Article

Effect of Seawater and Fly Ash Contaminants on Insulator Surfaces Made of Polymer Based on Finite Element Method

by
I Made Yulistya Negara
*,
I. G. N. Satriyadi Hernanda
,
Dimas Anton Asfani
,
Mira Kusuma Wardani
,
Bonifacius Kevin Yegar
and
Reynaldi Syahril
Electrical Engineering Department, Institut Teknologi Sepuluh Nopember, Surabaya 60111, Indonesia
*
Author to whom correspondence should be addressed.
Energies 2021, 14(24), 8581; https://doi.org/10.3390/en14248581
Submission received: 19 November 2021 / Revised: 11 December 2021 / Accepted: 15 December 2021 / Published: 20 December 2021
(This article belongs to the Special Issue Advanced Research of High Voltage Insulation)

Abstract

:
Polymer is an insulating substance that has become increasingly popular in recent years due to its benefits. Light density, superior dielectric and thermal properties, and water-resistant or hydrophobic properties are only a few of the benefits. The presence of impurities or pollutants on the insulator’s surface lowers its dielectric capacity, which can lead to current leakage. The influence of seawater and fly ash pollutants on the distribution of the electric field and the current density of the insulator was simulated in this study. The finite element method was used to execute the simulation (FEM). Polymer insulators are subjected to testing in order to gather current leakage statistics. The tested insulator is exposed to seawater pollution, which varies depending on the equivalent salt density deposit value (ESDD). The pollutant insulator for fly ash varies depending on the value of non-soluble deposit density (NSDD). The existence of a layer of pollutants increased the value of the electric field and the value of the surface current density, according to the findings. Both in simulation and testing, the ESDD value of seawater pollutants and the NSDD value of fly ash contaminants influenced the value of the leakage current that flowed. The greater the ESDD and NSDD values are, the bigger the leakage current will be.

1. Introduction

A polymer insulator is one type of insulator that is commonly used in electric power transmission and distribution systems [1]. Polymer insulators have hydrophobic characteristics that make the insulator performance superior in polluted environmental conditions compared to insulators made from different materials [2,3]. However, these properties still do not prevent the polymer insulator from interference due to pollution such as rainwater, dust, and other contaminants attached to the insulator surface.
The dielectric ability of the insulating material is influenced by the level of contaminants and the surface conditions of the insulator [4]. A heavier level of contaminants will greatly affect the value of the electric field on the insulator itself. The value of the electric field will also change when there is damage or there are air voids on the surface of the insulator [5]. In insulators installed on power lines near the coast or the sea, the main contaminant problem is seawater [6]. The seawater contains salt that can affect the dielectric of the insulator. The contaminant layer also causes the surface of the insulator to be conductive [7]. Moreover, insulators installed in power plant areas are very susceptible to fly ash contaminants. Fly ash is the result of the combustion of coal that comes from the combustion chamber in the form of a mixture of smoke in steam power plants [8]. Fly ash pollutants can fly in the wind and then stick to the surface of the insulator around the power plant. This initiates the appearance of a dry band on the surface of the insulator, which can cause leakage current through the surface, resulting in a phenomenon called dry-band arcing [9].
A few research studies have analyzed the distribution of electric fields and current leakage due to pollutants in insulators made from porcelain [10], glass [11], and polymer [12,13,14,15,16]. Especially for polymer insulators, some research was carried out in simulations to determine the characteristics of the electric field due to the influence of various types of contaminants on the surface of the insulator, such as general pollution levels [10], seawater [14], sand particles [15], and others. In addition, some research has also been carried out by testing polymer insulators, especially by observing leakage currents due to pollutants such as general pollutant levels, salt from the coast, and others [16]. However, research on the comparison between simulation results using COMSOL Multiphysics software and test results on the effect of salt and fly ash contaminants on polymer insulators has not been carried out.
Based on these conditions, this study was conducted to explore the effect of salt pollutants and fly ash pollutants on the surface of polymer insulators. This research consisted of two parts, namely simulation and testing. The simulation was carried out using finite element method (FEM)-based software. Then, the comparison of electric field conditions, current density, and leakage current on the surface of the insulator contaminated with sea water and fly ash with normal conditions was analyzed. The study continued by testing the polymer insulator against seawater pollutants and fly ash pollutants to obtain current leakage data on the insulator. The simulated insulator was given seawater pollutant and fly ash pollutant, which was varied based on the electrical conductivity value. Next, the simulation and the experiment results were compared to prove whether the results of the simulation and testing have differences.

2. Research Description

2.1. Equivalent Salt Density Deposit (ESDD)

The level of sea water pollutants on the surface of the insulator can affect the dielectric ability of the insulator. According to the IEC 815 standard, the pollution weight of the insulator is set into four, namely light, medium, heavy, and very heavy. Common methods used to determine pollution levels are the ESDD (equivalent salt density deposit) method, and the field review method [10]. In this study, the ESDD method was used to determine the level of pollution. The determination of the level of insulator pollution in the ESDD method based on the IEC 815 standard is shown in Table 1.

2.2. Nonsoluble Deposit Density (NSDD)

The surface of the insulator can be contaminated with various types of pollutants, which can then affect the resistance of the insulator. These pollutants are divided into two types, namely conductive pollutants and inert pollutants. Based on the IEC standard 815 paragraph 2, the method of determining the level of pollution weight on the insulator is divided into three, namely based on a qualitative analysis of environmental conditions, evaluation of field experience regarding the behavior of the insulator that has been installed, and measurement of insulator contaminants that have been in operation [1]. The IEC 815 standard also regulates the thickness of the pollutant layer attached to the surface of the insulator classified in four levels as shown in Table 1 [1].

2.3. Leakage Current

The leakage current in the insulator is influenced by the presence of a conductive part on the surface of the insulator [17]. This conductive layer is caused by pollutant contamination attached to the surface of the insulator. Pollutants adhering to the surface of the insulator can be both conductive and non-conductive. Conductive pollutants act as a path for leakage currents, but non-conductive (inert) pollutants are able to initiate leakage currents.
The leakage current caused by the layer of pollutants on the surface of the insulator causes heating of the insulator [18]. In polymer insulators, this heating initiates the appearance of a corona and the appearance of a dry band phenomenon. The appearance of the corona and the dry band initiates the appearance of electrical failure [19].

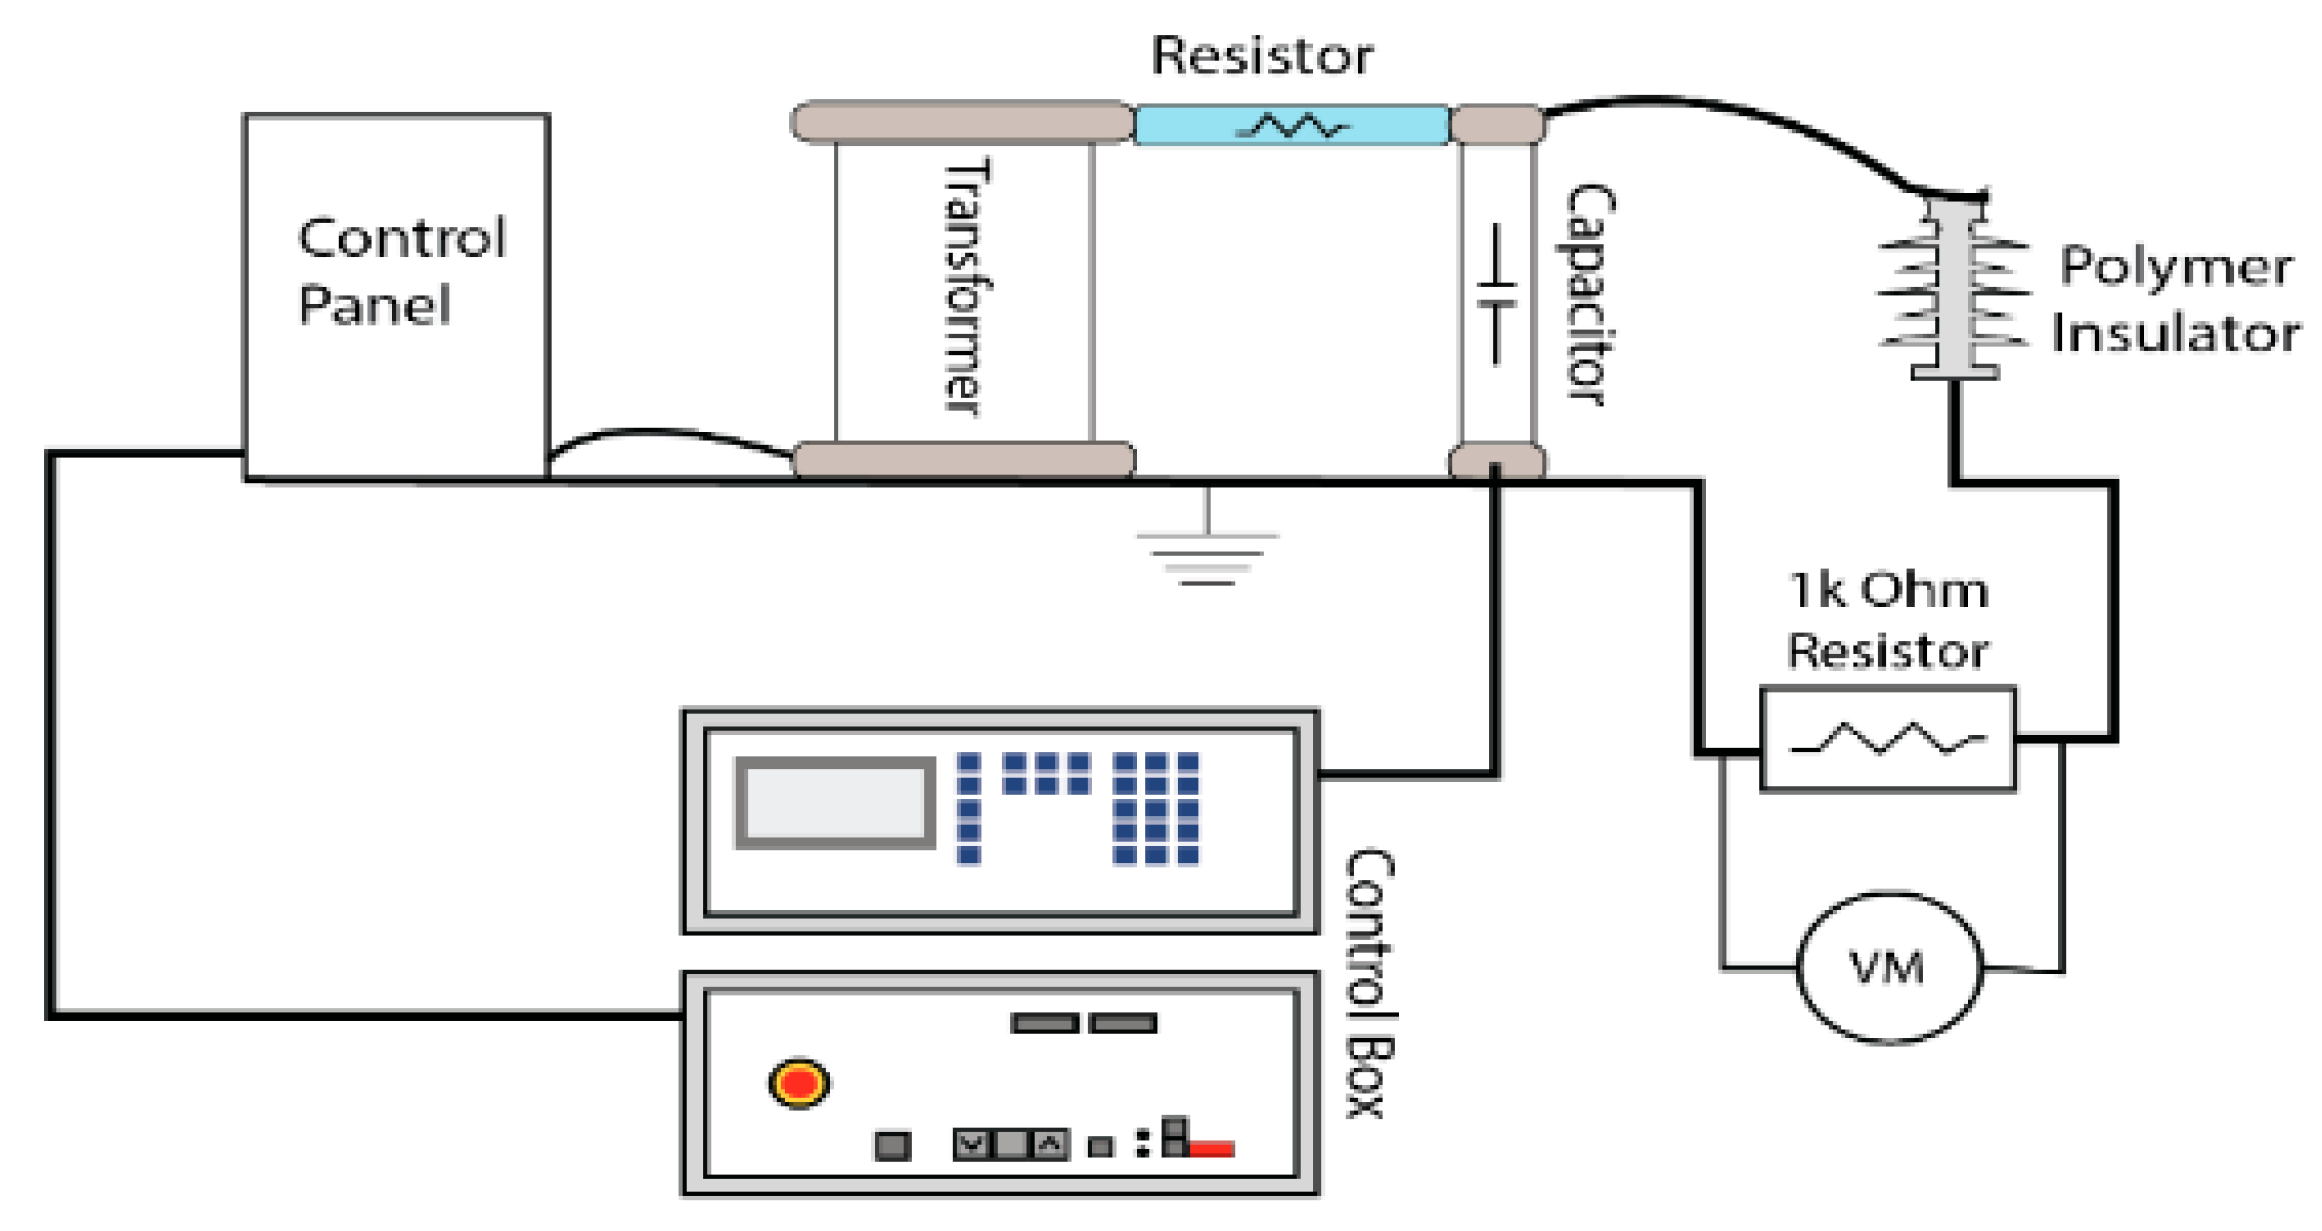
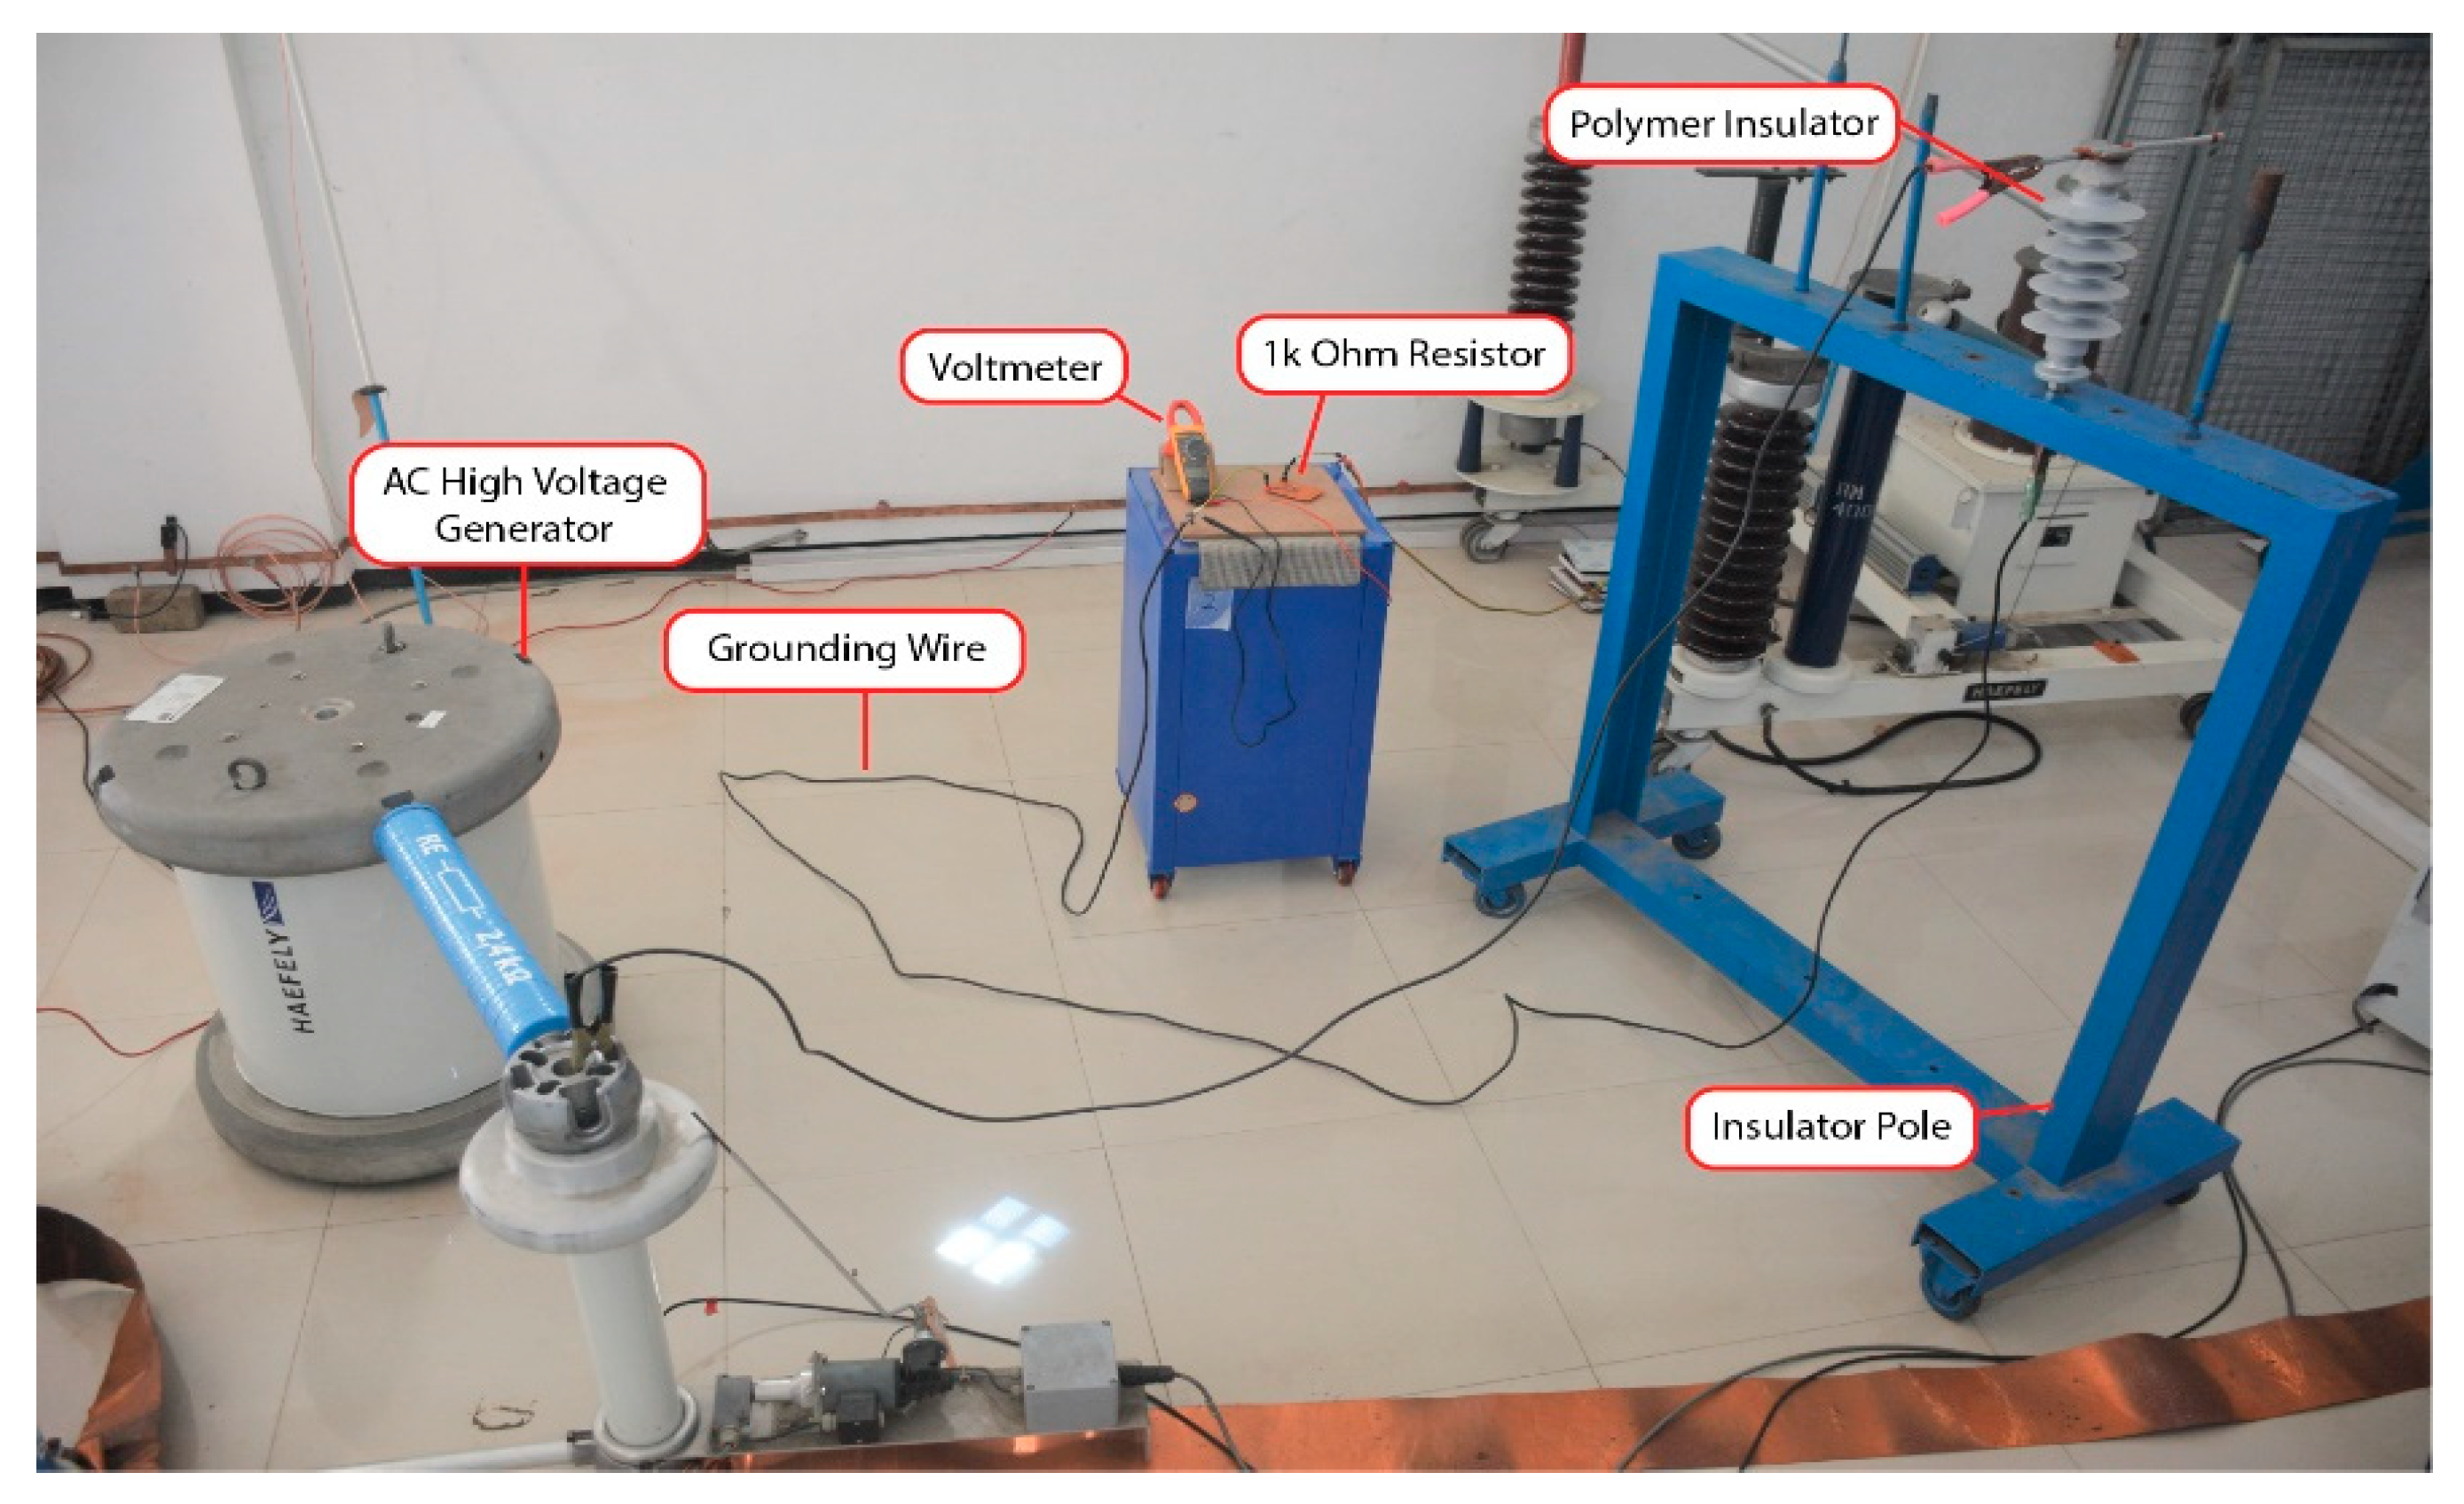
3. Experimental Setup

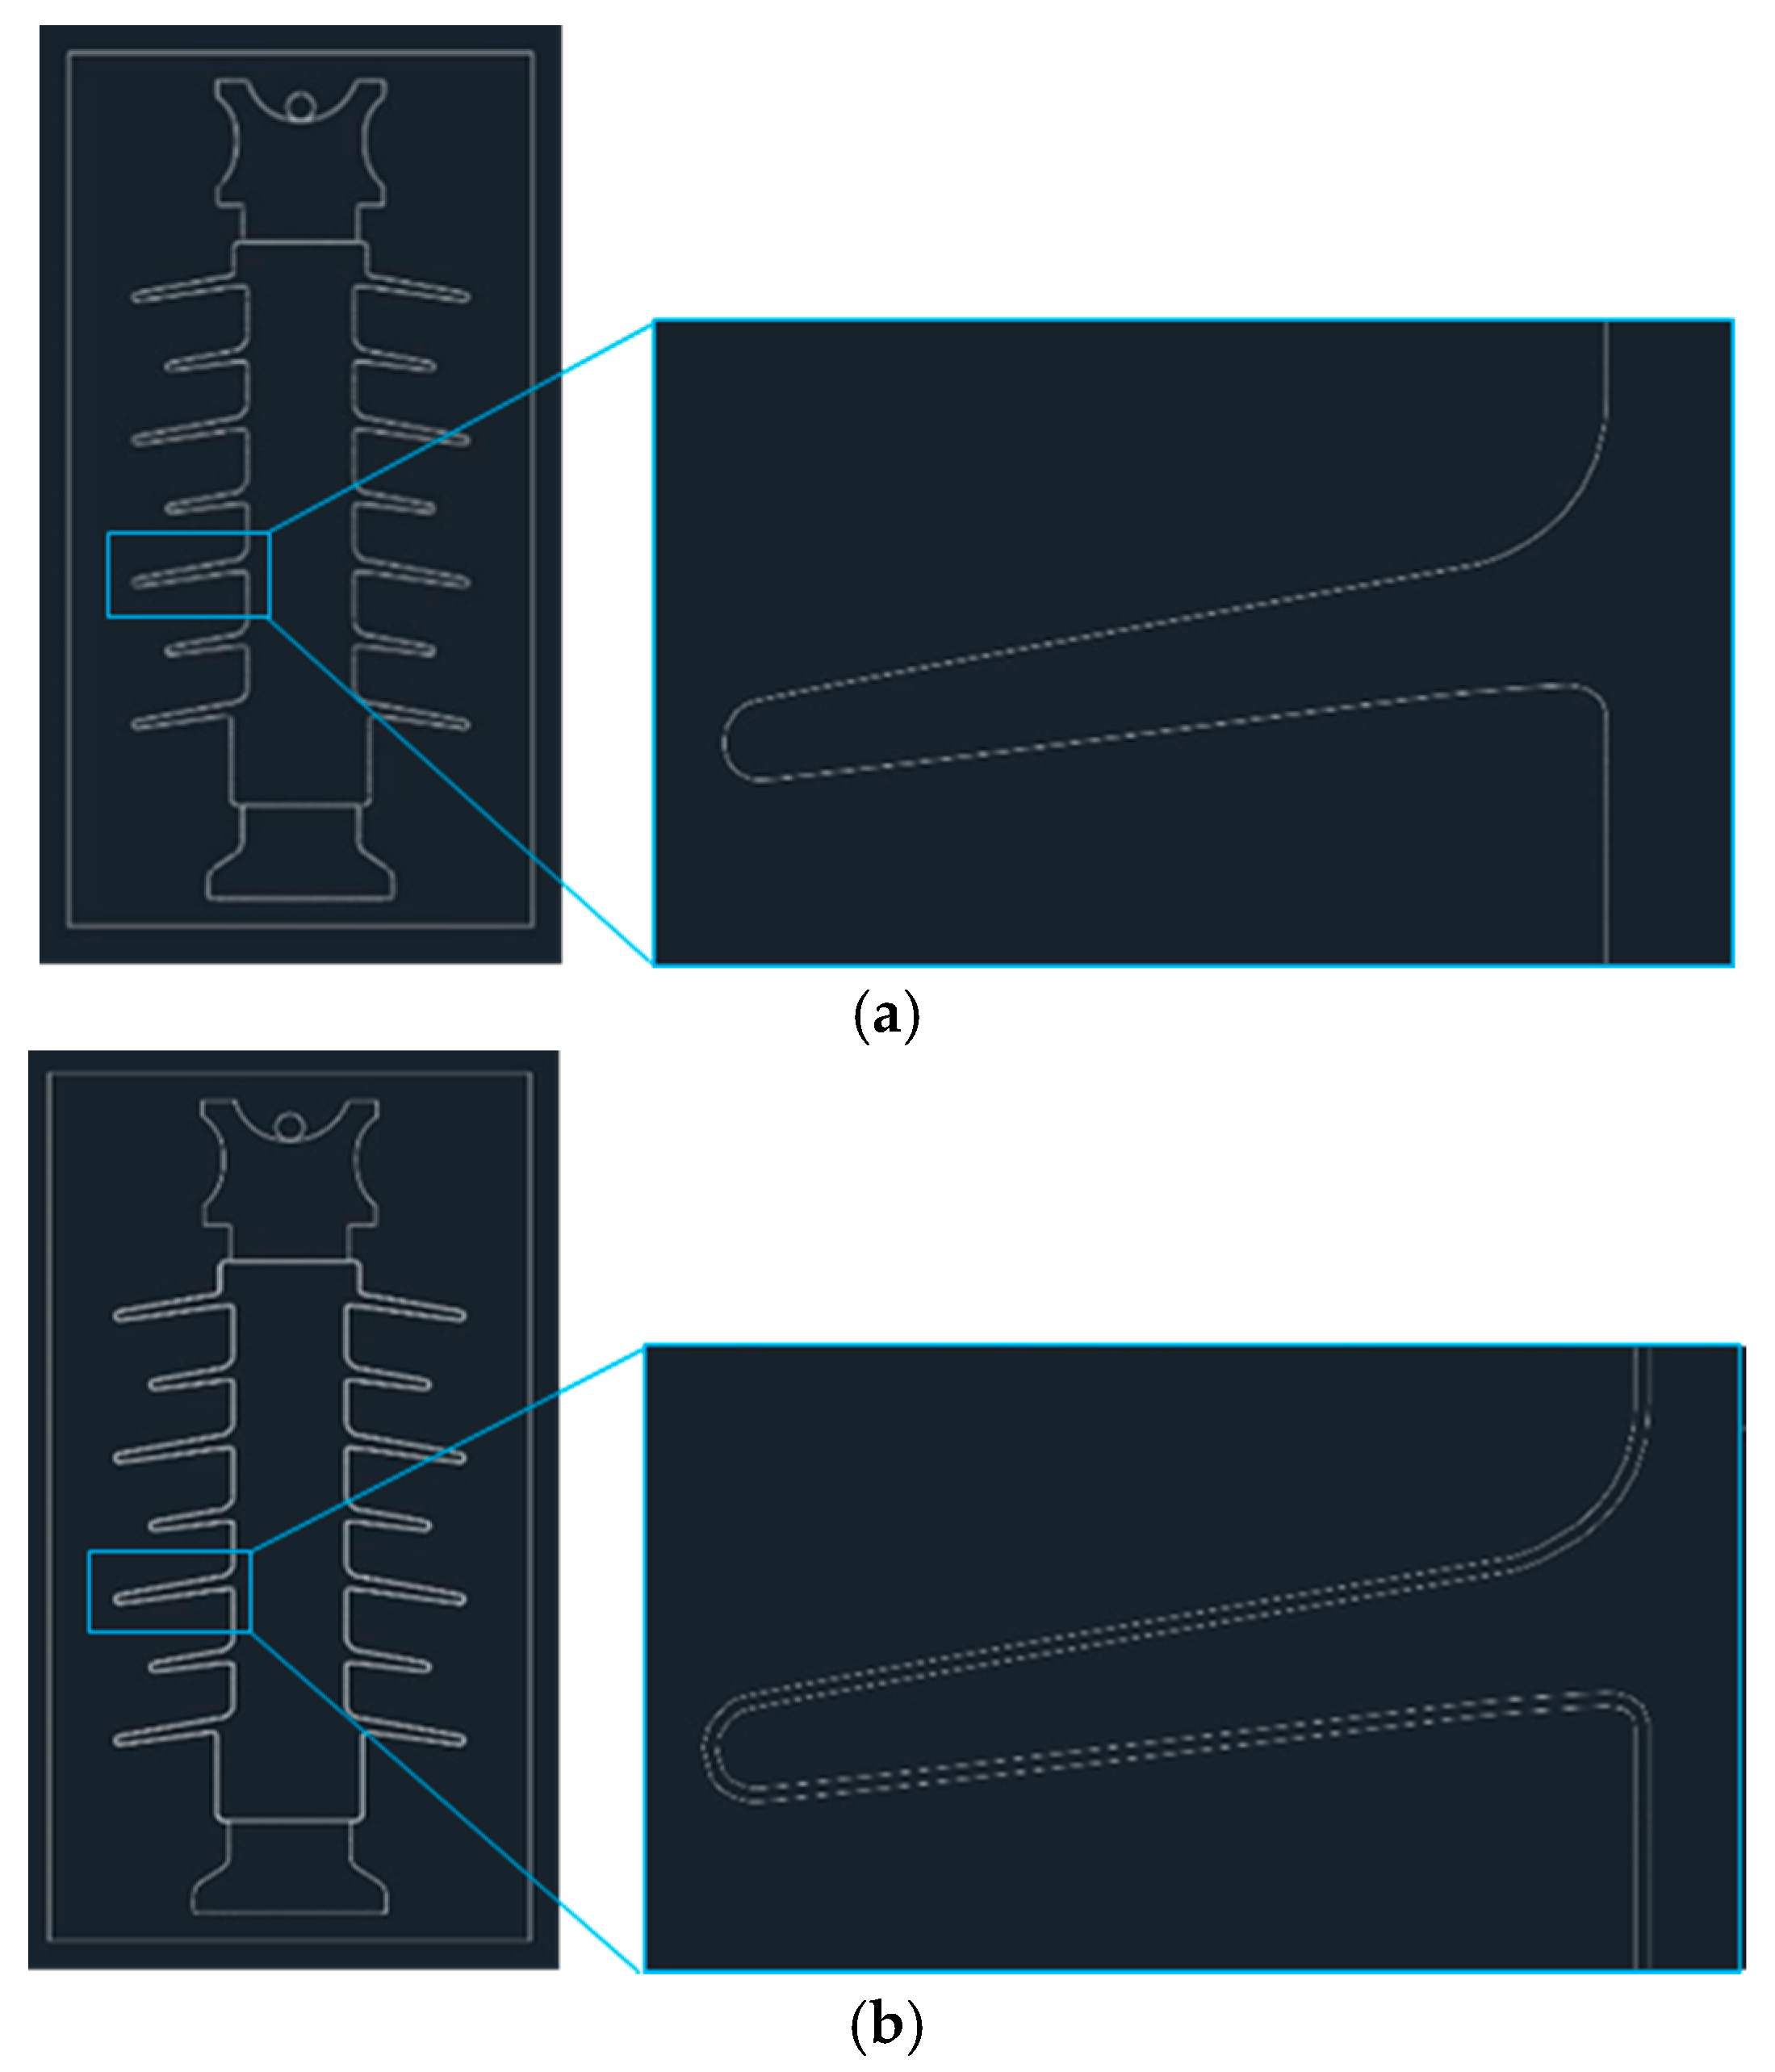
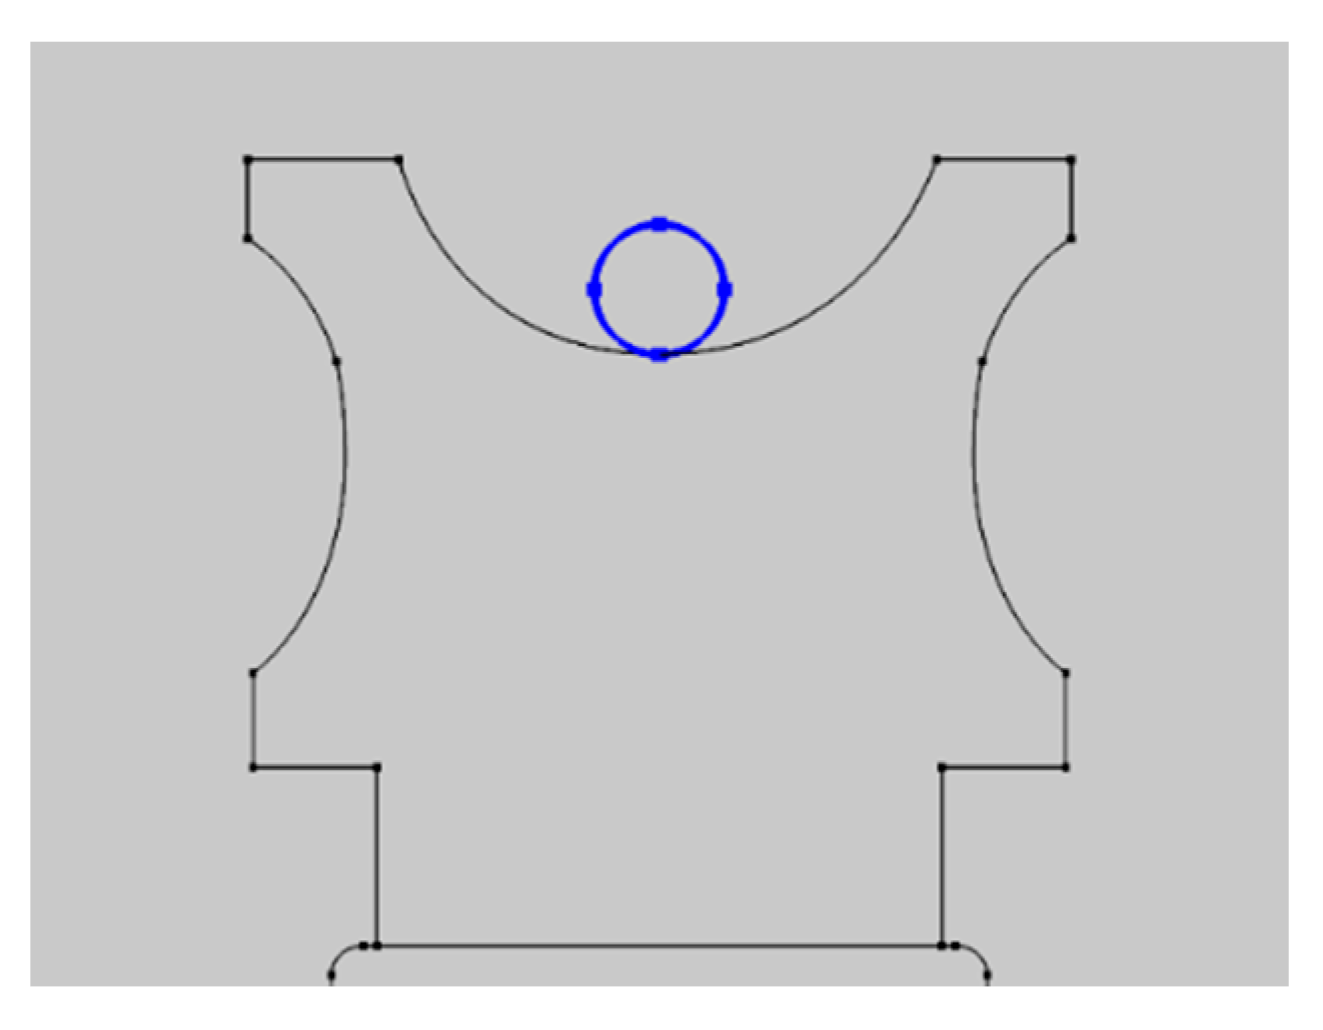
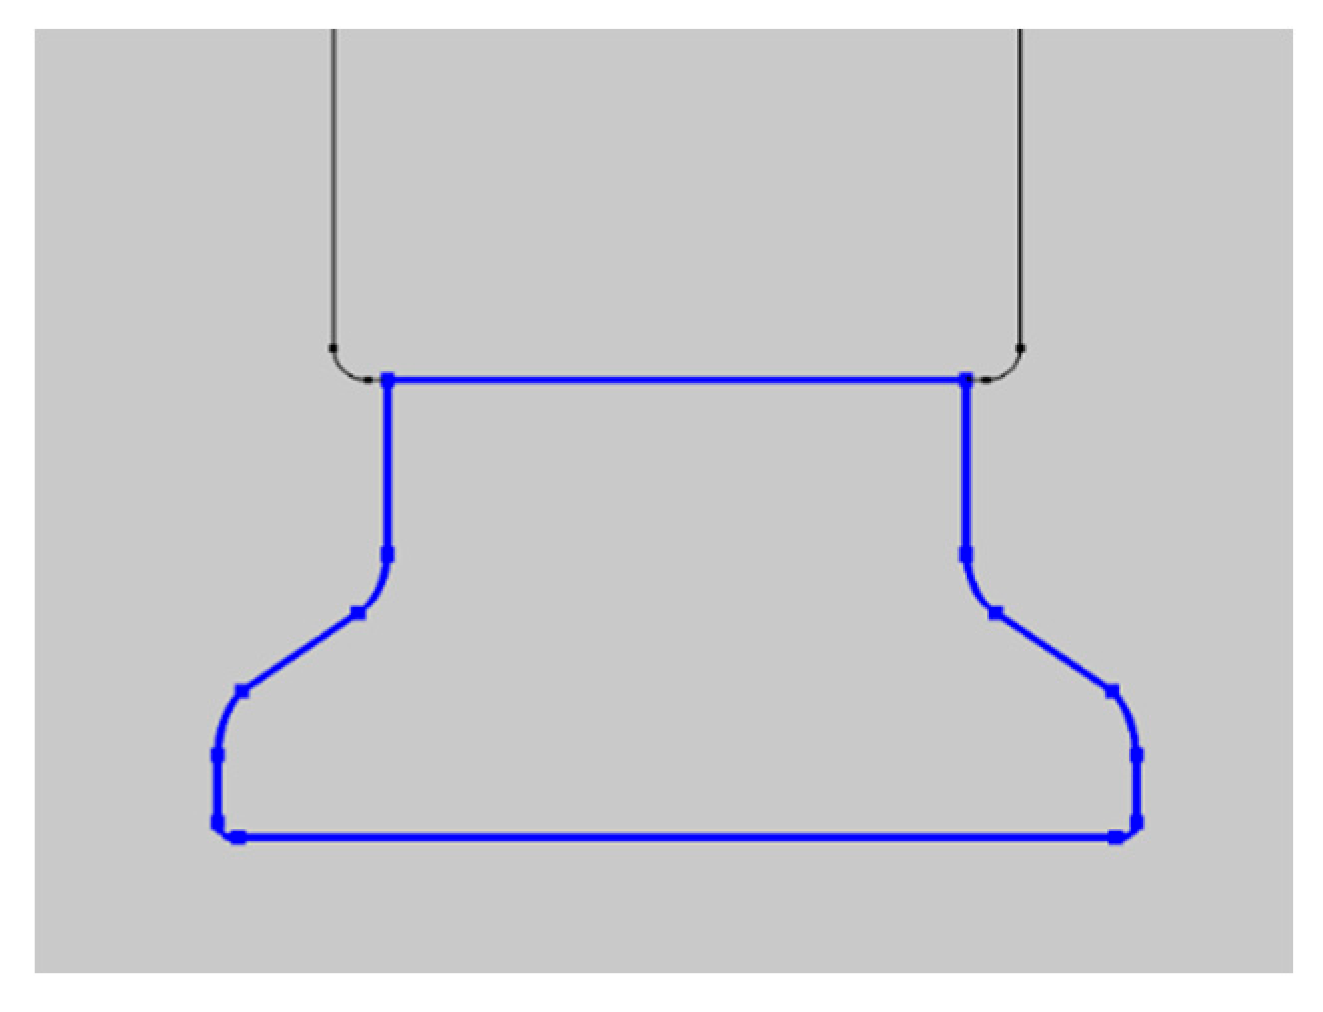
3.1. Modeling and Determination of Simulation Parameters

Insulator modeling was done with AutoCAD software in two-dimensional form, as shown in Figure 1. In addition to the shape of the insulator, the air around the insulator and the live conductor at the top of the support were also modeled. The insulator model was then imported into finite element method (FEM)-based software. The software that was used was COMSOL Multiphysics. The insulator model analyzed by simulation consisted of three types, namely clean insulators without pollutants, insulators with a 0.5 mm thick salt pollutant layer, and an insulator with a 0.5 mm thick fly ash pollutant layer.
Insulator simulation using FEM-based software requires several parameters from the insulator constituent materials, live conductors, and air around the insulator to be simulated. The parameters required are relative permittivity and electrical conductivity (S/m). These parameters are shown in Table 2.

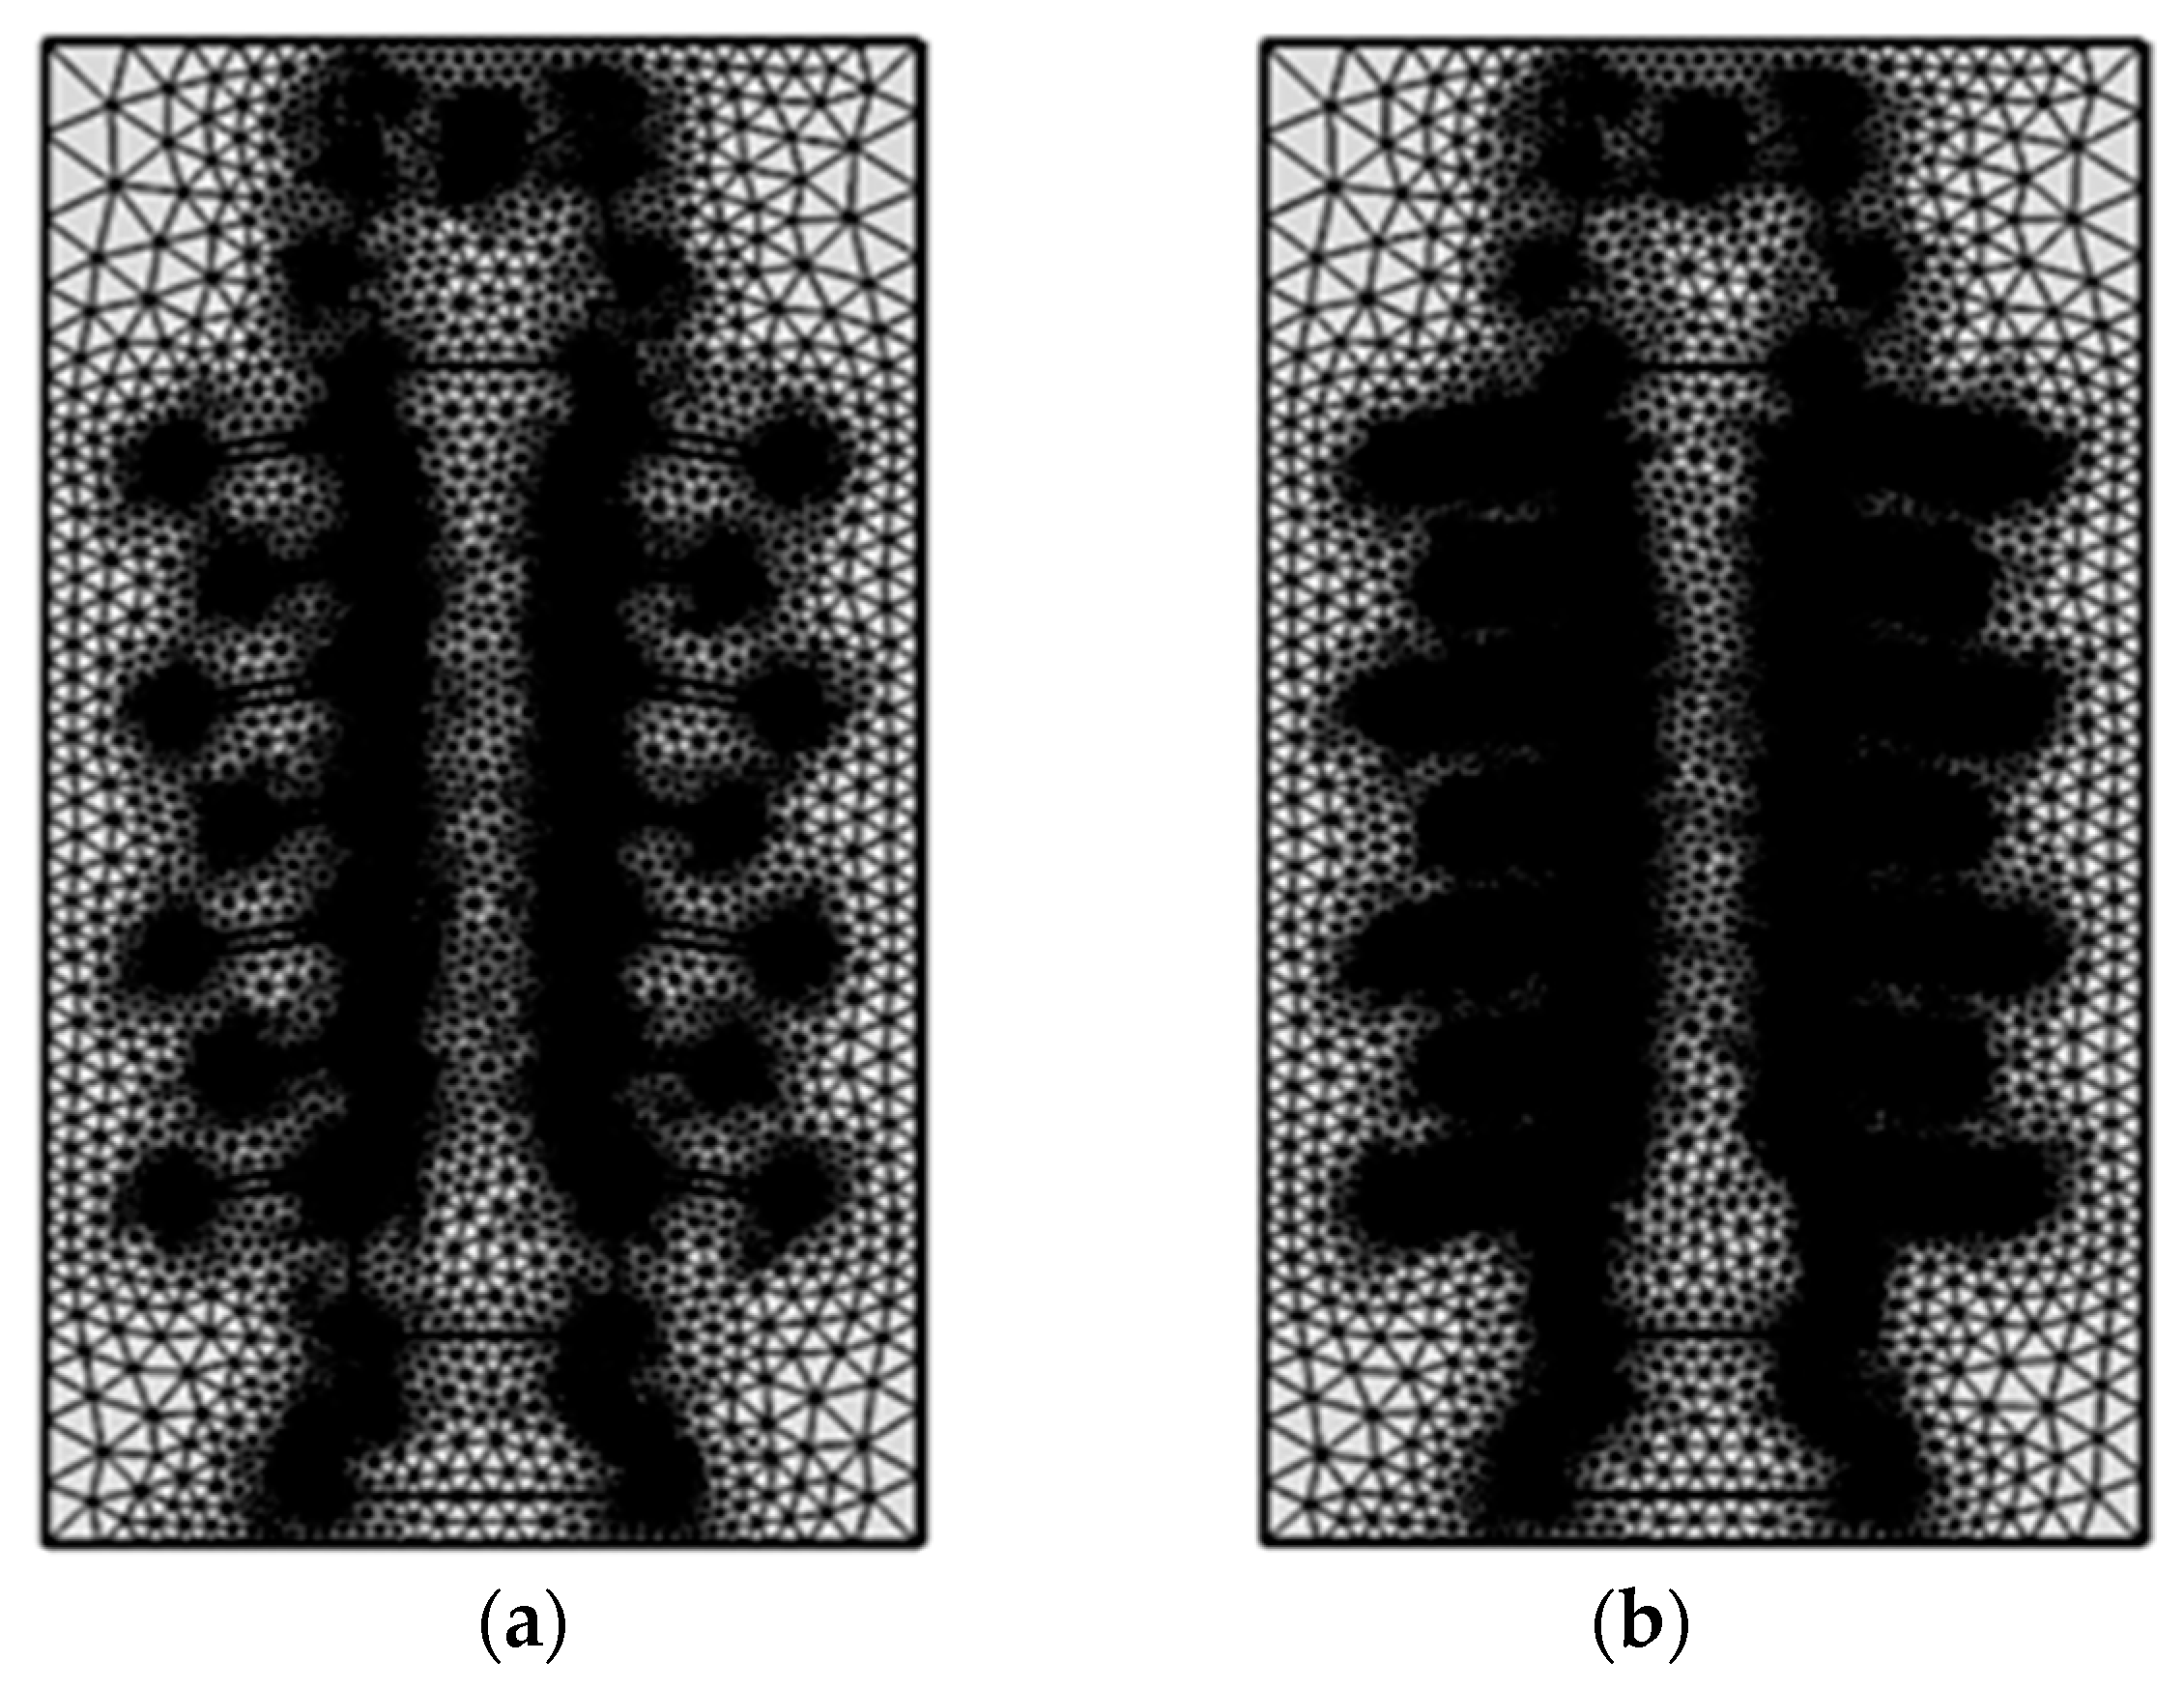
3.2. Finite Element Method (FEM)

The finite element method (FEM) is a method to analyze the value of the field distribution. This method has a basic principle, namely a discretization process in which an analyzed area is divided into a collection of interconnected elements and then modeled into one, two, or three-dimensional forms [20].
Completion of the calculation of the electric field distribution with FEM is done by dividing the insulator into the form of triangular elements. The value of the field distribution on the insulator is known by the approximate electric potential of each triangular element. Then each element of the triangle whose electric potential value is known is connected to each other with other triangles with different shapes and dimensions, so that the value of the electric potential at each point on the insulator can be obtained [14].
In accordance with the working principle of FEM, the clean insulator model without pollutants or pollutant insulators was divided into many triangular elements, as shown in Figure 2. The triangular elements were then processed by COMSOL Multiphysics software and produced analyses such as the distribution of electric potential and electric field distribution of the polymer insulator that was simulated. The mesh applied to the insulator design was a physics-controlled mesh. This option is the default option in COMSOL Multiphysics software. Moreover, the element size used in the polymer insulator design was normal size. The results of the normal size elemental mesh can be seen in Figure 2.

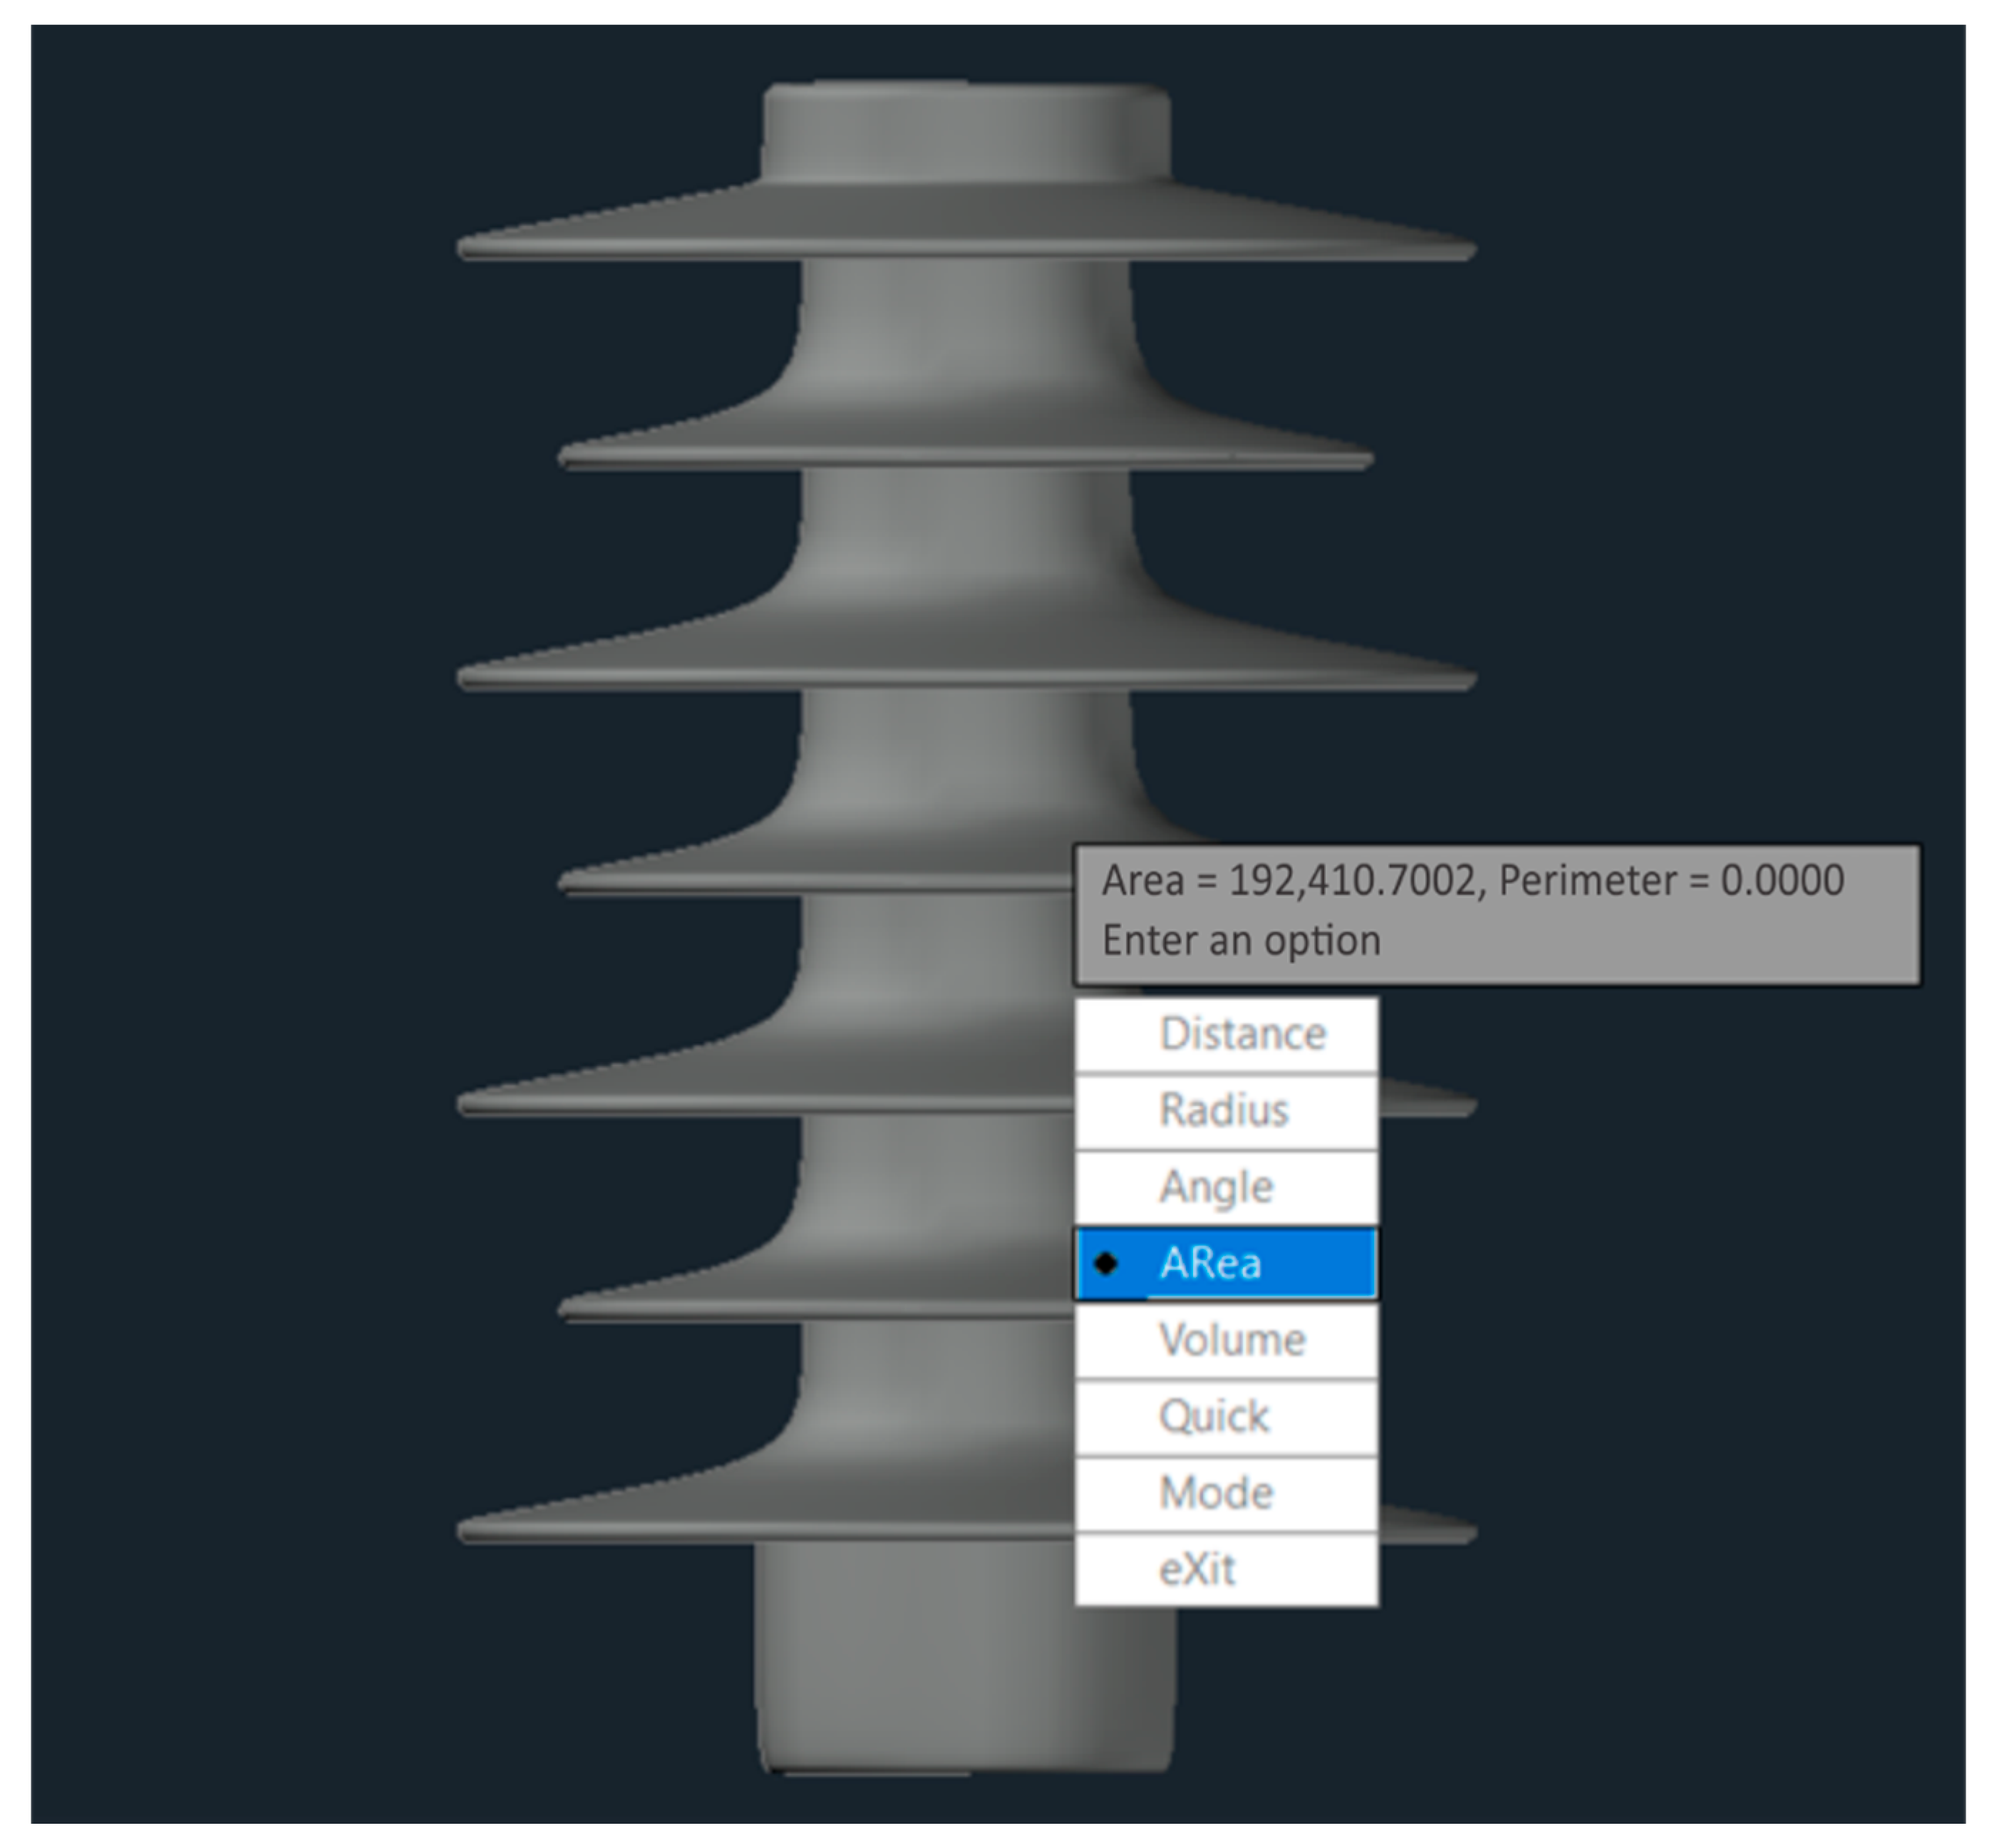
3.3. Calculation of Insulator Surface Area

ESDD and NSDD calculation requires the value of the surface area of the insulator. Therefore, it was necessary to calculate the surface area of the insulator core body, which was simulated using three-dimensional modeling of the insulator core body using AutoCAD software. As shown in Figure 3, by utilizing the object surface area function in AutoCAD software, the area displayed in AutoCAD still had mm2 units, so it had to be converted to cm2; the area became 1924.1 cm2.

3.4. ESDD Insulator Pollution Level Calculation

The level of seawater pollution in the insulator was determined by the value of equivalent salt density deposit (ESDD). The ESDD value of seawater contaminants is obtained through Equation (1), namely
E S D D = S a × V A
where
ESDD = equivalent salt deposit density (mg/cm2);
Sa = salt salinity (g/L);
V = volume of water (mL);
A = area insulator surface (cm2).
The area of the insulator was measured using AutoCAD software through an existing two-dimensional design by removing the top and bottom fittings so that the resulting area was 1924.1 cm2. The volume of water used was 50 mL with varying levels of salination. The seawater contaminants, ESDD, used in this study were four values, with each value representing a different classification of pollution levels, as shown in Table 3.

3.5. NSDD Pollution Level Calculation

The level of fly ash pollution on the surface of the insulator was determined by the value of the non-soluble deposit density (NSDD). The NSDD used in this study was divided into four values, in accordance with the IEC standard 60815, which regulates the pollution level according to the NSDD value, namely light, medium, heavy, and very heavy. The NSDD calculation is done without using filter paper, because the mass of the pollutant in this study is a controllable variable. Therefore, NSDD can be calculated using Equation (2) as follows:
N S D D = M A
where
M = net weight of fly ash pollutant (mg);
A = Area insulator surface (cm2).

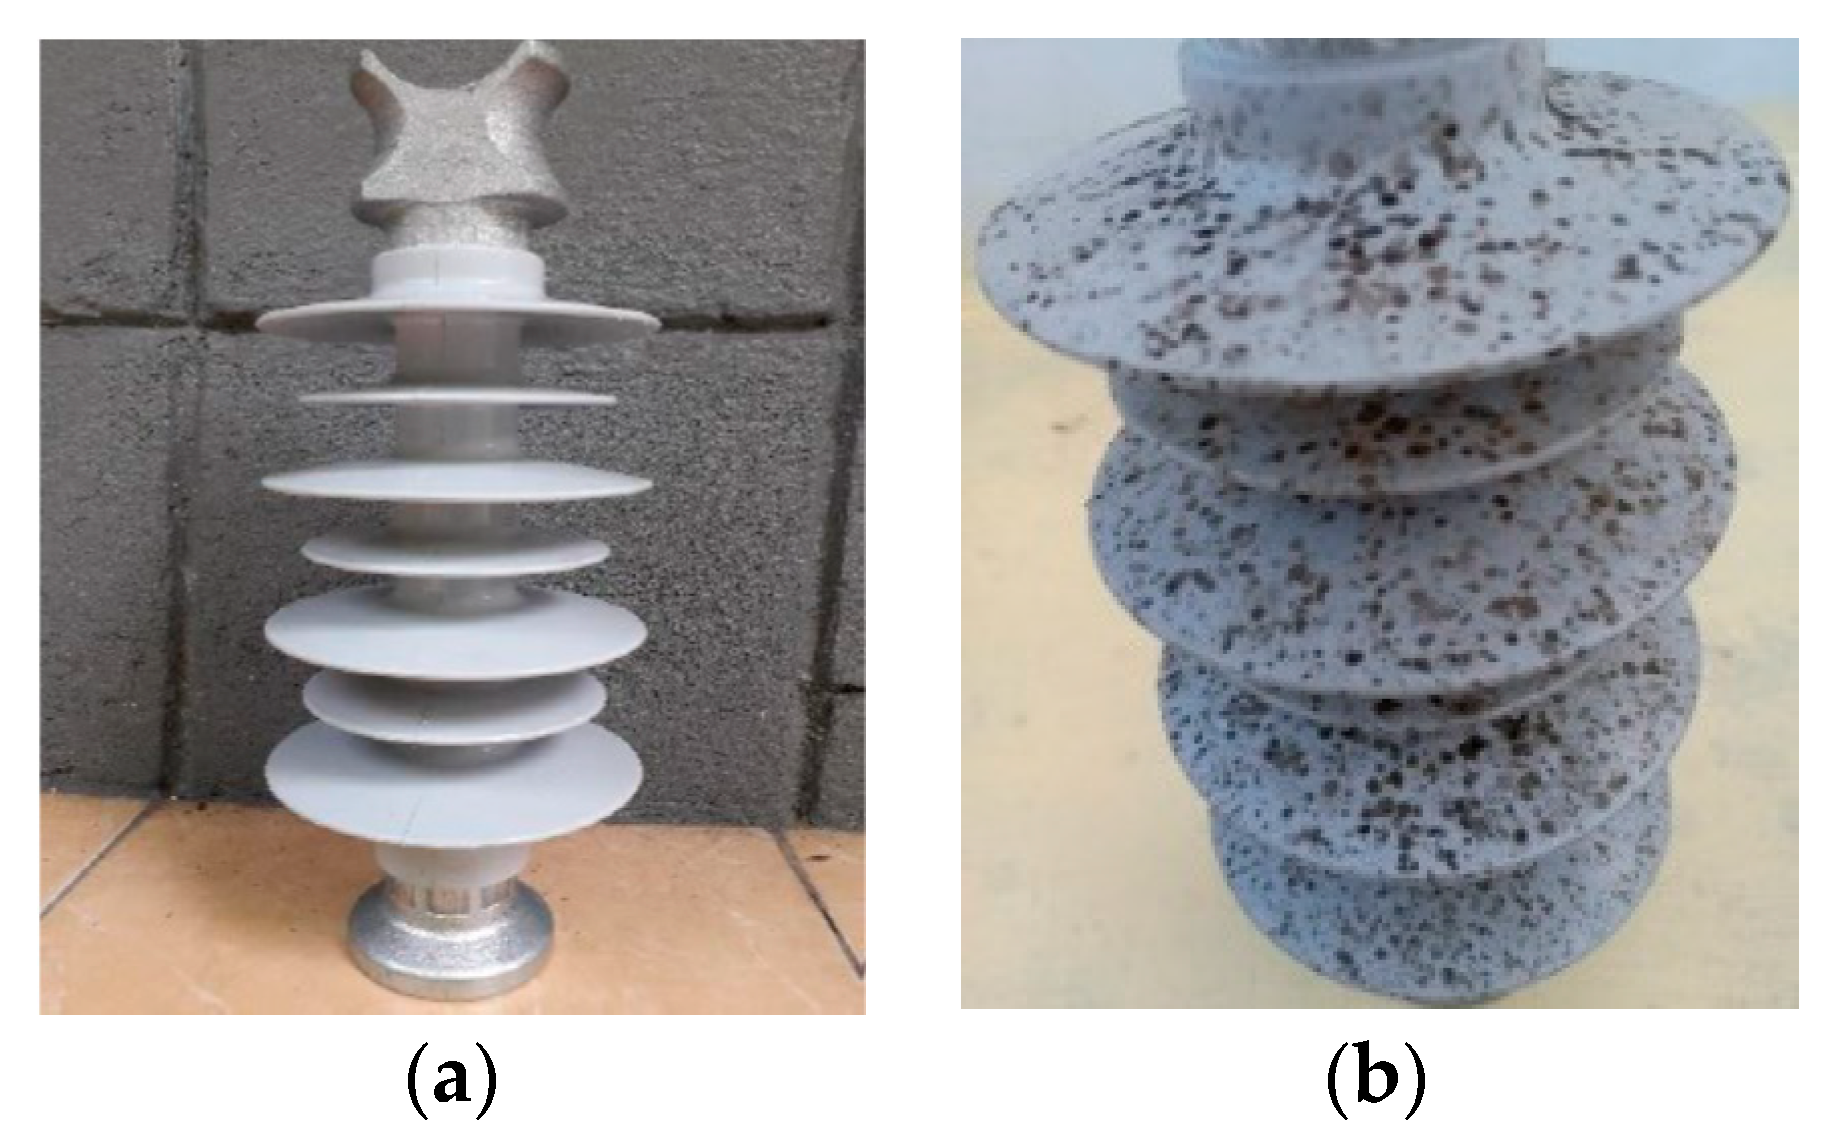
3.6. Natural Aging Insulator

Before the experiment was carried out, polymer insulators were placed in an open place, so they could be exposed to direct sunlight or rain. The purpose of the insulator being placed in the open was to condition the insulator to experience natural aging by exposing the insulator to heat from sunlight and water from rainwater [21]. The polymer insulator was placed in the open for 13 weeks. The development of the condition of the insulator is shown in Figure 4. In the last week it was shown that mold was seen growing on the surface of the insulator. The constituent material of the insulator, namely silicone rubber, can be a medium for fungi to grow and develop [22]. The possibility of mold growth on the surface of the polymer insulator is greater if the insulator is placed outdoors in the tropics [23]. Therefore, polymer insulators placed in the tropics have the potential to become a medium for fungi to grow on the surface of the core body [24].

3.7. Insulator Testing Scheme

The insulator test by measuring the leakage current aimed to test the dielectric strength of the insulator. The illustration of the test circuit is shown in Figure 5 and Figure 6. The tested insulator was tied to a conductor connected to an alternating voltage (AC) generator circuit. The bottom (grounding) of the isolator, which was also connected to the support pole, was buried. A 1000 ohm resistor was connected in series across the grounding line of the insulator. The voltmeter was connected in parallel to a 1000 ohm resistor.
The insulator test was carried out by the step voltage method, which took data on the leakage current at every 5 kV increase in voltage up to the nominal voltage of the insulator, which was 20 kV. Before being assembled in the test series, the insulator was conditioned by giving seawater pollutants and fly ash pollutants both in dry and wet conditions, as shown in Figure 7 and Figure 8. Conditioning insulators in wet conditions was done by spraying water on the surface of the insulators.

4. Result and Data Analysis

This section discusses the analysis based on the results of simulations and tests that were carried out. Simulation analysis consisted of the effect of salt and fly ash contaminants on voltage distribution, electric field distribution, current density, and leakage current, while the analysis consisted of a comparison of the leakage current insulator without aging and aging, the effect of voltage changes on the leakage current insulator and the effect of ESDD on the leakage current insulator, and the effect of NSDD on the leakage current insulator. The analysis in the test was divided into two parts, namely dry conditions and wet conditions. Furthermore, a comparison was made between the simulation results and the leakage current.

4.1. Polymer Insulator Simulation Results

Insulator material parameters must be filled in first. The simulation of electric field distribution and voltage distribution uses the Electrostatics physics module, while the current density simulation uses the Electric Current physics module. The module is already installed on COMSOL Multiphysics.

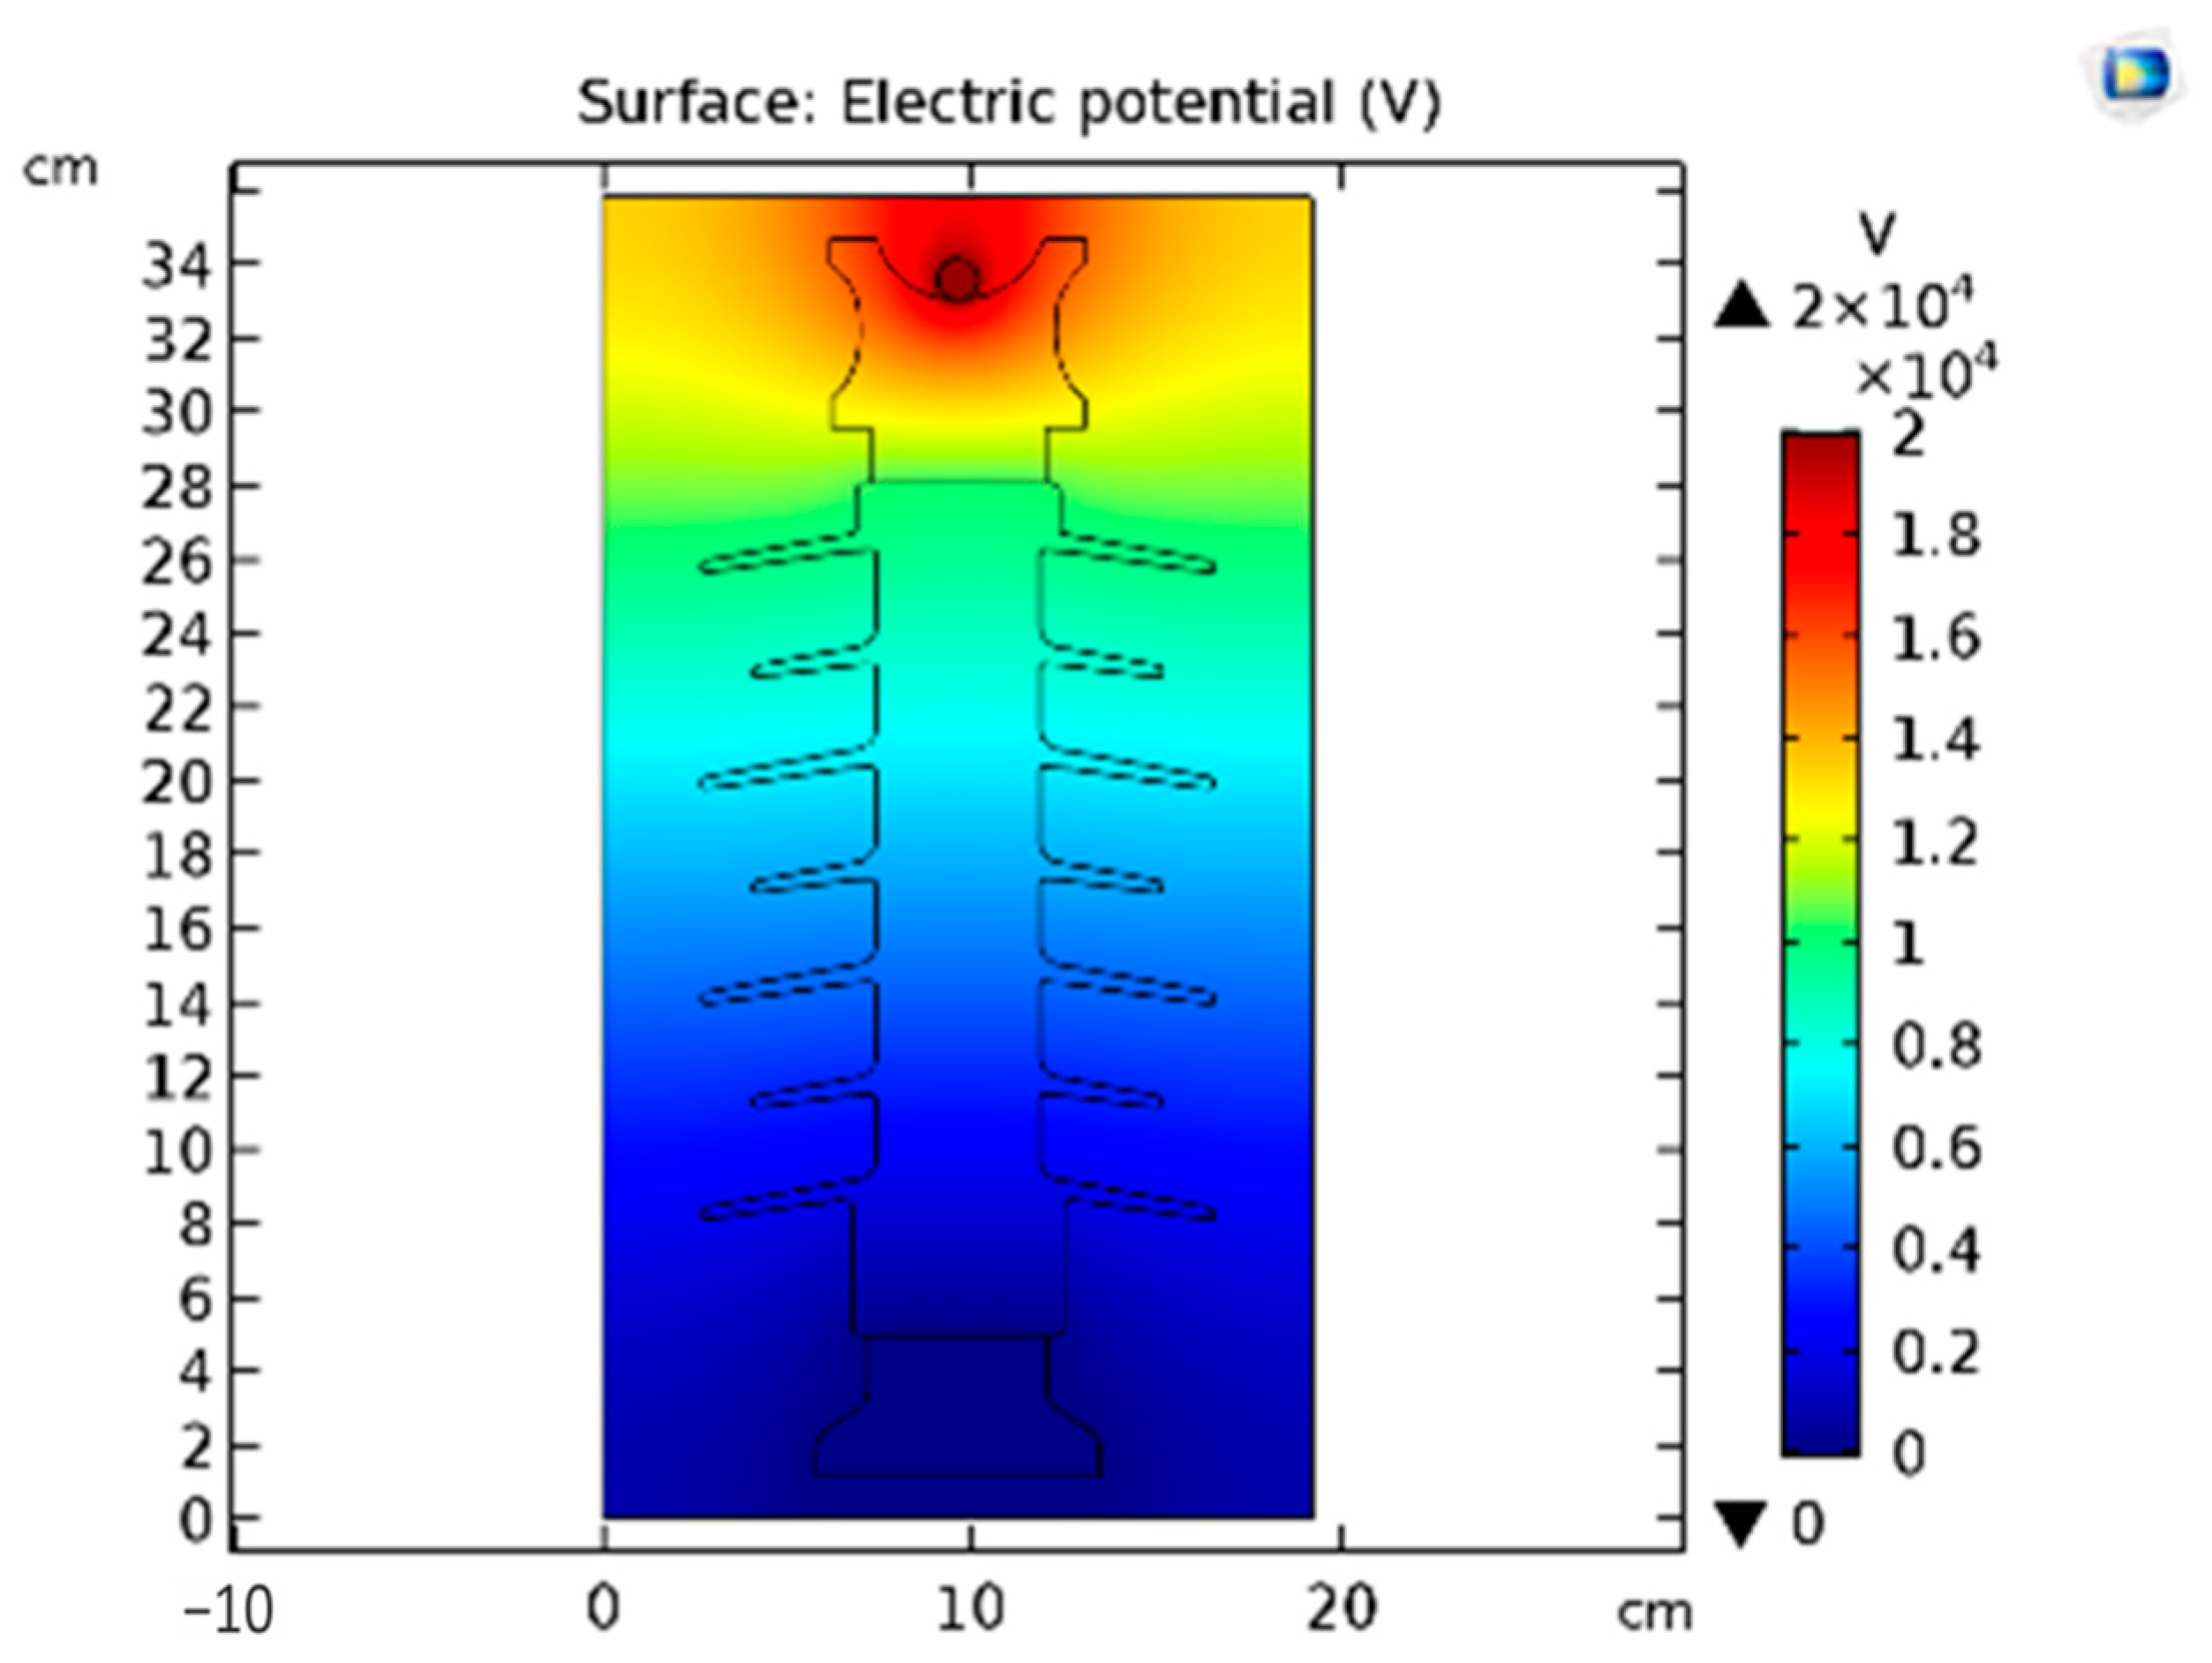
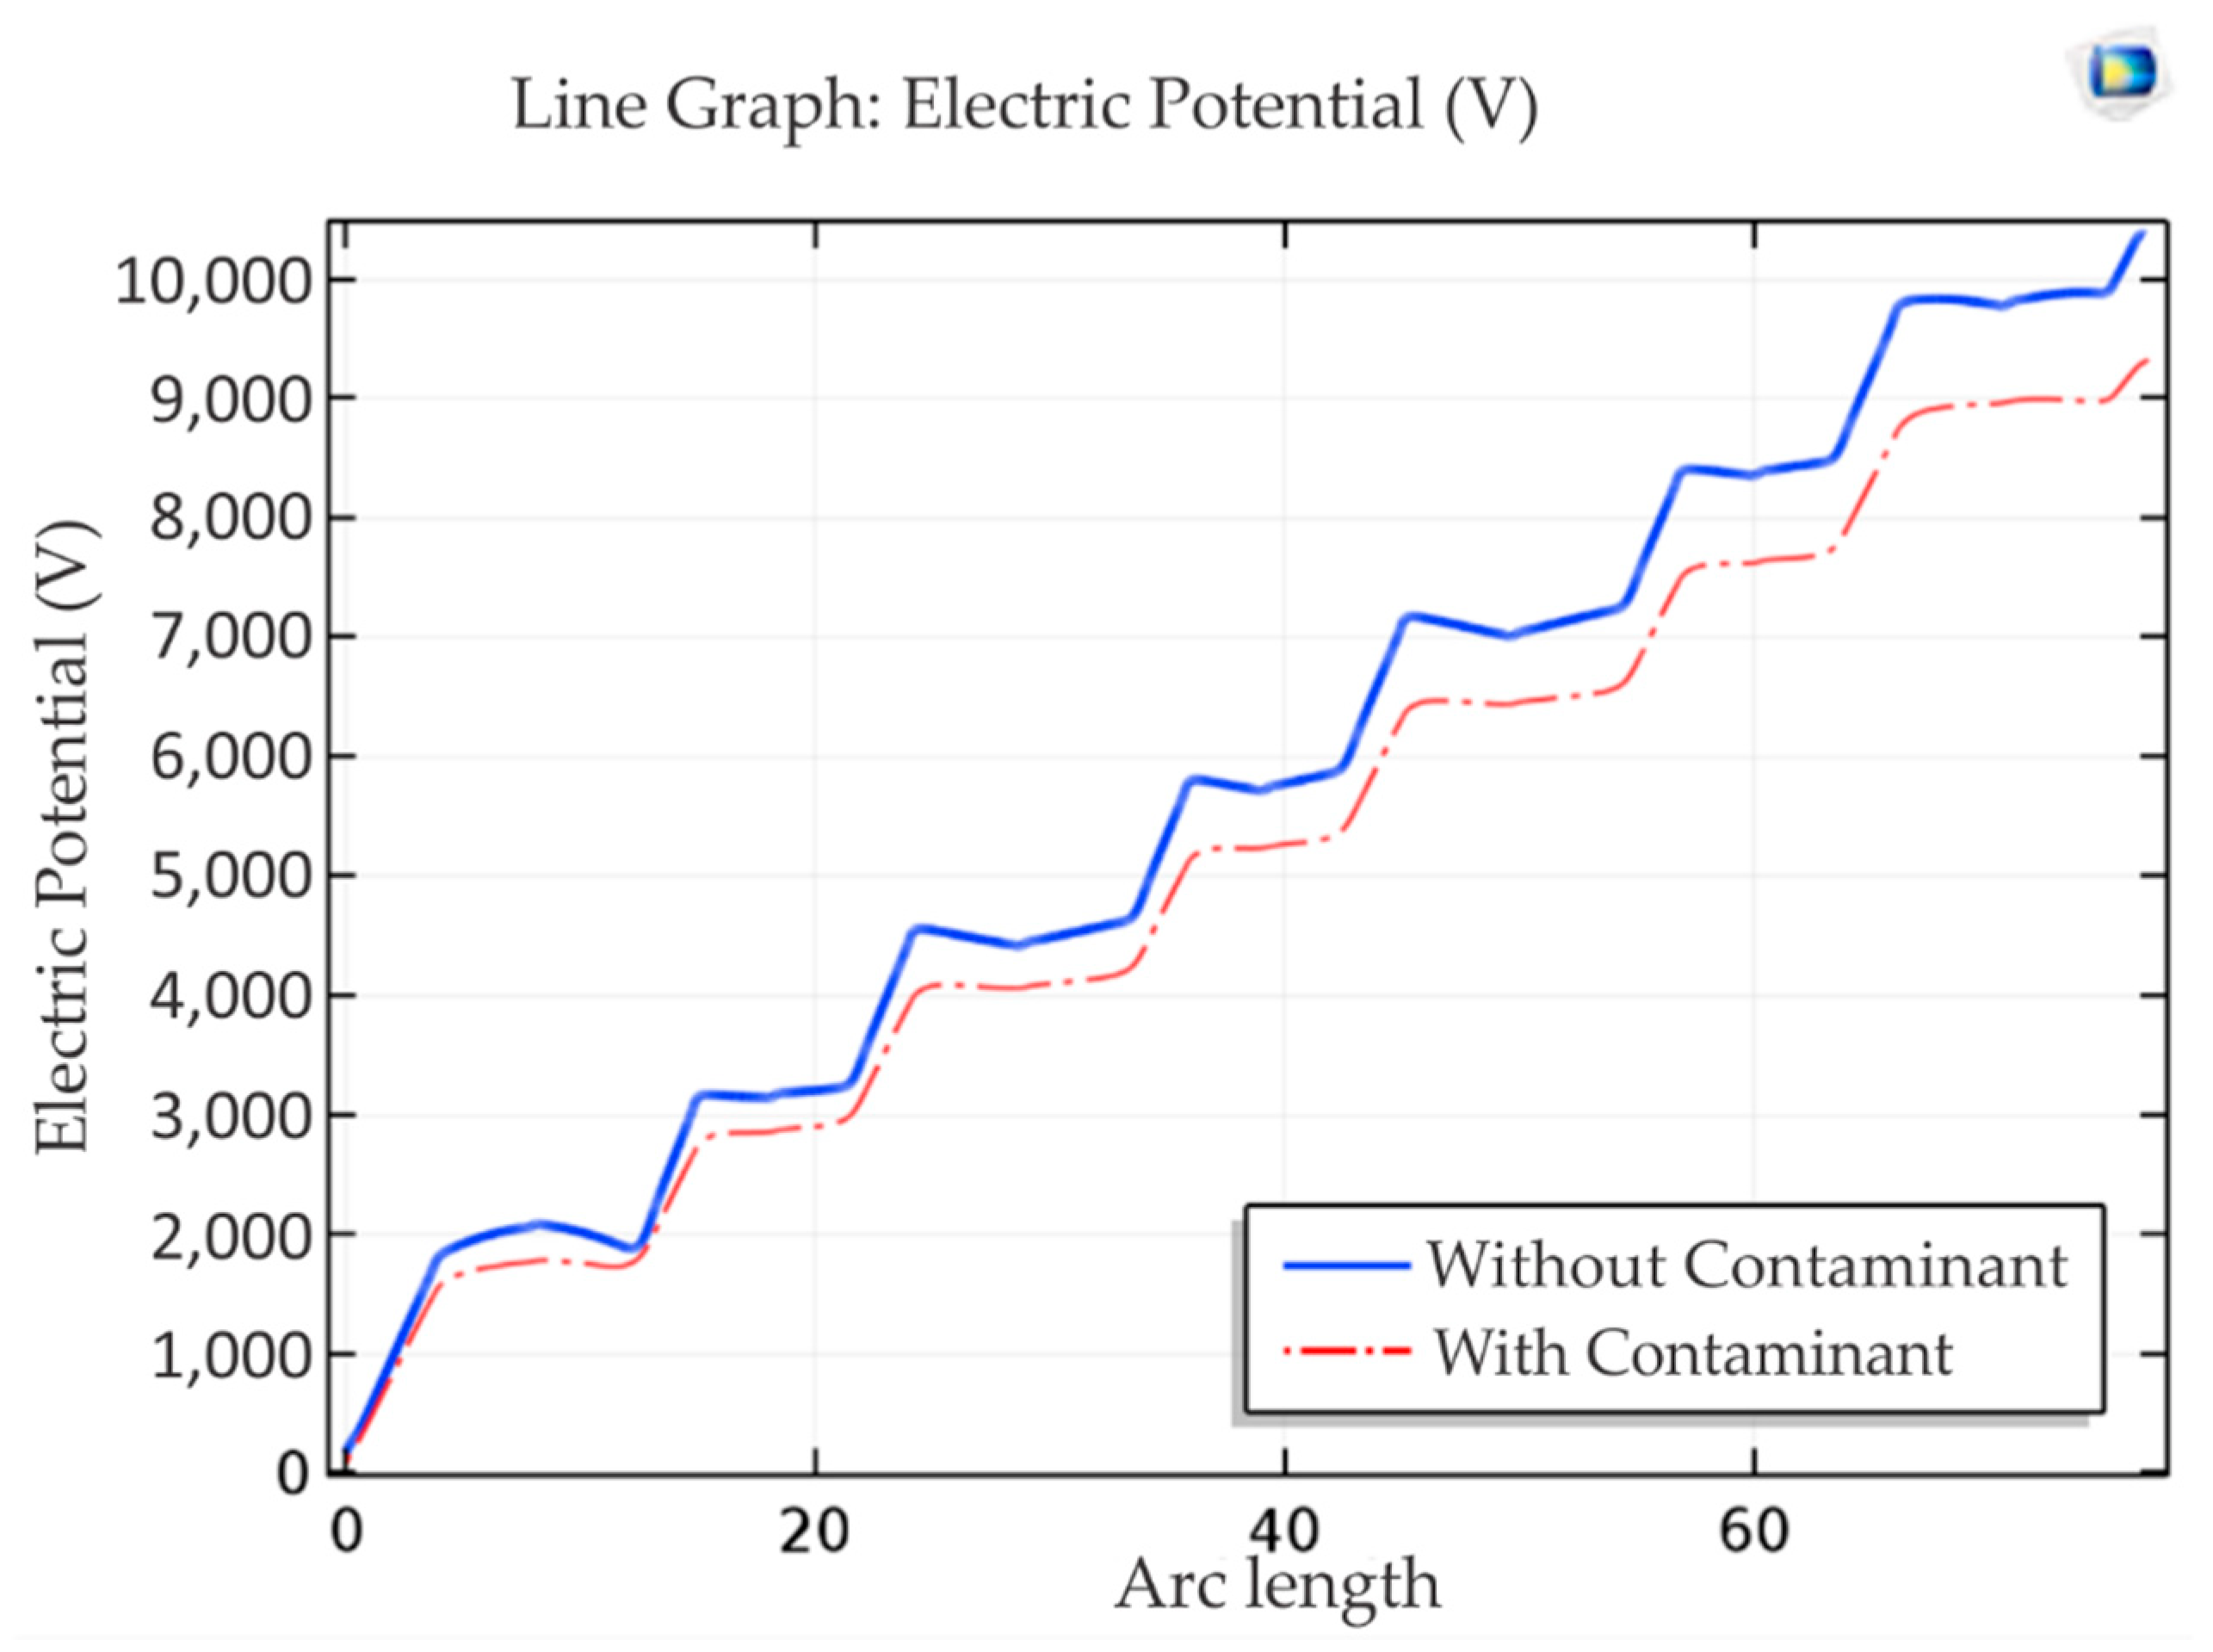
4.1.1. Voltage Distribution in Polymer Insulators

The voltage applied in this simulation was 20 kV according to the voltage of the polymer insulator system used. A terminal voltage of 20 kV was applied to the conductor cable, as shown in Figure 9, and ground was applied to the bottom fitting of the insulator, as shown in Figure 10. Figure 11 is the result of the simulation of the voltage distribution on the insulator model.
As seen in Figure 11, the maximum voltage from the simulation results was 20 kV according to the voltage applied to the conductor wire terminals. In the part close to the conductor wire, the visible voltage was still quite high according to the legend, where the color is red. As the ground is approached, the more blue the voltage, which means the lower the voltage value. This is because the core of the insulator is made of a dielectric material that has high resistance, so that it can withstand the voltage from flowing into the bottom fitting of the insulator.
To compare the voltage distribution on the insulator without contaminants and with contaminants, a line graph analysis was performed on the surface of the insulator, as shown in Figure 12. The comparison results can be seen in Figure 13.
In Figure 13, it can be seen that the voltage distribution in each insulator model with and without contaminant layers had different values. The voltage on the insulator without contaminants had a higher value than the insulator with contaminants. This can happen because the contaminant layer will decrease the dielectric strength of the insulator so that the measured voltage will also decrease.

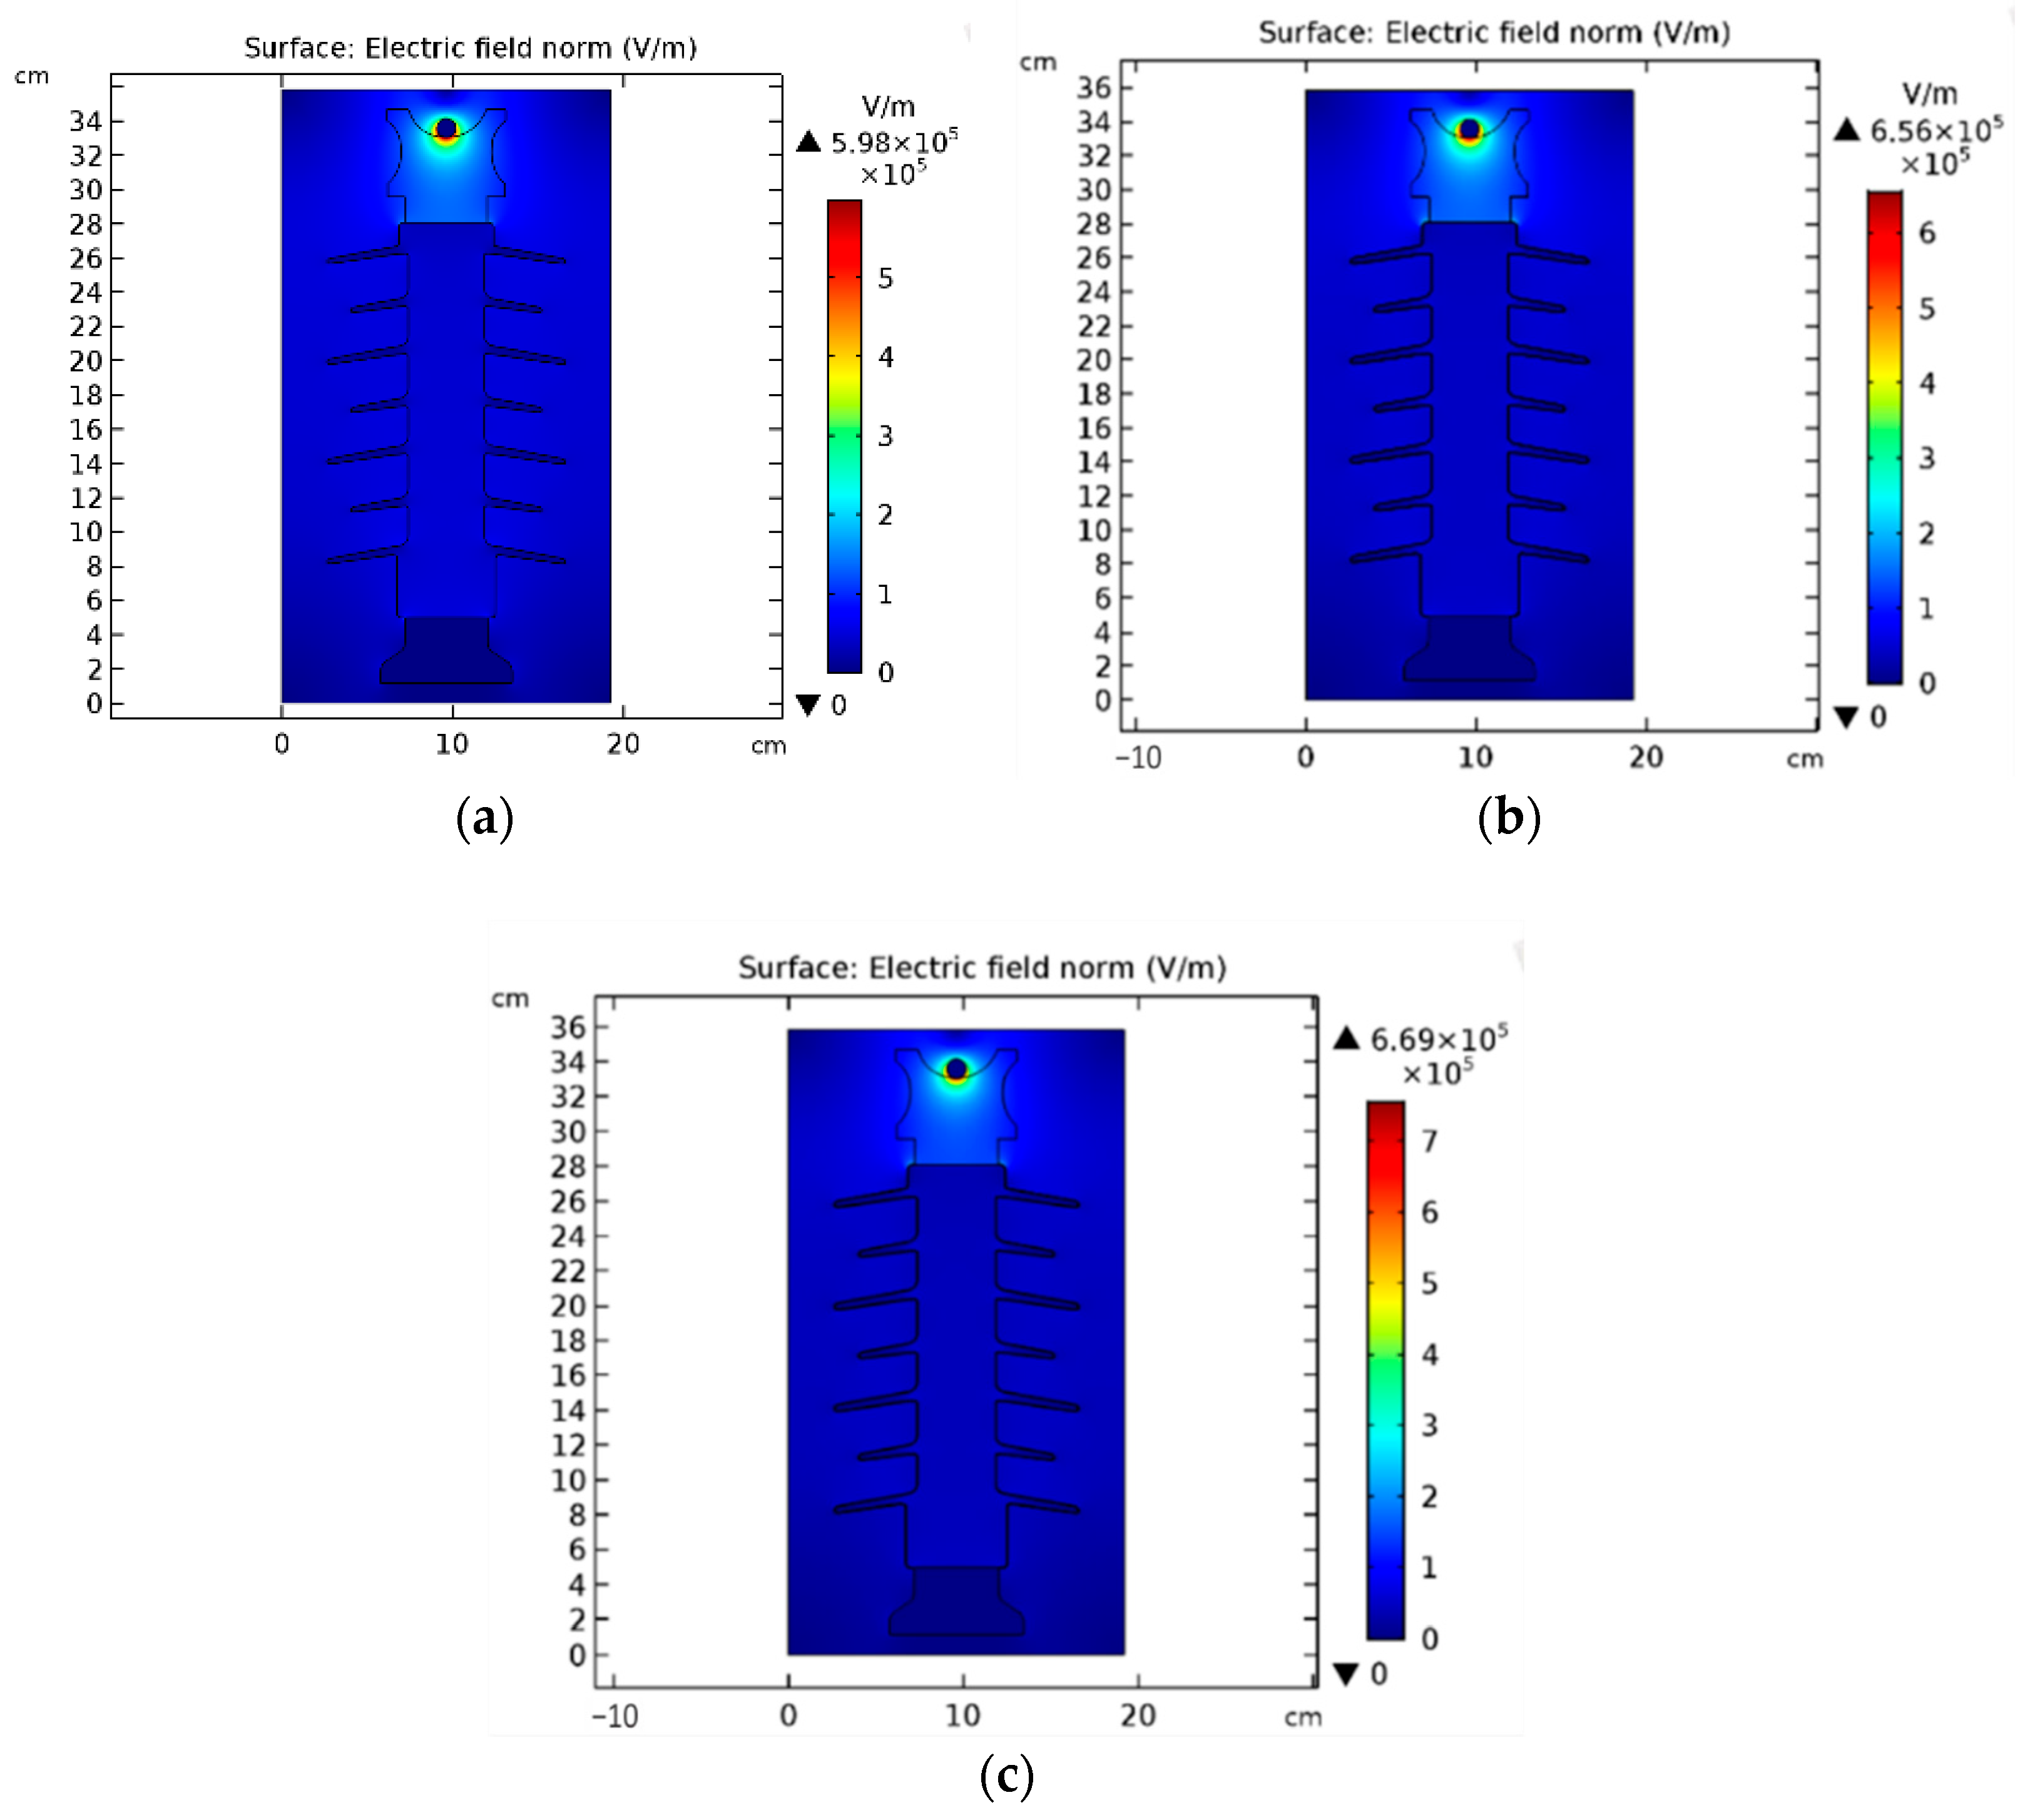
4.1.2. Effect of Contaminants on Electric Field

To determine the effect of salt contaminants on the distribution of the electric field, simulations were carried out on an insulator model without a contaminant layer and with a contaminant layer. In insulators contaminated with salt, the electrical conductivity value applied to the contaminant layer was 2.64 × 10⁻⁴ (S/m). While the insulator was contaminated with fly ash, the electrical conductivity value applied was 1.91 × 10⁻⁴ (S/m). The simulation results can be seen in Figure 14.
In Figure 14 it can be seen that the maximum electric field values were different in the insulator without contaminants and with contaminants. When the insulator was not coated with contaminants, the highest field value was 5.98 × 10⁵ V/m. The insulator with salt contaminants with a thickness of 0.5 mm had the highest field value of 6.56 × 10⁵ V/m. Moreover, for fly ash contaminants with a thickness of 0.5 mm, the highest field value was 6.69 × 10⁵ V/m. Thus, it can be concluded that the presence of contaminants will increase the maximum electric field value.

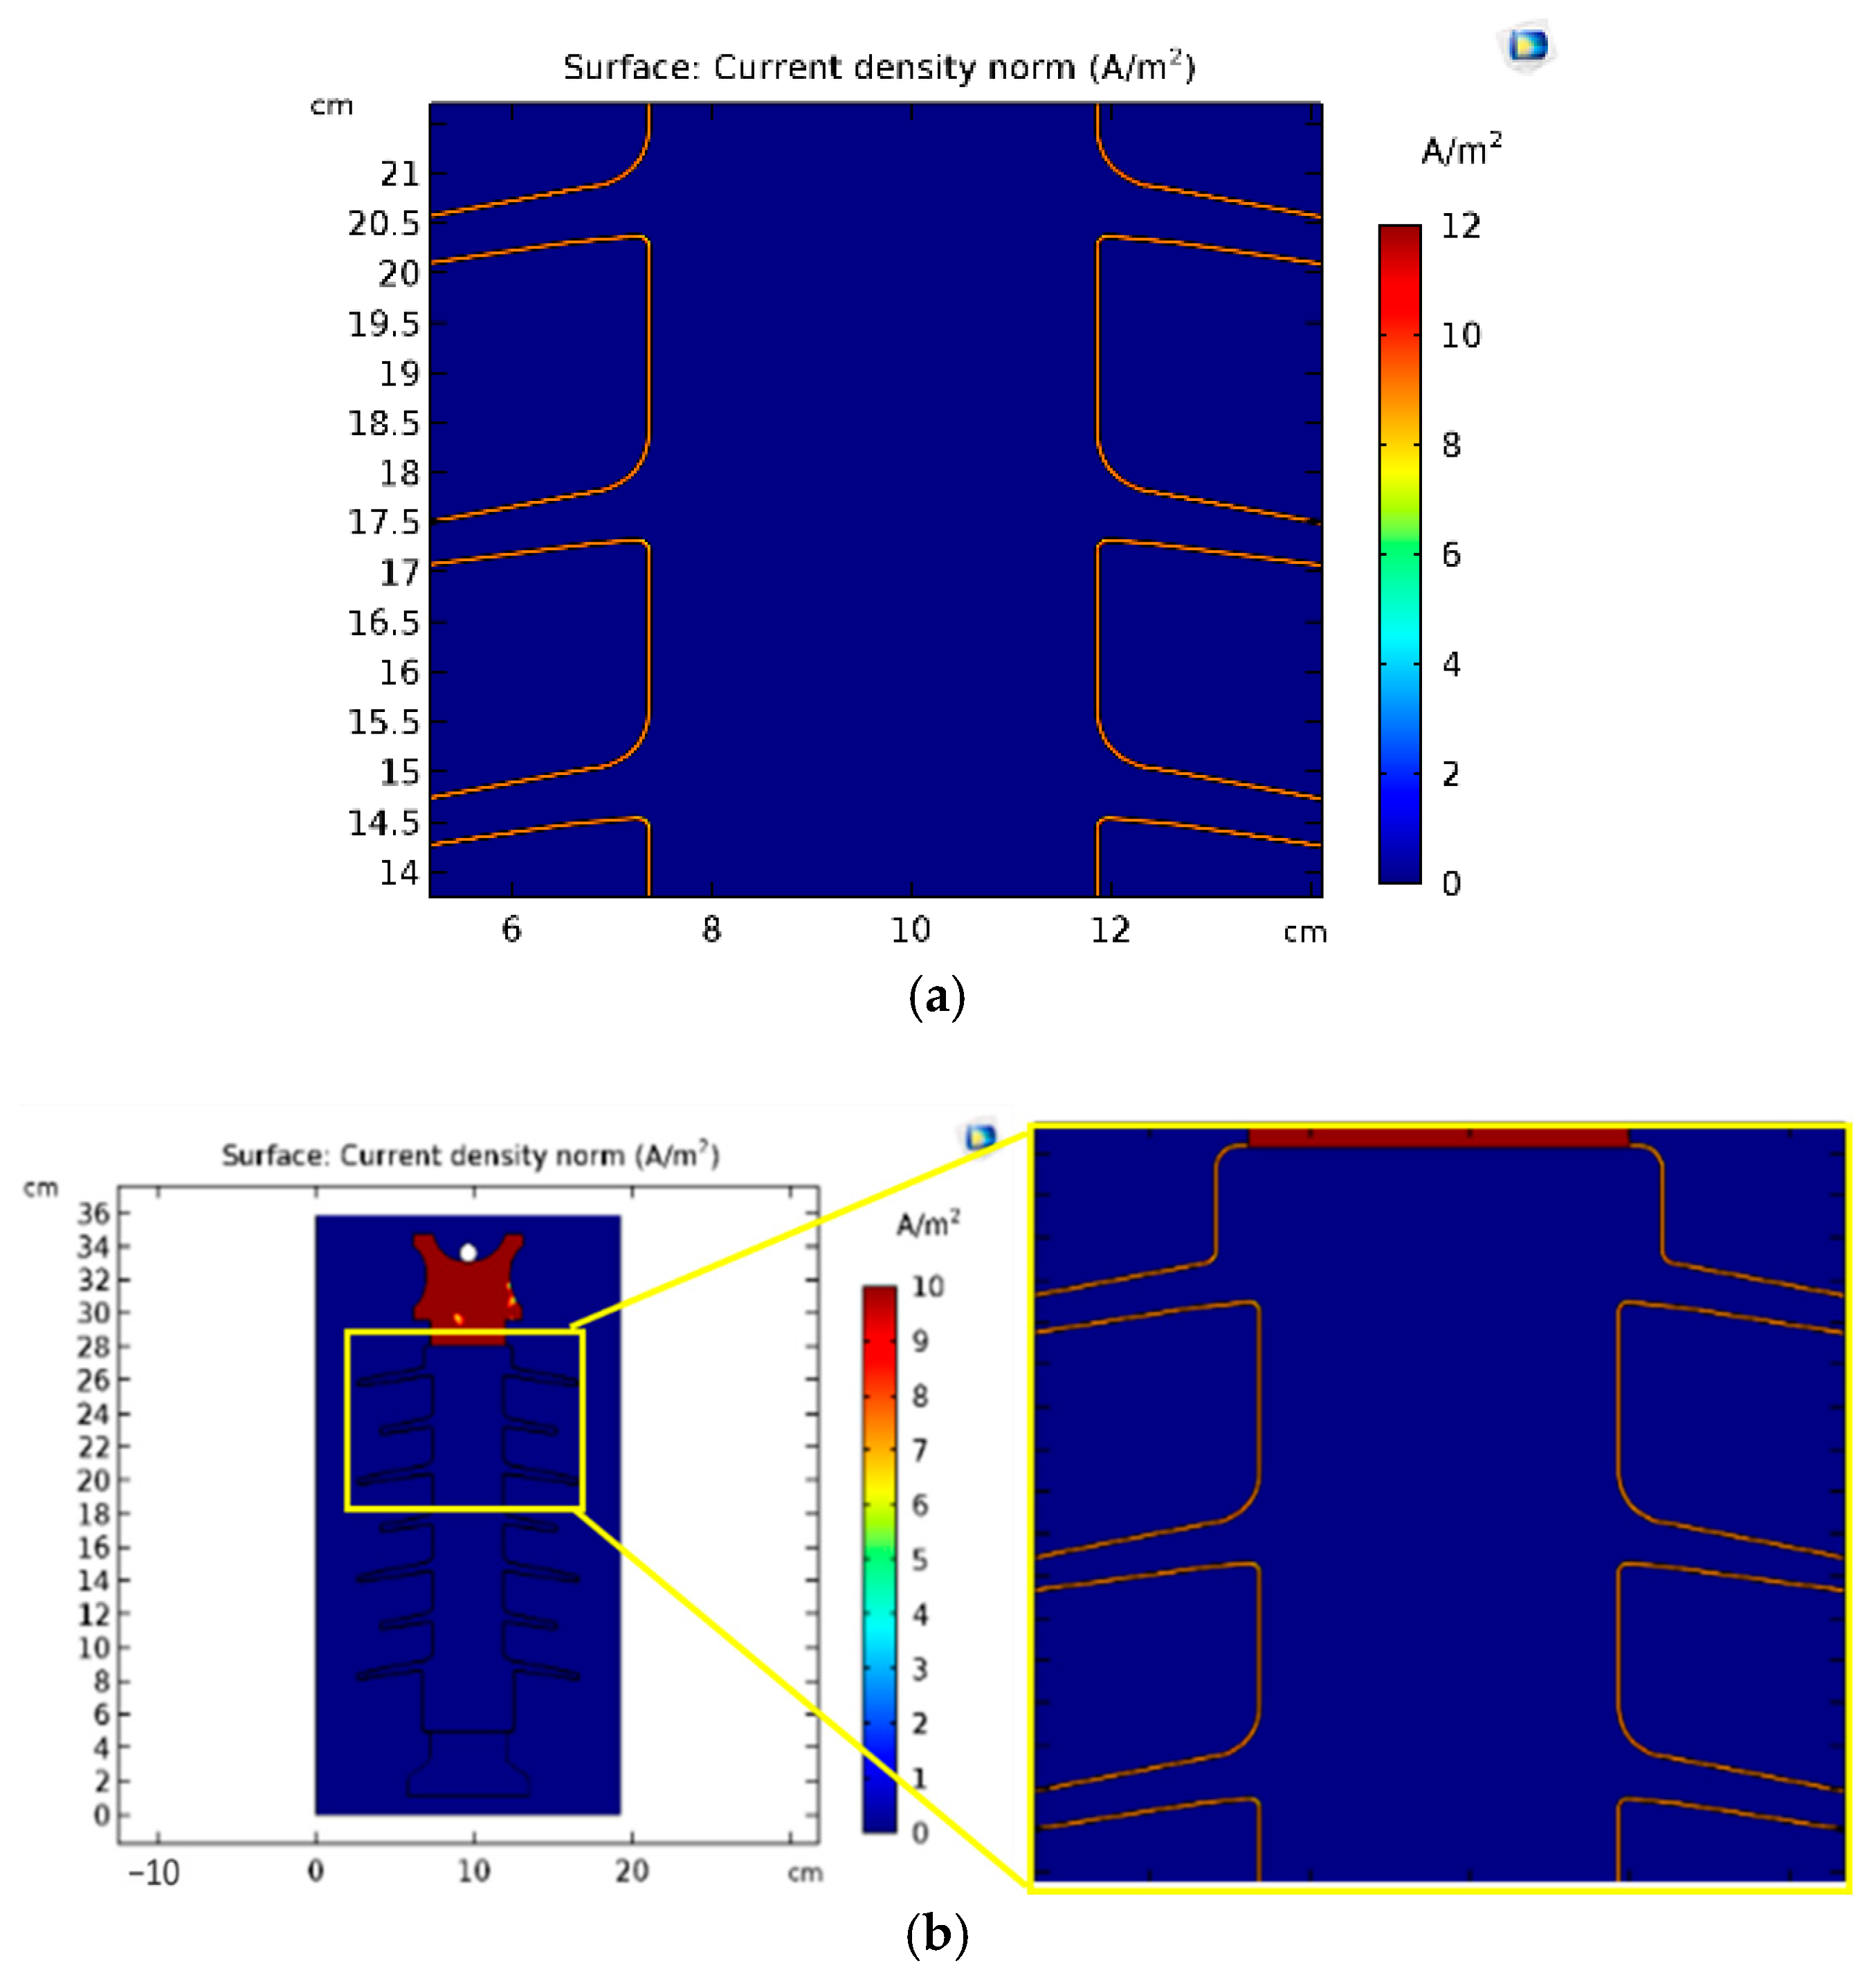
4.1.3. Effect of Contaminants on Current Density

To determine the effect of seawater and fly ash contaminants on the electric current density, simulations were carried out with variations in the electrical conductivity value of salt and fly ash contaminants. The simulation results of the current density can be seen in Figure 15. The figure shows that the current flowed through the contaminant layer because it had a high conductivity.
In the simulation, the current density in the pollutant layer was greater than the current density in the insulator core body. Figure 15 shows the pollutant layer in orange, while the inside of the insulator is blue.
The contaminant layer appeared to have a lighter color, indicating that the surface had a higher current density value. When viewed at the current density color level, this means that the contaminant layer had a greater current density than the inside of the insulator, so that the salt contaminant layer and fly ash contaminants were able to drain current from the conductor.

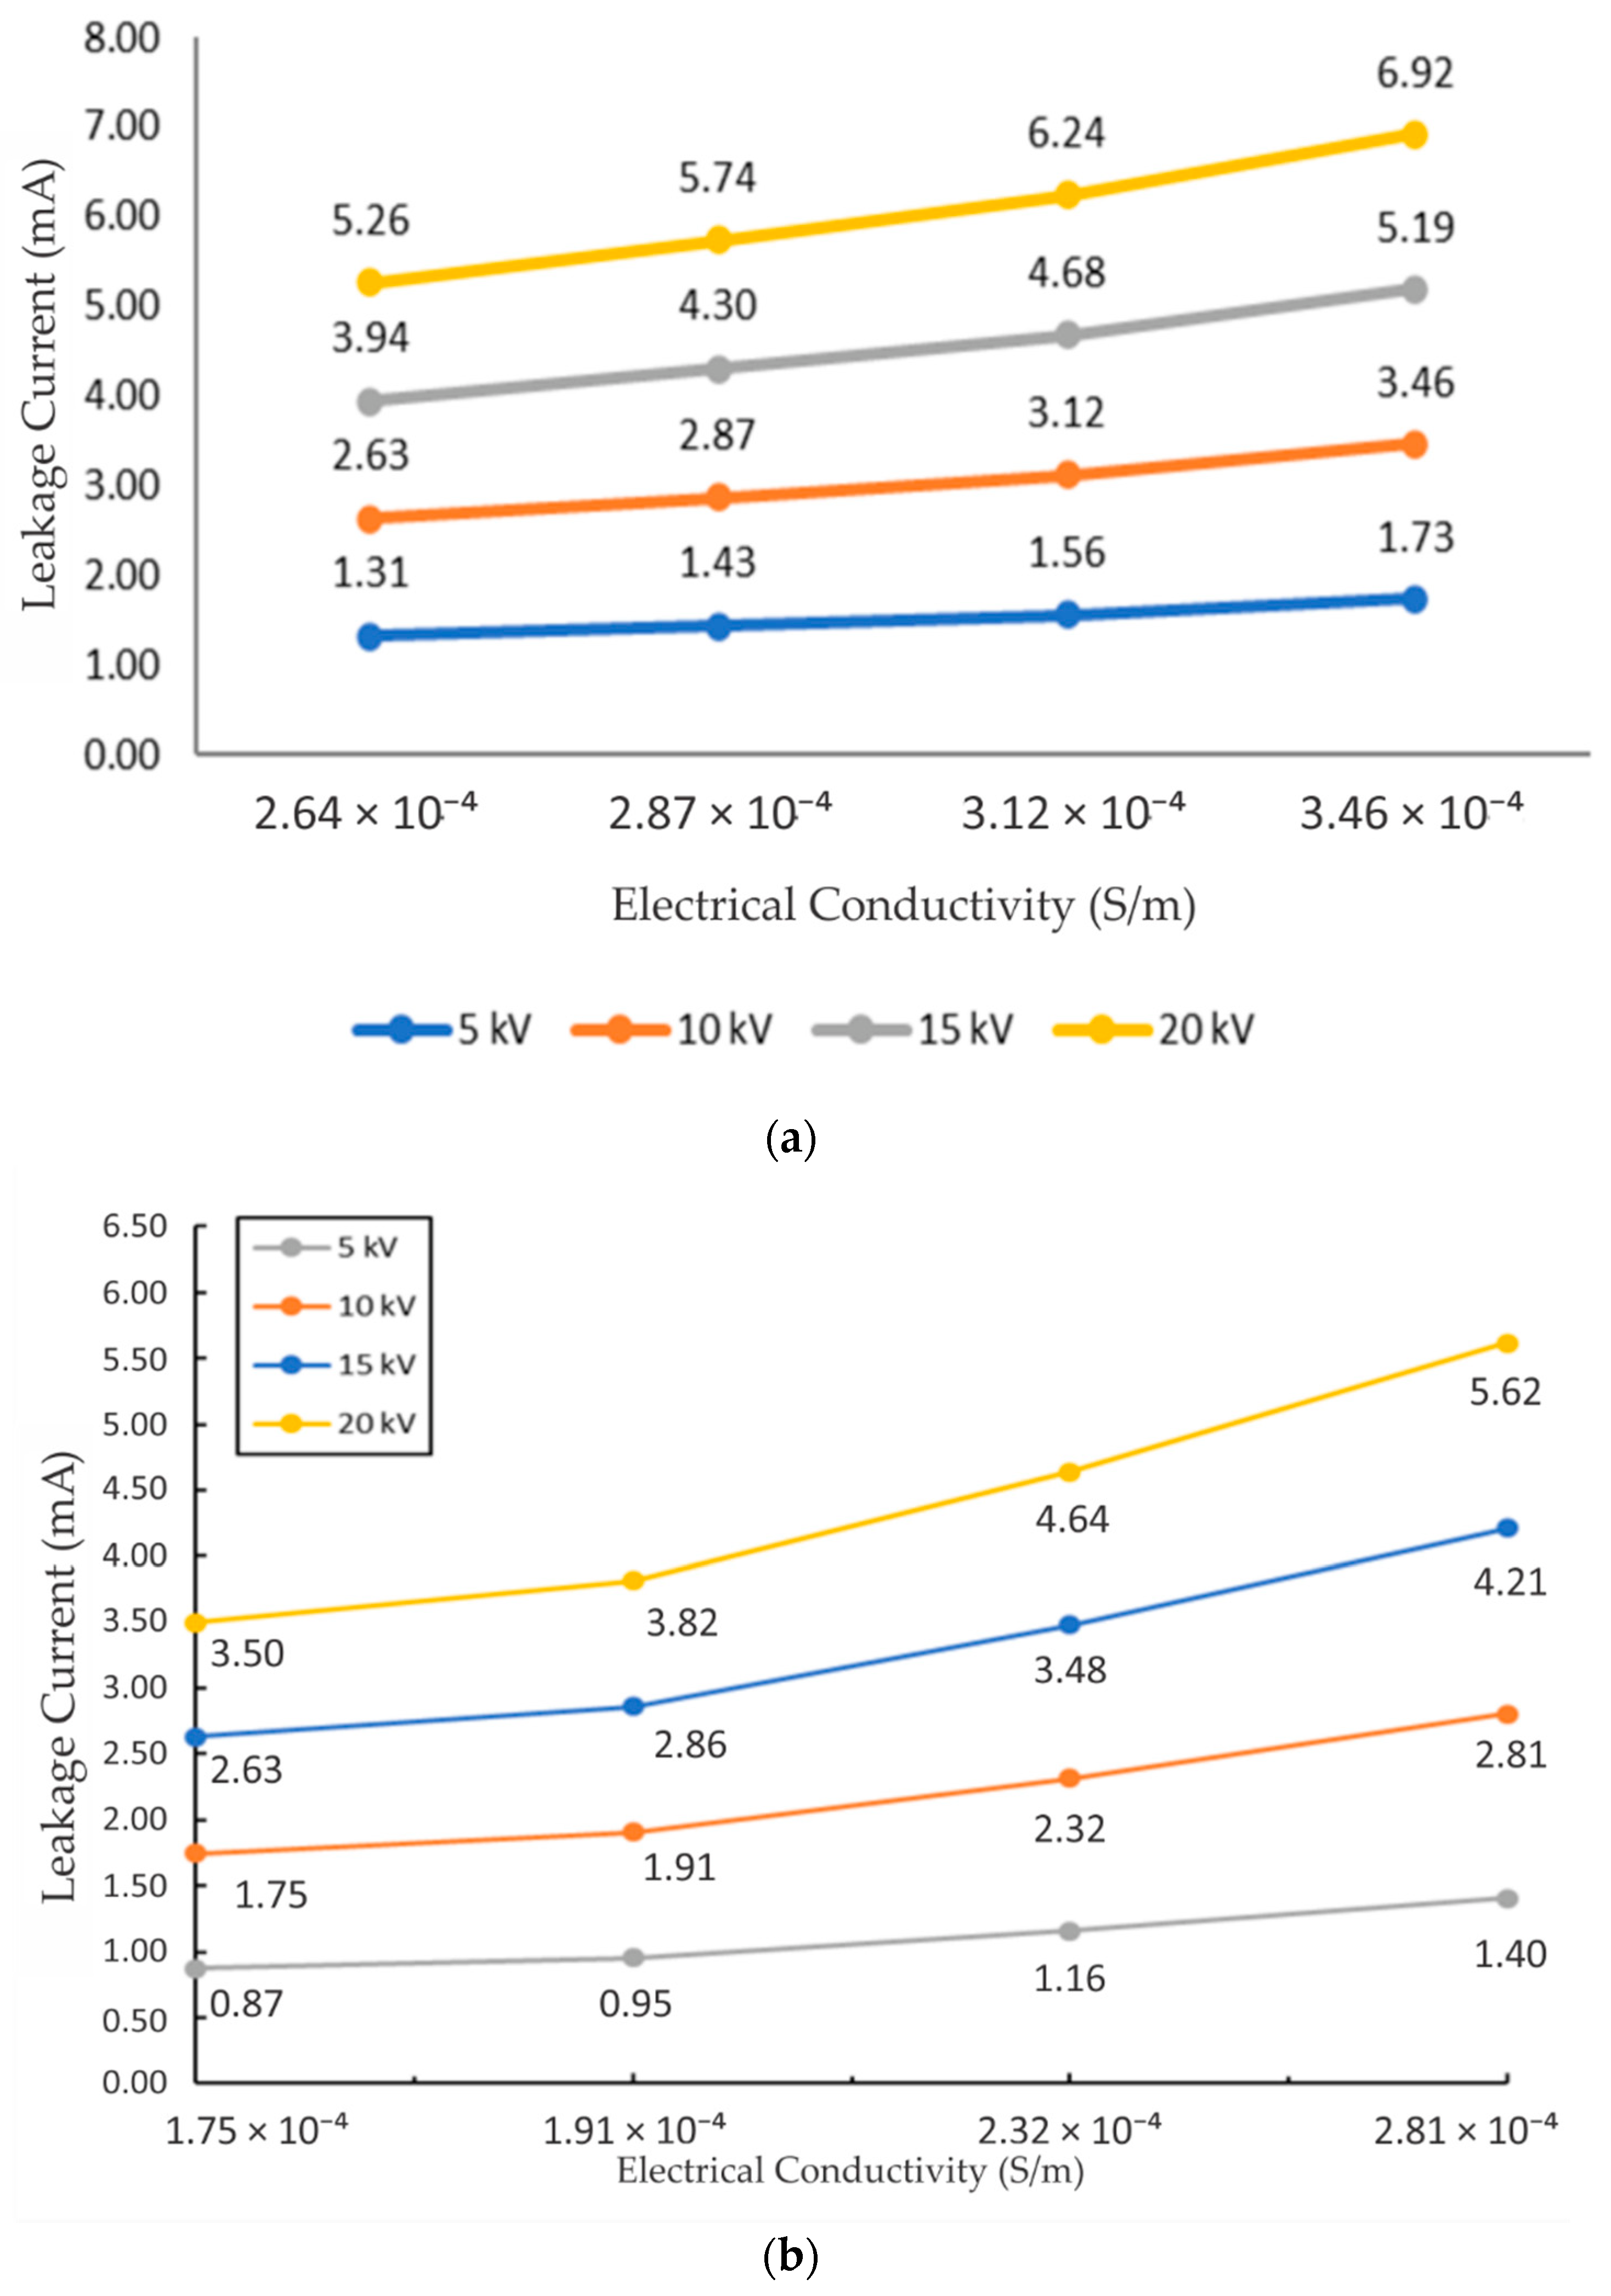
4.1.4. Effect of Electrical Conductivity on Leakage Current

Current density can be used to obtain the value of the surface current of the insulator with the function of surface integration. This surface current can then be called the insulator leakage current. Figure 16 shows the effect of the conductivity of salt contaminants and fly ash contaminants on the leakage current on the surface of the simulated insulator.
The higher the conductivity of the pollutant, the higher the leakage current measured on the insulator’s surface, as shown in Figure 16. The conductivity value of the salt pollutant was directly proportional to the ESDD of the salt pollutant. Likewise, the conductivity values of fly ash were proportional to its NSDD value. Therefore, it can also be concluded that the higher the level of salt pollution and fly ash pollution on the surface of the insulator, the higher the leakage current flowing on the surface of the insulator.

4.2. Polymer Insulator Experiment Results

The insulator experiment in this study measured the magnitude of the leakage current from the polymer insulator. The leakage current measurement was carried out by adjusting the predetermined variables, namely the applied voltage, ESDD from salt pollutants, and NSDD from fly ash pollutants. In addition, the test also compared the performance of insulators that were not aging and insulators that were aging, seen from the measured leakage current value. All insulator conditions were tested under dry conditions and wet conditions. Insulator testing was done by the step voltage method. Therefore, a voltage of 5 kV was applied and gradually increased to 10 kV, 15 kV, and finally 20 kV according to the nominal voltage of the insulator. Leakage current was measured at each voltage level. Leakage current measurements were carried out three times as a form of data validation. The three data were then taken to determine the average value of the leakage current for each voltage level and modeled in a graph using Microsoft Excel software.

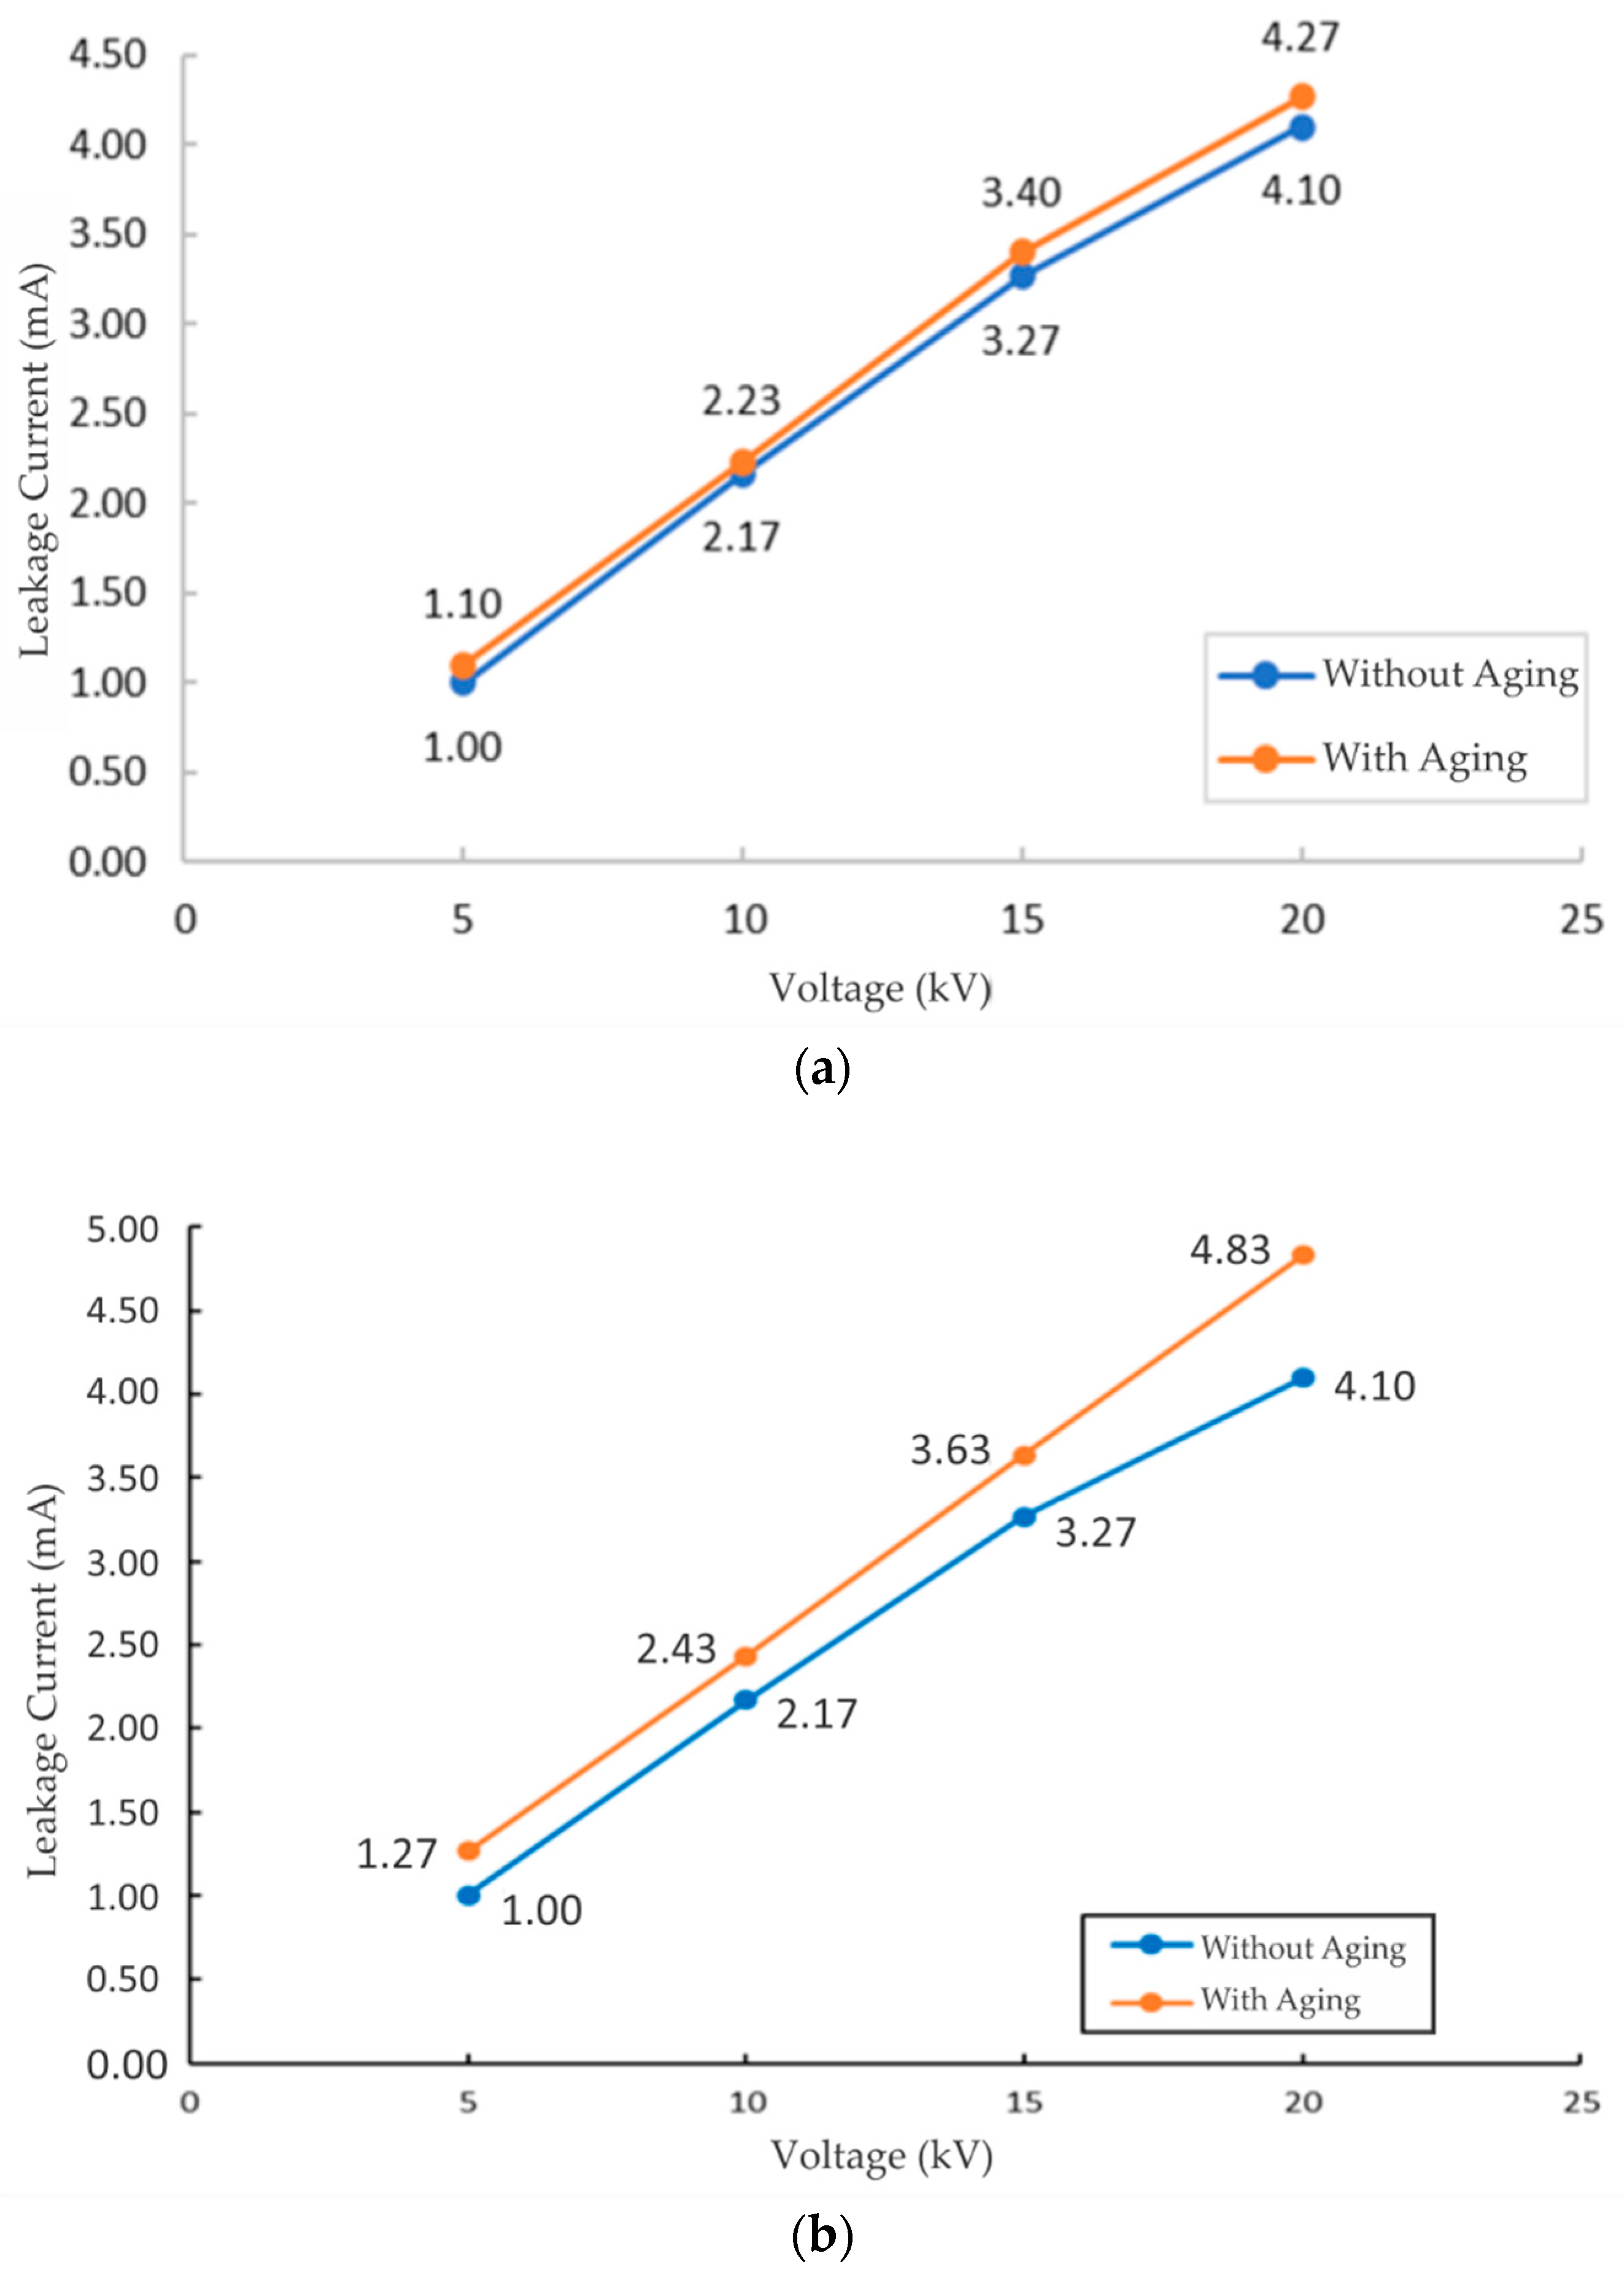
4.2.1. Comparison of Leakage Current of Aging with Aging Insulator

Figure 17 shows the comparison of the measured leakage current of each voltage level in the insulator without aging and the insulator with aging. Aged insulators had a higher leakage current than non-aged insulators. The fungus that grows on the insulator’s surface as a result of the natural aging process causes an increase in leakage current in aged insulators. The fungus that grows on the surface of the insulator made of polymer can increase the surface conductivity of the insulator core body [25]. The increased surface conductivity of the insulator makes it easier for leakage current to flow through the surface of the insulator. So, it can be concluded that the insulator with aging has a higher leakage current value than the insulator without aging. This is because the surface of the insulator with aging is already affected by the weather, namely exposure to sunlight, rainwater, and outdoor temperature.

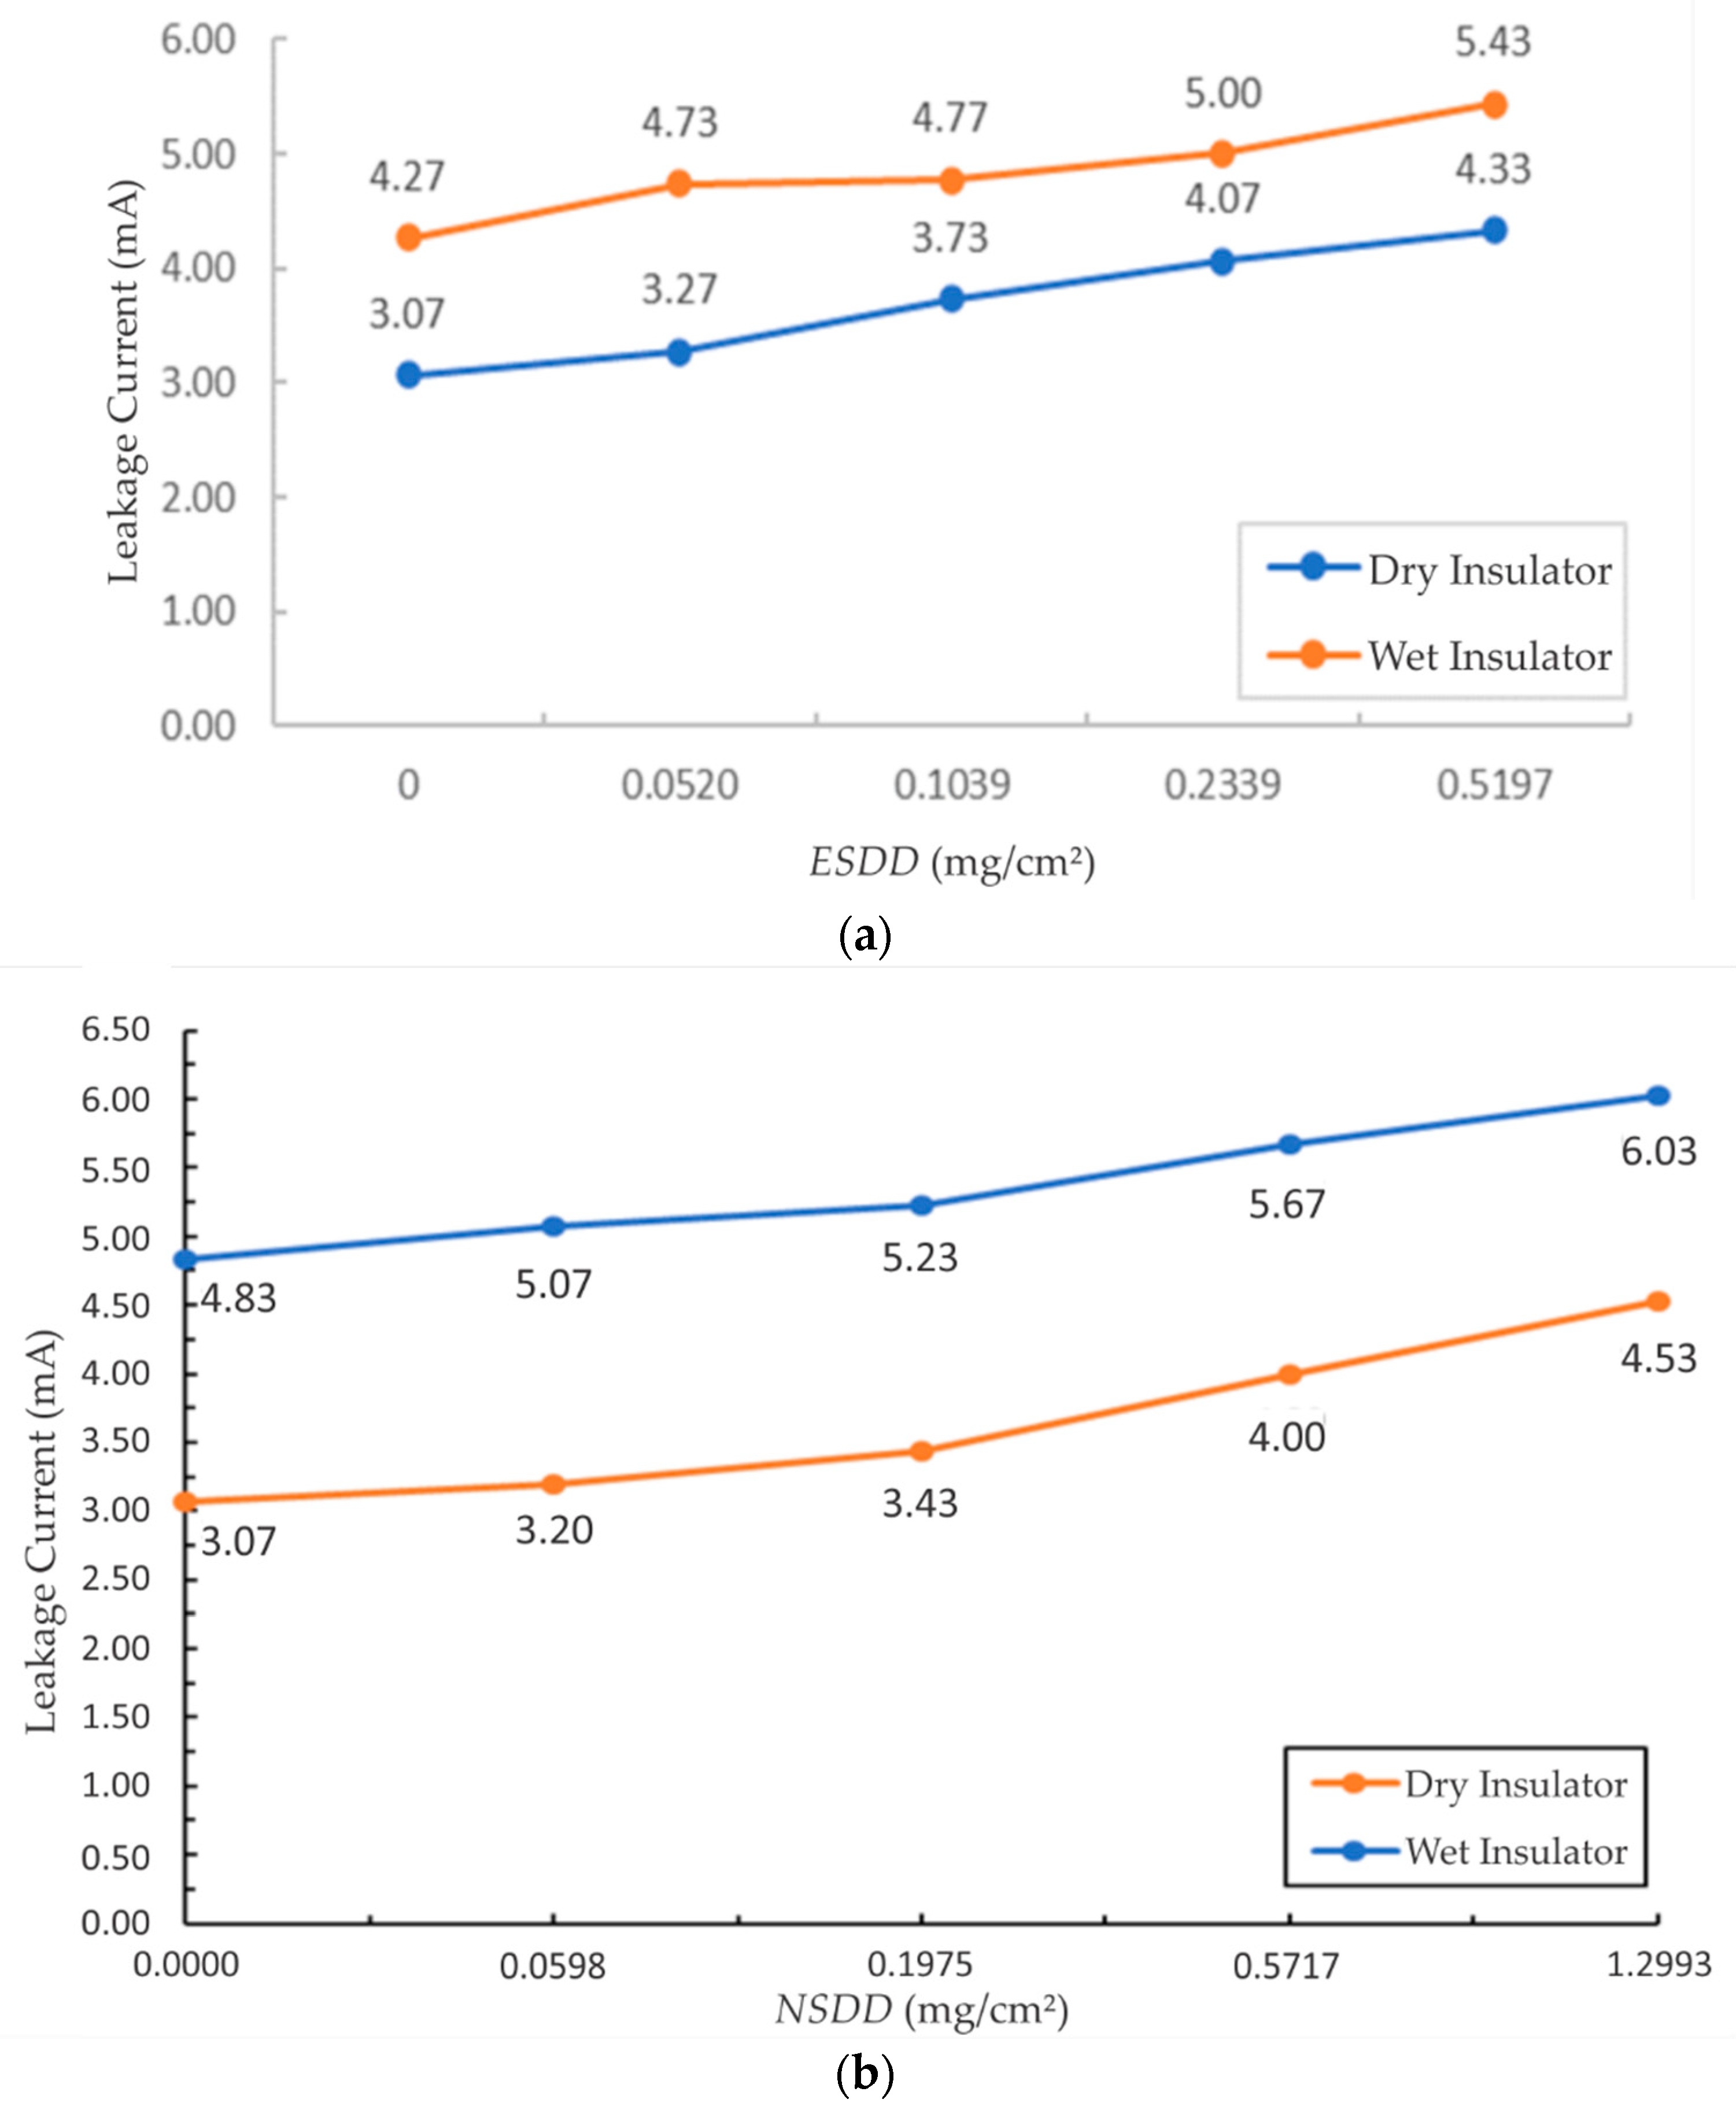
4.2.2. Comparison of Dry Insulator Leakage Current with Wet Insulator

In Figure 18, it can be seen that the increase in ESDD with the same voltage of 20 kV in dry and wet insulator conditions affected the value of the leakage current that flowed. In addition, it can be seen that the condition of the insulator caused a large difference in the value of the leakage current. From these data, it can be concluded that the insulator leakage current in wet conditions has a higher value than insulators in dry conditions. This can happen because water is a conductive compound or can conduct an electric current so that it can result in a decrease in the dielectric strength of the insulator, which results in an increase in the leakage current flowing.
In fly ash contaminants, comparison of the effect of NSDD on the leakage current in polymer insulators in dry and wet conditions was made. It can be seen that the leakage current continued to increase along with the increase in the NSDD value of fly ash pollutants for both dry and wet insulators. Therefore, it can be concluded that the higher the NSDD value of fly ash pollutants, the higher the leakage current in the polymer insulator in dry and wet conditions. This can happen because the fly ash pollutants on the surface of the insulator form a layer that is capable of flowing current. Water can mix with fly ash pollutants on the surface of the insulator easily because fly ash is hydrophilic, which is a property that causes fly ash to easily mix with water. Water, which is a good conductor, causes the conductivity of pollutants on the surface of the insulator to increase, so that current flows more easily on the surface of the insulator in wet conditions.

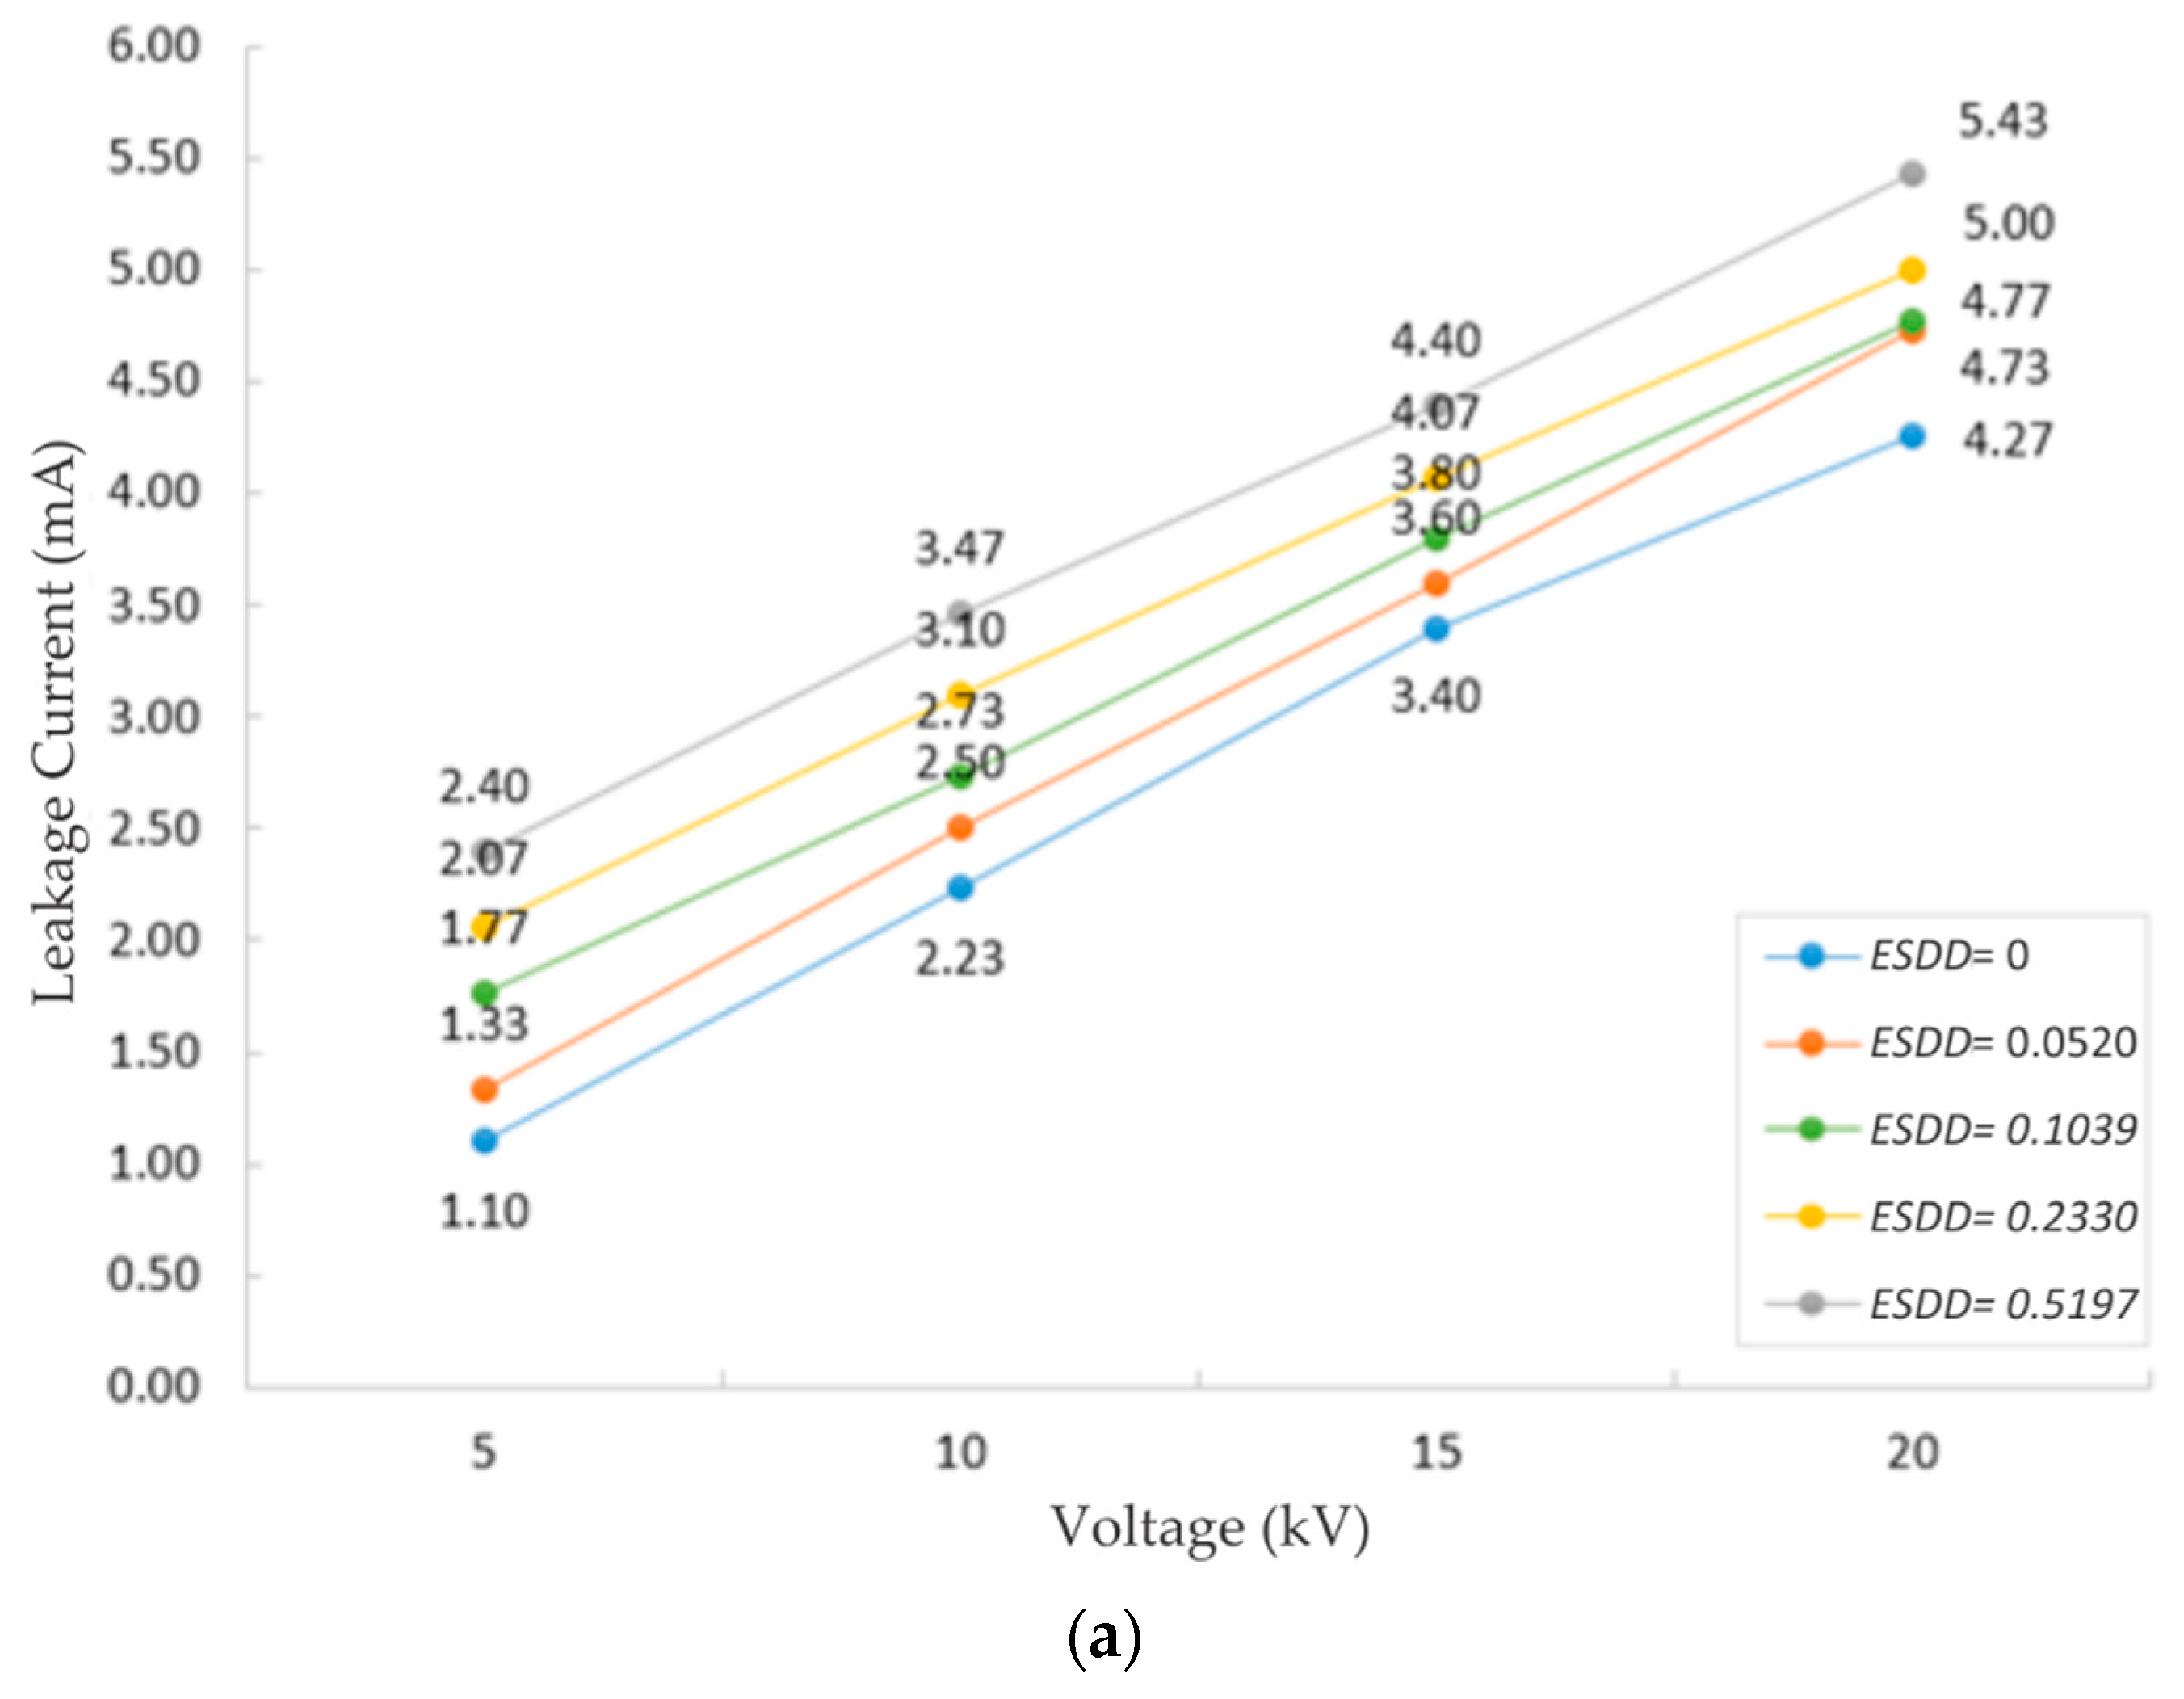
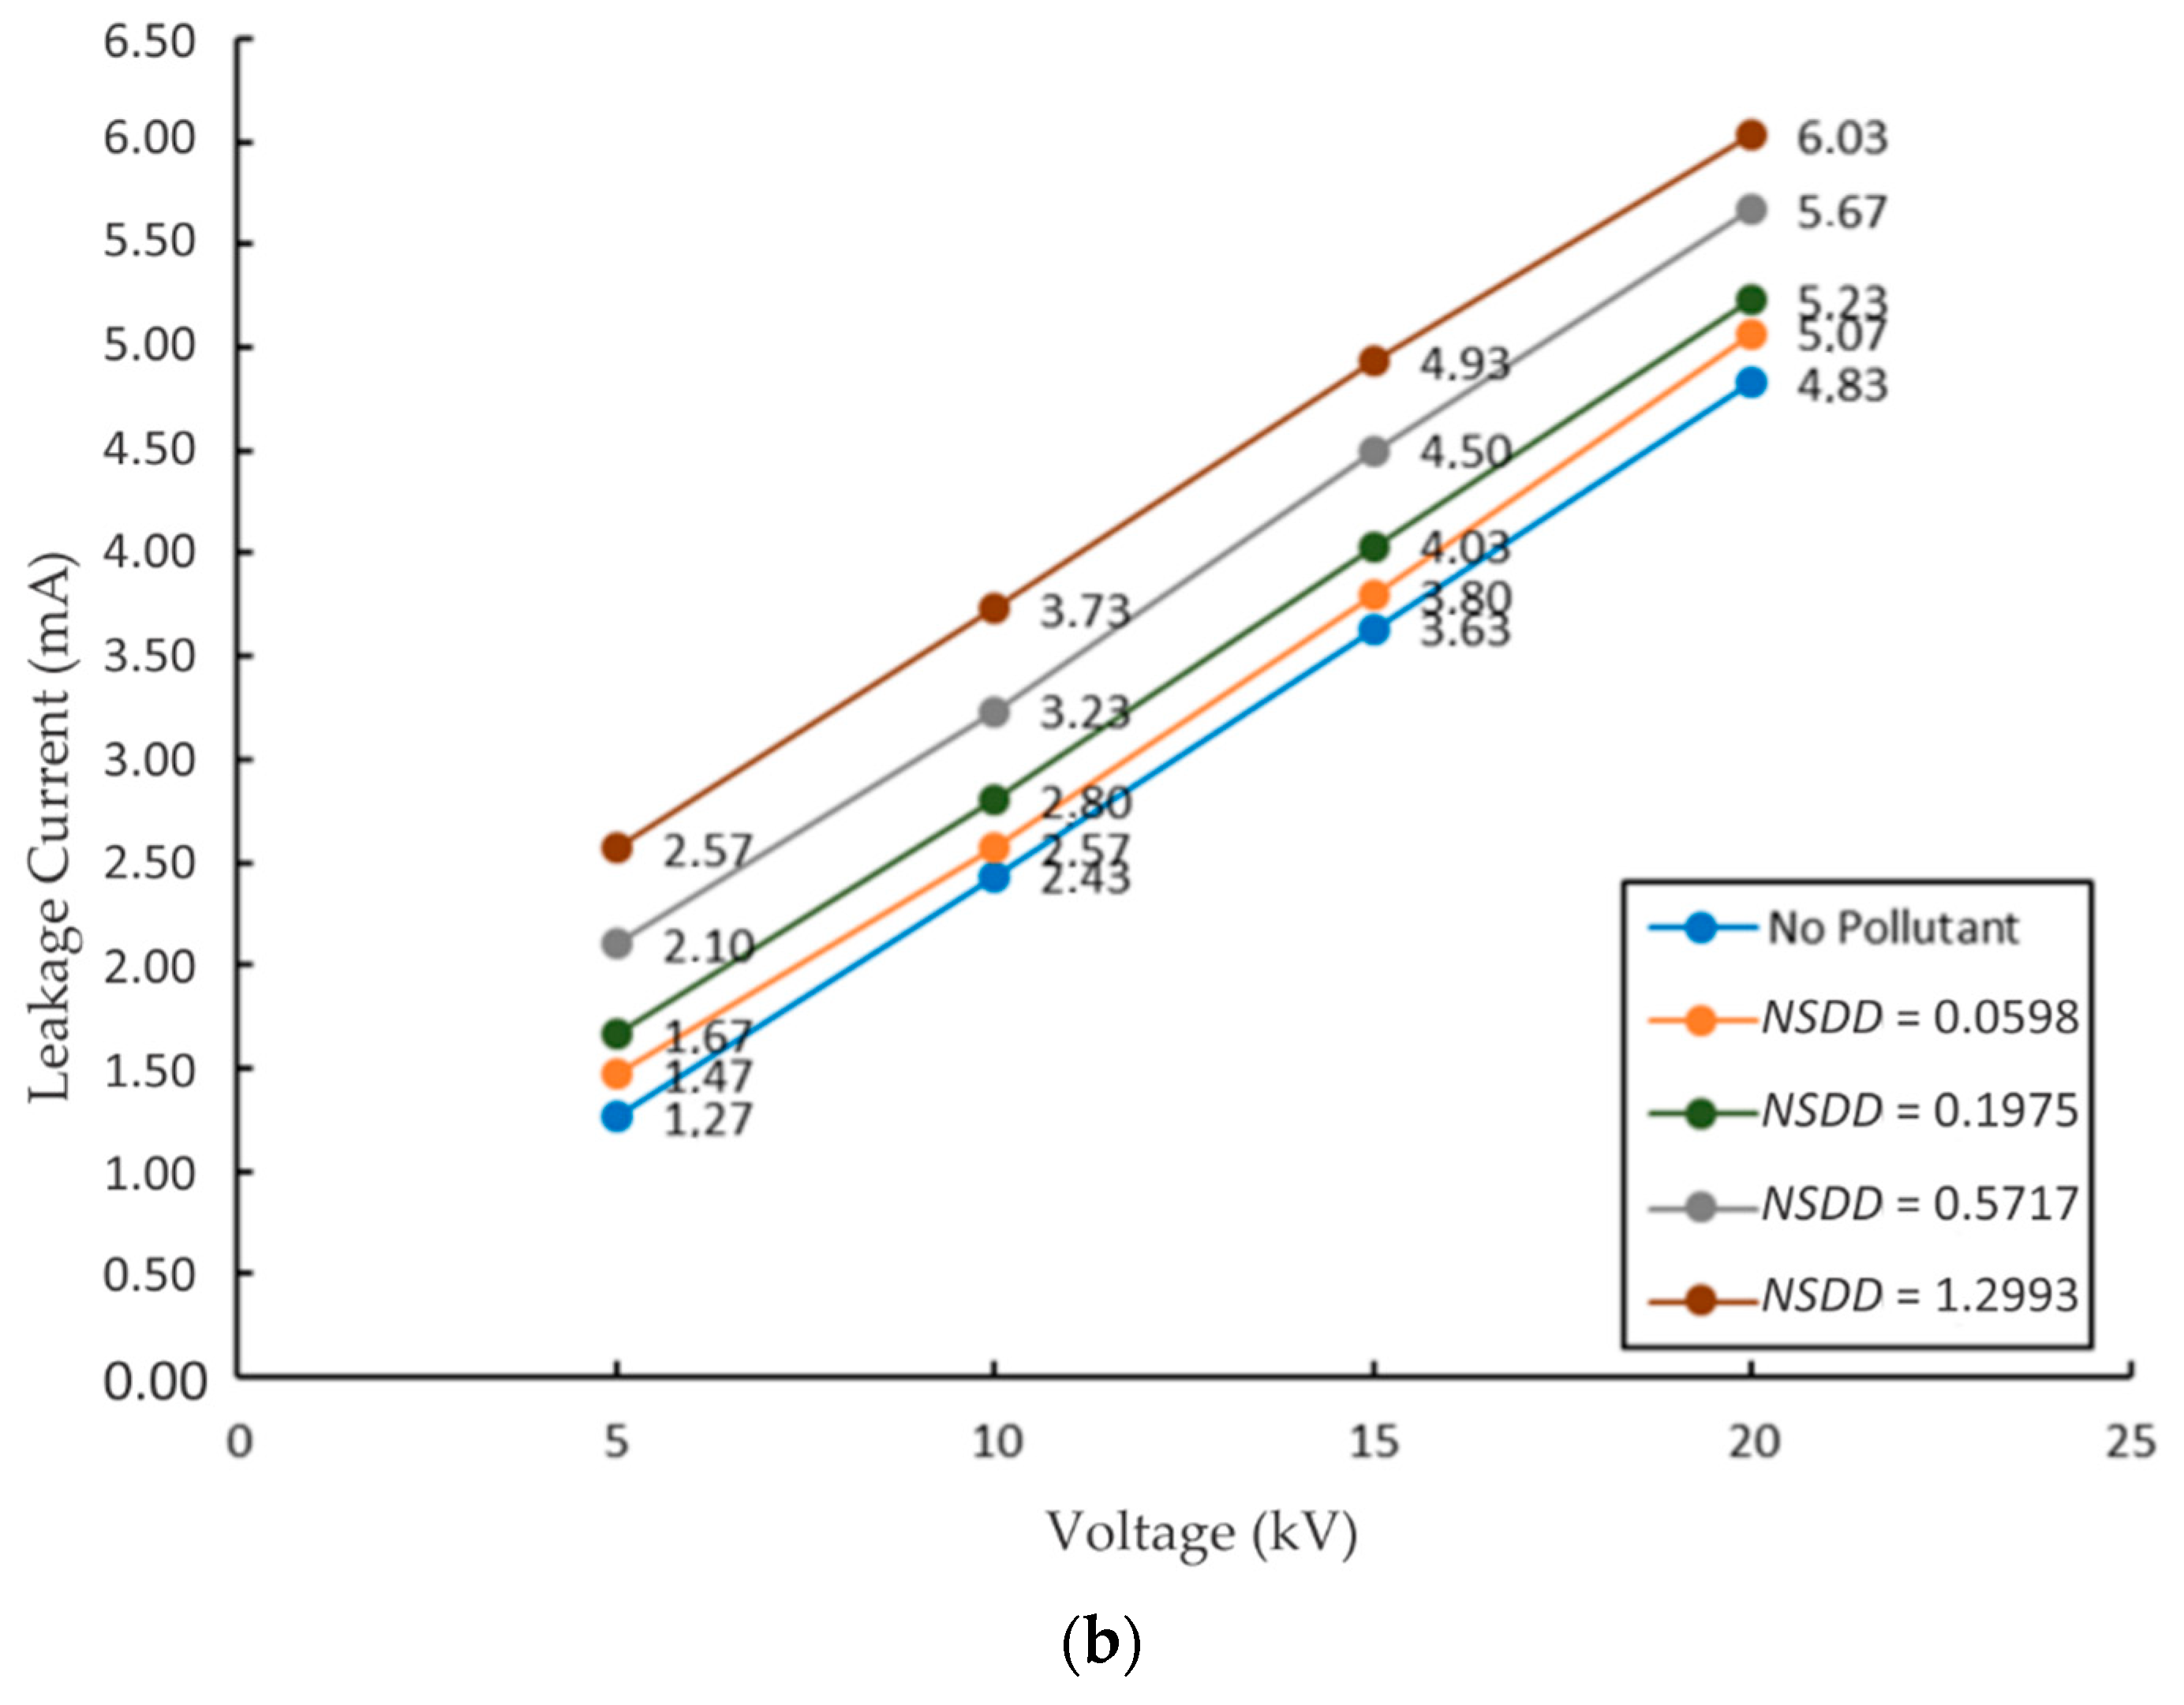
4.2.3. Comparison of the Change in Voltage to the Leakage Current in the Insulator

In this test, the insulator being tested was an insulator that had experienced aging. The given voltage starts from 5 kV, and then went to 10 kV and 15 kV and up to 20 kV. From Figure 19a,b it can be seen that the increase in voltage affected the leakage current from the insulator. The leakage current continued to increase along with the increase in the applied voltage, both on insulators without pollutants and insulators with pollutants with various ESDD and NSDD values. Therefore, it can be concluded that the higher the voltage applied to the insulator, the higher the leakage current in the dry insulator. This increase in leakage current can be explained by the equation V = I × R, where the insulator is a resistance (R), the voltage applied to the insulator is V, and the measured leakage current is I. So when viewed from the equation, the higher the voltage value given (V), the higher the leakage current (I) will also be, while the value of the insulator resistance (R) is constant.

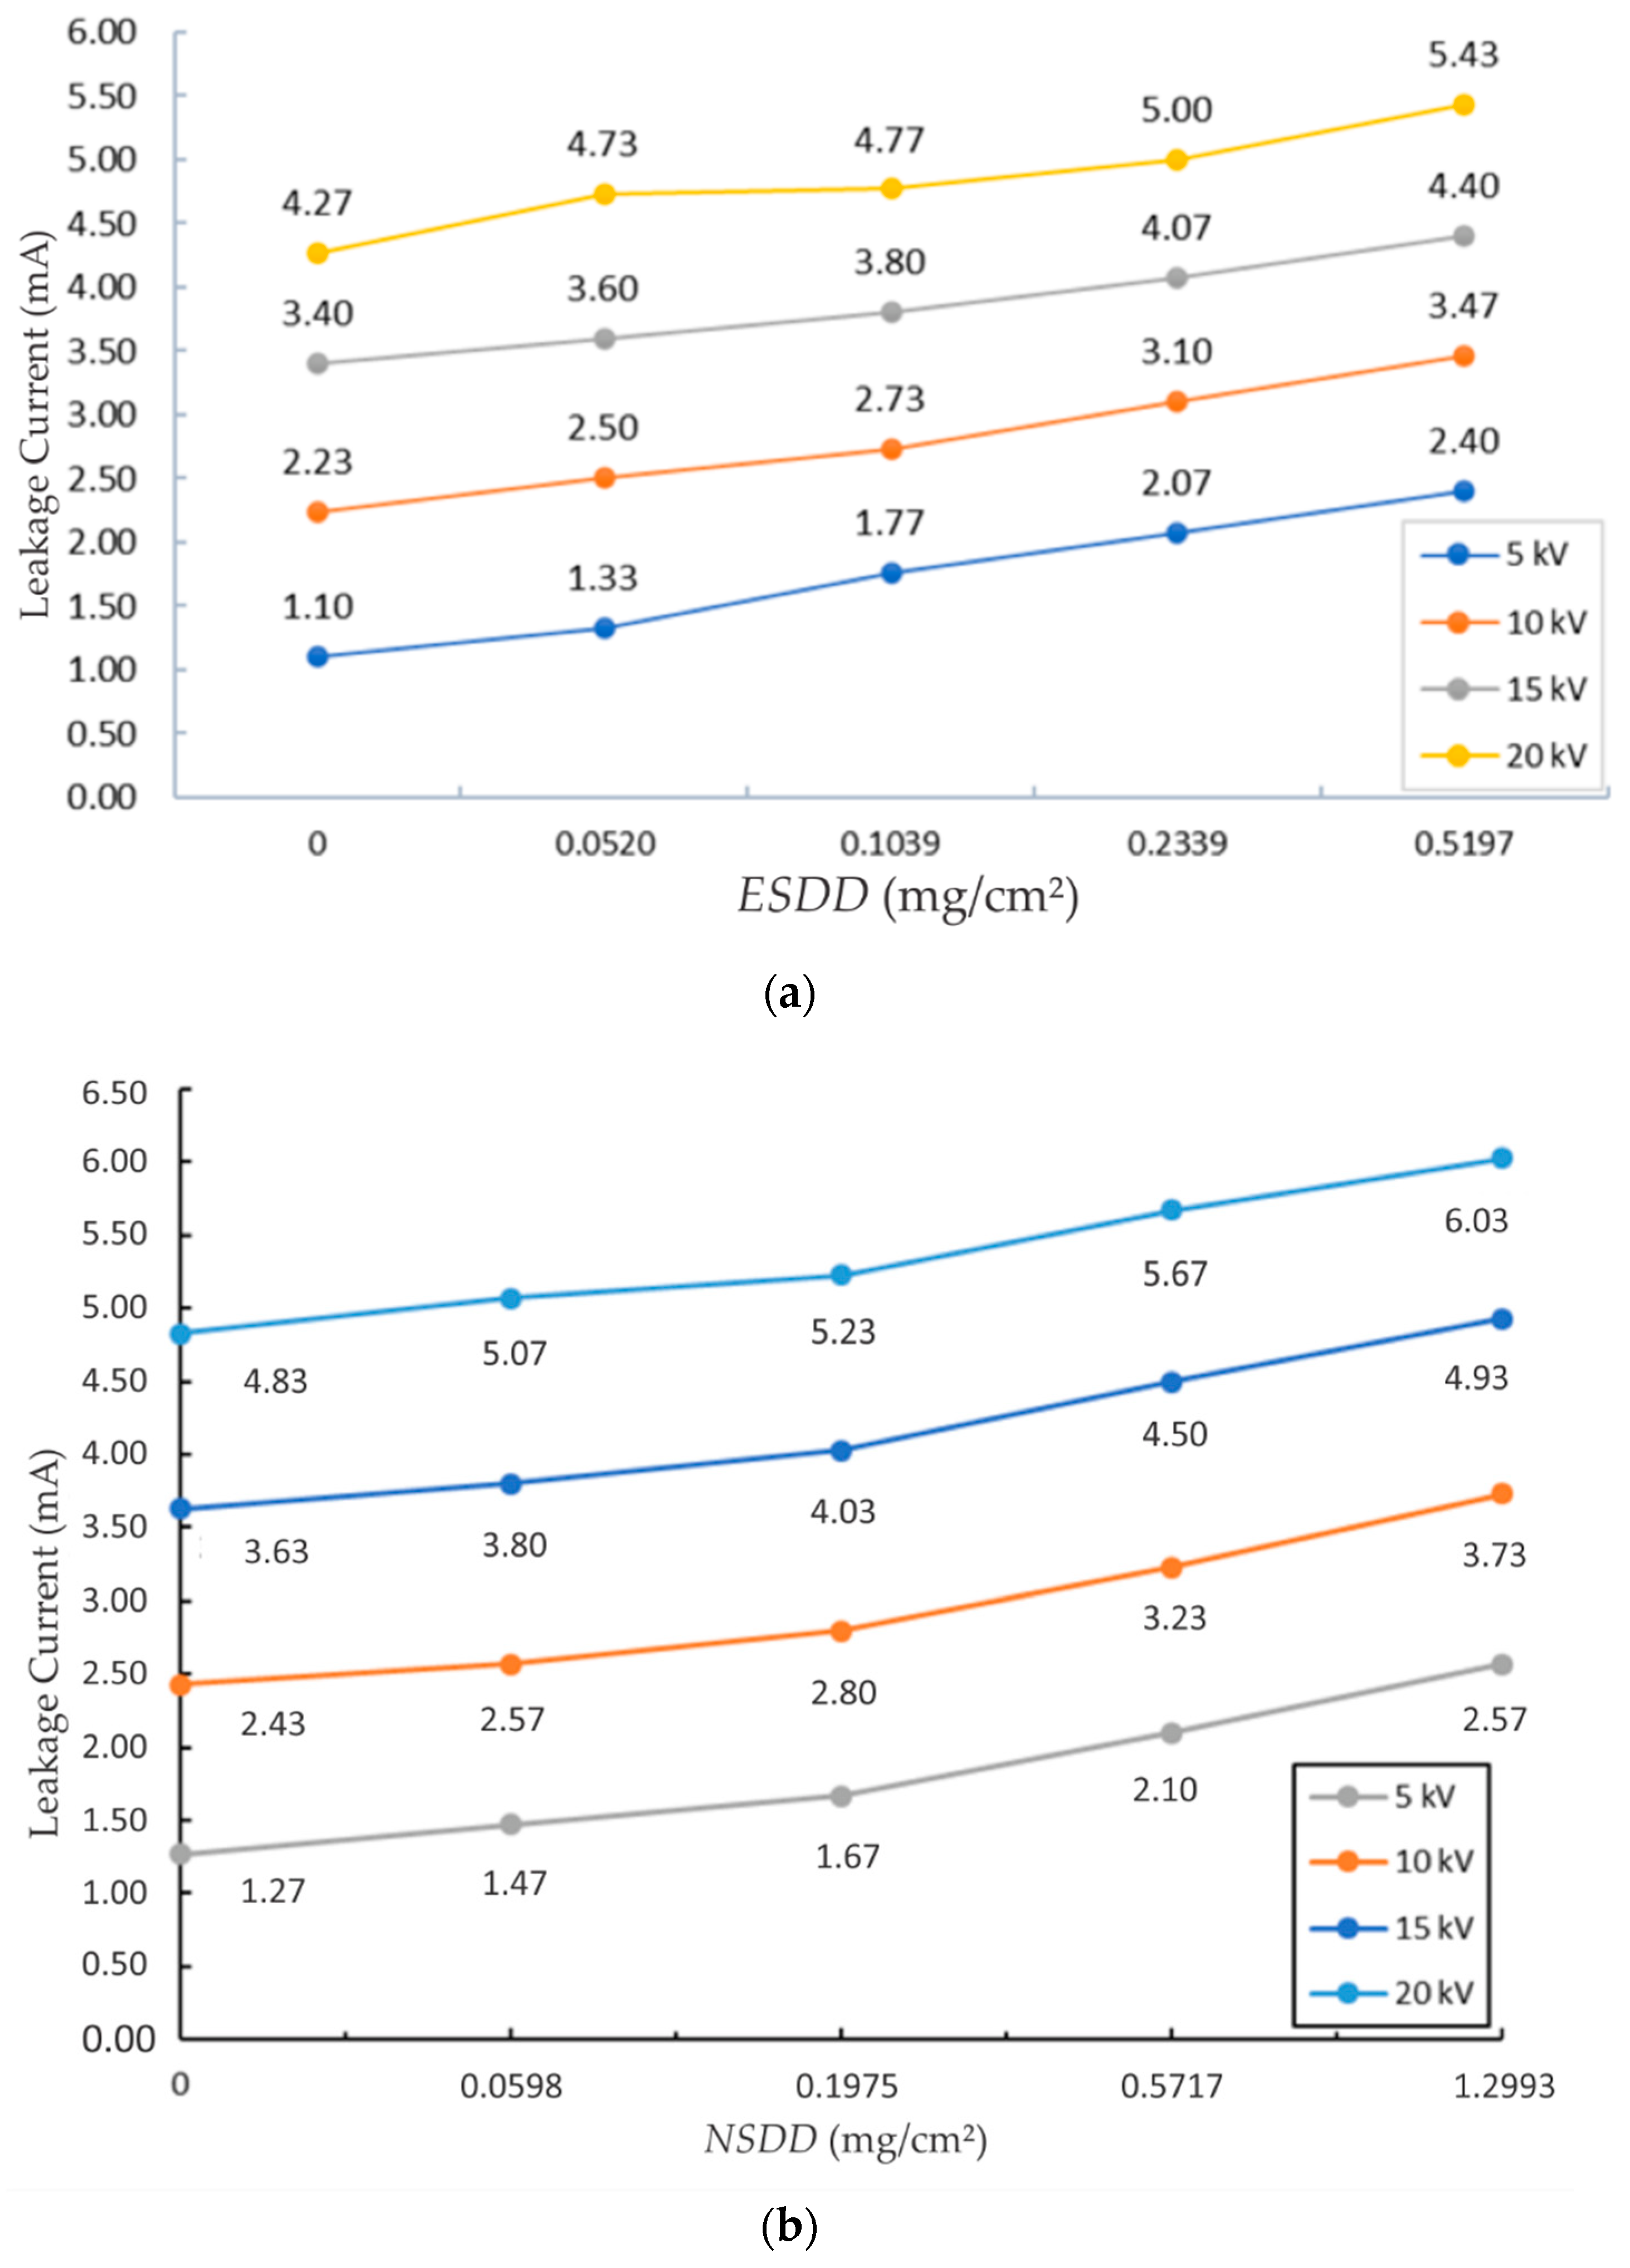
4.2.4. Comparison of the Effect of ESDD and NSDD on Leakage Current in the Insulator

In this test, the insulator being tested was an insulator that had experienced aging. Polymer insulators were tested based on variations in ESDD and NSDD values. These values represent the level of pollution on the insulator from light, medium, heavy, and very heavy. The voltages applied to the insulator were 5 kV, 10 kV, 15 kV, and 20 kV. Figure 20a shows the effect of ESDD on the amount of leakage current in the polymer insulator. Moreover, Figure 20b shows the effect of NSDD on the leakage current. It can be seen that the ESDD and NSSD values of each pollutant affected the insulator leakage current. The leakage current continued to increase as the ESDD and NSDD values increased. This also occurred at all voltage levels, namely 5 kV, 10 kV, 15 kV, and 20 kV. So it can be concluded that the higher the contaminant ESDD value, the higher the leakage current value in the insulator. Salt is an electrolyte compound, namely a compound that can conduct electric current, so that the higher the salt content in the insulator will increase the surface conductivity, which results in the electric current flowing. In addition, the higher the NSDD value of fly ash pollutants, the higher the leakage current in the polymer insulator in a wet state. This can happen because the fly ash pollutant on the surface of the insulator forms a layer that is capable of flowing current.

4.3. Comparison of Simulation Results with Testing

The results of the simulation and insulator experiment were compared to prove and compare the effect of salt pollutants and fly ash pollutants attached to the insulator surface on the insulator leakage current. The conductivity value of salt pollutants was directly proportional to the ESDD of salt pollutants. Likewise, the conductivity value of fly ash was directly proportional to the NSDD of fly ash pollutants.

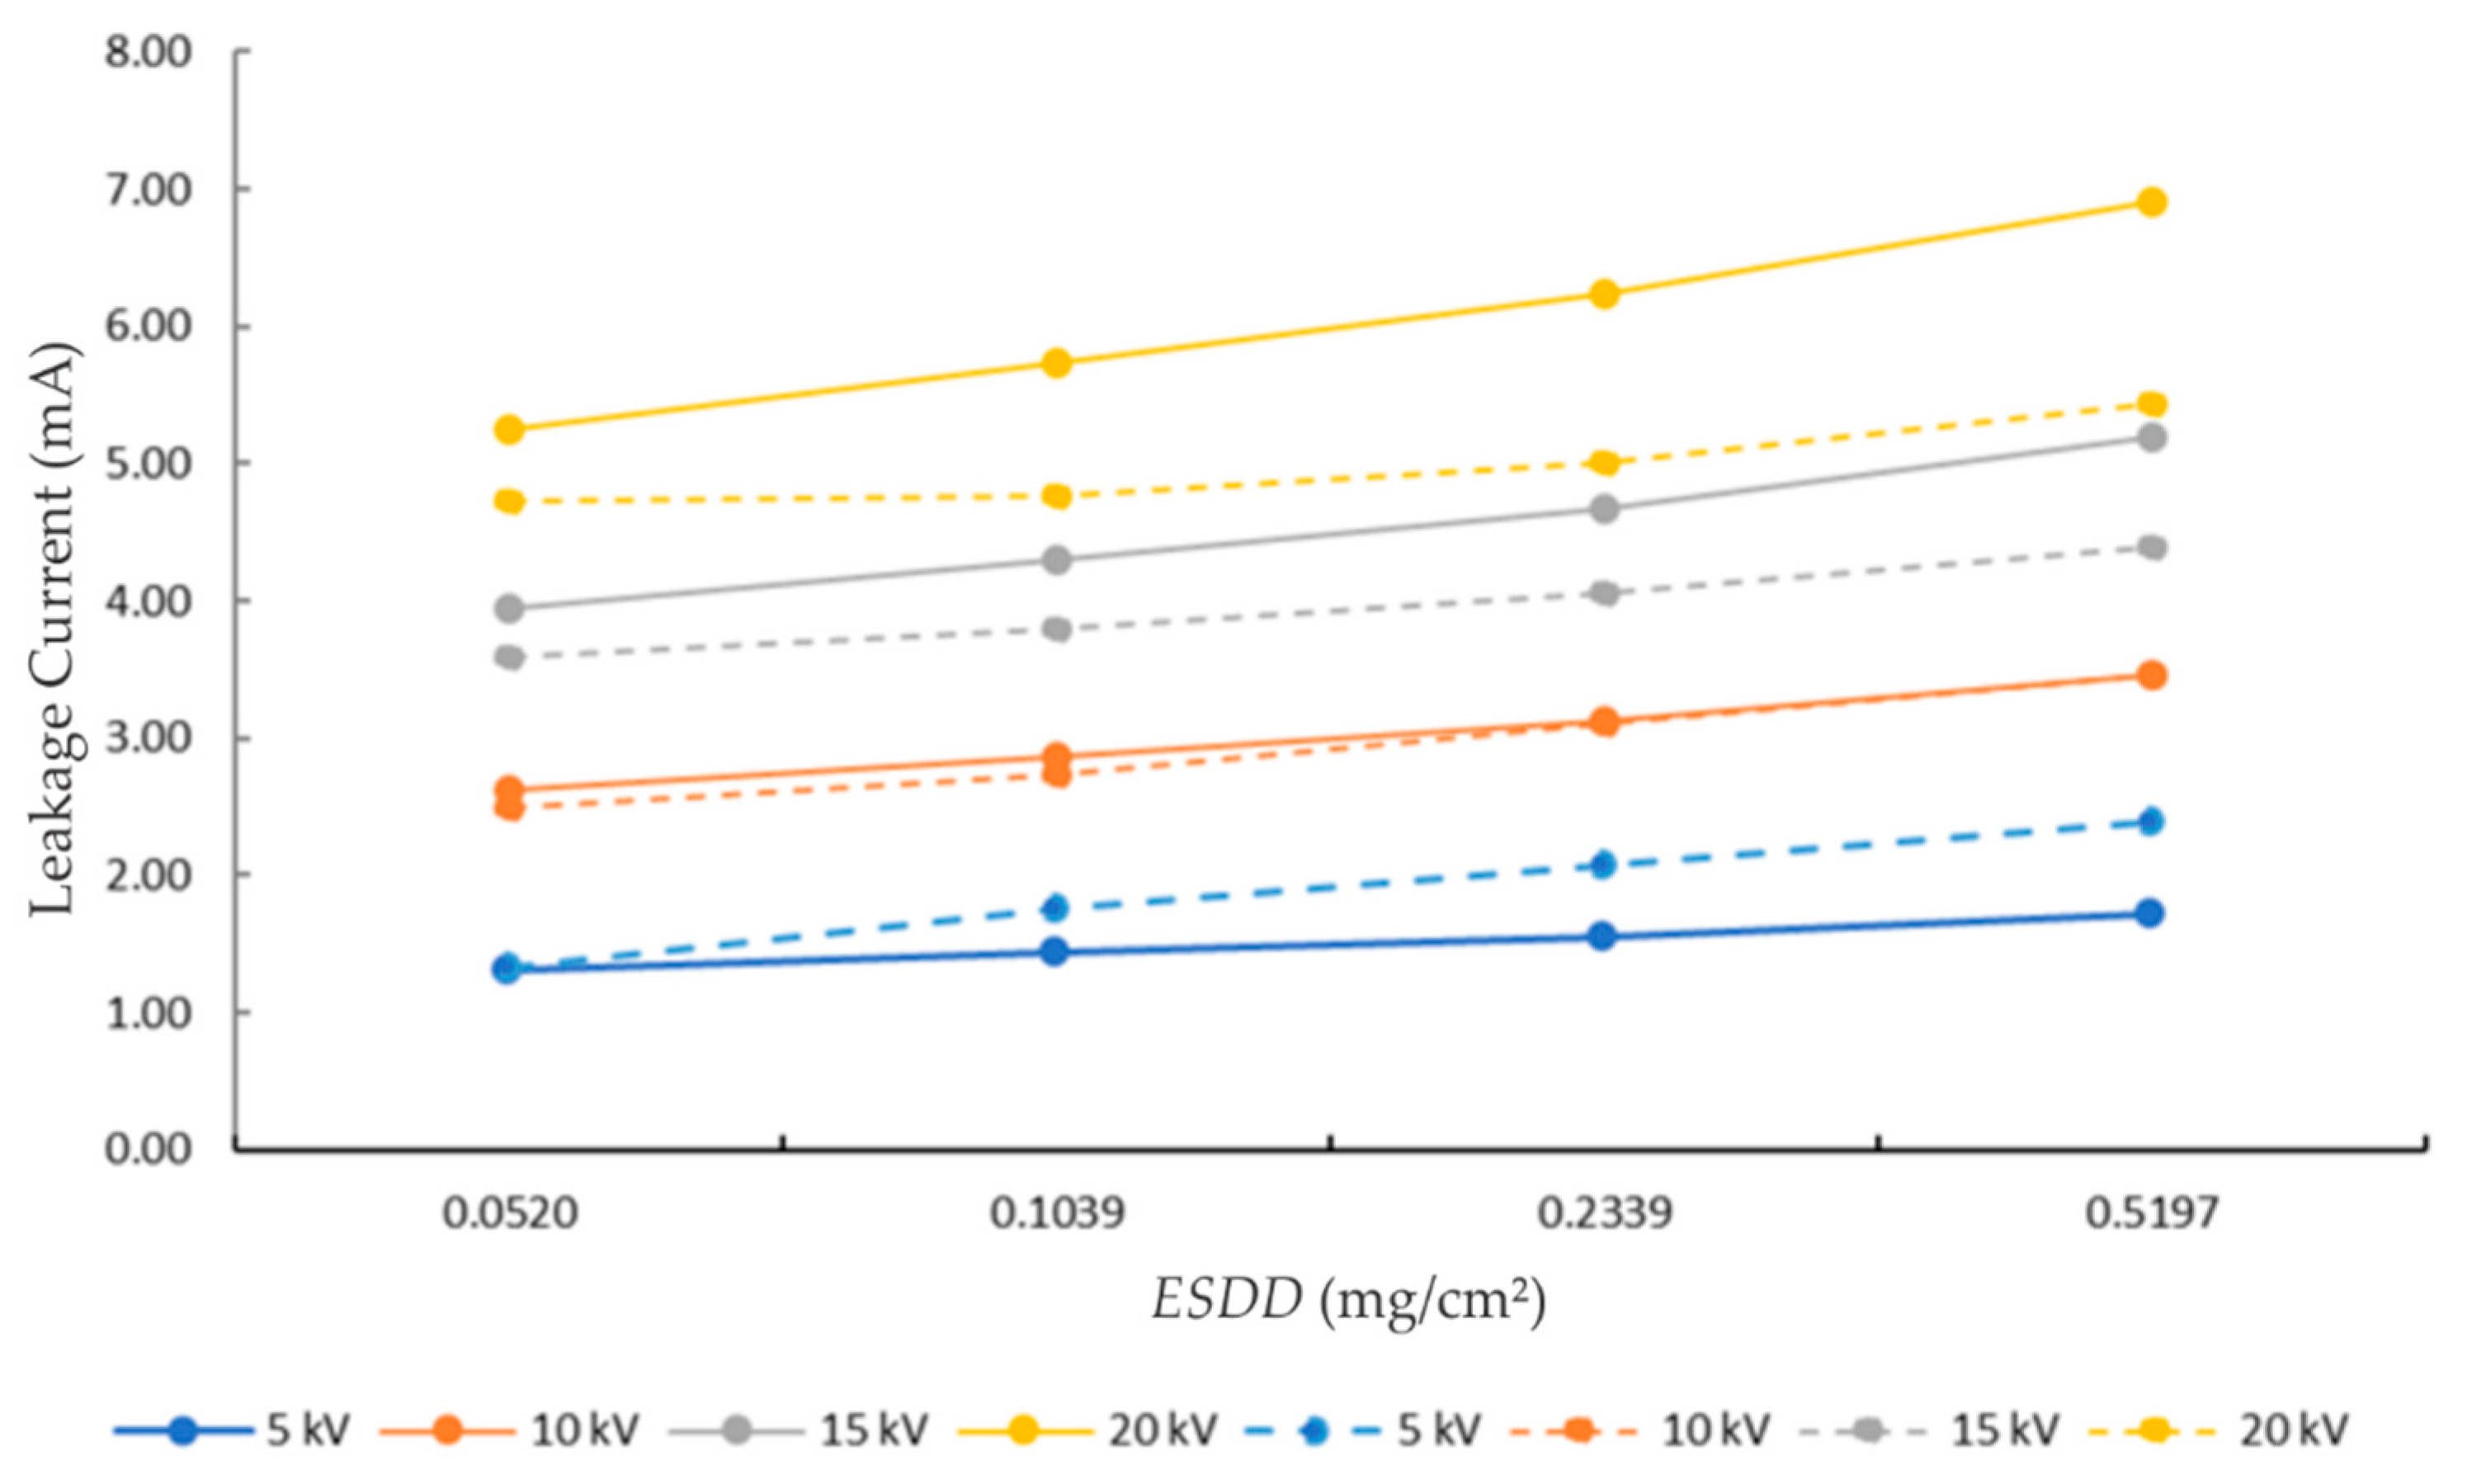
4.3.1. Comparison on Seawater Contaminants

In the leakage current simulation, the variable used was the electrical conductivity of salt contaminants. Moreover, in the variable leakage current test, the salt contaminant ESDD was used. So that the results of the simulation and test leakage currents could be compared, the electrical conductivity test was carried out on each ESDD of salt contaminants. The test method was described in the previous section, and the results of the electrical conductivity test can be seen in Table 4. From the test, it was found that the value of electrical conductivity is a representation of the ESDD value of the contaminant. The comparison of the leakage current from the simulation and test results can be seen in Figure 21. In this figure, the leakage current from the simulation result is represented by a straight line, while a dotted line represents the current from the test result. The figure shows that the leakage current increased in the simulation and test as the ESDD of salt contaminants increased. The difference between the simulation and the test is that in the simulation, the leakage current tended to be higher than the leakage current from the test results. Thus, it can be concluded that the simulation results can represent the polymer insulator leakage current test results.

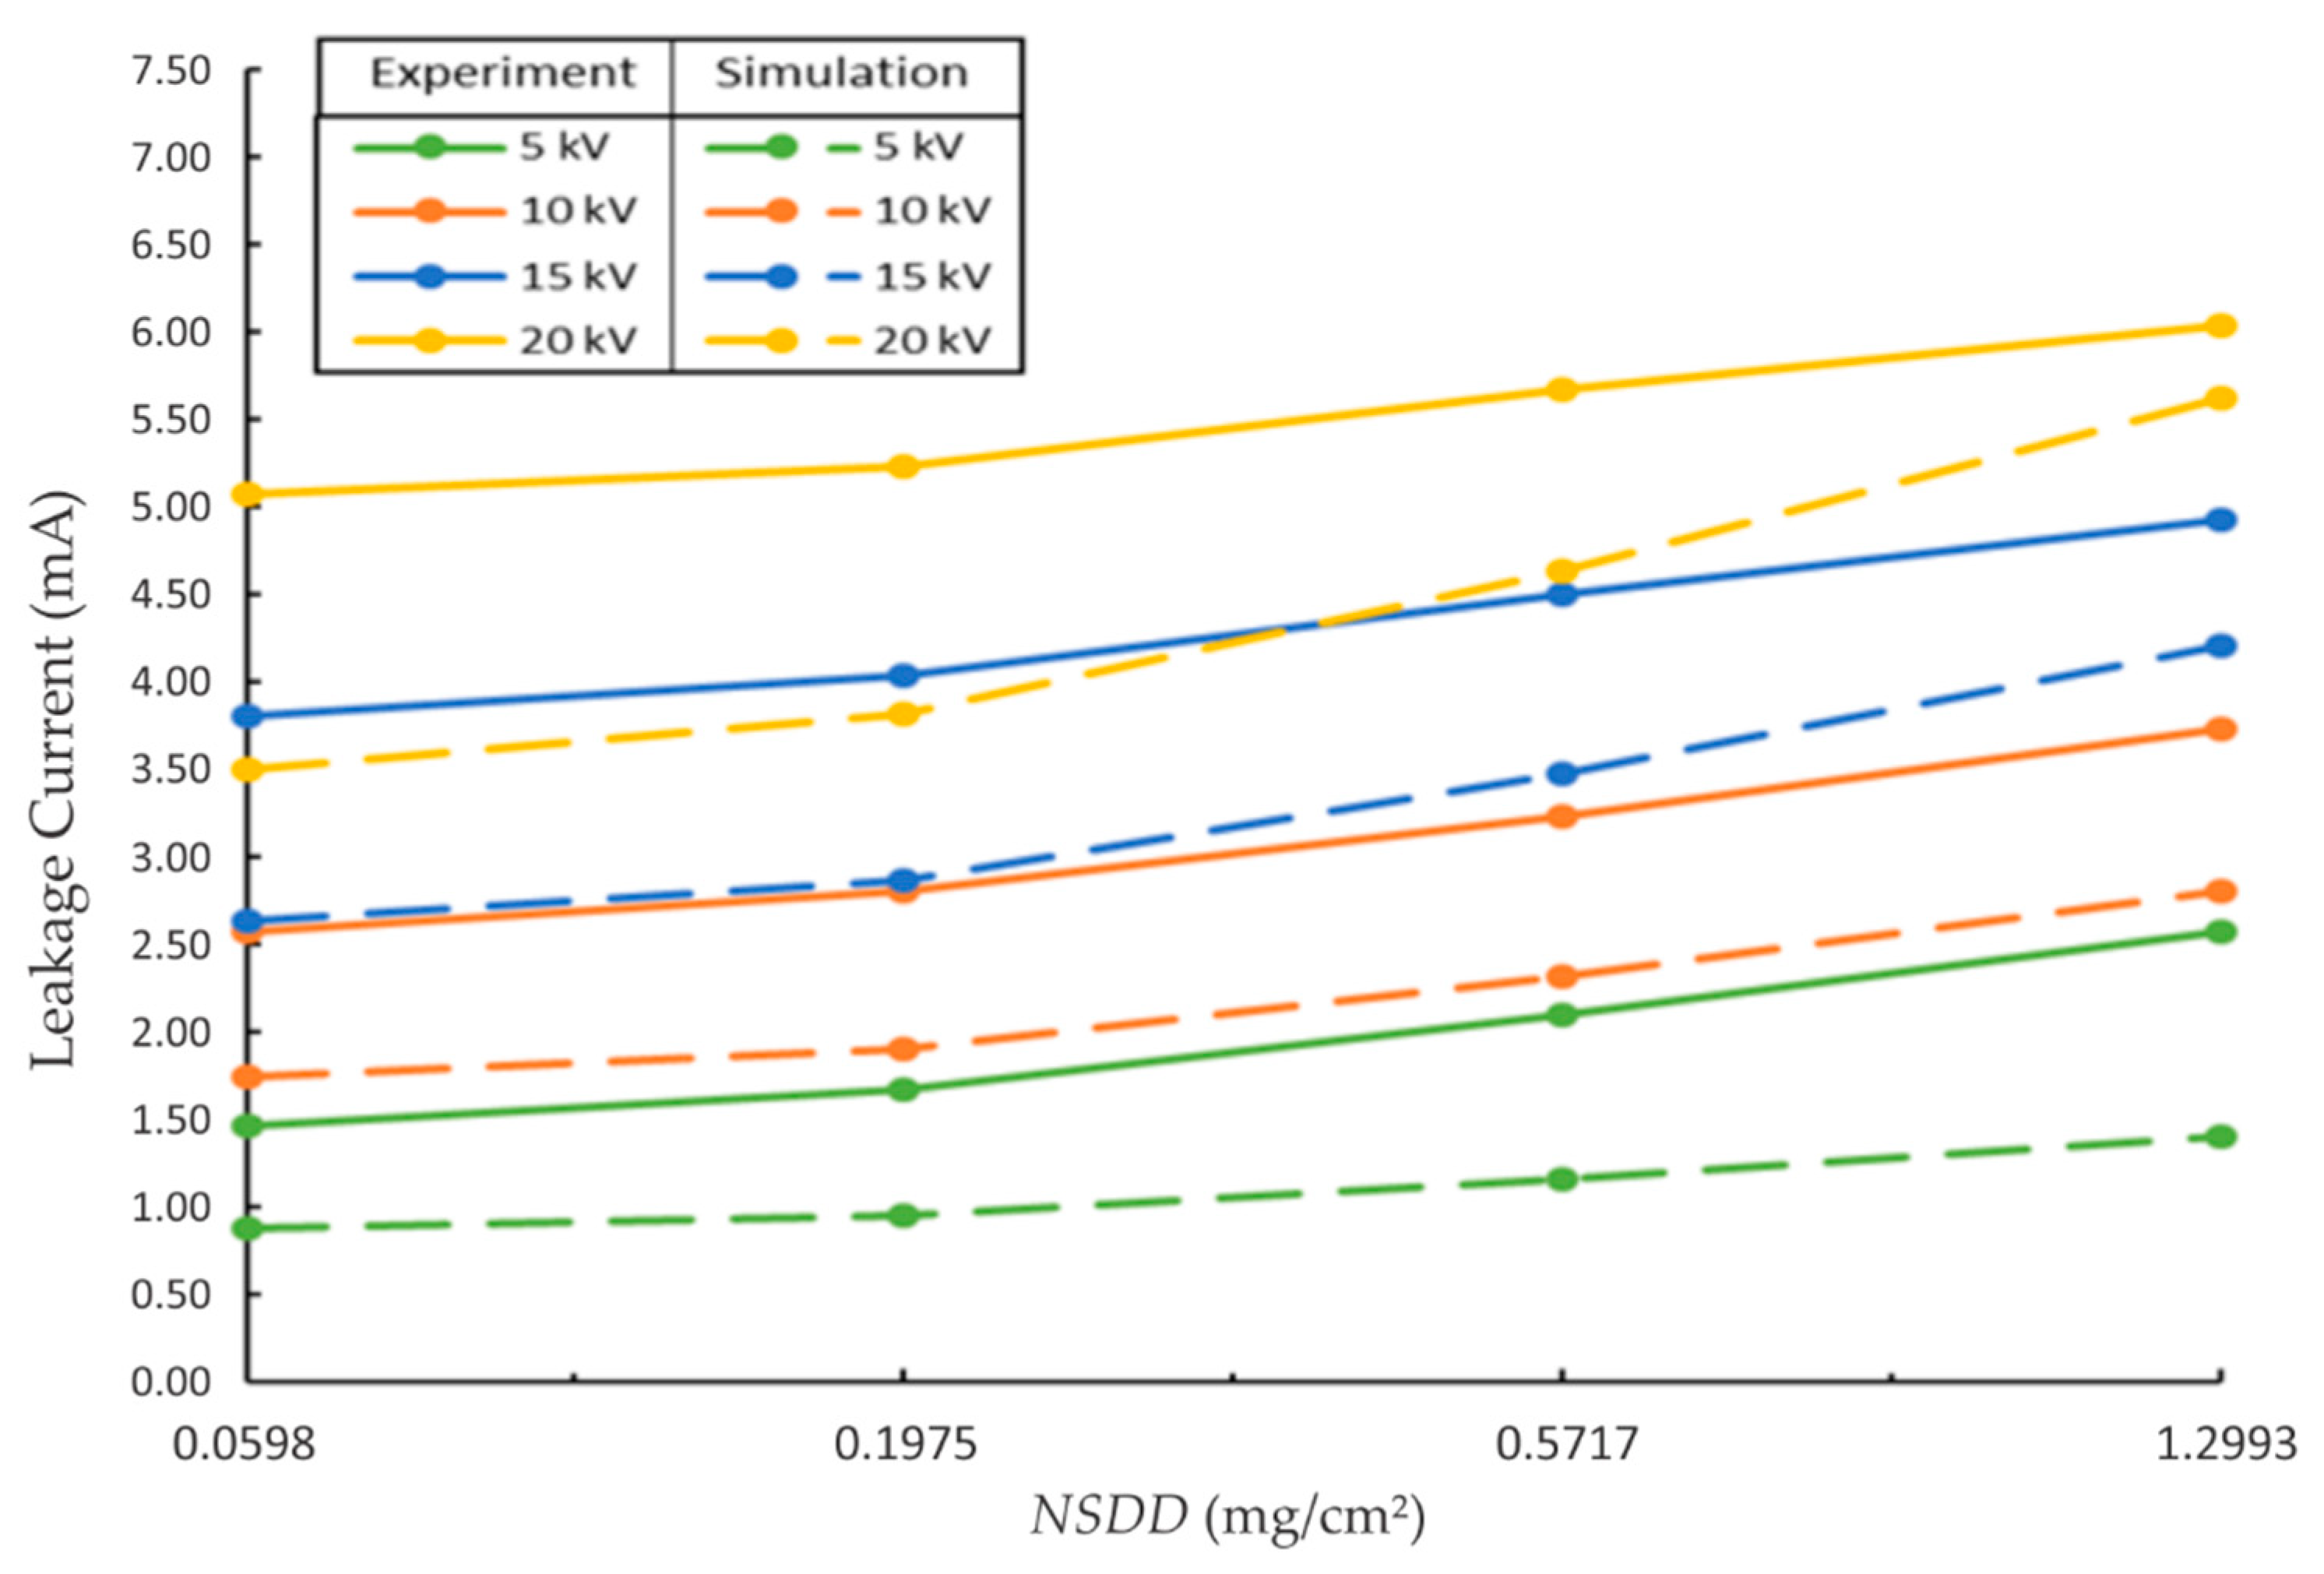
4.3.2. Comparison of Fly Ash Contaminants

The results of the simulation and insulator testing were then compared. The pollutant conductivity value was directly proportional to the fly ash pollutant NSDD. Therefore, to compare the simulation and test results, the pollutant conductivity value in the simulation was converted to NSDD. Figure 22 shows a comparison of the results of the simulation and insulator testing in this study.
Both by simulation and testing, the increase in fly ash pollutant NSDD was accompanied by an increase in insulator leakage current. The higher the fly ash pollution level on the insulator’s surface, the higher the leakage current on the insulator, both for simulation and testing. Although the leakage current value from the simulation results was smaller than the leakage current measured in the test, it can be concluded that the simulation results can represent the results of the tests carried out on polymer insulators because they both show that the higher the level of fly ash pollution on the surface of the insulator, the higher the leakage current.

5. Conclusions

Based on the results of simulations and tests, it can be concluded that the contaminant layer of seawater and fly ash affects the electric field of the insulator surface. The presence of a contaminant layer makes the surface of the insulator have a higher electric field value than without contaminants. Aging insulators have a higher leakage current value because the aging insulator surface is already affected by the weather and mold growth. Thus, the resistance of polymer insulators with aging is reduced due to these factors. The value of the electrical conductivity of the salt and fly ash contaminant layer affects the leakage current value of the insulator surface. The leakage current will increase as the electrical conductivity of the contaminant increases. In wet conditions, the insulator leakage current has a higher value than insulators in dry conditions because water is a conductive compound or can conduct electric current. It can result in a decrease in the dielectric strength of the insulator, which increases the leakage current flowing. The higher the contaminant ESDD value, the higher the value of the leakage current in the insulator because seawater is an electrolyte compound, namely a compound that can conduct electric current, so the higher seawater content in the insulator will increase the surface conductivity, which results in electric current flowing. In addition, the higher the fly ash pollutant NSDD, the higher the fly ash pollutant electrical conductivity. The higher the electrical conductivity of fly ash pollutants, the higher the leakage current that fly ash pollutants can flow. The simulation results of polymer insulators with FEM-based software can represent the insulator test results from measuring the leakage current. This is indicated by evidence that in the simulation and testing, both results show that the higher the level of salt and fly ash pollution on the surface of the polymer insulator, the higher the leakage current measured in the insulator will also be.

Author Contributions

Conceptualization, I.M.Y.N.; methodology, I.G.N.S.H.; software, M.K.W.; validation, D.A.A.; formal analysis, B.K.Y.; investigation, M.K.W.; resources, B.K.Y.; data curation, M.K.W.; writing—original draft preparation, B.K.Y.; writing—review and editing, R.S.; visualization, M.K.W.; supervision, I.M.Y.N.; project administration, D.A.A.; funding acquisition, I.G.N.S.H. All authors have read and agreed to the published version of the manuscript.

Funding

This research was funded by Ministry of Education, Culture, Research, and Technology of Indonesia through grant number 3/E1/KP.PTNBH/2021.

Institutional Review Board Statement

Not applicable.

Informed Consent Statement

Not applicable.

Data Availability Statement

The data are available from the authors.

Conflicts of Interest

The authors declare no conflict of interest.

References

  1. Tobing, B.L. High Voltage Equipment; Erlangga: Jakarta, Indonesia, 2012. [Google Scholar]
  2. Gutman, I.; Dernfalk, A. Pollution tests for polymeric insulators made of hydrophobicity transfer materials. IEEE Trans. Dielectr. Electr. Insul. 2010, 17, 384–393. [Google Scholar] [CrossRef]
  3. Cho, H.G.; Han, S.W.; Lee, U.Y. Multi-Aging Test Technology for Estimating Long Time Performance of Polymer Insulators. In Proceedings of the IEEE International Symposium on Electrical Insulation, Boston, MA, USA, 7–10 April 2002; pp. 232–236. [Google Scholar]
  4. Sinaga, J.J.; Zega, S. Study of the Effect of Air Pollution Contamination on a 20 Kv Medium Voltage Insulator at PT PLN (Persero) Customer Service Implementing Unit (UP3) Medan. J. Teknol. Energy Uda 2020, 9, 31–43. [Google Scholar]
  5. Uydur, C.C.; Arikan, O.; Kalenderli, O. The Effect of Insulation Defects on Electric Field Distribution of Power Cables. In Proceedings of the 2018 IEEE International Conference on High Voltage Engineering and Application (ICHVE), Athens, Greece, 10–13 September 2018; pp. 1–4. [Google Scholar]
  6. Hussain, M.; Mcmeekin, S.; Farzaneh, M.; Farokhi, S. The Effects of Salt Contamination Deposition on HV Insulators Under Environmental Stresses. In Proceedings of the 11th International Conference on the Properties and Applications of Dielectric Materials (ICPADM), Sydney, Australia, 19–22 July 2015. [Google Scholar]
  7. Santosa, D.H. Analysis of the Accelerated Age of Ceramic Insulators in 20 Kv Distribution Channels in Coastal Areas Due to Air Contaminants; Sepuluh Nopember Institute of Technology: Surabaya, Indonesia, 2017. [Google Scholar]
  8. Subekti, S. Analysis of the Proportion of Fly Ash Paiton and Tjiwi Kimia Waste Against Compressive Strength of Geopolymer Paste. In Proceedings of the Prosiding Seminar Nasional Aplikasi Teknologi Prasarana Wilayah (ATPW), Surabaya, Indonesia, 11 July 2012; Available online: https://dokumen.tips/documents/analisa-proporsi-limbah-fly-ash-paiton-dan-tjiwi-kimia.html (accessed on 1 November 2021).
  9. Ilhan, S.; Cherney, E.A. Comparative tests on RTV silicone rubber coated porcelain suspension insulators in a salt-fog chamber. IEEE Trans. Dielectr. Electr. Insul. 2018, 25, 947–953. [Google Scholar] [CrossRef]
  10. Nekahi, A.; McMeekin, S.G.; Farzaneh, M. Effect of pollution severity on electric field distribution along a polymeric insulator. In Proceedings of the 2015 IEEE 11th International Conference on the Properties and Applications of Dielectric Materials (ICPADM), Sydney, NSW, Australia, 19–22 July 2015; pp. 612–615. [Google Scholar]
  11. Khare, T.; Hasabe, R.; Mandlik, M. Electric Field and Potential Distribution along Porcelain Insulator under Polluted Conditions using Finite Element Method. Int. J. Adv. Res. Electr. Electron. Instrum. Eng. 2016, 5, 3531–3536. [Google Scholar]
  12. Othman, N.A.; Piah, M.A.M.; Adzis, Z.; Ahmad, H.; Ahmad, N.A. Simulation of voltage and electric-field distribution for contaminated glass insulator. In Proceedings of the 2013 IEEE Student Conference on Research and Development, Putrajaya, Malaysia, 16–17 December 2013; pp. 116–120. [Google Scholar]
  13. Gustavsson, T.G.; Gubanski, S.M.; Hillborg, H.; Karlsson, S.; Gedde, U.W. Aging of silicone rubber under ac or dc voltages in a coastal environment. IEEE Trans. Dielectr. Electr. Insul. 2001, 8, 1029–1039. [Google Scholar] [CrossRef]
  14. Fahmi, D.; Negara, I.M.Y.; Asfani, D.A.; Afif, Y. Electric Field Distribution Analysis on Hanging Insulator Types of Polymers due to the Effect of Contaminants. Natl. J. Electr. Eng. 2015, 4. [Google Scholar] [CrossRef] [Green Version]
  15. Yu, Z.; Peng, Z.; Liu, P.; Wu, X. The influence of charged sand particles on the external insulation performance of composite insulators in sandstorm condition. In Proceedings of the 2006 IEEE 8th International Conference on Properties & Applications of Dielectric Materials, Bali, Indonesia, 26–30 June 2006; pp. 542–545. [Google Scholar]
  16. Sunitha, N.S.; Ravi, K.N.; Prakash, R. A study on leakage current characteristics of polymeric insulators for different pollution layers. In Proceedings of the 2015 International Conference on Power and Advanced Control Engineering (ICPACE), Bengaluru, India, 12–14 August 2015; pp. 383–387. [Google Scholar]
  17. Dhofir, M.; Andaru, D.D.; Hasanah, R.N. The influence of conduction band location on the leakage current level of a glass insulator. In Proceedings of the 2017 5th International Conference on Electrical, Electronics and Information Engineering (ICEEIE), Malang, Indonesia, 6–8 October 2017; pp. 25–31. [Google Scholar]
  18. Hussain, M.M.; Farokhi, S.; McMeekin, S.G.; Farzaneh, M. Effect of cold fog on leakage current characteristics of polluted insulators. In Proceedings of the 2015 International Conference on Condition Assessment Techniques in Electrical Systems (CATCON), Bangalore, India, 10–12 December 2015; pp. 163–167. [Google Scholar]
  19. El-Hag, A.H. Promoting condition monitoring and diagnostics of electrical insulation in undergraduate capstone graduation projects. IEEE Electr. Insul. Mag. 2015, 31, 8–15. [Google Scholar] [CrossRef]
  20. Muniraj, C.; Chandrasekar, S. Finite Element Modeling for Electric Field and Voltage Distribution along the Polluted Polymeric Insulator. World J. Modeling Simul. 2012, 8, 310–320. [Google Scholar]
  21. Bojovschi, A.; Quoc, T.V.; Trung, H.N.; Quang, D.T.; Le, T.C. Environmental Effects on HV Dielectric Materials and Related Sensing Technologies. Appl. Sci. 2019, 9, 856. [Google Scholar] [CrossRef] [Green Version]
  22. Akbar, M.; Ullah, R.; Alam, S. Aging of Silicone Rubber-based Composite Insulators under Multi-stressed Conditions. Mater. Res. Express 2019, 6, 102003. [Google Scholar] [CrossRef]
  23. Gorur, R.S.; Montesinos, J.; Roberson, R.; Burnham, J.; Hill, R. Mold growth on nonceramic insulators and its impact on electrical performance. IEEE Trans. Power Deliv. 2003, 18, 559–563. [Google Scholar] [CrossRef]
  24. Ghosh, D.; Khastgir, D. Degradation and Stability of Polymeric High-Voltage Insulators and Prediction of Their Service Life through Environmental and Accelerated Aging Processes. ACS Omega 2018, 3, 11317–11330. [Google Scholar] [CrossRef] [PubMed]
  25. Wang, J.; Gubanski, S.M.; Blennow, J.; Atarijabarzadeh, S.; Stromberg, E.; Karlsson, S. Influence of biofilm contamination on electrical performance of silicone rubber based composite materials. IEEE Trans. Dielectr. Electr. Insul. 2012, 19, 1690–1699. [Google Scholar] [CrossRef]
Figure 1. Polymer insulator design (a) without pollutant and (b) with pollutant.
Energies 14 08581 g001
Figure 2. The insulator triangle element (a) without pollutant and (b) with pollutant.
Energies 14 08581 g002
Figure 3. Calculation of insulator area.
Energies 14 08581 g003
Figure 4. (a) Insulator before aging, and (b) insulator after aging.
Energies 14 08581 g004
Figure 5. Schematic of insulator leakage current test.
Energies 14 08581 g005
Figure 6. Insulator test circuit.
Energies 14 08581 g006
Figure 7. Insulators are subjected to salt pollutants in (a) dry and (b) wet conditions.
Energies 14 08581 g007
Figure 8. Insulators given fly ash pollutant in (a) dry and (b) wet conditions.
Energies 14 08581 g008
Figure 9. Terminal voltage of 20 kV on insulator model.
Energies 14 08581 g009
Figure 10. Ground on insulator model.
Energies 14 08581 g010
Figure 11. Voltage distribution in polymer insulators.
Energies 14 08581 g011
Figure 12. Selection of boundary isolators for line graph analysis.
Energies 14 08581 g012
Figure 13. Voltage distribution comparison with and without contaminant.
Energies 14 08581 g013
Figure 14. Distribution of electric field on insulator (a) without contaminant, (b) with salt contaminant, and (c) with fly ash contaminant.
Energies 14 08581 g014
Figure 15. Current density of insulator with (a) salt contaminant with electrical conductivity of 3.46 × 10⁻⁴ S/m, and (b) fly ash contaminant with electrical conductivity of 2.81 × 10⁻⁴ S/m.
Energies 14 08581 g015
Figure 16. Effect of conductivity on leakage current on the surface of the insulator: (a) salt contaminants, and (b) fly ash contaminants.
Energies 14 08581 g016
Figure 17. Comparison of leakage current in unaged insulators and insulators with aging (a) salt contaminants and (b) fly ash contaminants.
Energies 14 08581 g017
Figure 18. Comparison of dry insulator leakage current with wet insulator (a) salt contaminants and (b) fly ash contaminants.
Energies 14 08581 g018
Figure 19. Effect of changes in voltage on leakage current in insulator polymer with (a) salt contaminant and (b) fly ash contaminant.
Energies 14 08581 g019aEnergies 14 08581 g019b
Figure 20. Effect of ESDD and NSDD variations on insulator leakage current with (a) salt contaminant and (b) fly ash contaminant.
Energies 14 08581 g020
Figure 21. Comparison of simulated leakage currents with tests on salt contaminants.
Energies 14 08581 g021
Figure 22. Comparison of the leakage current from the simulation results with the test on fly ash.
Energies 14 08581 g022
Table 1. Pollution levels based on IEC 815.
Pollution LevelESDD (mg/cm2)NSDD (mg/cm2)
Light<0.060.03–0.06
Currently0.06–0.120.10–0.20
Heavy0.12–0.240.30–0.60
Very heavy>0.24>0.80
Table 2. Simulation material parameters.
MaterialRelative Permittivity rElectrical Conductivity (S/m)
Polymer4.31 × 10−13
Air11 × 10−14
Steel15.9 × 107
Aluminum2.23.69 × 107
Salt contaminants80Varies
Fly ash104Varies
Table 3. Determination of salination, ESDD, and salt conductivity.
Salination (g/L)ESDD (mg/cm2)Electrical Conductivity (S/m)Information
20.05202.64 × 10−4Light
40.10392.87 × 10−4Currently
90.23393.12 × 10−4Heavy
200.519973.46 × 10−4Very heavy
Table 4. Determination of mass, NSDD, and conductivity of fly ash.
Pollutant Mass (mg)NSDD (mg/cm2)Electrical Conductivity (S/m)Pollution Level
1150.05981.75 × 10−4Light
3800.19751.91 × 104Currently
11000.57172.32 × 10−4Heavy
25001.29932.81 × 10−4Very heavy
Publisher’s Note: MDPI stays neutral with regard to jurisdictional claims in published maps and institutional affiliations.

