1. Introduction
Urban sprawl is a spatial phenomenon observed in the urban areas of many countries, both industrialised and developing [
1,
2,
3]. Urban sprawl relates to the process of deconcentrating land use in the areas surrounding cities as a result of the impact of cities [
4,
5]. The effects of this process are as follows [
6,
7,
8]: chaotic dispersion of buildings, low population density rates, the lack of spatial continuity of built areas, and the dependence of communities and businesses on road and railway transport. The issue of the negative impact of this phenomenon was addressed in the 1960s [
9,
10]. On the other hand, the results of many contemporary research studies point to the possible positive economic effects of urban sprawl [
11,
12,
13]. The problem of urban sprawl has also been discussed in Poland [
14,
15,
16]. In addition, attention has been given to differences in the impact of urban sprawl in Poland and other countries. In Poland, it mainly relates to the location of built areas in the municipalities that surround core cities and not in cities themselves [
17,
18,
19]. In China, the phenomenon is usually recorded in cities due to the fact that their administrative areas are much larger than their actual built areas [
20,
21]. In the USA, is it sometimes mistakenly identified with suburbanization [
22], one of the spatial development strategies for large cities and their housing policies [
23]. From the perspective of a settlement system, urban sprawl in Poland is characterised by the exuberant and unplanned development of residential areas, and it is usually regarded as a negative phenomenon [
16,
24,
25].
Land development can have a negative impact on the existing technical and social infrastructure. Another issue is an increase in the costs of satisfying the needs of technical infrastructure [
26]. Problems arise on the border between private property and public goods [
27]. Independently of systemic solutions in spatial policies, externalities have an impact on market systems. They affect multi-level spatial structures and multi-dimensional social relations. They are caused by a number of factors, but the original driver of this process is the unavoidable presence, universality, and multiplier effects of positive and negative externalities. These effects relate to social costs and various implications for public policies, including energy policies. The social, universal, and unquestionably negative effect is the impact of externality generators on public goods, because public entities tend to claim compensation to a larger degree than private organizations [
28,
29].
The reorganization of land use and the increasing complexity of the structure of factors related to functional systems are accompanied by general changes in the existing spatial systems. Economic and political factors resulting from implemented spatial policies are affected by legal and administrative solutions [
30]. In addition, they are influenced by institutional conditions. Their impact on spatial structures can be identified with the effects on the efficiency of social spatial management activities. In simple terms, it can be assumed that spaces that are planned and organized in an optimal way are under a dominant impact of the positive externalities of implemented spatial, socioeconomic, and energy policies. They are permanently linked to the urban sprawl process and changes related to spatial conditions, referred to as urbanization, suburbanization, and metropolization [
31]. In addition to that, we observe negative and positive feedbacks generated within the framework of spatial and socioeconomic governance. Therefore, spatial governance can be a useful tool in a synthetic evaluation of economic, environmental, and social governance. It is also strongly correlated with the commonly occurring externalities. The urban sprawl process leads to considerable losses (benefits) in the natural and economic environment. It is assumed that spatial losses are reduced (incurred) losses or not achieved social benefits (lost opportunities) related to the use of resources and spaces. The externalities of urban sprawl represent a significant part of externalities generated as a result of satisfying socioeconomic needs in a given space. The evaluation of these effects depends on individual marginal utility, in which individual benefits do not always generate positive social externalities. On the other hand, positive externalities at the level of an entire community can generate negative externalities for individual users [
32].
2. Literature Review
Urban sprawl is generally viewed as a negative phenomenon due to the costs it generates. However, its effects can also be positive. Debates over urban sprawl give little attention to possible benefits that, due to much criticism of related costs, are marginalised [
17]. These benefits are as follows [
11,
33,
34,
35,
36,
37,
38,
39,
40,
41,
42]: increased productivity of regional economies, lower unemployment rates, availability of housing, proximity of workstations, and improvements in the quality of life. Literatures identify social, environmental, and economic costs generated by urban sprawl processes.
Social costs are as follows [
43]: reliance of inhabitants on vehicle transport and a negative impact on public health. These social costs are interdependent, so their impact is greater. The frequent use of cars by the inhabitants of suburbs reduces their physical activity, adversely affecting their physical fitness. Research studies of the impact of urban sprawl on physical health identify such effects as [
43,
44,
45] asthma, type 2 diabetes, cardiovascular diseases (hypertension), arthritis, rheumatism, breathing, movement and neurological disorders, chronic migraines, spine disorders, and cancers. Some studies suggest correlations between urban sprawl and obesity [
43,
46] as well as mental health [
47].
Research studies give more attention to environmental effects [
33,
39,
43,
48,
49,
50,
51,
52,
53,
54,
55,
56]: low air quality, higher temperatures, natural and agricultural losses (reduced agricultural output, reductions in natural facilities, threats to agriculture-related activities), a negative impact on the ecosystem (a decrease in wooded and farmland areas as well as open spaces), and hydrology-related costs (low groundwater level, flooding, and deteriorating quality of drinking water).
So far, the use of solar energy has not been analysed in the context of the environmental effects of urban sprawl. Renewable sources of energy can reduce the above costs in such areas as low air quality and higher temperatures. Air pollution resulting from urban sprawl relates to the previously mentioned dependence on automobiles, higher fuel consumption, and, consequently, higher emissions [
48,
49,
50].
The extensive growth of cities, increasing the use of automobiles, is a source of such pollution as carbon monoxide, ozone, sulphur dioxide, nitrogen oxides, and particulate matter. Pollution hinders the growth of plants, creates smog and acid rain, contributing to higher temperatures in suburban areas [
51]. This is a heat island effect, an area with temperatures that are 3.5–4.5 °C higher than in the surrounding terrain [
50]. Along with urban sprawl, heat islands spread along built areas and roads [
43]. Simultaneously, higher temperatures in urban sprawl areas have an indirect impact on air pollution; rising temperatures increase demand for electricity in connection with air-conditioning systems. Because a large number of power plants use fossil fuels, increased energy generation contributes to emissions [
33], hence the use of solar energy not only in household air-conditioning units but also in charging electric and hybrid vehicles.
Most attention in exploring the effects of urban sprawl has been traditionally given to the economic impact of this phenomenon. Analyses of the costs of urban sprawl were undertaken in the first half of the 20th century [
9,
10,
35,
39,
57,
58,
59,
60,
61,
62,
63]. The major economic costs include the following [
33,
44,
64,
65,
66,
67,
68]: excessive public spending on infrastructure servicing and public services, a negative impact on household budgets, a negative market impact on city centres, and reduced energy efficiency.
Solar energy can be seen as a remedy for the environmental and economic costs of urban sprawl, particularly in periods of the inefficient use of energy. In the context of analysing urban sprawl, the inefficient use of energy relates to two categories of losses. The first one is the excessive use of fuel by automobiles (previously mentioned in connection with environmental costs). The second group of losses relates to the increased costs of electricity transmission. With regard to the latter case, analyses stress the fact that the lower density and dispersion of buildings in suburban areas increase the length of transmission lines, the costs of construction works, and the maintenance of energy transmission networks [
44]. Apart from that, other costs are incurred as a result of the losses of energy transmitted to consumers. Energy losses are proportional to transmission distances [
33]. Household solar installations can reduce transmission losses.
Climate change has been a debated issue for several decades, but the intensity of research on global warming has gained significant momentum over the past 20 years. The alarming information about the increasing average global temperature, as well as about extreme weather events, rising sea and ocean levels, and melting glaciers has been being reported, among others, by the Intergovernmental Panel on Climate Change (IPCC) established at the request of the United Nations with the involvement of the World Meteorological Organization (WMO) and the United Nations Environment Programme (UNEP). Global warming is one of the greatest challenges of the 21st century because it can lead to a variety of consequences for the natural environment and further cause serious socio-economic and political consequences. An example of an international strategy to limit carbon dioxide emissions is the Kyoto Protocol to the United Nations Framework Convention on Climate Change adopted on 11 December 1997. The carbon market created in 2005 allows for the enforcement of the social costs of unwanted emissions. Europe is being subjected to various processes negatively affecting climate, biodiversity, natural resources, etc. The problem of limiting global warming and balancing sustainability is the subject of various policies enshrined, among others, in the Territorial Agenda 2030, the Agenda 2030 Sustainable Development Goals, the New Leipzig Charter, the Urban Agenda for the EU, the European Green Deal, and the European Climate Pact.
Various studies draw attention to the art of compromise as a result of widely understood limitations and sacrifices of today’s users of space for the benefit of future generations. Further questions arise as to whether currently proposed constraints are socially beneficial, whether it is worth sacrificing consumption to combat global warming, how to establish intergenerational equity, and whether we have finally identified the scale of potential threats to humanity [
69,
70,
71,
72].
The economics of global warming has received a lot of attention in research studies. Assuming that climate change is a negative phenomenon, limiting these negative externalities can provide benefits for current and future generations. Reduced (lost) consumption today may become a kind of investment and ensure less environmental damage in the future, but with one caveat. Authorities must be concerned about reducing negative externalities, and therefore it becomes necessary to implement effective instruments that mitigate climate change and to spread information about the effects of global warming [
73]. In seeking an optimal solution serving the needs of local communities, we should bear in mind that it is not possible to eliminate all costs and effects of spatial management activities. Our main objective is to mitigate the impact of negative externalities. Spatial management, regardless of implemented planning systems and policies based on various standards, generates externalities. According to definitions, externalities are generated when an entity creates costs or benefits for other individuals who do not have economic incentives to accept them [
74]. In other words, externalities occur when an individual’s actions have an impact on a third party who does not pay for it or does not receive any compensation [
28]. Usually, an entity’s economic activity or consumption has an indirect impact on the economic effectiveness, consumption, or utility of other entities that do not have significant relationships with this entity [
75]. In this situation, positive and negative externalities occur as a result of consumption processes (e.g., the use of energy by households and the industrial or service sector), or during the production process itself (including spatial management processes).
A crucial role is played by the complexity of this process, enhanced by the diversity of factors that generate a given externality. In addition to that, market deficiencies, which usually manifest themselves during spatial management processes (e.g., inappropriately defined ownership rights or economically unjustified resource allocations), can lead to multidimensional effects (externalities), affecting large groups of land users. A decisive factor is a type and intensity of externalities in such areas as spatial planning and policy, real estate management, natural, environmental and agricultural conditions, and technical infrastructure. Generated externalities affect spatial management systems, individuals, and society at large.
Because externalities are commonly regarded (a simplified approach) to be the effects of actions of individual entities, changing the level of utility of other space users, it will be necessary to present a reliable identification of parties to the exchange process, which initiates a transaction. Our analysis should consider both immediate and more distant recipients of generated externalities. Distant recipients include individuals or groups of individuals, e.g., the inhabitants of a housing estate, neighbours, and all those affected by externalities. The effects of the process are costs and benefits resulting from actions in a given space under spatial management programmes, performed by a specific entity. When identifying externalities, we must first confirm the existence of expected costs or benefits. Undoubtedly, it is a difficult task because we do not always have sufficient knowledge about potential benefits or threats. Externalities are recognizable when we start to identify them, e.g., when we evaluate relationships between affected and generating entities (a manufacturing entity, local communities, users, etc.). In addition, attention should be given to our evaluations, which are not always unbiased. It results from the existing interactions in space to which we are simply accustomed and which, as such, do not attract our attention [
76,
77].
A precise attribution of costs and benefits to society at large, even at a local level, can be very difficult or not feasible [
78,
79]. We should also consider how local conditions are optimised in the context of local societies’ behaviours after the occurrence and reception of externalities.
In the context of these considerations, a significant role is played by the phenomenon of the movement of externalities, particularly with regard to positive externalities. This problem has been analysed in a number of studies on economic growth [
80,
81]. The observed availability of benefits encourages users to remain in this state of affairs and invites (attracts) new users despite high costs. Moreover, the identified geographical proximity increases the dispersion of externalities, especially in the context of positive externalities, contributing to the development of a given spatial entity. The literature on the subject stresses the significance of introducing improvements in an entity for the benefit of other users. For example, an entity’s technological externalities increase the productivity of other entities without any compensation [
82]. Therefore, the process of identifying externalities can be supported by the evaluations of individuals not related to the generation of externalities.
Spatial monocultures generate more negative externalities than diversified spaces [
83,
84,
85]. However, this issue seems to be less significant in the context of the possible use of solar energy in areas affected by urban sprawl. There is no clear and unequivocal need for locating entities representing various sectors in a given space. It can be assumed that negative externalities generated by spatial monocultures will be counterbalanced (but not fully) by externalities resulting from solar energy generated by these monocultures. This process will be accompanied by urbanization- and localization-related externalities. They will be more strongly correlated with the issue of localization rather than spatial growth, and a clear identification of their occurrence is a complex process.
It is assumed that an externality derives from various actions and all entities generating externalities contribute to creating costs. Another issue is the establishment of ownership rights. The recipients of externalities always face the problem of determining the price of a single externality. The problem arises of establishing principles and conditions for externality market trading.
Spatial management and real estate management are also related to ecological and environmental externalities, as well as aesthetic and proximity externalities [
86]. Transaction costs resulting from operations generating real estate costs, documentation costs, etc., are inherent in spatial management processes. Ordinary space users are not aware of such costs or regard them as a less important aspect of transactions. The reactions of real estate market participants, and various planning processes which accompany transaction costs, are linked to the internalization of spatial management externalities. Transaction costs are affected by social, economic, natural, and cultural factors, and spatial management externalities are additionally correlated with planning procedures. Implemented spatial policies based on relevant plans advises space users on the profitability of their actions. Documents establishing local laws or determining spatial policies allow for anticipating possible externalities resulting from investment projects (for example, expected energy efficiency of buildings, interdependencies of different investment projects or their impact on climate, landscape, etc.). In the spatial management process, space can be treated as an anthropogenic source of externalities. The implementation of spatial policies adjusted to local conditions is likely to reduce external costs generated by users [
32,
87].
The urban sprawl process comprises interactions that lead to degrading fundamental natural goods. The transformation of space as a result of various forms of land use and land management frequently results in irrevocable changes in its components. Usually, such changes have a negative impact on the quality of human life. Ecological, natural, environmental, and agricultural externalities, apart from most space-related externalities (including urban sprawl and real estate management), have long-lasting impacts. Obviously, we are aware of externalities that lose their original significance at the moment of completing execution of a given process, e.g., construction works. External costs are incurred during the manufacture of building materials and then in the course of construction works (CO2 emissions, the use of natural resources or electricity). In connection with the above and in light of the presented considerations, it should be noted that the first stage of identifying technical structure externalities should focus on determining the size and character of a generating entity’s impact on affected parties. This process is very difficult due to the delayed occurrence of externalities. Delays are sometimes very long; an entity stops generating externalities, while effects (also benefits) are observed by affected entities after a certain lapse of time. Moreover, if we treat identifying recipients as a process, we should first identify a group of the potential recipients of externalities and only then indicate the external costs/benefits of technical infrastructure.
Because published literatures have reported that solar energy generation does not generally pollute the environment (except for the manufacture and recycling of solar panels for energy collection along with appropriate installations), it is considered to be a source of clean energy. The only currently recorded deficiency of solar energy collection is its low efficiency of energy collecting devices. Currently available PV modules are between 15% to 20% efficient, and the most technologically advanced are up to 26% efficient [
88]. A relatively low efficiency affects the surface of energy generating panels. Satisfactory power of PV installations for individual purposes (prosumer) requires a surface of one to several dozen square meters.
To maximise the use of available space in buildings, users most frequently mount panels on roofs. Roofs have a very important feature required for the efficient work of installations; they are often the least shaded places. In addition, the shape of roofs reduces mounting costs because panels installed on roofs do not require structural support. Buildings in urban sprawl areas are dispersed, and if not covered with trees provide a perfect location for installing panels. It is estimated [
89] that 25% of energy consumed in the EU could be generated by individual installations mounted on the roofs of buildings.
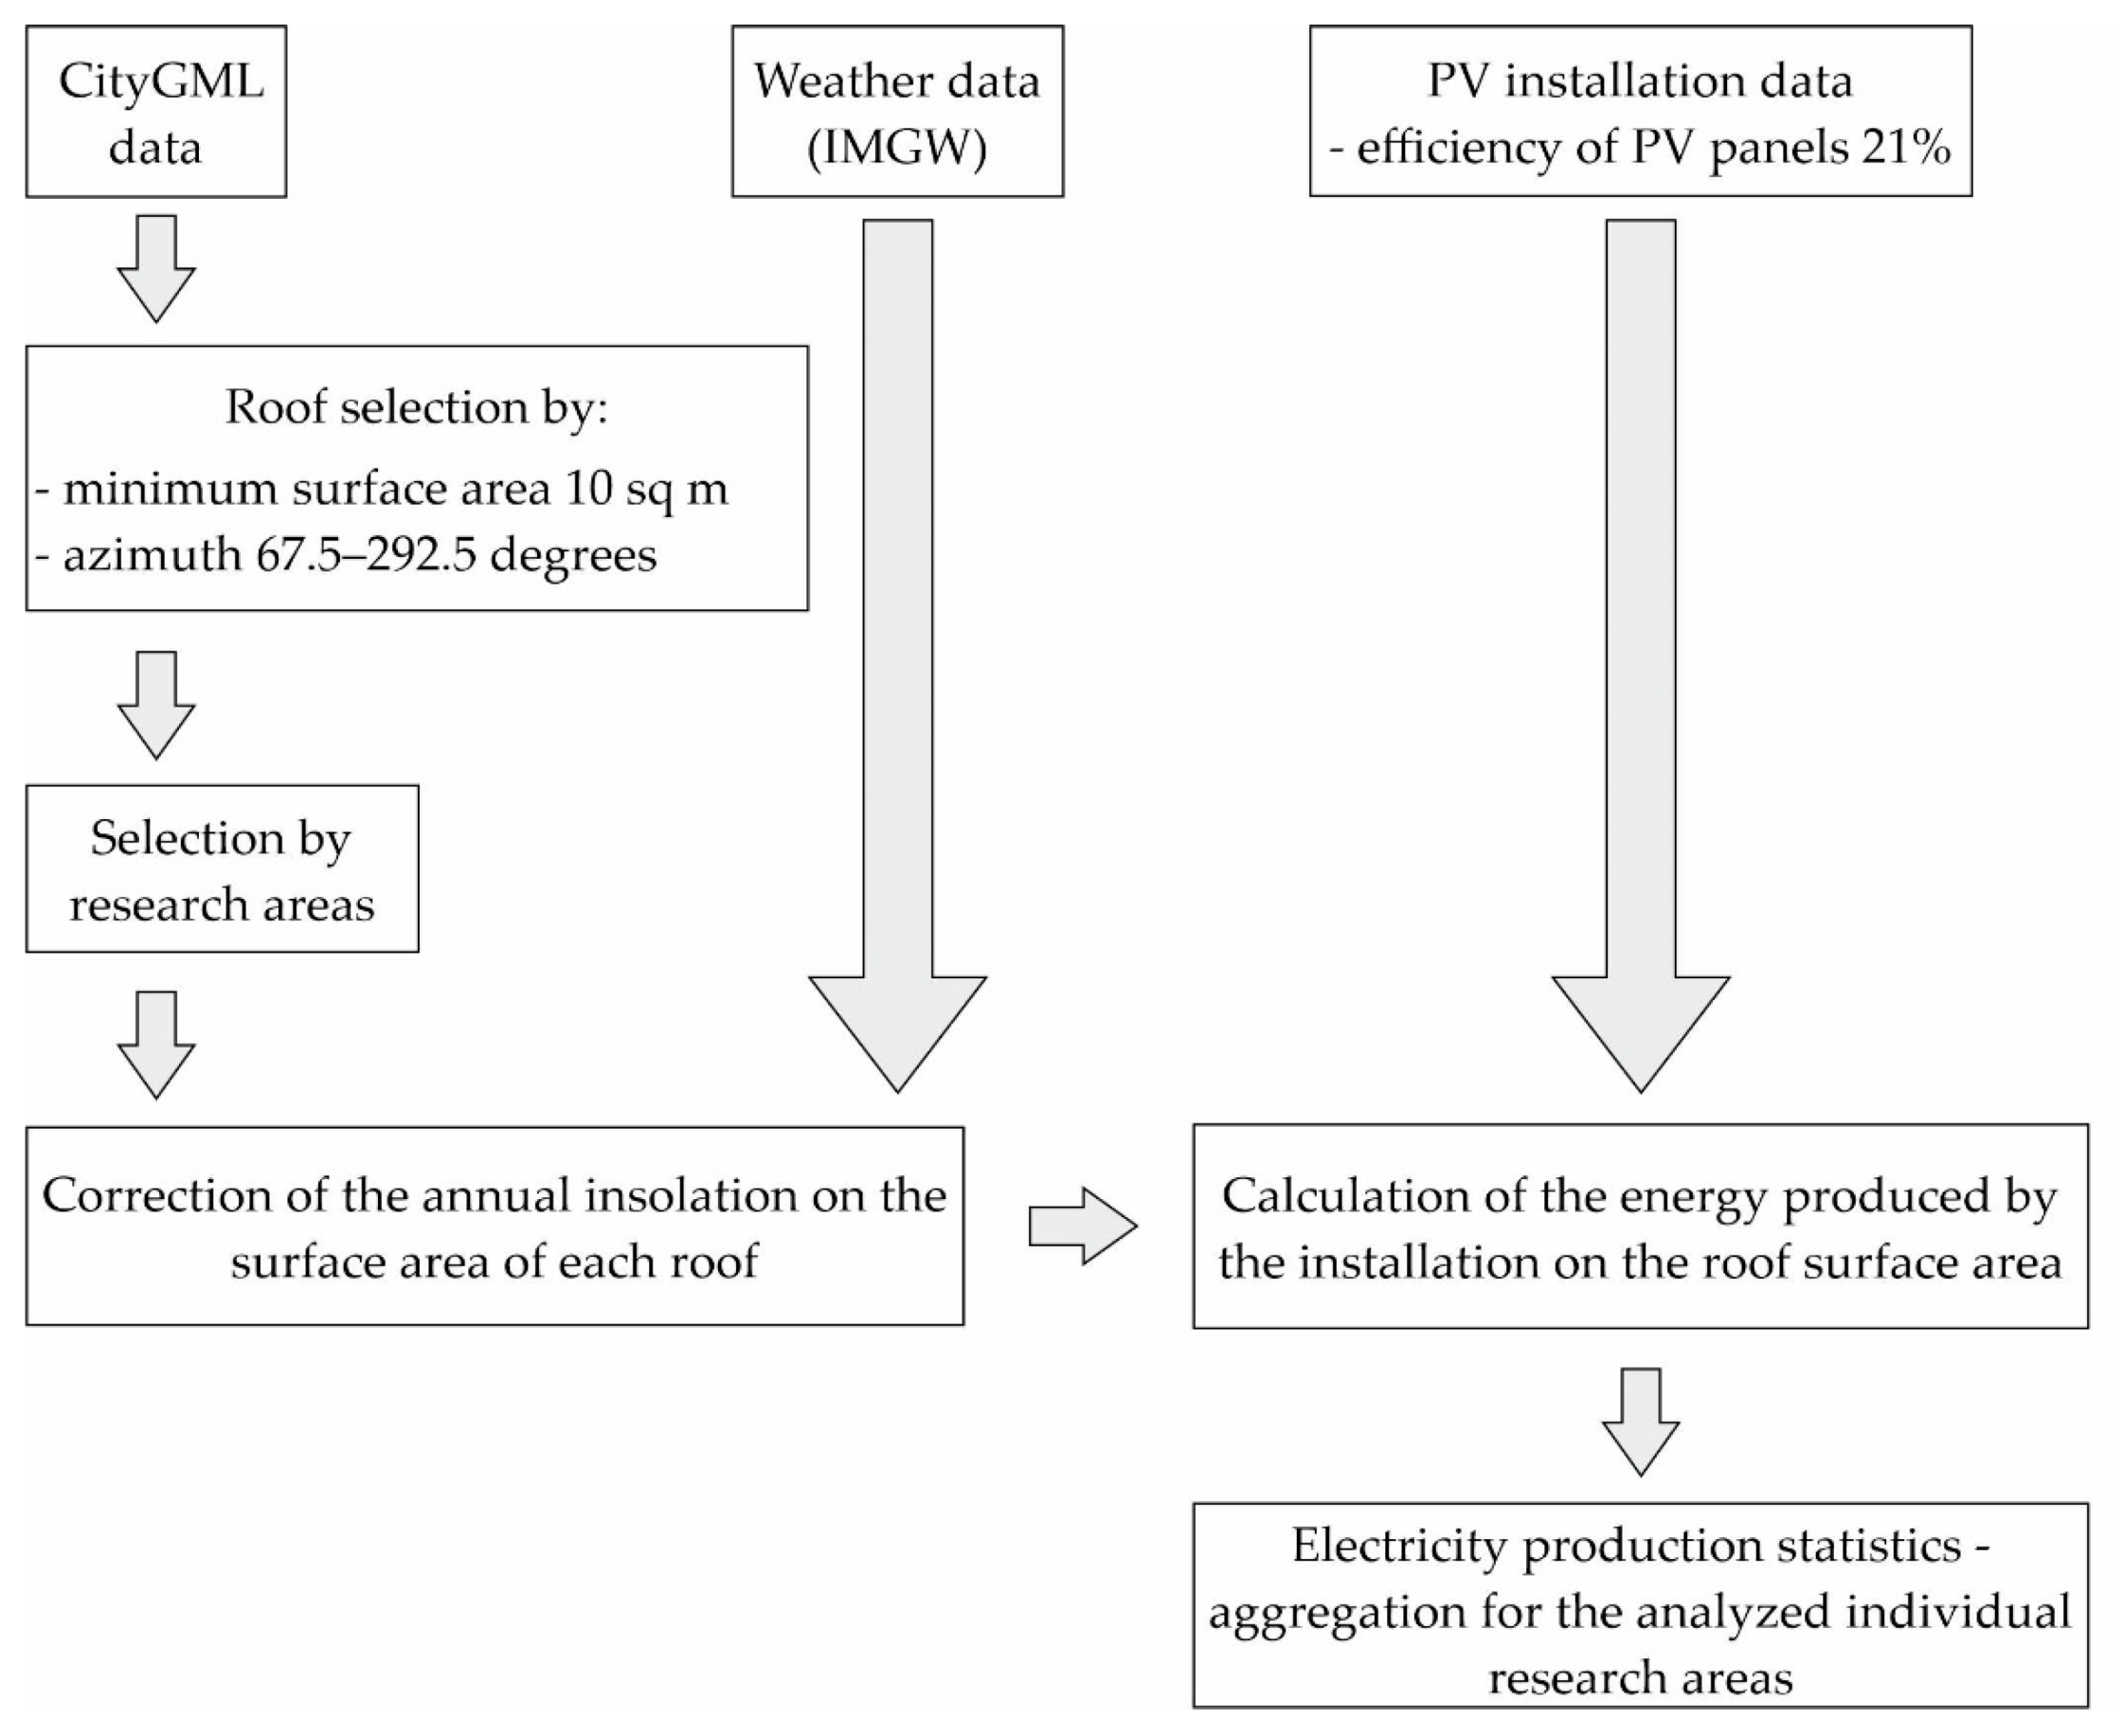
The issue of estimating the amount of energy that could be generated by the roofs of buildings has been undertaken by various disciplines. Many studies are based on data collected on the basis of LIDAR (a detection system which uses laser-based scanning) [
90,
91,
92,
93,
94]. An example of a more advanced method of estimating the potential of solar energy is the use of machine learning, which facilitates more accurate estimations based on a large number of variables related to the location of PV installations [
95,
96,
97]. Good results are also achieved as a result of combining LIDAR data with photogrammetric products [
98]. Many studies point to the use of 3D roofs. In this case, CityGML models can be used with the level of detail of at least LOD2, which are often available for large cities [
99]. From the perspective of CityGML data accuracy, they are the best choice for estimating the potential of solar energy in large areas (when available).
The undertaking of this research problem is justified by a knowledge gap in empirical research; urban sprawl is not evaluated from the perspective of benefits resulting from the possibility of installing solar panels on the roofs of dispersed buildings in suburban areas. Polish researchers are aware of the gap in evaluating the impact of urban sprawl [
100], which affects the development of national spaces. This work was undertaken to estimate the potential of solar energy in three selected cities in Poland, namely Krakow, Warsaw, and Olsztyn. These cities represent the areas with identified urban sprawl processes. They are located at three different latitudes, representing Poland’s longitudinal extent and different sunlight conditions. The analyses were based on CityGML data. In addition, we estimated the solar potential of municipalities surrounding the cities (suburban areas). Based on data from different periods (2012–2017), we estimated the impact of the identified urban sprawl in selected cities on increasing the energy potential of their agglomerations.
The main objective of the article is to estimate output energy in urban sprawl areas. A sub-objective is to present an economic justification for the use of roofs for energy generation.
Section 2 reviews the literature, and
Section 3 describes the Polish energy sector and its policies.
Section 4 presents the methodology of the analyses, and the results are discussed in
Section 5.
Section 6 is the discussion of results. The article ends with concluding remarks.
3. The Characteristics of Poland’s Energy Sector and Energy Policy
The possibility of the use of solar radiation in the energy sector is strongly correlated with natural and particularly climate conditions. In this context, the most significant feature of climate is direct sunlight, which indicates the amount of total solar radiation reaching the earth’s surface. The average annual exposure to the sun of Poland’s territory, determined for the years 2007–2016 and for an optimal surface inclination using data from the Satellite Application Facility on Climate Monitoring project (SAF CM), amounts to 1273 kWh/m
2 [
101]. This value is lower than that (1470 kWh/m
2) determined for EU areas located to the south of parallel 65°01′30″ N, for which SAF CM data is collected.
Among all EU member states, 15 countries are characterised by a higher level of annual exposure to the sun than the one determined for Poland [
101,
102]. Poland’s neighbouring countries such as Germany, Czech Republic, and Lithuania record slightly lower sunlight levels, while in Slovakia the respective level is higher by 49 kWh/m
2. Considering exposure to the sun and the location of buildings in particular EU countries, Poland ranks 6th (after France, Germany, Italy, Spain, and Romania) in terms of the technical potential for generating PV electricity on roofs, amounting to more than 30,000 GWh/p.a. [
89]. The achievement of this level of electricity generation from PV panels corresponds to nearly 20% of the total electricity consumption in Poland in 2019. However, estimates indicate that electricity generated by PV units in Poland in 2019 reached the level of 730 GWh [
103]. This value is lower than in 15 other EU countries, including Czech Republic, the Netherlands, or Belgium, which have a lower solar energy potential.
Special attention should be given to disproportions in solar energy output between Poland and neighbouring Germany, despite similar sunlight conditions in the two countries [
89,
104]. Solar energy output in Germany in 2019 was estimated at 47,517 GWh, accounting for 9.3% of electricity consumption (the highest level in the EU), while in Poland solar energy represented merely 0.5% of the total consumption (only four countries recorded lower levels) [
103,
105].
In 2019, the capacity of installed PV panels per one inhabitant in the EU amounted to 262 MW. In Poland, the respective value was only 35 MW per inhabitant, lower than in 23 other EU countries, including Finland and Sweden [
103]. Germany, again, reached the highest value amounting to 590 MW per inhabitant.
Electricity generation in Poland is growing steadily, reaching 157.7 TWh in 2020. A favourable trend is a decrease in the share of coal in the energy mix, which in 2020 was the lowest in the history of more than 100 years of the country’s electric power industry (electricity output from hard coal fell to 46% (71.6 TWh), while the share of lignite shrank to 24% (38.3 TWh).
The weaker position of Poland’s mining industry is also confirmed by its more than 4.3 bn PLN loss in 2020. Coal extraction in many Polish mines is less competitive than coal imports; in 2019, average coal extraction costs in Polish coal mines amounted to 346 PLN per tonne, while ARA Rotterdam prices were 44% lower. Simultaneously, the share of other sources of energy increased; in 2020, natural gas was 10% (16 TWh), wind energy was 10% (15.7 TWh), biomass/biogas was 5% (8.2 TWh), water was 2% (2.9 TWh), and solar energy was 1.2% (2 TWh) [
106].
In 2020, the total capacity of all Polish power stations exceeded 51.8 GW [
107]. The structure of electricity generating units is currently dominated by power stations and power and heat generating plants, which use hard coal and lignite, accounting for 66% [
107] of the total capacity of 90 coal units (70 of them exceeded their life expectancy [
108], being in operation for 30–40 years).
Moreover, subsidies received since 2021 under the market aid programme will be cancelled after the year 2025, and the inefficiency of subsequent modernization programmes will make them purposeless. The total installed capacity of wind turbines in Poland has increased to 6.4 GW (12.3% of the installed capacity in 2020), which is also true of PV installations; their total installed capacity amounts to 3.96 GW (7.6%) [
106].
An efficient electricity transmission system is crucial to the country’s energy security. The National Power System (KSE) comprises, apart from generating units (power stations and heat and power generating plants), transmission and distribution networks, ensuring the transmission of energy from producers to recipients. Electric power transmission lines of the highest voltage, i.e., 220 kV, 400 kV, and 750 kV, are the Polish Electric Power Networks SA (PSE)—Poland’s Transmission System Operator. The lines are located across the country’s entire territory. Currently, the total length of these lines amounts to 15,316 km, including 750 kV—114 km, 400 kV—7822 km, and 220 kV—7380 km [
109]. The national transmission network (400 kV and 220 kV), along with a large part of the 110 kV distribution network, functions as a closed multi source power supply system. The system requires NN stations, a large number of WN switchboards, and transformer stations at which medium voltage (10 kV–30 kV used for distribution purposes) is converted to low voltage for end-users (230/380 V). All these facilities, i.e., electric power lines and stations, constitute an electric power system. The network of Poland’s largest electricity distributors consists of state-controlled companies: Tauron Dystrybucja, PGE Dystrybucja, Energa-Operator, and Enea Operator, and a private firm Innogy Stoen Operator. Problems are posed by the slow pace of investment projects and network recovery in distribution companies, necessary activities related to the energy transformation process, particularly for the needs of renewable energy sources. At the end of 2017, the age of more than 40 years was reached by 42% of WN, 37% of SN, and 31% of NN networks [
110].
From a technical perspective, the functioning of the entire system is determined by an increasing demand for electricity and by weather conditions; record high and low temperatures are reflected in demand spikes and limited possibilities of integrating voltage from different sources. A power station’s installed capacity does not guarantee its continuous use.
The entire national electric power system has the achievable capacity of 50.2 GW (96% of the installed capacity), which is not available at any time. In recent years, a much higher demand for electricity has been recorded in summer than in winter. The efficiency of an electric power system is determined by so called demand peaks, which occur in limited periods of time. In Poland, prolonged and higher demand for electricity occurs in winter evenings. In spring and autumn, it usually lasts for one hour, around 8 pm, while morning peaks are lower but longer. In summer, demand peaks occur around noon. A higher demand in summer also results from climate change. Higher average temperatures in summer result in more frequent use of more powerful air-conditioner and cooling systems [
111]. The correlation between peak demand for electricity and the highest level of solar energy output in connection with sunlight is a solid argument for using solar energy to meet demand on hot days [
112] and for increasing the number and capacity of PV systems.
A key role in balancing the capacity of the national electric power system is played by the purchase and sales of electricity on the integrated European electricity market. Energy is imported when it is offered at a lower price than on the domestic market. In the case of the domestic energy sector, which relies heavily on hard coal, emission costs translate to electricity prices, and it should be noted that in September 2021, CO2 emission allowances exceeded a record of 60 € per tonne. Poland became a net importer in 2014. Electricity wholesale prices on the Polish stock exchange are usually the highest in Europe. In 2020, Poland imported 13.1 TWh of electricity (from Sweden, Germany, Czech Republic, Lithuania, Ukraine, and Slovakia), while the country’s export to these markets reached the level of 1.6 TWh. Considering the adopted trend in transforming the electric power industry (Green Deal), it is necessary to invest in RES, which is also confirmed by the energy balance structure.
The energy security of Poland, along with ensuring the competitiveness of the state economy, energy efficiency, and reducing the environmental footprint of the energy sector, are the statutory objectives enshrined in the state energy policy. Pursuant to Articles 12,13–15 of the Energy Law, the state energy policy is developed by the minister responsible for energy, climate, and environment. Its current form is strongly affected by the European Union’s climate and energy policy, aiming to achieve climate neutrality in the European Union by 2050 and using regulatory mechanisms stimulating the achievement of climate targets in the coming decades (2020, 2030). Another important document recently influencing the state energy policy was Regulation (EU) 2018/1999 of the European Parliament and of the Council on the Governance of the Energy Union and Climate Action. Poland, adapting national policies to EU requirements, adopted for implementation the Energy Policy of Poland until 2040 (repealing the 2009 Energy Policy of Poland until 2030) and the National Energy and Climate Plan for the years 2021–2030. The EPP2040 is crucial for the low carbon energy transition, while the NECP aims to implement energy union. Several entities, in particular the Minister of Energy and Climate and the Council of Ministers, are responsible for shaping and implementing these policies in Poland.
Apart from significant delay in the process of decarbonization of the Polish economy and slow growth of green solutions, including RES (unmet target of 15% share of renewable sources in the gross final energy consumption in 2020), the weakness of the national energy management system is a frequent replacement of entities responsible for energy policy implementation, including development and use of renewable energy sources. Only in the last six years (2016–2021), these entities were the Minister of Energy (from 1 December 2015 to 14 November 2019), the Minister of State Assets (15 November 2019 to 20 March 2020), the Minister of Climate (from 21 March 2020 to 5 October 2020), the Minister of Climate and Environment (from 6 October 2020).
The energy transformation process within the framework of the national energy policy, although necessary, is very challenging for the economy, both in terms of financial and social costs as well as time needed to implement the intended changes. The overall cost, the scale of investment, and the high volume of greenhouse gas reductions all contribute to this challenge.
5. Discussion
Table 4 presents the comparison of potential solar energy and energy consumed by households in 2017 [
135].
It should be noted that potential energy generated during one year by all possible (optimal) roof surfaces is several times as high as households’ demand for energy (excluding the use of energy by the industrial sector and transport and business activities). Due to the aggregation of statistical data, the total consumption of energy does not refer to entire voivodeships. Simultaneously, a comparison of potential energy in urban sprawl areas and the consumption of energy in an entire voivodeship (urban sprawl areas represent only 1/5 of voivodeship areas) (
Table 5) leads to the conclusion that in the areas of Krakow and Warsaw, consumption slightly exceeds potential energy output. The urban sprawl area of Olsztyn is an exception; its surface its much smaller than that of the entire voivodeship. The presented values indicate that solar energy output from all possible roof surfaces in a given voivodeship would exceed demand for energy.
However, the above reasoning has some weaknesses; at the present moment it is based on theoretical considerations. First, energy generation is changeable during the year, even for one day, so it cannot be a substitute for demand in winter months and after the onset of darkness. Simultaneously, in summer months and during the day, the achievement of a maximum potential leads to a huge surplus of energy. This problem could be solved by utility warehouses [
136,
137], but this solution also has a number of disadvantages [
138].
The main problem lies in high costs and energy losses, making this solution economically unviable. Perhaps energy storage can be less expensive and more beneficial in the future.
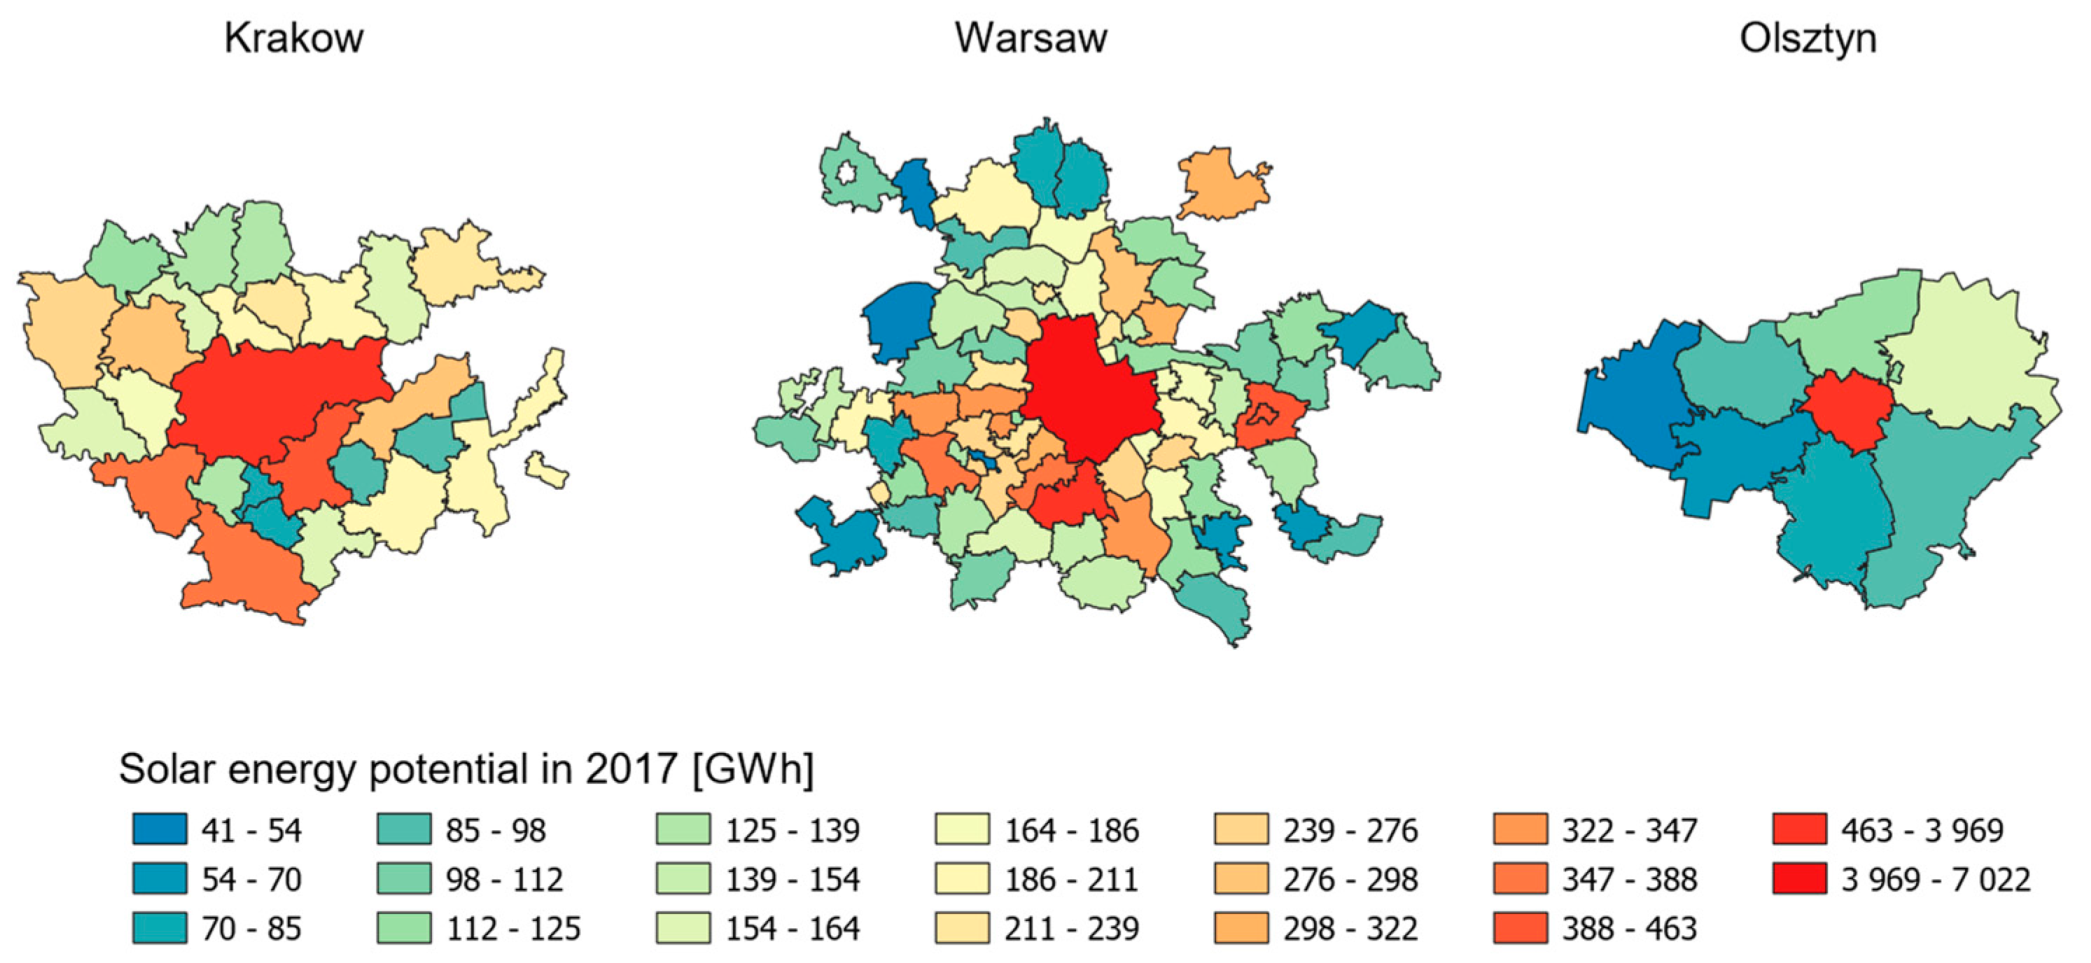
The solar energy potential in all the analysed urban sprawl areas is concentrated in core cities (
Figure 3). Municipalities surrounding Krakow and Warsaw, contrary to the case of Olsztyn, have great energy potential. It results from the dominance of rural areas and, consequently, a lower level of urbanization.
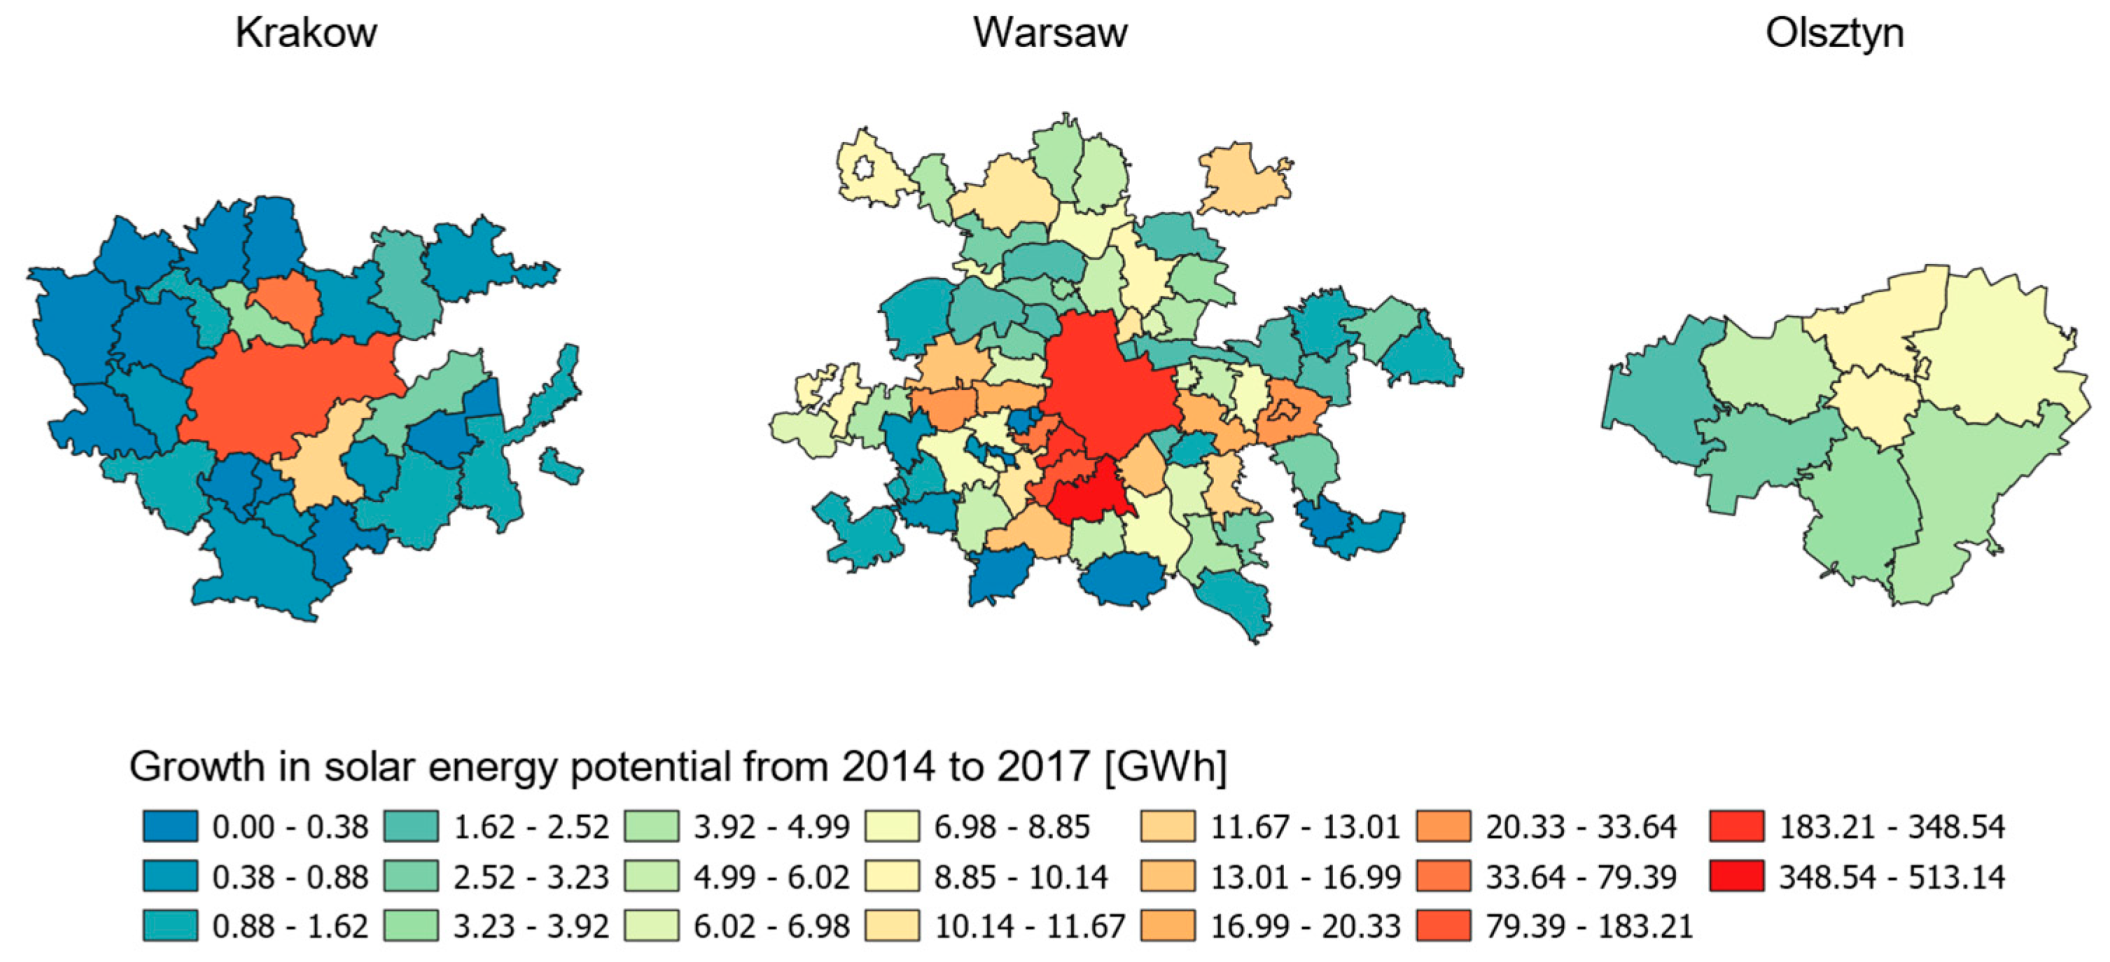
Figure 4 presents growth in solar energy potential resulting mainly from urban sprawl and a higher level of urbanization in municipalities surrounding a core city. Municipalities surrounding Krakow are characterised by very slight changes in energy potential in 2014–2017, while those surrounding Warsaw and Olsztyn record high and average growth in solar energy potential. In Olsztyn, solar energy potential increases in a similar way to surrounding municipalities, while the urban areas of Krakow and Warsaw are characterised by very high increases in solar energy potential as a result of new buildings.
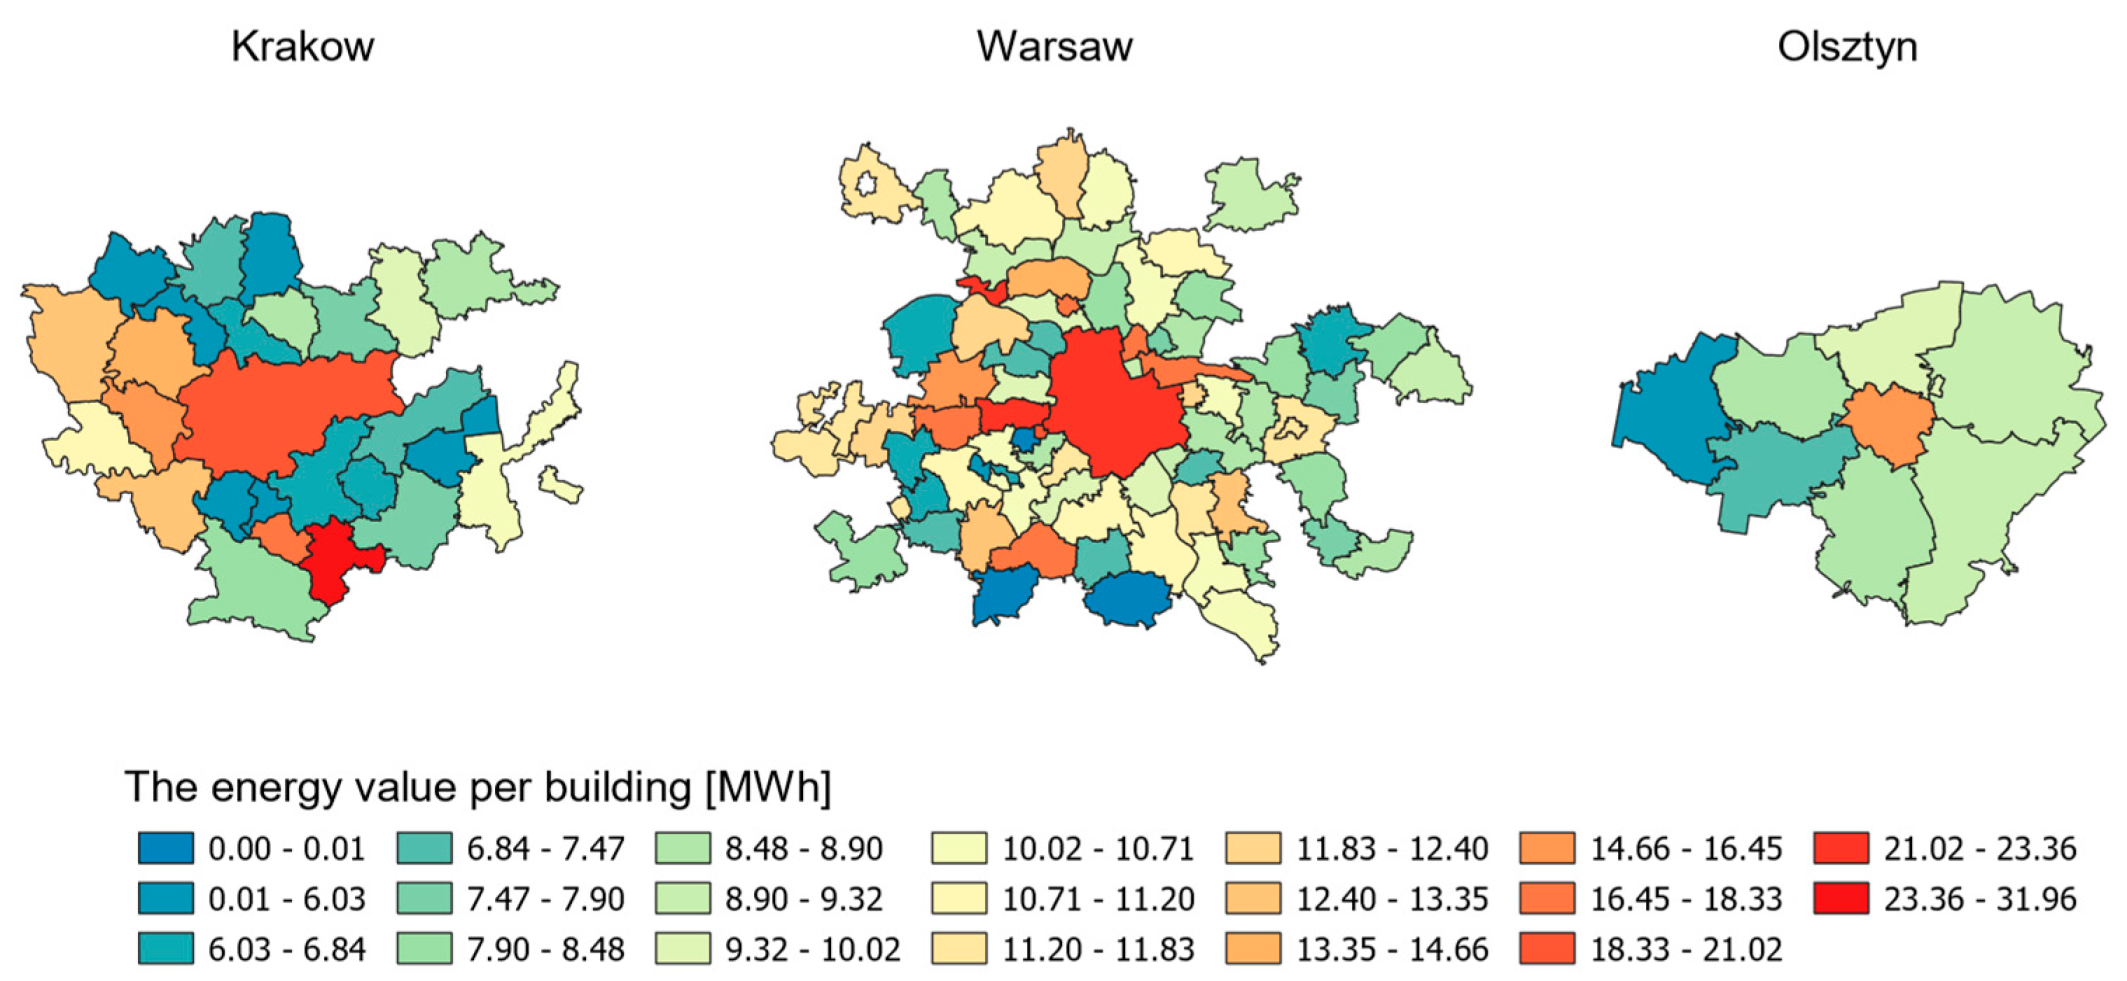
Figure 5 shows the amount of energy per building from 2014 to 2017. The municipality of Dobczyce near Krakow records very high values. It may be the effect of the optimal location of roofs (inclination and azimuth) in buildings erected in this period.
Percentagewise, the highest growth in solar energy potential is recorded in municipalities around the Urban Functional Area of Olsztyn (5.6%), and its dynamics is greater than in the city itself (1.4%). Urban sprawl in this area contributes greatly to an increase in energy potential, unlike in Krakow and Warsaw, which are characterised by a higher growth in potential than surrounding municipalities.
The conducted analyses indicate that the selected urban sprawl areas have a high solar energy potential. The use of databases allows for calculating an average roof surface per one building in its entirety and by single-family houses (
Table 6) and an annual profit (
Table 7).
The longest ROI time is recorded for urban sprawl areas located in the least favourable locations in terms of solar energy collection; currently, in the case of a single-family house with a fully utilised roof for energy collection, it is more than 20 years. The percentage and amount of reimbursement after 25 years of operation of the PV installation is presented in
Table 8.
The best result is achieved by Krakow’s urban sprawl area, in which ROI time is 21 years for an average single-family house, and 20 years for an average building (total). From the perspective of general benefits for communities and the environment, we should note a considerable reduction in CO
2 emissions. However, from the point of view of investors, alternative options would be more favourable in terms of rates of return (a possible profit from PV installations earned after as many as 20–25 years). According to the work of Muhammad-Sukki et al. [
139], in Malaysia the payback period of PV systems was similar (21 years), while Formica and Pecht [
140] calculated a ROI payback period of 5 years, taking into account tax credits for reducing the start-up costs.
Today, a big unknown is the wholesale market price of electricity at which energy can be sold to the grid (regardless of energy source). Currently, it amounts to 383 PLN/MWh, but not so long ago, in Q1 2021, it stood at 243 PLN. This rapid increase in energy prices only throughout the next quarter will considerably shorten the ROI time.
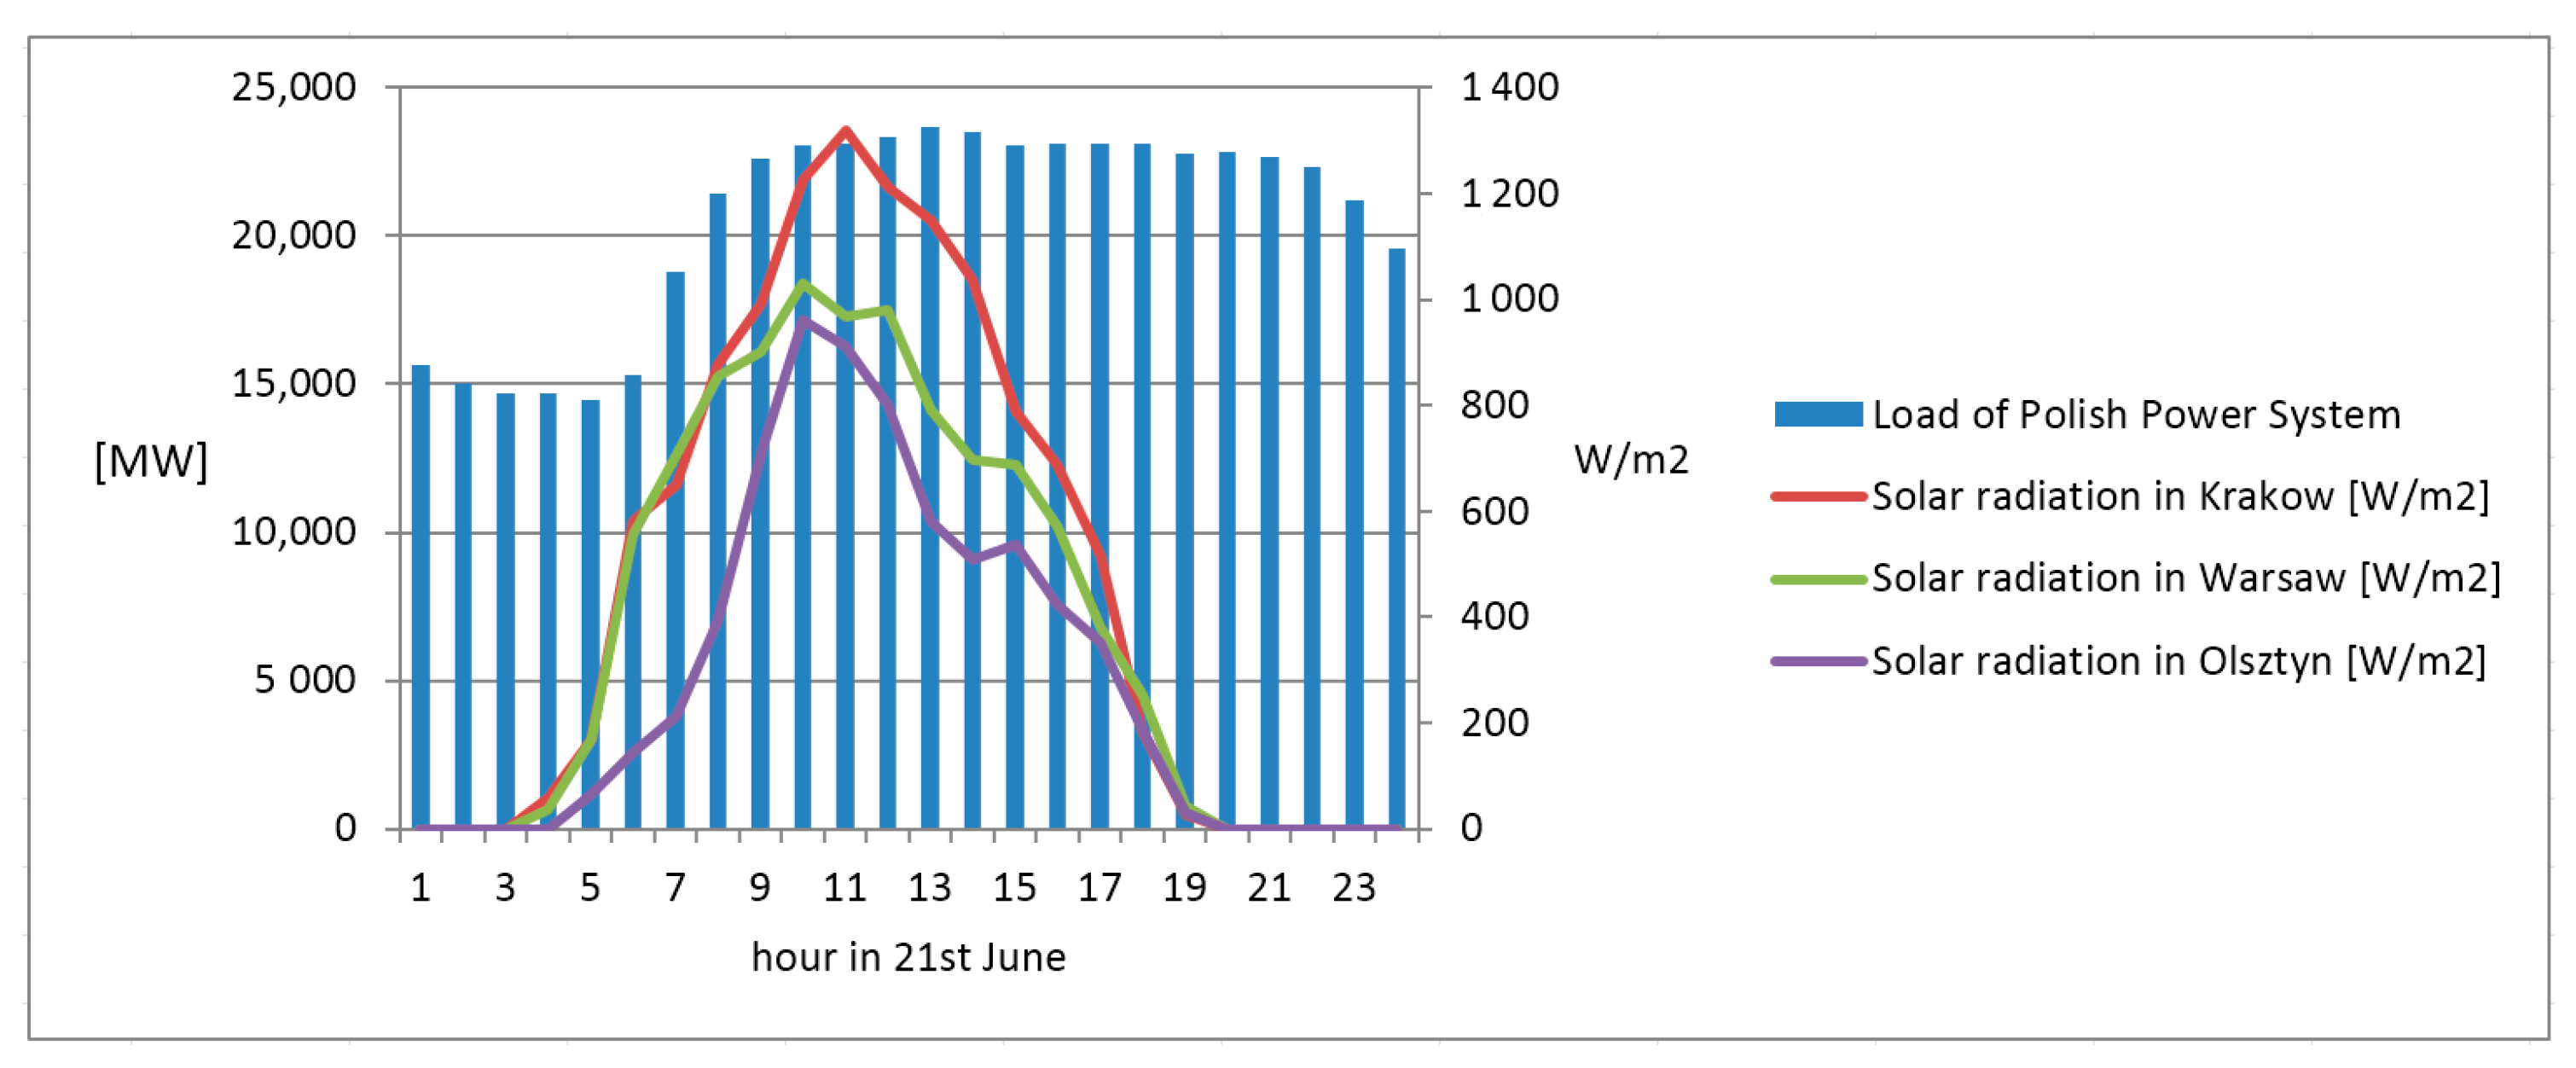
Based on the work in [
141], an attempt was made to compare energy consumption and potential energy generation in selected areas over time (
Figure 6). The solar radiation in three selected areas and the load of the Polish Power System on a given day were compared. The graph shows that the production of solar energy could compensate the increasing energy consumption between 6 and 11 a.m. After that, the share of other energy sources would have to increase due to the gradual decrease of solar radiation until it completely disappears around 7 p.m., when there is still significant demand for energy. The analysis of the graph allows one to conclude that solar energy cannot replace other sources of energy to a large extent, but it can balance spikes in demand at critical times.
In Poland, electricity generation based on PV panels has gained in popularity in recent years, which is reflected in a considerable increase in the number of micro installations. At the beginning of 2020, Poland had 154,426 such installations, totalling a capacity of 992 MW, while the respective figures for 2021 were 457,443 and 3007 MW, representing an increase by 196%. In 2021, the growth rate in this area remained high; at the end of Q3, the total number of all micro installations connected to the distribution network was more than 712 thousand, representing the capacity of more than 4900 MW [
142]. This results from Poles’ increasing awareness of environmental issues, but the main driver is the intention to reduce the costs of electricity consumption. However, the profitability of such investments is conditioned by appropriate legislation. A significant role is also played by a system of incentives for prospective prosumers.
These issues are the components of Poland’s energy policy, which should guarantee the stability of the electric power sector and the promotion of solutions aimed to eliminate a significant external cost, namely global warming. Undoubtedly, this can be achieved through abandoning the use of fossil fuels in electricity generation [
143].
Poland’s energy policy should be based on the recommendations adopted by EU member states, which are designed to achieve three major goals: maintaining the lowest possible electricity prices, minimising the negative impact of energy technologies on the environment (mitigating negative externalities), and ensuring short- and long-term supplies of energy [
144].
The relevant strategy for achieving these goals is presented by the Ministry of Climate and Environment in the document “The Energy Policy of Poland until 2040”, which sets four main objectives: increased security, increased economic competitiveness, increased energy efficiency, and reduced impact on the environment [
145].
In addition to that, strategic goals are set for the energy policy until 2030 and 2040, including the following: increased PV installed capacity up to 5–7 GW (2030) and 10–16 GW (2040); increased capacity of installed sea wind energy up to 11 GW (2040); increased share of RES in all sectors and technologies by at least 23% and not less than by 32% in electricity generation (2030); decreased share of hard coal in electricity generation by at least 56% (2030); and abandoning the use of hard coal in households in cities by 2030 and in rural areas by 2040.
The process of phasing out coal in electricity generation will take many years. However, no specific goals are identified for increasing installed land wind energy. This results from the fact that the Polish authorities do not regard this type of generation as a stable source of electricity that guarantees maintaining the stability of the electric power sector and energy security. This approach is the continuation of the policy aimed to limit the development of land wind energy, initiated by the Act on wind power plants of 20 May 2016 [
146].
The policy requires maintaining a minimum distance between new wind turbines and residential areas as well as natural sites of at least a 10-fold height of an installation. Simultaneously, new regulations imposed higher property taxes on wind turbines. All these restrictions practically stopped the development of wind energy in Poland. Surprisingly, the planned capacity of PV installations until 2030 and 2040, as compared with the installed capacity, is at a relatively low level.
The conservative estimates of growth in the installed capacity may result from the changes that the government makes in the system of financial settlements for prosumers and PV energy operators in connection with the 2015 Act on renewable energy sources [
147]. The changes relate to the resignation from existing incentives offered to PV operators in their settlements with energy network operators and are set forth in the amended Act on RES, passed by the Polish Parliament on 29 October 2021 (as part of a legislative process which is then referred to the Senate and submitted for the President’s approval). The new regulations are to become effective as of 1 April 2022.
Undoubtedly, the new legislation will hinder the dynamic development of PV micro installations, observed in Poland in recent years.
The presented external benefits of electricity generation based on PV panels are significant for all space users and the future of space—the place of human residence. Imposing restrictions on zero-emission electricity collection systems is likely to be accompanied by the decreasing prosperity of local communities understood as the quality of life in space. The process of developing effective spatial, economic, and social policies should give attention to interdependencies between private and social optimum, which lead, when necessary, to emergency measures.
The scale of externalities is usually proportional to the number of space users. Therefore, social and ecological policies should aim to mitigate negative externalities. However, it should not be identified only with direct land use; indirect users are individuals who receive intangible benefits resulting from residing in a given space. Therefore, it should be stressed that the overall process of land use and management, including urban sprawl, generates transaction costs that are also dependent on planning, various procedures, regulations, etc. While managing a space, we benefit from the right to affect different components of the natural environment. This right is transferred with attention given to generated costs. It is assumed that an entity has a legal capacity to carry out land use activities, while an affected entity is entitled to repurchase the right to use a given space from an entity responsible for the reorganization process.
6. Concluding Remarks
In the light of the findings and conclusions presented in the paper, the confirmed potential of urban sprawl areas, in terms of increasing the number of micro installations, points to concrete economic, social, spatial, and institutional benefits. It provides opportunities for increasing the supply of electricity, mitigating the negative impact of externalities, as well as for generating positive externalities, e.g., creating new spatial governance.
A list of benefits resulting from the use of PV installations in electricity generation is quite long, comprising the following: mitigating negative effects on the natural environment (reduced emissions, a decrease in waste volumes and the use of fossil fuels); economic benefits (relatively low costs of usage); and increased energy security along with the achievement of power balance. This zero-emission system has its drawbacks. Apart from the previously mentioned disadvantages (e.g., energy storage problems, daily/seasonal changeability of solar radiation, high prices of equipment), attention should be given to two issues. The first one is the process of recycling/disposal of panels and related equipment. Unfortunately, the currently applied technologies generate a wide range of negative externalities. The second problem relates to installation requirements, preparing roofs for mounting panels, as well as the necessity of maintenance and the continuity of operation.
In the light of our considerations, particularly those related to their economic aspects, the natural environment should be viewed from a different perspective. It should not be identified with the economy as its component. The natural environment does not have a substitute; it cannot be created or replaced by a different environment. Debates in this area should certainly give consideration to the exhaustibility of natural resources; our planet’s marginal productivity is not known, and an assessment and estimation of the Earth’s self-improvement ability is not possible.
To prevent huge social and environmental losses, spatial policies should promote establishing small PV farms, which allow for maintaining cities’ electric power balance at critical moments (mainly in the summer, when demand for electricity in cities is the highest). Therefore, it is desirable to implement spatial policies that enable local spatial economies—responsible for spatial and environmental governance—to create effective, compact, and low emission spatial structures. Activities aimed to improve the environment’s quality should be based on reliable formal and legal analyses for the needs of governing entities and space users. Directions for local self-governments’ activities in this area should be set forth by planning as well as strictly strategic documents. Relevant analyses should be interlinked and coherent. Unfortunately, economic practices indicate that this is not always the case. There are a number of discrepancies between spatial policies, administrative decisions and local regulations in force. Zoning approvals concerning individual cases can generate short-term benefits, but in the long-run this approach to spatial governance management is not possible due to costs and negative externalities created for space users. Therefore, new legislation is necessary, which would enforce developing a system based on functional, efficient, and, most importantly, zero-emission technical infrastructure. In addition, an optimal spatial policy should reduce costs generated by new users, representing negative externalities for current inhabitants.
However, in the areas with weakly developed or obsolete energy networks, the expansion of PV farms may pose a threat to the stability of such farms themselves, causing the temporary shutdowns of prosumers’ PV installations, especially in the situations of the lack of local demand for generated energy.
Urban sprawl is usually observed in new and undeveloped areas, in which modern energy networks are constructed. Therefore, it is recommended that such areas be legally obliged to adapt new buildings to energy collection requirements. Local laws should impose specific parameters, especially for roof surfaces. Recommendations relate to roof pitch (approx. 30 degrees) and its southern azimuth angle; such locations are the most economical, encouraging future owners to install small PV farms. Simultaneously, areas with obsolete energy networks should avoid excessive concentrations of solar installations. Installation decisions should be made by energy network owners who have access to the results of analyses of a given space.


 ,
, 


