Article

Low Temperature One-Pot Hydrothermal Carbonization of Corn Straw into Hydrochar for Adsorbing Cadmium (II) in Wastewater

1
School of Municipal and Environmental Engineering, Jilin Jianzhu University, Changchun 130118, China
2
Key Laboratory of Songliao Aquatic Environment Ministry of Education, Jilin Jianzhu University, Changchun 130118, China
3
Library of Jilin Jianzhu University, Changchun 130118, China
*
Author to whom correspondence should be addressed.
Energies 2021, 14(24), 8503; https://doi.org/10.3390/en14248503
Submission received: 30 October 2021 / Revised: 24 November 2021 / Accepted: 7 December 2021 / Published: 16 December 2021
(This article belongs to the Collection Renewable Energy and Energy Storage Systems)

Abstract

:
Corn straw, a typical agricultural waste, was directly converted into hydrochar with a yield of 77.56% by hydrothermal carbonization at 140–230 °C for 2 h with a solid–liquid ratio of 1:20. The morphology and surface properties were characterized by elemental analysis, specific surface area and pore size analysis and Fourier transform infrared spectroscopy. The results showed that with the increase of hydrothermal reaction temperature, some physical and chemical properties such as the increase of hydrocarbon content, crystallinity, and specific surface area of hydrochar changed significantly. A series of chemical reactions such as dehydration, decarboxylation, and aromatization occurred in the hydrothermal carbonization process so that the prepared hydrochar had rich oxygen-containing functional groups (-HO, C-O-C, C=O) and unique porous structure made the hydrochar prepared at 170 °C had the best removal effect on Cd2+ in solution (5.84 mg/g). These specific conditions could remove Cd2+ and greatly improve the adsorption performance. The pseudo-second-order kinetic model and Freundlich isotherm model could better describe the adsorption behavior of Cd2+. Therefore, corn straw hydrochar as a potential adsorbent for removing Cd2+ from water.

1. Introduction

In recent years, with the rapid development of industrialization, an increasing number of water bodies and soils have been seriously polluted, especially the heavy metal content severely exceeding the standard, which not only brings serious damage to the ecological environment, but also poses a threat to human life and health [1]. Therefore, it was urgent to solve the environmental pollution caused by heavy metals, maintain the safety of human life and ensure the sustainable development of society. Due to its strong mobility, long persistence, high toxicity, and bioaccumulation, cadmium must be removed before industrial wastewater is discharged into the environment [2]. Otherwise, long-term exposure to cadmium will damage the liver, bones, genitals, and other organs, leading to diseases and even cancer [3]. Therefore, in order to meet certain requirements for water quality, methods such as adsorption, ion exchange, chemical precipitation, reverse osmosis, and membrane treatment technology have been developed in recent years [4]. Among them, the adsorption method has been widely used in the actual treatment process because of its advantages of high efficiency, economy, and simple operation.
As a low-cost adsorption material, biochar has attracted more and more people’s interest in removing heavy metals and organic pollutants from sewage. Biochar is a kind of material rich in carbon. It comes from the pyrolysis and hydrothermal carbonization of biomass. It has undergone a thermochemical conversion process and has multiple functions such as fuel and adsorption [5]. Biochar includes pyrolytic carbon and hydrochar [6]. Compared with the preparation of biochar by pyrolysis and supercritical water gasification, hydrothermal carbonization (HTC) technology is milder and has more advantages. As supercritical water gasification requires higher temperature and pressure, the water at this time is corrosive and unsafe [7]. The pyrolysis method requires drying of raw materials and a higher reaction temperature [8]. However, the HTC technology does not require an excessively high reaction temperature, and does not need to dry the biomass, so it can directly convert wet biomass into biochar. The biochar prepared by HTC is also called hydrochar. In recent years, hydrochar as an adsorbent has attracted more and more attention.
The structure and properties of biomass have undergone great changes after hydrothermal treatment. It has rich aromatic functional groups and an ideal pore structure, and is a good material for removing heavy metal ions. For example, Liu et al. used corn straw as a raw material to first undergo hydrothermal pretreatment at 200 °C and then performed pyrolysis treatment at 350–600 °C to obtain pyrolytic hydrochar. Among them, the adsorption capacity of the product obtained by pyrolysis at 500 °C for Cr6+ and Cd2+ was 2.55 mg/g and 7.34 mg/g, respectively. Lei et al. [9] treated corn straw raw materials by HTC prepared hydrochar with rich oxygen-containing functional groups and porous network structure, which showed good adsorption performance for Cr6+, and the adsorption efficiency reached 67.26%. In the study of Huang et al. [10], corn straw was modified with magnesium chloride after pyrolysis treatment. The modified biochar contained a large number of functional groups, and it was concluded that the adsorption process of Pb2+ in solution was multilayer adsorption, mainly chemical adsorption [11]. Based on the above analysis, it can be seen that the choice of raw materials and different preparation methods will affect the surface structure and properties of hydrochar, thus affecting the removal ability of heavy metal ions. Previous studies mostly focused on the efficiency and adsorption behavior of biochar materials for adsorbing heavy metal ions. Compared with the HTC reaction process, the research on promoting adsorption performance is still limited. Moreover, the current HTC technology to treat biomass to produce hydrochar is still insufficient, experimental research is still needed. The study on the mechanism of HTC and the adsorption mechanism of hydrochar materials for heavy metals would provide a comprehensive understanding of the adsorption of heavy metals by hydrochar materials. It provided a theoretical basis for the environmental application of hydrochar materials.
In our present study, corn straw was used as raw material to prepare hydrochar materials by the HTC method. Hydrochar surface structure was analyzed by various characterization methods. The adsorption capacity of the prepared hydrochar for Cd2+ was tested. The isothermal adsorption model and kinetic model were established, and the corresponding adsorption mechanism was discussed.

2. Materials and Methods

2.1. Materials

Corn straw (CS) comes from a suburb of Changchun City, Jilin Province, China. The experimental water comes from the production of deionized water equipment (1820a, Chongqing Moore Water Treatment Equipment Co., Ltd., Chongqing, China). Accurately weigh 2.0316 g of CdCl22.5H2O solid. A 1000 mg/L simulated solution of Cd2+ was prepared by dissolving it in 1000 mL deionized water. All Cd2+ solutions of different concentrations in this study were obtained by diluting with simulated solutions. All chemical reagents were analytical grade and purchased from Shanghai McLean Biochemical Technology Co, Ltd., Shanghai, China.

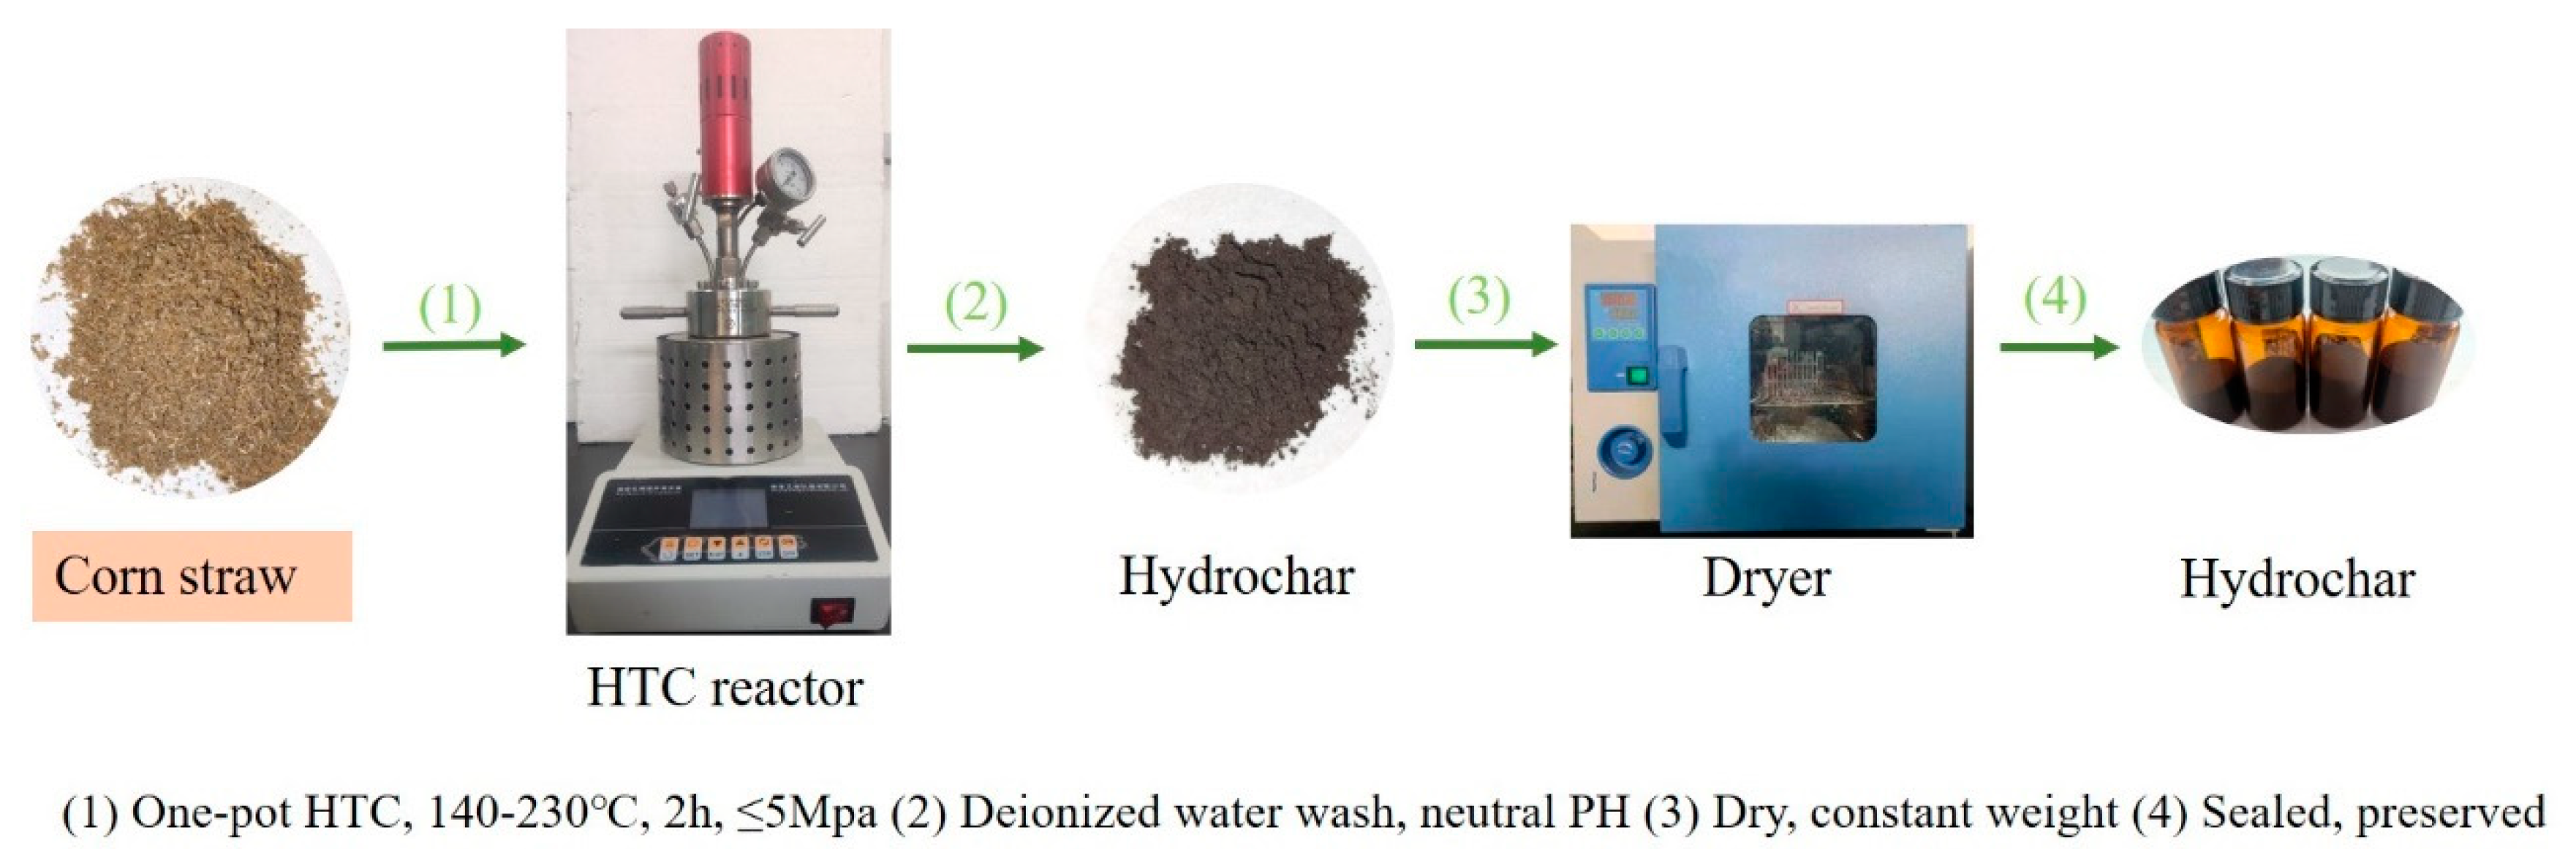
2.2. Preparation of Hydrochar

The corn straw was cleaned with deionized water and cut into small pieces (2–3 cm) after natural air drying. The corn straw was crushed with a grinder (FW177, Tianjin Taisite Instrument Co., Ltd., Tianjin, China) and passed through a 50 mesh sieve. After that, it was cleaned several times with deionized water to remove the impurities and dust on the surface and dried in the drying oven (DHG-9015A, Shanghai Hengke Instrument Co., Ltd., Shanghai, China) at 105 °C to constant weight. Weighing 3.0 g dried corn straw powder accurately and mixing it with deionized water at a ratio of 1:20 (g:mL). Then, we put it into a high temperature and high-pressure reactor (K-PSA-100ML, Nanjing Zhengxin Instrument Co., Ltd., Nanjing, China), purged it with nitrogen for 5 min, set up 140, 170, 200, and 230 °C reaction temperature, and kept the temperature for 2 h. After heating, we took it out after the hydrothermal reactor was cooled to room temperature, filtered it with 0.45 um water system filter membrane, and washed it several times until the pH value of filtrate was close to neutral. Then, we put it in a glass Petri dish, dried it in a drying oven at 105 °C with constant weight to remove water, used an agate mortar to grind the hydrochar into a uniform powder, and stored it for later use. HTC-140, HTC-170, HTC-200, and HTC-230 were labeled by hydrochar at different temperatures. The overall preparation process of the hydrochar sample in this work is shown in Figure 1.

2.3. Characterizations

The content of C, N, and H in the sample was determined by element analyzer (EA3000, Euro Vector, Milan, Italy). The ash content of the sample was determined by industrial analyzer (YX-GYFX 7706, Changsha Youxin Instrument Manufacturing Co., Ltd., Changsha, China), and the content of O element, the atomic ratio of H/C and O/C were calculated. The surface morphology and structure of the samples were observed by scanning electron microscope (FEITM ESEM Quanta 450 FEG, Hillsboro, OR, USA). The functional group structure of the sample was analyzed by Fourier transform infrared spectrometer (L1600400 Spectrum TWO, Llantrisant, UK). The dry KBr and the sample were mixed according to the mass ratio of 1:100 and then ground in agate mortar to make the tablet. The wavenumber scanning within the 4000–400 cm−1 range was carried out under the instrument. X-ray diffraction (DX-2700 XRD, Dandong Tongda Technology Co., Ltd., Dandong, China) was used to determine the microcrystalline structure of the samples. The specific surface area of the sample was measured by specific surface area and pore size analyzer (Quantachrome Instruments, NOVA, NOVA, Florida, USA, FL, USA) at 77 K and calculated by Brunauer–Emmett–Teller (BET) method. The acid-base functional groups on the surface of hydrochar were determined by Boehm titration [12].

2.4. Cadmium Ion Adsorption Experiment

2.4.1. Adsorption Characteristics

At 25 °C, 50 mL of 50 mg/L Cd2+ solution was added into a 100 mL wide-mouth flask, and the PH value of the solution was adjusted to 5 with 0.1 mol/L HCl and 0.1 mol/L NaOH. Then, 50 mg of corn straw hydrochar treated at different temperatures was added, respectively, and samples were taken after shaking in a constant temperature water bath oscillator for 6 h at 150 r/min, and filtered through 0.45 um filter membrane. The concentration of Cd2+ in the solution after adsorption was determined by inductively coupled plasma (Prodigy XP ICP-OES).

2.4.2. Effect of Initial Solution Concentration

Accurately weighed 0.05 g of hydrochar and added it into 50 mL of Cd2+ solution with a certain concentration (10–150 mg/L). Adjusted the pH value of the solution to 5.0 with 0.1 mol/L NaOH and 0.1mol/L HCl solution, then took it out after adsorption at 25 °C 150 r/min in a constant temperature water bath oscillator for 6 h, filtered it with 0.45 um water system membrane, and saved the reaction solution for measurement.

2.4.3. Effect of Adsorption Time

Added 0.05 g hydrochar into 50 mL Cd2+ solution with a concentration of 50 mg/L, adjusted the pH value of the solution to 5.0 with 0.1 mol/L NaOH and 0.1 mol/L HCl solution, then took it out after adsorption for a certain time (5–1440 min) at 25 °C 120 r/min in a constant temperature water bath oscillator, filtered it with 0.45 um water system membrane, and saved the reaction solution for measurement.

2.5. Data Analysis

The calculation formula of hydrochar yield is as follows:
Hydrochar   Yield = Mass   of   hydrochar   obtained Mass   of   feedstock   loaded × 100 %
The adsorption capacity qe (mg/g) and adsorption rate E were calculated at equilibrium:
q e = ( C 0 C e ) V m
where V is the volume of Cd2+ solution (L), m is the amount of adsorbent (g), C0 is the initial mass concentration of Cd2+ solution (mg/L), and Ce is the mass concentration of Cd2+ solution at adsorption equilibrium (mg/L).
E = C 0 C e C 0 × 100 %
where E is the adsorption rate at equilibrium, and the rest is the same as above.
All the experiments were performed in triplicate.

3. Results and Discussion

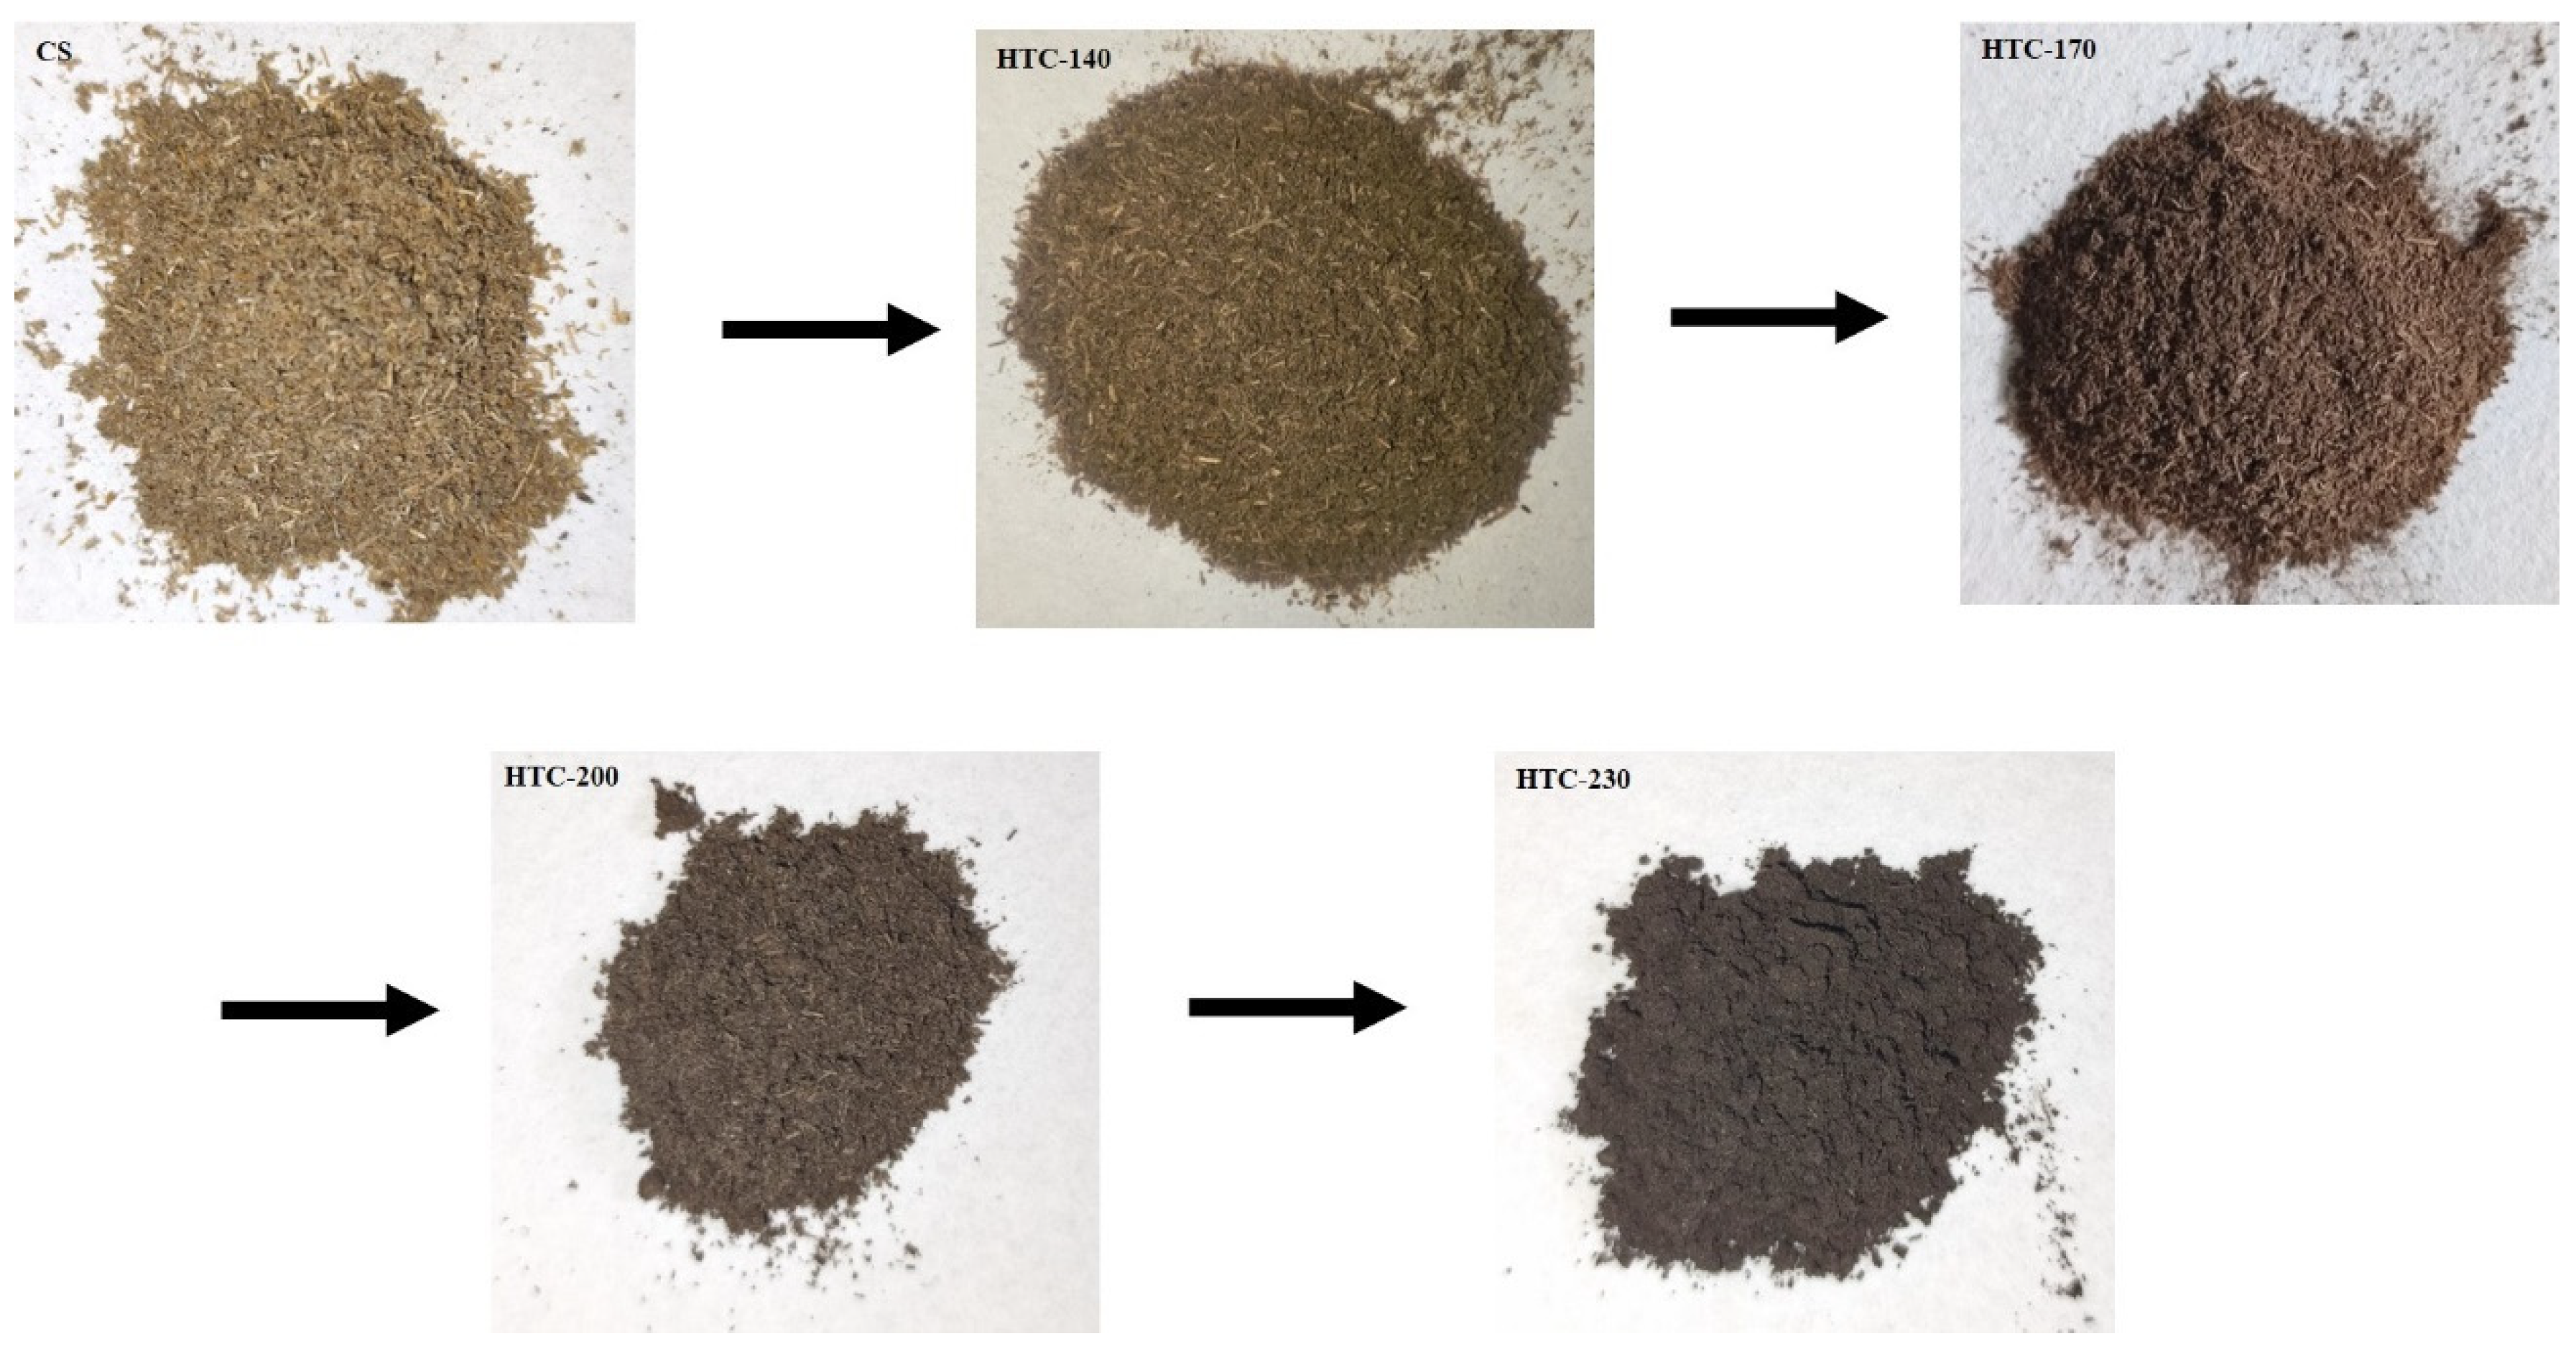
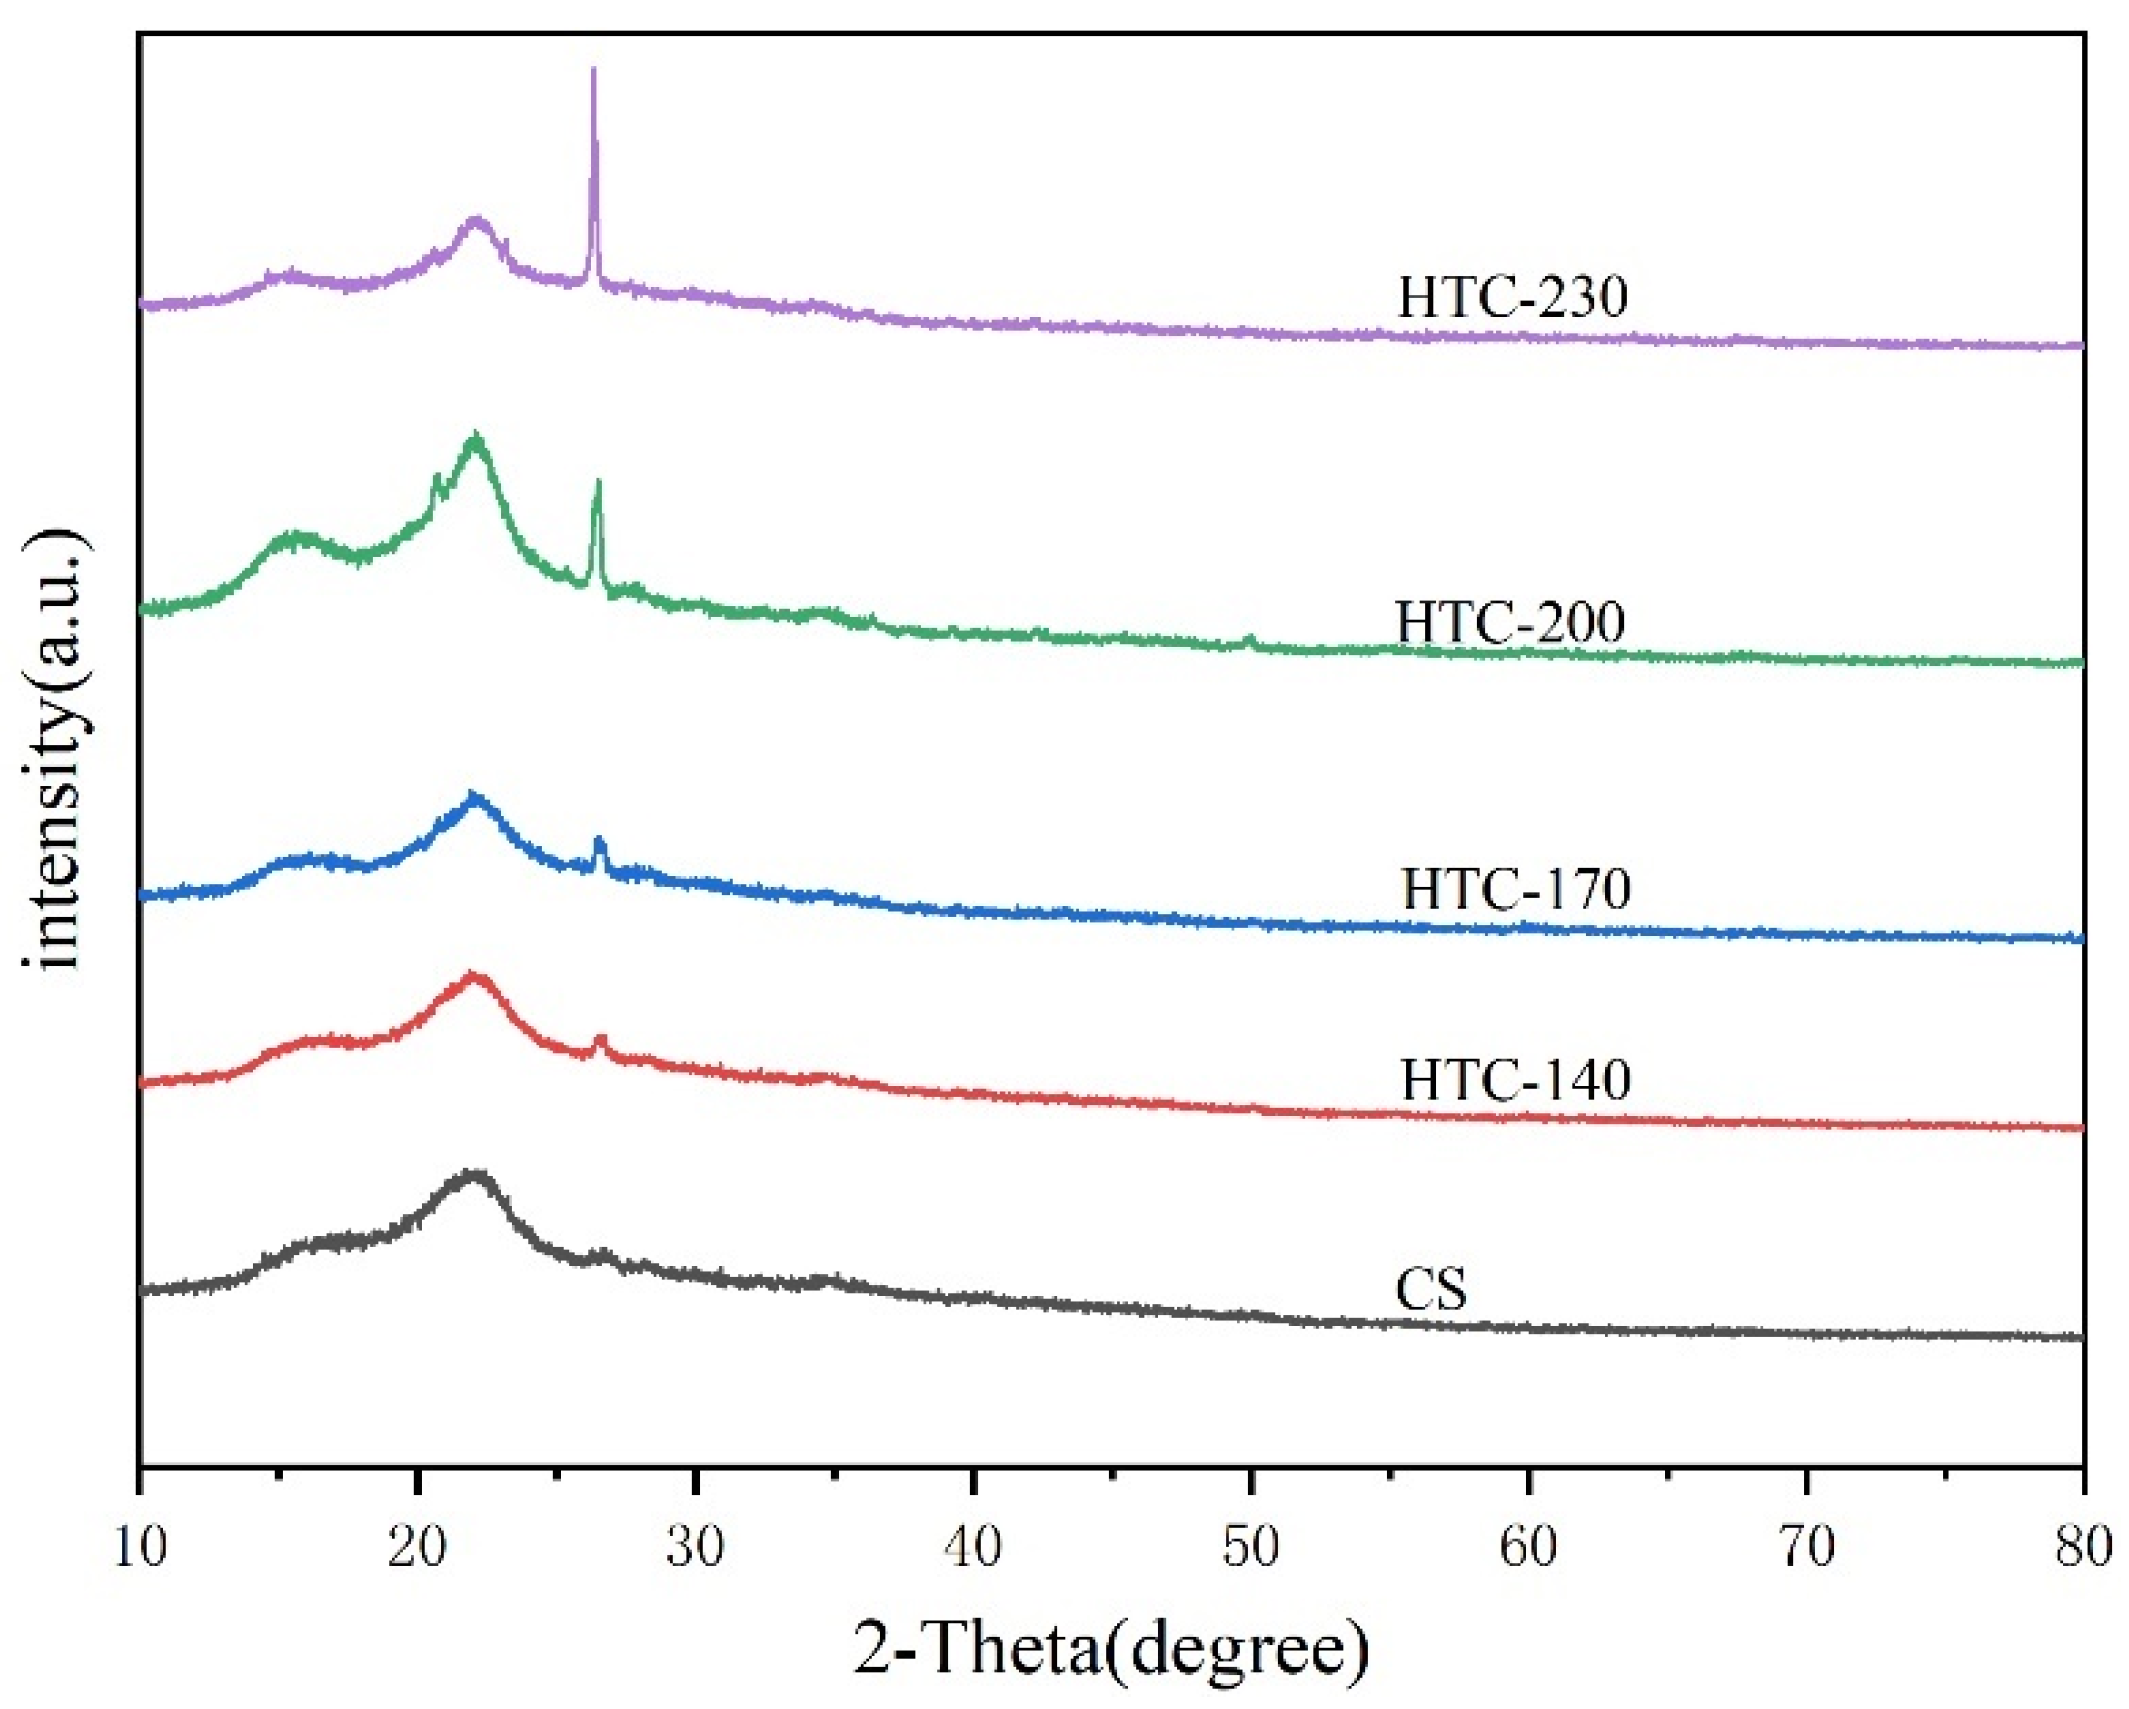
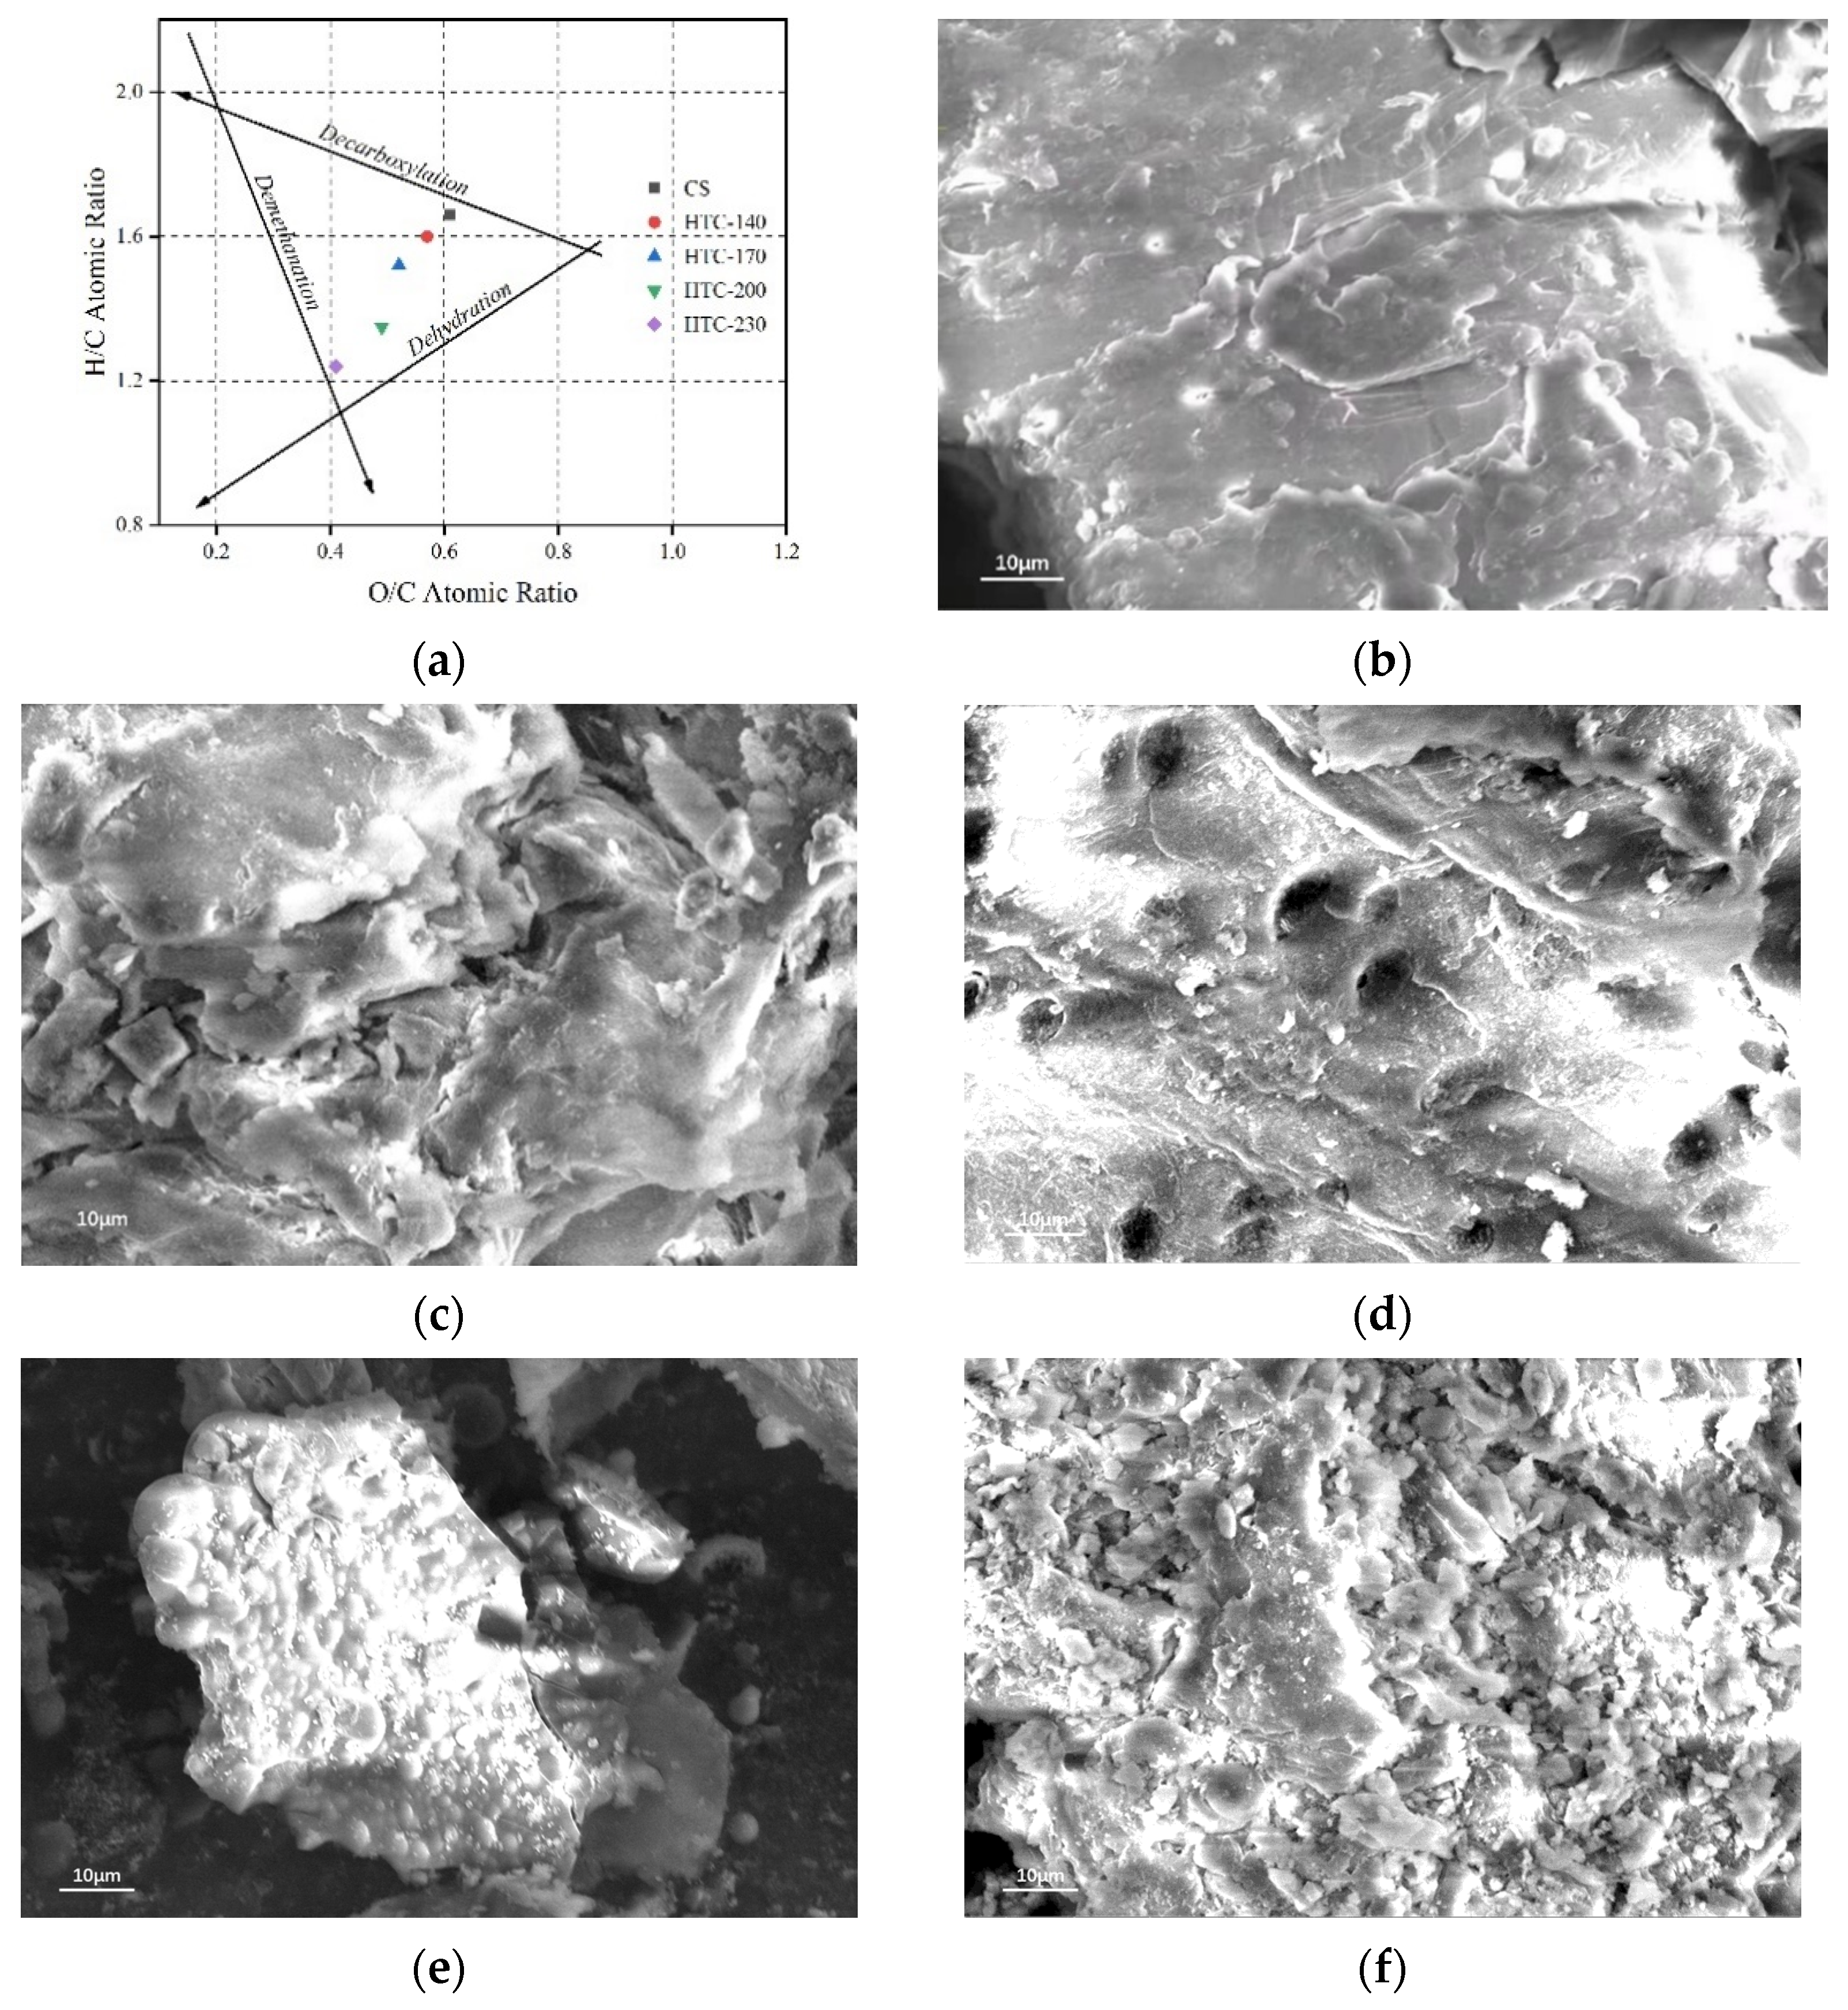
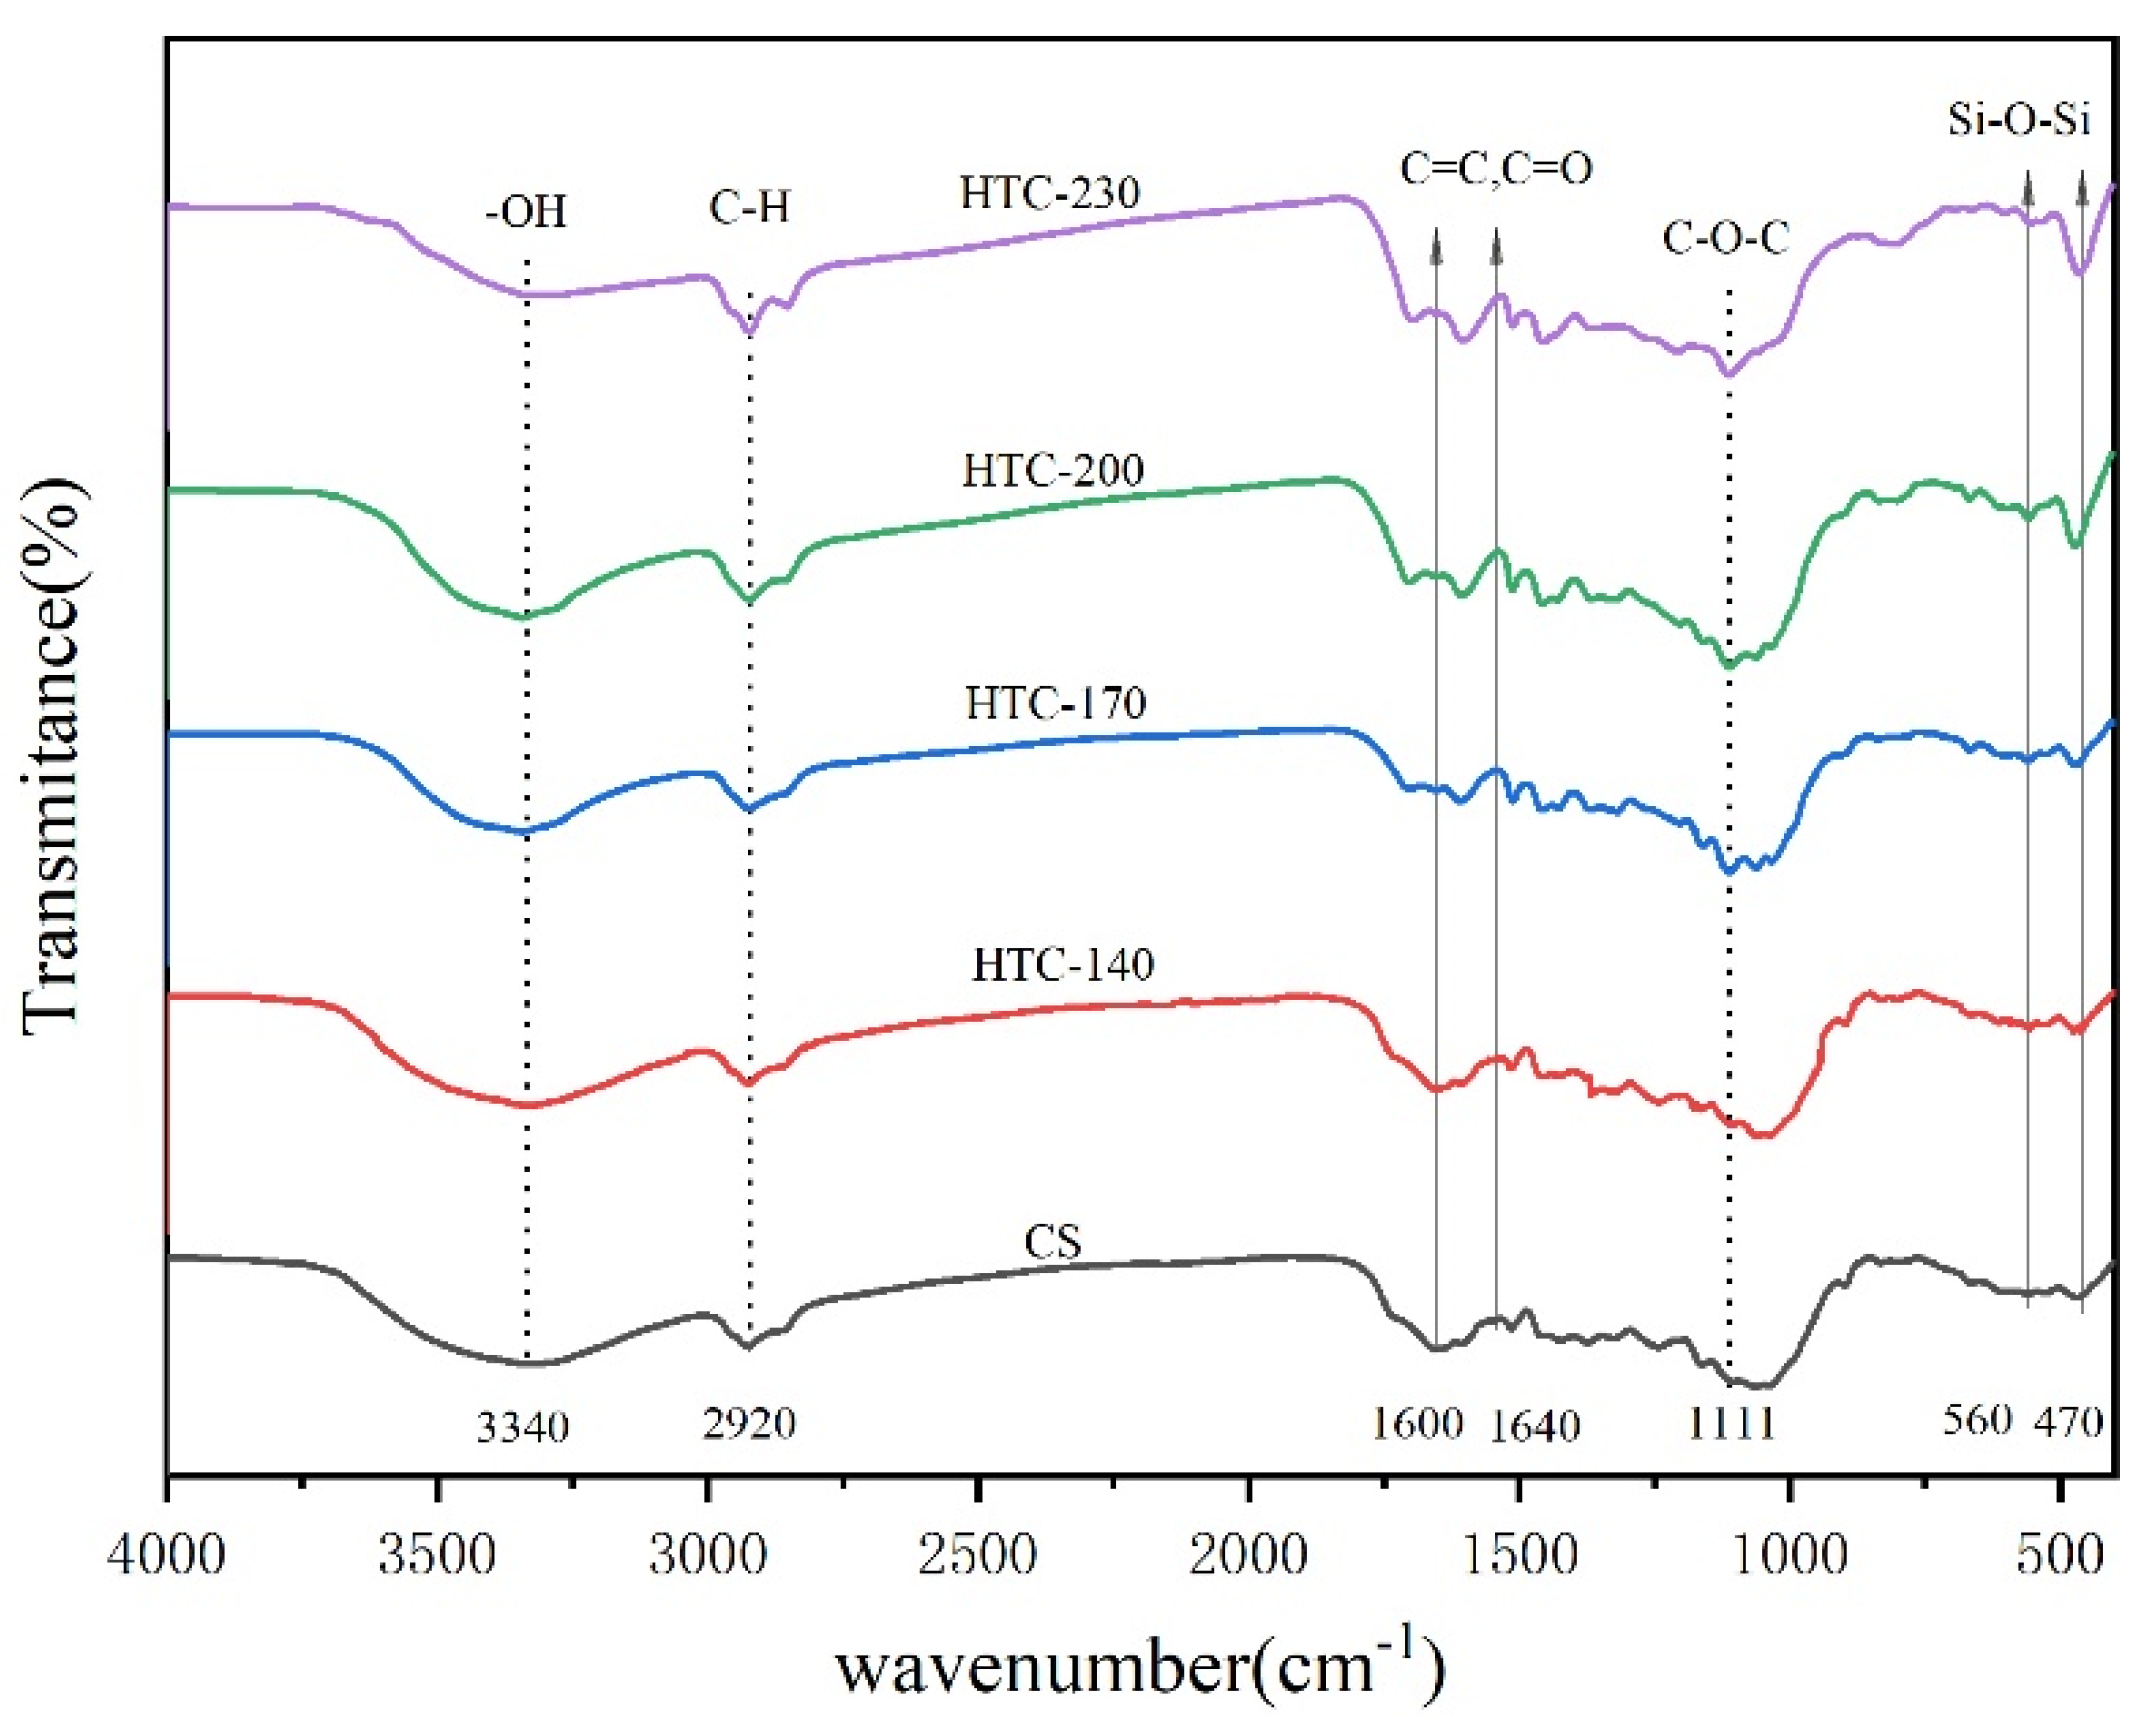
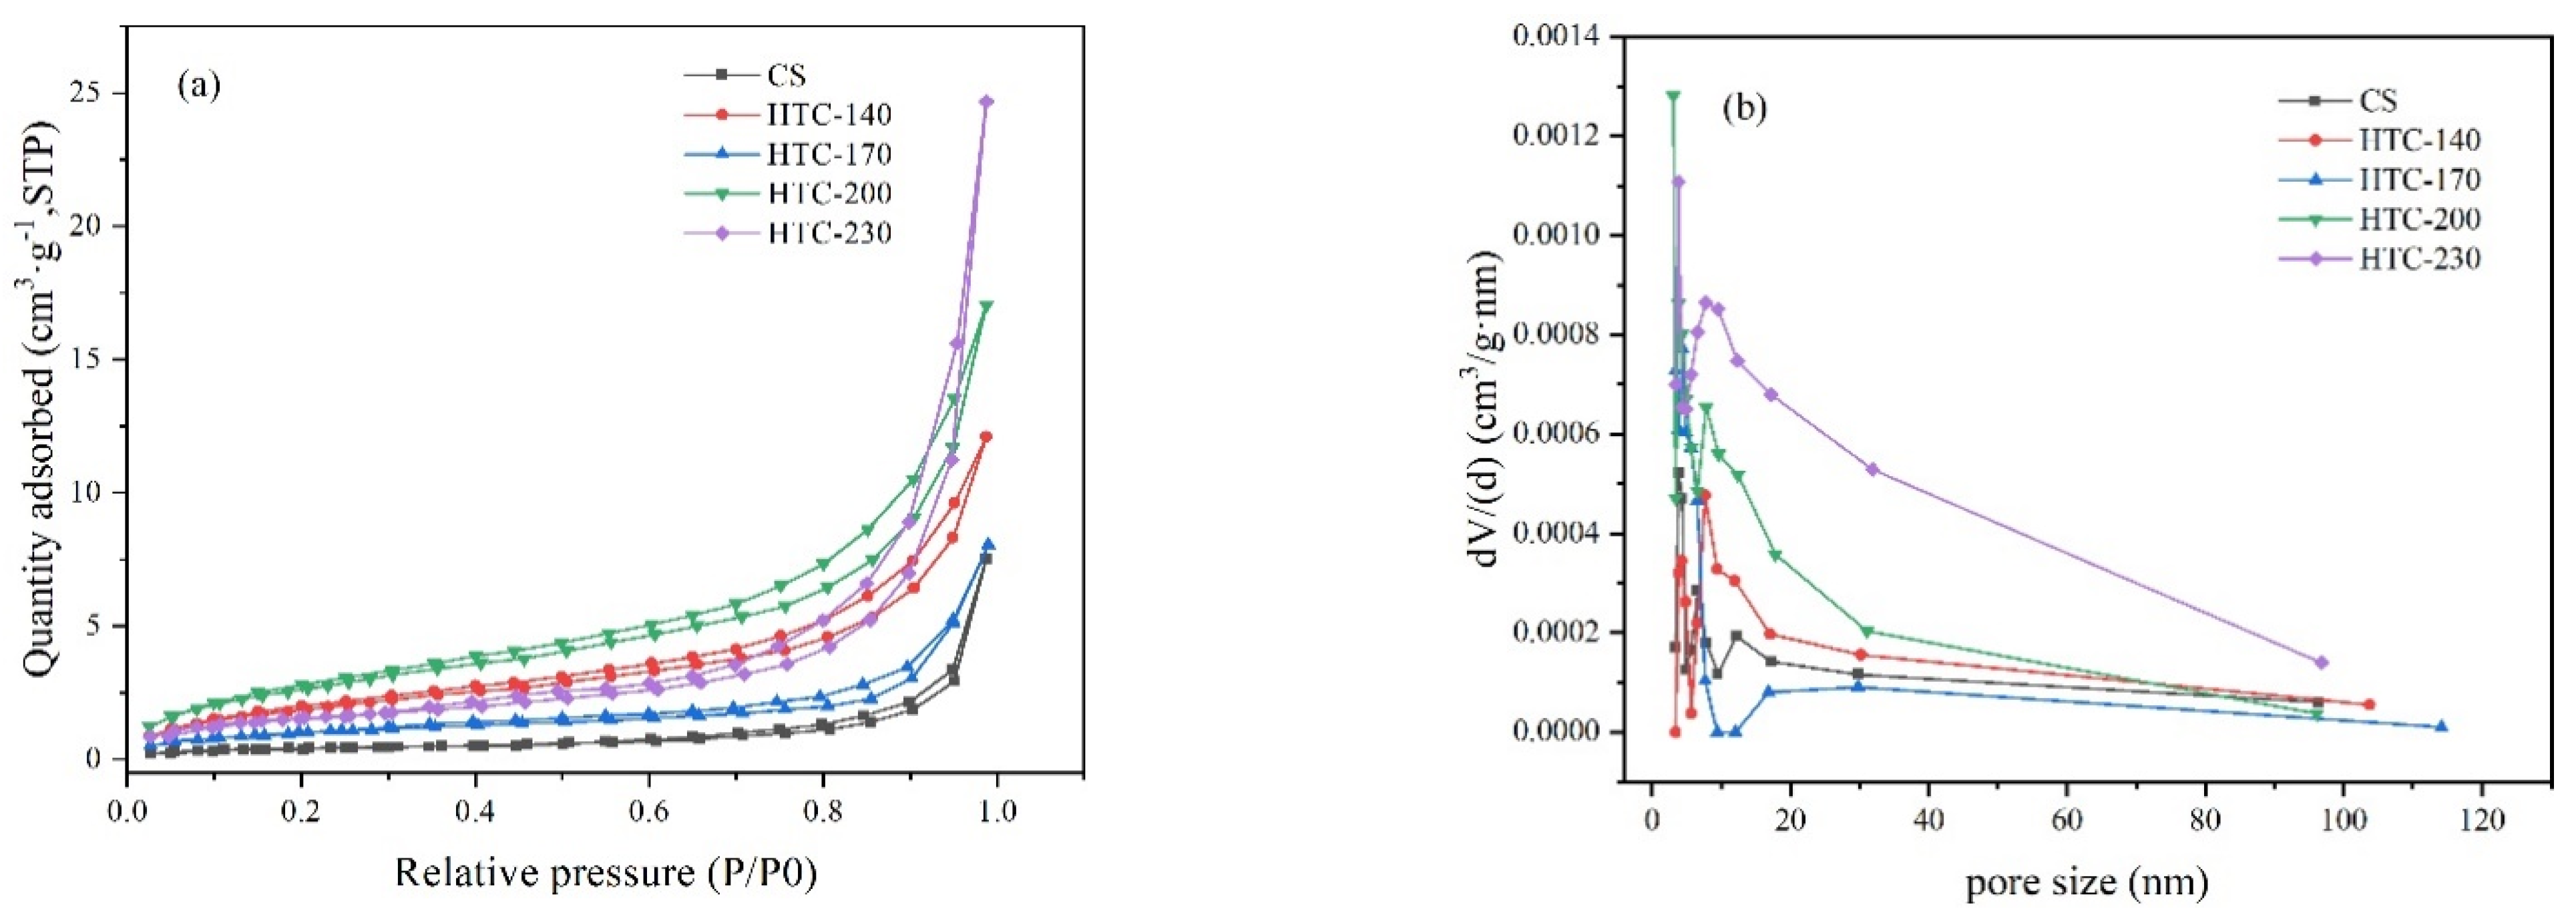
3.1. Characteristics of Hydrochar

Figure 2 shows the sample state of CS treated at different HTC temperatures. Figure 3 analyzed the XRD pattern of the sample to illustrate the potential structural differences caused by the material after different HTC temperatures.
From the product pictures after HTC of corn straw and the corresponding XRD images, it could be seen that the color change of hydrochar reflects the degree of carbonization of the product, which was consistent with the analysis of SEM and Van Krevelen diagrams discussed later. As the temperature increases, the color of straw material gradually changed from the initial vegetation to tan, and finally turned to carbon black. Under the condition of closed high temperature and high pressure, the change of color showed that the change of hydrothermal reaction temperature had accelerated the aging of straw. In order to analyze the crystal structure of hydrochar, an XRD spectra analysis was performed. From the XRD spectra of straw raw materials and hydrochar, it could be seen that after HTC, the characteristic peak of hydrochar was more obvious than that of straw raw materials. When the diffraction angle 2θ was 22.1° and 26.5°, there were diffraction peaks representing the crystal structure of cellulose, which was mainly related to the crystal structure of corn straw cellulose [13]. Compared with the raw materials, the diffraction peak at 2θ = 22.1° gradually weakened with the increase of HTC temperature, indicating that the increase of temperature changed the cellulose from microcrystalline structure to amorphous structure. The diffraction peak at 2θ = 26.5°gradually increased, indicating that the crystallinity of hydrochar was further strengthened and the functional groups of carbon and oxygen were gradually reduced.
The surface structure of the hydrochar samples was observed by SEM technology. It could be seen from Figure 4 that the raw material of corn straw showed a dense and agglomerated plate structure. After different hydrothermal temperature treatments, the external structure of the raw material was changed, the bond of the polymer was broken, which reduced the structural integrity of the hydrochar. The particle surface was uneven and had rich pore structure. After 200 °C, some biological macromolecules such as cellulose and hemicellulose were hydrolyzed. With the further increase of temperature, smaller organic units appeared on the surface of hydrochar at 230 °C, amorphous cellulose and lignin were partially hydrolyzed, the surface was rough and porous, its density and average diameter increased, and the network structure was destroyed, which was due to the decomposition of biomass and the release of volatiles [14].
The element content of hydrochar and the atomic ratio of H/C and O/C was listed in Table 1. It could be seen from the elemental analysis results in the table that when the reaction temperature increased from 140 °C to 230 °C, the mass fraction of the C element of the obtained hydrochar showed an upward trend, increasing from 42.69% of the raw material to 48.51%, which indicated that after HTC of corn straw, the carbon element was aggregated, providing a structural basis for the adsorption of heavy metals [15]. The mass fraction of O decreased from 34.56% to 26.22%, and the mass fraction of H also showed a downward trend, which was due to the dehydration and dehydrogenation of corn straw during the HTC process. At the same time, the atomic ratios of H/C and O/C decreased from 1.66 and 0.61 to 1.24 and 0.41, respectively, which could also be observed in the Van Krevelen diagram (Figure 4a). The changing trend of the H/C and O/C atomic ratio indicated the loss of oxygen-containing functional groups on the surface of hydrochar [16]. The lower H/C and O/C indicated that dehydration and decarboxylation were the main reactions in the hydrothermal process, resulting in a series of aromatization and carbonization of the hydrochar, and the decrease of polar and oxygen-containing functional groups [17].
In order to determine the functional groups on the surface of straw raw materials and hydrochar, FTIR spectroscopy was carried out. It could be seen from Figure 5 that the surface of hydrochar was rich in functional groups. For example, the absorption peak of 3200–3700 cm−1 was caused by -OH stretching vibration in the hydroxyl or carboxyl group [18]. With the increase of carbonization temperature, the hydrogen bonds between hydroxyl groups were destroyed or broken, the strength of hydroxyl or carboxyl groups decreased gradually, and the position of the absorption peak moved to a lower wavenumber [19]. The absorption peak at 2800–3000 cm−1 indicated the existence of C-H bending and stretching vibration of methylene. With the increase of carbonization temperature, methylene was gradually degraded or changed, which meant that the unstable aliphatic compounds were gradually reduced [20]. The absorption peak at 1600–1700 cm−1 indicated the existence of C=O and C=C stretching vibration of carbonyl, carboxyl, or ester, which indicated that the existence of acidic oxygen-containing functional groups might be beneficial to the adsorption of heavy metals [21,22]. The absorption peak at 1100–1200 cm−1 indicated the existence of C-O-C tensile vibration, and the intensity of the absorption peak decreased with the increase of temperature. The absorption peaks near 470 and 560 cm−1 were the stretching vibration of SiO2, and the absorption peaks widened with the increase of carbonization temperature, indicating that the carbonization of corn straw was further strengthened. The above results showed that the hydrochar prepared from corn straw was mainly composed of carbon, hydrogen, and oxygen, which contained hydroxyl and aromatic carbon oxygen functional groups. The carbonization process led to the oxidation of functional groups. As shown in Table 1, the content of carbon increased, the content of hydrogen and oxygen decreased, and the absorption wave number shifted. These functional groups might provide good binding sites for heavy metal ions [23].
According to the isothermal adsorption curve of corn straw hydrochar (Figure 6), the nitrogen adsorption and desorption isotherms of hydrochar were similar, which belonged to type IV in the IUPAC (International Union of Pure and Applied Chemistry) classification system [24]. The adsorption and desorption curves did not coincide, but there was an obvious H4 hysteresis loop, which indicated that the sample was mesoporous material and was related to capillary condensation in mesoporous [25]. From the pore size distribution diagram, it could be seen that the pore size distribution was mainly concentrated in the range of 3–20 nm, the content of mesopores was rich, and the content of micropores and macropores was relatively small, indicating that hydrochar had mesoporous characteristics. The detailed structural parameters of these hydrochars were given in Table 2. Compared with the raw materials, the hydrochars had higher specific surface area and total pore volume. HTC-230 had the largest specific surface area (8.497 m2/g) and total pore volume of 0.040 cm3/g, while the raw materials had smaller specific surface area (1.458 m2/g) and pore volume of 0.012 m3/g, which was consistent with the results of SEM analysis. The increase in the specific surface area and pore volume of straw raw materials was due to the hydrolysis reaction of HTC, and some components might become gas or dissolved in water, thereby forming pores and increasing the specific surface area of the pores [26]. Therefore, the relevant properties of raw materials after HTC were improved.
The content of oxygen-containing functional groups on the surface of hydrochar was determined by the Boehm titration method, and the results were shown in Table 2. With the increase of HTC temperature, the acidic functional groups of hydrochar from corn straw decreased gradually, from 3.181 mmol/g to 2.054 mmol/g, while carboxyl, phenolic hydroxyl, and lactone groups decreased in varying degrees. This indicated that the increase of HTC temperature was not conducive to the formation of oxygen-containing functional groups on the surface of hydrochar to a certain extent, which further confirmed the result that the mass fraction of oxygen and hydrogen decreased with the increase of HTC temperature in Table 1.

3.2. Adsorption Studies

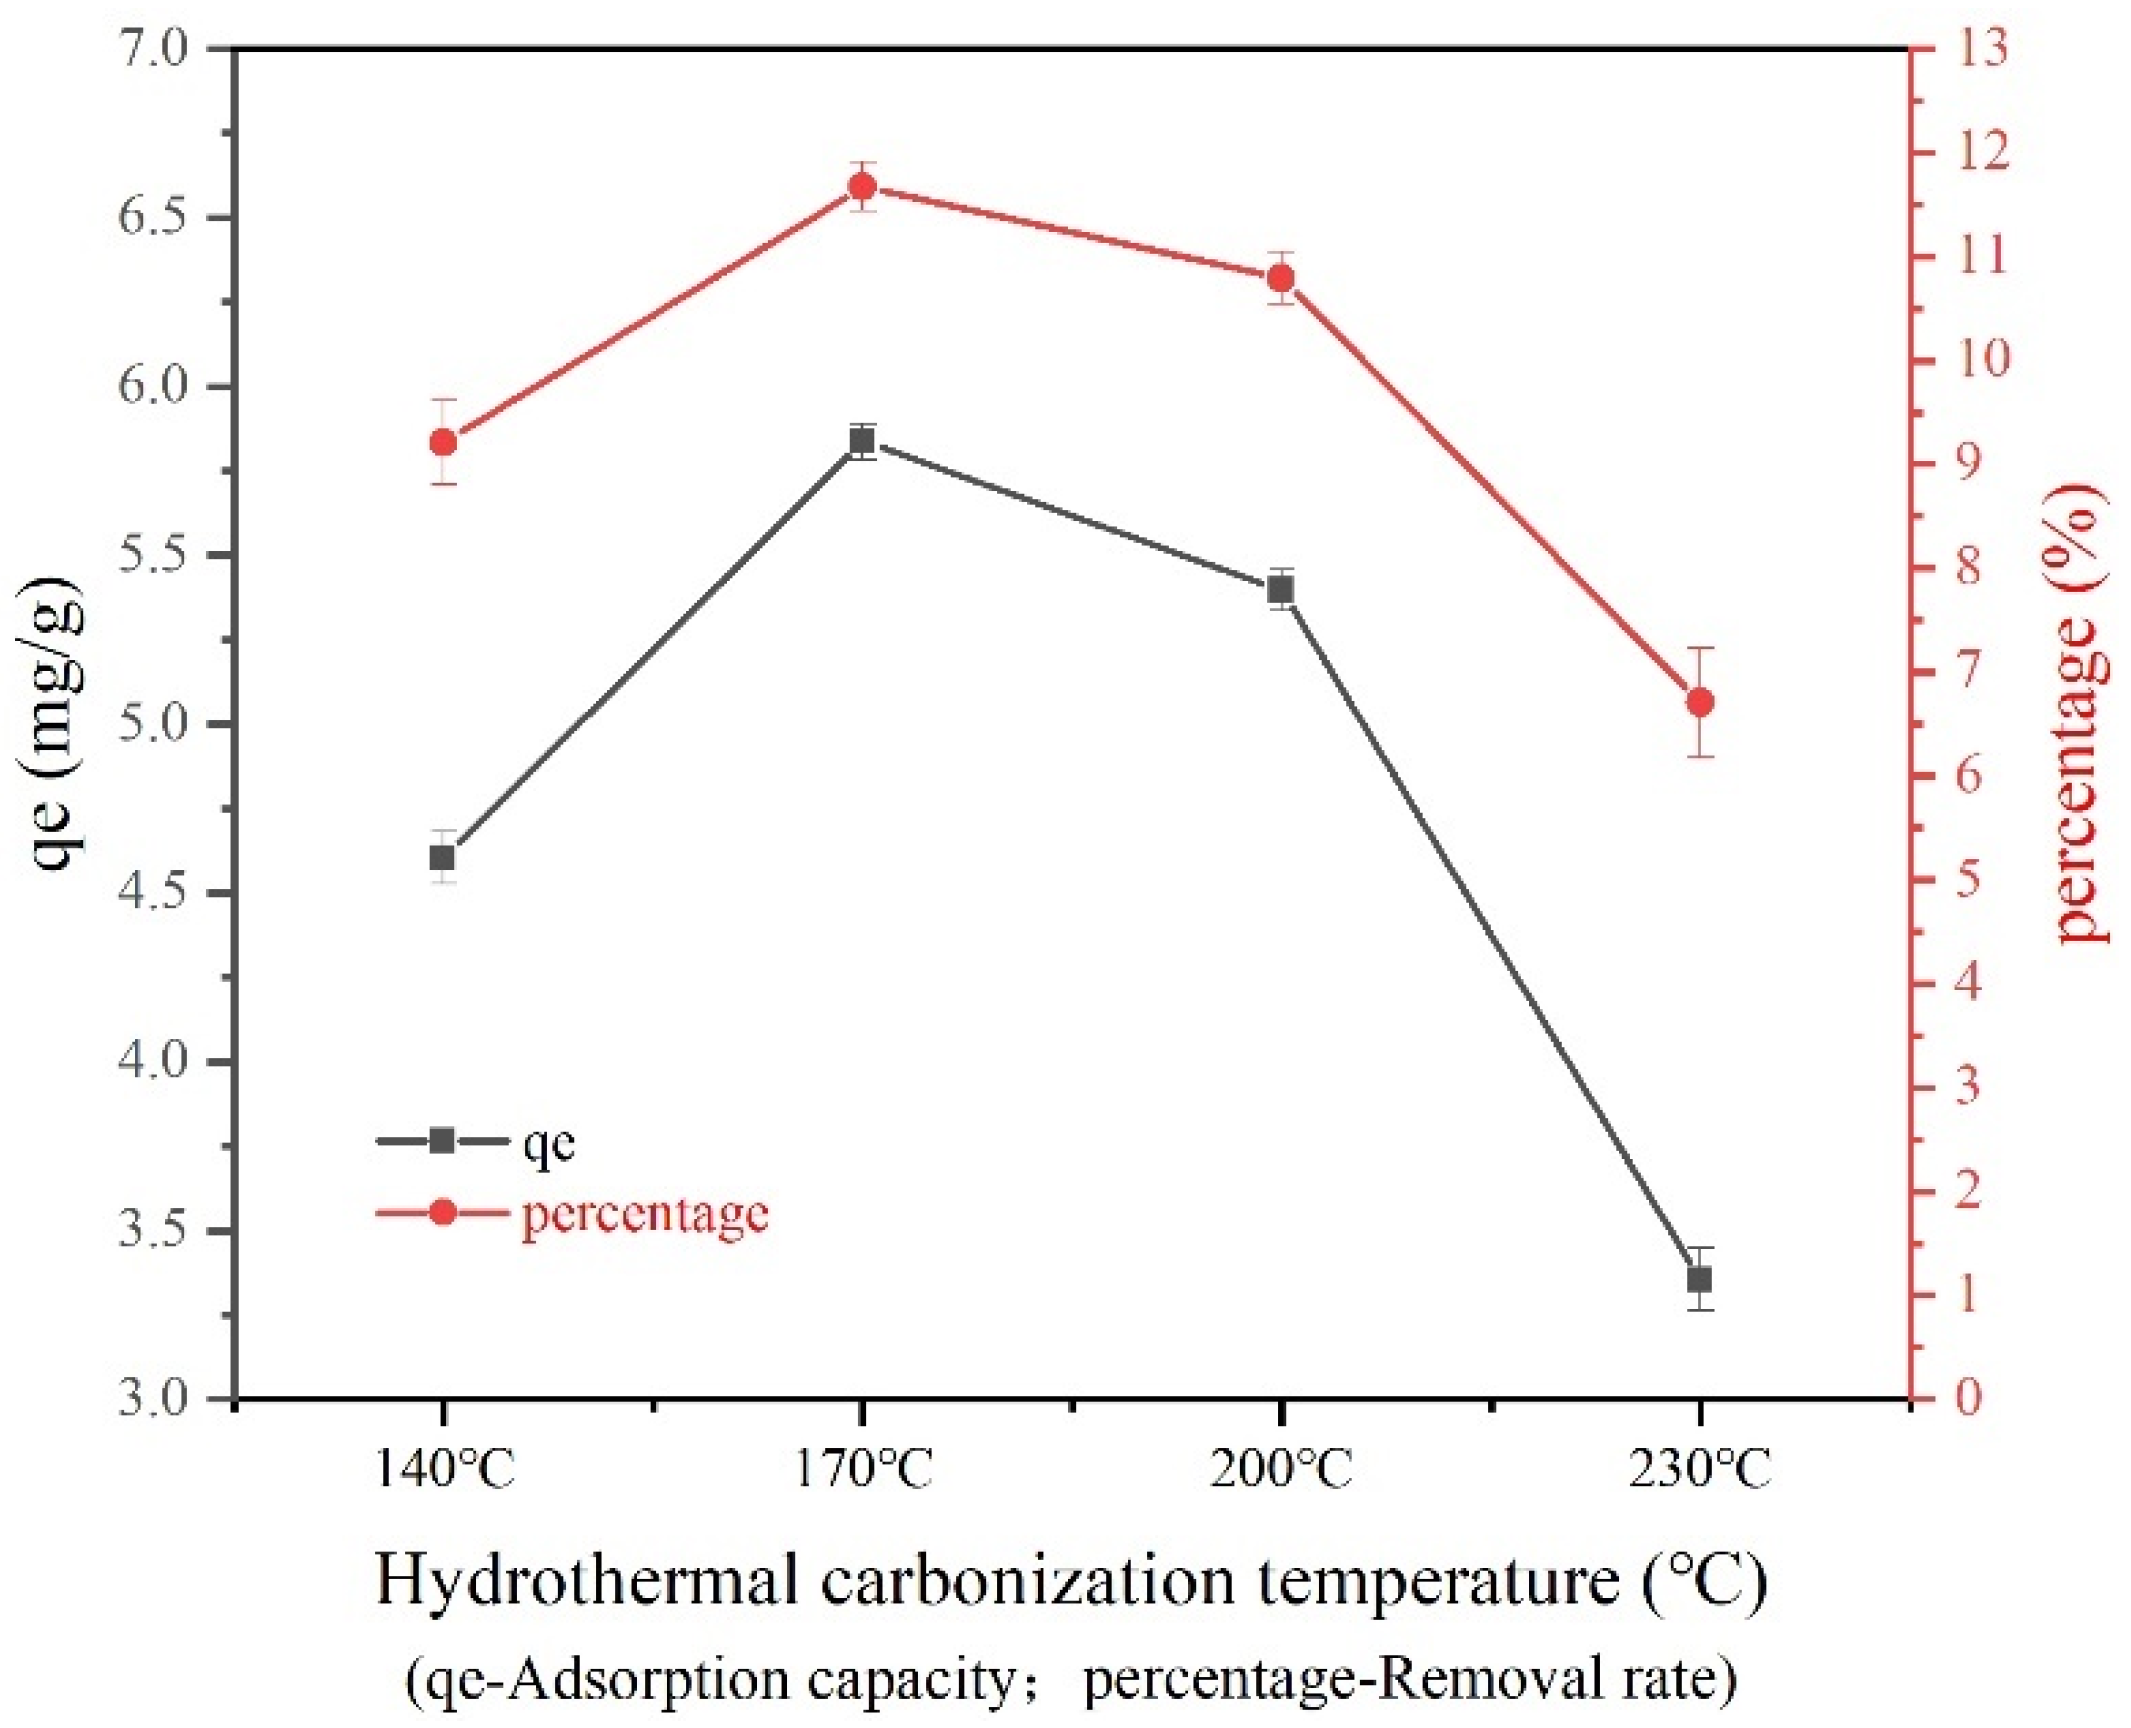
3.2.1. Effect of Hydrothermal Carbonization Temperature

Figure 7 showed the effect of treatment temperature on the adsorption capacity of hydrochar products. The temperature had a great impact on the physical and chemical properties of hydrochar, and the change of temperature would also affect the performance of subsequent hydrochar adsorption of heavy metal ions. It could be seen from the figure that HTC temperature had an important impact on the adsorption capacity of hydrochar. As the HTC temperature increased from 140 °C to 170 °C, the adsorption capacity increased from 4.60 mg/g to 5.84 mg/g, and the adsorption efficiency also increased. Then, the HTC temperature was further increased, and the adsorption capacity decreased to 3.4 mg/g. The reason for this phenomenon was that at a temperature of 140 °C, the straw HTC reaction was not complete, most of the straw did not undergo a hydrolysis reaction, and the corresponding oxygen-containing functional groups were also less. However, with the further increase of the hydrothermal reaction temperature, some physical and chemical properties of the material also began to improve. When the hydrothermal reaction reached a certain level, continuing to increase the temperature was not conducive to the removal of Cd2+. This was because the higher hydrothermal reaction temperature aggravated a series of chemical reactions such as hydrolysis, dehydration, decarboxylation, and polymerization of the material, which caused the hydrochar to lose a large amount of oxygen-containing functional groups, which affected the ability of the material to adsorb Cd2+. In general, too high hydrothermal reaction temperature was not conducive to the removal of Cd2+. The above analysis results showed that at the lower hydrothermal reaction temperature, the generated hydrochar had rich oxygen-containing functional groups (Table 2). The formation of oxygen-containing functional groups improved the removal ability of Cd2+ in the solution to a certain extent.

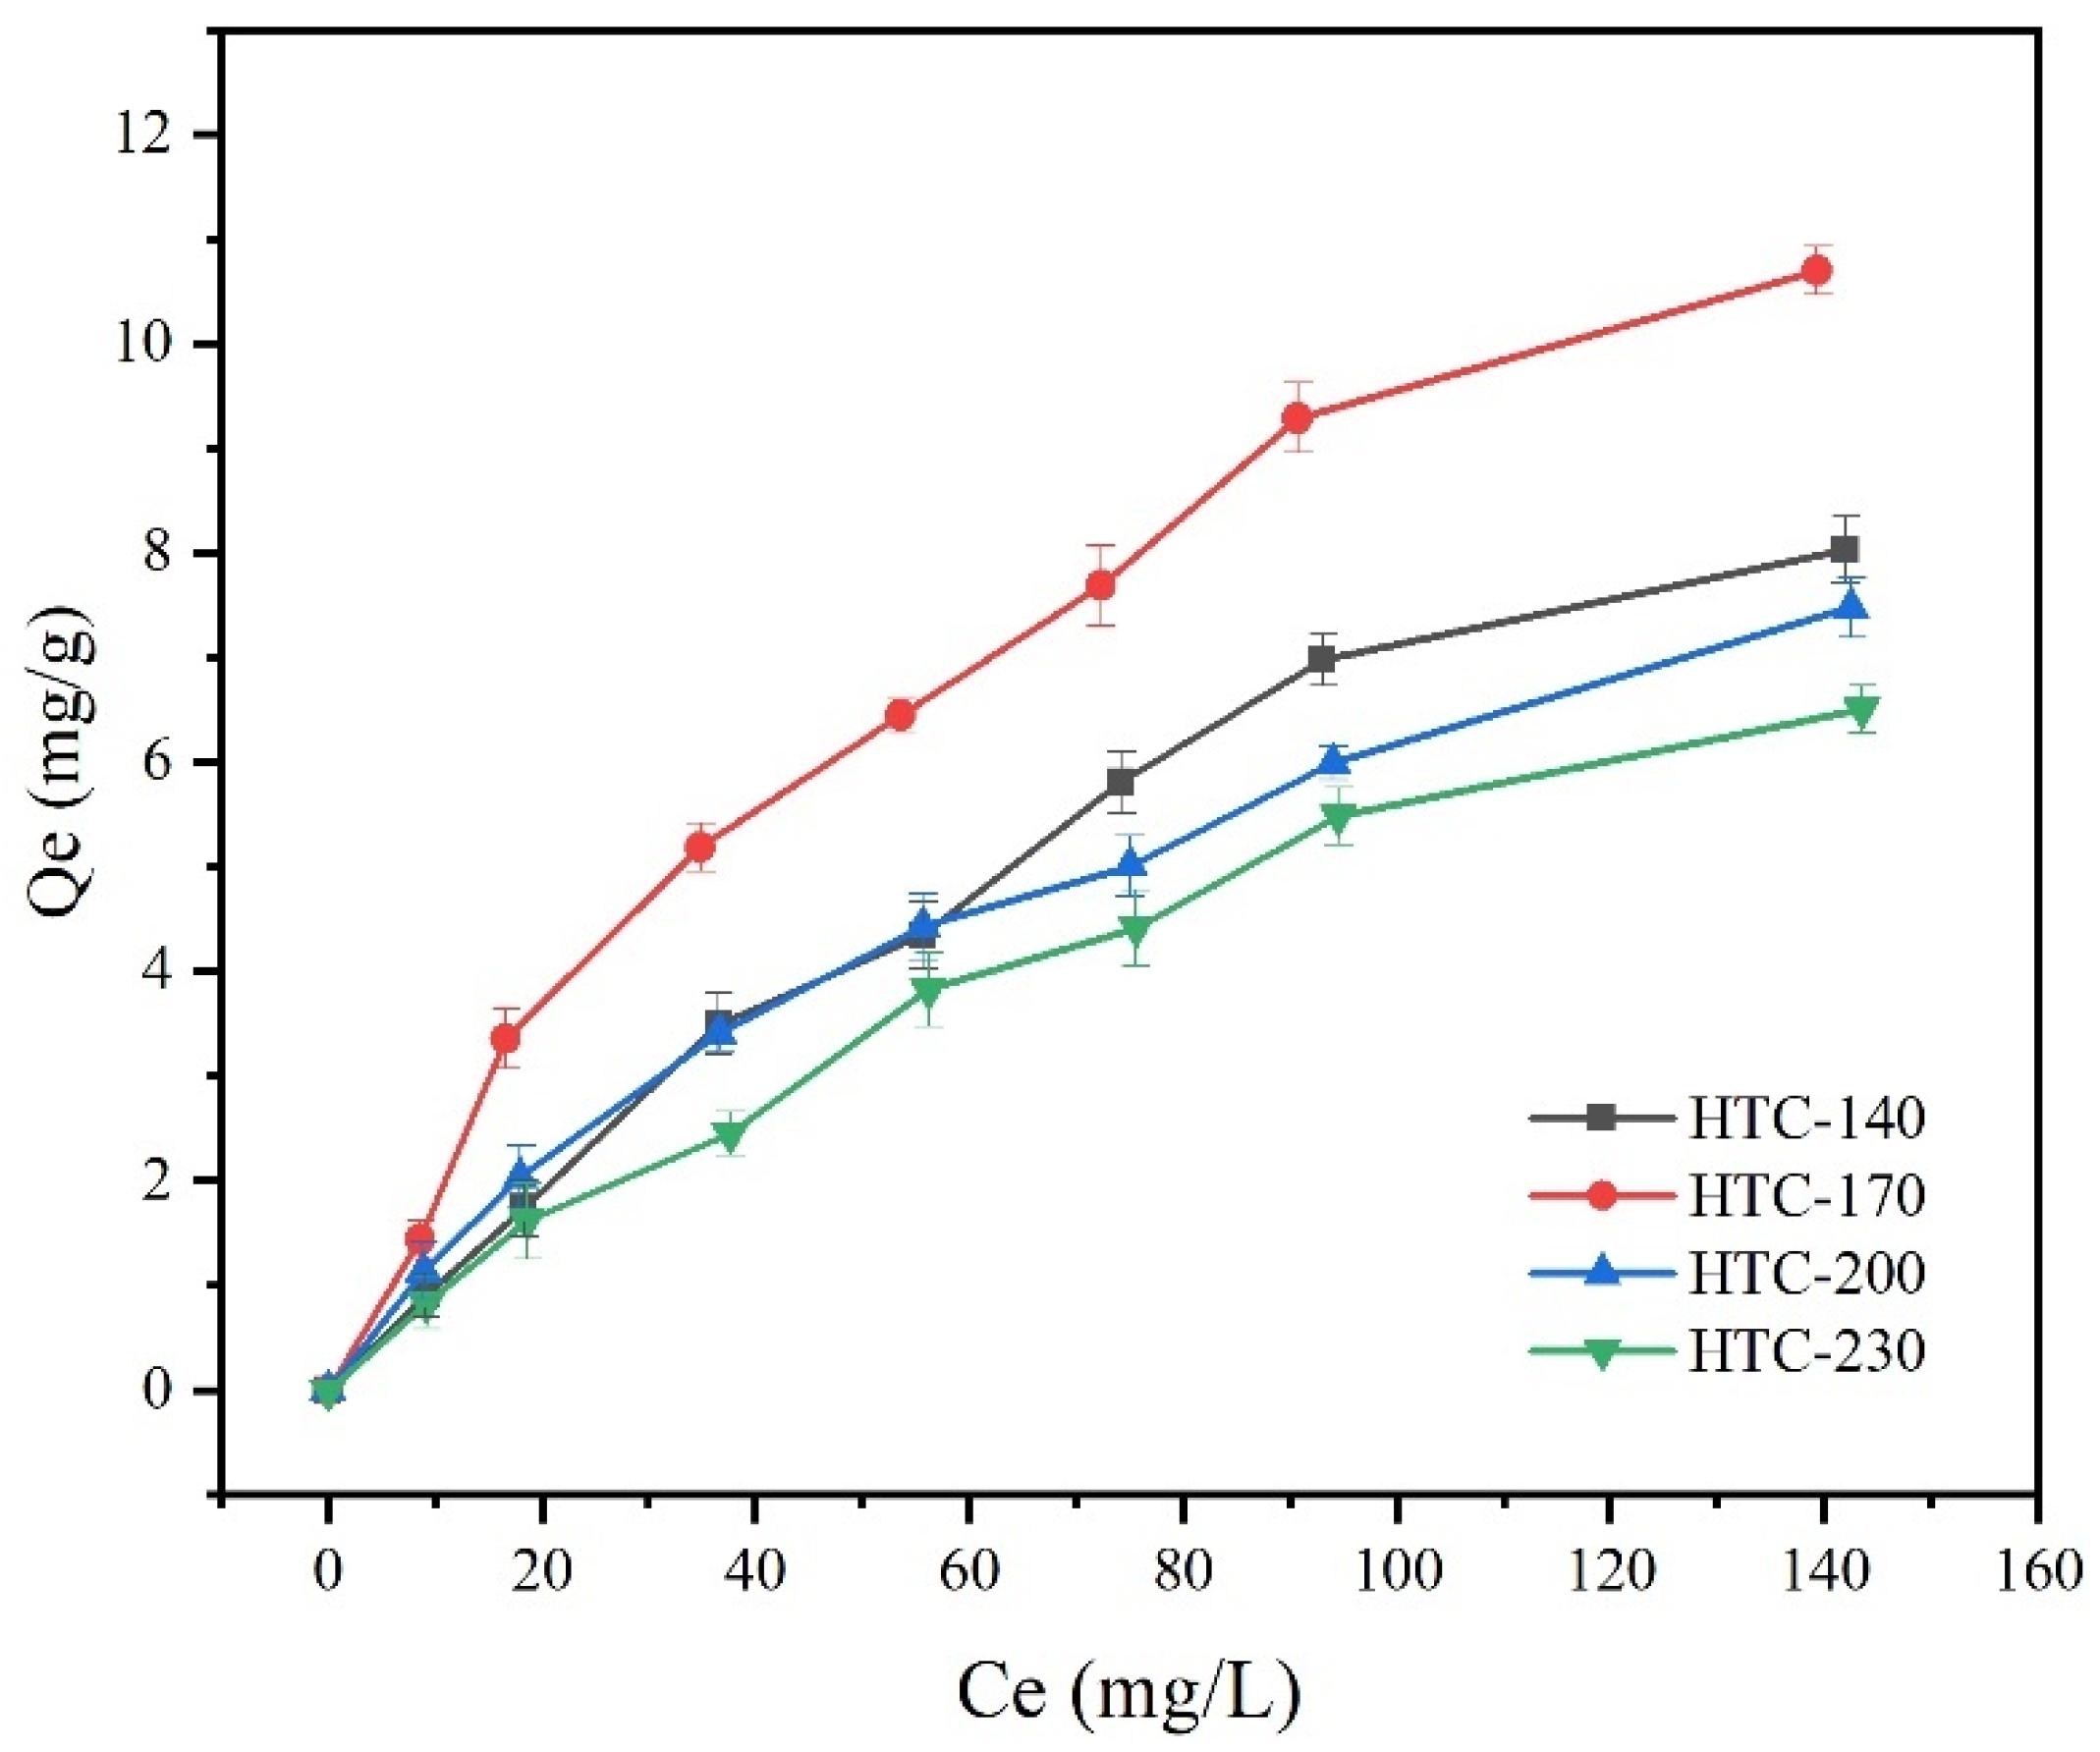
3.2.2. Effect of Initial Solution Concentration

The influence of hydrochar obtained at different temperatures on the equilibrium adsorption of different initial Cd2+ concentrations was shown in Figure 8. It could be found from Figure 8 that the adsorption changing trend of hydrochar to Cd2+ was basically the same. As the initial concentration of Cd2+ in the aqueous solution increased, the amount of hydrochar adsorption also increased. The adsorption performance of hydrochar rose rapidly with the increase of metal ion concentration in the initial lower solution concentration stage, and then rose slowly and tended to equilibrium. When the Cd2+ concentration increased from 100 mg/L to 150 mg/L, the adsorption amount of hydrochar did not increase significantly. It could be considered that starting from 100 mg/L, the adsorption of Cd2+ by the straw hydrochar reached saturation.

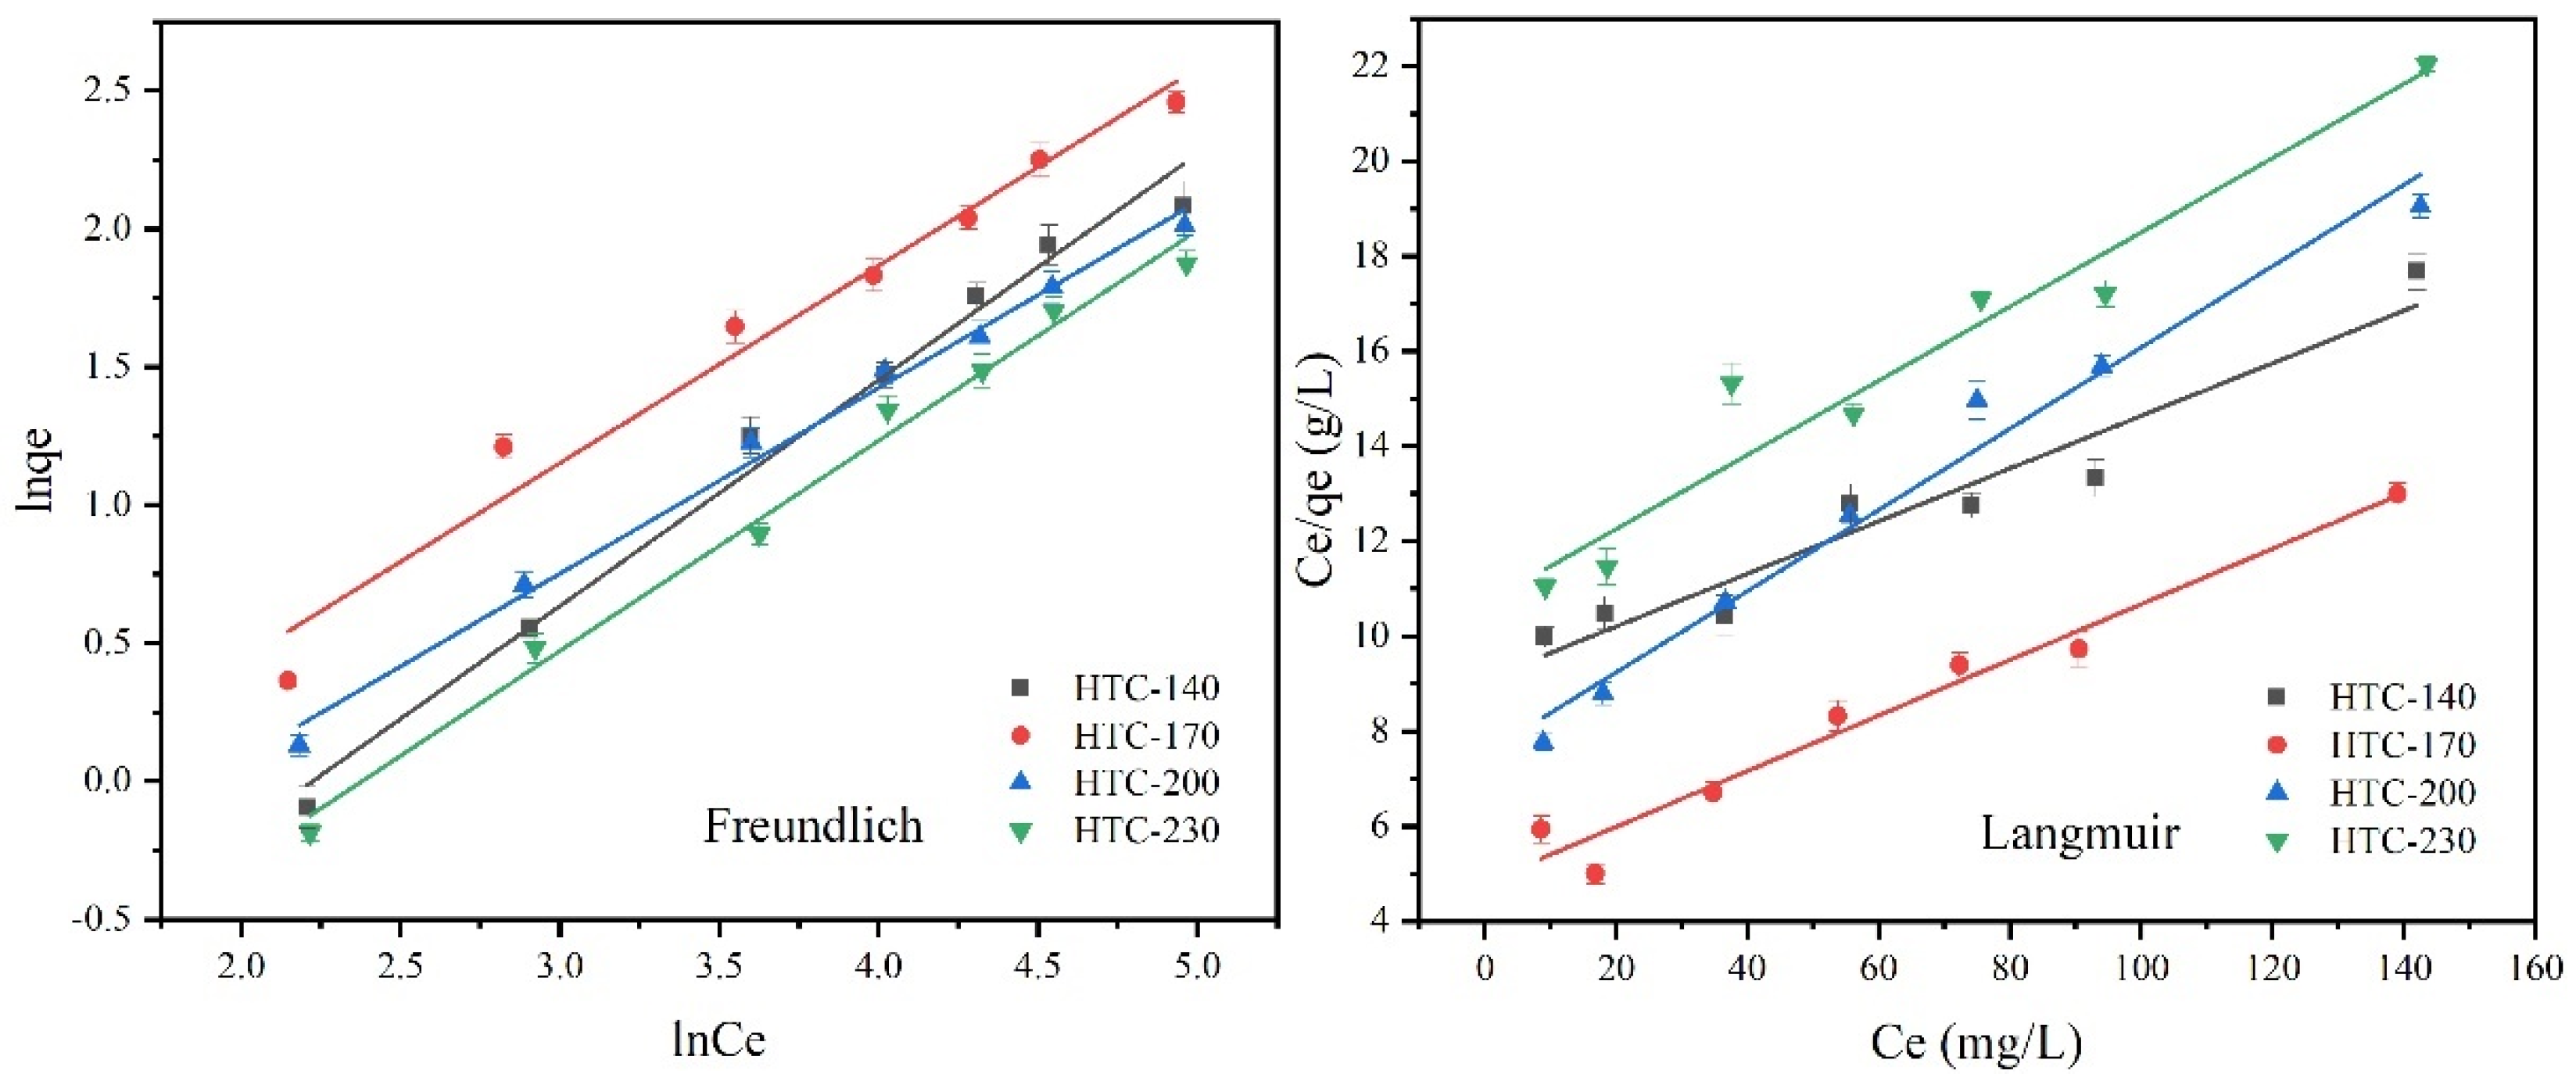
3.2.3. Adsorption Isotherm

The adsorption isotherm equation expresses the relationship between the equilibrium adsorption capacity of the adsorbent and the gas partial pressure or concentration of the adsorbate under isothermal conditions. At a constant temperature, the adsorption phenomenon on the solid surface can be expressed linearly by the Langmuir and Freundlich isotherm adsorption equations. The Langmuir and Freundlich isotherm adsorption equations can be expressed as Equations (1) and (2), respectively [27]:
C e q e = C e q m + 1 K L q m
lnq e = lnK F + 1 n lnC e
where qe (mg/g) is the adsorption capacity at equilibrium, qm (mg/g) is the maximum adsorption capacity of hydrochar, Ce is the adsorbate concentration at equilibrium (mg/L), KL is the Langmuir constant, and KF is the Freundlich equilibrium adsorption constant, n is Freundlich equilibrium adsorption constant.
It could be seen from Figure 9 and Table 3 that the equilibrium adsorption experimental data were consistent with Langmuir and Freundlich models, and the two models fit the adsorption isotherm of Cd2+ by corn straw hydrochar well. It could be found from Table 3 that the correlation coefficients of Freundlich isotherms for different hydrochars were higher than those of Langmuir. The results showed that the Freundlich model was more suitable to describe the adsorption mechanism of Cd2+ by corn straw hydrochar. The Freundlich model was suitable for describing the equivalent adsorption position and could predict that an increase in the concentration of adsorbate would lead to an increase in adsorption capacity [28]. The Freundlich constant n reflected the adsorption capacity, and the value of n was between 1 and 10, indicating that it is beneficial to the adsorption process [28]. In this study, the Freundlich constant n at four temperatures were 1.22 (HTC-140), 1.40 (HTC-170), 1.49 (HTC-200), and 1.32 (HTC-230), respectively, indicating that there was a certain interaction between straw hydrochar and Cd2+.

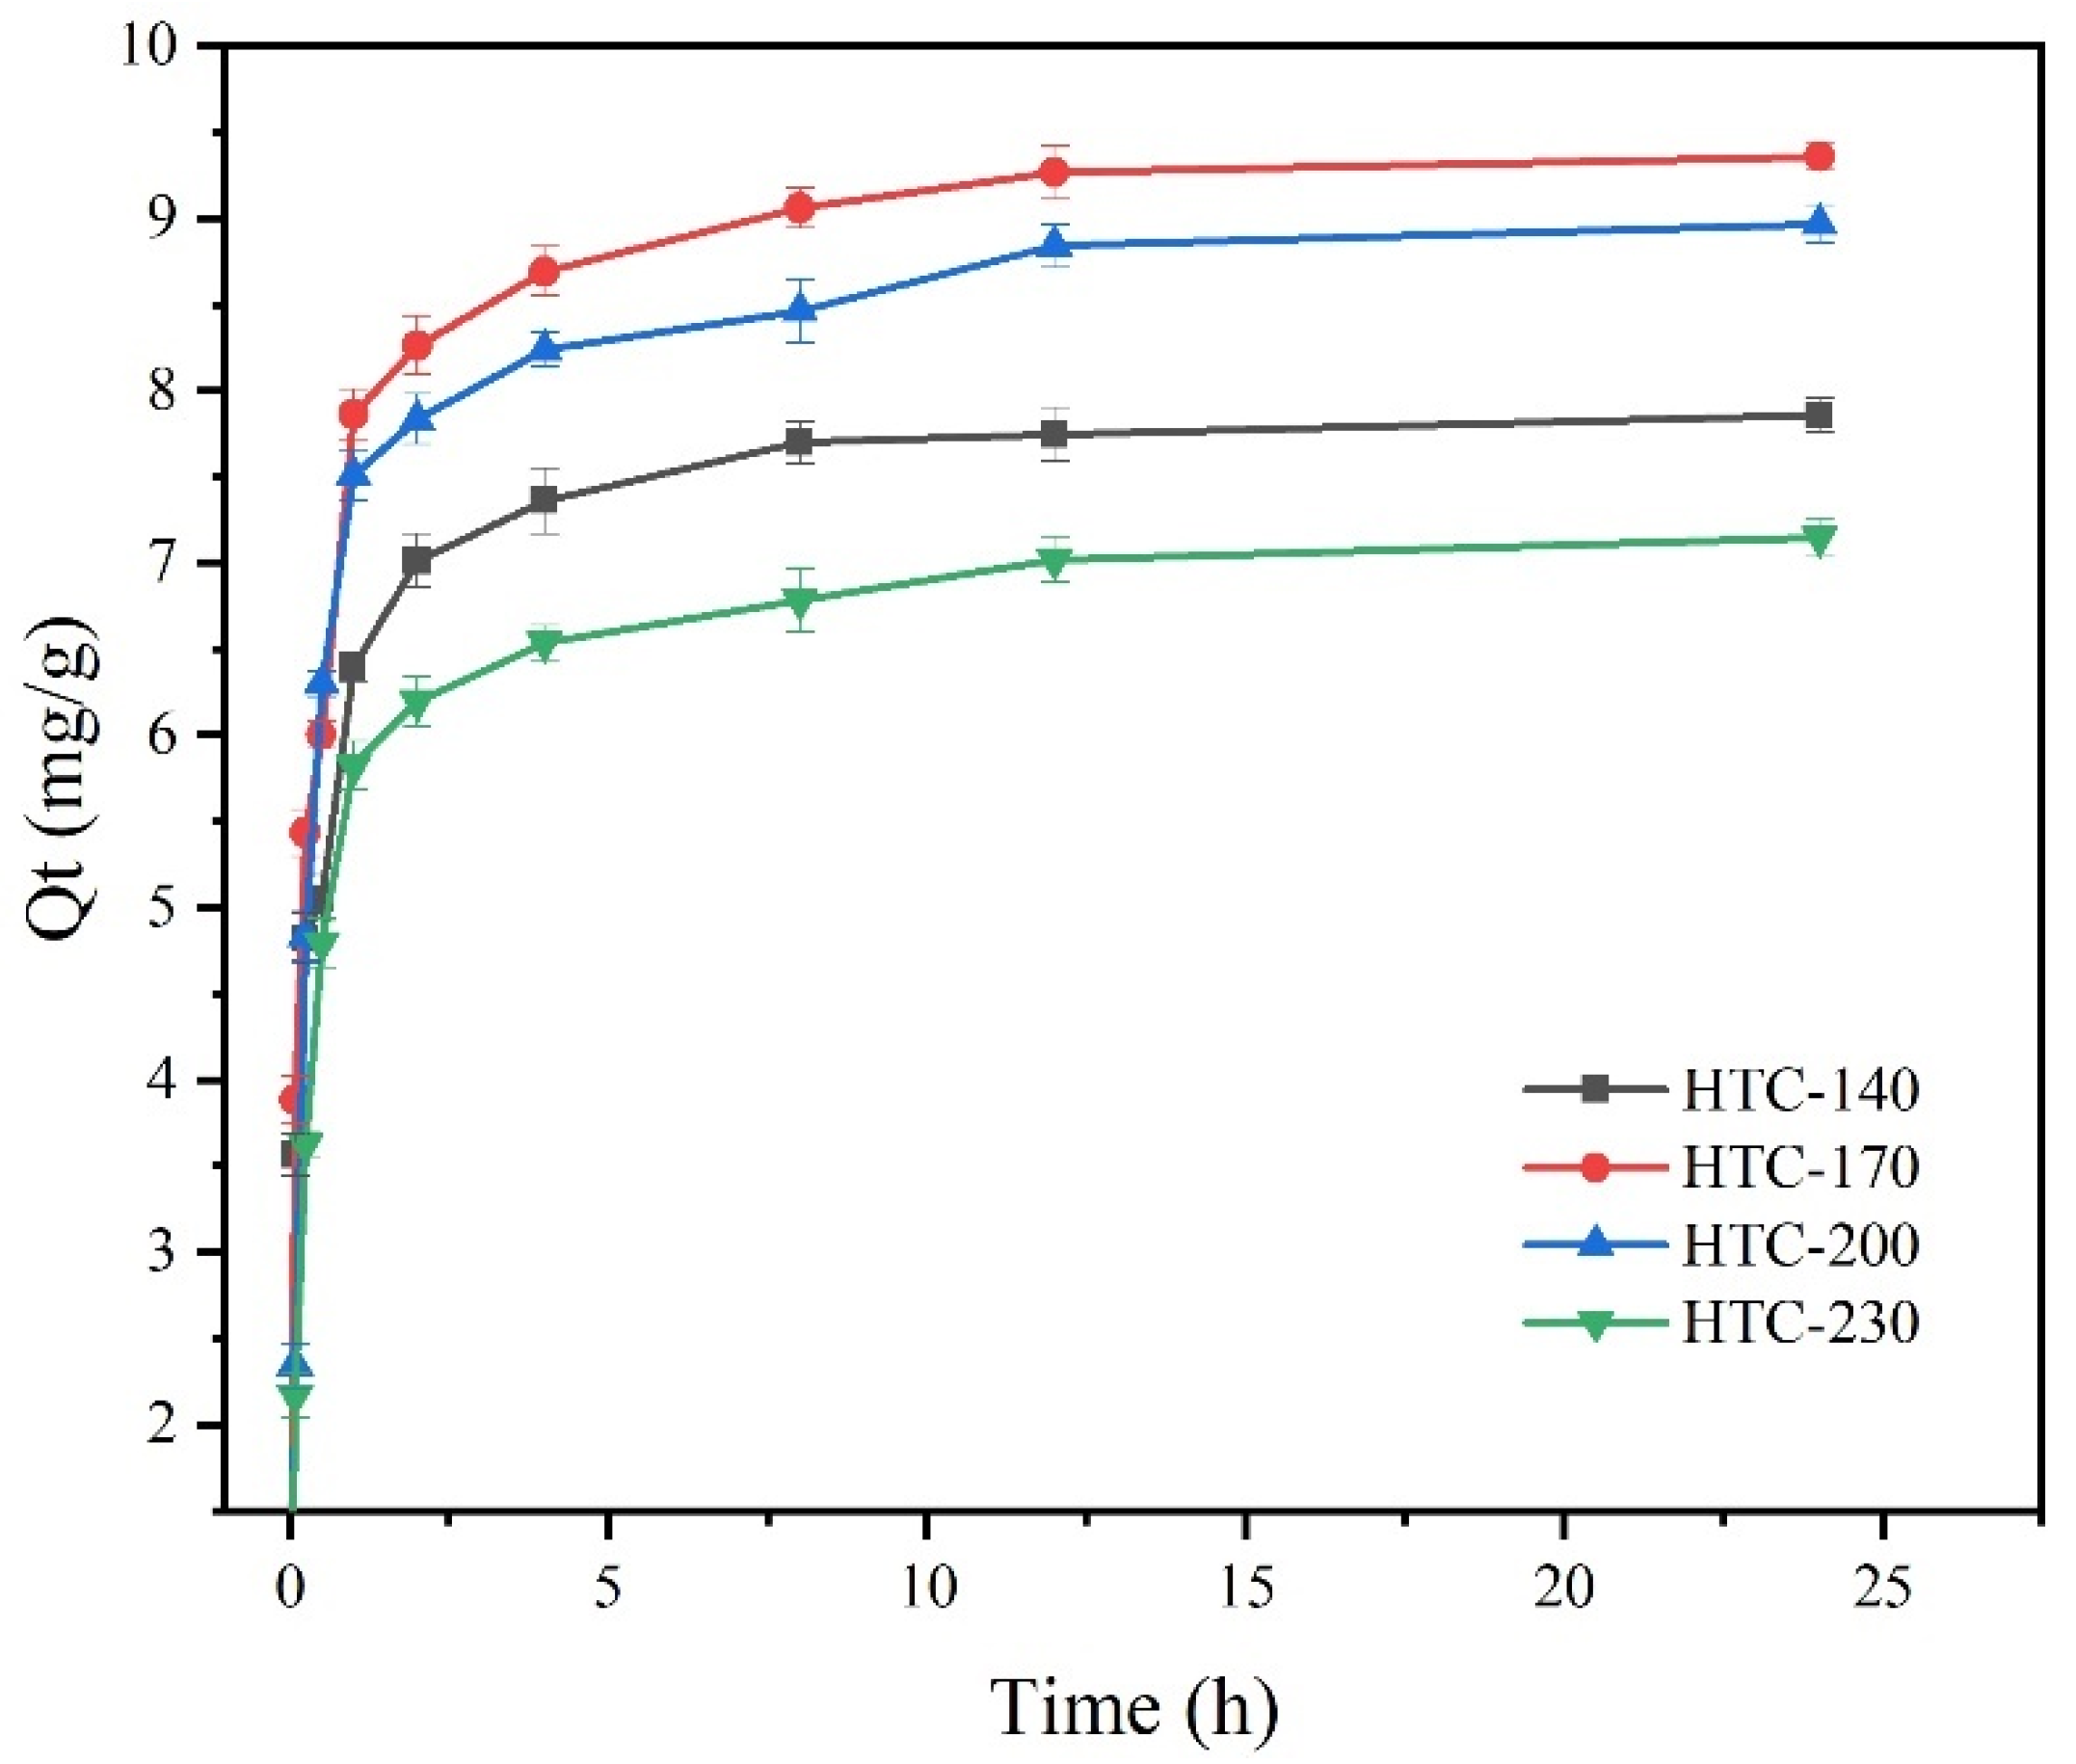
3.2.4. Adsorption Time Influence

Figure 10 showed the curve of the adsorption of Cd2+ by hydrochar over time. It could be seen from Figure 10 that the adsorption capacity of straw hydrochar to Cd2+ increased with time, but the increasing trend gradually became slower. There were two different stages of adsorption, the first stage was 0–6 h. The reaction rate at this stage was relatively fast, basically reaching the Cd2+ adsorption equilibrium within 6 h, and the adsorption at this time mainly occurred on the outer surface of the hydrochar. The outer surface contained a large number of adsorption sites, and Cd2+ was rapidly adsorbed. The adsorption mechanism was considered to be related to physical and chemical adsorption [20]. After that was the second stage, the adsorption was relatively slow. As the adsorption site decreased, the adsorption capacity of the adsorbent surface increased, so that the adsorption rate of Cd2+ decreased, and the adsorption equilibrium was basically reached within 24 h.

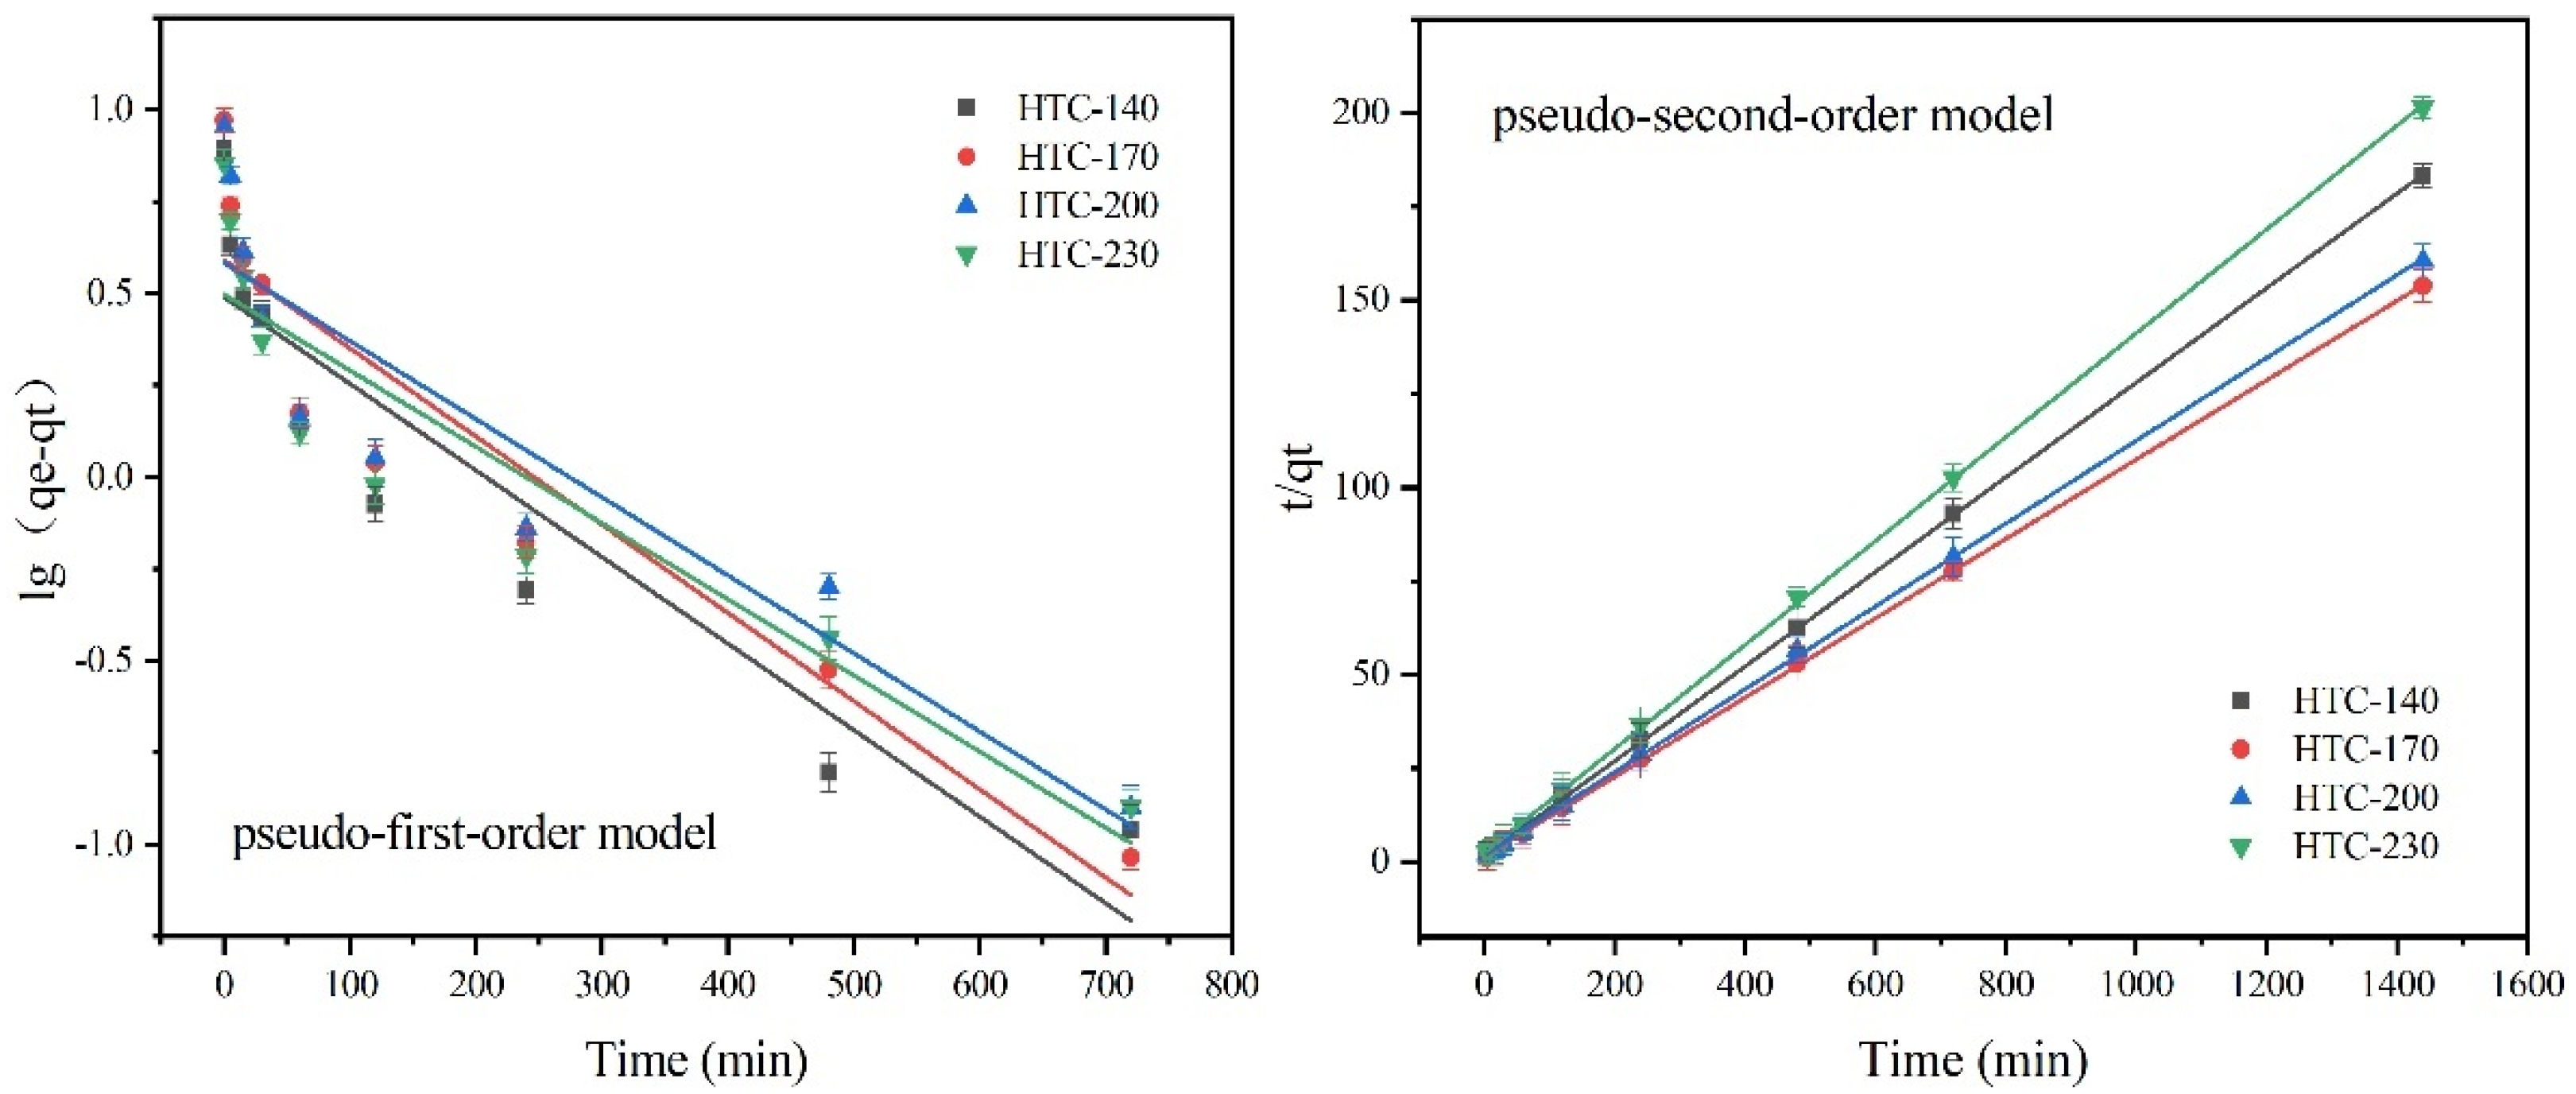
3.2.5. Adsorption Kinetics

The adsorption kinetics reflects the effects of temperature, pressure, concentration, and media on the reaction rate, revealing the adsorption mechanism of the adsorbent. The adsorption process of straw hydrochar to Cd2+ in the solution can be described by pseudo-first-order kinetic equation and pseudo-second-order kinetic equation. The pseudo-first-order kinetics equation and the pseudo-second-order kinetics equation are, respectively, as Equations (4) and (5):
lg ( q e q t ) = lgq e K 1 t 2.303
t q t = 1 K 2 q e 2 + t q e
where qe (mg/g) is the adsorption capacity when the adsorption reaches the adsorption equilibrium, qt (mg/g) is the adsorption capacity of the adsorbent at time t, K1 is the pseudo-first-order kinetic rate constant and K2 is the pseudo-second-order kinetic rate constant.
In order to study the adsorption mechanism of Cd2+ on hydrochar, the pseudo-first-order kinetics model and pseudo-second-order kinetics model was used to fit the kinetic experimental data. The fitting results and adsorption data were shown in Figure 11 and Table 4, respectively.
It could be seen from Table 4 that the correlation coefficients of the four kinds of hydrochar were greater in the pseudo-second-order kinetics than in the pseudo-first-order kinetics. Therefore, the adsorption process of Cd2+ was well fitted by the pseudo-second-order kinetic equation, and the calculated values of equilibrium adsorption capacity qe were (HTC-140 (7.92), HTC-170 (9.44), HTC-200 (9.04), HTC-230 (7.21)), which were closer to the experimental values (HTC-140 (7.86), HTC-170 (9.36), HTC -200 (8.97), HTC-230 (7.15)). The results showed that the adsorption of Cd2+ by corn straw hydrochar was mainly chemical adsorption [20].
According to the above characterization results and adsorption performance of corn straw hydrochar, the schematic diagram as shown in Figure 12 was drawn. Corn straw was initially packed with hemicellulose, cellulose, and lignin, which was slowly dissociated after HTC treatment. With the increase of HTC temperature, the lignocellulose structure of straw began to change. It began to decompose into various sugar monomers, mainly xylan and glucomannan, followed by the cracking of cellulose and lignin [29]. Due to the complex structure of lignin, there was only a small amount of hydrolysis in this process, while cellulose had changed from oligomer to grape and fructose, and further dehydrated and cracked into small molecules [30].
It could be observed from SEM and XRD that the surface structure of hydrochar changes with the change of temperature, and the basic structure has been destroyed. FTIR analysis showed that the hydrochar surface contains rich oxygen-containing functional groups (-COOH, -OH), which formed complexes with Cd2+ on the hydrochar surface, which might be an important reason for the adsorption of Cd2+ by hydrochar, and aromatic C=C and C=O could be used as π-donors [1]. These functional groups on the surface of hydrochar were related to the hydrolysis and decomposition of corn straw and played an important role in the adsorption of Cd2+ in aqueous solution [31]. In addition, the adsorption process also included the surface precipitation of hydroxide ions, because metal ions such as Cd2+ could be adsorbed on the hydrochar surface by hydroxide ions, resulting in surface precipitation [32]. Cation exchange was a common mechanism of hydrochar adsorption of metal ions. Metal ions such as Mg2+, K2+, Ca2+ could exchange Cd2+ [3].

4. Conclusions

A simple one-pot HTC method was used to convert corn straw into hydrochar adsorbent, and the behavior of hydrochar adsorption of Cd2+ was studied. The straw material was converted into 77.56% hydrochar at 140 °C for 2 h. Detection methods such as SEM, FTIR, and BET proved that its surface was porous and had abundant oxygen-containing functional groups (-HO, C-O-C, C=O). The adsorption capacity of the prepared hydrochar for Cd2+ was 5.84 mg/g, and the adsorption process conformed to the pseudo-second-order kinetic model and Freundlich isotherm model. Surface complexation and ion exchange might be the main adsorption mechanism of hydrochar.

Author Contributions

Conceptualization, M.C. and X.X.; methodology, H.L. and Y.S.; validation, L.B. and Y.S.; investigation, H.L. and Y.L.; data curation, H.L. and M.C.; writing—original draft preparation, H.L. and M.C.; writing—review and editing, Y.S.; funding acquisition, L.B., M.C. and X.X. All authors have read and agreed to the published version of the manuscript.

Funding

This work was supported by the National Natural Science Foundation of China (52070088), Jilin Science and Technology Bureau Outstanding Young Talents Training Special Project (No.20200104118), Scientific Research Project of Education Department of Jilin Province (No.JJKH20210263KJ), National Natural Science Foundation of China (52100146), and open fund: Key Laboratory of Songliao Aquatic Environment, Ministry of Education.

Institutional Review Board Statement

Not applicable.

Informed Consent Statement

Not applicable.

Data Availability Statement

Data is contained within the article.

Conflicts of Interest

The authors declare no conflict of interest.

References

  1. Teng, D.; Zhang, B.; Xu, G.; Wang, B.; Mao, K.; Wang, J.; Sun, J.; Feng, X.; Yang, Z.; Zhang, H. Efficient removal of Cd(II) from aqueous solution by pinecone biochar: Sorption performance and governing mechanisms. Environ. Pollut. 2020, 265, 115001. [Google Scholar] [CrossRef] [PubMed]
  2. Bashir, S.; Zhu, J.; Fu, Q.; Hu, H. Comparing the adsorption mechanism of Cd by rice straw pristine and KOH-modified biochar. Environ. Sci. Pollut. Res. 2018, 25, 11875–11883. [Google Scholar] [CrossRef] [PubMed]
  3. Gao, L.-Y.; Deng, J.-H.; Huang, G.-F.; Li, K.; Cai, K.-Z.; Liu, Y.; Huang, F. Relative distribution of Cd2+ adsorption mechanisms on biochars derived from rice straw and sewage sludge. Bioresour. Technol. 2019, 272, 114–122. [Google Scholar] [CrossRef] [PubMed]
  4. Ihsanullah, A.; Abbas, A.; Al-Amer, A.M.; Laoui, T.; Al-Marri, M.J.; Nasser, M.S.; Khraisheh, M.; Atieh, M.A. Heavy metal removal from aqueous solution by advanced carbon nanotubes: Critical review of adsorption applications. Sep. Purif. Technol. 2016, 157, 141–161. [Google Scholar] [CrossRef]
  5. Li, Y.; Tsend, N.; Li, T.; Liu, H.; Yang, R.; Gai, X.; Wang, H.; Shan, S. Microwave assisted hydrothermal preparation of rice straw hy-drochars for adsorption of organics and heavy metals. Bioresour. Technol. 2019, 273, 136–143. [Google Scholar] [CrossRef]
  6. Belmonte, B.A.; Benjamin, M.F.D.; Tan, R.R. Bi-objective optimization of biochar-based carbon management networks. J. Clean. Prod. 2018, 188, 911–920. [Google Scholar] [CrossRef]
  7. De Blasio, C. Notions of biomass gasification. In Green Energy and Technology; Springer: Berlin/Heidelberg, Germany, 2019; pp. 307–334. [Google Scholar] [CrossRef]
  8. Krylova, A.Y.; Gorlov, E.G.; Shumovskii, A.V. Production of Biocoal by the Pyrolysis of Biomass. Solid Fuel Chem. 2019, 53, 369–376. [Google Scholar] [CrossRef]
  9. Liu, Y.; Ma, S.; Chen, J. A novel pyro-hydrochar via sequential carbonization of biomass waste: Preparation, characterization and adsorption capacity. J. Clean. Prod. 2018, 176, 187–195. [Google Scholar] [CrossRef]
  10. Lei, Y.; Su, H.; Tian, R. Morphology evolution, formation mechanism and adsorption properties of hydrochars prepared by hy-drothermal carbonization of corn stalk. RSC Adv. 2016, 6, 107829–107835. [Google Scholar] [CrossRef]
  11. Huang, K.; Cai, Y.; Du, Y.; Song, J.; Mao, H.; Xiao, Y.; Wang, Y.; Yang, N.; Wang, H.; Han, L. Adsorption of Pb(II) in Aqueous Solution by the Modified Biochar Derived from Corn Straw with Magnesium Chloride. Nat. Environ. Pollut. Technol. 2020, 19, 1273–1278. [Google Scholar] [CrossRef]
  12. Ren, H.; Cunha, E.; Sun, Q. Surface functionality analysis by Boehm titration of graphene nanoplatelets functionalized via a solvent-free cycloaddition reaction. Nanoscale Adv. 2019, 1, 1432–1441. [Google Scholar] [CrossRef] [Green Version]
  13. Qiao, Y.; He, C.; Zhang, C.; Jiang, C.; Yi, K.; Li, F. Comparison of Adsorption of Biochar from Agricultural Wastes on Methylene Blue and Pb2+. BioResources 2019, 14, 9766–9780. [Google Scholar] [CrossRef]
  14. Rasam, S.; Moraveji, M.K.; Soria-Verdugo, A.; Salimi, A. Synthesis, characterization and absorbability of Crocus sativus petals hydrothermal carbonized hydrochar and activated hydrochar. Chem. Eng. Process. Process. Intensif. 2021, 159, 108236. [Google Scholar] [CrossRef]
  15. Chen, G.; Wang, C.; Tian, J.; Liu, J.; Ma, Q.; Liu, B.; Li, X. Investigation on cadmium ions removal from water by different raw mate-rials-derived biochars. J. Water Process. Eng. 2020, 35, 101223. [Google Scholar] [CrossRef]
  16. Krysanova, K.; Krylova, A.; Zaichenko, V. Properties of biochar obtained by hydrothermal carbonization and torrefaction of peat. Fuel 2019, 256, 115929. [Google Scholar] [CrossRef]
  17. Li, X.; Wang, C.; Tian, J.; Liu, J.; Chen, G. Comparison of adsorption properties for cadmium removal from aqueous solution by Enteromorpha prolifera biochar modified with different chemical reagents. Environ. Res. 2020, 186, 109502. [Google Scholar] [CrossRef] [PubMed]
  18. Zhang, L.; Tan, J.; Xing, G.; Dou, X.; Guo, X. Cotton stalk-derived hydrothermal carbon for methylene blue dye removal: Investigation of the raw material plant tissues. Bioresour. Bioprocess. 2021, 8, 10. [Google Scholar] [CrossRef]
  19. PetroviĿ, J.; PerišiĿ, N.; MaksimoviĿ, J.D.; MaksimoviĿ, V.; KragoviĿ, M.; StojanoviĿ, M.; LauševiĿ, M.; MihajloviĿ, M. Hydrothermal conversion of grape pomace: Detailed characterization of obtained hydrochar and liquid phase. J. Anal. Appl. Pyrolysis. 2016, 118, 267–277. [Google Scholar] [CrossRef]
  20. Xian, Y.; Wu, J.; Yang, G.; Liao, R.; Zhang, X.; Peng, H.; Yu, X.; Shen, F.; Li, L.; Wang, L. Adsorption characteristics of Cd(ii) in aqueous solutions using spent mushroom substrate biochars produced at different pyrolysis temperatures. RSC Adv. 2018, 8, 28002–28012. [Google Scholar] [CrossRef] [Green Version]
  21. Liu, L.; Cai, W.; Dang, C.; Han, B.; Chen, Y.; Yi, R.; Fan, J.; Zhou, J.; Wei, J. One-step vapor-phase assisted hydrothermal synthesis of functionalized carbons: Effects of surface groups on their physicochemical properties and adsorption performance for Cr(VI). Appl. Surf. Sci. 2020, 528, 146984. [Google Scholar] [CrossRef]
  22. Zhou, N.; Chen, H.; Xi, J.; Yao, D.; Zhou, Z.; Tian, Y.; Lu, X. Biochars with excellent Pb(II) adsorption property produced from fresh and dehydrated banana peels via hydrothermal carbonization. Bioresour. Technol. 2017, 232, 204–210. [Google Scholar] [CrossRef] [PubMed]
  23. Wang, B.; Yu, J.; Liao, H.; Zhu, W.; Ding, P.; Zhou, J. Adsorption of Lead (II) from Aqueous Solution with High Efficiency by Hy-drothermal Biochar Derived from Honey. Int. J. Environ. Res. Public Health 2020, 17, 3441. [Google Scholar] [CrossRef]
  24. Liu, T.T.; Li, Y.; Peng, N.N.; Lang, Q.Q.; Xia, Y.; Gai, C.; Zheng, Q.F.; Liu, Z.G. Heteroatoms doped porous carbon derived from hydrothermally treated sewage sludge: Structural characterization and environmental application. J. Environ. Manag. 2017, 97, 151–158. [Google Scholar] [CrossRef] [PubMed]
  25. Shu, D.; Liu, J.; Chi, Y.; Chen, S.; Liu, J.; Wang, F.; Jiang, X. Adsorption Characterization and Activation Behavior of Biomass Chars Produced by Hydrothermal Carbonization. J. Biobased Mater. Bioenergy 2017, 11, 568–576. [Google Scholar] [CrossRef]
  26. Kang, C.; Zhu, L.; Wang, Y.; Wang, Y.; Xiao, K.; Tian, T. Adsorption of Basic Dyes Using Walnut Shell-based Biochar Produced by Hydrothermal Carbonization. Chem. Res. Chin. Univ. 2018, 34, 622–627. [Google Scholar] [CrossRef]
  27. Sun, Y.; Liu, C.; Zan, Y.; Miao, G.; Wang, H.; Kong, L. Hydrothermal Carbonization of Microalgae (Chlorococcum sp.) for Porous Carbons With High Cr(VI) Adsorption Performance. Appl. Biochem. Biotechnol. 2018, 186, 414–424. [Google Scholar] [CrossRef] [PubMed]
  28. Zhang, X.; Zhang, L.; Li, A. Eucalyptus sawdust derived biochar generated by combining the hydrothermal carbonization and low concentration KOH modification for hexavalent chromium removal. J. Environ. Manag. 2018, 206, 989–998. [Google Scholar] [CrossRef] [PubMed]
  29. Wang, T.; Zhai, Y.; Zhu, Y.; Li, C.; Zeng, G. A review of the hydrothermal carbonization of biomass waste for hydrochar formation: Process conditions, fundamentals, and physicochemical properties. Renew. Sustain. Energy Rev. 2018, 90, 223–247. [Google Scholar] [CrossRef]
  30. Khan, N.; Mohan, S.; Dinesha, P. Regimes of hydrochar yield from hydrothermal degradation of various lignocellulosic biomass: A review. J. Clean. Prod. 2021, 288, 125629. [Google Scholar] [CrossRef]
  31. Jian, X.; Zhuang, X.; Li, B.; Xu, X.; Wei, Z.; Song, Y.; Jiang, E. Comparison of characterization and adsorption of biochars produced from hydrothermal carbonization and pyrolysis. Environ. Technol. Innov. 2018, 10, 27–35. [Google Scholar] [CrossRef]
  32. Wang, S.; Kwak, J.-H.; Islam, S.; Naeth, M.A.; El-Din, M.G.; Chang, S.X. Biochar surface complexation and Ni(II), Cu(II), and Cd(II) adsorption in aqueous solutions depend on feedstock type. Sci. Total. Environ. 2020, 712, 136538. [Google Scholar] [CrossRef] [PubMed]
Figure 1. Schematic diagram showing the preparation of hydrochar.
Energies 14 08503 g001
Figure 2. The sample changes of corn straw after the hydrothermal reaction.
Energies 14 08503 g002
Figure 3. XRD patterns of CS and hydrochar.
Energies 14 08503 g003
Figure 4. Van Krevelen diagram (a) and SEM images of CS (b), HTC-140 (c), HTC-170 (d), HTC-200 (e) and HTC-230 (f).
Energies 14 08503 g004
Figure 5. FTIR spectra of CS and hydrochar at different temperatures.
Energies 14 08503 g005
Figure 6. N2 adsorption-desorption isotherms (a) and pore size distributions (b) of CS and hydrochar.
Energies 14 08503 g006
Figure 7. Effect of hydrothermal temperature on removal efficiency and adsorption capacity of Cd2+.
Energies 14 08503 g007
Figure 8. Effect of initial solution concentration on Cd2+ adsorption by hydrochar.
Energies 14 08503 g008
Figure 9. Sorption isotherms of Cd2+ by hydrochar.
Energies 14 08503 g009
Figure 10. The effect of adsorption time on the adsorption of Cd2+.
Energies 14 08503 g010
Figure 11. Adsorption kinetics of Cd2+ on the hydrochar.
Energies 14 08503 g011
Figure 12. HTC process of corn straw and mechanism of adsorption of Cd2+.
Energies 14 08503 g012
Table 1. Elemental analysis of CS and hydrochar.
SamplesComposition (wt%)
CHNAshO *H/CO/CMass Yield
CS42.695.901.5015.3534.561.660.61
HTC-14043.805.851.3415.5433.471.600.5777.56
HTC-17045.775.781.4415.0032.011.520.5264.27
HTC-20047.635.361.3914.2431.381.350.4957.83
HTC-23048.515.031.7318.5126.221.240.4147.90
* % O = 100% − (%C + %N + %H + %ash).
Table 2. Summary of properties for CS and hydrochar.
PropertiesCSHTC-140HTC-170HTC-200HTC-230
BET surface Area (m2/g)1.4582.2303.6377.2368.497
Pore Diameter (nm)3.8147.6724.3013.0613.786
Pore volume (cm3/g)0.0120.0140.0150.0170.040
Acidic (mmol/g)-2.0543.1812.8252.405
Carboxyl (mmol/g)-0.7521.3931.2460.789
Phenolic (mmol/g)-0.3920.8930.7760.339
Lactone (mmol/g)-0.8131.2771.0100.895
Table 3. Parameters of adsorption isotherm model for Cd2+ adsorption hydrochar.
AdsorbentThe Langmuir ModelThe Freundlich Model
qmKLR2KFnR2
HTC-14018.050.00610.92320.16261.220.9834
HTC-17017.090.01210.96110.37121.400.9668
HTC-20011.700.01130.97640.28261.490.9916
HTC-23012.810.00730.93450.16401.320.9886
Table 4. Kinetic parameters for the adsorption of Cd2+ on the hydrochar.
AdsorbentPseudo-First-Order ModelPseudo-Second-Order Model
qeK1R2qeK2R2
HTC-1403.090.00540.84677.920.00940.99993
HTC-1703.900.00550.87549.440.00730.99990
HTC-2003.830.00490.81929.040.00640.99976
HTC-2303.150.00480.83377.210.00770.99981
Publisher’s Note: MDPI stays neutral with regard to jurisdictional claims in published maps and institutional affiliations.

