Article

The Effect of Anode Material on the Performance of a Hydrogen Producing Microbial Electrolysis Cell, Operating with Synthetic and Real Wastewaters

by
Ilias Apostolopoulos
1,2,
Georgios Bampos
1,2,
Amaia Soto Beobide
1,
Stefanos Dailianis
3,
George Voyiatzis
1,
Symeon Bebelis
2,
Gerasimos Lyberatos
1,4 and
Georgia Antonopoulou
1,*
1
Institute of Chemical Engineering Sciences, Platani, GR 26504 Patras, Greece
2
Department of Chemical Engineering, University of Patras, GR 26500 Patras, Greece
3
Department of Biology, Section of Animal Biology, University of Patras, GR 26500 Patras, Greece
4
School of Chemical Engineering, National Technical University of Athens, GR 15780 Athens, Greece
*
Author to whom correspondence should be addressed.
Energies 2021, 14(24), 8375; https://doi.org/10.3390/en14248375
Submission received: 10 November 2021 / Revised: 6 December 2021 / Accepted: 9 December 2021 / Published: 12 December 2021
(This article belongs to the Special Issue Biological Processes in the Green Hydrogen Value Chain)

Abstract

:
The aim of the study was to assess the effect of anode materials, namely a carbon nanotube (CNT)-buckypaper and a commercial carbon paper (CP) on the performance of a two-chamber microbial electrolysis cell (MEC), in terms of hydrogen production and main electrochemical characteristics. The experiments were performed using both acetate-based synthetic wastewater and real wastewater, specifically the effluent of a dark fermentative hydrogenogenic reactor (fermentation effluent), using cheese whey (CW) as substrate. The results showed that CP led to higher hydrogen production efficiency and current density compared to the CNT-buckypaper anode, which was attributed to the better colonization of the CP electrode with electroactive microorganisms, due to the negative effects of CNT-based materials on the bacteria metabolism. By using the fermentation effluent as substrate, a two-stage process is developed, where dark fermentation (DF) of CW for hydrogen production occurs in the first step, while the DF effluent is used as substrate in the MEC, in the second step, to further increase hydrogen production. By coupling DF-MEC, a dual environmental benefit is provided, combining sustainable bioenergy generation together with wastewater treatment, a fact that is also reinforced by the toxicity data of the current study.

1. Introduction

The microbial electrolysis cell (MEC) is a new bio-electrochemical reactor that takes advantage of the metabolism/respiration of a specific group of microorganisms, called exoelectrogens, towards hydrogen production [1,2]. The electrons needed for hydrogen generation in this system can be obtained by using renewable resources, such as organic wastes/wastewaters as substrates, accomplishing energy recovery, in the form of hydrogen, as well as wastewater treatment [3].
A MEC is a similar device to the traditional microbial fuel cell (MFC), with the difference that consists of a hermetically sealed cathode, where hydrogen is produced, and also requires an external voltage (at least 0.11 V), which theoretically needs to be supplied to overcome the thermodynamic barrier [3,4]. In practice, due to the system overpotentials, a much higher voltage is commonly required [5], which in all cases is considerably lower than the respective required for water electrolysis (1.23 V), under standard conditions [6].
In general, a MEC consists of an anode and a cathode, typically separated by a membrane. At the anode, exoelectrogens, forming an electro-active biofilm, oxidize the organic substrates and use the electrode as a direct electron acceptor. The electrons pass, to the cathode, via an external circuit, where they react with hydrogen cations (migrating from the anode) that get reduced to form hydrogen gas. The electrochemical performance of the MEC, and thus hydrogen production efficiency, is highly affected by the abiotic and biotic characteristics of the system and their interactions. The electrodes’ characteristics, such as conductivity, biocompatibility, structure and active surface area, are among the crucial factors which determine the transfer of electrons at both electrodes, influencing the redox reactions which take place there [7]. Although the cathode limitations are significant [8,9,10], the anode characteristics contribute also significantly to the overall MEC performance [11]. Along this line, research efforts have been done for improving the electro-catalytic properties of the anode materials, so as to overcome the anode limitations and realize the practical application of MECs.
Similar to MFCs, in the majority of MECs systems carbon-based materials, such as carbon cloth (CC), carbon paper (CP) and graphite granules (GG), are commonly used as anodic electrodes, thanks to their biocompatibility with exoelectrogens, high electrical conductivity and low toxicity. In order to further enhance the MEC performance, special attempts have been made in the last few years on the development of new materials with improved electrocatalytic properties, such as carbon composites and nanomaterials [12]. Carbon nanotubes (CNTs) are conductive materials that have been used for anode construction in MFCs [13] due to their structural, electrical and chemical characteristics [14]. Depending on the number of graphene layers rolled to form a tube, either multi-walled CNTs (MWCNTs) or single-walled CNTs (SWCNTs) have been tested to enhance the performance of different MFCs systems [15,16] before or after functionalization with carboxyl (-COOH) or hydroxyl (-OH) functional groups [17,18]. It is reported that MWCNTs-based materials have biological advantages, such as biocompatibility, chemical activity and resistance to decomposition [19]. They also have unique surface properties, such as hydrophilicity/hydrophobicity and functional groups which can affect cell adhesion, growth, and metabolism. On the other side, it is reported that nanomaterials can inactivate bacteria [20], thus further investigation of their negative effects on bacteria metabolism is essential, before their promotion in microbial electrochemical technologies. Given that MEC technology is a new technology, compared to MFC technology, the use of CNT-based materials as anodes in MECs is still limited.
On the other side, their use as cathodic electrodes is less ambiguous, since cathodes are usually abiotic. In this respect, the replacement of the fossil cathodic electrodes with CNTs-supported Pt can increase the reaction activity and reduce the high cost of noble metals. Wang et al. [21] developed CNT-based cathodes in a single-chamber, membrane-free MEC operated under an applied voltage of 0.9 V. They also reported that a Pt/MWCNT-based cathode yielded a comparable MEC performance, like that for conventional electrodes of carbon cloth coated only with Pt. For further improvement of the performance of the MEC using MWCNTs-based cathodes, functionalization with polymers, such as polyaniline (PANI) was performed, and PANI/MWCNT composites were used as cathode catalysts in the same single-chamber membrane-free MEC [22]. The results obtained showed that due to the PANI conductivity and special properties, the developed PANI/MWCNTs cathodes yielded a MEC performance with a similar hydrogen production rate to the respective Pt/C cathode.
Since the use of CNT-based electrodes as anodes in MECs still remains a challenge, the current study aims at assessing the effect of different anode materials, namely a CNT-buckypaper and a commercial CP, on the efficiency of two-chamber MECs, in terms of hydrogen production and main electrochemical characteristics. The experiments were performed using both acetate-based synthetic wastewater and real wastewater, specifically the effluent of a dark fermentative hydrogenogenic reactor (an up-flow column bioreactor-AUFCR), using cheese whey (CW) (CW fermentation effluent) as substrate. The AUFCR operated at a steady state at a hydraulic retention time (HRT) of 12 h and was fed with diluted CW, at an initial carbohydrates concentration of 20 g/L [23]. In this respect, a two-stage process is proposed, where dark fermentation (DF) of CW occurs in the first step, where hydrogen and fatty acids are produced, while the effluent of that step is subsequently used as an influent of the MEC to further increase hydrogen production. The whole concept is based on the fact that the volatile fatty acids (VFAs), i.e., acetate, butyrate and propionate or lactate, which are common substances in the fermentation effluents, cannot be further decomposed by fermentative hydrogen-producing bacteria, but they can be considered as a source of energy for electro-active bacteria, i.e., exoelectrogens, working at the anodes of bioelectrochemical systems, such as MECs [24,25]. By coupling DF with a MEC system, a dual environmental benefit is provided, combining wastewater treatment together with sustainable bioenergy generation [26]. Glycerol [27], CW [25,28] and other agro-industrial wastewaters [26] have been investigated so far for combined hydrogen production, using DF-MEC systems. The novelty of the present work lies in the optimization of the anode reactions, by using new anode materials, specifically MWCNTs-based electrodes, for enhancing the efficiency of MEC and increasing the overall hydrogen yield of CW, in the framework of a two-stage DF-MEC process. Moreover, given that the DF effluents could not be safely discharged into the environment [29], the efficiency of the MEC system to reduce DF toxic potential was further assessed via a small-scale toxicity test, using the fairy shrimp Thamnocephalus platyurus, thus ensuring the safe environmental disposal of the remaining DF-MEC effluents.

2. Materials and Methods

2.1. Fabrication of CNTs Buckypaper

CNT buckypapers (thin sheets made of an aggregate of carbon nanotubes) have been prepared in an effort to develop free-standing electrodes. Due to their continuous nanotube networks, they possess low contact resistance and considerably higher conductivity compared to macroscopic CNT materials, such as CNT composites. Carboxyl functionalized thin MWCNT, Thin-MWCNT-COOH, with an average length of 1–5 μm and an outer diameter of 15 ± 5 nm were purchased from NanoLab (Waltham, MA, USA). Approximately 110 mg of those CNTs were dispersed into 35 mL of dimethyl formamide using tip sonication for 12 min (400 W, 40% Amplitude, UP400S-Hielscher ultrasonic processor with Sonotrode H3). The dispersion was vacuum filtered over a Nylon filtration membrane (0.45 μm, 47 mm, Whatman). After drying with hot air, the CNT-based buckypapers, thus fabricated were peeled off from the filtration membrane. The generated buckypapers had a thickness of approximately 150 μm with a corresponding diameter of about 3 cm. Then the anode was cut to the desired dimensions.

2.2. Construction and Operation of MECs

Two identical two-chamber MECs, MEC1 and MEC2, consisting of two glass bottles, filled to 250 mL and connected via a glass tube, were used. Separation of the chambers of each MEC was performed by a proton exchange membrane (Nafion 117, Perfluorinated Membrane, Sigma-Aldrich), pretreated as described in Antonopoulou et al. [30]. In both MECs, carbon cloth coated with Pt (ETEK, 0.5 mg/cm2) (2 cm × 2 cm) was used as cathodic electrode. The anode (working) electrode in MEC1 was made of CP (Quintech), whereas in MEC2 it was made of the prepared Thin-MWCNT-COOH buckypaper (dimensions 2 cm × 2 cm). Titanium wires connected the cell to the external circuit.
A voltage of 0.9 V was supplied to each of the two MECs using a custom-made DC power supply. It was monitored and recorded using a data acquisition system (ADAM-4017), as described in Antonopoulou et al. [31]. Produced current (mA) was determined via measurement of the voltage drop across a 10 Ω resistor (resistance decade box, RS), connected in series to each MEC. This resistance was much smaller than the ohmic resistance of the MECs, as confirmed by EIS measurements.
Anodes and cathodes were agitated and were placed in a constant temperature chamber at 30 °C. MECs operated in three phases: (a) acclimation of the microbial consortium and enrichment of the anodic electrode with electroactive–bacteria, (b) hydrogen production using acetate based synthetic wastewater, and (c) hydrogen production using DF effluent from CW, which was rich in VFAs.
During all experiments, the cathode compartments were filled with a nutrient medium consisting of a buffer solution (3.45 g/L Na2HPO4∙2H2O, 3.67 g/L NaH2PO4∙2H2O) and KCl (0.16 g/L). During the acclimation phase, the anode compartments were filled with the aforementioned nutrient medium, but also alkalinity (5 g/L NaHCO3) and a solution of trace elements [31], were added. Inoculation was performed with the addition of methanogenic sludge (10% v/v) in acetate-based synthetic wastewater (chemical oxygen demand (COD): 0.8 g/L). The sludge was obtained from an anaerobic digester and had the following characteristics: total suspended solids (TSS): 34.60 ± 0.80 g/L, volatile suspended solids (VSS): 17.14 ± 0.54 g/L, pH: 7.22 ± 0.01, soluble COD (s.COD): 0.52 ± 0.04 g/L. During this phase, both cells operated as MFCs under closed-circuit conditions (external resistance R = 100 Ω), for six successive cycles. During each cycle of MFC operation, the cathodes were continuously aerated using an air-pump and the voltage produced was recorded. Regarding the anodic chambers, after consumption of the COD, the anode media were emptied and the chambers were refilled with new media (the nutrients solutions described above and microbial inoculum), while the cathode was refilled only with the nutrient solution.
Once the anode enrichment with bacteria was performed, both systems were operated potentiostatically as MECs (applied voltage 0.9 V), without further microbial inoculum addition, but using the same anolytes and catholytes as in the previous phase. Finally, the acetate based synthetic wastewater was replaced by real wastewater, specifically the fermentation effluent of a hydrogenogenic reactor treating CW. The main characteristics of the effluent used were: pH: 5.72 ± 0.03, total carbohydrates: 1.80 ± 0.14 g/L, soluble carbohydrates: 0.69 ± 0.14 g/L, total COD (T.COD): 36.50 ± 0.71 g/L, s.COD: 24.95 ± 0.39 g/L, TSS: 6.36 ± 0.70, VSS: 4.06 ± 0.42, acetic acid: 2.55 ± 0.07 g/L, propionic acid: 0.31 ± 0.01 g/L, butyric acid: 7.42 ± 1.45 g/L, valeric acid: 0.65 ± 0.03 g/L, caproic acid: 1.91 ± 0.35 g/L. Prior to its use as substrate in the MECs, the effluent was diluted, so the initial COD concentration was reduced to ca. 0.8 g/L.

2.3. Calculations

The volumetric hydrogen productivity during a batch cycle of operation is calculated as [3]:
HPRv   ( m L H 2 L   d ) = V H 2 V r t
VH2: the hydrogen volume (mL), Vr: the working volume (L) and t: the time of the cycle (d)
Hydrogen yield can be calculated on a molar or on a mass basis. On a mass basis, the yield is given by [3]:
Y H 2 ( g H 2 g C O D ) = V H 2   P   M H 2 R   T   Δ C O D
where P: the hydrogen pressure (bar), R: 0.08314 L bar/(K mol), T: the temperature (K), MH2: is the molecular weight of hydrogen (2 g/mol) and ΔCOD: is the COD consumption of the substrate over a batch cycle (gCOD).
On a molar basis, the yield is given by [3]:
YH2 = nH2/nS
where nH2: the hydrogen generation and nS the substrate consumed (both in moles). The hydrogen yield could be expressed on a percent basis, compared to the theoretical maximum production (nth), as [3]:
YH2,th = (nH2/nth) 100%.
The value of nth based on COD is calculated by:
n t h = 2 Δ C O D M O 2
MO2: the oxygen molecular weight (32 g/mol).
The quantity of hydrogen (moles) which could be theoretically obtained based on the measured current, nCE, is expressed as [3]:
n C E = t = 0 t I d t 2 F
where I: the measured current (A), dt: the data collection interval (s), F: the Faraday constant and 2: conversion factor of electrons to hydrogen (in moles).
Theoretical hydrogen recovery nCE related to the Coulombic efficiency, (CE) is given from Equation (3):
CE = n C E n t h
The cathodic hydrogen recovery is the ratio of hydrogen recovered at the cathode to the theoretical produced, for the measured current [3]:
r c a t h = n H 2 n C E
The overall hydrogen recovery is given by [3]:
rH2 = CE rcath.

2.4. Electrochemical Characterization

The electrochemical characterization was conducted applying an Autolab PGSTAT204 (0.4 A/20 V) potentiostat–galvanostat. Cyclic voltammograms (CVs) and electrochemical impedance spectroscopy (EIS) measurements, with the results presented in the form of Nyquist and Bode plots, were conducted in order to study the electrochemical characteristics of the anode electrodes. These measurements were performed with the anode acting as the working electrode (WE), the cathode was used at the counter electrode (CE) whereas an Ag/AgCl (3M KCl) was employed as the reference electrode (RE). CVs were obtained within the potential range −1 to 1 V by scanning the applied potential with a rate equal to 50 mV/s, while EIS spectra were obtained in the range of 100 kHz to 1 mHz, under potentiostatic mode, applying a stimulus of 10 mV amplitude.

2.5. Toxicity Test

The CW fermentation effluent of a hydrogenogenic reactor, as well as DF-MEC1 and DF-MEC2 samples, were used for the application of the small-scale (24 h) toxicity test, using instars II–III larvae of the fairy shrimp T. platyurus, previously hatched from cysts purchased by MictoBio Tests Inc. (Belgium). The procedure was carried out in accordance with ISO 14380, 2011 protocol, while species’ health status was verified by the use of potassium dichromate (K2Cr2O7), as previously mentioned [32,33,34]. After checking the critical range of species, tests were performed by using all samples at concentrations ranging from 2.5 to 100% v/v. The results expressed as the mean value ± SD of the 24 h EC10, 20 and 50 effective concentration endpoints (% v/v) in each experiment that performed in triplicate. EC endpoints were calculated by Probit analysis (p < 0.05), based on log-transformed values in all cases, while differences among DF, DF-MEC1 and DF-MEC2 toxic endpoints were checked non-parametrically (Mann–Whitney U-test, p < 0.05), using the IBM SPSS Inc. 17 software, after checking for homogenicity (Levene’s test).

2.6. Analytical Methods

The measurements of COD, TSS and VSS were carried out based on Standard Methods [35], while the determination of carbohydrates and VFAs as well as of hydrogen content in the gas phase was performed as presented in Antonopoulou et al. [36]. Raman spectra were recorded in the backscattering geometry using a UV-Vis Labram HR-800 (Horiba Jobin-Yvon) system. The excitation line was the 441.6 nm (by an air-cooled HeCd laser of Kimmon Electric Co.; dual, 325/442 nm, UV/blue, 20/80 mW, IK5651R-G model laser). The laser power on the specimen was 1.8 mW.
Scanning electron microscopy (SEM) images were taken with a Zeiss SUPRA 35VP-FEG instrument, operating at 5–20 keV. Fixation of microorganisms was performed as described by Dounavis et al. [37].
The CNTs BET specific surface area was determined using the nitrogen physical adsorption–desorption isotherms (at 77 K), recorded after degassing at 300 °C for 2 h, using a Micromeritics apparatus (FlowPrep 060 Sample Degas System–Tristar 3000 porosimeter) and the corresponding software. The hydrophilicity/hydrophobicity of the two electrodes was assessed through images of the drops captured with a digital camera and the contact angles were calculated with Opendrop.

3. Results and Discussion

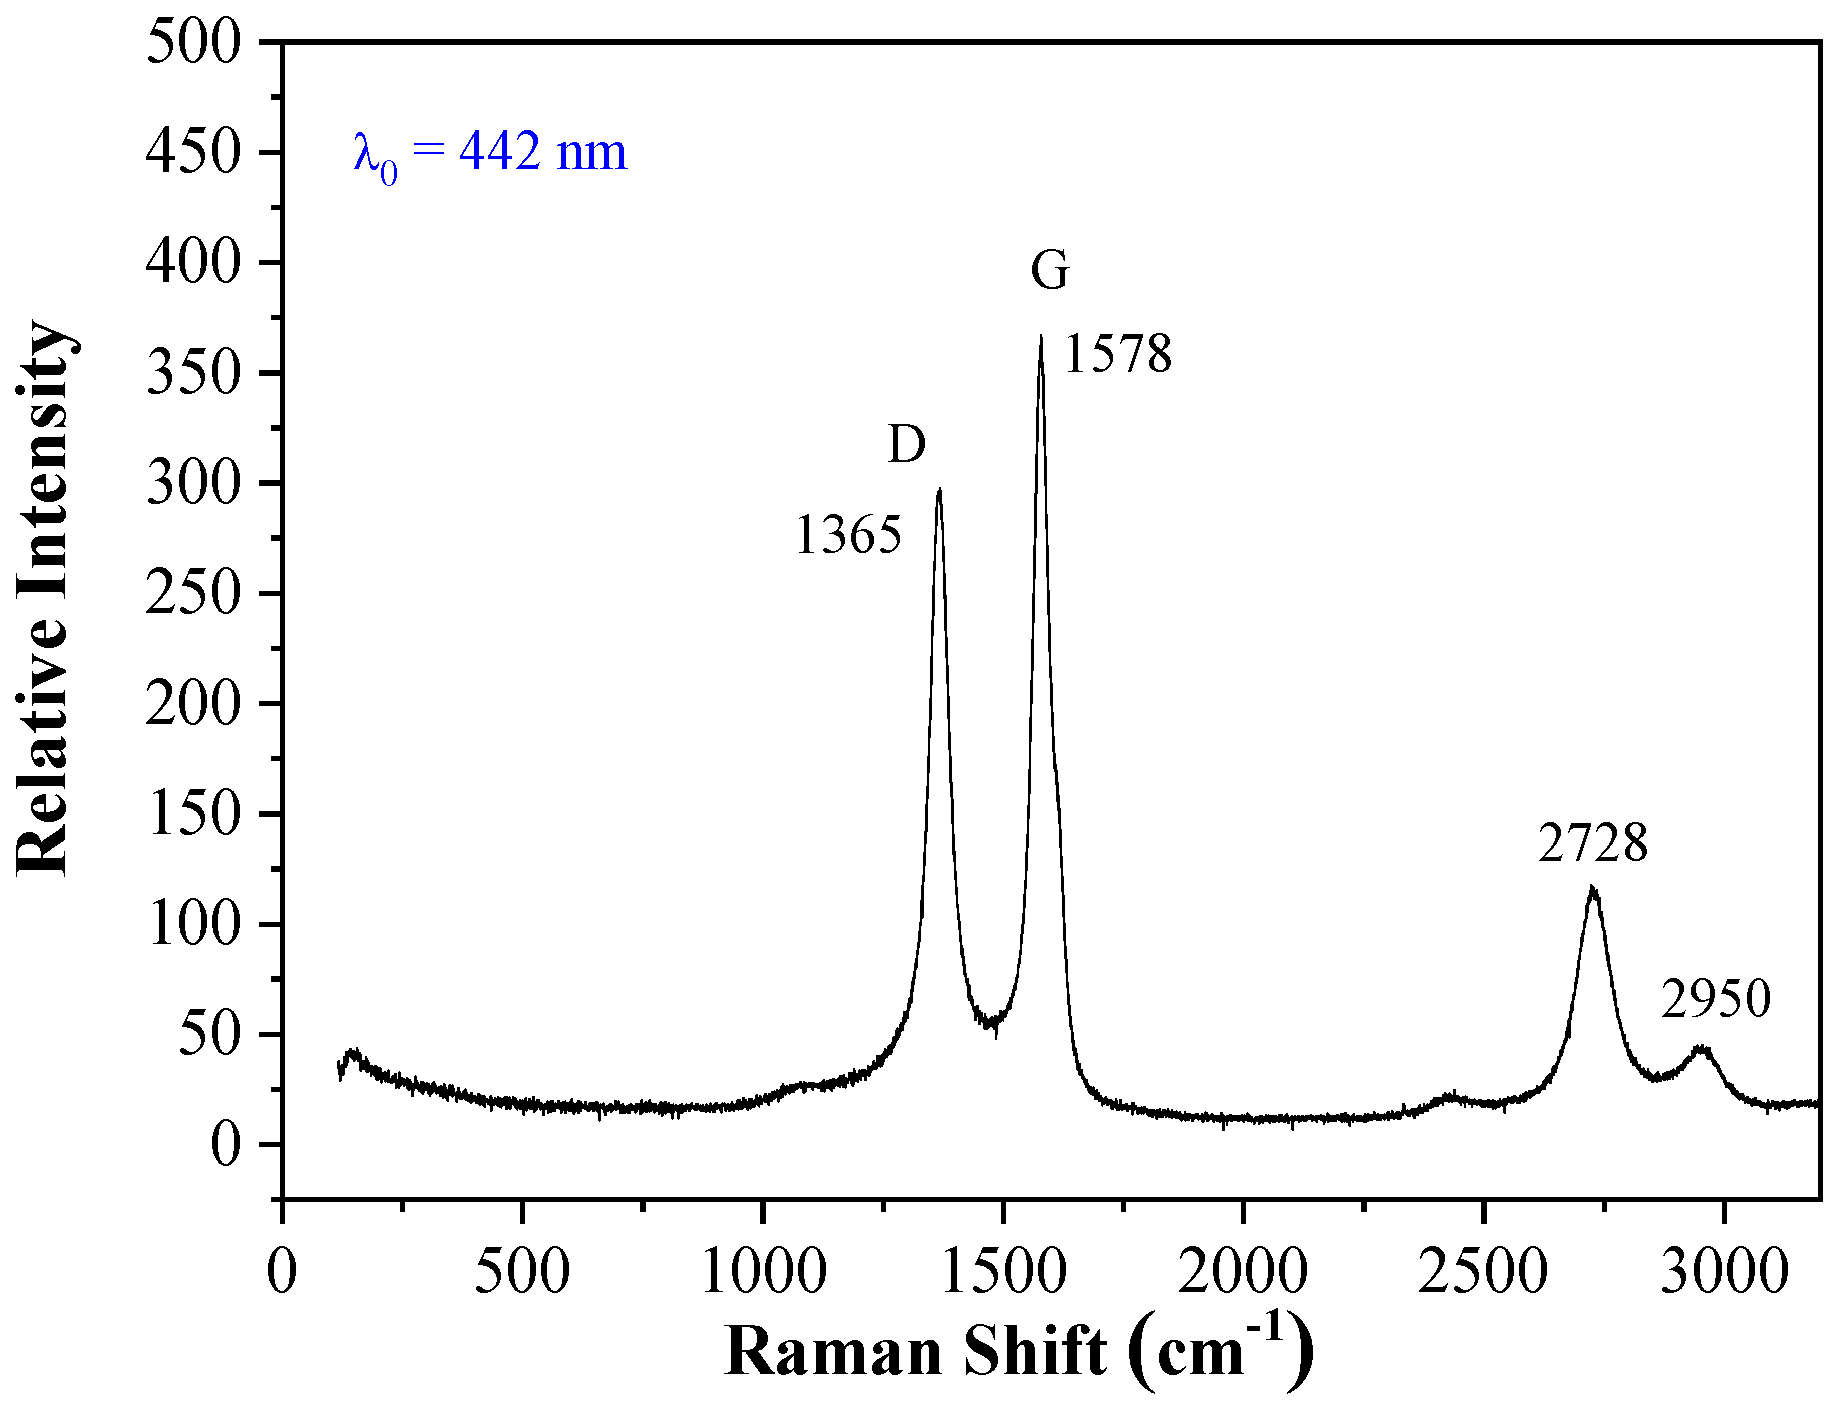
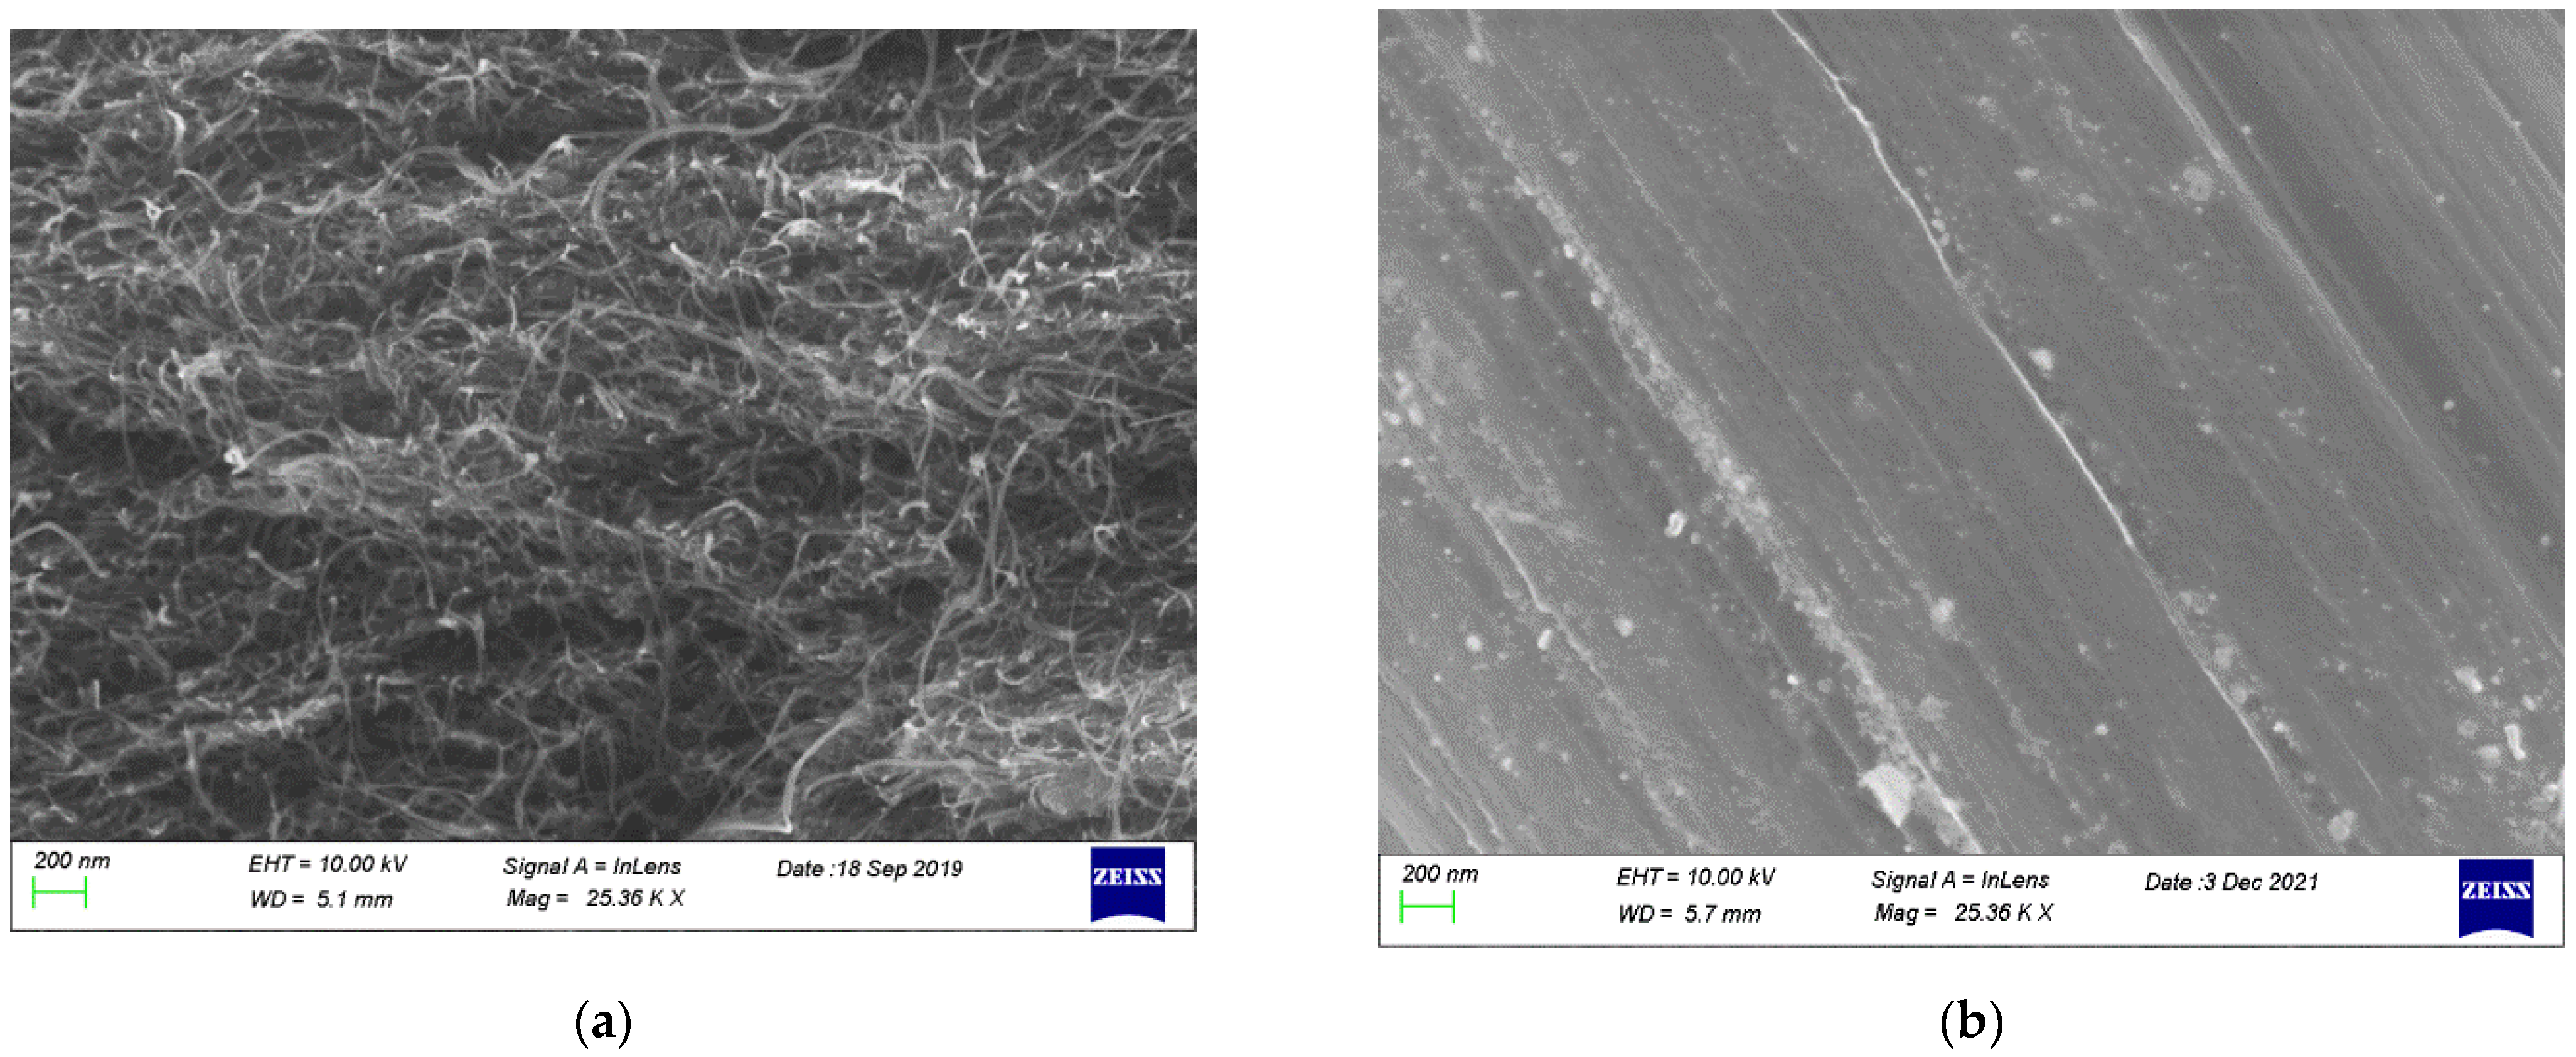
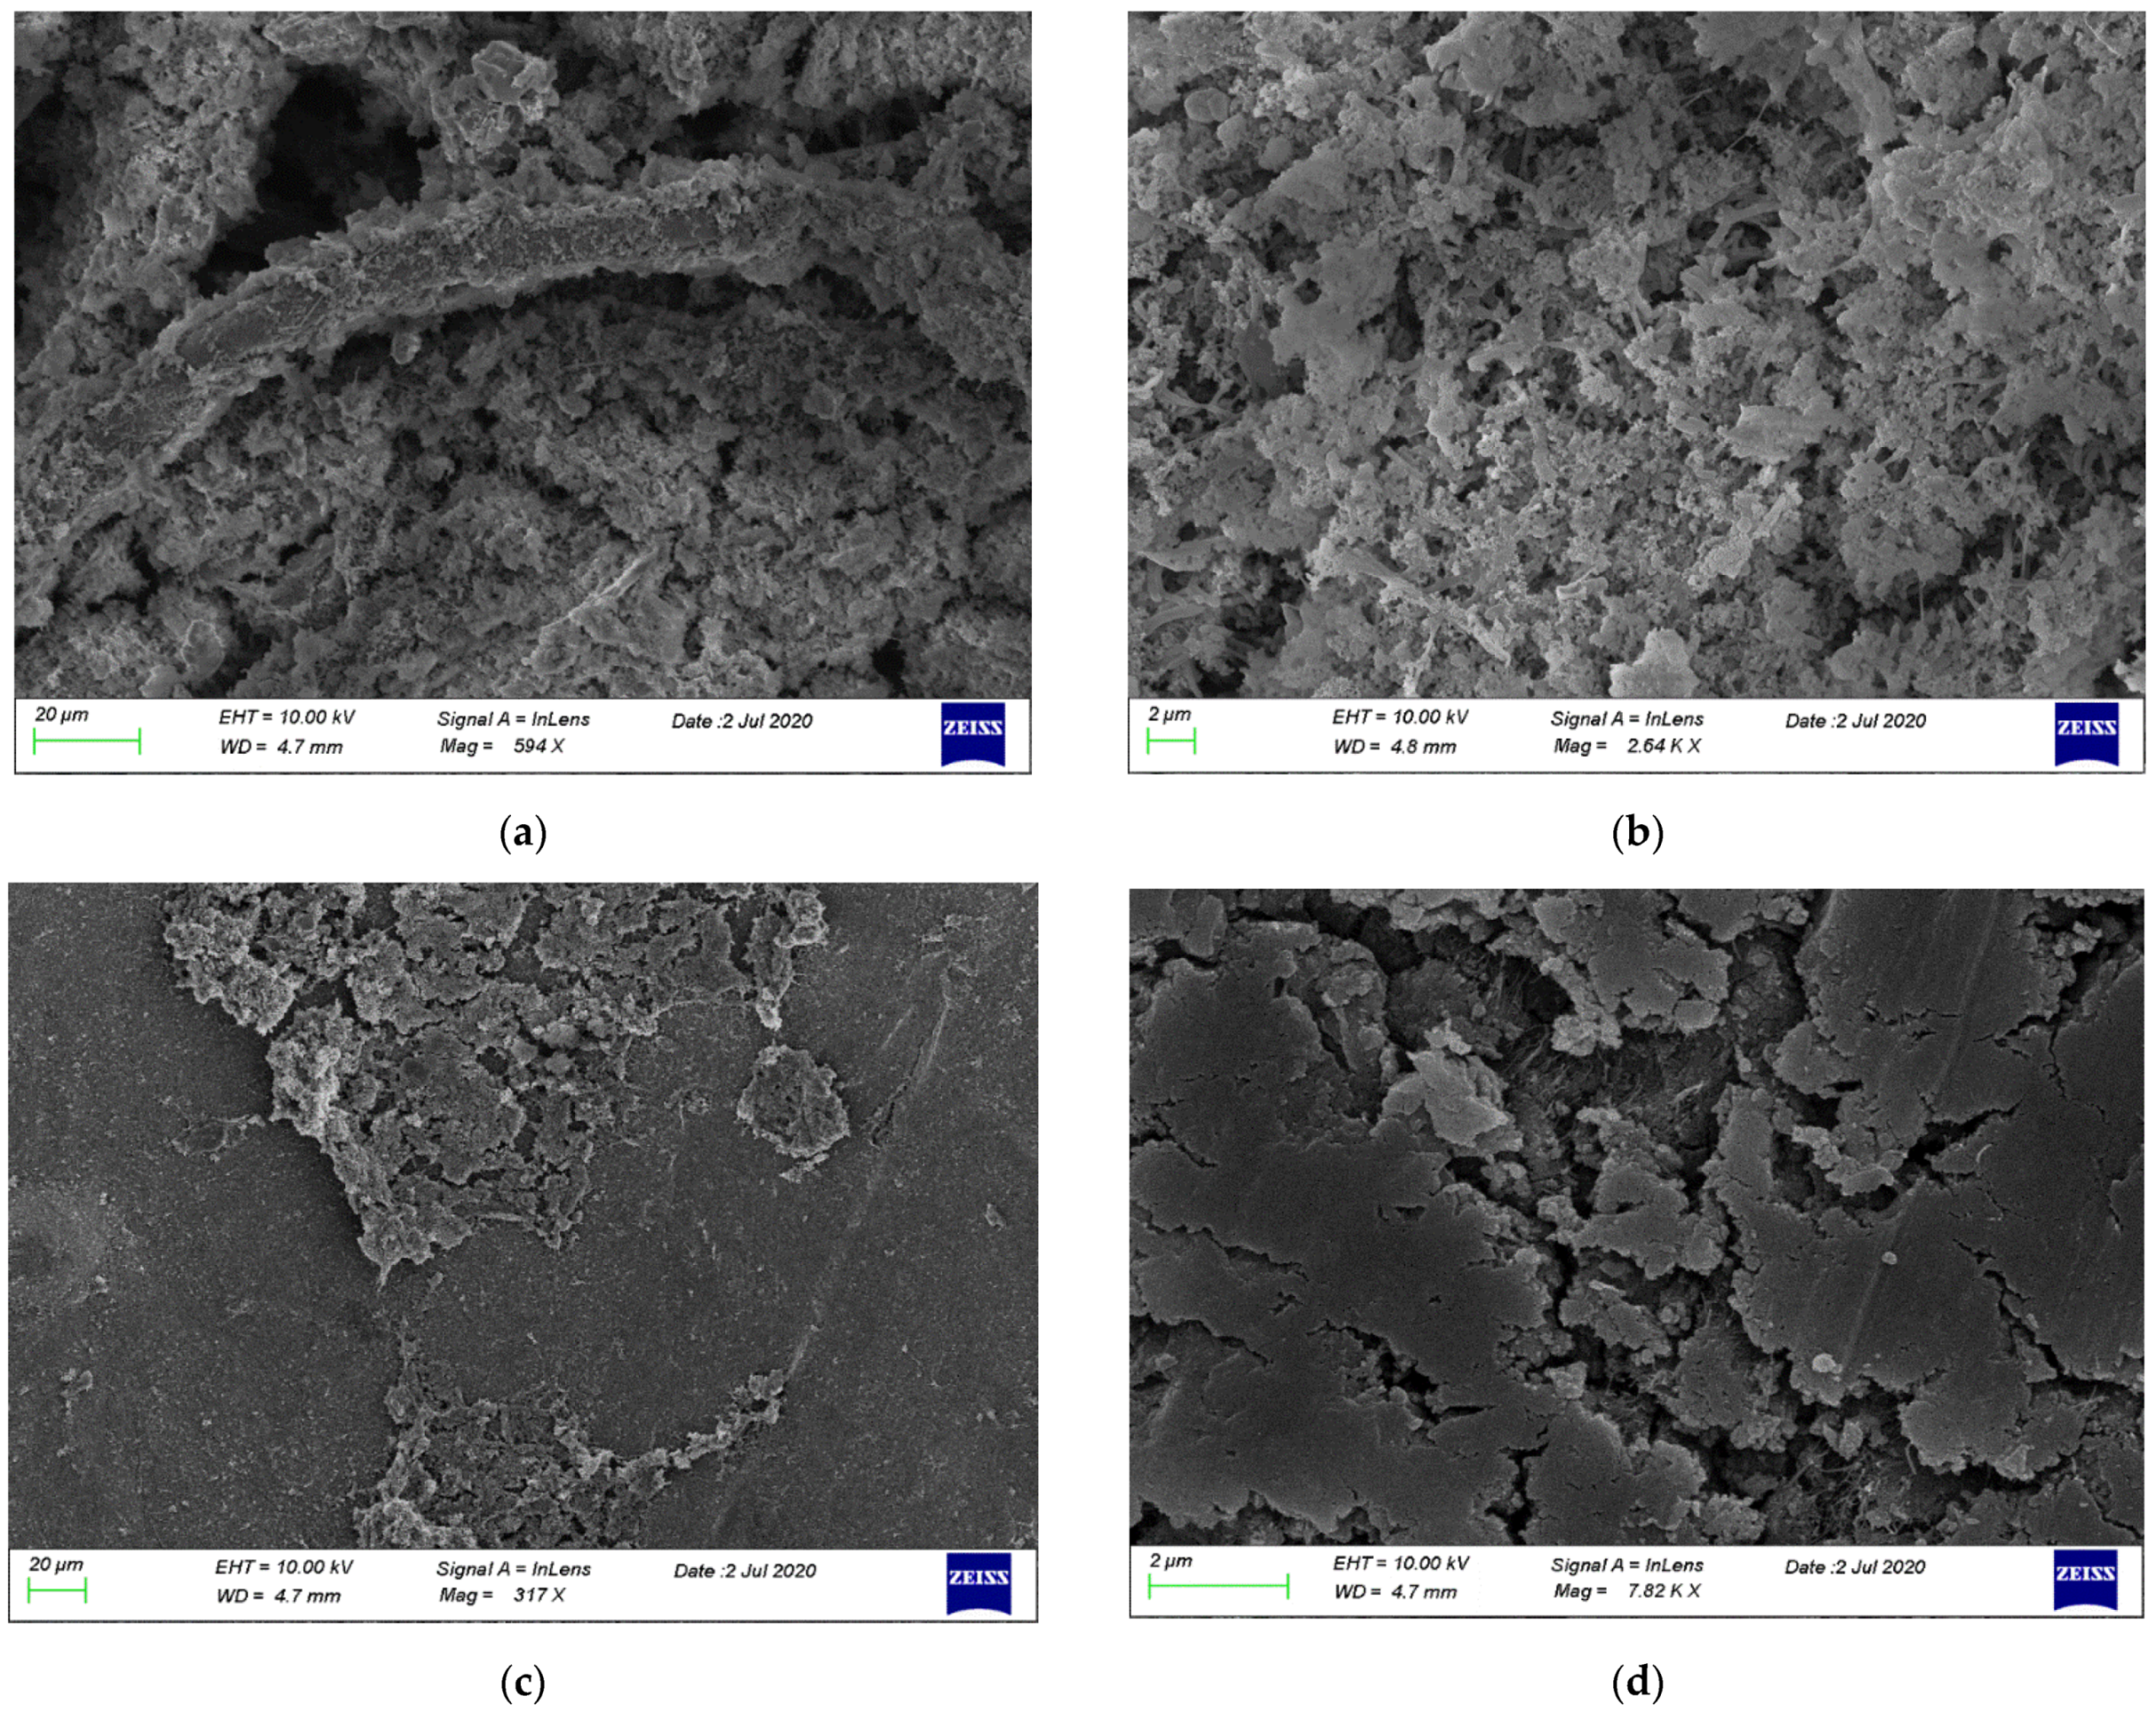
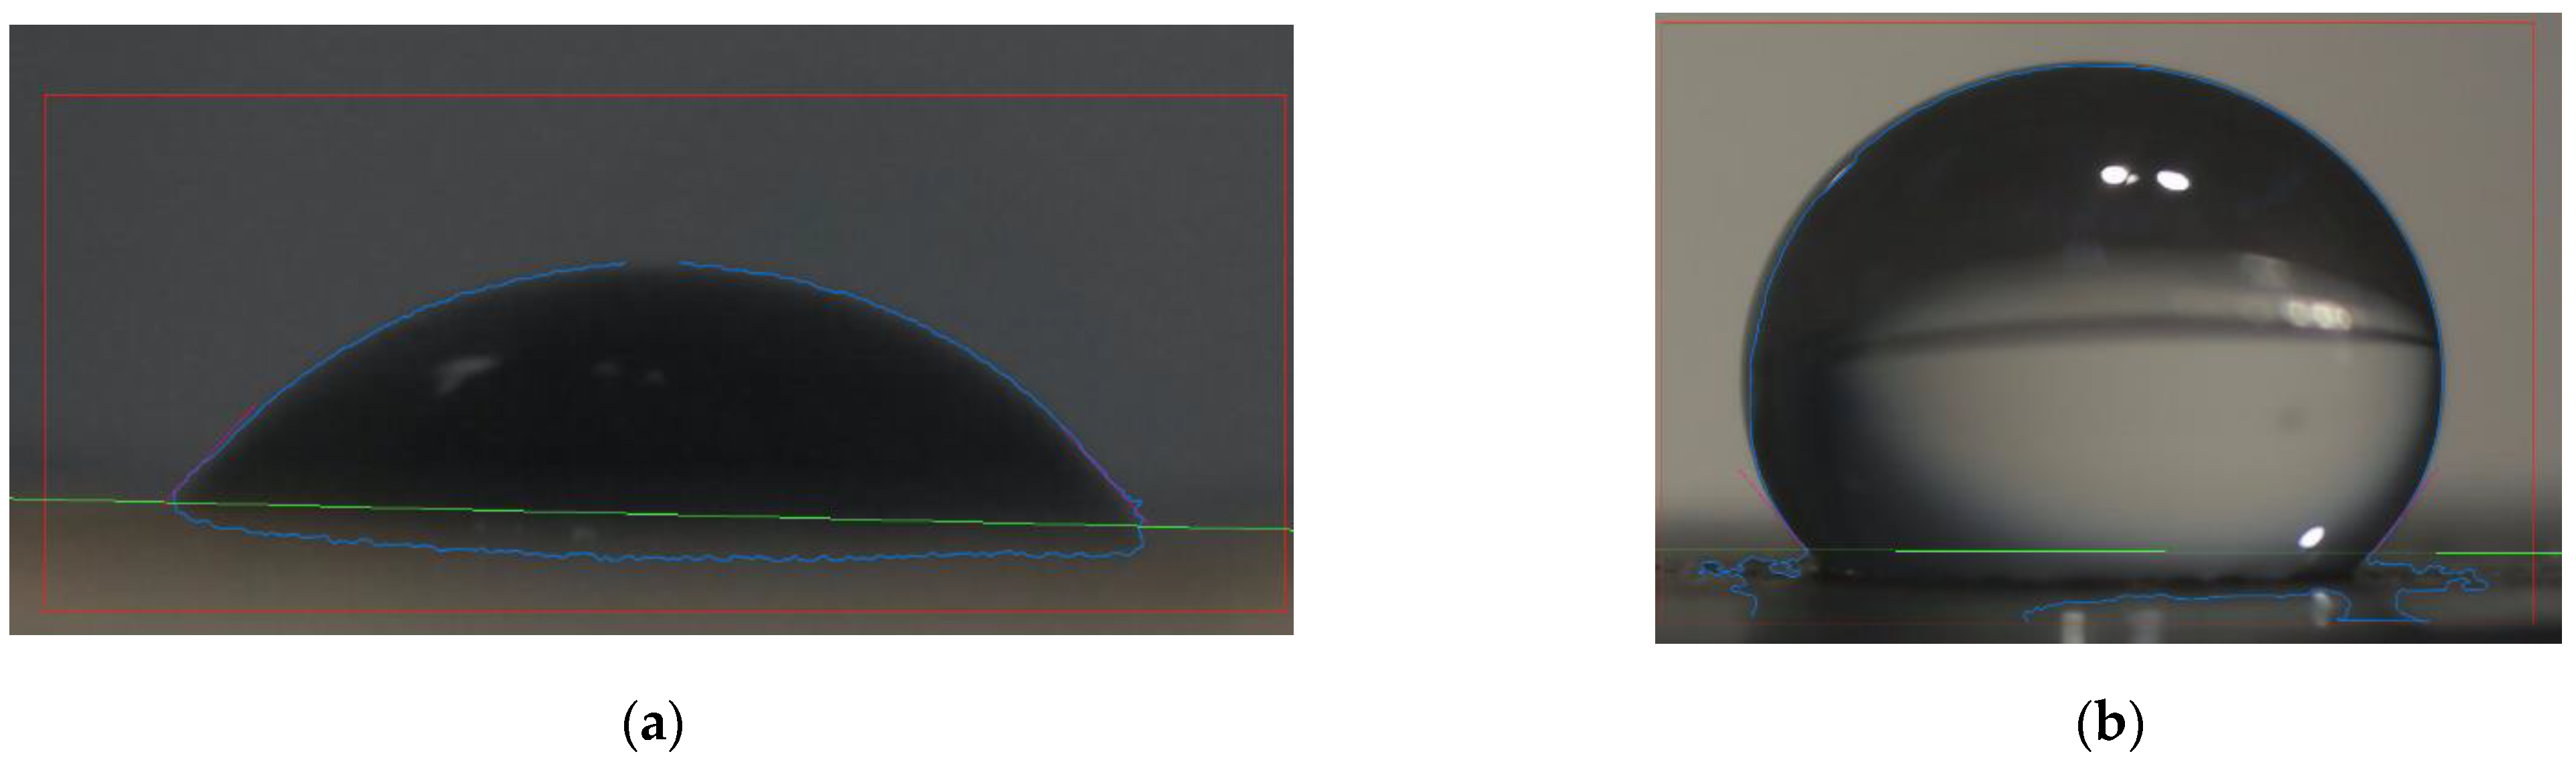
3.1. Characterization of CNTs Buckypaper

Raman spectroscopy was employed for the characterization of the prepared buckypaper (Figure 1). The most significant spectral features observed are the disorder-induced D band at 1365 cm−1 and the tangential G band at 1578 cm−1. The latter is associated with the graphite tangential E2g Raman allowed mode, where the two atoms in the graphene unit cell vibrate tangentially one against the other; neighboring atoms are moving in opposite directions along the surface of the tube as in 2D graphite [38]. The second-order related harmonic G’ (or 2D) band is located at ~2700 cm−1.
The morphology of the Thin-MWCNT-COOH buckypaper was determined by SEM. The image depicted in Figure 2 shows the entanglements of CNTs, while CP is also depicted for comparison. A continuous tube network can be clearly seen. During the creation of the buckypaper through filtration, the tubes are interlaced and self-assembled into bundles due to the van der Walls forces, giving rise to this characteristic network For buckypaper-based electrode application, the porous nature of the membrane surface is a prerequisite in order to permit the electrolyte to infiltrate the membrane and form a large efficient capacity surface. The specific surface area determined from BET analyses was 145.0 m2/g.

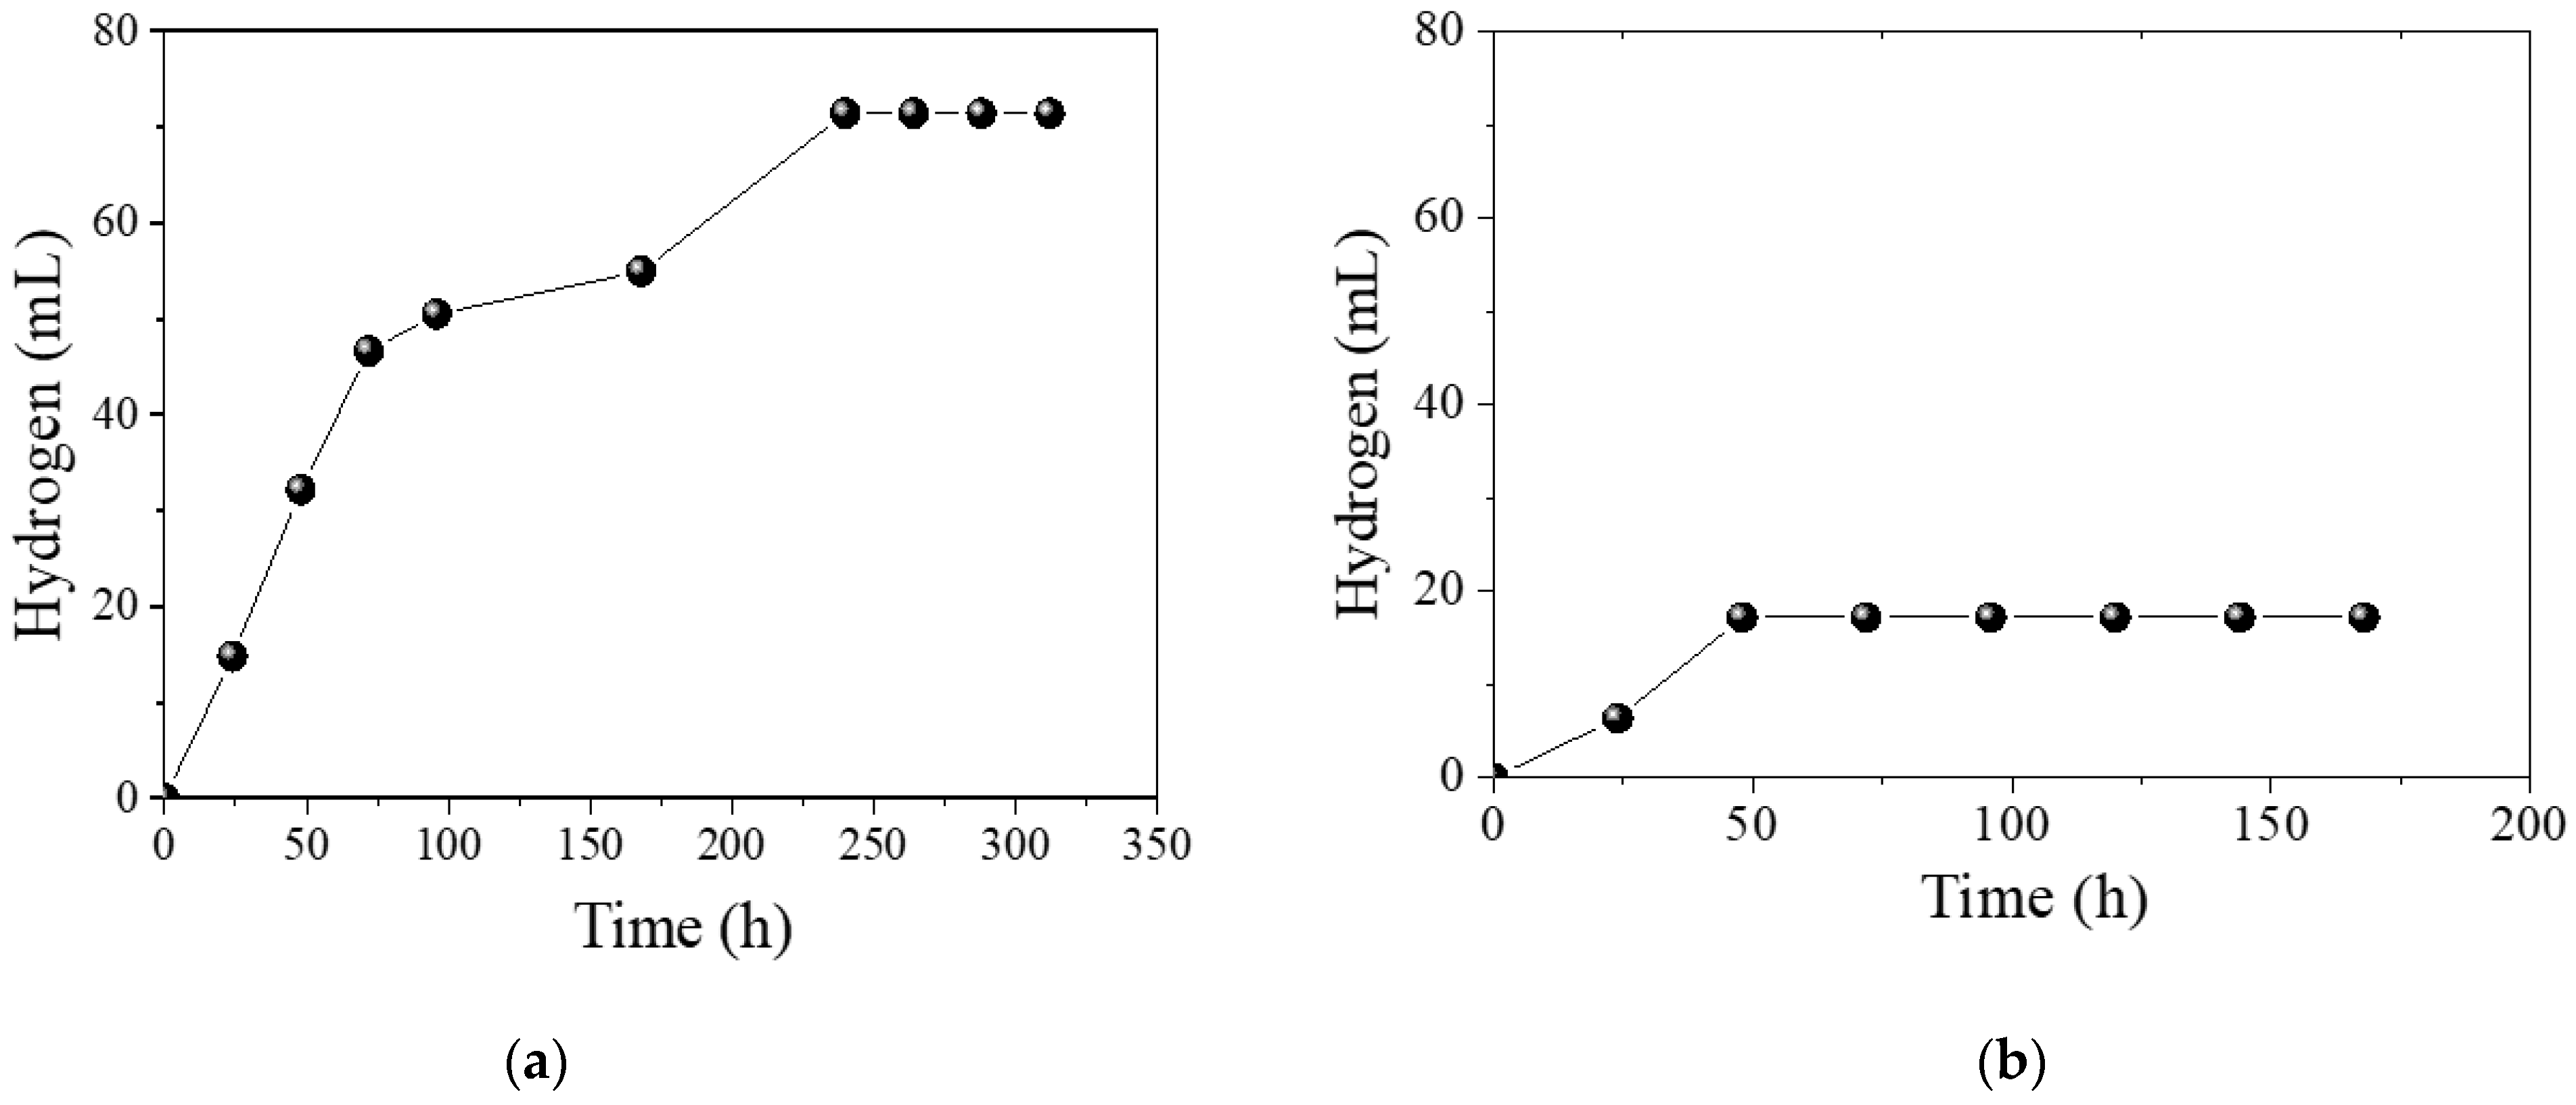
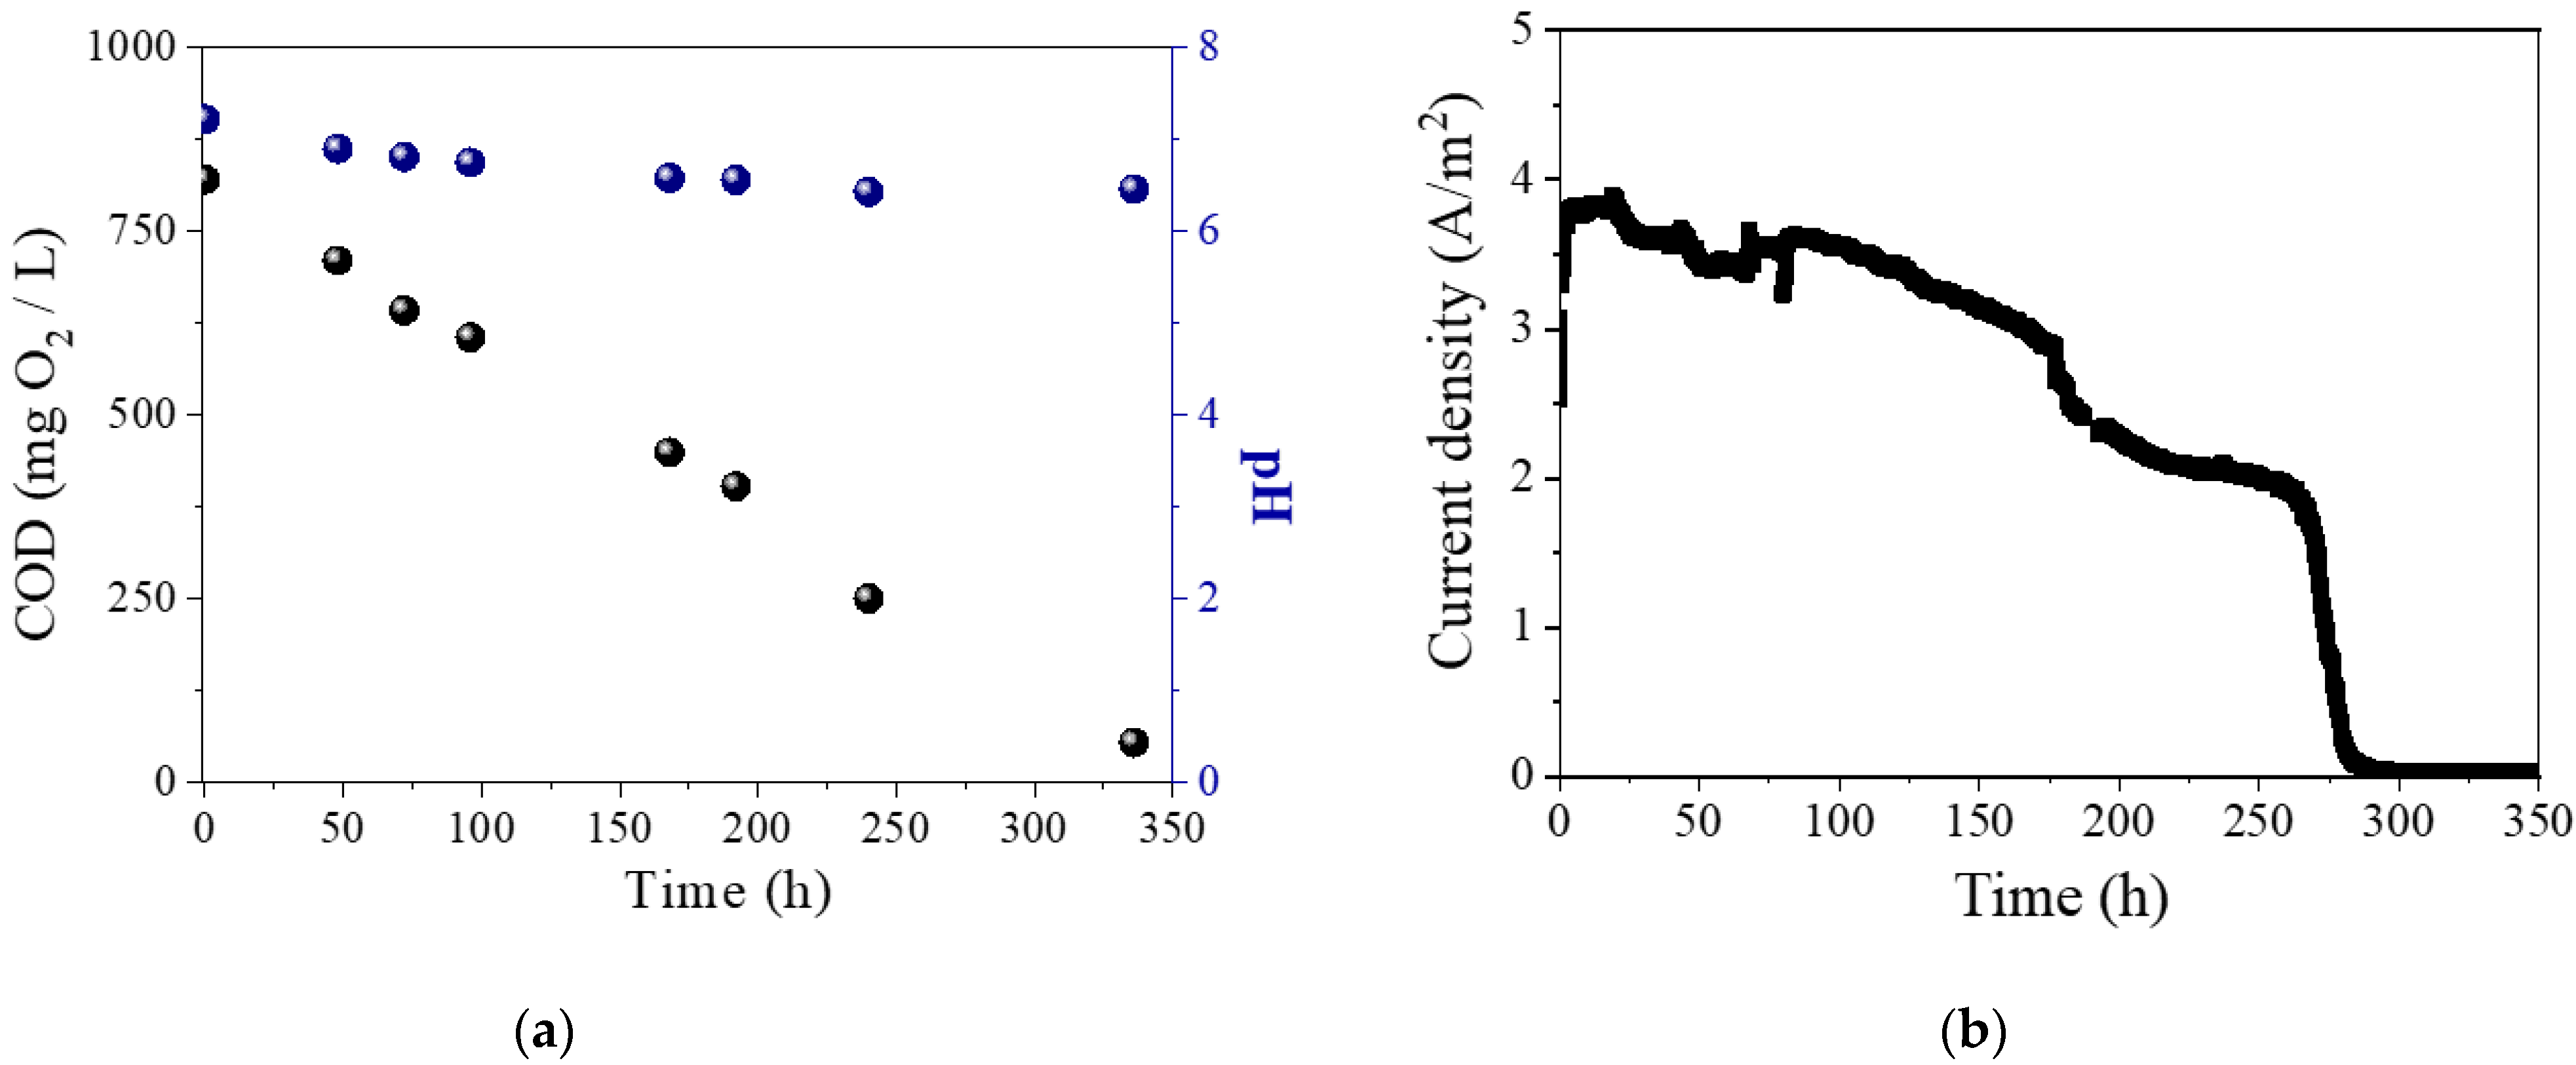
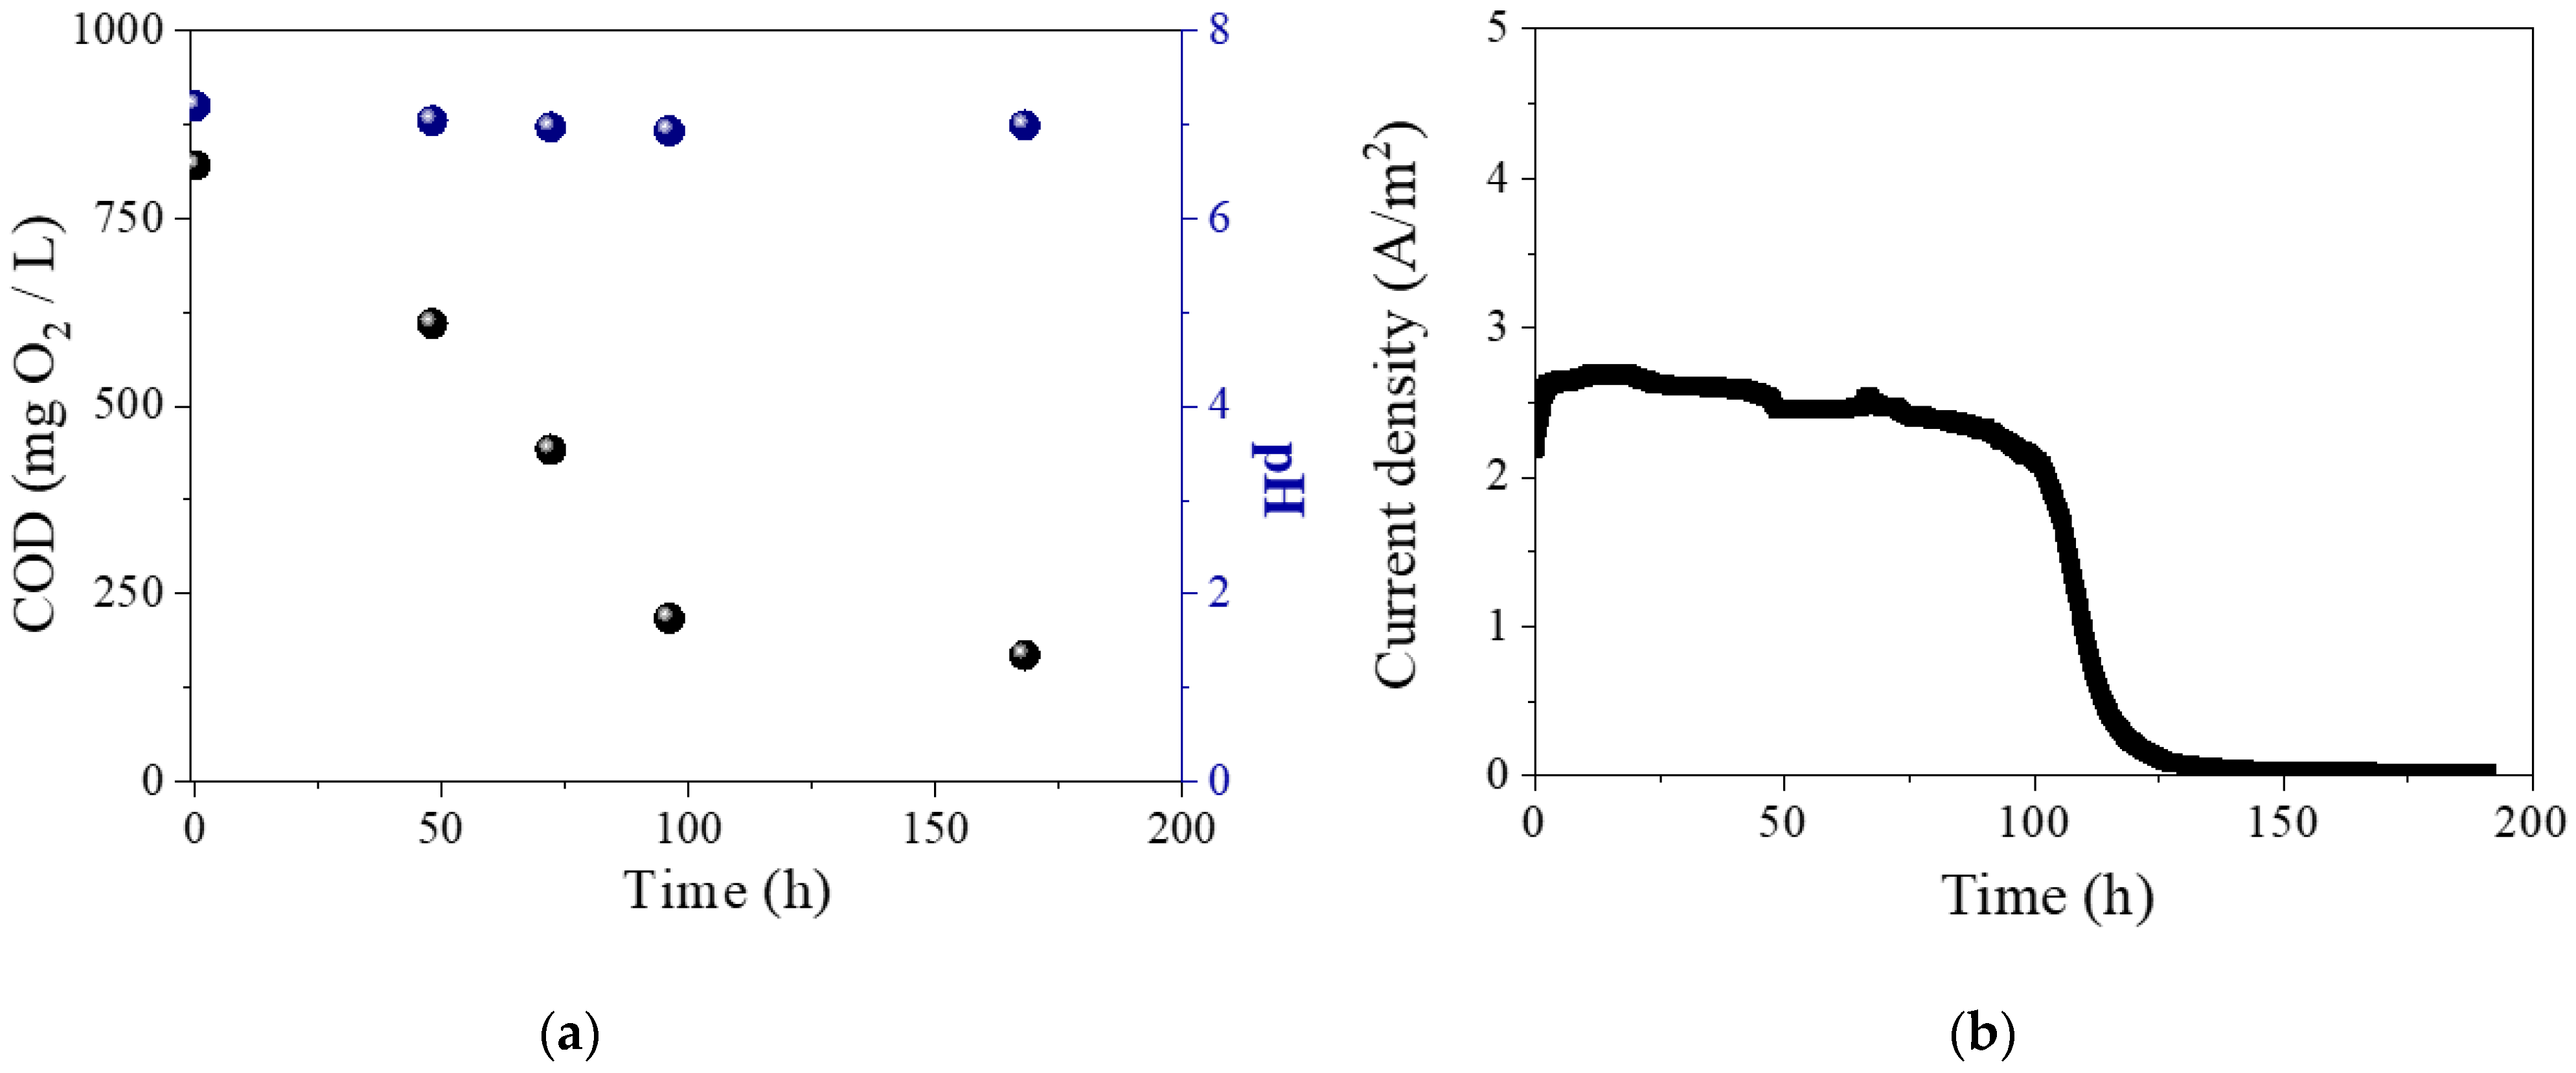
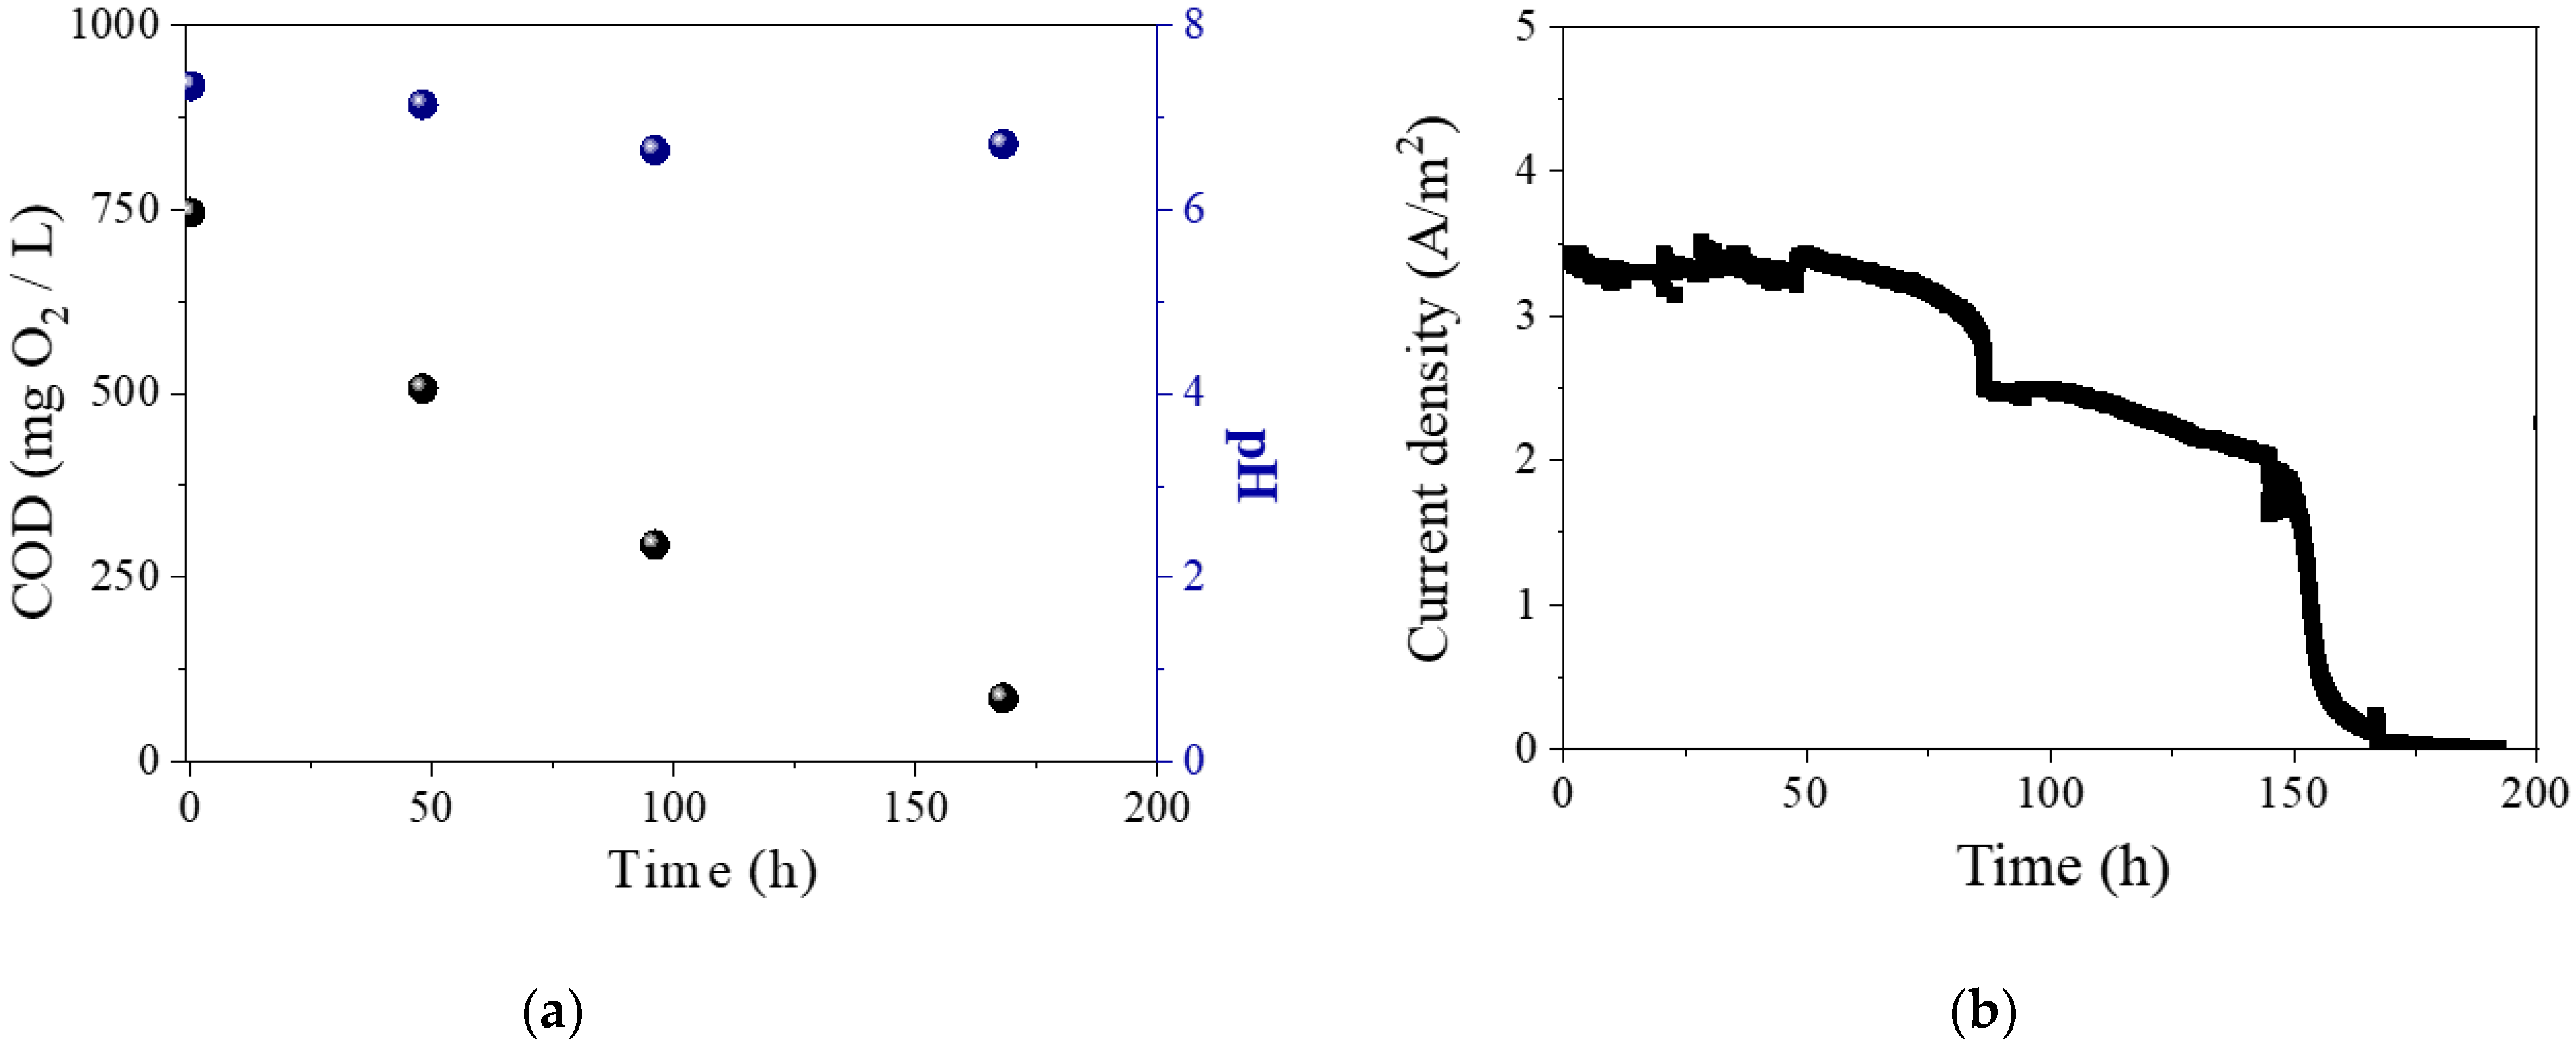
3.2. MECs Performance Using an Acetate-Based Synthetic Wastewater as Substrate

During the acclimation phase, experiments were conducted using the acetate-based medium and both systems were operated as MFCs for six successive cycles so as the anodes be enriched with electrochemically active bacteria; 25 mL of anaerobic sludge was added in the anode compartments, along with the addition of acetate-based nutrient medium. Once the substrate was consumed, the cell potential dropped to zero and the addition of a new batch of bacteria together with the acetate-based medium was repeated for six cycles until the maximum voltage was generated and was reproducible for at least two cycles. In Table 1, the maximum voltage values recorded during the operation of the systems as MFCs, for six successive cycles, are presented.
From the table, it is obvious that the voltage values obtained in MEC1, where CP was used as an anode, were higher than the corresponding values obtained in MEC2, where Thin-MWCNT-COOH-based buckypaper was used as an anode, which indicates better colonization of the CP electrode with electroactive bacteria. This was also evident, since a less intense biofilm was attached to the CNT-electrode of MEC2, compared to the electrode of MEC1, indicating that the biofilm formation and selection of bacteria on the bioanodes were probably affected by the anode material.
Once the acclimation period was finished, the systems were operated potentiostatically as MECs via the application of a constant voltage of 0.9 V at each MEC. From this point onward, both MECs operated without the addition of microorganisms, since it was presumed that the anodes were enriched with electrochemically active bacteria. MEC1 and MEC2 were operated for one cycle with the acetate-based medium and hydrogen evolution was observed just after the onset of the cycles (Figure 3), accompanied by a gradual consumption of the COD (Figure 4a and Figure 5a). The main characteristics which determine the performance of both MECs are presented in Table 2.
For MEC2, hydrogen evolution almost ceased after 50 h of operation, which was not accompanied by a proportional reduction of the current density or COD removal, like in the case of MEC1. Cumulative hydrogen production, HPRV and yields (Table 2), as well as the current density (normalized to the anodic surface area, 2 × 2 cm2) (Figure 4b and Figure 5b) of MEC1 with a CP anode, were higher than the respective ones for MEC2, with a Thin-MWCNT-COOH–buckypaper anode. The pH of the anodic chamber of MEC1 dropped slightly from 7.2 to 6.5, while that for MEC2 remained stable to a value around 7 (right axis of Figure 4a and Figure 5a), indicating sufficient transport of protons from the anodes (where they are generated upon decomposition of the organic substrates) to the cathodes (where they are consumed) and ensuring no voltage losses due to membrane pH gradient, according to the Nernst equation [3]. In MEC1, the COD consumption was 70.0% and 93.4% after 240 and 310 h of operation, respectively, while in MEC2 it was 80.0% after 168 h.
The better performance of MEC1 compared to MEC2 could be attributed to the efficient colonization of the MEC1 anodic electrode with electroactive bacteria, which is corroborated by the higher voltage values of MEC1 during the acclimation phase (Table 1) and by the thickness of the formed biofilm. Given the similar operational conditions of both MECs and the same cathodes, the difference in their performances could be attributed to the different anode materials used. Based on the literature, although CNTs exhibit excellent electrical, mechanical and thermal properties, their practical application in MEC is doubtful, due to many issues, such as biotoxicity and biosafety that should be addressed [39]. The negative effects of nanomaterials on the biofilm formation in MEC2, strengthen the argument regarding bio-toxicity and negative effects of CNT-based materials on bacteria metabolism [20].
The current densities values obtained from MEC1 (3.8 A/m2) and MEC2 (2.7 A/m2) are like those obtained in other studies. For instance, Flayak et al. [40] obtained a current density of 2.28 ± 0.62 and 2.44 ± 0.71 A·/m2 when using acetate and lactate at concentrations of 80 mM, as substrates in two-chamber MECs with carbon plates as anode electrodes and plates of 90% Pt and 10% Ir, as cathodes. The HPRv values obtained in MEC1 (23.6 mL/L/d) are like those obtained in similar studies. Rozendal et al. [41] reported a HPRv of 20 mL/L/d when using acetate in a two-chambered MEC under application of 0.5 V. However, higher HPRv values and hydrogen recoveries (overall and cathodic) have been usually reported for MECs fed with acetate, but with different configurations or electrode materials [42]. For instance, Jeremiasse et al. [43] achieved a HPRv of almost 50 L H2/L/d in a two chamber MEC, operating with a biocathode, under an applied potential of 1 V.
In MEC1, coulombic efficiency CE, which expresses the yield of acetate oxidation to release e, was calculated equal to 55.6%, while the cathodic hydrogen recovery (e to H2) was equal to 48%. Thus, the overall efficiency (acetate to H2) was just 26.7%. Low CEs, reveal that acetate consumption is not mainly directed to current production. This could be attributed to a partial loss of electrons for the biosynthesis of cellular components, e.g., biofilm formation [26]. In addition, the low cathodic hydrogen efficiency could be attributed to a possible loss of hydrogen due to diffusion through the Nafion 117 membrane [41], from the cathode to the anode chamber, as happens in the case of oxygen in MFCs [30].

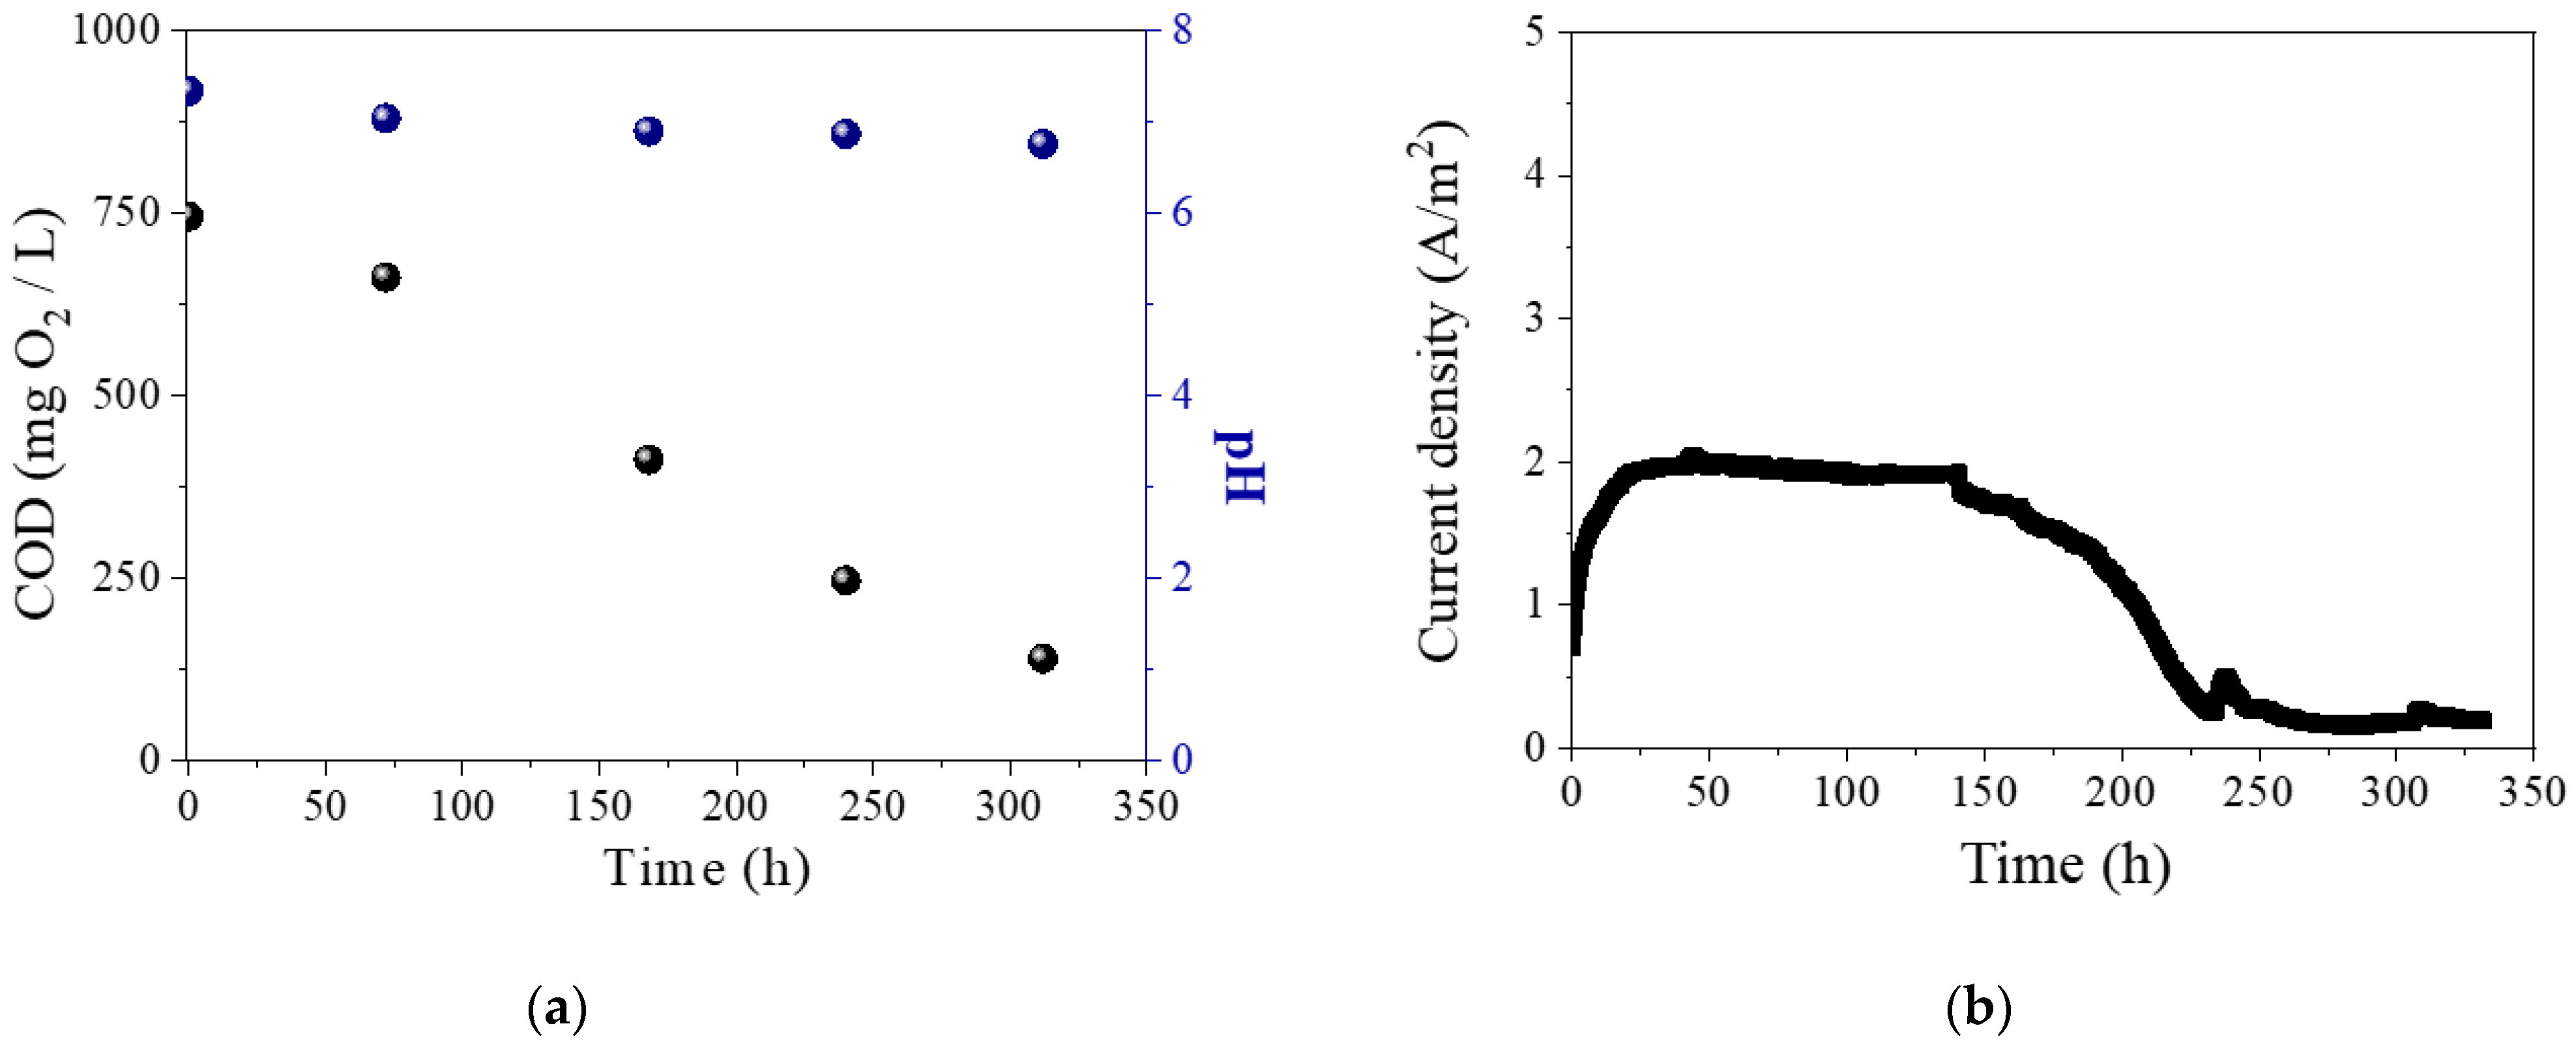
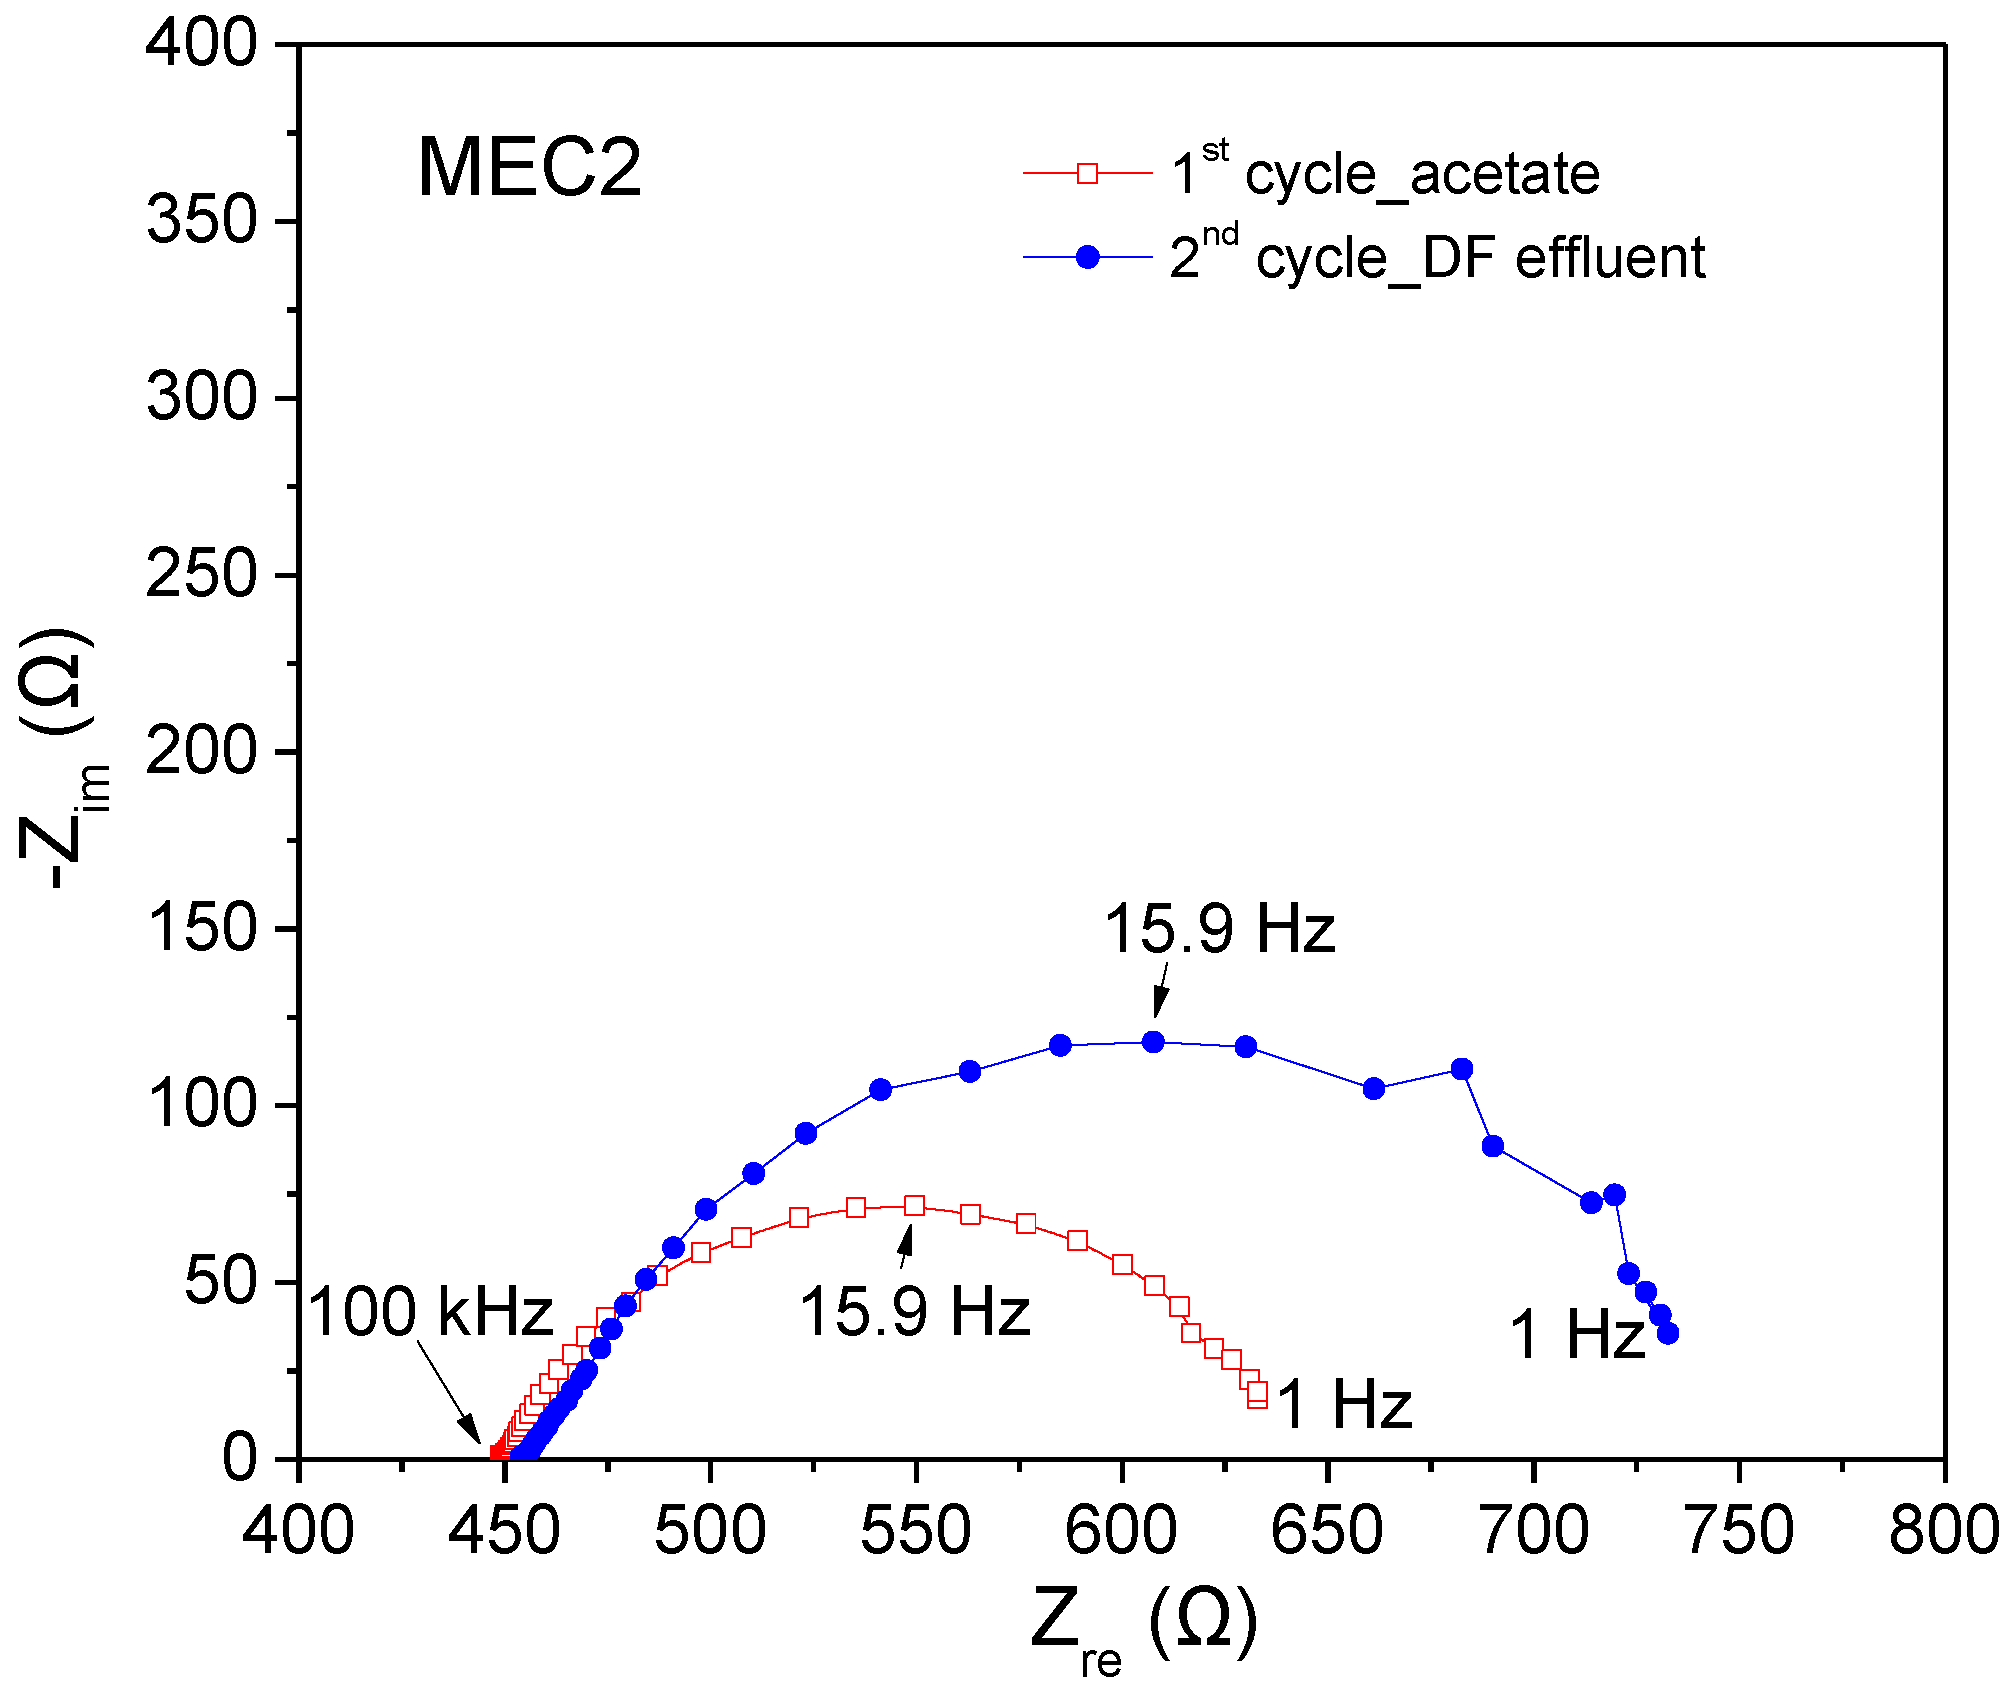
3.3. MECs Performance Using the DF Effluent from CW as Substrate

Following the MECs operation with acetate-based synthetic wastewater as substrate, diluted CW fermentation effluent of a AUFCR, rich in VFAs and fed with CW, was used as an energy source. COD and pH of the anolytes, as well as the obtained current densities vs. operation time are shown in Figure 6 and Figure 7, respectively. The main characteristics of the MECs are presented in Table 3.
As in the case of synthetic substrate feed, cumulative hydrogen production, HPRV and hydrogen yields (Table 3), as well as current density (Figure 6b and Figure 7b) for MEC1, were significantly higher than for MEC2. These results, in combination with SEM images of the surfaces of the anodic electrodes, at the end of the operation cycles with DF effluents (Figure 8), confirmed the hypothesis of better colonization of the MEC1 anodic electrode with electroactive microorganisms. In this phase, a partial decomposition or detachment of the formed biofilm had possibly occurred. Specifically, due to the negative effects of CNT-based materials on the bacteria metabolism, it is possible that some electroactive bacteria initially established in the biofilm which was attached to the anode of MEC2 were deactivated and as a result, the performance of MEC2 was much lower compared to MEC1.
It has been shown that the biofilm viability and hydrogen evolution, can for different bacteria, be affected by the hydrophobicity/hydrophilicity of the anode. The hydrophilicity/hydrophobicity of CNT-buckypaper and commercial CP was evaluated (Figure 9) with contact angle measurements using a drop of water on their surface. The contact angle is ca. 46° for CNT-buckypaper while for the CP is ca. 128°. These results indicate high wettability for CNT-buckypaper, thus confirming the best hydrophilic behavior. These results are consistent with the results of De-la-Pinta et al. [44] who assessed the effect of roughness and hydrophobicity of different biomaterials on the biofilm formation of different microorganisms. Based on their study, hydrophobic materials led to more abundant and profuse biofilms and their influence was more significant in the formation of biofilm than the roughness of the biomaterials.
The HPRv values obtained in MEC1 (29.3 mL/L/d) are similar to those reported in other studies, where DF effluents were used as substrates. Rivera et al. [45] observed a rate of 81 mL H2/L/day using a DF effluent in a two-chamber MEC (applied potential: 0.55 V) with graphite cloth as an anode. However, higher HPRv values have been also reported for MECs with different configurations (e.g., one-chamber MECs, without membranes, etc.), fed with real wastewaters [46].
In MEC1 the COD consumption was 88.5% after 168 h of operation, while in MEC2 it was 81.3% after 312 h of operation. The current density (normalized to the anodic surface, 2 × 2 cm2) obtained from MEC1 for 0.9 V applied voltage (3.5 A/m2) was much higher than that from MEC2 for the same voltage (2.0 A/m2). For both MEC1 and MEC2, the obtained current density for DF effluent as feed was lower compared to that for synthetic wastewaters feed; this was also observed as it concerns hydrogen production and yields. This could be attributed to the different types of substrate used. DF effluent is a complex substrate, rich in butyric and propionic acids, which are called “dead end products” due to the fact that these compounds are not decomposed for producing hydrogen; bacteria cannot extract energy via the corresponding reactions [3]. Those substrates are firstly fermented towards acetate by acetogenic bacteria and then are utilized to generate hydrogen [26]. Thus, the hydrogen performance of the MECs is highly correlated to carbon availability or degradability by specific groups of microorganisms, involved in the process. Marone et al. [26] reported better performance in MECs fed with fermentation effluents of simple initial composition rather than effluents with a more complex one.
The COD consumption efficiency and the current density production in MEC2 indicate the possible co-existence of exoelectrogenic bacteria with fermenting bacteria, which possibly ferment the substrate producing electrons (CE: 76.9%) but no hydrogen. The low cathodic hydrogen recovery (2.8%) and the low overall efficiency (2.2%) in combination with the high CE reveal that the produced electrons are either used for the formation of new biofilm or consumed in other electrochemical side reactions, such as reduction of metal ions in the cathodic chamber [26]. The possibility of occurrence of other competitive reactions in the anode, such as methanogenesis, can also explain the low cathodic yields which were observed.
The current density of MEC1 is similar to the respective one in other studies, dealing with the use of DF effluents as substrates in MECs. Marone et al. [26] reported 7.46 ± 1.76 A/m2 when the DF effluent of a batch hydrogen reactor fed with deproteinized ricotta CW was used in a two-chamber MEC, with carbon felt as an anode. The experiments were done under 0.44 V. vs. SHE (Standard hydrogen electrode). Rivera et al. [25] obtained current densities of 1.5–2.5 A/m2 and 1.3 A/m2 in a single-chamber MEC, treating the effluents of a methanogenic and a hydrogenogenic reactor fed with CW, respectively, with a graphite felt anode (60 cm2) and a stainless steel cathode.

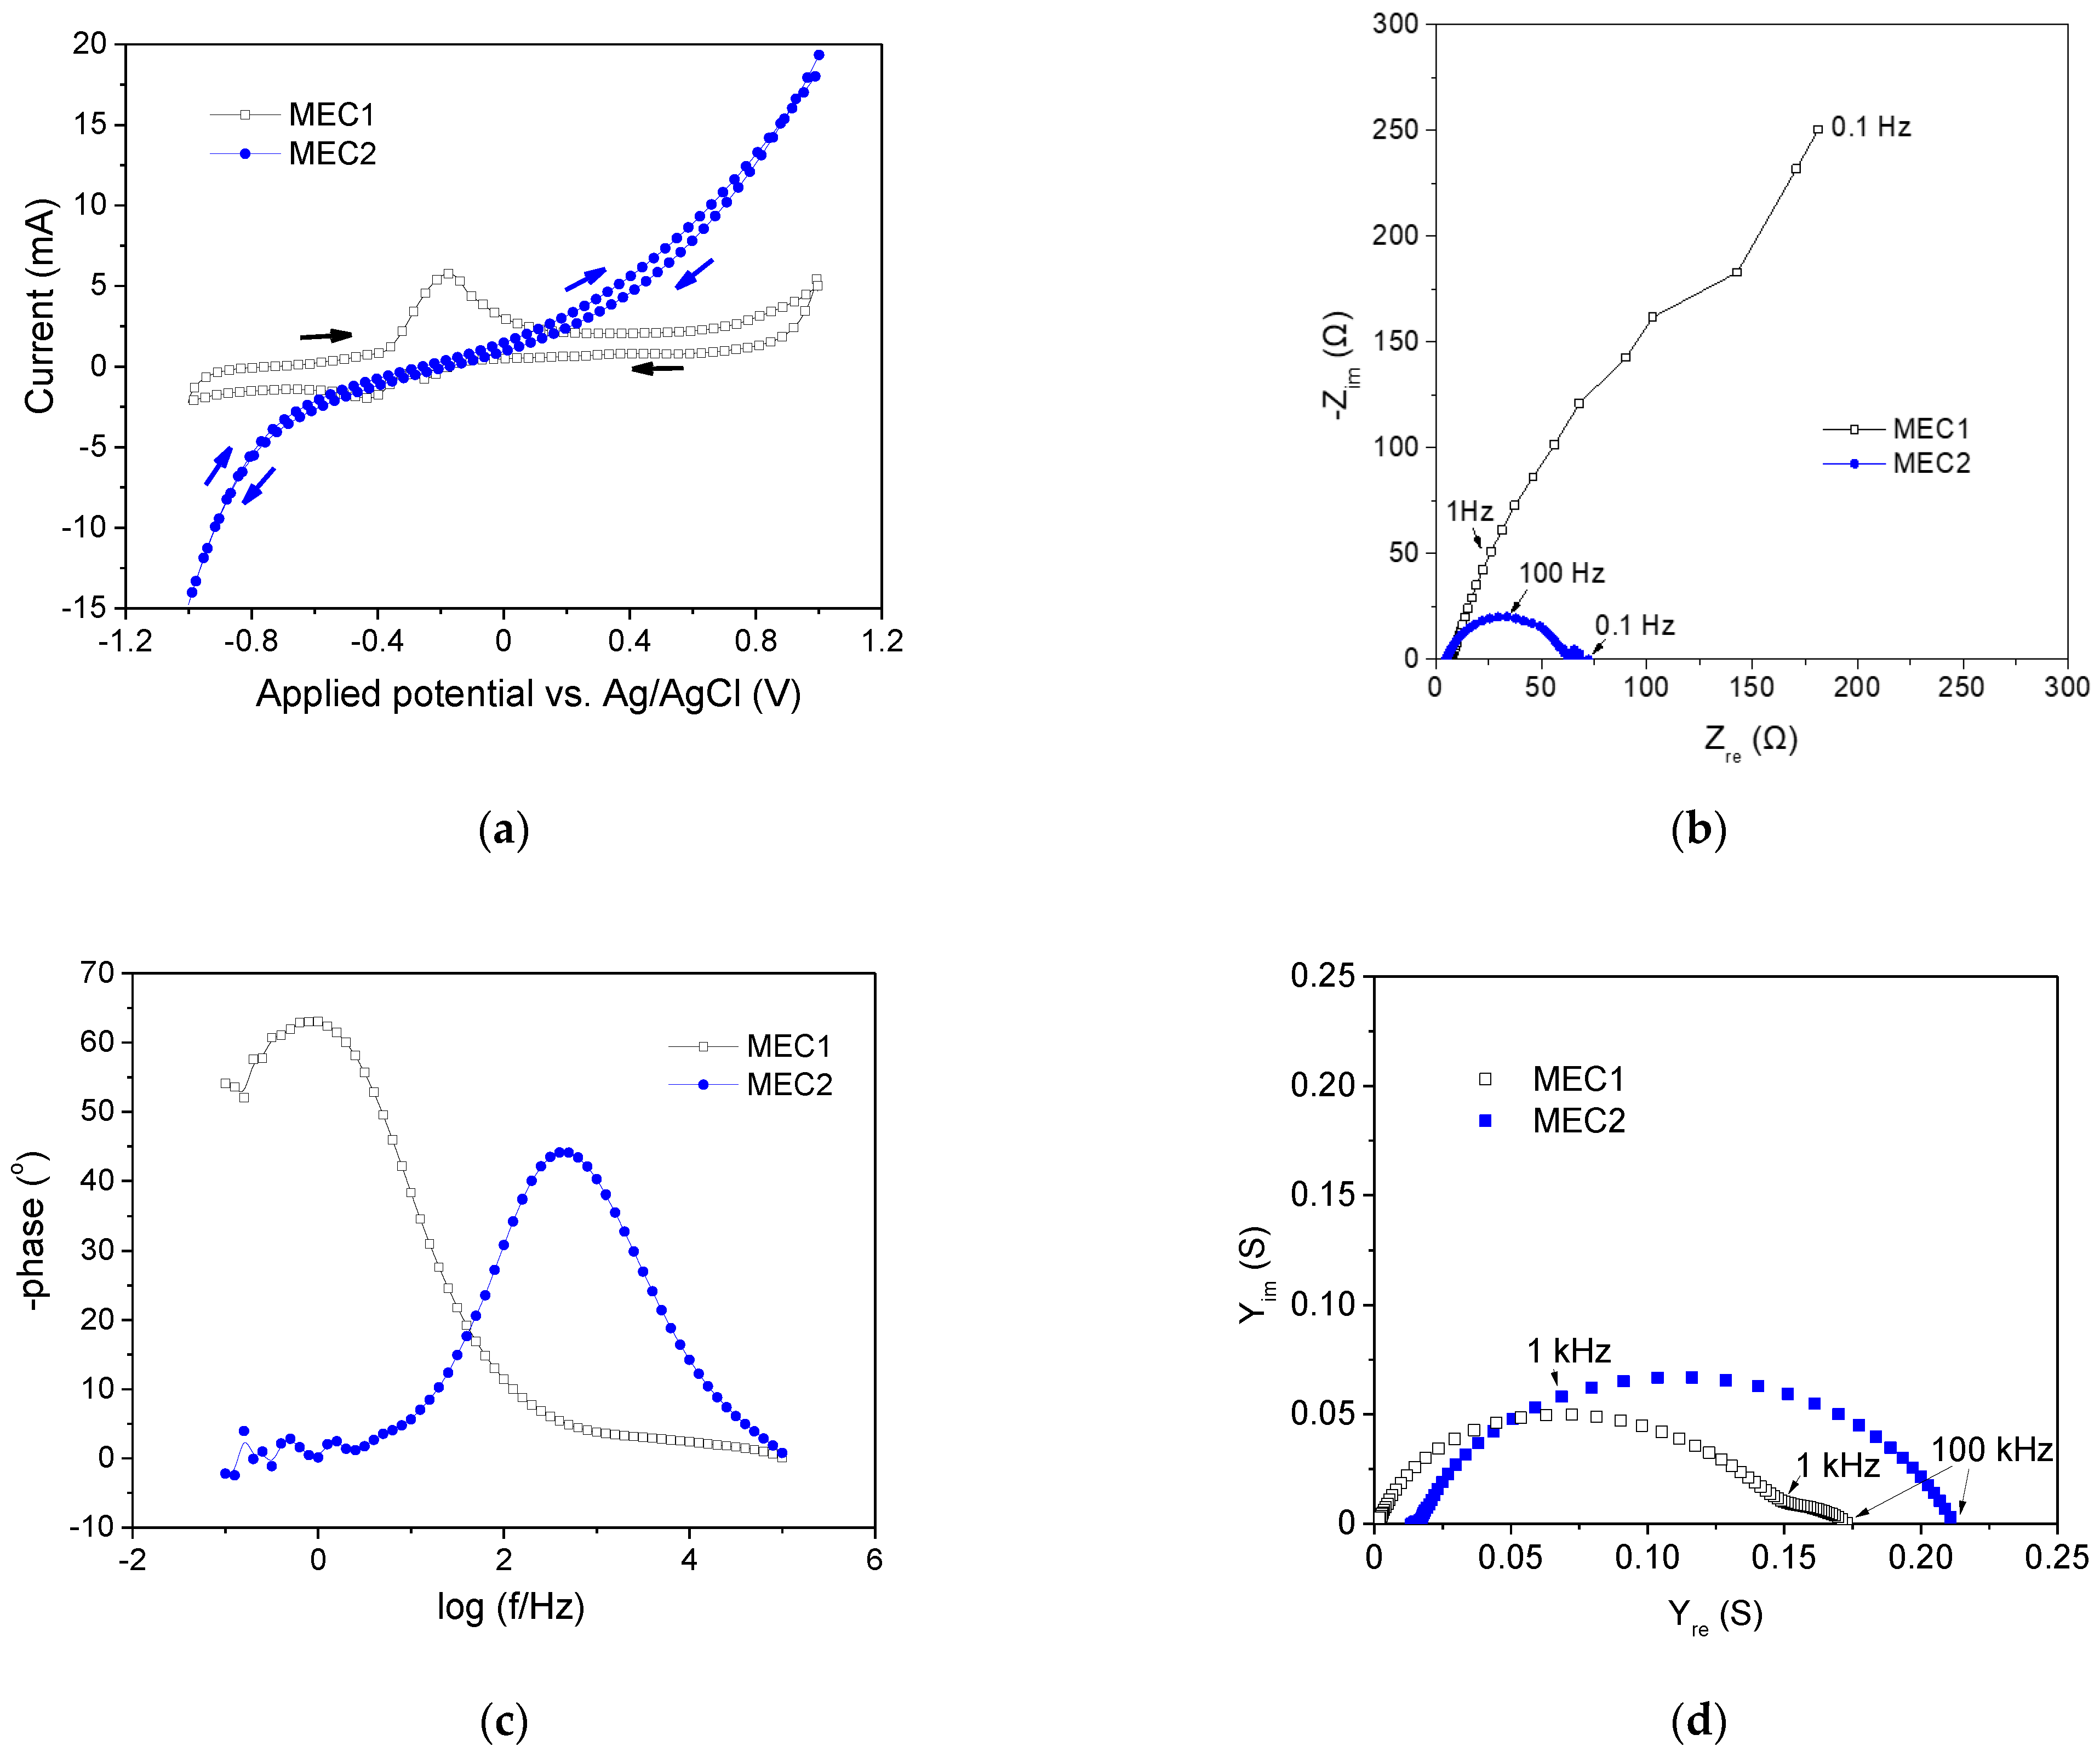
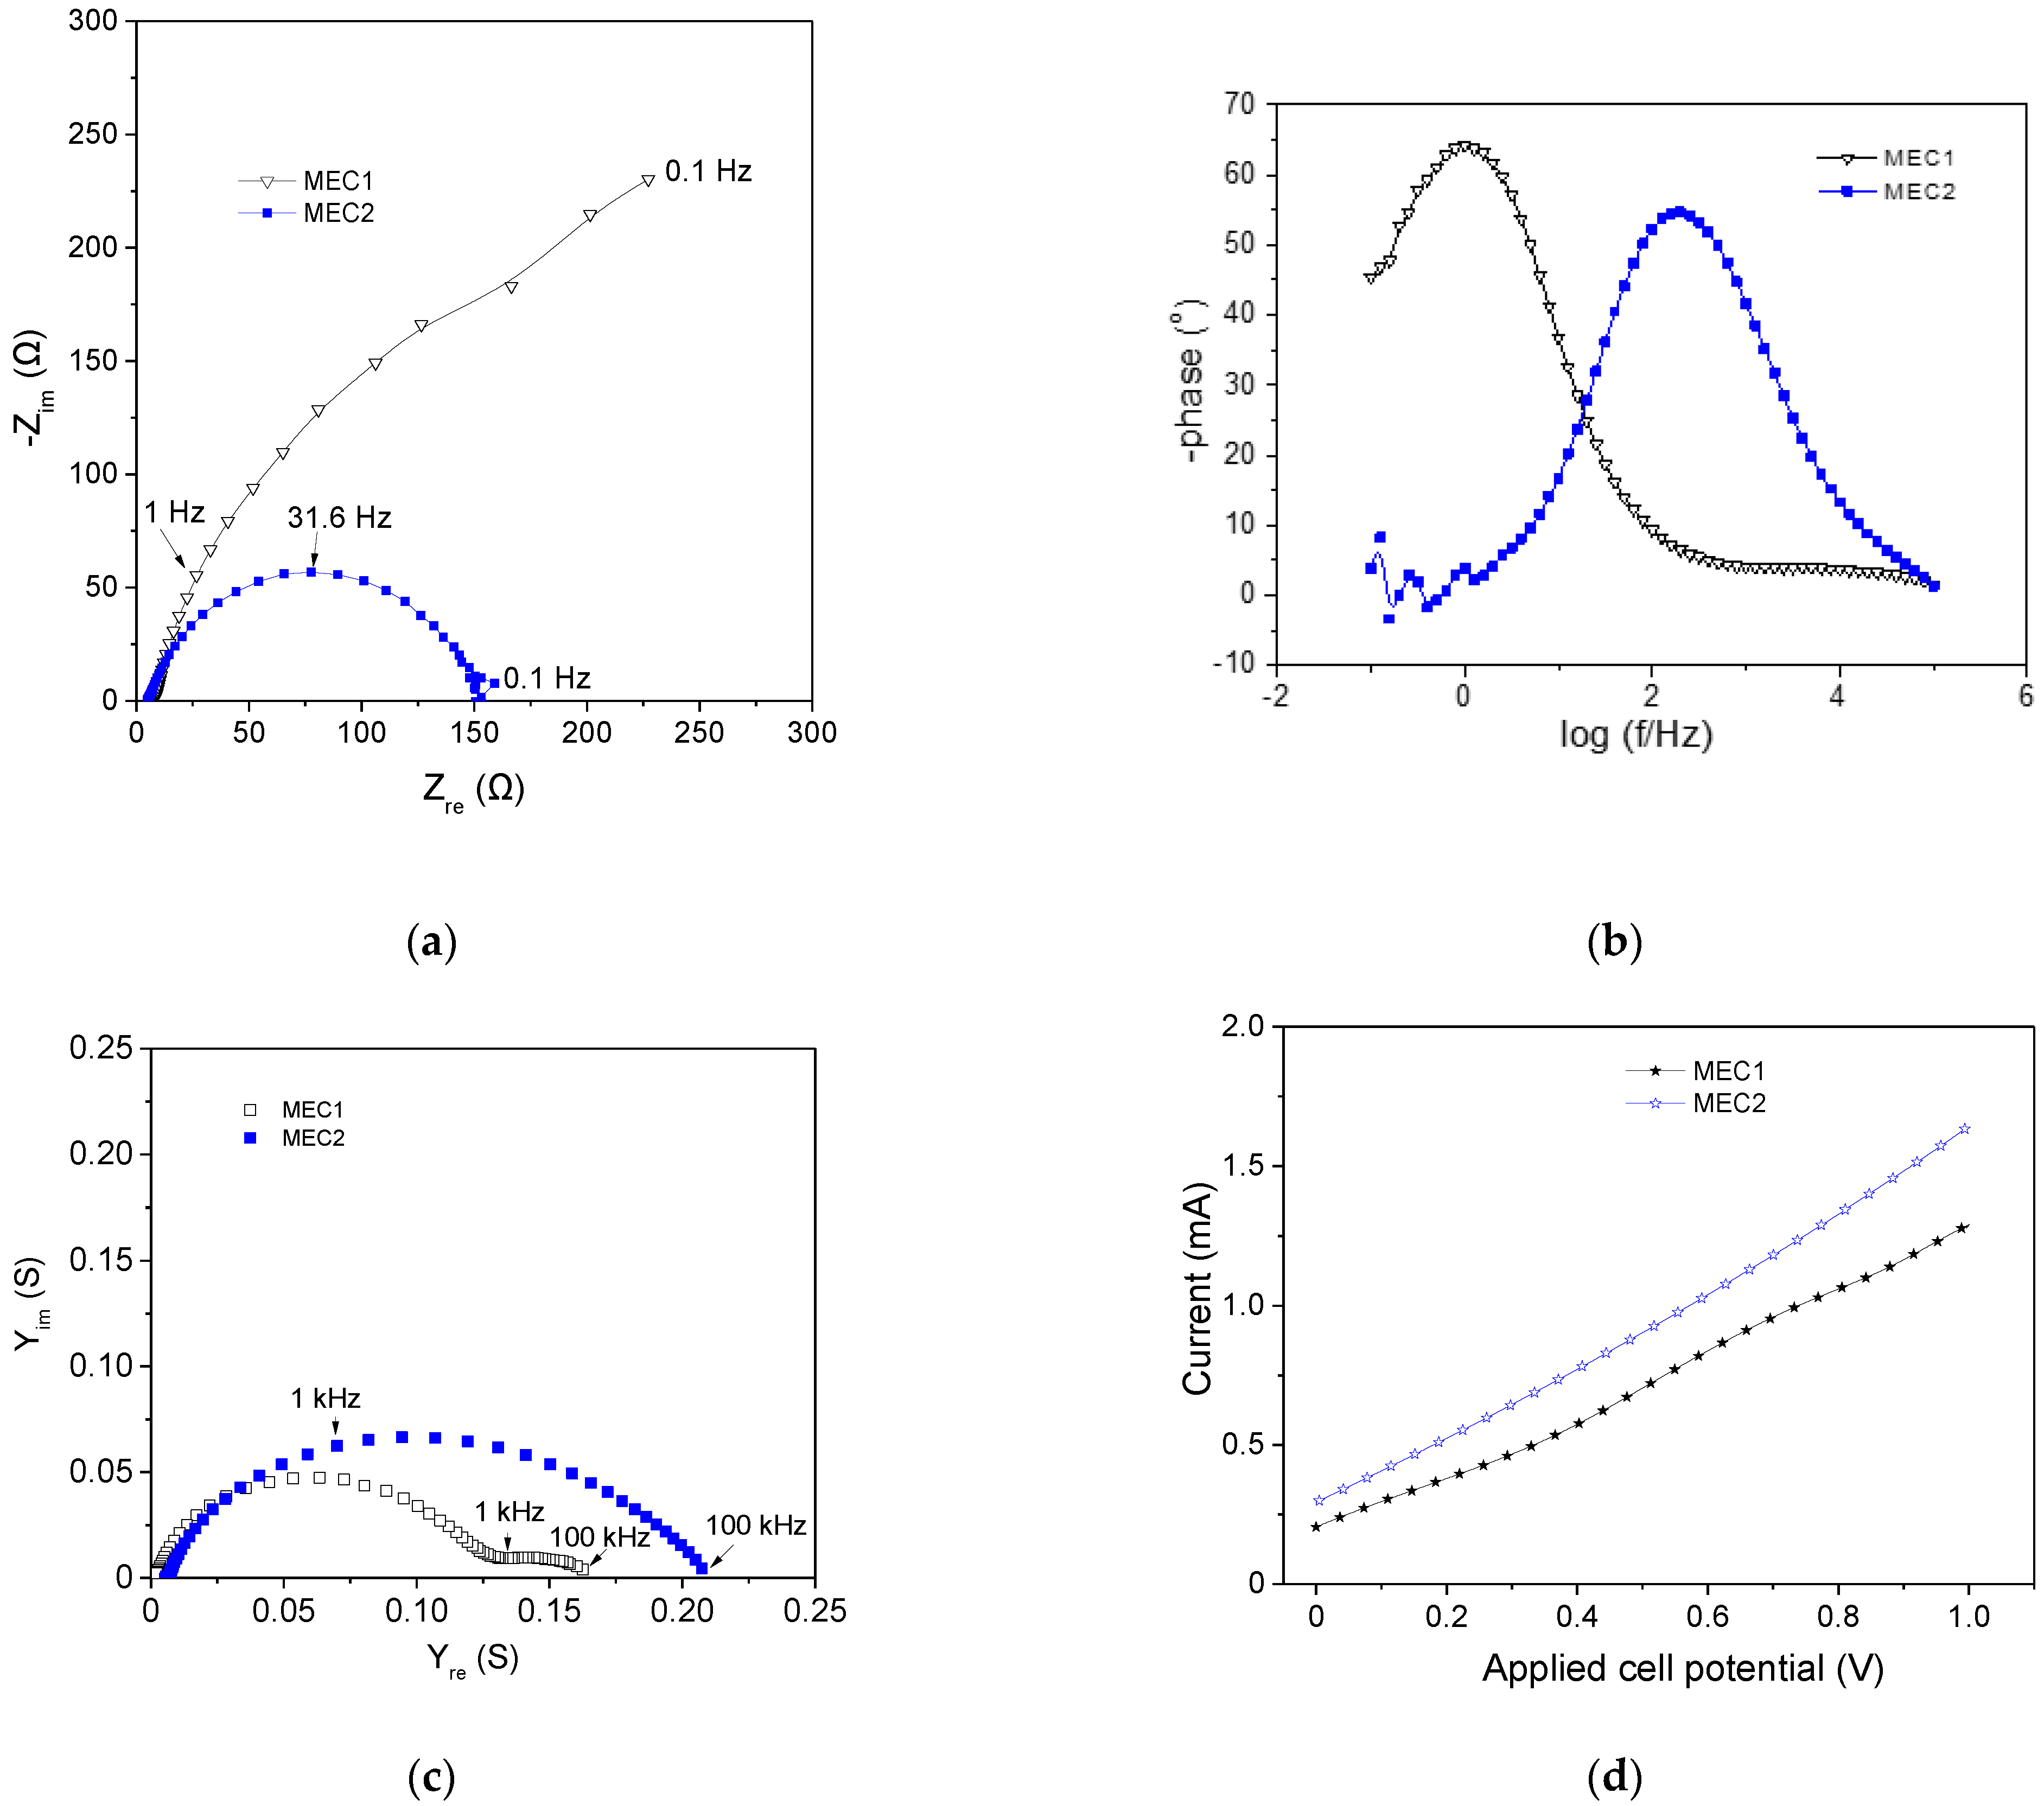
3.4. Electrochemical Characterization of MECs

Figure 10 shows results of electrochemical measurements (CV, EIS) carried out in both MECs, 72 h after the onset of the operation cycle with acetate-based synthetic wastewater as electron donor when the COD was equal to ca. 625 mg O2/L for MEC1 and 440 mg O2/L for MEC2. Regarding the qualitative characteristics of the obtained CVs (Figure 10a) it is evident that the anode electrode material affects significantly the electrochemical characteristics of the anode, which in turn affects the performance of each MEC. Specifically, in the case of the CP anode electrode (MEC1), oxidation, as well as reduction peaks, are observed (at ca. −0.17 V in the forward scan and at ca. −0.25 V and −0.43 V in the backward scan) whereas in the case of the Thin-MWCNT-COOH-buckypaper anodic electrode no obvious peaks appear. In general, the CNT-based anode appears less polarizable than the CP anode if compared over the entire potential range −1 to 1 V vs. Ag/AgCl, whereas it exhibits a less pronounced capacitive behavior in view of the narrow CV recorded for this electrode.
These conclusions are corroborated by a comparison of the EIS characteristics of the two anodes at 0.9 V vs. Ag/AgCl, which are depicted in Figure 10b–d, in the form of Nyquist plots (Figure 10b), phase angle vs. log (frequency) Bode plots (Figure 10c) and admittance plots (Figure 10d). For both MEC1 and MEC2, the ohmic resistance component is equal to ca. 6 Ω (as determined by the intersection of the Nyquist plots with the Zre axis at high frequencies). This is rather expected since the same anolyte and electrode arrangement was used in both MECs. On the other hand, as concluded by comparing the corresponding Nyquist plots, the polarization resistance is obviously much larger for the MEC1 anode compared to the MEC2 anode, in agreement with the CV results (Figure 10a). As shown in Figure 10c, a single peak is observed in the Bode plots for both MEC anodes, implying that a single process mainly determines the impedance characteristics of the compared anode electrodes, although two processes are discernible in the admittance plot in Figure 10d for the MEC1 anode. However, the high frequency (above ca. 1 kHz) process has a minimal contribution to the polarization resistance of the MEC1 anode, as shown in the corresponding Nyquist plot (Figure 10b). The location of the peak for the MEC1 anode in the Bode plot (Figure 10c) at lower frequencies compared to that for the MEC2 anode implies (for the same ohmic resistance) an intrinsically slower process, at this specific anode potential, in accordance with higher polarizability. It is also observed that for the MEC1 anode the phase angle at the peak in the Bode plot is closer to 90° than that for MEC2, which indicates a more pronounced capacitive behavior, in agreement with the conclusion drawn by comparison of the corresponding CV.
In general, as a lower polarization resistance is related to a better MEC performance in terms of hydrogen production, there seems to be an apparent contradiction between the aforementioned electrochemical characteristics of MEC1 and MEC2 and their performance, as it concerns both the obtained current (Figure 5b) and hydrogen production (Table 2). However, in the compared systems (with acetate as substrate) an applied voltage 0.9 V (yielding ca. 3.5 A/m2 for MEC1 and 2.4 A/m2 for MEC2 or, equivalently, a current equal to ca. 1.4 mA for MEC1 and 0.96 mA for MEC2) corresponds to anode potentials in the region near 0 V vs. Ag/AgCl. Equivalently, a comparison of the EIS characteristics of the MEC1 and MEC2 anodes at 0.9 V vs. Ag/AgCl corresponds to MEC potential much larger than 0.9 V. Moreover, the worst performance of MEC2 for hydrogen production may be related to the high toxicity of the CNT anodic material which in turn may affect negatively the metabolism of microorganisms.
The electrochemical characteristics of MECs were also determined at the end of the second operation phase, with DF effluent as electron donor, specifically 192 h and 336 h after the onset of the cycle for MEC1 and MEC2, respectively, when COD in anolytes of both MECs was lower than 100 mg O2/L.
The EIS characteristics of the anodes of the two MECs at 0.9 V vs. Ag/AgCl are compared in Figure 11, in the form of Nyquist plots (Figure 11b), phase angle vs. log (frequency) Bode plots (Figure 11c) and admittance plots (Figure 11d). As shown in the Nyquist plots (Figure 11a), the ohmic component is small for both anodes (6.1 Ω in the case of CP and 4.8 Ω in the case of CNT anode) whereas, at the specific anode potential, the polarization resistance for the MEC2 anode is much smaller than for the MEC1 anode. Similar to the case of acetate substrate, the Bode plot (Figure 11b) for each anode consists of a dominant peak which is shifted to lower frequencies for the MEC1 anode and corresponds to a phase angle closer to 90° compared to that for the MEC2 anode, indicating a slightly more pronounced capacitive behavior. It is noted that for the MEC1 anode two processes are evident in the admittance plot (Figure 11c), however, the process corresponding to frequencies above ca. 1 kHz does not contribute appreciably to the polarization resistance, as shown in the corresponding Nyquist plot (Figure 11a).
The aforementioned EIS behavior is qualitatively similar to that observed for acetate-synthetic wastewater as feed (Figure 10), although differences exist concerning the corresponding quantitative features. Comparison between the anode characteristics for operation with the two different substrates is not attempted here as the electrochemical characterization was performed at different stages of the corresponding cycles. It is noted that for DF effluent application of anode potential equal to 0.9 V vs. Ag/AgCl corresponded to a current of ca. 1.65 mA for MEC1 and 2.2 mA for MEC2. As shown in Figure 11d, where current-potential curves are presented for the two MECs operating on DF effluent, at 0.9 V applied cell potential, the obtained current was equal to ca. 1.17 mA for MEC1 and 1.48 mA for MEC2. This indicates that the applied anode potential (0.9 V vs. Ag/AgCl) in the EIS measurements corresponded to MEC potential higher than 0.9 V, as in the case of acetate substrate.
Summarizing, the qualitative features of the EIS plots for the anode electrodes (CP or Thin-MWCNT-COOH-buckypaper) did not change appreciably with changing substrate (acetate or DF effluent), although the comparison is not straightforward for reasons mentioned above. Observed differences in the polarization resistance values indicate differences in the rate of the underlying electrochemical processes. The worse performance of MEC2 compared to MEC1 concerning hydrogen production for both substrates is apparently not in agreement with the measured lower polarization resistance of the MEC2 anode. This can be partly explained by the fact that a comparison of the EIS characteristics of the MEC anodes was made at anode potential (0.9 V vs. Ag/AgCl) which corresponded to MEC potential higher than 0.9 V (at which operation of MEC1 and MEC2 was tested), the difference being significantly larger for acetate syntheticsubstrates. As discussed above, this discrepancy could also be attributed to the negative effects of nanotubes on biofilm formation in the case of MEC2. Both MEC1 and MEC2 exhibited superior performance in operation (at 0.9 V) with acetate synthetic wastewater compared to DF effluent, which can be associated with a lower polarization resistance of the anode in the former case and, concomitantly, with a lower polarization resistance for MEC1. This difference in polarization resistance can be seen in Figure 12, where the EIS characteristics of MEC2 for operation at 0.9 V with acetate synthetic wastewater and DF effluent are compared in the form of Nyquist plots. The polarization resistance, calculated as the difference of the intersections of the Nyquist plot with the Zre axis at high (100 kHz) and low (1 Hz) frequencies, is equal to ca. 184 Ω for acetate and ca. 290 Ω for DF effluent as feed. Notwithstanding that the EIS data for the two feeds were obtained at different stages of the corresponding cycles, this difference in polarization resistances agrees with the better performance of MEC2 for acetate substrate, considering also that for both feeds the ohmic resistance was practically the same, equal to ca. 452 Ohm. The fact that the ohmic resistance of MEC2 is of the same order and higher than its polarization resistance at 0.9 V indicates that a better design of MEC2 to minimize ohmic resistance can significantly improve its performance. The same is also expected for MEC1.

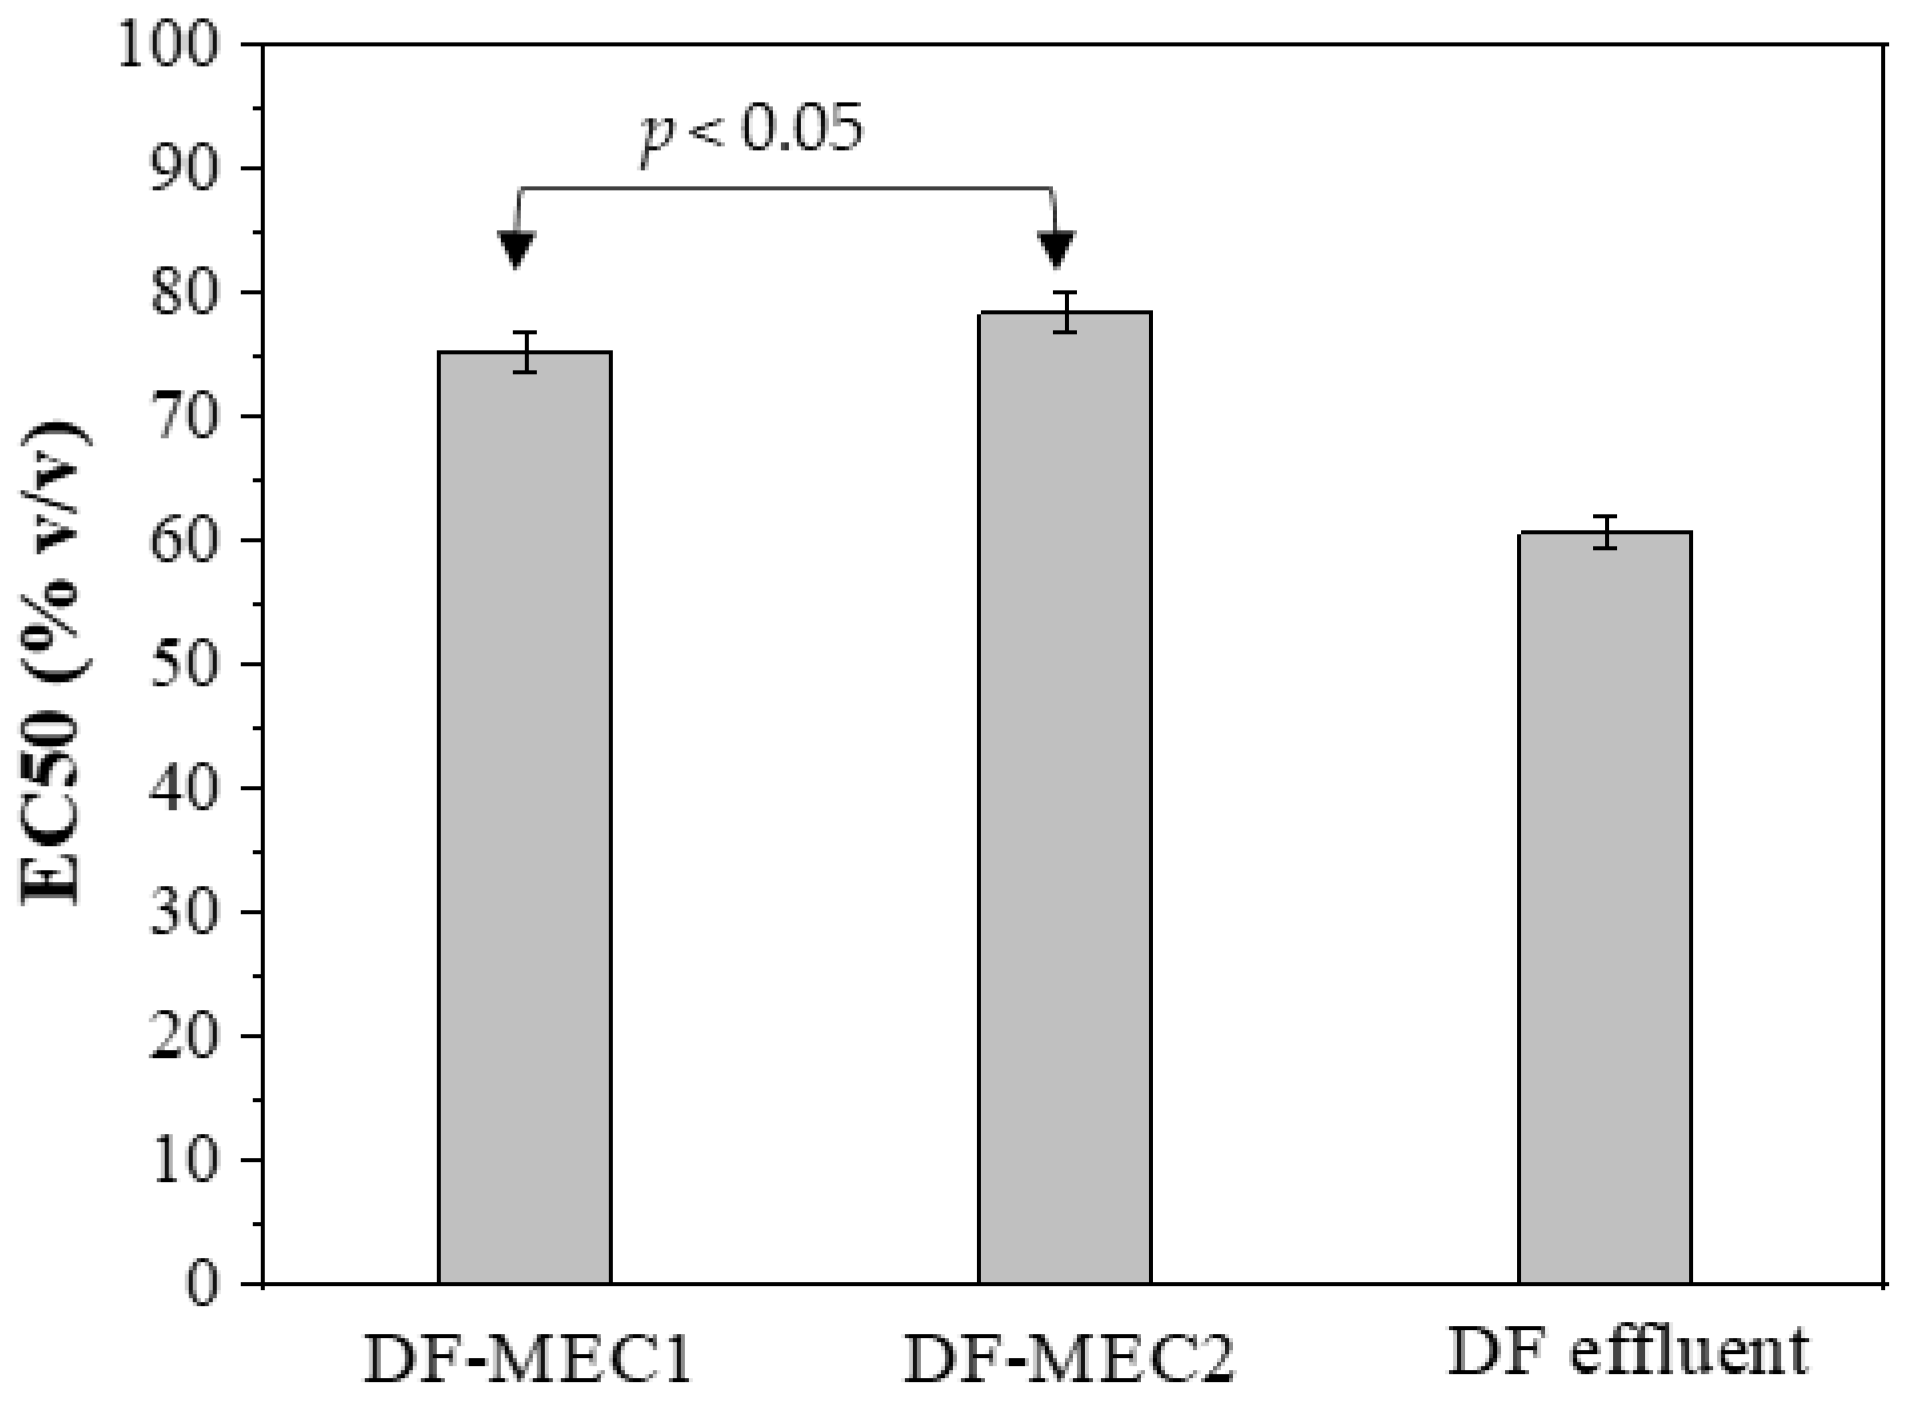
3.5. Toxicity Assessment

In the present study, the toxic potential of DF-MEC effluents was assessed, using the crustacean Thamnocephalus platyurus. To our knowledge, it is the first time that the toxic potency of a DF-MEC effluent is evaluated. According to the results, DF-MEC1 and DF-MEC2 treated samples were significantly less toxic than the DF sample, based on the respective higher EC values (Table 4, Figure 13). Indeed, Karadima et al. [29] reported that the toxic potency of the DF effluent of a hydrogenogenic reactor fed with CW against the freshwater organisms; Daphnia magna, T. platyurus and Danio rerio, remained high enough, preventing thus the safe disposal of the final effluents into the environment, which is in accordance with the current study. The latter could be attributed to the removal of COD [32,47] as well as the potent removal of other inorganic substances (i.e., nitrogen-derived, phosphates, etc.) [29,32,48]. However, considering the safe disposal of DF-MEC effluents, more efforts could be performed, in terms of MEC utilization for enhancing the removal of DF-MEC toxic potential in all cases.

3.6. Energy Recovery from Combining DF with MEC Technology

From the values of Table 3, it is calculated that in MEC1 with CP as an anode electrode, 7.39 L H2 can be produced per L of DF effluent, which corresponds to 310 mL H2/g COD consumed. Taking into account that during DF of CW in the UFCR 2.08 L H2 per L of CW are also produced (220 mL H/g COD consumed) [23] and that 1 L of CW produces 1 L of DF effluent; it can be concluded that the combination of both processes enhances the overall hydrogen yield to 9.47 L H2 per L of CW. Despite the fact that these results were obtained from lab-scale experiments, it is clearly presented the feasibility of establishing a two-stage process (DF-MEC), instead of a one-stage (DF), to increase the overall energy production from CW and to make use of its carbon content. During DF, even under optimum conditions, in which the maximum theoretical hydrogen yield (4 mol/mol sugars) could be achieved, only a 20% COD reduction occurs [49]. In this respect, further exploitation of the organic content of the DF effluent, in a second process, could increase the COD reduction efficiency, thus leading to an almost zero-carbon effluent [50], a fact that is also reinforced by the toxicity data of the current study.
Alternatives to DF-MEC could be DF-anaerobic digestion (AD) [51,52] or DF-MFC technology [53], which were found to be promising for the treatment of the effluents of hydrogenogenic reactors fed with CW. A two-stage technology, such as DF-MEC could be installed in the premises of a cheese-making company, without the requirements of experienced labor or expensive equipment. However, a detailed cost analysis should be performed so that all economical and technical aspects will be taken into account.

4. Conclusions

Two different anode electrodes, a carbon nanotube (CNT)-buckypaper and a commercial carbon paper (CP) were assessed in terms of hydrogen production and main electrochemical characteristics in a two-chamber microbial electrolysis cell (MEC). The results showed that the use of CP as anode led to a better overall performance of the MEC, compared to the CNT-buckypaper electrode, which was attributed to the better colonization of the CP electrode with electroactive microorganisms, something that was confirmed by SEM images. When using the cheese whey (CW) fermentation effluent as substrate in the MEC, a dual environmental benefit is accomplished, combining sustainable bioenergy generation, in the form of hydrogen with the CW treatment, a fact that is also reinforced by the toxicity data of the current study.

Author Contributions

Conceptualization; resources; project administration; funding acquisition: G.A.; Investigation: I.A., G.A., G.B., A.S.B. and S.D.; Supervision; Visualization: G.A., G.V., S.B., S.D. and G.L.; Writing—original draft preparation: G.A., G.B., A.S.B. and S.D.; Writing—review and editing: G.A., S.B., S.D., G.L. and G.V. All authors have read and agreed to the published version of the manuscript.

Funding

This research was funded in the frame of the research project «APPLICATION OF MICROBIAL ELECTROCHEMICAL TECHNOLOGIES TOWARDS ADVANCED BIOFUELS PRODUCTION», which is supported by the 1st Call for H.F.R.I. Research Projects for the support of Post-doctoral Researchers (fellowship of G Antonopoulou).

Institutional Review Board Statement

Not applicable.

Informed Consent Statement

Not applicable.

Data Availability Statement

The datasets discussed and analyzed in the current study are available from the corresponding author upon request.

Acknowledgments

The authors gratefully acknowledge I. Mourikis for his valuable suggestions, at the beginning of the experiments.

Conflicts of Interest

The authors declare no conflict of interest.

References

  1. Liu, H.; Grot, S.; Logan, B.E. Electrochemically assisted microbial production of hydrogen from acetate. Environ. Sci. Technol. 2005, 39, 4317–4320. [Google Scholar] [CrossRef] [PubMed]
  2. Chaurasia, A.K.; Mondal, P. Enhancing biohydrogen production from sugar industry wastewater using Ni, Ni–Co and Ni–Co–P electrodeposits as cathodes in microbial electrolysis cells. Chemosphere 2022, 286, 131728. [Google Scholar] [CrossRef] [PubMed]
  3. Logan, B.E.; Call, D.; Cheng, S.; Hamelers, H.V.M.; Sleutels, T.H.J.A.; Jermiasse, A.W.; Rozendl, R.A. Microbial electrolysis cells for high yield hydrogen gas production from organic matter. Environ. Sci. Technol. 2008, 42, 8630–8640. [Google Scholar] [CrossRef]
  4. Yu, Z.; Leng, X.; Zhao, S.; Ji, J.; Zhou, T.; Khan, A.; Kakde, A.; Liu, P.; Li, X. A review on the applications of microbial electrolysis cells in anaerobic digestion. Bioresour. Technol. 2018, 255, 340–348. [Google Scholar] [CrossRef] [PubMed]
  5. Rousseau, R.; Etcheverry, L.; Roubaud, E.; Basseguy, R.; Delia, M.-L.; Bergel, A. Microbial electrolysis cell (MEC): Strengths, weaknesses and research needs from electrochemical engineering standpoint. Appl. Energy 2020, 57, 113938. [Google Scholar] [CrossRef]
  6. Kim, K.N.; Lee, S.H.; Kim, H.; Park, Y.H.; In, S.I. Improved microbial electrolysis cell hydrogen production by hybridization with a TiO2 nanotube array photoanode. Energies 2018, 11, 3184. [Google Scholar] [CrossRef] [Green Version]
  7. Pham, T.H.; Aelterman, P.; Verstraete, W. Bioanode performance in bioelectrochemical systems: Recent improvements and prospects. Trends Biotechnol. 2009, 27, 168–178. [Google Scholar] [CrossRef] [PubMed]
  8. Rismani-Yazdi, H.; Carver, S.M.; Christy, A.D.; Tuovinen, O.H. Cathodic limitations in microbial fuel cells: An overview. J. Power Sources 2008, 180, 683–694. [Google Scholar] [CrossRef]
  9. Mier, A.A.; Olvera-Vargas, H.; Mejía-López, M.; Longoria, A.; Verea, L.; Sebastian, P.J.; Arias, D.M. A review of recent advances in electrode materials for emerging bioelectrochemical systems: From biofilm-bearing anodes to specialized cathodes. Chemosphere 2021, 283, 131138. [Google Scholar] [CrossRef] [PubMed]
  10. Jayabalan, T.; Manickam, M.; Naina Mohamed, S. NiCo2O4-graphene nanocomposites in sugar industry wastewater fed microbial electrolysis cell for enhanced biohydrogen production. Renew. Energy 2020, 154, 1144–1152. [Google Scholar] [CrossRef]
  11. Fonseca, E.U.; Kim, K.-Y.; Rossi, R.; Logan, B.E. Improving microbial electrolysis stability using flow-through brush electrodes and monitoring anode potentials relative to thermodynamic minima. Int. J. Hydrogen Energy 2011, 46, 9514–9522. [Google Scholar] [CrossRef]
  12. Liu, Y.; Zhang, X.; Zhang, Q.; Li, C. Microbial fuel cells: Nanomaterials based on anode and their application. Energy Technol. 2020, 8, 2000206. [Google Scholar] [CrossRef]
  13. Liang, P.; Wang, H.; Xia, X.; Huang, X.; Mo, Y.; Cao, X.; Fan, M. Carbon nanotube powders as electrode modifier to enhance the activity of anodic biofilm in microbial fuel cells. Biosens. Bioelectron. 2011, 26, 3000–3004. [Google Scholar] [CrossRef] [PubMed]
  14. Sharma, T.; Reddy, A.L.M.; Chandra, T.S.; Ramaprabhu, S. Development of carbon nanotubes and nanofluids based microbial fuel cell. Int. J. Hydrogen Energy 2008, 33, 6749–6754. [Google Scholar] [CrossRef]
  15. Higgins, S.R.; Foerster, D.; Cheung, A.; Lau, C.; Bretschger, O.; Minteer, S.D.; Nealson, K.; Atanassov, P.; Cooney, M.J. Fabrication of macroporous chitosan scaffolds doped with carbon nanotubes and their characterization in microbial fuel cell operation. Enzym. Microb. Technol. 2011, 48, 458–465. [Google Scholar] [CrossRef]
  16. Xie, X.; Hu, L.; Pasta, M.; Wells, G.F.; Kong, D.; Criddle, C.S.; Cui, Y. Three-dimensional carbon nanotube-textile anodes for high-performance microbial fuel cells. Nano Lett. 2011, 11, 291–296. [Google Scholar] [CrossRef]
  17. Thepsuparungsikul, N.; Phonthammachai, N.; Ng, H.Y. Multi-walled carbon nanotubes as electrode material for microbial fuel cell. Water Sci. Technol. 2012, 65, 1208–1214. [Google Scholar] [CrossRef] [PubMed]
  18. Thepsuparungsikul, N.; Ng, T.C.; Lefebvre, O.; Ng, H.Y. Different types of carbon nanotube-based anodes to improve microbial fuel cell performance. Water Sci. Technol. 2014, 69, 1900–1910. [Google Scholar] [CrossRef]
  19. Zhang, Y.; Liu, L.; Van Der Bruggen, B.; Yang, F. Nanocarbon based composite electrodes and their application in microbial fuel cells. J. Mater. Chem. A 2017, 5, 12673–12698. [Google Scholar] [CrossRef]
  20. Wei, J.; Liang, P.; Huang, X. Recent progress in electrodes for microbial fuel cells. Bioresour. Technol. 2011, 102, 9335–9344. [Google Scholar] [CrossRef] [PubMed]
  21. Wang, L.; Chen, Y.; Huang, Q.; Feng, Y.; Zhu, S.; Shen, S. Hydrogen production with carbon nanotubes based cathode catalysts in microbial electrolysis cells. J. Chem. Technol. Biotechnol. 2012, 87, 1150–115610. [Google Scholar] [CrossRef]
  22. Yang, Q.; Jiang, Y.; Xu, Y.; Qiu, Y.; Chen, Y.; Zhu, S.; Shen, S. Hydrogen production with polyaniline/multi-walled carbon nanotube cathode catalysts in microbial electrolysis cells. J. Chem. Technol. Biotechnol. 2014, 90, 1263–1269. [Google Scholar] [CrossRef]
  23. Alexandropoulou, M.; Lyberatos, G.; Antonopoulou, G. Comparison of the continuous fermentative hydrogen production efficiency from cheese whey in suspended and attached-biomass systems. In Proceedings of the 17th International Conference on Environmental Science and Technology, Athens, Greece, 1–4 September 2021. [Google Scholar]
  24. Rozsenberszki, T.; Kook, L.; Bakonyi, P.; Nemestothy, N.; Logrono, W.; Perez, M.; Urquizo, G.; Recalde, C.; Kurdi, R.; Sarkady, A. Municipal waste liquor treatment via bioelectrochemical and fermentation (H2 + CH4) processes: Assessment of various technological sequences. Chemosphere 2017, 171, 692–701. [Google Scholar] [CrossRef] [PubMed]
  25. Rivera, I.; Bakonyi, P.; Cuautle-Marín, M.A.; German, B. Evaluation of various cheese whey treatment scenarios in single chamber microbial electrolysis cells for improved biohydrogen production. Chemosphere 2017, 174, 253–259. [Google Scholar] [CrossRef]
  26. Marone, A.; Ayala-Campos, O.R.; Trably, E.; Carmona-Martınez, A.A.; Moscoviz, R.; Latrille, E.; Steyer, J.-P.; Alcaraz-Gonzalez, V.; Bernet, N. Coupling dark fermentation and microbial electrolysis to enhance biohydrogen production from agro-industrial wastewaters and by-products in a bio-refinery framework. Int. J. Hydrogen Energy 2017, 42, 1609–1621. [Google Scholar] [CrossRef]
  27. Chookaew, T.; Prasertsan, P.; Ren, Z.J. Two-stage conversion of crude glycerol to energy using dark fermentation linked with microbial fuel cell or microbial electrolysis cell. New Biotechnol. 2014, 31, 179–184. [Google Scholar] [CrossRef]
  28. Moreno, R.; Escapa, A.; Cara, J.; Carracedo, B.; Gomez, X. A two stage process for hydrogen production from cheese whey: Integration of dark fermentation and biocatalyzed electrolysis. Int. J. Hydrogen Energy 2015, 40, 168–175. [Google Scholar] [CrossRef]
  29. Karadima, C.; Theodoropoulos, C.; Iliopoulou-Georgudaki, J. Environmental hazard assessment of cheese manufacturing effluent treated for hydrogen production. Bull. Environ. Contam. Toxicol. 2009, 83, 428–434. [Google Scholar] [CrossRef]
  30. Antonopoulou, G.; Stamatelatou, K.; Bebelis, S.; Lyberatos, G. Electricity generation from synthetic substrates and cheese whey using a microbial fuel cell. Biochem. Eng. J. 2010, 50, 10–15. [Google Scholar] [CrossRef]
  31. Antonopoulou, G.; Ntaikou, I.; Pastore, C.; di Bitondo, L.; Bebelis, S.; Lyberatos, G. An overall perspective for the energetic valorization of household food waste using microbial fuel cell technology of its extract, coupled with anaerobic digestion of the solid residue. Appl. Energy 2019, 242, 1064–1073. [Google Scholar] [CrossRef]
  32. Papadopoulos, K.P.; Argyriou, R.; Economou, C.N.; Charalampous, N.; Dailianis, S.; Tatoulis, T.I.; Tekerlekopoulou, A.G.; Vayenas, D.V. Treatment of printing ink wastewater using electrocoagulation. J. Environ. Manag. 2019, 237, 442–448. [Google Scholar] [CrossRef]
  33. Genethliou, C.; Dailianis, S.; Kornaros, M. Biodegradation of olive mill wastewater phenolic compounds in a thermophilic anaerobic upflow packed bed reactor and assessment of their toxicity in digester effluents. J. Environ. Manag. 2020, 255, 109882. [Google Scholar] [CrossRef]
  34. Tsouloufa, A.; Dailianis, S.; Karapanagioti, H.K.; Manariotis, I.D. Physicochemical and toxicological assay of leachate from malt spent rootlets biochar. Bull. Environ. Contam Toxicol. 2020, 104, 634–641. [Google Scholar] [CrossRef]
  35. APHA; AWWA; WPCF. Standard Methods for the Examination of Water and Wastewater; Franson, M.A., Ed.; American Public Health Association: Washington, DC, USA, 1995. [Google Scholar]
  36. Antonopoulou, G.; Vayenas, D.; Lyberatos, G. Ethanol and hydrogen production from sunflower straw: The effect of pretreatment on the whole slurry fermentation. Biochem. Eng. J. 2016, 116, 65–74. [Google Scholar] [CrossRef]
  37. Dounavis, A.S.; Ntaikou, I.; Kamilari, M.; Lyberatos, G. Production of bio-based hydrogen enriched methane from waste glycerol in a two stage continuous system. Waste Biomass Valor 2016, 7, 677–689. [Google Scholar] [CrossRef]
  38. Dresselhaus, M.S.; Dresselhaus, G.; Saito, R.; Jorio, A. Raman spectroscopy of carbon nanotubes. Phys. Rep. 2005, 409, 47–99. [Google Scholar] [CrossRef]
  39. Rasheed, T.; Hassan, A.A.; Kausar, F.; Sher, F.; Bilal, M.; Iqbal, H.M.N. Carbon nanotubes assisted analytical detection—sensing/delivery cues for environmental and biomedical monitoring. Trends Anal. Chem 2020, 132, 116066. [Google Scholar] [CrossRef]
  40. Flayac, C.; Trably, E.; Bernet, N. Microbial anodic consortia fed with fermentable substrates in microbial electrolysis cells: Significance of microbial structures. Bioelectrochem 2018, 123, 219–226. [Google Scholar] [CrossRef]
  41. Rozendal, R.A.; Hamelers, H.V.M.; Euverink, G.J.W.; Metz, S.J.; Buisman, C.J.N. Principle and perspectives of hydrogen production through biocatalyzed electrolysis. Int. J. Hydrogen Energy 2006, 31, 1632–1640. [Google Scholar] [CrossRef]
  42. Rozendal, R.; Hamelers, H.V.M.; Molenkamp, R.J.; Buisman, C.J.N. Performance of single chamber biocatalyzed electrolysis with different types of ion exchange membranes. Water Res. 2007, 41, 1984–1994. [Google Scholar] [CrossRef]
  43. Jeremiasse, A.W.; Hamelers, H.V.M.; Buisman, C.J.N. Microbial electrolysis cell with a microbial biocathode. Bioelectrochem 2010, 78, 39–43. [Google Scholar] [CrossRef]
  44. De-la-Pinta, I.; Cobos, M.; Ibarretxe, I.; Montoya, E.; Eraso, E.; Guraya, T.; Quindos, G. Effect of biomaterials hydrophobicity and roughness on biofilm development. J. Mater. Sci. Mater. Med. 2019, 30, 30–77. [Google Scholar] [CrossRef]
  45. Rivera, I.; Buitron, G.; Bakonyi, P.; Nemestothy, N.; Belafi-Bako, K. Hydrogen production in a microbial electrolysis cell fed with a dark fermentation effluent. J. Appl. Electrochem. 2015, 45, 1223–1229. [Google Scholar] [CrossRef]
  46. Li, X.-H.H.; Liang, D.-W.W.; Bai, Y.-X.X.; Fan, Y.-T.T.; Hou, H.-W.W. Enhanced H2 production from corn stalk by integrating dark fermentation and single chamber microbial electrolysis cells with double anode arrangement. Int. J. Hydrogen Energy 2014, 39, 8977–8982. [Google Scholar] [CrossRef]
  47. Siorou, S.; Vgenis, T.T.; Dareioti, M.A.; Vidali, M.S.; Efthimiou, I.; Kornaros, M.; Vlastos, D.; Dailianis, S. Investigation of olive mill wastewater (OMW) ozonation efficacy with the use of a battery of selected ecotoxicity and human toxicity assays. Aquat. Toxicol. 2015, 164, 135–144. [Google Scholar] [CrossRef]
  48. Baran, A.; Tarnawski, M. Phytotoxkit/Phytotestkit and Microtox® as tools for toxicity assessment of sediments. Ecotoxicol. Environ. Saf. 2013, 98, 19–27. [Google Scholar] [CrossRef] [PubMed]
  49. Antonopoulou, G.; Gavala, H.N.; Skiadas, I.V.; Angelopoulos, K.; Lyberatos, G. Biofuels generation from sweet sorghum: Fermentative hydrogen production and anaerobic digestion of the remaining biomass. Bioresour. Technol. 2008, 99, 110–119. [Google Scholar] [CrossRef]
  50. Satar, I.; Abu Bakar, M.H.; Wan Daud, W.R.; Mohd Yasin, N.H.; Somalu, M.R.; Kim, B.H. Feasibility of Ni/Ti and Ni/GF cathodes in microbial electrolysis cells for hydrogen production from fermentation effluent: A step toward real application. Int. J. Energy Res. 2020, 44, 7464–7476. [Google Scholar] [CrossRef]
  51. Antonopoulou, G.; Stamatelatou, K.; Venetsaneas, N.; Kornaros, M.; Lyberatos, G. Biohydrogen and methane production from cheese whey in a two –stage anaerobic process. Ind. Eng. Chem. Res. 2008, 47, 5227–5233. [Google Scholar] [CrossRef]
  52. Venetsaneas, N.; Antonopoulou, G.; Stamatelatou, K.; Kornaros, M.; Lyberatos, G. Using cheese whey for hydrogen and methane generation in a two-stage continuous process with alternative pH controlling approaches. Bioresour. Technol. 2008, 100, 3713–3717. [Google Scholar] [CrossRef]
  53. Antonopoulou, G.; Ntaikou, I.; Bebelis, S.; Lyberatos, G. On the evaluation of filtered and pretreated cheese whey as an electron donor in a single chamber microbial fuel cell. Biomass Convers. Biorefin. 2021, 11, 633–643. [Google Scholar] [CrossRef]
Figure 1. Raman spectrum of Thin-MWCNT-COOH buckypaper.
Energies 14 08375 g001
Figure 2. SEM image (top view) of (a) the prepared Thin-MWCNT-COOH buckypaper and (b) CP (for comparison).
Energies 14 08375 g002
Figure 3. Cumulative hydrogen production in the cathode of (a) MEC1 and (b) MEC2, for an acetate-based synthetic wastewater feed. Applied cell potential: 0.9 V.
Energies 14 08375 g003
Figure 4. (a) COD, pH of the anolyte, and (b) current density (normalized to the anodic surface area, 2 × 2 cm2) for MEC1 vs. operation time, for an acetate-based synthetic wastewater feed. Applied cell potential: 0.9 V.
Energies 14 08375 g004
Figure 5. (a) COD, pH of the anolyte, and (b) current density (normalized to the anodic surface, 2 × 2 cm2) for MEC2 vs. operation time, for an acetate-based synthetic wastewater feed. Applied cell potential: 0.9 V.
Energies 14 08375 g005
Figure 6. (a) COD, pH of the anolyte, and (b) current density (normalized to the anodic surface, 2 × 2 cm2) for MEC1 vs. operation time, for the DF effluent feed. Applied cell potential: 0.9 V.
Energies 14 08375 g006
Figure 7. (a) COD and pH of the anolyte, and (b) current density (normalized to the anodic surface, 2 × 2 cm2) for MEC2 vs. operation time, for the DF effluent feed. Applied cell potential: 0.9 V.
Energies 14 08375 g007
Figure 8. SEM images (top view) of both anodes at the end of the cycle with DF effluent feed. (a,b) MEC1 and (c,d) MEC2.
Energies 14 08375 g008
Figure 9. Contact angle of (a) CNT-buckypaper and (b) commercial CP.
Energies 14 08375 g009
Figure 10. (a) Cyclic voltammograms and anode EIS characteristics for MEC1 and MEC2 at 0.9 V vs. Ag/AgCl, depicted in the form of (b) Nyquist plots, (c) phase angle vs. log (frequency) Bode plots and (d) admittance plots. Measurements were conducted in a three electrode set-up (anode as working electrode (WE), cathode as a counter electrode (CE) and Ag/AgCl electrode, immersed in the anolyte, as reference electrode (RE)). An acetate based wastewater was used as substrate in both MECs. Open circuit anode voltages (vs. Ag/AgCl): −0.15 V for MEC1 and −0.2 V for MEC2.
Energies 14 08375 g010
Figure 11. EIS characteristics of the anodes of MEC1 and MEC2 at 0.9 V vs. Ag/AgCl, depicted in the form of (a) Nyquist plots, (b) phase angle vs. log (frequency) plots and (c) admittance plots. (d) Current–potential curves, obtained via forward scan of the potential at a rate equal to 10 mV/s. Measurements were conducted in a three electrode set-up (anode as working electrode (WE), cathode as counter electrode (CE) and Ag/AgCl electrode, immersed in the anolyte, as reference electrode (RE). DF effluent was used as substrate in both MECs). Open circuit cell voltages: 0.1 V for MEC1 and −0.3 V for MEC2.
Energies 14 08375 g011
Figure 12. EIS characteristics (Nyquist plots) of MEC2 obtained at 0.9 V applied cell potential and with either acetate synthetic wastewater or DF effluent as feed.
Energies 14 08375 g012
Figure 13. Estimated EC50 values in the fairy shrimp Thamnocephalus platyurus, after DF (DF effluent samples), as well as DF-MEC1 and DF-MEC2 samples. The results (expressed as % v/v) are mean ± SD from 3 independent experiments. Values in bracket are statistically different from the respective value obtained in feeding samples (Mann Whitney U-test, p < 0.05, N = 3).
Energies 14 08375 g013
Table 1. Maximum voltage obtained during the acclimation phase of MEC1 and MEC2 (operated as MFC, R = 100 Ω) for six cycles of operation.
Cycle NumberVoltage of MEC1 (mV) Voltage of MEC2 (mV)
112.72.9
282.651.3
391.253.5
494.256.0
5102.561.6
6103.163.0
Table 2. The main characteristics of both MECs for an acetate-based synthetic wastewater feed.
CharacteristicsMEC1MEC2
HPRv (mL/Ld)23.69.8
Y H 2 (mgH2/gCOD)33.38.6
YH2,th (% molH2/mol)26.76.9
CE (%)55.619.9
Cathodic hydrogen recovery, %48.034.6
Hydrogen recovery, %26.76.9
Table 3. The main characteristics of both MECs for the DF effluent feed.
CharacteristicsMEC1MEC2
Cumulative hydrogen production (mL)51.35.0
HPRv (mL/Ld)29.31.6
Y H 2 (mgH2/gCOD)25.52.7
YH2,th (% molH2/mol)20.42.2
CE (%)39.376.9
Cathodic hydrogen recovery, %51.92.8
Hydrogen recovery, %20.42.2
Table 4. Toxic endpoints, in terms of 24 h EC10, 20 and 50 values (% v/v) and confidence intervals (lower and upper bound values within parenthesis) in Thamnocephalus platyurus challenged with different concentrations of DF effluent samples, as well as DF-MEC1 and DF-MEC2 effluents, as obtained by Probit analysis (p < 0.05, N = 3).
DF-MEC1EC1045.87 (0.02–62.30)
EC2054.38 (0.37–71.37)
EC5075.28 (42.62–>100.00)
DF-MEC2EC1047.56 (n.e.)
EC2056.46 (n.e.)
EC5078.38 (n.e.)
DF effluentEC1037.89 (0.78–53.10)
EC2044.53 (2.73–59.81)
EC5060.67 (24.94–91.28)
n.e.: not estimated by Probit analysis.
Publisher’s Note: MDPI stays neutral with regard to jurisdictional claims in published maps and institutional affiliations.

