Article

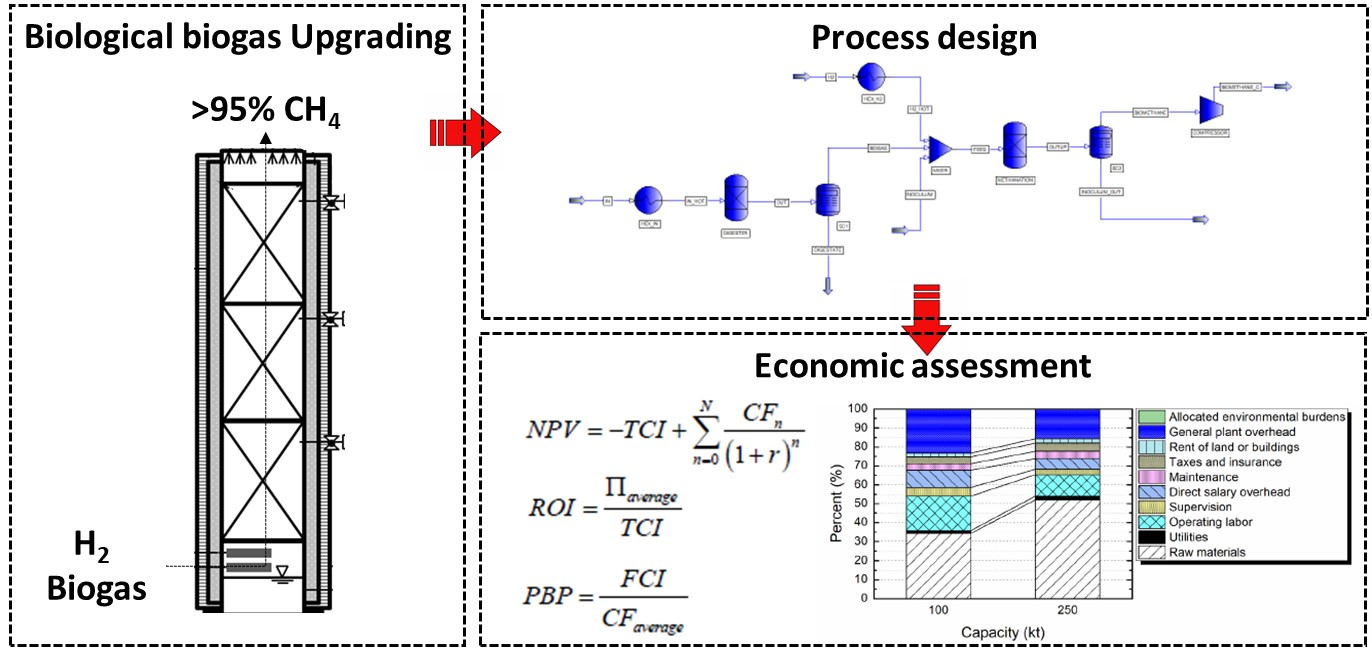
Techno-Economic Assessment of Biological Biogas Upgrading Based on Danish Biogas Plants

by
Néméhie Lawson
,
Merlin Alvarado-Morales
*,†,
Panagiotis Tsapekos
* and
Irini Angelidaki
Department of Chemical and Biochemical Engineering, Technical University of Denmark, DK-2800 Kgs. Lyngby, Denmark
*
Authors to whom correspondence should be addressed.
These authors contributed equally to the present work.
Energies 2021, 14(24), 8252; https://doi.org/10.3390/en14248252
Submission received: 12 November 2021 / Revised: 24 November 2021 / Accepted: 1 December 2021 / Published: 8 December 2021

Abstract

:
Biological biogas upgrading with H2 derived from excess renewable electricity was modeled and simulated in PROII® (AVEVA Group plc, Cambridge, UK). An economic analysis was performed for a biogas plant processing 100,000 tons of biomass (substrate) per year. The biogas and biomethane production simulation results were validated with laboratory experimental data, as well as full-scale data obtained from biogas plants. A biomethane production cost of 0.47 €/Nm3 was calculated, while the minimum biomethane selling price for NPV = 0 was equal to 0.66 €/Nm3, considering a H2 price of 1.0 €/kg. The feasibility analysis indicated that the H2-related costs were the major contributor to the capital and operation costs due to high expenses associated with the in-situ H2 storage facility and the purchasing of H2, respectively. Compared to conventional upgrading methods, biological biogas upgrading has a higher capital and production cost, which can be reduced by increasing the plant capacity. The sensitivity analysis showed that the profitability is very sensitive to biomethane prices, capital investment, and the H2 price.

Graphical Abstract

1. Introduction

In recent years, the introduction of renewable energy into global energy systems has been a priority for the European Union (EU) to mitigate climate change. Within the EU, Denmark has set an ambitious target to have a 100% fossil-free energy system by 2050 [1]. Therefore, the Danish energy sector is massively developing wind and solar power, and is shifting from coal feedstock to biomasses [2]. Nevertheless, wind’s production intermittency entails the need for storage, and it is hardly usable as a substitute for thermal purposes. In this context, there is a rising interest in biogas as a renewable energy source that can also be exploited to supply baseload power and process heat. It should be noted that the overall aim for renewable energy source consumption by 2030 was set to 32% in the renewable energy directive of the EU [3], while the target was raised to 40% in the next version [4]. The commission has previously required a minimum of 14% of the energy consumed in road and rail transport by 2030 to be from renewables. Complementary to the ambitious targets, biomethane will seek opportunities in transport modes that are difficult to electrify (e.g., aviation and maritime modes). The biomethane plants in Europe showed a remarkable increase from 483 plants in 2018 to 729 units in 2020 [5]. More specifically, 18 countries are upgrading their biogas, with Germany having the highest number of plants, followed by France and the United Kingdom. Focusing on Denmark, the “Energy Agreement” was adopted by the government to encourage the development of anaerobic digestion (AD) [6,7]. As a result, 170 biogas plants were being operated in 2020, and the production was increased four times from 2012, reaching a total annual volume of approximately 20 PJ [8].
Biogas is composed mainly of CH4 (50–70% v/v) and CO2 (30–50% v/v) [9]. The CO2 fraction is treated differently depending on the final use of the gas. If the biogas is combusted in an engine to generate heat and power, the CO2 fraction is not removed. Otherwise, the biogas can be upgraded to biomethane (typically 95–97% CH4 content [10]) to be injected into the natural gas grid or used as a storage or vehicle fuel [9]. However, the sulfur content should be removed from biogas before its injection into the gas grid or the upgrading process takes place, respectively [11]. The use of biomethane does not require new infrastructure (pipes, burner, etc.); thus, it represents a good substitute for natural gas [12]. Hence, Denmark decided to explore the financial support of upgrading projects in 2018. In 2018 and 2020, around 8 and 20% of the Danish gas consumption originated from upgraded biogas, respectively, and it is expected that biogas-derived CH4 will reach 30% in the natural gas grid by 2030 [8]. However, the specific terms of the new Danish support scheme have not been determined yet, and thus the information and input to build an adequate subsidy scheme are needed.
Nowadays, the most commonly applied biogas upgrading methods are chemical and physical, which can either be energy-intensive or involve hazardous chemicals. A common feature of these methods is that they do not utilize the CO2, but simply remove it from the biogas. On the contrary, biological processes are more environmentally friendly—considering both the energy consumption and the chemicals used—and thus are gaining more and more interest. Besides this, the biological route captures and converts the CO2 present in the biogas into CH4. In the ex-situ process, H2 and biogas are injected into a separate reactor, while H2 is directly injected into the anaerobic digester in the in-situ biomethanation process. Between the two biomethanation processes, ex-situ upgrading appears to have higher market potential, because the in-situ method has intrinsic problems with pH stability [13,14]. Despite the ongoing research being mainly centered on the experimental level to find the optimal reactor configuration, process modelling and simulation are also highly relevant as inexpensive methods to predict the process performance. On this topic, a steady-state process simulator can offer a large range of component libraries, thermodynamic methods, and operation units involved in a wide range of chemical processes.
Despite the progress in biomethanation, the economic feasibility of the process is still not clear. In contrast, literature studies are mainly looking into the profitability of chemical-based upgrading methods (e.g., amine scrubbing), focusing on the economy of scale and identifying the main contributors to the capital and operating costs [9,12,15]. Moreover, previous studies often compared different technologies [9,15], while the impact of resources (e.g., feedstocks and electricity prices) on the economic feasibility of biological upgrading is scarce. Specifically, Vo et al. [16] carried out economic studies on ex-situ biomethanation, focusing on different combinations between biomethanation and amine scrubbing [17]. Eventually, an investigation on a farm-scale plant using biomethanation was recently published by Bekkering et al. [18]. Both studies concluded that one of the main bottlenecks for the profitability of biomethanation processes is the H2 price. H2 can be produced from water electrolysis powered by excess wind electricity in order to store surplus electricity and achieve lower prices. The valorization of excess electricity is particularly interesting in Denmark, where the share of wind in the electricity mix is higher than 50% [19]. Nevertheless, H2 is the main raw material for biomethane production through biomethanation, and therefore the effect of price variation should be carefully examined. The majority of the previous literature has been focused on the examination of the sustainability of chemical methods, e.g., a high-pressure water scrubber [20]; pressure swing absorption, water scrubbing, amines, and membranes [21]; and high-pressure water scrubbing at an alkaline pH, with regeneration and bottom ash upgrading [22]. Nevertheless, a recent study compared the metrics of biological biogas upgrading with water scrubbing [23]. Despite the promising results of biomethanation, the analysis showed that the economic profitability and the production cost of biomethane are clearly connected with the electrolyzer for H2 provision and the provided subsidy. Nowadays, the conditions for making the biologically mediated biogas upgrading technology more sustainable are not clearly defined. Hence, it is crucial to examine case studies using real-life data as a meaningful contribution to political affairs, and also to help stakeholders to make investment decisions. Thus, the present study aims to assess the techno-economic performance of AD and biomethanation processes of a full-scale biogas plant in order to unveil the specific conditions in which the biomethanation process could be profitable. Process flowsheets were modelled and simulated in PROII®, and the economic performance was evaluated based on H2 and biomethane prices, taking into account a biogas support scheme. Consequently, the minimum biomethane price was computed in order to determine the plant’s profitability for different subsidy levels. Finally, biomethanation was compared to amine scrubbing in terms of costs and greenhouse gas emissions (GHG).

2. Materials and Methods

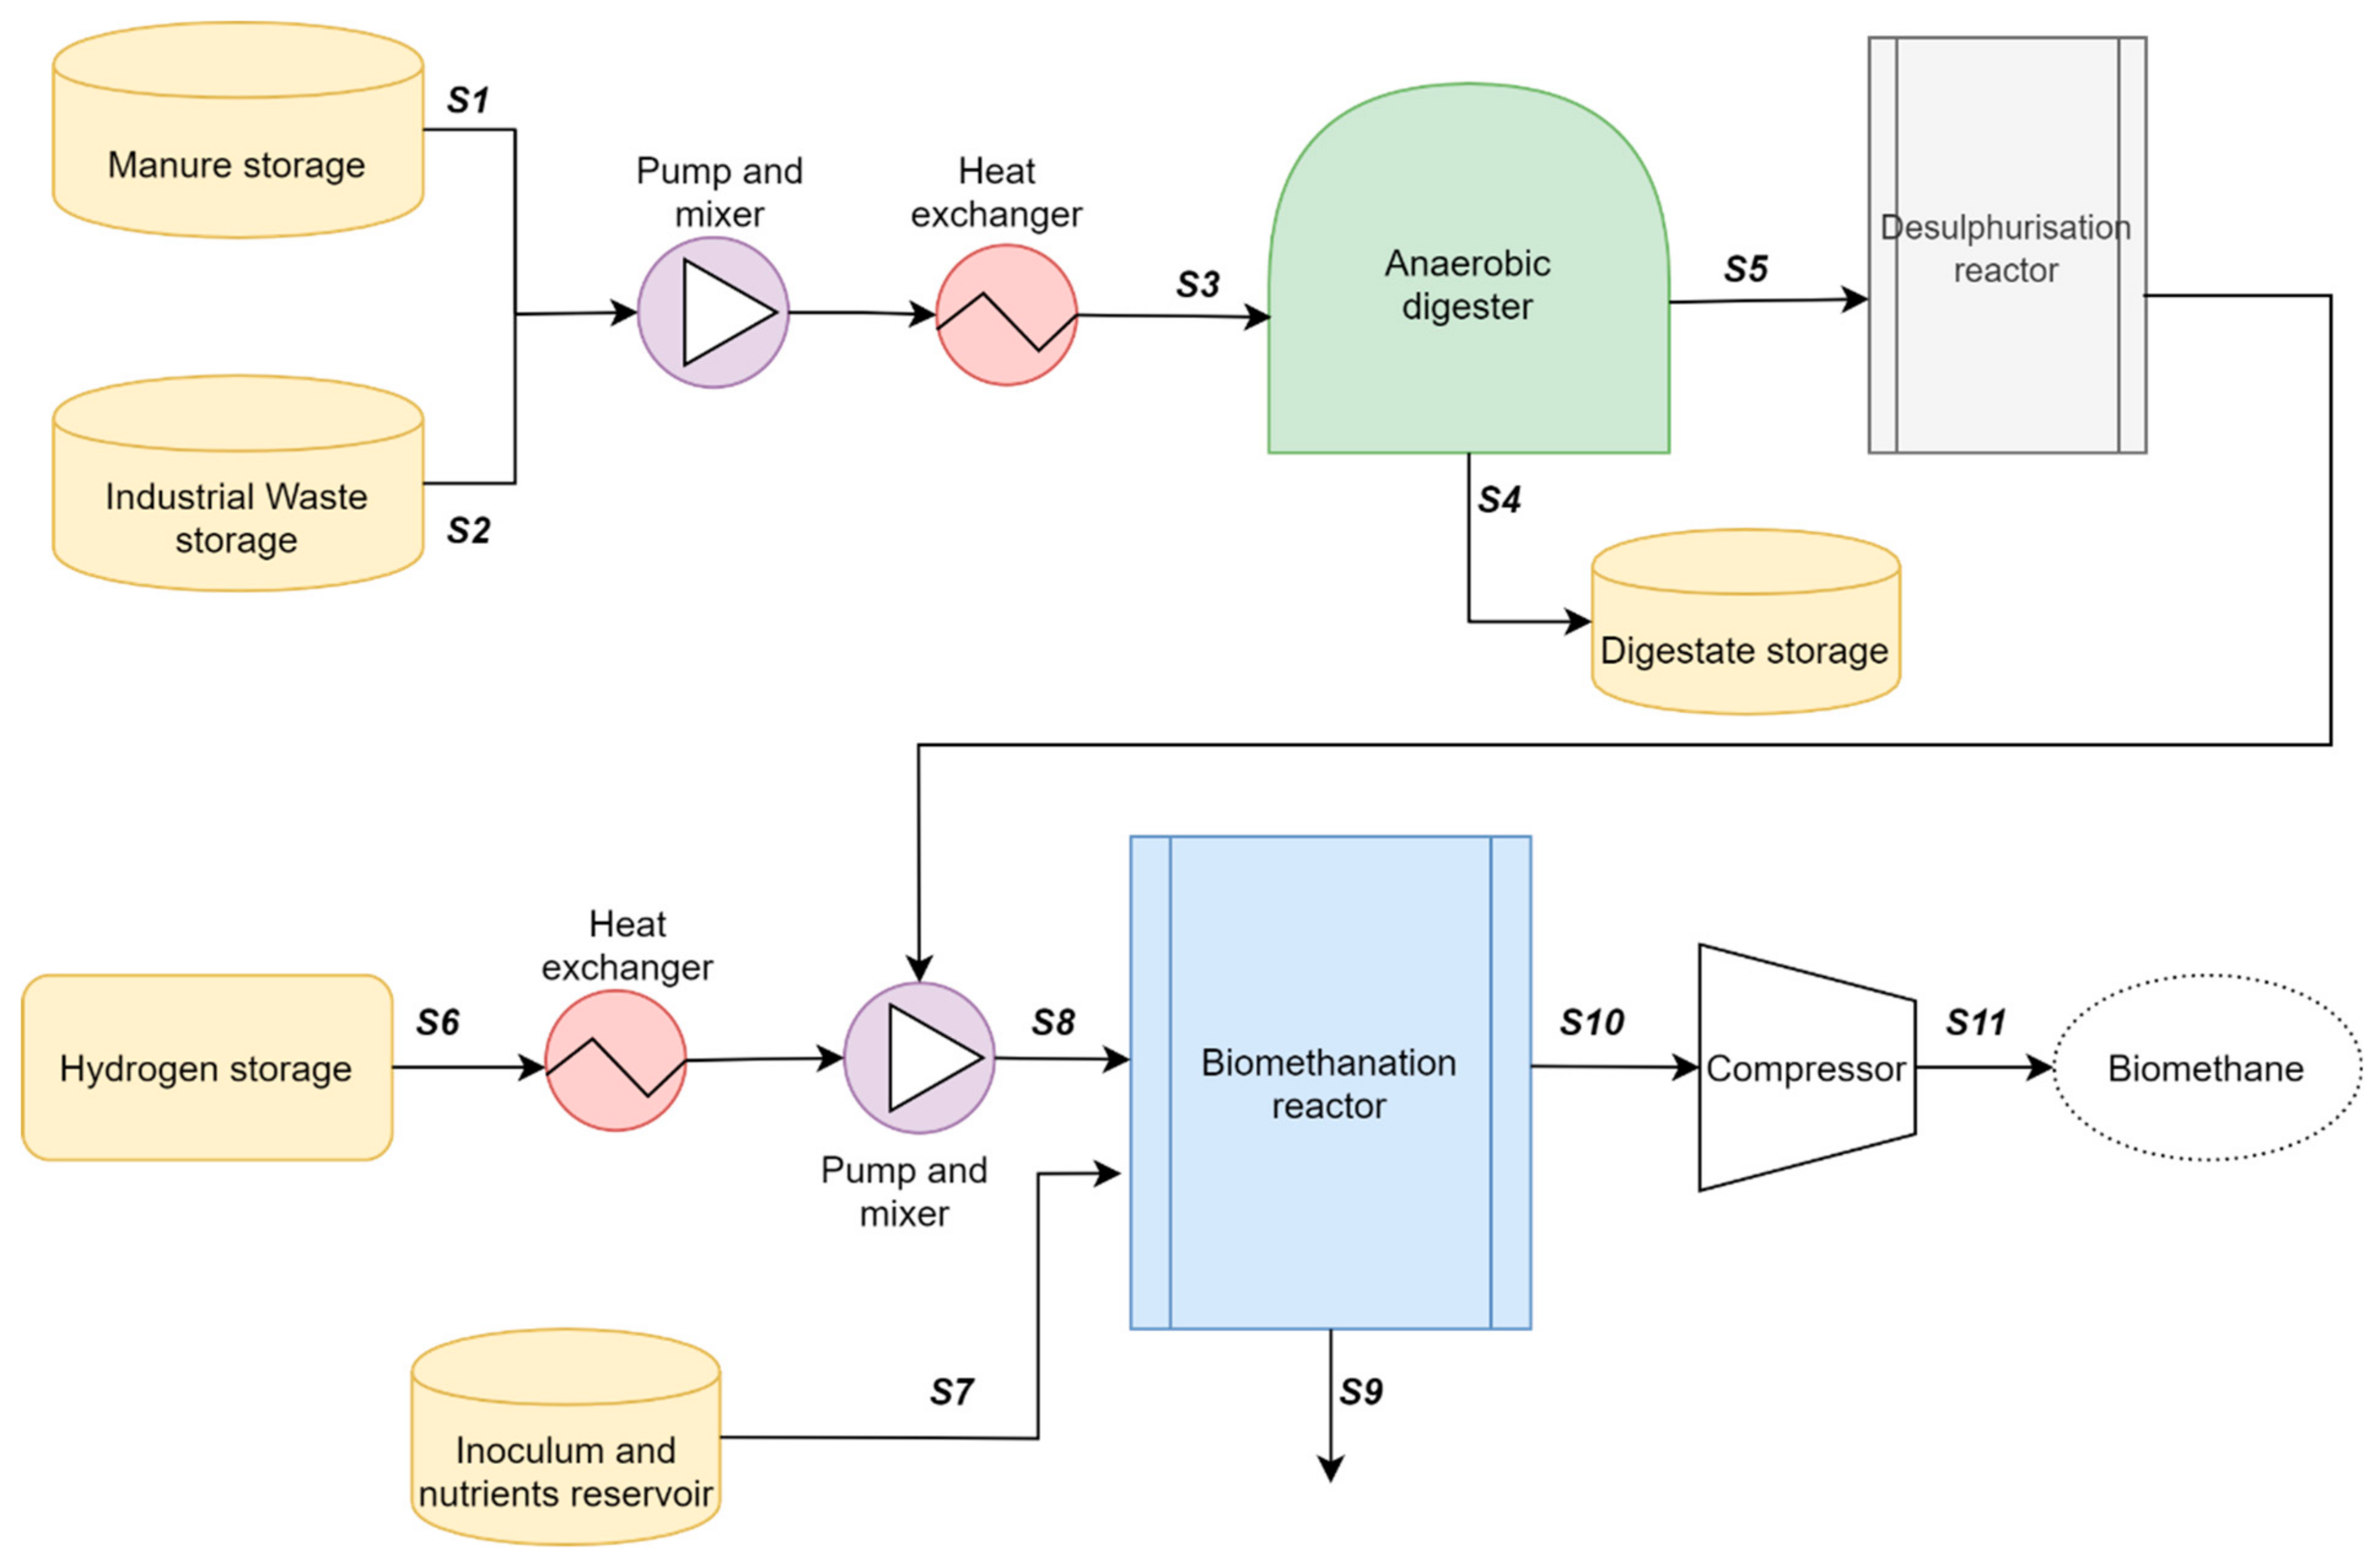
2.1. Base Case Process Design

The typical characteristics of Danish biogas plants were taken into consideration. In the base case design, the plant consists of two sections, namely, the AD and biomethanation sections. The feedstock to the anaerobic digester consisted of 80% (w/w) manure and 20% (w/w) other industrial biowastes or municipal biowaste (biobulp). The substrates’ composition was taken from the BioModel 2.0 databank [24,25]. It was considered that the plant processes 100,000 tons of substrate per year, which corresponds to a mass flow of 12.08 tons per hour. The plant has a 20-year lifetime, and is assumed to run 345 days per year. The construction period is assumed to take a year, and the start-up period is assumed to be 4 months. A desulphurization unit is also considered in the process, and the technology selected was a biotrickling filter which is commonly used in Danish biogas plants [26,27]. The discount rate was set to 10%, which is rather high compared to typical European AD plants [28]. However, the investment risk, in this case, is higher due to the new technology of biomethanation. The process flowsheet is described in Figure 1, and the plant characteristics are given in Table 1.

2.1.1. Anaerobic Digestion

A thermophilic anaerobic digester (55 °C) with a hydraulic retention time (HRT) of 20 days operated at atmospheric pressure was considered. Manure and industrial wastes are first blended by a mixer and then pumped to a heat exchanger, where the feedstock is preheated at 55 °C. Afterward, the feedstock is sent to the anaerobic digester. These steps, along with the digester heating system, represent the main utilities for the AD section.

2.1.2. Biological Biogas Upgrading

The upgrading process was considered to take place in a trickle-bed reactor (TBR) under thermophilic conditions [29]. The gas retention time (GRT) and the packing material are two essential parameters for the optimal conversion of CO2 and H2 into CH4. GRT affects the size of the biomethanation reactor and thus the capital cost, because the upgrading has to be designed to process the biogas produced during AD. In the present study, a GRT of 30 min was targeted, assuming that the efficiency is not decreased at these operating conditions. Polyurethane foam (PUF) was used as a low-cost packing material, which was later used in an ex-situ biomethanation process satisfying the process performance in terms of high H2 conversion rates at a low GRT [30]. The amount of daily H2 needed was calculated based on the amount of CO2 present in the produced biogas.

2.2. Process Simulation

The chemical compounds involved in the model but not found in the PROII® databanks—such as the cell mass (C5H7O2N—were set up via the user-defined option. An overview of the compounds used in the simulation is given in the Supplementary Materials. Once all of the components are defined, along with the minimum physicochemical properties, the biological and chemical reactions can be defined. The stoichiometry of the biological and chemical reactions was taken from Kovalovszki et al. [24] and implemented in the PROII® software for the steady-state simulation of the AD process. All of the reactions were implemented in a conversion reactor model in PROII®, which allows the setting of the conversion efficiency for each of the chemical/biochemical reactions taking place in the AD process. The conversion efficiencies for hydrolysis reactions were assumed to be equal to 80%. For the other steps, the conversion ranged from 80 to 90%, and was determined in order to obtain a typical biogas composition (40% CO2, 60% CH4), as well as a CH4 yield between 150 and 300 Nm3/tonne of VS.
The goal of the upgrading section was to achieve a high production capacity of the final gas with a CH4 content above 95% v/v [31,32]. The stoichiometric reaction of CO2 and H2 conversion is described by Equation (1).
4H2 + CO2 → CH4 + 2H2O
Regarding biomethanation, Hill proposed a model for hydrogenotrophic methanogenesis including cell mass synthesis [33], and this was previously used by Lovato et al. [34] for in-situ biogas upgrading. Thus, Equation (2) was implemented in PROII®.
H2 + 0.26443CO2 + 0.00577NH3 → 0.00577C5H7O2N + 0.23557CH4 + H2O
A conversion reactor model in PROII® was also selected for biological upgrading. The conversion ratios for CO2 and H2 were retrieved from previous experiments. A H2 conversion efficiency equal to 98.9% was selected [31], and the CO2 efficiency was calculated to be equal to 98.9% from the feed and output stream.
The feed stream of the biomethanation reactor is composed of biogas, H2, inoculum, and nutrients. A H2:CH4:CO2 ratio of 61.3:21.7:16.3 was used. The amount of inoculum was set according to the specifications of the culture used by Porté et al. [31]. The competitive reaction of the hydrogenotrophic pathway is homoacetogenesis, which converts H2 and CO2 into acetic acid instead of CH4. Voelklein et al. [35] reported that 2 to 5% of the H2 might be converted into acetate by homoacetogenesis during AD, leading to limited biomethanation. Equation (3), given by Hill [33], describes the homoacetogenic reaction which was also implemented in PROII®.
H2 + 0.5CO2 + 0.02435NH3 → 0.02435C5H7O2N + 0.18913C2H4O2 + 0.57305H2O

2.3. Economic Analysis

The following exchange currency was used: 7.45 DKK/€ and 0.9 $/€. The corporate income tax rate in Denmark is 22% [36], and inflation of 1.2% in 2020 was taken into account for the analysis [37].

2.3.1. Total Capital Cost Estimation

The total capital investment (TCI) was calculated by adding the fixed capital investment (FCI) and the working capital investment. The latter expense is needed to start up the plant, and usually represents 15% of the FCI [38]. The FCI describes the expenditure for the plant construction, including equipment, installation, piping, and other costs linked to the electricity or the building. The FCI was estimated with the factorial method, multiplying the equipment purchased price by different factors according to the expense categories in order to build and start the plant. Lang’s method is slightly different because all of the factors are compiled in the one, which is called a Lang factor. In order to apply this method, the plant was divided into two sections: AD including desulphurization, and biological upgrading. Only two sections were considered, because desulphurization systems are always integrated with biogas plants regardless of the biogas end-use. This approach allowed us to calculate the contribution of each section to the FCI and ultimately the total product cost. Tao et al. [39] described a Lang factor of 1.80 for biofuel production, while Amigun et al. [40] found a 1.79 Lang factor for biogas installations. A factor equal to 1.80 for both AD and sulfur removal units was selected. Regarding FCI estimation, the biomethanation was assumed to be similar to the Power-to-Gas process, with a factor of 2.62 according to Zauner et al. [41]. This factor takes into account the different costs for the methanation unit and the H2 storage tank, e.g., engineering, materials for construction, assembly, process-control technology, and other costs. The storage tank is necessary to ensure a continuous supply of H2. Indeed, its production is as intermittent as the excess electricity availability from wind turbines. The equipment purchase cost was appraised with the method defined by Towler et al. [38], except for the compressor and the packing material for the biomethanation and desulphurization reactors. The correlation is shown in Equation (4), considering 2006 as the base year for the cost. Ce is the equipment purchase cost, a and b are the correlation coefficients, n is the economy of scale exponent, and S is the equipment size parameter.
C e = a + b S n
This correlation does not apply to the size of the compressor needed here; the method supplied by Brown et al. [42] was adopted instead. This price is provided for the year 2013. Regarding packing material, the PUF price was considered to be 30 €/m3 on the basis of the year 2013, according to Kennes et al. [43]. The details on the correlations used for each type of equipment are given in the Supplementary Materials (Table S1).
The purchase costs were updated for the year of the plant construction, which was considered to be 2019. The cost projection is described by Equation (5), where CECI2019 is equal to 607.5 and CECIbase year represents the CECI of the year 2006 or 2013, depending on the equipment price base year.
C o s t 2019 = C o s t b a s e   y e a r C E C I 2019 C E C I b a s e   y e a r
All of the equipment costs are summarised in the Supplementary Materials (Table S2).

2.3.2. Operation Cost Estimation

The operational costs include variable and fixed costs of production. The latter consists of maintenance, operating labor, supervision, direct salaries, general overheads, the rent of the land and buildings, property taxes, insurance, and allocated environmental charges. The details of how these expenses were evaluated are shown in the Supplementary Materials, except for the operating labor. Six operators are needed to operate a large-scale biogas plant [44], among which are three truck drivers. Their service is during working hours, and one person is on call in the evening and night [42]. The operator-related costs were estimated considering an 8-h working day and an operator salary of 24.2 €/h [45,46].
The variable costs are composed of raw materials and utilities costs, which are shown in the Supplementary Materials. The H2S removal unit requires O2, which can be provided from the air; however, it is preferred to use pure O2 when biogas is upgraded to biomethane in order to avoid the subsequent introduction of N2 to the gas grid. Based on the H2S produced during AD and an O2:H2S ratio of 4 during biological desulphurization [47], approximately 5 tons of O2 per year are needed. The most important raw material for the process is H2, which was assumed to be produced from water electrolysis powered by the electricity surplus from wind turbines. The purchasing of an electrolyzer was not included in the plant studied here. Nevertheless, the operation of the electrolyzer was looked into, as it highly influences the H2 costs. The H2 price depends mainly on the operating hours of the electrolyzer. According to NREL, the H2 price can be as low as 1.0 to 1.5 €/kg [48], while Vo et al. reported 4.5 €/kg [16]. In 2017, the International Energy Agency (IEA) estimated the H2 cost evolution for different electricity prices and electrolyzer operating hours [49]. The IEA found that H2 is cheaper when it is produced from the excess of electricity (i.e., electricity price is 0 €/MWh), and its lowest price is 1.0 €/kg (on a 2019 basis); therefore, this value was selected in this study.

2.3.3. Revenues

Biomethane benefits from governmental financial support. The subsidy is a feed-in-premium which is a guaranteed fixed add-on to the market price. The price of biomethane can be estimated knowing the old subsidy and the price of natural gas. The goal of this study, as mentioned before, is to appraise the minimum biomethane selling price and then the corresponding subsidy. The revenues (R) were calculated—following Equation (6)—by multiplying the volume of biomethane produced Vbiomethane with the biomethane price including the subsidy Pbiomethane.
R = V b i o m e t h a n e P b i o m e t h a n e

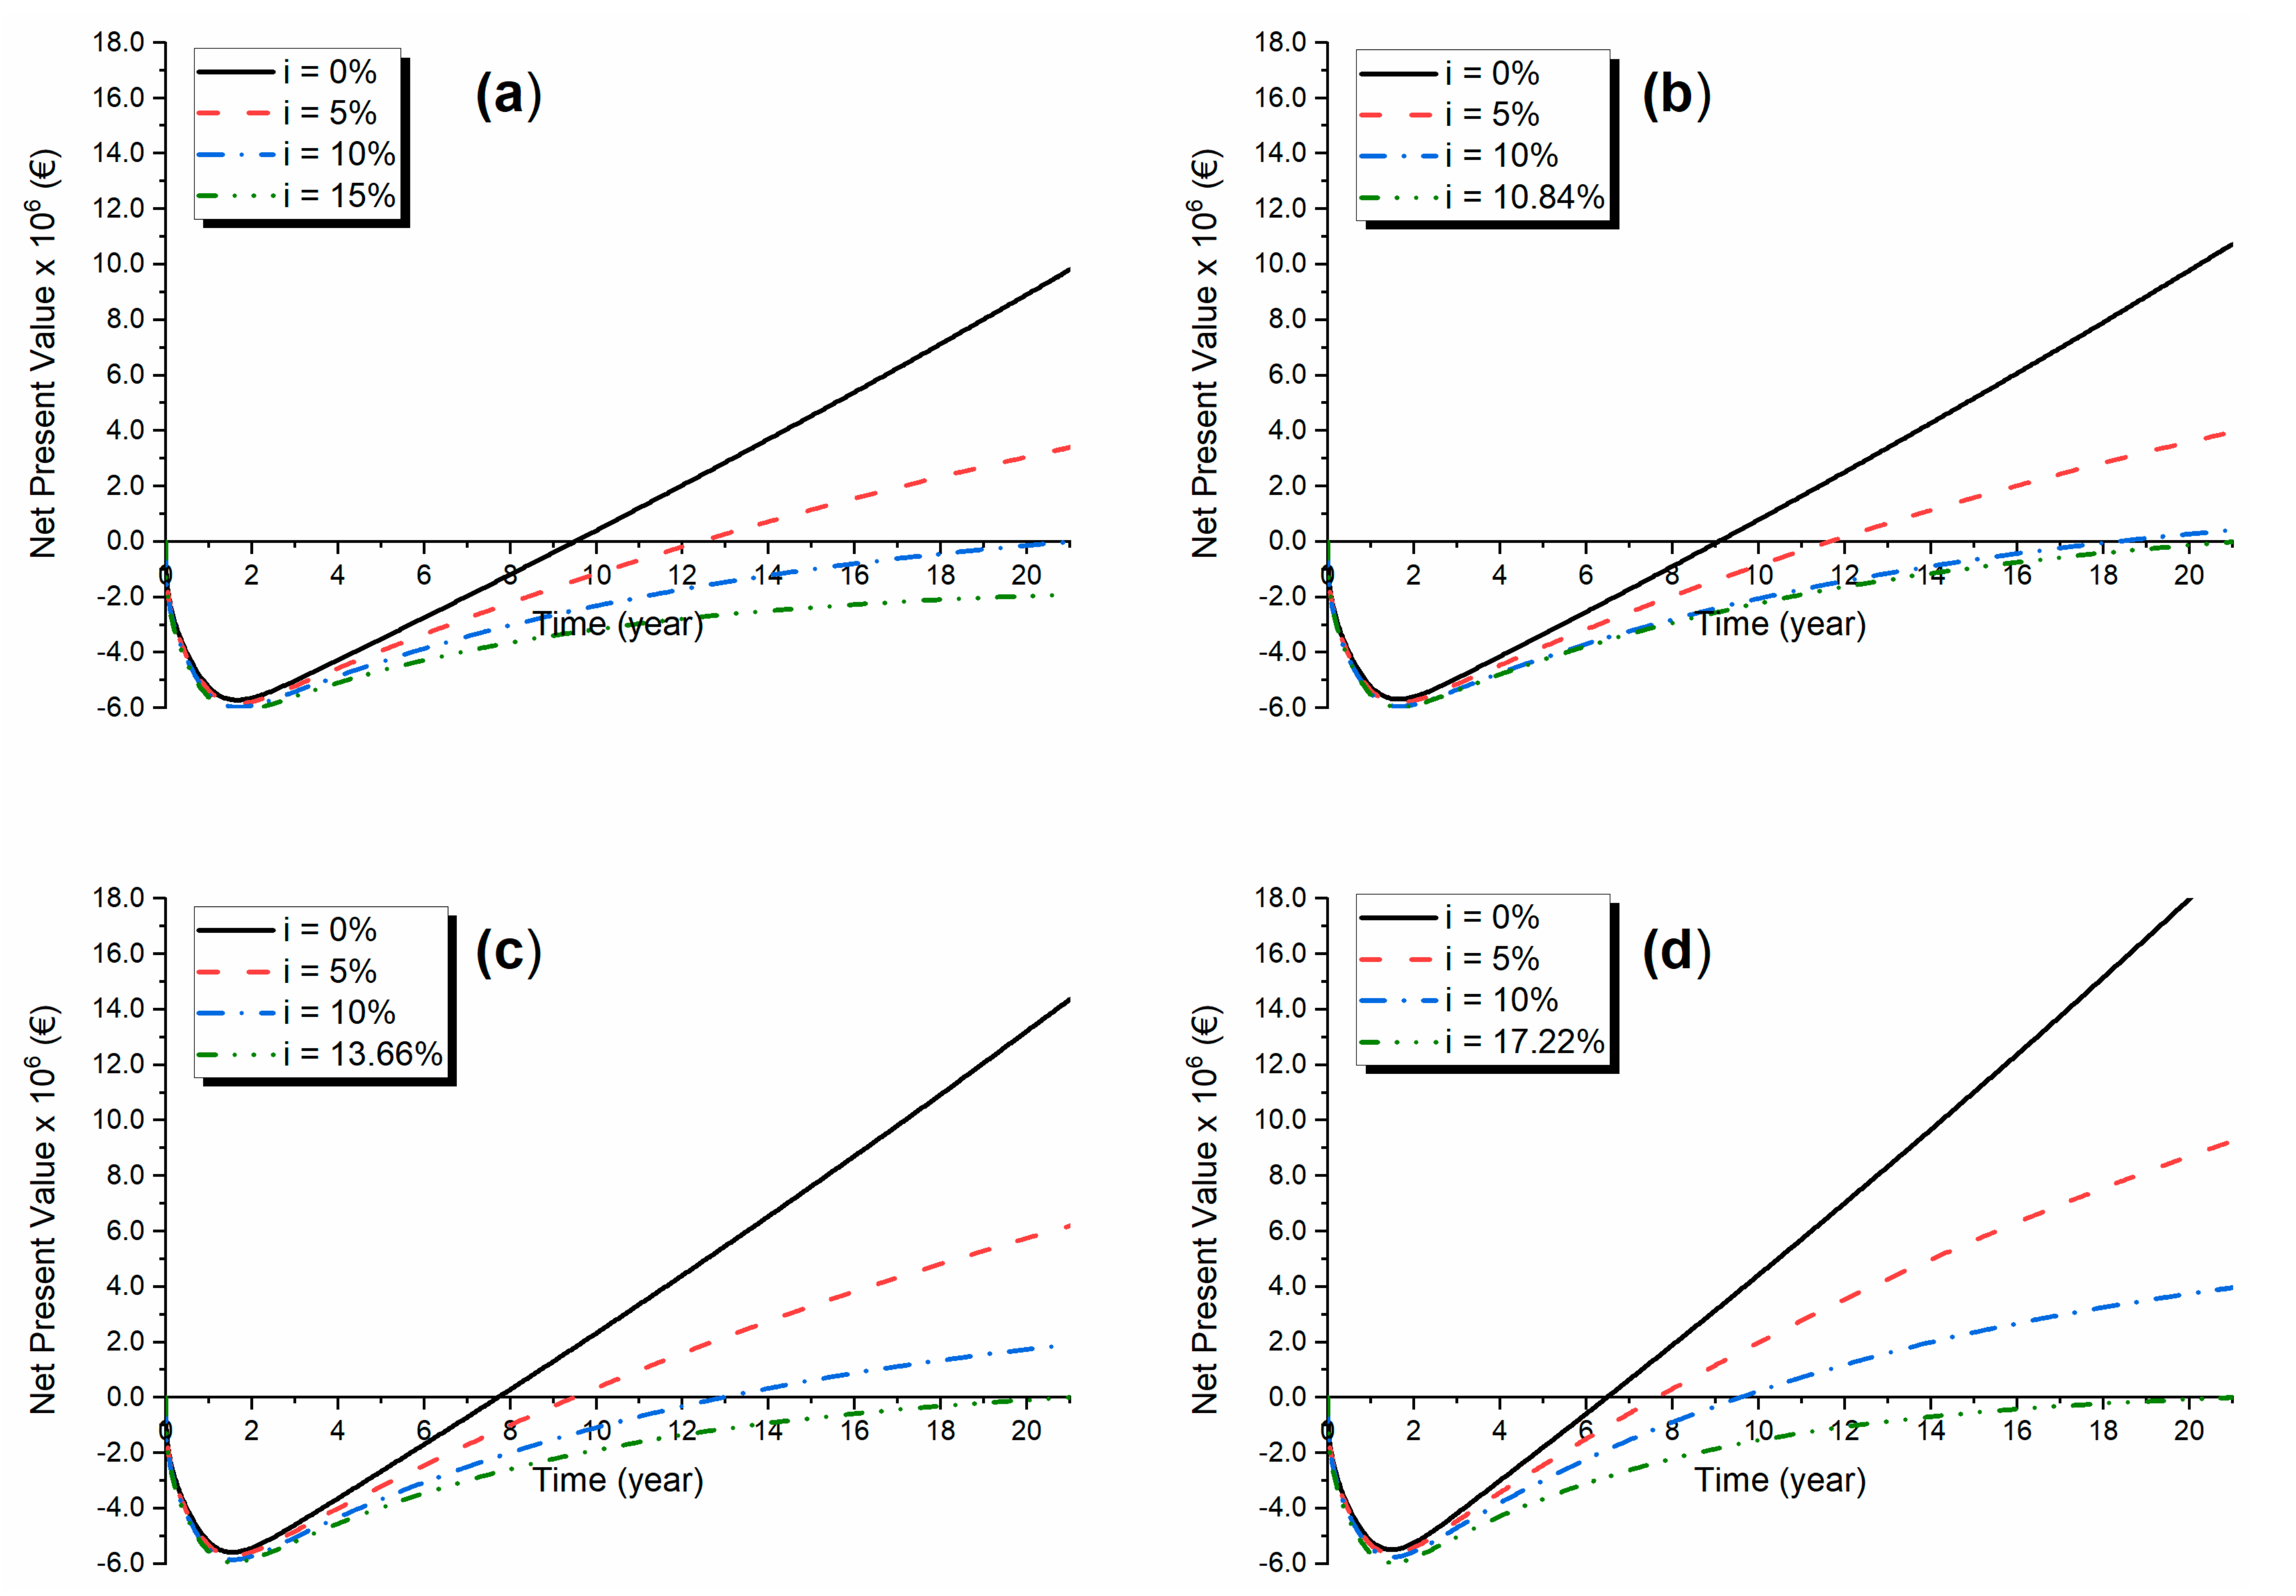
2.3.4. Profitability Analysis

The profitability of the plant was assessed using 5 metrics: the return on investment (ROI), the payback period (PBP), the net present value (NPV), the internal rate of return (IRR), the minimum biomethane selling price, and the maximum H2 purchase price. The NPV described by Equation (7) represents the economic value of the project at present by taking into account the time value of money throughout the project lifetime. N and CFn correspond to the cash flow of the year n. A positive NPV indicates economic feasibility.
N P V = T C I + n = 0 N C F n 1 + r n
The payback period (PBP) expresses the period which is necessary for full investment recovery (Equation (8)). The project is profitable if the PBP is lower than the discount rate PBP, which is the maximum recovery period knowing the discount rate r; it is expressed by Equation (9). The minimum biomethane price was determined for 4 different levels of profitability i.e., by setting two metrics to different values: NPV = 0, PBP = 6.1 years (which matches the discount rate PBP), PBP = 5 years, and PBP = 4 years. The two first levels are the minimum requirement for profitability regarding each of these indicators, and the last two aim to evaluate the possibility of a very attractive project, for instance, a PBP of 5 years is a typical target for companies [28,50,51]. The same values were taken to calculate the maximum H2 price.
P B P = F C I C F a v e r a g e
P B P r = F C I T C I r + F C I T C I N
The internal rate of return (IRR) and the return on investment (ROI) were also calculated. The IRR corresponds to the discount rate when the NPV becomes zero; its expression is derived from Equation (7). Finally, the ROI (Equation (10)) is the percentage of the investment recovered in each year of operation. Πaverage is the average net yearly profit. The PBP should be greater than the discount rate for the plant to be considered profitable.
R O I = Π a v e r a g e T C I
Knowing the risk of investment, the discount rate r for this project was set to 10% [38]. The straight-line depreciation method is generally observed for biogas installations, and was chosen here [38]. With a 20-year lifetime, the depreciation is 5%.

2.3.5. Sensitivity Analysis

A sensitivity analysis was performed to assess the impact of different parameters on the profitability of the base case scenario. The following parameters were examined: the FCI (−30 to +30%), the working capital (−20 to +50%), the biomethane price (−28 to +38%), the H2 price (−15 to +100%), the H2 storage (−50 to +30%), and the compressor purchase price (−30 to +80%). For the FCI and the working capital, the variations chosen are typically found in the plant’s project, while for the other parameters, the forward and backward changes were determined regarding the context and elements in the literature [49,52,53].

2.4. Process Design Scenarios

In addition to the sensitivity analysis, different scenarios were considered in order to broaden the analysis and discussion of the study. To begin with, a performance drop in the biomethanation process (first scenario) was modelled by decreasing the H2 conversion to 95%. This resulted in a lower gas quality, as the CH4 content was reduced to 90%. Plant economics indicators were examined in this scenario. In addition, economy of scale was considered (second scenario) by increasing the plant processing capacity to 250,000 tons of substrate per year. The process remained unchanged except for a second digester being added. Furthermore, a comparison with a benchmark upgrading process was performed (third scenario). For this reason, data were collected from the literature on the economics of amine scrubbing [15,16]. Briefly, this chemical upgrading method involves an absorber and a stripper. In order to remove CO2, the biogas flows up through the column while an amine-based solution flows counter-currently. The CO2 is absorbed by the solution, which is thereafter injected into the stripper where the amine solution is heated up and thus regenerated while the CO2 is stripped [9,12]. To finish, the GHG emissions of the biomethanation for the base case and scenario 2 were compared to the emissions of the amine scrubbing process. The data were retrieved from a Joint Research Center report regarding AD emissions [54]. The values for manure and biowaste emissions were taken into consideration, as well as the emissions avoided due to waste management and natural gas substitution [55,56].

3. Results and Discussion

3.1. Base Case Design

The yearly feedstock mass of 100,000 tons per year is converted into 4.70 kt of raw biogas, i.e., a flow of 567.7 kg/h for 345 operating days, corresponding to an annual production of 4.08 million Nm3 raw biogas. The addition of 5.44 million Nm3 H2 generates an extra 1.21 million Nm3 CH4, which together with the CH4 produced after AD results in an annual production of 3.86 million Nm3 CH4. Vo et al.’s process model with ex-situ biomethanation almost doubled the amount of biomethane, with a final volume of 6.64 million Nm3 compared to 3.86 million Nm3 before biological upgrading (i.e., based on biomethanation) [16]. However, the details of the upgrading model were not provided in the scientific article. Bekkering et al. also found a nearly doubled volume of biomethane after biological upgrading, but their focus was more on the economic and environmental aspects, rather than the model and simulation of the upgrading process [18].
The requirements for a well-functioning AD process were met with a loading rate of 5.07 kgVS/m3.d. The raw biogas had 65% CH4, which is in the typical range for AD. Despite the CH4 productivity and yield being low, they fall within the scope of manure digestion due to feedstock recalcitrance and the low availability of easily accessible organic matter for biological degradation (Table 2).
Table 3 shows that the upgrading process fulfills the high CH4 content specification given by previous studies [10,31,32,62]. As expected, the CO2 conversion efficiency is high, reaching 98.9%. Both the CO2 and H2 fractions in the final gas are below the maximum allowable percentage of 4% and 12%, respectively, for injection into the gas grid [63,64]. Very few studies detail the H2 loading rate. The one used in the present study exploited a H2 loading rate of 29.53 Nm3/m3.d, which is close to the value of 25.2 Nm3/m3.d reported by Alitalo et al. [65]. However, the GRT was not reported in the latter study. In the literature, the upgraded CH4 productivity ranges from 0.26 to 6.35 Nm3/m3.d based on the applied GRT [10,31,32,65]. In a well-performing biomethanation process, the lower the GRT the higher the CH4 productivity. However, more experiments are needed to validate the consistency of the productivity of the upgrading process, and to define the process limits.

3.2. Capital and Operation Costs

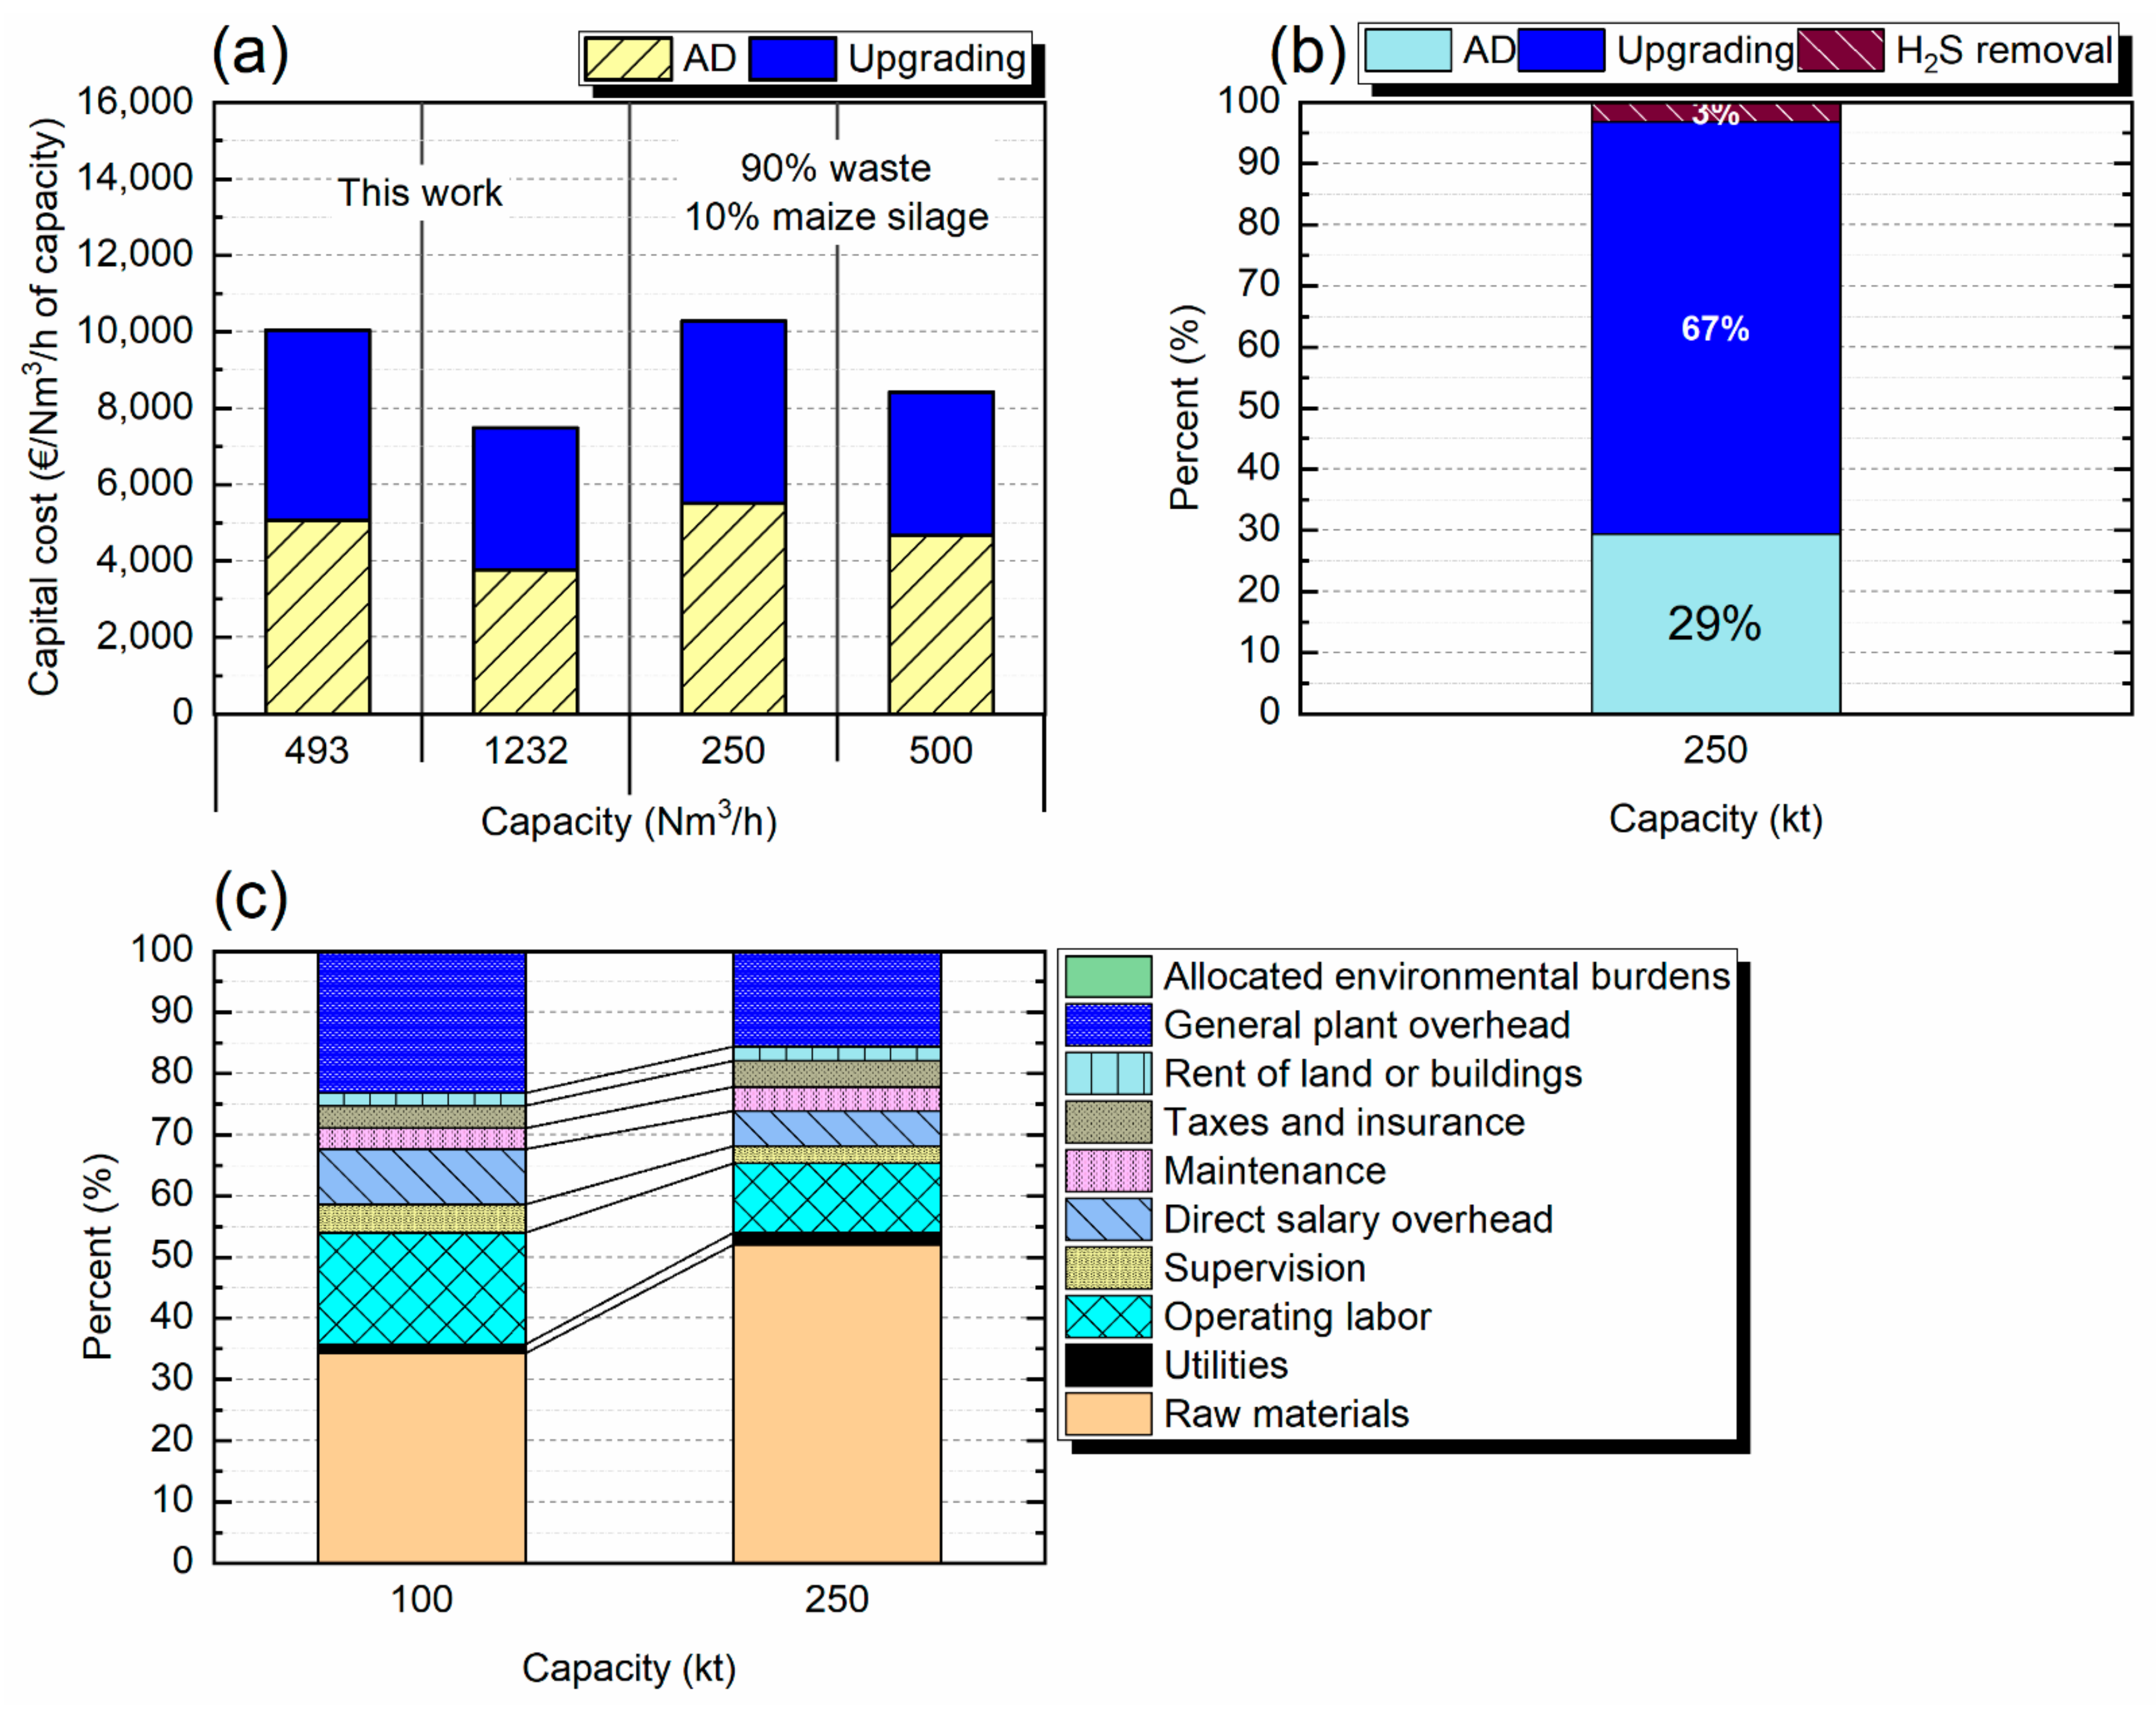
3.2.1. Total Capital Investment Cost (TCI)

Table 4 summarizes the equipment cost, the fixed capital investment, and the total capital investment for each section of the plant. The calculated TCI is equal to €5.68 million. When compared with other studies [66], it is clear that the ex-situ biomethanation contributes significantly to the capital cost compared to conventional upgrading methods. This is mainly due to the H2 storage purchase price, as explained in the Section 2.4.

3.2.2. Operation Cost

To produce 3.86 million Nm3 CH4 per year, the annual operation cost was calculated to be 1.83 million €. The Horsens Bioenergi plant in Denmark, which upgrades biogas by water scrubbing, produces 8.0 million Nm3 CH4 annually, and has a production cost of 1.8 million € per year [44]. However, the annual processing capacity of Horsens Bioenergi is 240,000 t of biomass (e.g., primarily cattle and pig manure, slaughterhouse waste, food waste, poultry deep litter, and other available residues), which is a significantly higher treatment capacity than our base case.
In the present work, the upgrading section accounts for 70% of the production cost; more specifically, the raw materials (i.e., H2) are one of the main reasons for this high expense (27% of total). On this topic, Vo et al. reached a similar conclusion regarding the H2 contribution, appraising an operational cost of 1.3 €/Nm3 CH4 in 2016 [16]. In another study, the production cost ranged from 0.3 to 1.4 €/Nm3 CH4 depending on the substrate considered without including the H2 price [17]. For a fair cost comparison, CH4 produced from methanation should be taken into account, and after this consideration, the cost for upgrading alone drops by 34%, from 0.48 to 0.32 €/(Nm3 CH4/year), as shown in Figure 2.

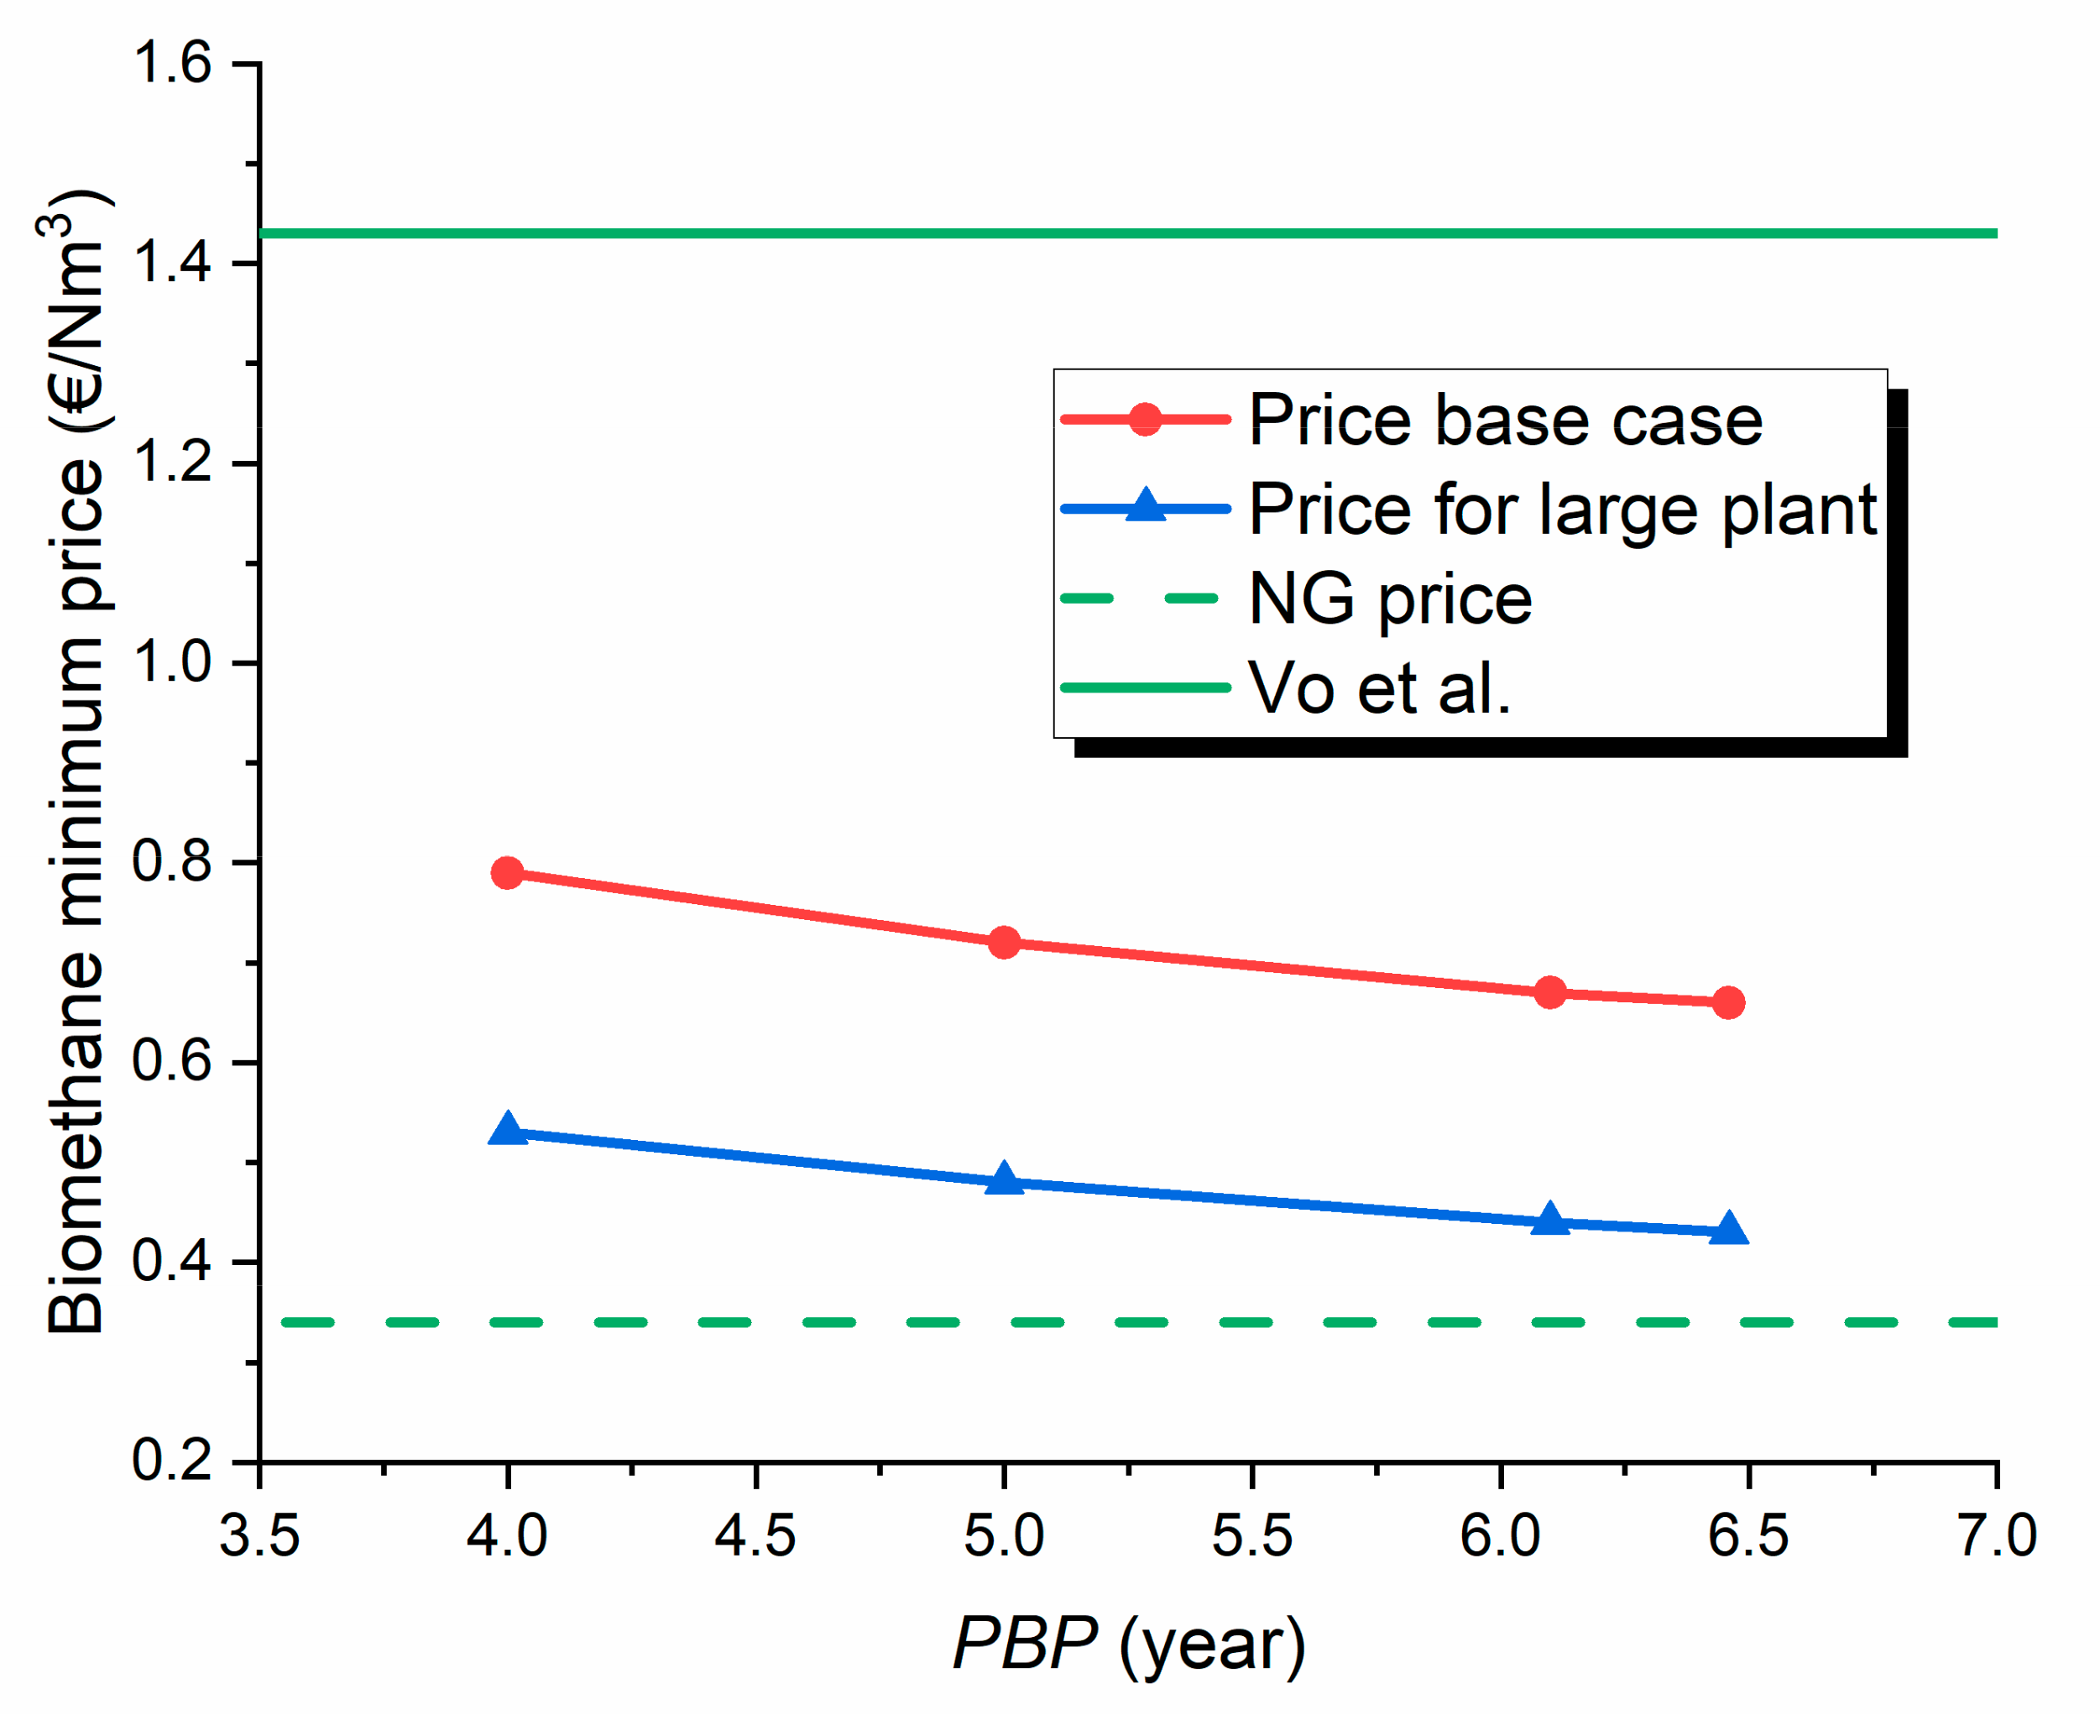
3.3. Profitability Analysis

The results of the profitability analysis in terms of ROI, NPV, PBP, IRR, and the minimum CH4 selling price are presented in Figure 3, and are summarised in Table 5. Figure 3a shows the cumulative cash flow diagrams at different discount rates for the base case, considering a minimum selling price of CH4 at 0.66 €/Nm3. The NPV of the base case was equivalent to 9.81 million €, and the payback period was calculated to be 6.46 years when the discount rate was not accounted. As shown in Figure 3b, for the base case, the NPV became zero when the discount rate was 10%, which is also known as IRR.
It should be noted that when NPV becomes zero the project is not profitable based on the ROI and PBP, because the time value of money is taken into account for the NPV and IRR. When PBP is equal to 6.1 years, all of the indicators point to the project’s feasibility (e.g., an IRR of 10.84%), and the CH4 minimum selling price is 0.67 €/Nm3. The highest minimum CH4 selling price estimated corresponded to 0.79 €/Nm3 for a PBP of 4 years, which is still lower than the one found by Vo et al. [16].
The NPV appears to be the best metric to assess investment attractiveness in the finance sector. This indicator takes into consideration both the time value of money and the cash flows for the entire project lifetime, which is not the case with the ROI and the PBP. Nonetheless, the two metrics previously mentioned (i.e., ROI and PBP) are easily understandable for a large spectrum of actors and stakeholders (e.g., farmers, researchers, governmental agencies). For instance, with the ROI, farmers or governmental institutions can easily know the time needed to recover their investment.
Concerning the H2 price, the same method was used to determine the maximum price for the project’s profitability, e.g., either the NPV was set to 0 or the PBP was set to 6.1 years, and the price was evaluated accordingly. For the definition of the maximum accepted H2 price, the base profitability should not be defined by NPV = 0 or PBP = 6.1 years, as it represents lower limits of viability; therefore, a base profitability of PBP = 5 years was assumed, which corresponds to a price of 0.72 €/Nm3 CH4. The maximum price defined by NPV = 0 is 1.52 €/kg H2; based on PBP, it reaches a needed value of 1.41 €/kg H2 (see Figure S2 in the Supplementary Materials). Beyond 1.52 €/kg H2, the economic viability of the project is no longer achieved. As a consequence, and knowing the price evolution from the IEA [49], it appears that the electrolyzer has to operate for a maximum number of hours using only surplus electricity. According to IAE, the maximum yearly operating hours using electricity surplus equals 2000; under this limit, the H2 price is higher; for instance, at 1000 h it reaches 2 €/kg. Indeed, the lowest H2 price from non-free electricity is higher than the one calculated when NPV = 0. Even H2 produced from Steam Methane Reforming (SMR) is slightly higher than the value of 1.51 €/kg H2. It is, therefore, crucial to secure the supply of H2 from an excess of electricity in order to guarantee the plant’s profitability.

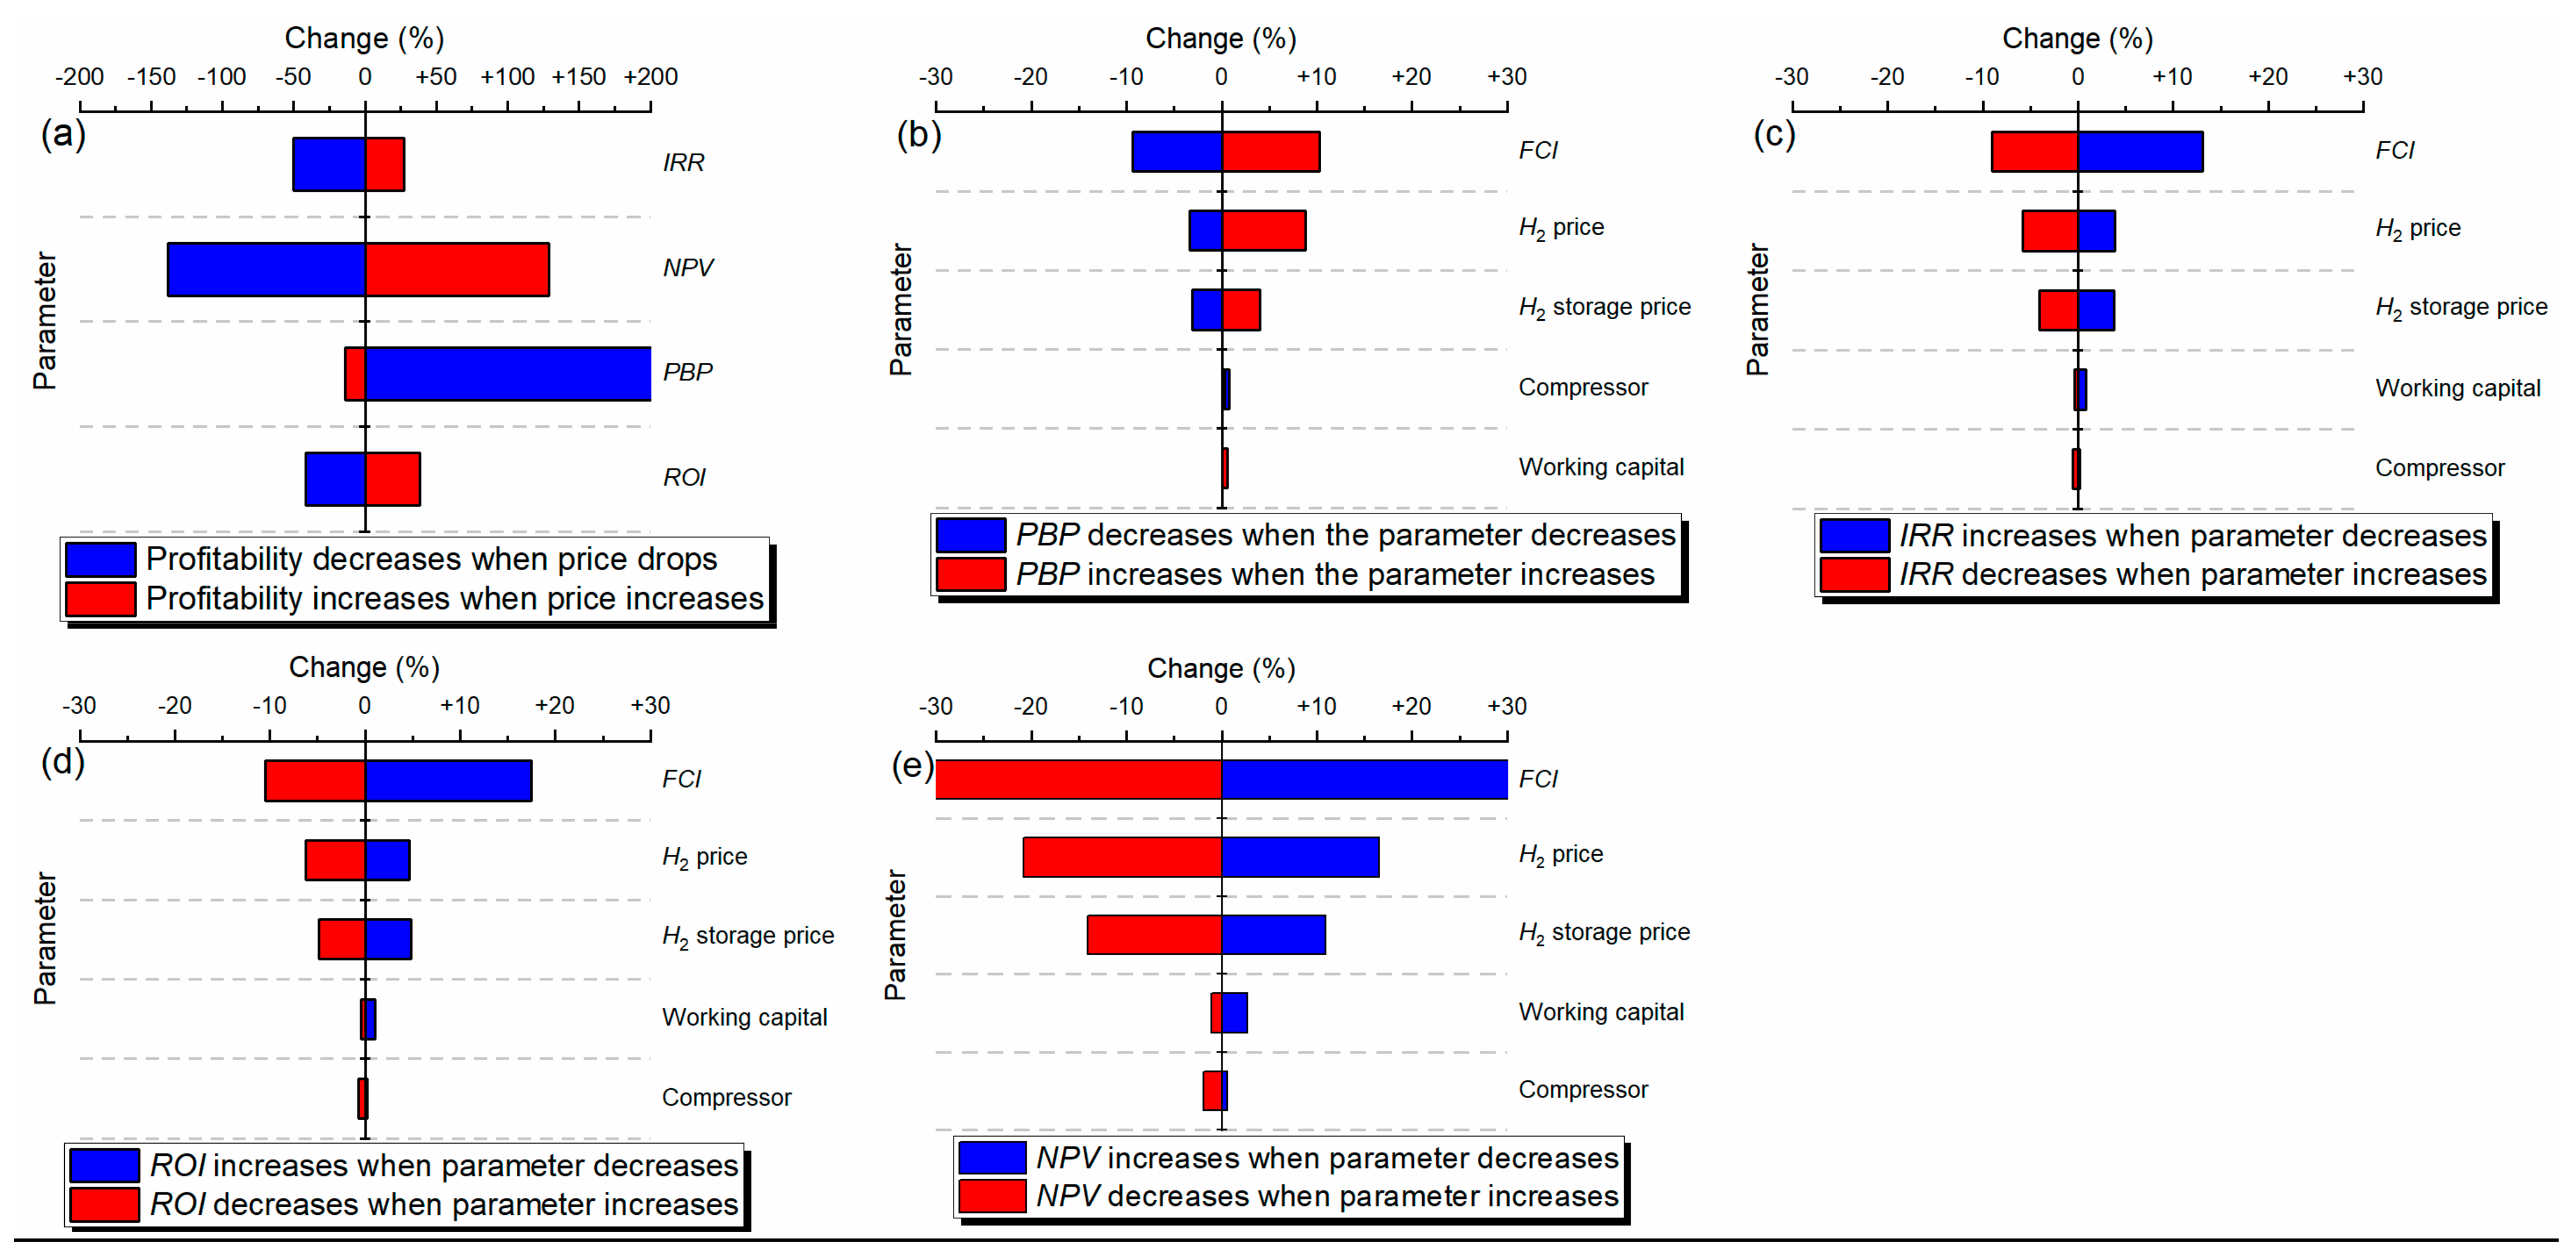
3.4. Sensitivity Analysis

A sensitivity analysis was performed by varying the following parameters: the biomethane price, the FCI, the working capital, the H2 selling price, the H2 storage purchase price, and the compressor cost (Figure 4). Figure 4a reflects the changes of all of the metrics when the biogas price varies. Figure 4b–e shows the reaction of each metric to the parameter perturbation. For instance, NPV undergoes greater changes (±30%) regarding the FCI compared to PBP (±10%) and all of the other indicators. The impact on the four indicators was studied for the base case.
Biomethane selling is the most influential parameter, and so the results are further described. Indicators such as the NPV or the PBP can vary by more than 100% in their absolute value when the CH4 price decreases (Figure 4a). This indicates that the biomethane price is important for the project’s economic feasibility, and thus that the subsidy should be carefully designed to ensure the viability of biomethane plants using biomethanation.
The second parameter with a high incidence on the economic metrics is the FCI. It should be noted that compared to the biomethane price influence, the FCI does not entail the project’s unfeasibility. Therefore, the project is less attractive, but is still profitable. Because the FCI was calculated from the purchase equipment cost, the effect of two units was investigated. Between the H2 storage and the compressor, the former has a greater impact. Hence, attention should be drawn to this equipment when designing the plant.
The H2 price has a lesser impact on the feasibility compared to the parameters aforementioned, but it is still significant enough to corroborate the previous conclusions on its contribution to the total product cost. Overall, the NPV is the most sensitive response variable, and all of them are less sensitive to the working capital and the compressor purchase cost.

3.5. Process Design Alternatives

3.5.1. 90% CH4 Content

As explained earlier, the H2 conversion was adjusted to achieve a less-efficient biomethanation, and to define the impact of dropped performance. The total produced gas volume is higher because of the low H2 density. Both CO2 and H2 are in the allowable range for injection into the gas grid [63,64]. Finally, productivity was slightly affected, with a 4% decrease. For the economics of the plant, when the NPV was set to 0, the minimum price slightly decreased to 0.63 €/Nm3. The minimum price for the base case was equal to 0.66 €/Nm3. Thus, by setting the minimum biomethane price at 0.66 €/Nm3, the profitability indicators were calculated (Table 6). A drop-in process performance then has a greater impact on the economics. It should be added that because less H2 is converted, a larger fraction of it is injected into the grid.

3.5.2. Economy of Scale

Overall, the large-scale plant performance was similar to the base scenario, reaching a final biomethane content of 97% (v/v) (Table 3). Both the total product and capital cost per capacity unit were reduced in this scenario. The capital cost is still high compared to typical biogas installations, and especially the upgrading share, as indicated in Figure 5. The cost of 0.47 €/Nm3 CH4 decreased to 0.31 €/Nm3, which is almost a 35% reduction. However, upgrading contributes more to the total cost, with a 68% share (Figure 5b). This is due to the high H2 demand, which now represents 54% of the product cost (Figure 5c). All of the other expenses remain relatively unchanged when the plant capacity is increased while the need for a H2 supply rises to convert more CO2.
The cost reduction caused a decrease in the minimum CH4 price. For a 4-year PBP, the minimum price calculated is 0.53 €/Nm3 against 0.79 €/Nm3 in the base case (Figure 6). The minimum price when NPV is set to 0 is equal to 0.43 €/Nm3, pointing out at subsidy of 0.30 €/Nm3 on top of the market price. The project is consequently more attractive regarding the CH4 price, while the necessity for cheap H2 is highlighted. The maximum H2 price dropped to 1.31 €/kgH2 when PBP was 6.1 years and 1.40 €/kgH2 when NPV = 0, having the highest maximum H2 price at 1.52 €/Nm3 as presented above.

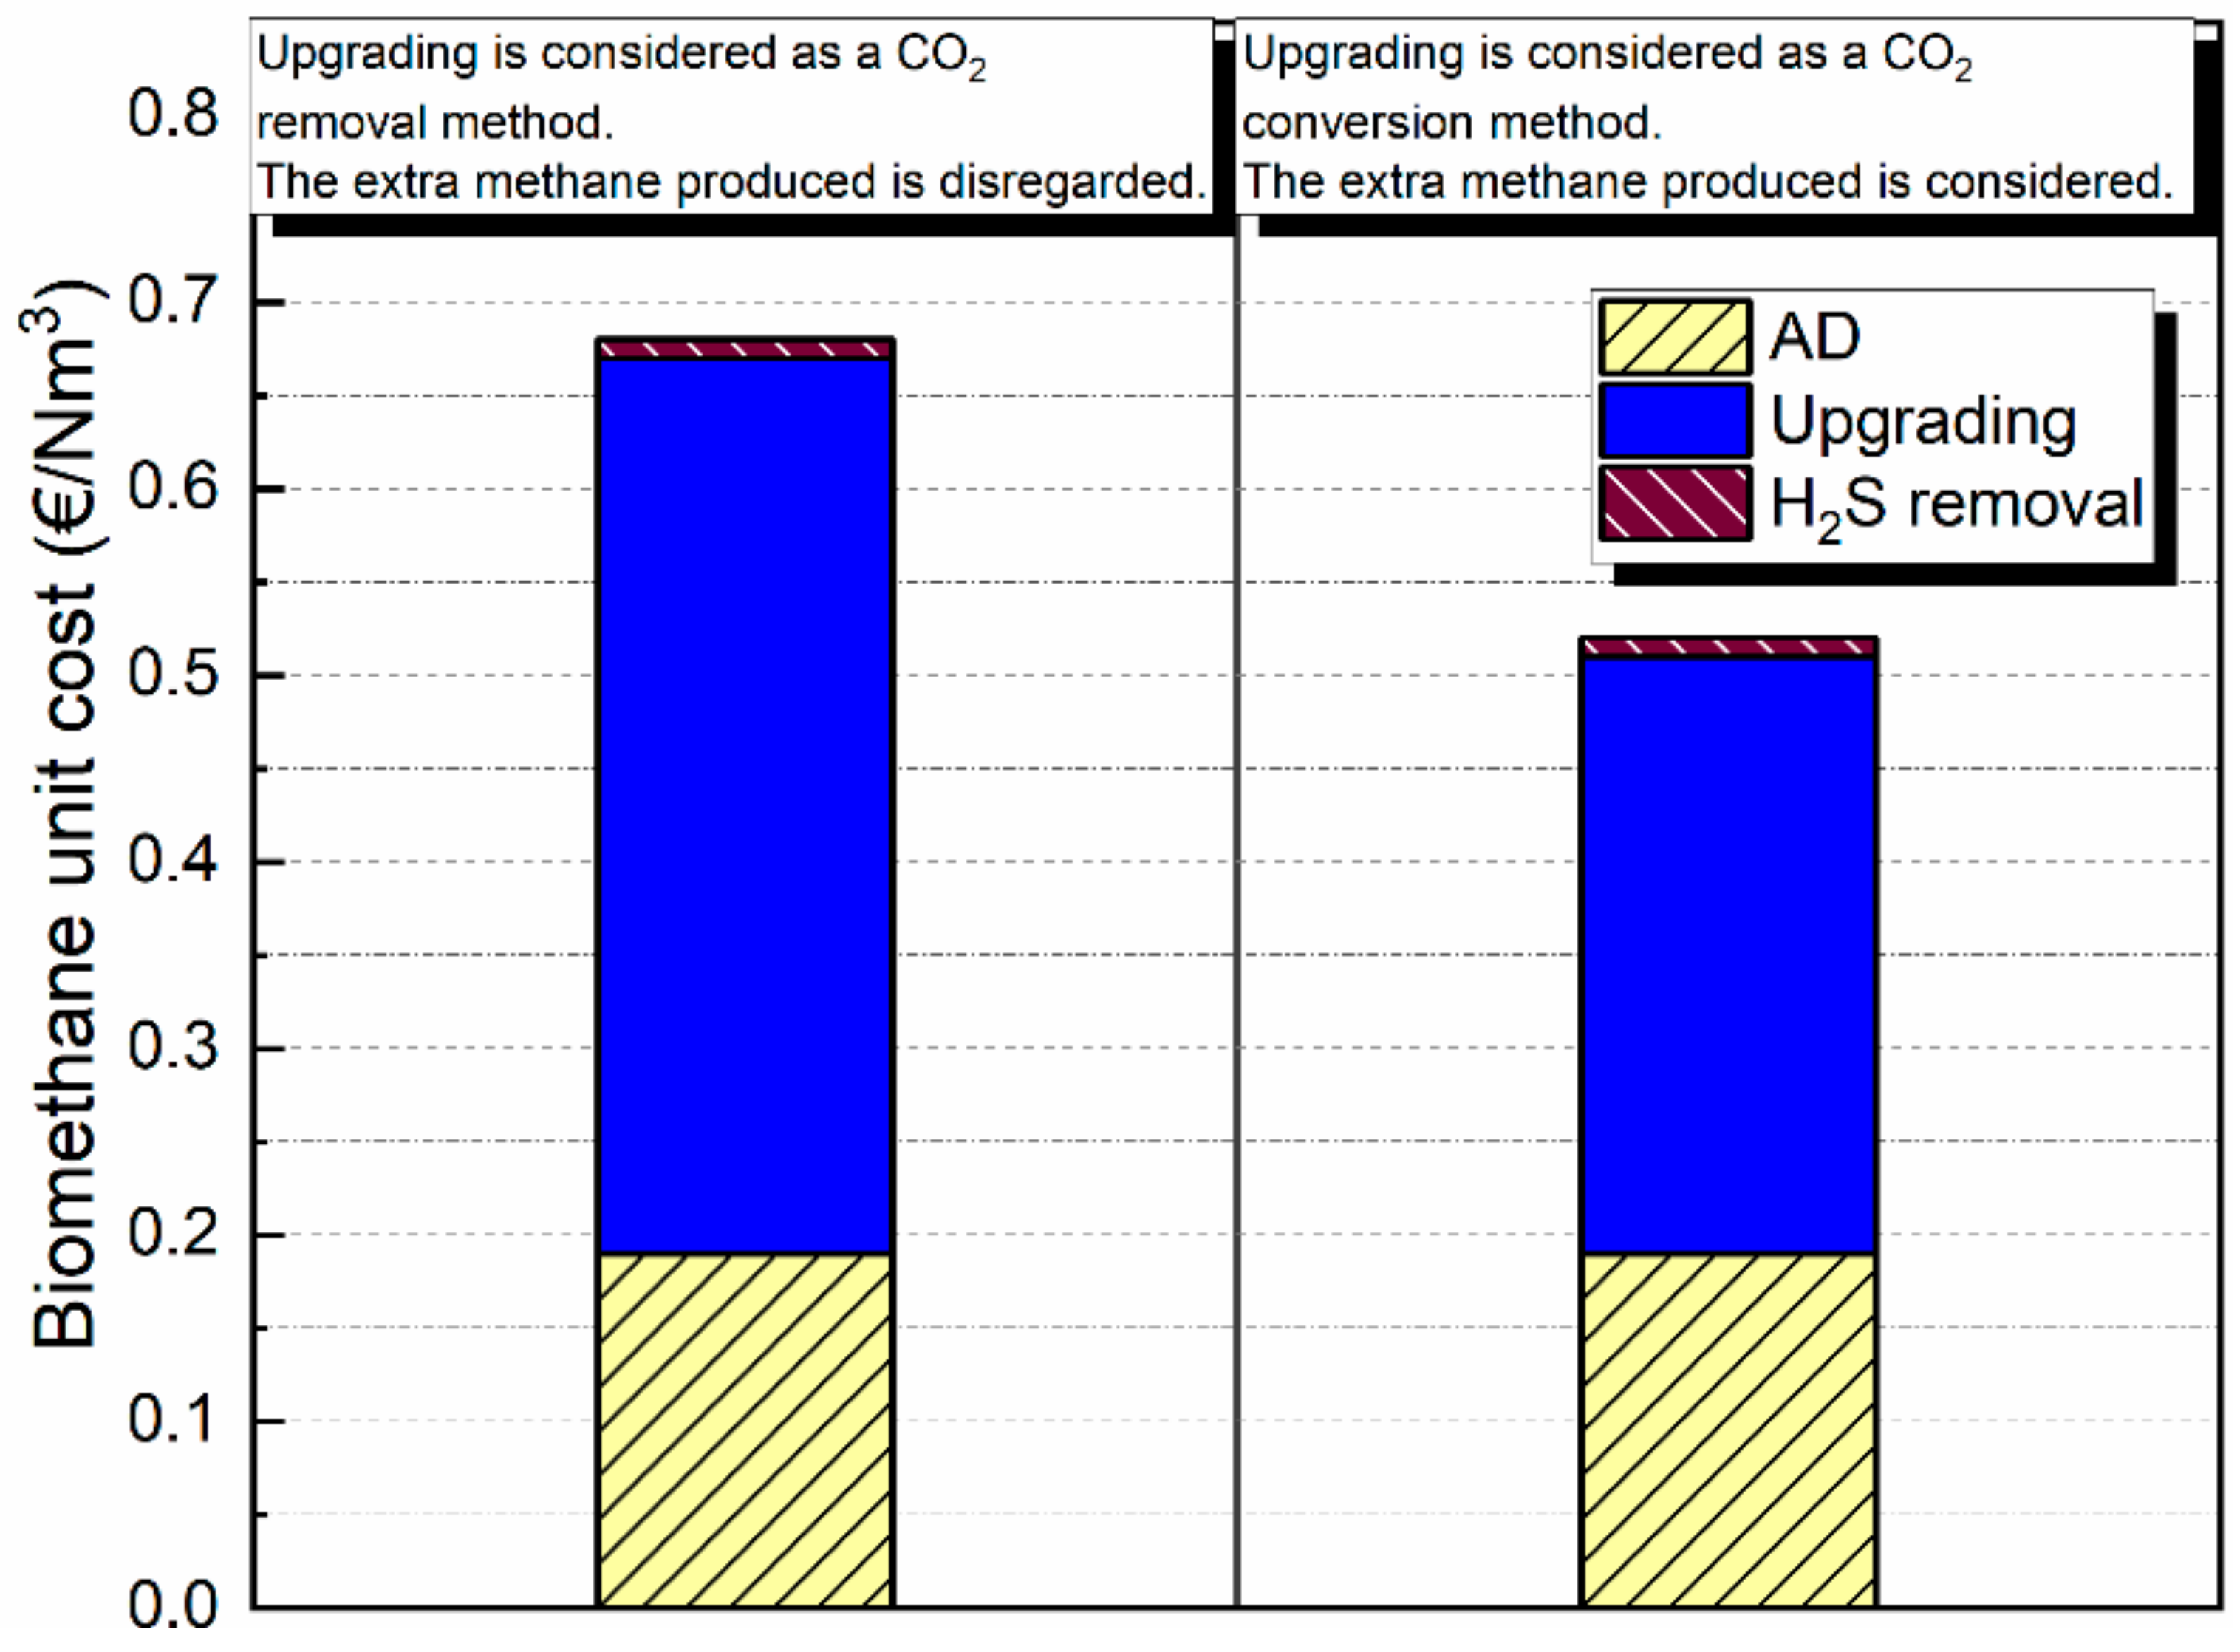
3.5.3. Comparison with Amine Scrubbing and Greenhouse Gas Emissions

The production costs (including AD and desulphurization) from different studies using amine scrubbing or ex-situ biomethanation were compared, knowing the CH4 flow rate in raw biogas (Supplementary Materials). Biological upgrading is more costly compared to amine scrubbing because of the H2 cost. Indeed, chemical upgrading costs are mainly composed of energy needs and raw materials. Vo et al. [16] reported a lower energy consumption for biomethanation, and thus the discrepancy caused by H2.
The emissions are negative for both upgrading methods. Biomethanation performs better because CO2 is converted into CH4, more natural gas is substituted, and eventually the process itself emits less GHG. Biological upgrading emits 34% less GHG (−12,000 tCO2−eq/year and −4.55 kgCO2−eq/Nm3 CH4 in biogas) compared to amine scrubbing (−5435 tCO2−eq/year and −3.40 kgCO2−eq/Nm3 CH4 in biogas). Even when the performance of biomethanation is reduced to reach a 90% CH4 content in the output, the biological route is still more favorable, with 33% GHG emission reduction in comparison to the chemical method.

4. Conclusions

This study presented the techno-economic analysis of a biogas plant with ex-situ biomethanation as an upgrading method. The utilization of process simulator software to analyse the techno-economic feasibility of biological biogas upgrading can help to draw robust conclusions about process sustainability. The modelling and simulation in PROII of the entire process gave consistent results based on experimental, literature and biogas plant data. The economic evaluation showed that the minimum biomethane price varies between 0.66 and 0.79 €/Nm3 for different levels of profitability. Because H2 contributes significantly to the production cost, the cost has to be lower than 1.52 €/kg H2 to secure economic feasibility. The sensitivity analysis revealed that the profitability is strongly affected by the biomethane price. Increasing the plant capacity improves the economic performance for the biomethane minimum price. However, the feasibility relies more on the H2 price. Despite biomethanation being more expensive compared to amine scrubbing in terms of production costs, biomethanation has a better environmental performance. Overall, a low H2 price is a prerequisite to establish biomethanation widely. Global strategies are important to reduce electrolyser costs through continuous innovation that will make the green H2 cost competitive. On this topic, the ongoing large investments in H2 production across EU are expected to be beneficial for the biomethanation process. Despite the present study being nationally oriented, the outcome clearly shows the potential of biomethanation to be used in other EU countries.

Supplementary Materials

The following are available online at https://www.mdpi.com/article/10.3390/en14248252/s1, Figure S1: Cost of hydrogen from electrolysis for different electricity costs and load factors [10], Figure S2: H2 maximum proce estimated in this study for different PBP and H2 price range from electrolysis and SMR, Table S1: Correlation coefficient (a and b) and boundaries values (Slower and Supper) for each equipment type, Table S2: Equipment cost breakdown, Table S3: Unit cost for operational expenses, Table S4: Fixed cost calculation factors, Table S5: List of compounds involved in the simulation of the base case design, Table S6: Mass balance for the base case scenario, Table S7: Mass balance for scenario 3.

Author Contributions

Conceptualization, M.A.-M. and P.T.; methodology, N.L. and M.A.-M.; software, N.L.; validation, N.L., M.A.-M. and P.T.; formal analysis, N.L.; investigation, N.L.; resources, P.T and I.A.; data curation, N.L. and M.A.-M.; writing—original draft preparation, N.L.; writing—review and editing, M.A.-M., P.T and I.A.; visualization, M.A.-M. and P.T.; supervision, M.A.-M., P.T and I.A.; project administration, M.A.-M. and P.T.; funding acquisition, I.A. All authors have read and agreed to the published version of the manuscript.

Funding

We acknowledge financial support from the projects BioUpgrade (ForskEL 2016-1-12465) and eFUEL (EUDP 64018-0559).

Institutional Review Board Statement

Not applicable.

Data Availability Statement

The data presented in this study are available on request from the corresponding author.

Acknowledgments

We acknowledge BioUpgrade and eFUEL projects.

Conflicts of Interest

The authors declare no conflict of interest.

References

  1. Oslo, N.E.R.S. 25 N.-0170; no: 984809255, N.O. 100% Renewable Energy Supply—Nordic Energy Research. Available online: https://www.nordicenergy.org/figure/ambitious-climate-targets-and-visions-for-all-nordic-countries/100-renewable-energy-supply/ (accessed on 19 October 2020).
  2. Biomass Conversion Programme. Available online: https://orsted.com/en/our-business/bioenergy/biomass-conversion-programme (accessed on 19 October 2020).
  3. The European Union. Directive (EU) 2018/2001 of the European Parliament and of the Council of 11 December 2018 on the Promotion of the Use of Energy from Renewable Sources (Text with EEA Relevance). Off. J. Eur. Communities Legis. 2018, 61, 82–209. [Google Scholar]
  4. EUR-Lex-52021PC0557-EN-EUR-Lex. Available online: https://eur-lex.europa.eu/legal-content/EN/TXT/?uri=CELEX%3A52021PC0557 (accessed on 19 November 2021).
  5. The ‘European Biomethane Map 2020′ Shows a 51% Increase of Biomethane Plants in Europe in Two Years|European Biogas Association. Available online: https://www.europeanbiogas.eu/the-european-biomethane-map-2020-shows-a-51-increase-of-biomethane-plants-in-europe-in-two-years/ (accessed on 19 November 2021).
  6. Foged, H.L.; Park, A.B. Livestock Manure to Energy; Agro Business Park A/S: Tjele, Denmark, 2012. [Google Scholar]
  7. Mathieu, C.; Eyl-Mazzega, M.-A. Biogas and Biomethane in Europe: Lessons from Denmark, Germany and Italy; Analysis & Policy Observatory: Hawthorn, Australia, 2019. [Google Scholar]
  8. Biogas Production—Insights and Experiences from the Danish Biogas Sector. Available online: https://www.biogasgoglobal.com/news/news-item/biogas-production-insights-and-experiences-from-the-danish-biogas-sector?Action=1&M=NewsV2&PID=40729 (accessed on 3 May 2021).
  9. Bauer, F.; Persson, T.; Hulteberg, C.; Tamm, D. Biogas upgrading—Technology overview, comparison and perspectives for the future. BiofuelsBioprod. Bioref 2013, 7, 499–511. [Google Scholar] [CrossRef]
  10. Rachbauer, L.; Voitl, G.; Bochmann, G.; Fuchs, W. Biological biogas upgrading capacity of a hydrogenotrophic community in a trickle-bed reactor. Appl. Energy 2016, 180, 483–490. [Google Scholar] [CrossRef]
  11. Piechota, G. Multi-step biogas quality improving by adsorptive packed column system as application to biomethane upgrading. J. Environ. Chem. Eng. 2021, 9, 105944. [Google Scholar] [CrossRef]
  12. Angelidaki, I.; Treu, L.; Tsapekos, P.; Luo, G.; Campanaro, S.; Wenzel, H.; Kougias, P.G. Biogas upgrading and utilization: Current status and perspectives. Biotechnol. Adv. 2018, 36, 452–466. [Google Scholar] [CrossRef] [Green Version]
  13. Khoshnevisan, B.; Duan, N.; Tsapekos, P.; Awasthi, M.K.; Liu, Z.; Mohammadi, A.; Angelidaki, I.; Tsang, D.C.W.; Zhang, Z.; Pan, J.; et al. A critical review on livestock manure biorefinery technologies: Sustainability, challenges, and future perspectives. Renew. Sustain. Energy Rev. 2021, 135, 110033. [Google Scholar] [CrossRef]
  14. Dupnock, T.L. High-Performance Biogas Upgrading Using a Biotrickling Filter and Hydrogenotrophic Methanogens. Appl. Biochem. Biotechnol. 2017, 183, 488–502. [Google Scholar] [CrossRef]
  15. Leme, R.M.; Seabra, J.E.A. Technical-economic assessment of different biogas upgrading routes from vinasse anaerobic digestion in the Brazilian bioethanol industry. Energy 2017, 119, 754–766. [Google Scholar] [CrossRef]
  16. Vo, T.T.Q.; Wall, D.M.; Ring, D.; Rajendran, K.; Murphy, J.D. Techno-economic analysis of biogas upgrading via amine scrubber, carbon capture and ex-situ methanation. Appl. Energy 2018, 212, 1191–1202. [Google Scholar] [CrossRef]
  17. Vo, T.T.Q.; Xia, A.; Wall, D.M.; Murphy, J.D. Use of surplus wind electricity in Ireland to produce compressed renewable gaseous transport fuel through biological power to gas systems. Renew. Energy 2017, 105, 495–504. [Google Scholar] [CrossRef]
  18. Bekkering, J.; Zwart, K.; Martinus, G.; Langerak, J.; Tideman, J.; Meij, T.; Alberts, K.; Steenis, M.; Nap, J. Farm-scale bio-power-to-methane: Comparative analyses of economic and environmental feasibility. Int. J. Energy Res. 2020, 44, 2264–2277. [Google Scholar] [CrossRef]
  19. Data & Statistics. Available online: https://www.iea.org/data-and-statistics (accessed on 12 November 2020).
  20. Lorenzi, G.; Gorgoroni, M.; Silva, C.; Santarelli, M. Life Cycle Assessment of biogas upgrading routes. Energy Procedia 2019, 158, 2012–2018. [Google Scholar] [CrossRef]
  21. Collet, P.; Flottes, E.; Favre, A.; Raynal, L.; Pierre, H.; Capela, S.; Peregrina, C. Techno-economic and Life Cycle Assessment of methane production via biogas upgrading and power to gas technology. Appl. Energy 2017, 192, 282–295. [Google Scholar] [CrossRef] [Green Version]
  22. Starr, K.; Gabarrell, X.; Villalba, G.; Talens, L.; Lombardi, L. Life cycle assessment of biogas upgrading technologies. Waste Manag. 2012, 32, 991–999. [Google Scholar] [CrossRef] [PubMed]
  23. Nashmin Elyasi, S.; He, L.; Tsapekos, P.; Rafiee, S.; Khoshnevisan, B.; Carbajales-Dale, M.; Saeid Mohtasebi, S.; Liu, H.; Angelidaki, I. Could biological biogas upgrading be a sustainable substitution for water scrubbing technology? A case study in Denmark. Energy Convers. Manag. 2021, 245, 114550. [Google Scholar] [CrossRef]
  24. Kovalovszki, A.; Alvarado-Morales, M.; Fotidis, I.A.; Angelidaki, I. A systematic methodology to extend the applicability of a bioconversion model for the simulation of various co-digestion scenarios. Bioresour. Technol. 2017, 235, 157–166. [Google Scholar] [CrossRef] [PubMed] [Green Version]
  25. Tsapekos, P.; Kougias, P.G.; Kuthiala, S.; Angelidaki, I. Co-digestion and model simulations of source separated municipal organic waste with cattle manure under batch and continuously stirred tank reactors. Energy Convers. Manag. 2018, 159, 1–6. [Google Scholar] [CrossRef] [Green Version]
  26. Okoro, O.V.; Sun, Z. Desulphurisation of Biogas: A Systematic Qualitative and Economic-Based Quantitative Review of Alternative Strategies. ChemEngineering 2019, 3, 76. [Google Scholar] [CrossRef] [Green Version]
  27. Hinge, J.; Allegue, L.B. Biogas Upgrading, Evaluation of Methods for H2S Removal; Danish Technological Institute: Taastrup, Denmark, 2014; 31p. [Google Scholar]
  28. Carlini, M.; Mosconi, E.; Castellucci, S.; Villarini, M.; Colantoni, A. An Economical Evaluation of Anaerobic Digestion Plants Fed with Organic Agro-Industrial Waste. Energies 2017, 10, 1165. [Google Scholar] [CrossRef]
  29. Tsapekos, P.; Treu, L.; Campanaro, S.; Centurion, V.B.; Zhu, X.; Peprah, M.; Zhang, Z.; Kougias, P.G.; Angelidaki, I. Pilot-scale biomethanation in a trickle bed reactor: Process performance and microbiome functional reconstruction. Energy Convers. Manag. 2021, 244, 114491. [Google Scholar] [CrossRef]
  30. Sieborg, M.U.; Jønson, B.D.; Ashraf, M.T.; Yde, L.; Triolo, J.M. Biomethanation in a thermophilic biotrickling filter using cattle manure as nutrient media. Bioresour. Technol. Rep. 2020, 9, 100391. [Google Scholar] [CrossRef]
  31. Porté, H. Process performance and microbial community structure in thermophilic trickling biofilter reactors for biogas upgrading. Sci. Total Environ. 2019, 655, 529–538. [Google Scholar] [CrossRef] [PubMed]
  32. Dupnock, T.L.; Deshusses, M.A. Detailed investigations of dissolved hydrogen and hydrogen mass transfer in a biotrickling filter for upgrading biogas. Bioresour. Technol. 2019, 290, 121780. [Google Scholar] [CrossRef]
  33. Hill, D.T. A comprehensive dynamic model for animal waste methanogenesis. Trans. ASAE 1982, 25, 1374–1380. [Google Scholar] [CrossRef]
  34. Lovato, G. In-situ biogas upgrading process: Modeling and simulations aspects. Bioresour. Technol. 2017, 245 Pt A, 332–341. [Google Scholar] [CrossRef] [Green Version]
  35. Voelklein, M.A.; Rusmanis, D.; Murphy, J.D. Biological methanation: Strategies for in-situ and ex-situ upgrading in anaerobic digestion. Appl. Energy 2019, 235, 1061–1071. [Google Scholar] [CrossRef]
  36. Denmark Corporate Tax Rate|1981–2019 Data|2020–2021 Forecast|Historical|Chart. Available online: https://tradingeconomics.com/denmark/corporate-tax-rate (accessed on 10 January 2021).
  37. Denmark—Inflation Rate. 2025. Available online: https://www.statista.com/statistics/318356/inflation-rate-in-denmark/ (accessed on 10 January 2021).
  38. Towler, G.P.; Sinnott, R.K. Chemical Engineering Design: Principles, Practice and Economics of Plant and Process Design; Elsevier/Butterworth-Heinemann: Amsterdam, The Netherlands; Boston, MA, USA, 2008; ISBN 978-0-7506-8423-1. [Google Scholar]
  39. Tao, L.; Tan, E.C.D.; McCormick, R.; Zhang, M.; Aden, A.; He, X.; Zigler, B.T. Techno-economic analysis and life-cycle assessment of cellulosic isobutanol and comparison with cellulosic ethanol and n-butanol. Biofuel Bioprod. Biorefin. 2013, 8, 30–48. [Google Scholar] [CrossRef]
  40. Amigun, B.; von Blottnitz, H. Capital cost prediction for biogas installations in Africa: Lang factor approach. Environ. Prog. Sustain. Energy 2009, 28, 134–142. [Google Scholar] [CrossRef]
  41. Zauner, A.; Böhm, H.; Rosenfeld, D.C.; Tichler, R. Innovative Large-Scale Energy Storage Technologies and Power-to-Gas Concepts after Optimization Analysis on Future Technology Options and on Techno-Economic Optimization 2019. Available online: https://www.storeandgo.info/fileadmin/downloads/deliverables_2019/20190801-STOREandGO-D7.7-EIL-Analysis_on_future_technology_options_and_on_techno-economic_optimization.pdf (accessed on 6 December 2021).
  42. Brown, R.C.; Brown, T.R. Biorenewable Resources, 1st ed.; John Wiley & Sons, Ltd.: Hoboken, NJ, USA, 2014. [Google Scholar]
  43. Kennes, C.; Veiga, M.C. Biotrickling Filters. In Air Pollution Prevention and Control; Kennes, C., Veiga, M.C., Eds.; John Wiley & Sons, Ltd.: Chichester, UK, 2013; pp. 121–138. ISBN 978-1-118-52336-0. [Google Scholar]
  44. Harder, B.; Ramirez Higareda, B.L.; Huitron, R.; Molina, R.; Jorge Edgaedo, H. Biogas plants in Denmark and Mexico. 2017. Available online: https://www.billundvand.dk/media/1277/190628-biogas-plants-in-denmark-and-mexico_05052019.pdf (accessed on 6 December 2021).
  45. Chemical Operator Salary in Denmark. Available online: https://www.erieri.com/salary/job/chemical-operator/denmark (accessed on 12 December 2020).
  46. Salaries on positions in Denmark—Paylab.com. Available online: https://www.paylab.com/dk/salaryinfo (accessed on 12 December 2020).
  47. Ramos, I.; Pérez, R.; Fdz-Polanco, M. Microaerobic desulphurisation unit: A new biological system for the removal of H2S from biogas. Bioresour. Technol. 2013, 142, 633–640. [Google Scholar] [CrossRef] [PubMed]
  48. Saur, G.; Ainscough, C. U.S. Geographic Analysis of the Cost of Hydrogen from Electrolysis; NREL/TP-5600-52640, 1033439; National Renewable Energy Lab. (NREL): Golden, CO, USA, 2011. [Google Scholar]
  49. Philibert, C. Renewable Energy for Industry: From Green Energy to Green Materials and Fuels; International Energy Agency (IEA): Paris, France, 2017. [Google Scholar]
  50. Menind, A.; Olt, J. Biogas plant investment analysis, cost benefit and main factors. In Proceedings of the 8th International Scientific Conference Engineering for Rural Development, Jelgava, Latvia, 28–29 May 2009; pp. 339–343. [Google Scholar]
  51. Shafiei, M.; Kabir, M.M.; Zilouei, H.; Sárvári Horváth, I.; Karimi, K. Techno-economical study of biogas production improved by steam explosion pretreatment. Bioresour. Technol. 2013, 148, 53–60. [Google Scholar] [CrossRef]
  52. United States Natural Gas Industrial Price (Dollars per Thousand Cubic Feet). Available online: https://www.eia.gov/dnav/ng/hist/n3035us3m.htm (accessed on 10 January 2021).
  53. Gorre, J.; Ruoss, F.; Karjunen, H.; Schaffert, J.; Tynjälä, T. Cost benefits of optimizing hydrogen storage and methanation capacities for Power-to-Gas plants in dynamic operation. Appl. Energy 2020, 257, 113967. [Google Scholar] [CrossRef]
  54. Giuntoli, J.; Agostini, A.; Edwards, R.; Marelli, L. Solid and Gaseous Bioenergy Pathways: Input Values and GHG Emissions; Publications Office of the European Union: Luxembourg, 2017. [Google Scholar]
  55. Bradbury, J.; Clement, Z.; Down, A. Greenhouse Gas Emissions and Fuel Use within the Natural Gas Supply Chain – Sankey Diagram Methodology; U.S. Department of Energy: Washington, DC, USA, 2015; 22p. [Google Scholar]
  56. Balcombe, P.; Anderson, K.; Speirs, J.; Brandon, N.; Hawkes, A. Methane and Co2 Emissions from the Natural Gas Supply Chain an Evidence Assessment; Sustainable Gas Institute: London, UK, 2015; p. 105. [Google Scholar]
  57. Harun, N.; Othman, N.A.; Zaki, N.A.; Mat Rasul, N.A.; Samah, R.A.; Hashim, H. Simulation of Anaerobic Digestion for Biogas Production from Food Waste Using SuperPro Designer. Mater. Today Proc. 2019, 19, 1315–1320. [Google Scholar] [CrossRef]
  58. Al-Rubaye, H.; Karambelkar, S.; Shivashankaraiah, M.M.; Smith, J.D. Process Simulation of Two-Stage Anaerobic Digestion for Methane Production. Biofuels 2019, 10, 181–191. [Google Scholar] [CrossRef]
  59. Khoshnevisan, B.; Tsapekos, P.; Alvarado-Morales, M.; Angelidaki, I. Process performance and modelling of anaerobic digestion using source-sorted organic household waste. Bioresour. Technol. 2018, 247, 486–495. [Google Scholar] [CrossRef] [PubMed] [Green Version]
  60. Tsapekos, P. Co-digestion of municipal waste biopulp with marine macroalgae focusing on sodium inhibition. Energy Convers. Manag. 2019, 180, 931–937. [Google Scholar] [CrossRef]
  61. Møller, H.B.; Sommer, S.G.; Ahring, B.K. Methane productivity of manure, straw and solid fractions of manure. Biomass Bioenergy 2004, 26, 485–495. [Google Scholar] [CrossRef]
  62. Burkhardt, M.; Busch, G. Methanation of hydrogen and carbon dioxide. Appl. Energy 2013, 111, 74–79. [Google Scholar] [CrossRef]
  63. Wegener Kofoed, M.V.; Jensen, M.B.; Mørck Ottosen, L.D. Chapter 12—Biological upgrading of biogas through CO2 conversion to CH4. In Emerging Technologies and Biological Systems for Biogas Upgrading; Aryal, N., Mørck Ottosen, L.D., Wegener Kofoed, M.V., Pant, D., Eds.; Academic Press: Cambridge, MA, USA, 2021; pp. 321–362. ISBN 978-0-12-822808-1. [Google Scholar]
  64. Danish Gas System Able to Store Wind Energy. Available online: https://en.energinet.dk:443/About-our-news/News/2019/05/21/Danish-gas-system-able-to-store-wind-energy (accessed on 3 May 2021).
  65. Alitalo, A.; Niskanen, M.; Aura, E. Biocatalytic methanation of hydrogen and carbon dioxide in a fixed bed bioreactor. Bioresour. Technol. 2015, 196, 600–605. [Google Scholar] [CrossRef]
  66. 10 Tips to Reduce the Costs of Your Biogas/RNG Plant and Increase Its Profitability • BiogasWorld. Available online: https://www.biogasworld.com/news/reduce-the-costs-of-biogas-plant/ (accessed on 10 January 2021).
Figure 1. Process flowsheet of the anaerobic digestion and biomethanation plant.
Energies 14 08252 g001
Figure 2. Comparison of biomethane unit costs considering upgrading as a CO2 removal and conversion method, respectively.
Energies 14 08252 g002
Figure 3. Cumulative cash flow diagrams at different discount rates for (a) 0.66, (b) 0.67, (c) 0.72, and (d) 0.79 €/Nm3 CH4 selling prices, respectively.
Energies 14 08252 g003
Figure 4. Sensitivity analysis tornado plots for (a) the biomethane price according to all of the economic metrics, (b) PBP, (c) IRR, (d) ROI, and (e) NPV.
Energies 14 08252 g004
Figure 5. (a) Capital cost comparison of scenario 3, with data from biogasworld.com and the base case; (b) cost contribution from each plant section; and (c) cost breakdown for upgrading between the base case and the larger plant scenario.
Energies 14 08252 g005
Figure 6. Biomethane minimum price comparison for all of the scenarios.
Energies 14 08252 g006
Table 1. Summary of the plant’s characteristics—base case.
ItemAssumption
Plant locationDenmark
Capacity100,000 tons of substrate/year
ProcessContinuous, 24 h/day, 345 days/year
Feedstock80% manure/20% industrial waste
HRT20 days
GRT30 min
Calculation year2019
Plant lifetime20 years
Construction period1 year
Discount rate10%
Income tax22%
Inflation rate1.2%
DepreciationStraight line, 5%/years
Table 2. AD results indicators.
Parameter/IndicatorThis StudyComparison
Organic loading ratekgVS/m3 d5.07
CH4 content% (v/v)6556.78 [57]59.51 [58]
CO2 content% (v/v)3524.51 [57]
CH4 productivityNm3/m3 d1.330.88 [59]0.85 [60]
CH4 yieldNm3/t of VS271.81275 [61]148 [61]
Nm3/t of feedstock26.55
Table 3. Biomethanation results indicators.
Parameter/IndicatorBase Case90% CH4 ContentLarger Plant Capacity
CH4 content% (v/v)96.090.2597.0
CO2 content% (v/v)0.01.980.0
H2 content% (v/v)4.07.773.0
H2 loading rateNm3/m3.d29.5329.5326.52
CH4 loading rateNm3/m3.d5.625.405.62
CO2 H2 conversion%98.99598.9
Table 4. Breakdown of the total capital investment for each section of the plant.
SectionTotal Equipment Cost (103 €)Fixed Capital Investment (FCI) (103 €)Total Capital Investment (TCI) (103 €)
Anaerobic digestion (AD)138524922866
Upgrading93424472814
Total231949395680
Table 5. Economic metrics and minimum CH4 price for different profitability levels—base case.
IndicatorNPV = 0PBP = 6.1 YearsPBP = 5.0 YearsPBP = 4.0 YearsRequirement
ROI (%)9.119.9113.0417.39>10%
PBP (y)6.466.15.04.0<PBPr = 6.1 years
NPV (106 €)00.421.913.96>0
IRR (%)1010.8413.6617.22>10%
Minimum CH4 selling price (€/Nm3)0.660.670.720.79
Table 6. Economics metrics for the 90% CH4 content scenario at a price of 0.66 €/Nm3.
IndicatorBase Case90% CH4Requirement
ROI (%)9.1111.20>10%
PBP (y)6.465.6<PBPr = 6.1 y
NPV (106 €)01.04>0
IRR (%)1012.03>10%
CH4 min selling price (€/Nm3)0.660.66
Publisher’s Note: MDPI stays neutral with regard to jurisdictional claims in published maps and institutional affiliations.

