1. Introduction
In the recent years, the European energy market opened the possibility for third parties to provide regulation services (e.g., ancillary services). Among these control services, a very important role for the safe operation of the electricity network is given to the frequency control services, which aim at maintaining the network frequency in a safe range. Frequency regulation services are usually provided by traditional generators, through speed droop controllers that control the mechanical power applied to the rotor shafts based on their rotation speed. However, it is also possible to control the network frequency with other kind of generators, like wind farms [
1,
2] and photovoltaic plants [
3]. Moreover, many papers intercepted the possibility to modulate the energy demand of heavy flexible electric loads, such as heating, ventilation, and air conditioning systems [
4], and thermostatically controlled loads [
5], in order to control network frequency. Among the flexible loads, PEVs emerged as good candidates for the provision of frequency regulation services, as their power consumption can be changed remotely by the charging stations, and the reaction time is very low. Anyway, the power absorbed by a single PEV is not enough to participate effectively to the ancillary service market, so it is fundamental to aggregate a set of PEVs and coordinate their action to provide the requested services. The possibility to aggregate many charging PEVs is becoming easier, due to the mass spreading of PEVs in the market and thanks to new high-speed/low-latency cellular communication means [
6], which significantly reduce the cost to update the current charging point operator (CPO) infrastructure to provide frequency regulation services. Indeed, the authors of this paper proposed a novel architecture [
7] that enables CPO charging stations to provide frequency regulation services over a 5G communication network, exploiting the 5G multi access edge computing [
8] as edge computing node, without violating the time constraints to provide this kind of services. The proposed architecture [
7], together with the results coming from this paper, will be implemented in the context of the European H2020 Project 5G-Solutions [
9].
The problem of controlling PEVs for frequency regulation services has been studied in the literature by Yao, Wong, and Schober with focus on a robust control method to estimate the hourly regulation capacity (i.e., aggregated power margins) of the PEVs [
10], or with a focus on the market bids for the frequency regulation services provided by PEVs [
11]. Moreover, Xia et al. studied, in [
12], the problem of computing power setpoints for fleets of PEVs in presence of fluctuating wind generators, using consensus.
In addition, the contribution of PEVs to fast frequency regulation has been studied in [
13], where the frequency droop curves for each PEV cluster are computed using an improved harmony search algorithm, but without balancing the effort of each PEV based on its smart charging requirements.
Kuang et al. have studied in [
14] the problem of providing frequency regulation by using dispersed PEVs, while maintaining the target state of charge (SOC) level requested by the PEV owners, but without changing dynamically over time the control droop curves to balance the effort among the different PEVs based on the drivers’ requirements.
In [
15], the authors provided a hierarchical control scheme to allocate frequency control effort among the charging PEVs that is able to ensure the final SOC level for the PEVs by real-time corrections of the allocated frequency control action. Anyway, this approach does not optimize the effort among the different PEVs, allocating it based on the frequency regulation capacity of each PEV.
Jia et al. have studied in [
16] the problem of load frequency control using PEVs with inertia uncertainties and time-varying delays, and in particular focusing on the coordination among PEVs and power plants to provide such frequency control functionalities, but without considering the integration of smart charging system with load frequency control, which is one of the focuses of the presented paper.
In [
17], the authors have discussed a demonstration of the provisioning of frequency-controlled normal operation reserve (one of the primary frequency regulation services in the Nord Pool energy market) using three PEVs from different manufacturers. Differently from the present work, the charging setpoints to implement the frequency regulation service are computed by a central controller, which results in higher response times compared to the decentralized solution we present.
In [
18], a model predictive control scheme to schedule the bidding in frequency regulation market is proposed, with the aim of maximizing the payment to PEV aggregators, based on a prediction of the frequency regulation market price built using a seasonal-autoregressive integral-moving-average model. Though taking into account the current PEVs SOC level, the EV power schedule is limited to three possible states and, again, the effort is not balanced among PEVs; moreover the algorithm does not provide droop curves to be applied by the PEVs in response to frequency deviations.
Finally, in [
19], Islam et al. propose a Markov decision process formulation of the problem of aggregating flexibility from the PEVs for providing frequency regulation services. The goal is to maximize the revenue of the aggregator. A possible limitation of this approach is in its scalability, and in the possibility of having a fine-grained control for each PEV (due to the use of the state aggregation technique).
The distinctive features of the present paper are: (i) we propose an approach in which frequency control actions are taken at each charging station based on local droop curves, which allows for very fast intervention, as required for providing fast frequency regulation. The parameters of the local droop curves are periodically updated by a central controller, which allows to equally balance the frequency control effort among the PEVs, while having a highly scalable scheme, since the central optimization problem is a linear one and is executed within larger time constraints with respect to the frequency regulation control loop ones; (ii) the droop curves are computed as to balance the control effort among the various PEVs, taking into account the smart charging requirements of the different users, on available dwelling time, current SOC, and final desired SOC; (iii) the presented algorithm exploits the availability of edge computing nodes, such as 5G multi-access edge computing, to reduce, as much as possible, communication latencies with the charging stations, and with the frequency meter.
In summary, the proposed approach is scalable, it allows for very fast frequency control action, and it ensures a correct balancing of the control action among the participating PEVs, by taking into account their individual conditions. Therefore, the algorithm summarizes the strengths found separately in the different works in literature.
The rest of the paper is structured as follows:
Section 2 presents the reference system architecture and the interaction between traditional smart charging services and frequency regulation services;
Section 3 presents the problem formulation, while
Section 4 the proposed algorithm to compute the local droop curves for each charging PEV;
Section 5 reports numerical simulation to validate the proposed algorithm.
2. Reference Scenario and Problem Description
In recent years, the European energy market has moved towards a separation between the roles of balance responsible party (i.e., the entities which are responsible for electricity network imbalances), and balance service provider (i.e., the entities which provide balancing services for the electricity network). In this context, the distribution system operators (DSOs) can rely on the balance service providers for their balancing services [
20]. The CPO can, thus, take advantage of this market separation, becoming itself a balance service provider and providing ancillary services to the power network, by leveraging the possibility of changing the power setpoint of the charging station in real-time. Anyway, the CPO cannot participate to the ancillary service market with each separate charging station, since the power provided by each charging station is not in line with the power requirements to access to this market; instead, it can participate after aggregating many (even physically dispersed) charging stations, and so providing balancing services both at DSO and transmission system operator level. In this context, the authors of this paper proposed a smart charging solution that can enable fleets of charging PEVs to demand side management services [
21].
Within the same scenario, it is possible, in principle, to provide also frequency regulation services, by leveraging the power margins provided by the smart charging system. Indeed, most of the time the charging PEVs charge with a power setpoint that is between zero and the maximum charging power, and so there are power margins both to increase and to reduce the power adsorbed by the PEVs. These margins can be aggregated and used to participate to the frequency regulation services.
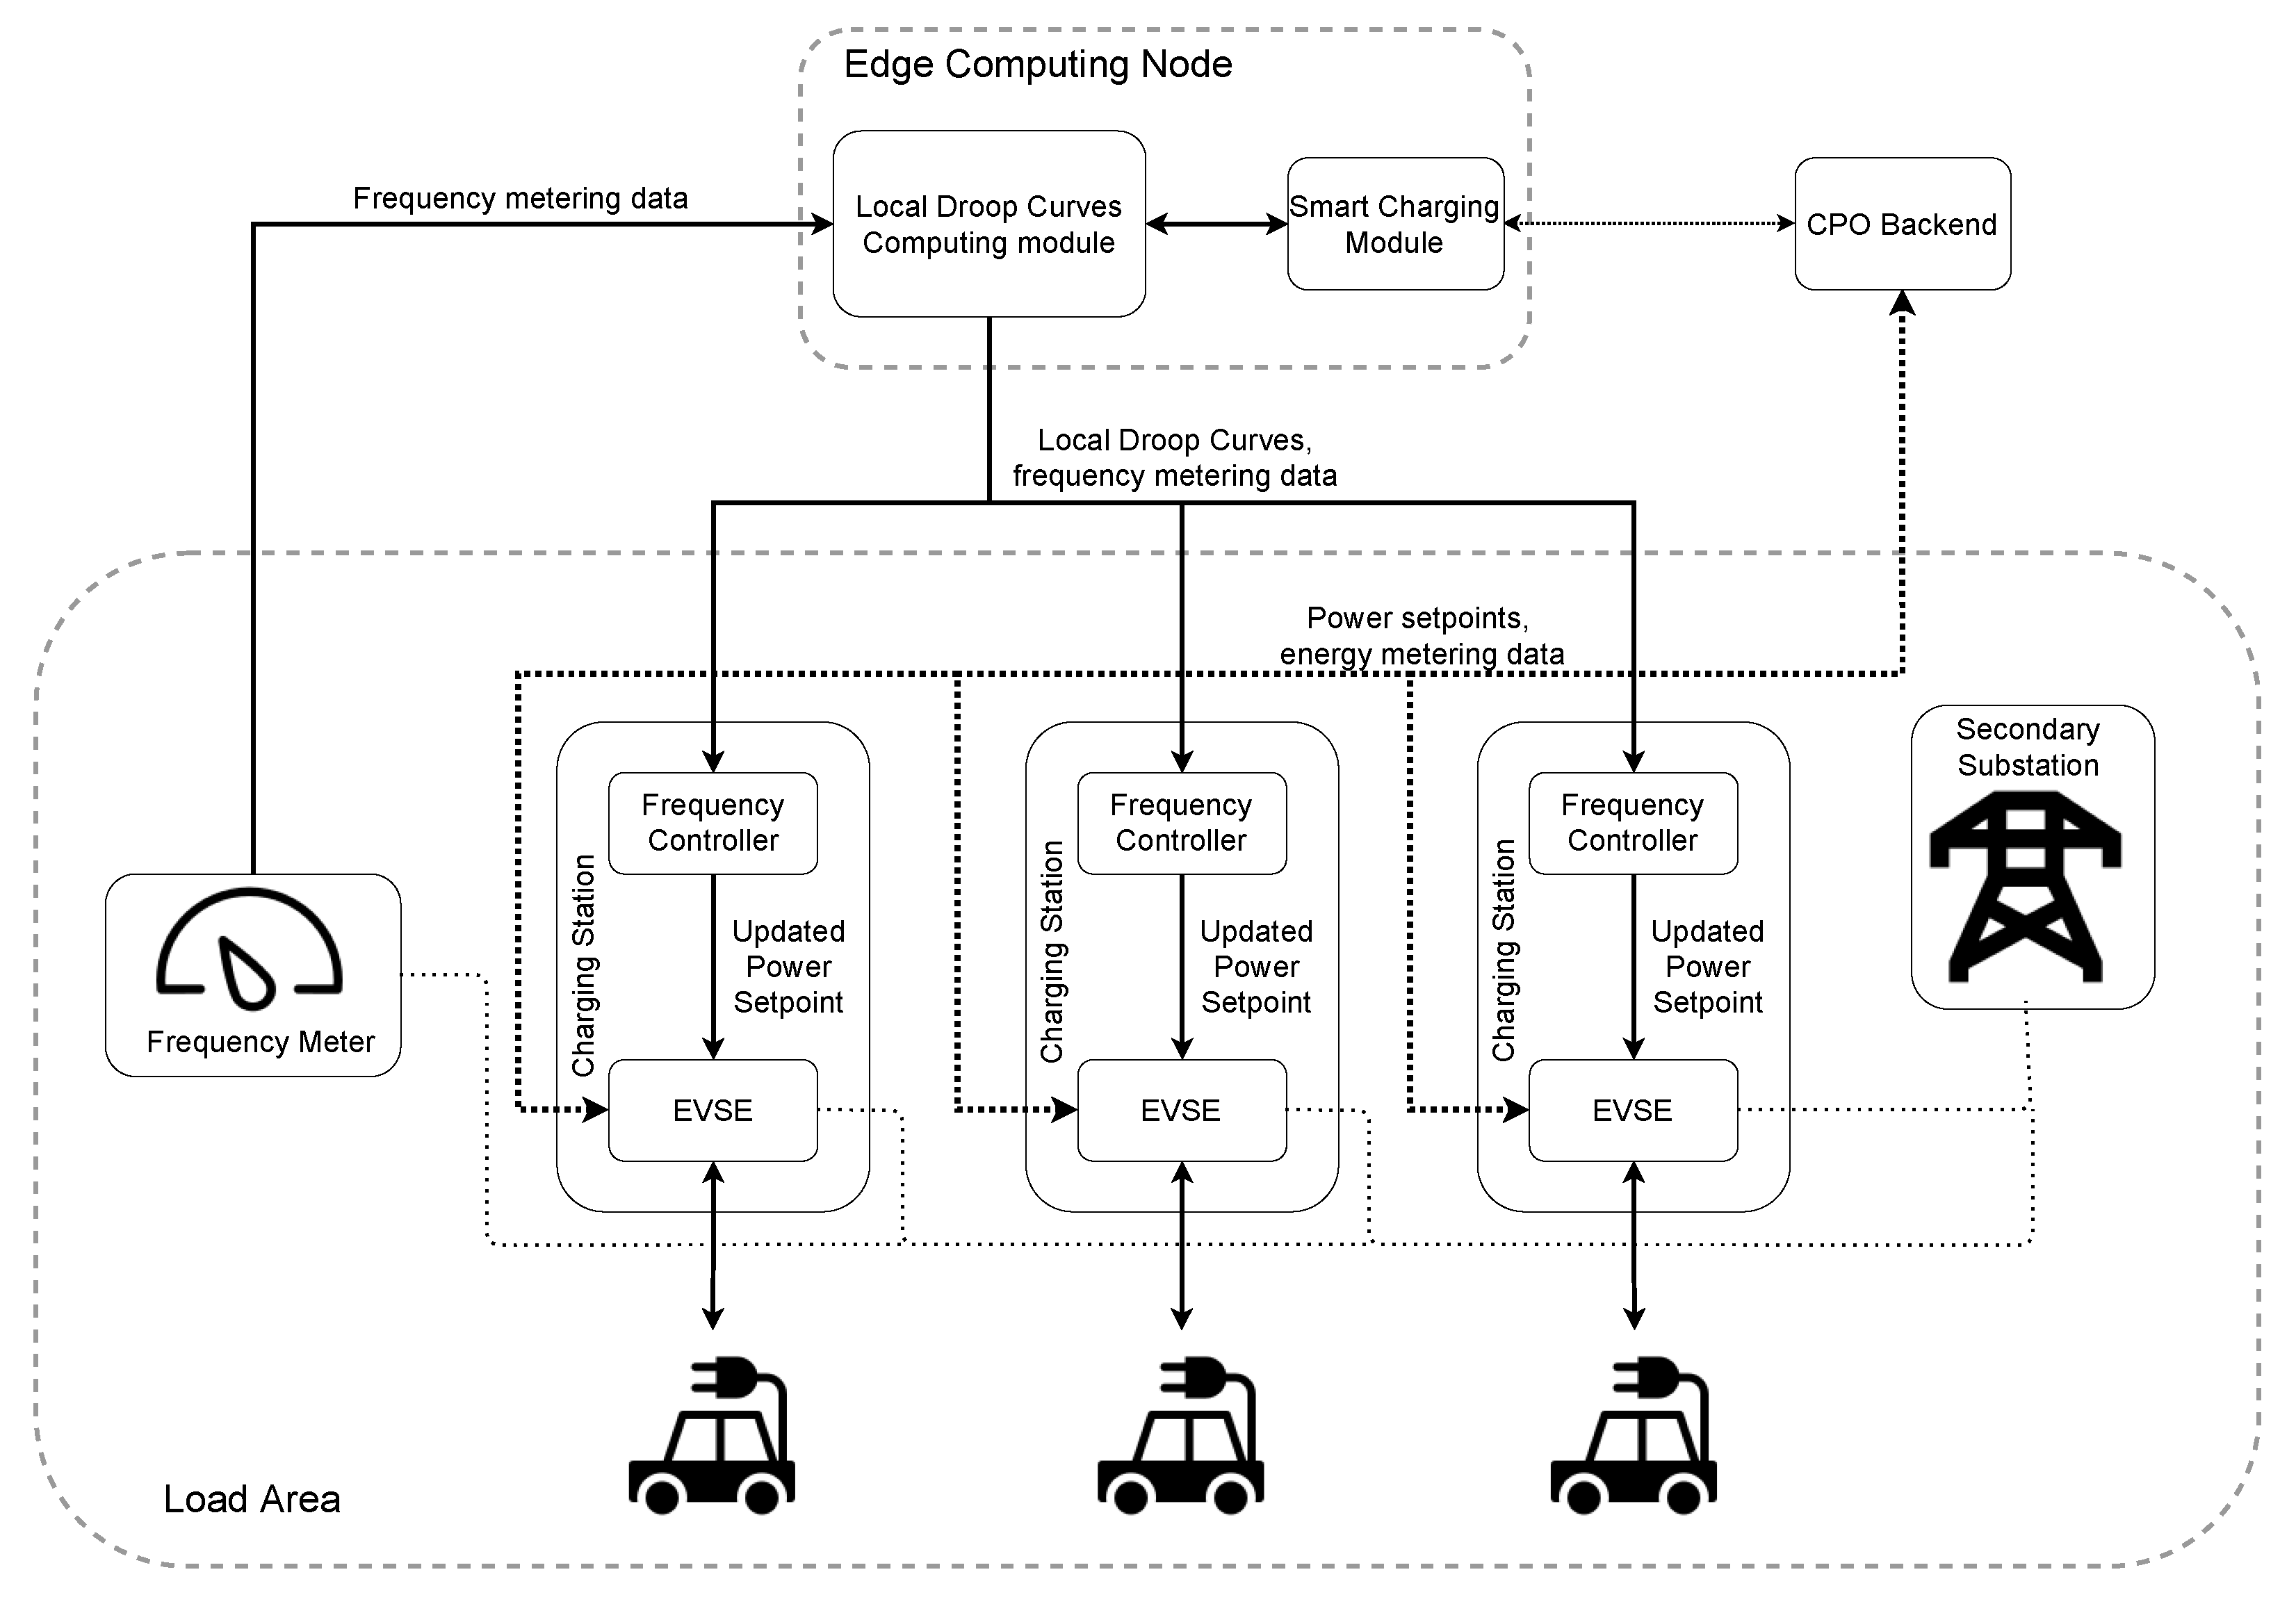
Figure 1 shows the reference scenario considered in this study, which is based on the same novel architecture proposed in [
7]. A set of PEVs are connected to charging stations that are remotely monitored and controlled by the CPO backend. The charging power setpoints actuated by the charging stations are periodically (e.g., every minute in [
21]) computed by smart charging algorithms hosted in the “smart charging module”. The goal of the smart charging module is to control the PEV recharging in the load area, in such a way that the PEVs are recharged in compliance with the user preferences (e.g., time available for recharging and amount of energy to recharge), and in compliance with the technical constraints of the grid. Hence, the role of the smart charging module is to ensure safe (for the vehicle and the grid), efficient (e.g., taking into account battery degradation), and economical smart charging service to the users. For an example of a possible implementation of the smart charging module, and the associated smart charging algorithms, the reader is referred, e.g., to our previous work [
22].
The role of the “local droop curves computing module” instead is related with the provisioning of frequency control services. The module hosts a control algorithm which builds frequency control services by leveraging the flexibility offered by the PEVs. The module periodically computes and sends to the charging stations one power-frequency droop curve for each PEV performing smart charging, and agreeing to participate in frequency regulation. The droop curves are frequency/power curves that, given the current value of the network frequency, specify the power deviation with respect to the smart charging setpoint, i.e., how much the charging power setpoint computed by the smart charging module for the specific vehicle should be increased or decreased at any time, depending on the current grid frequency value. In absence of the frequency regulation service, the charging station simply implements the power setpoint it receives periodically from the smart charging module. When the PEV also participates in the frequency regulation, the charging station adds or subtracts to the smart charging setpoint a delta of power that is given by the value of the local droop curve at the current value of the grid frequency (frequency measurement is communicated to the charging station via 5G). To be able to modulate, in real time, the power setpoint, as required in this scheme, the charging station needs to be equipped with a power converter (as in direct current charging stations). As discussed in the following, the different droop curves are computed in such a way that their total, cumulative effect follows a desired power-frequency droop curve, as if the PEV fleet was a unique entity providing frequency regulation services.
The relation among the two modules introduced above will be fully characterized in a future work. We remark here that each local droop curve is computed on the basis of the specific parameters of the related charging session. The logic is that the contribution of each PEV to the frequency regulation should be tuned depending on the current progress of the charging session, and on the technical characteristics of the PEV. On the other hand, the implementation of the droop curves by the single PEVs means that a different setpoint is actuated by the PEV, compared to the one that was computed by the smart charging module. The effect of this perturbation is compensated by the fact that the smart charging module periodically recomputes the charging schedules (see, e.g., [
22]), so that the new charging schedule is computed taking into account, and to compensate, the effect of any possible deviation from the previous schedule caused by the participation of the PEV to the frequency regulation service (and by any other disturbance affecting the charging process). The effect of the perturbation on the smart charging session caused by the participation of the PEV in the frequency regulation service is measured by the smart charging module by measuring the current state of charge of the PEV, before each re-calculation of the smart charging setpoint. This scheme ensures that the two services, i.e., the smart charging service, and the frequency regulation one, can coexist, in a way that is transparent for the user.
The present works focuses entirely on the discussion of the control algorithm hosted by the local droop curves computing module. The interaction of this module with the smart charging module will be fully analyzed in a future publication.
In order to enable the charging stations to provide frequency regulation services, the system should be able to take a frequency measure and actuate the proper power setpoint to the PEV (increasing or reducing it based on the frequency deviation) within a very limited time (in the order of 300 ms, according to the Fast Reserve pilot project of TERNA [
23]), as analyzed in [
7]. It is important to notice that this very strict time constraint has to be guaranteed just for frequency regulation functions, while other smart-charging functionalities (e.g., the computation of nominal power setpoints) have much larger time constraints, that are typically in the order of minutes. Installing a frequency meter capable of the above-mentioned time requirements inside each charging station would imply very high costs. However, by leveraging the new cellular communication technologies (e.g., 5G), it is possible to install just one (or few, for redundancy) frequency meter in each load area, and then spread the information to the other charging stations with negligible delay, thus matching the strict time requirements for the service.
3. Nomenclature and Problem Formulation
In this section, we detail the proposed control algorithm hosted in the “local droop curves computing module”, which periodically computes the local droop curves (i.e., one for each charging station), based on the current status of the ongoing charging sessions. In particular the local droop curves are computed with the same sampling time of the smart charging signals (e.g., nominal power setpoints for the charging sessions), so in the order of minutes. First of all, the used nomenclature is introduced.
Let N be the number of PEVs connected at the generic time k in the load area. The generic n-th PEV at time k is characterized by:
The current charging power level ;
The maximum and the minimum possible charging power levels, respectively and (if , the PEV is enabled to discharging);
The current SOC level ;
The time left until the end of the charging session, ;
The error, , between the desired SOC, , and the current one, , i.e., ;
The power deviation, , at time k, for the n-th PEV, due to the participation in the frequency regulation service. This value is computed from a droop curve.
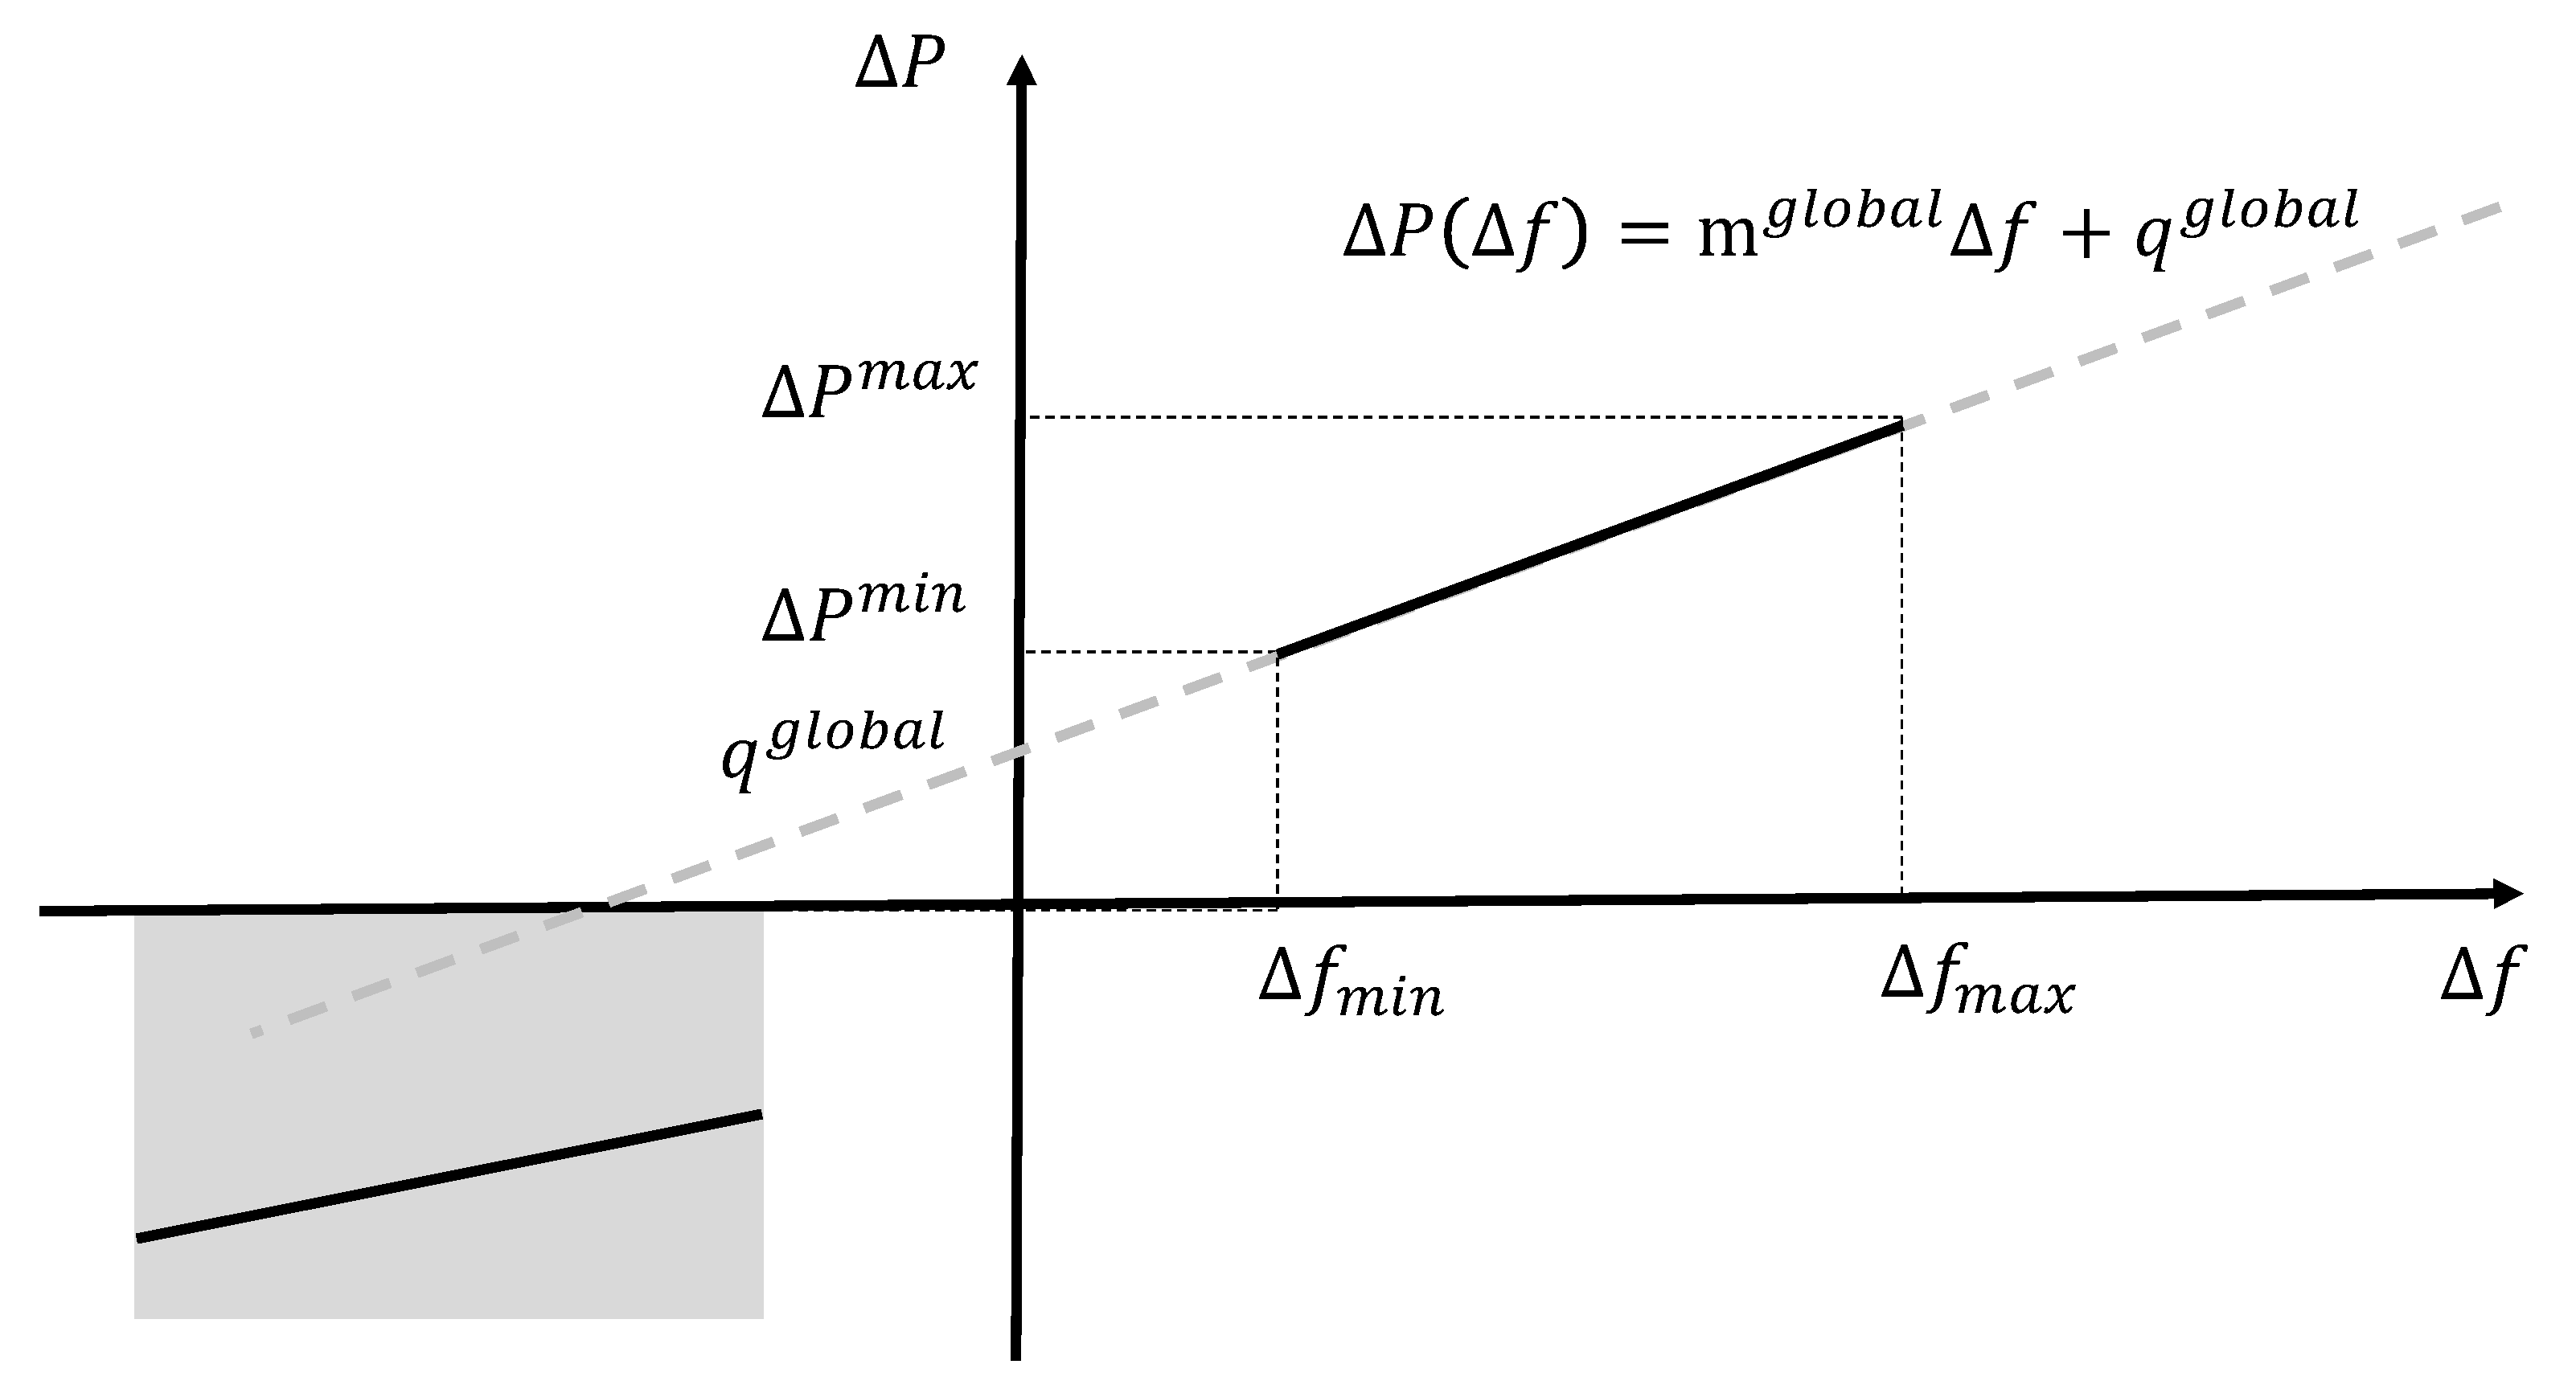
The proposed algorithm is aimed at optimally coordinating the connected PEVs in the participation to the provisioning of ancillary services. In more detail, the problem we tackle is that of optimally define p–f droop curves at single PEV level (which we call local droop curves ), in such a way that, once combined, they match a given, desired droop curve (the global droop curve). The global droop curve defines how, collectively, the connected PEVs should react to frequency mismatches, as if they formed a unique entity participating in the provisioning of the ancillary service.
Figure 2 displays a general prototype of a global p–f curve. Focusing of the right-half plane, the parameter
defines the deadband: the power variation is zero if the deviation of the frequency with respect to the reference frequency value is in the interval
.
defines the frequency deviation limit after which the power variation saturates.
defines the droop, i.e., the ratio between the variation of the power and the frequency deviation.
The algorithm presented next recovers the global droop curve as the sum of N local droop curves. A notable aspect is that the design of each local droop curve takes into account the current status of the PEV’s recharging process, as explained next.
For the design of the local droop curves, we make the following assumption.
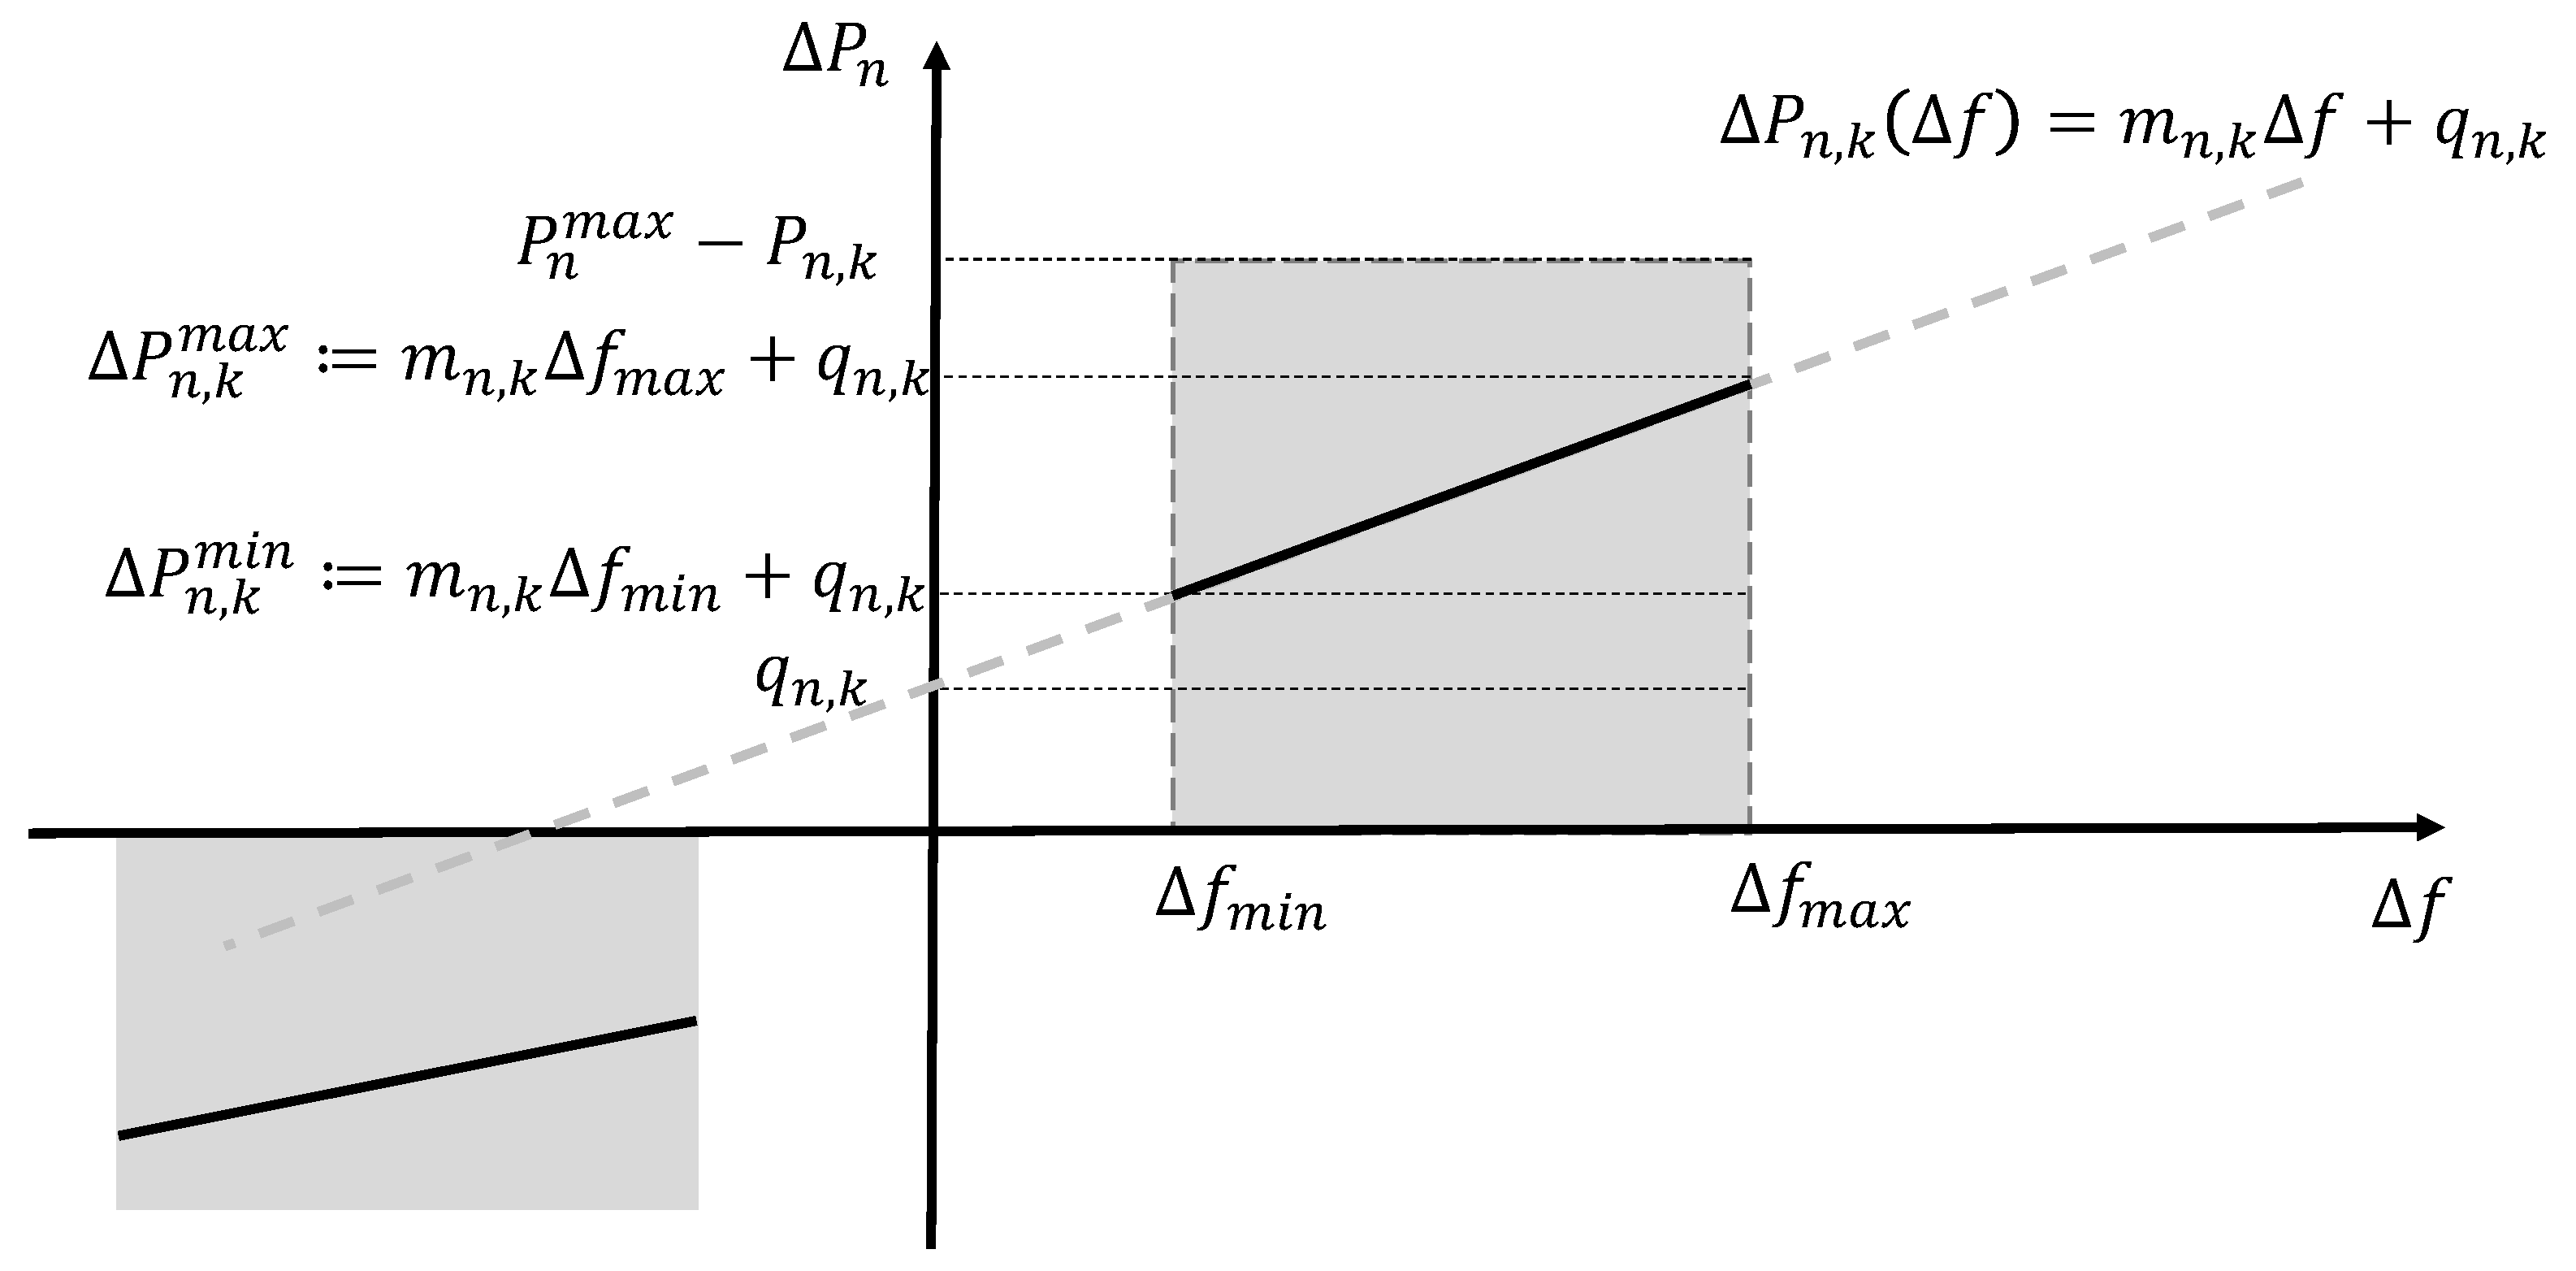
Assumption 1 (Shape of local droop curves). Local droop curves have a positive slope, and they are linear between and .
Assumption 1 is included because it is in line with the common design principle of standard p–f droop curves (the algorithm proposed in this paper could work also with non-linear droop curves). As implied by Assumption 1, the focus of this paper is on linear droop curves, i.e., on curves described by the equation:
We focus on linear local droop curves because standard droop curves are linear, and because working with such type of functions results in a linear optimization problem, which has low computational complexity.
The algorithm proposed in this paper optimally designs each local droop curve by selecting the parameters
and
, which are, therefore, the optimization variables of the problem. The algorithm is presented in the next section. To keep the description of the algorithm concise, and without loss of generality, we focus our attention on the design of the portion of the droop curves lying on the right half of the
/
plane (see
Figure 2 and
Figure 3). The part of the curve on the left half of the plane is designed in a similar way.
5. Numerical Tests
Simulations have been performed in Julia [
24], version 1.6.0, on an standard computer (3.3 GHz, I7 processor with 16 GB RAM). The simulation scenario is as follows. We consider a charging load area that participates to the frequency regulation service. We assume that the charging sessions active in the load area are enough to provide the required power-frequency curve, i.e., that the composition algorithm presented in
Section 4 admits a solution.
In the following, two simulation scenarios are discussed, to validated the proposed approach:
- 1
Scenario 1: we run the algorithm in a balanced scenario, i.e., considering a set of charging sessions that are homogeneous in terms of power margin flexibility, SOC error, and charging time availability;
- 2
Scenario 2: we run the algorithm in a scenario in which the charging sessions have different power margins, different SOC errors, and time flexibility.
The two scenarios are meant to show that, from one side, the algorithm is able to come up with a fair and balanced assignment of local droop curves among the participating PEVs while, on the other hand, taking always in consideration the real time SOC and time flexibility status of the participating PEVs, as determined by the respective charging session status, controlled by smart charging algorithms.
5.1. Scenario 1: Local Droop Curves Assignment in a Balanced Scenario
The first set of simulations is aimed to show how the algorithm is able to design local droop curves that result in a balanced distribution of the regulation effort, among the participating PEVs. To this end, we consider 3 active charging sessions, characterized by the same dwelling time and SOC error. The distinguishing attribute between the sessions is the available margin of power, , which reflects:
The possible presence of different charging technologies in the load area, i.e., the fact that the charging sessions are characterized in general by different maximum power, depending on the charging technology;
The presence of smart charging sessions, i.e., the fact that the charging sessions happen at different charging levels, which are in general different from the maximum possible charging level.
Indeed, the algorithm must be able to work in presence of smart charging sessions ongoing at different charging levels.
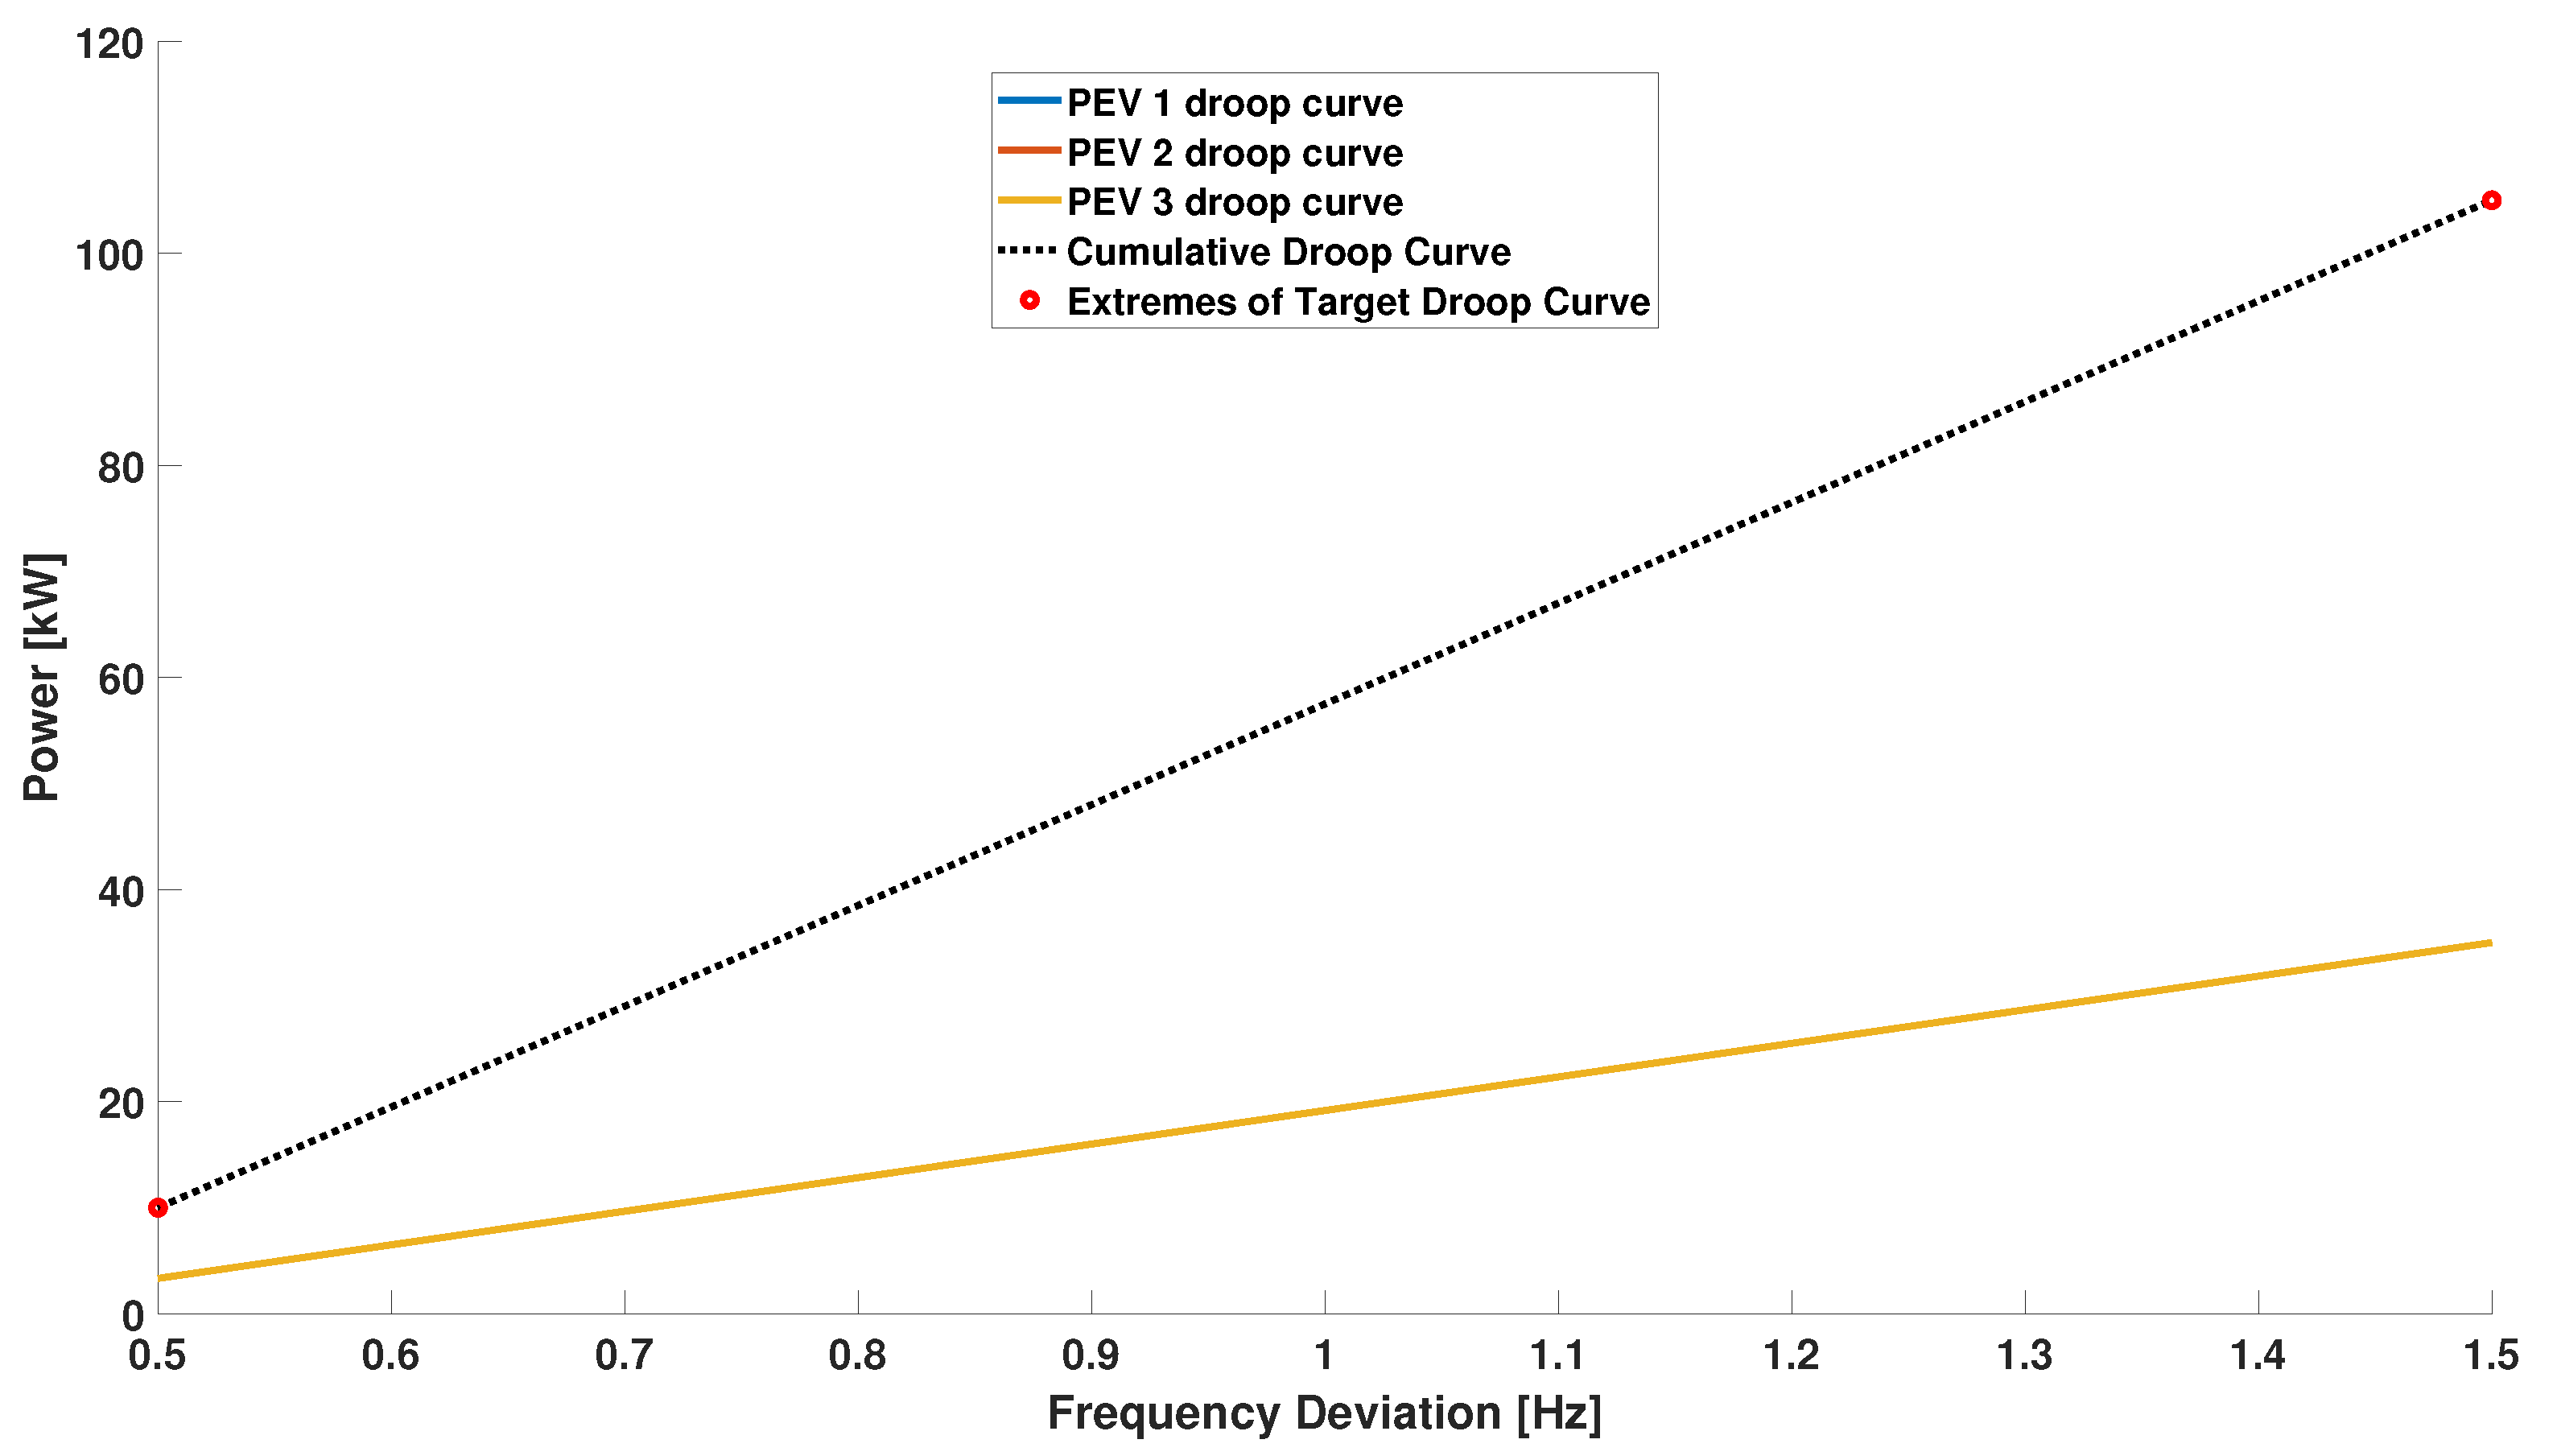
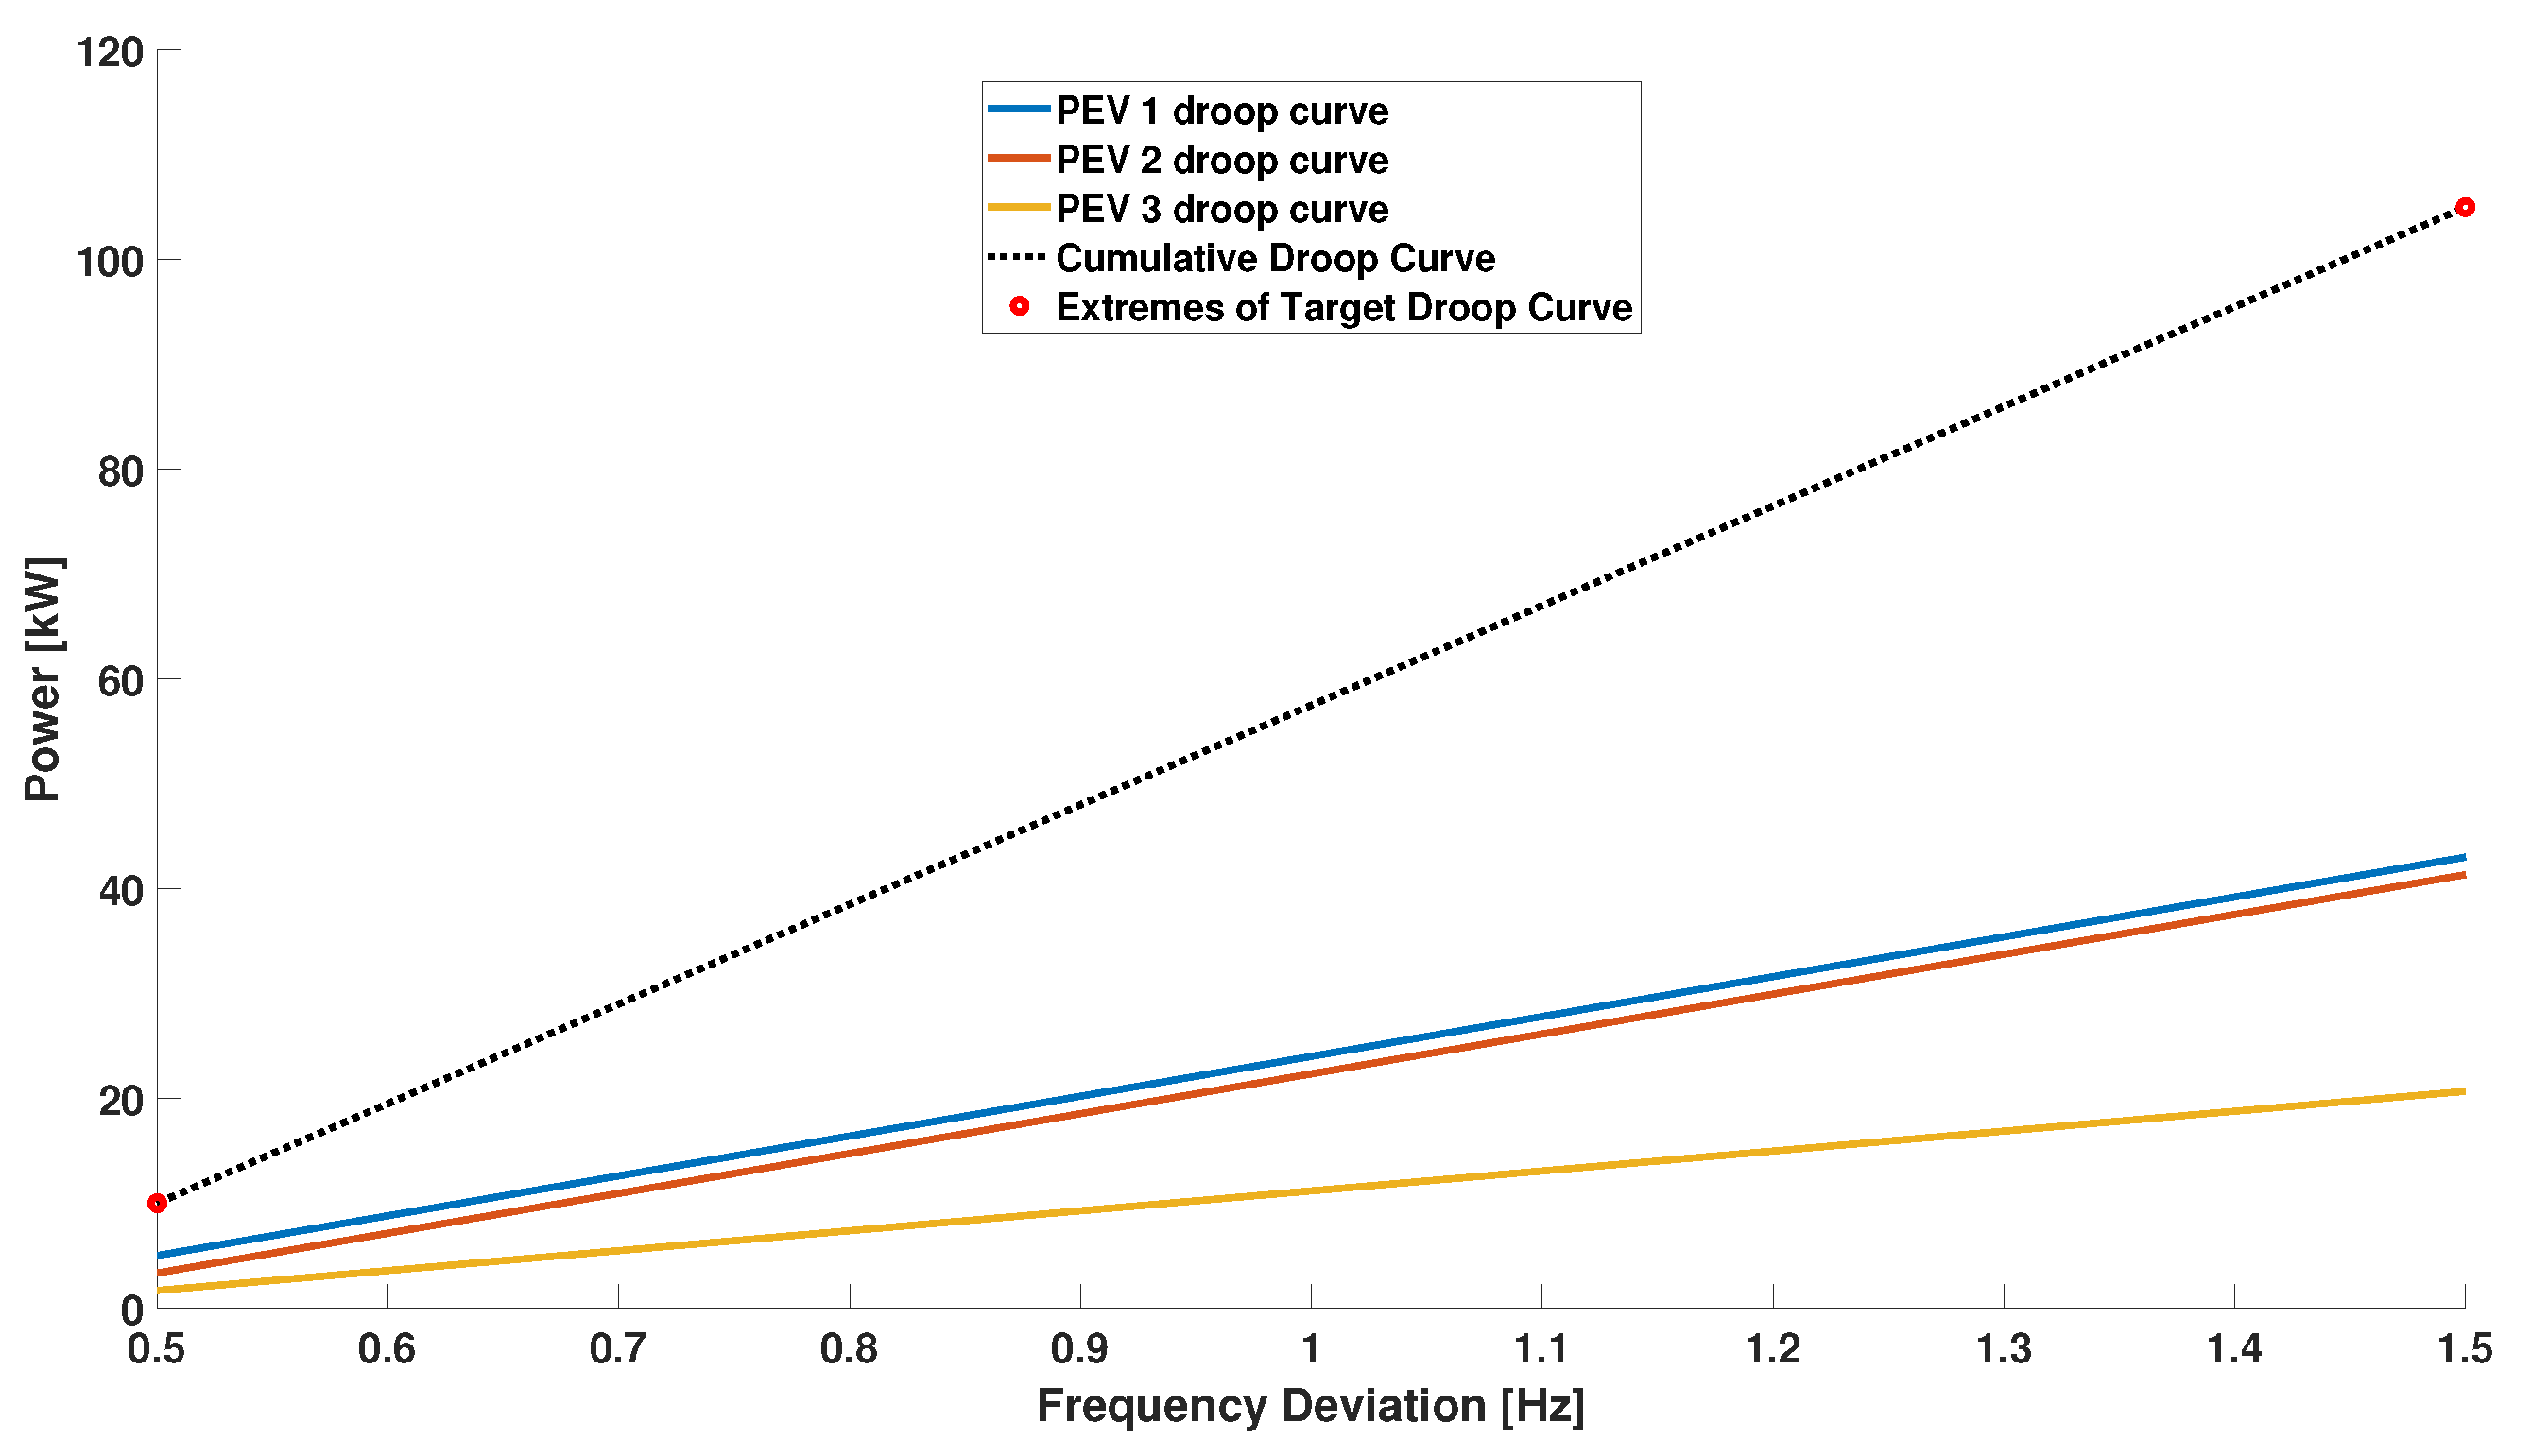
The first simulation in this scenario shows the case in which the charging sessions are characterized by the same power margin. Specifically, the charging sessions are characterized by a maximum charging power of 150 kW, and by a common charging setpoint of 100 kW, resulting in a power margin of 50 kW. The global droop curve, for over frequency events, is characterized by a maximum power deviation of 105 kW (70% of the available power margin of 150 kW), and by a frequency range
mHz. In correspondence with the minimum of the bandwidth, the given global droop curve is characterized by a power deviation of 10 kW.
Figure 4 shows the result of the algorithm.
The algorithm determines the optimal distribution as an equal allocation of droop curves between the charging session. The target droop curve is identified in the plot with the red-dashed line, instead the resultant droop curve is represented by the black-dotted line.
Figure 4 shows that the sum of the local curves matches exactly the target global one. The presence of the last term in the cost function determines an exact balancing of the frequency regulation service among the charging sessions, i.e., leading to identical local droop curves.
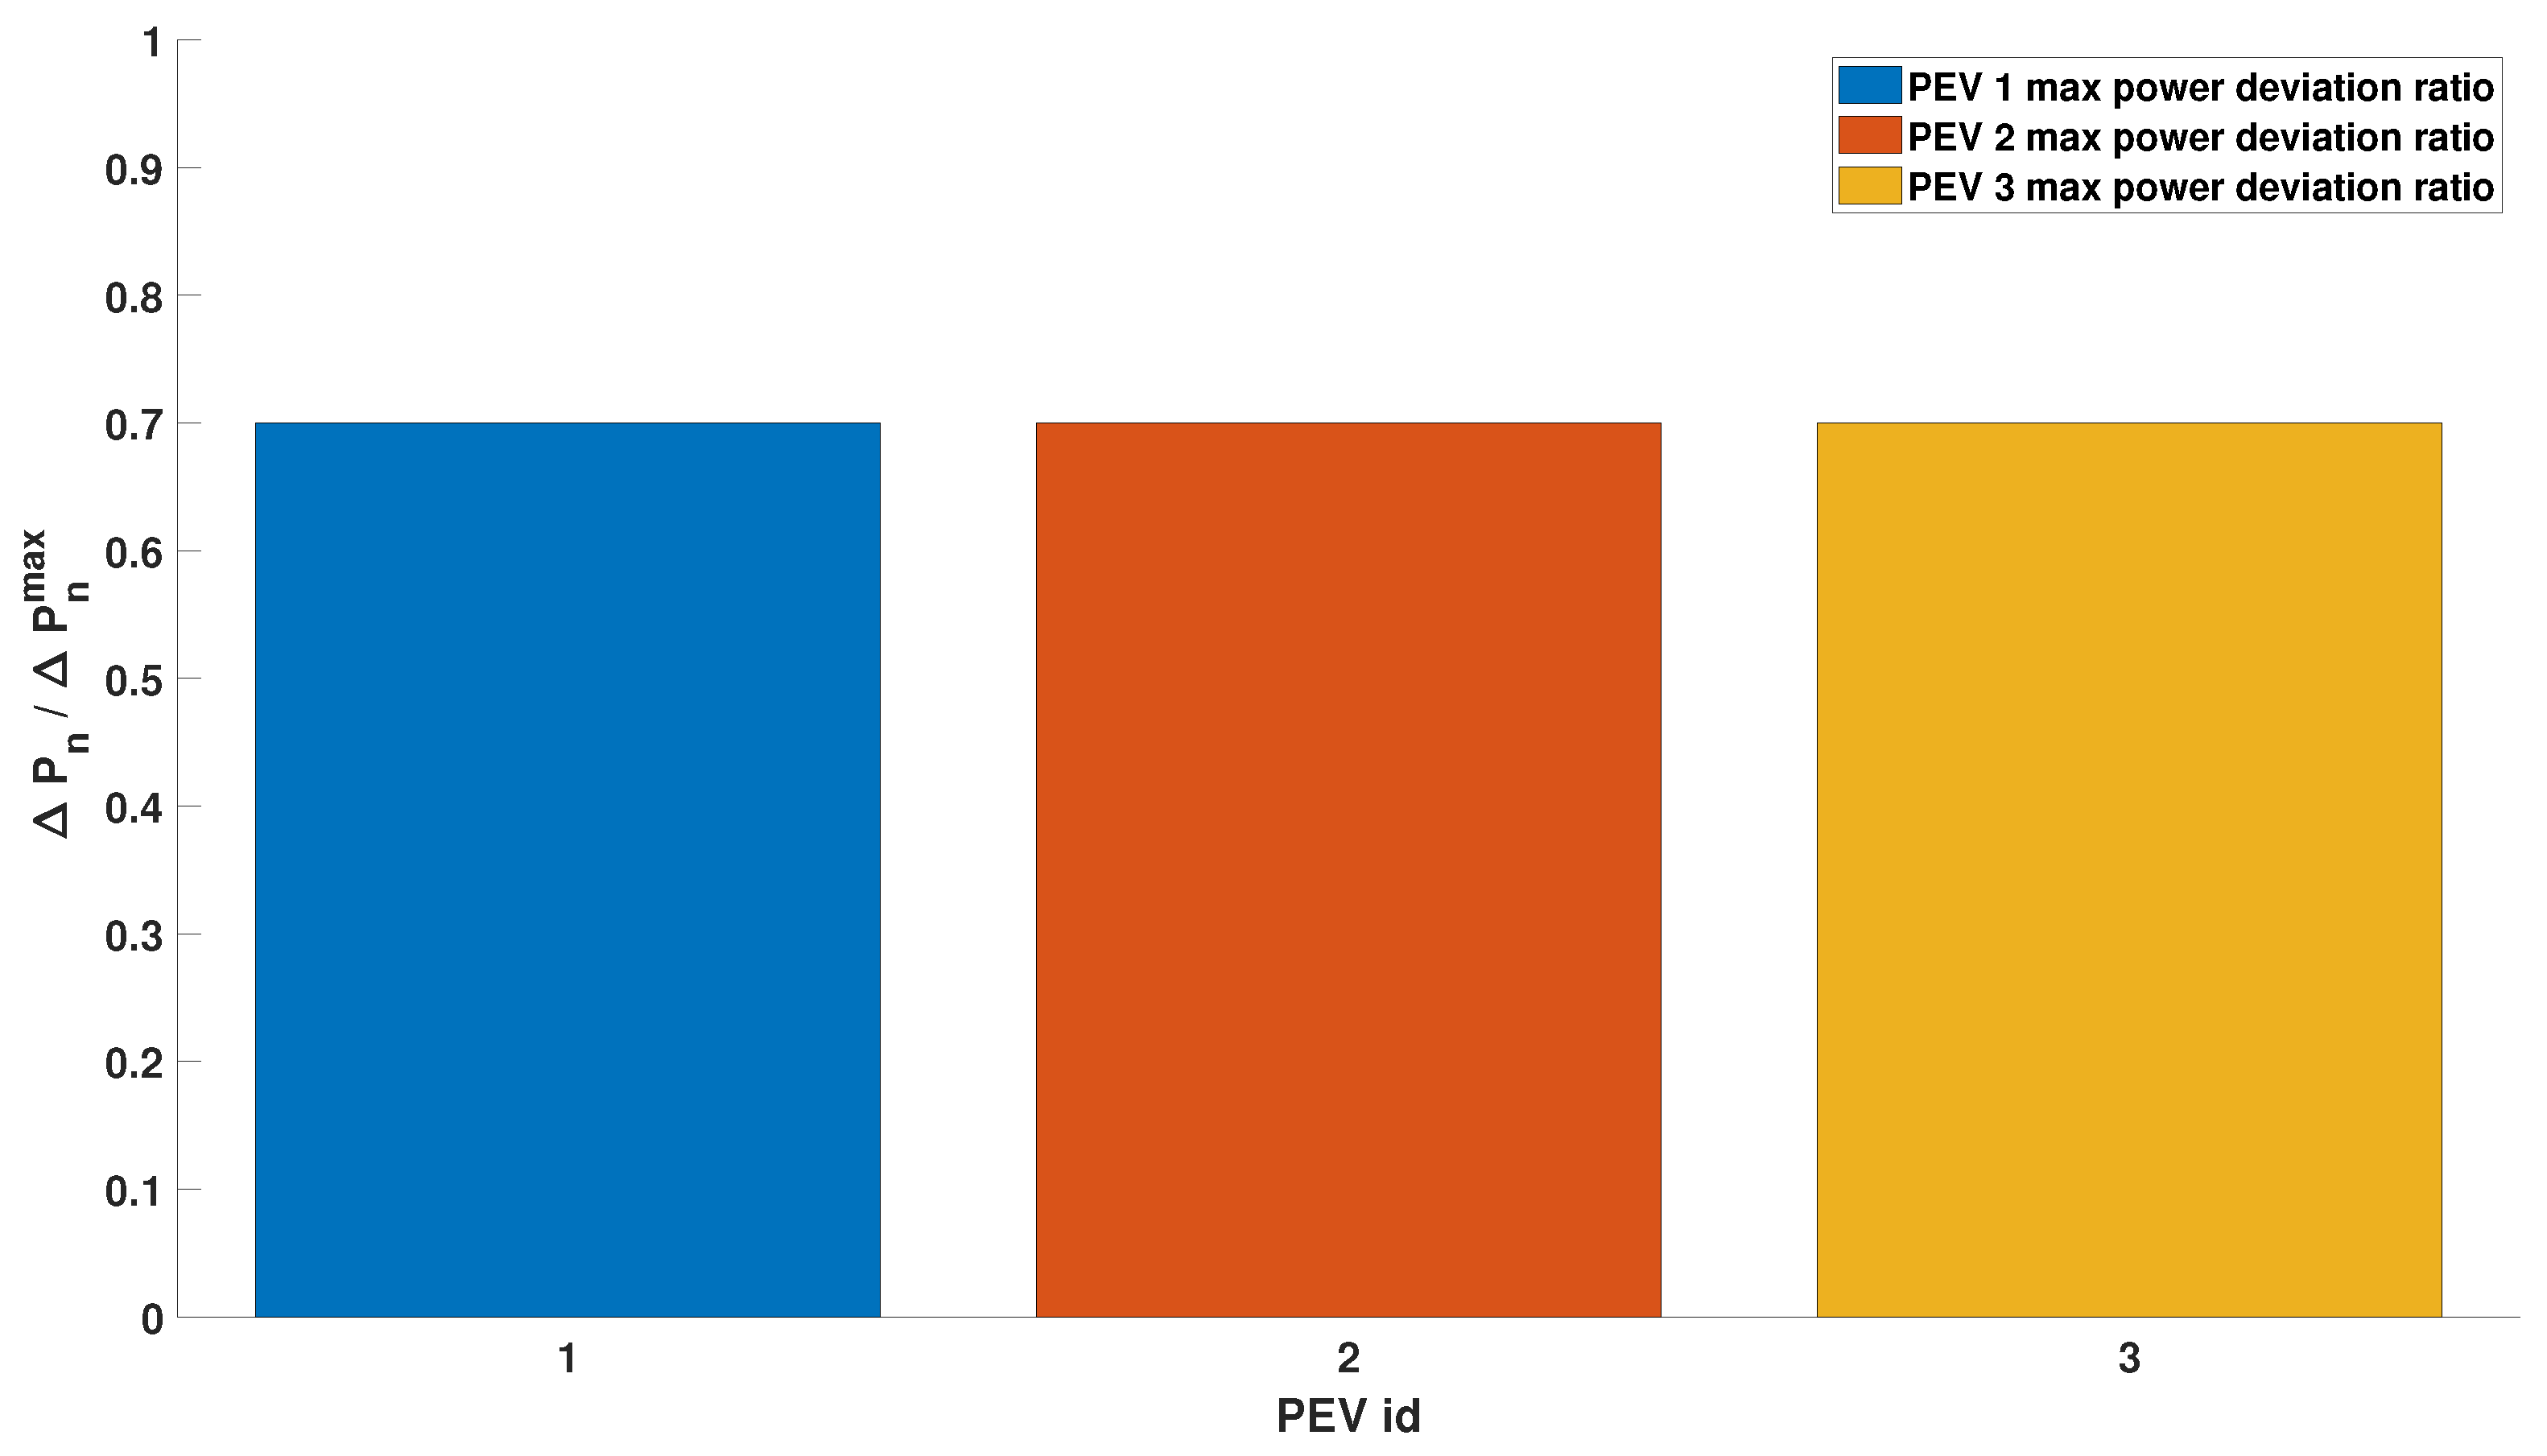
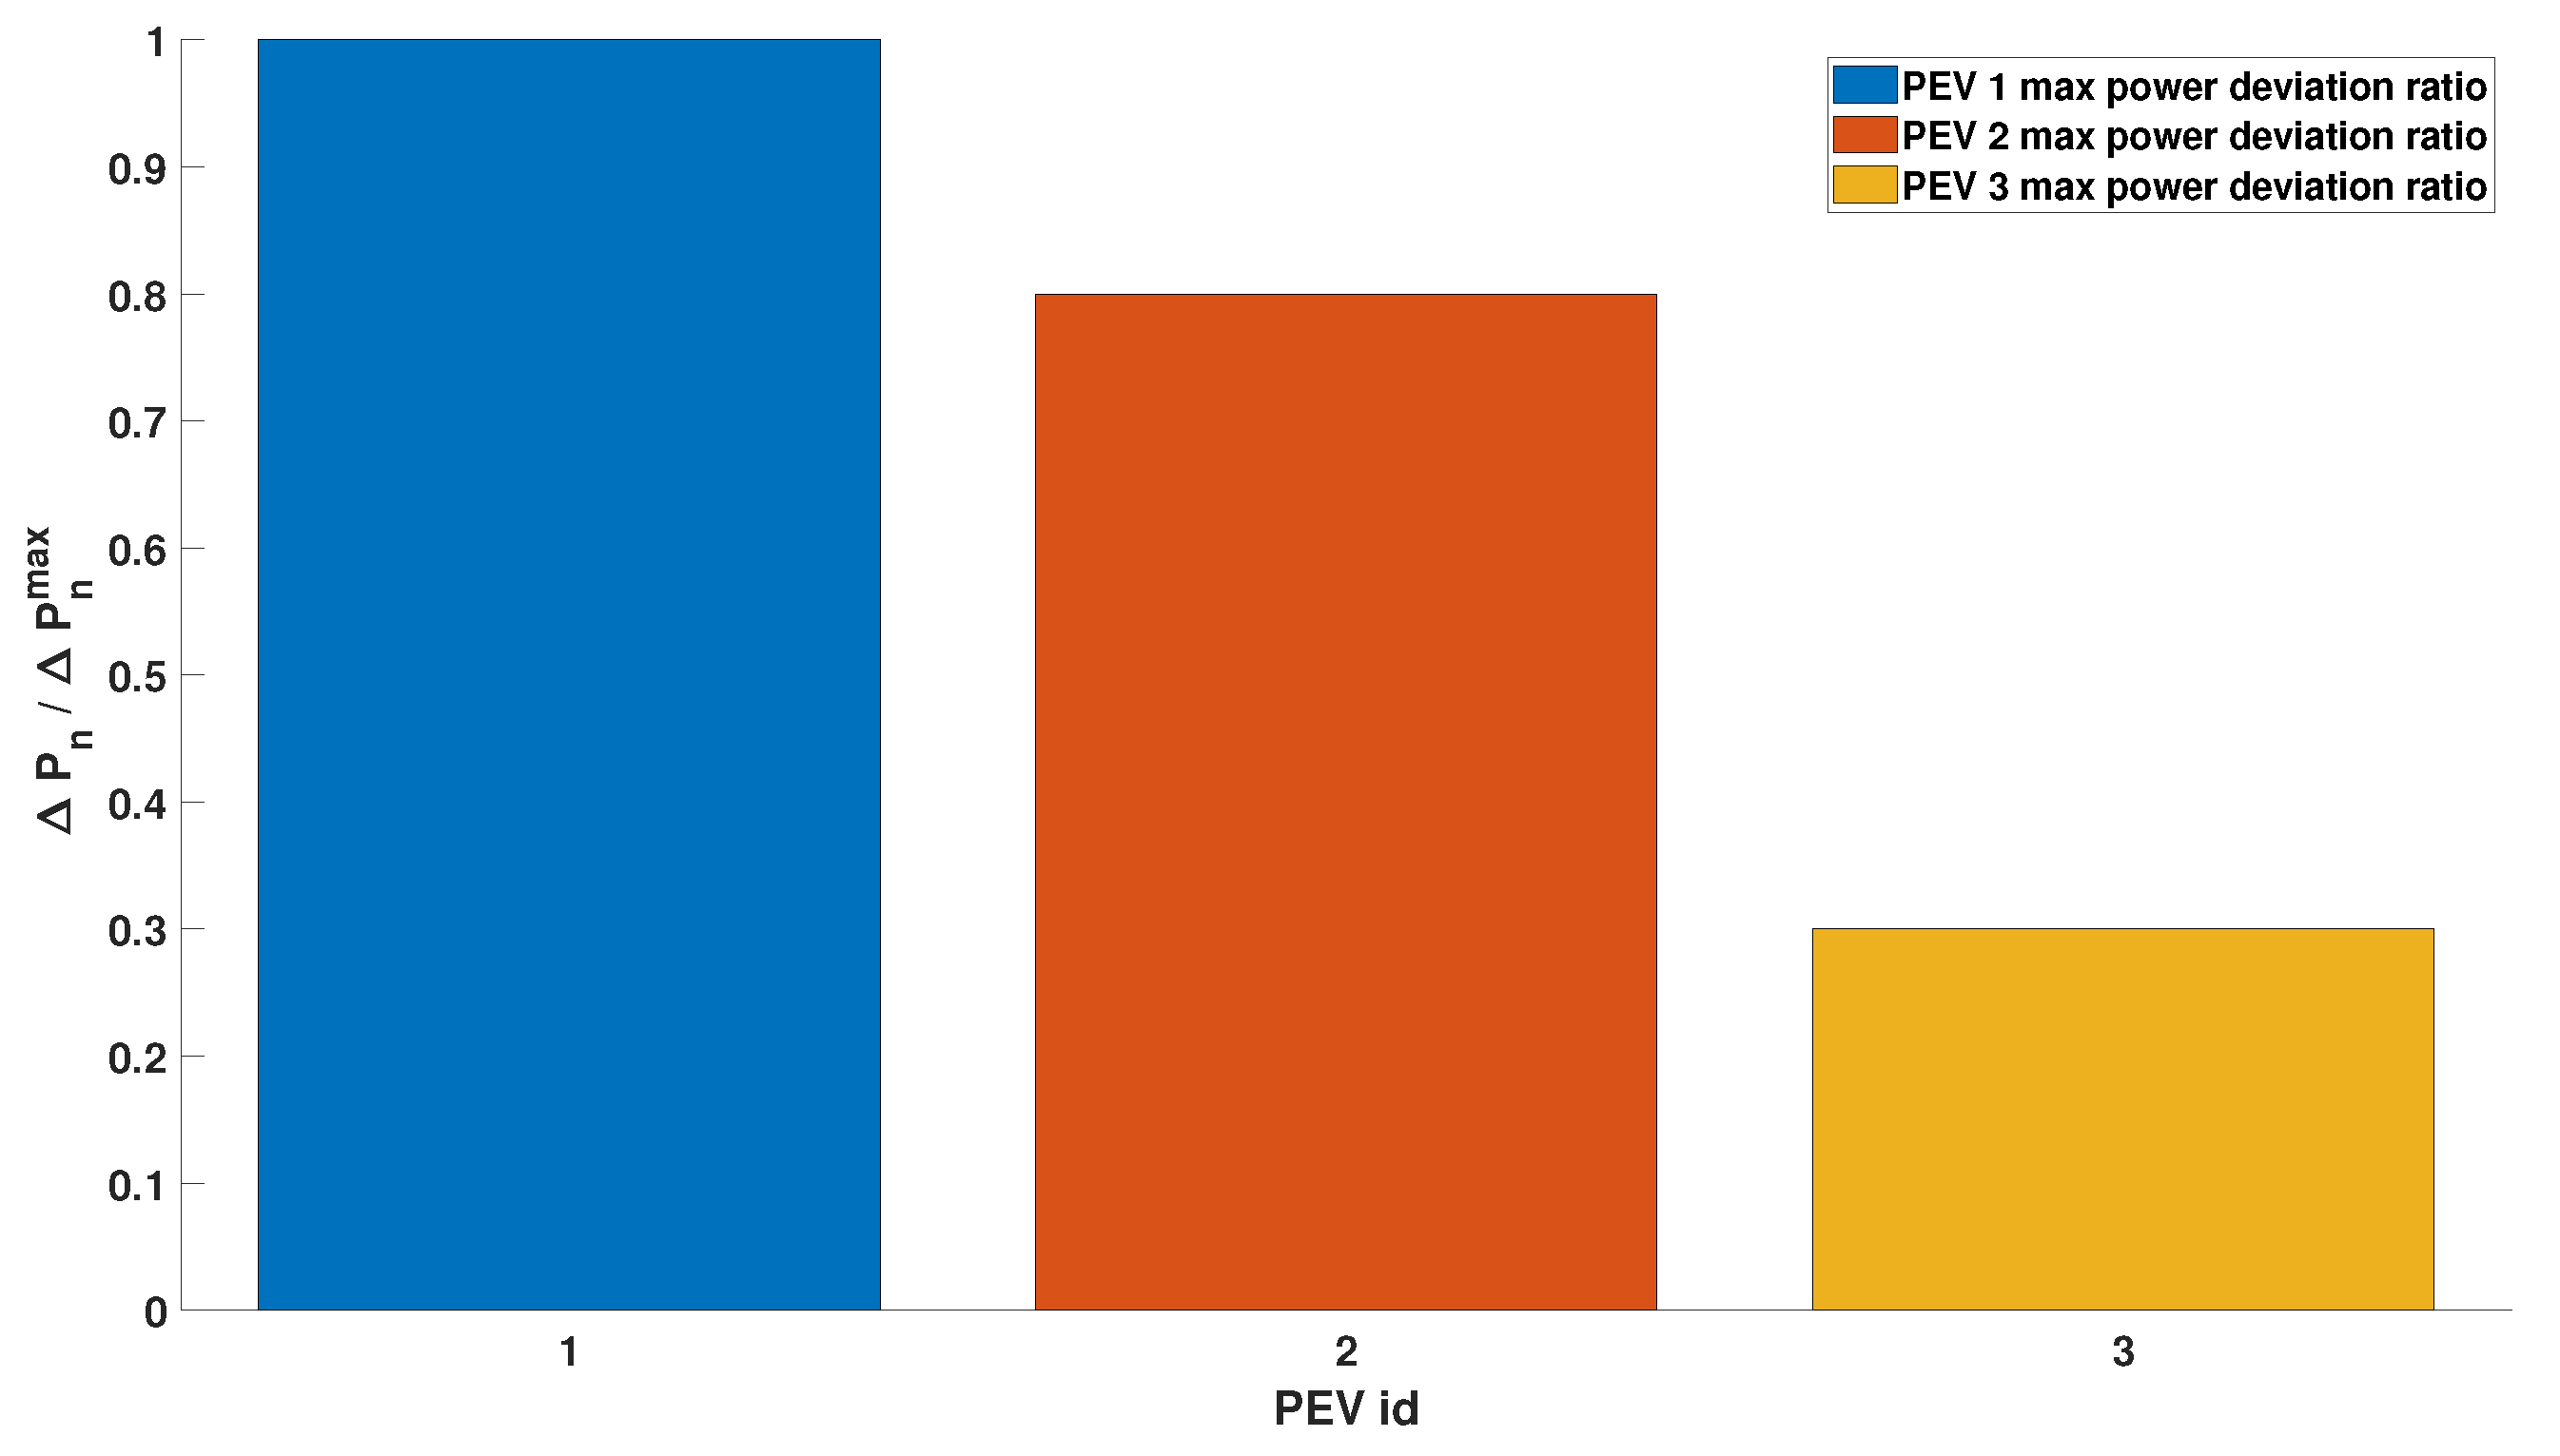
Figure 5 shows the percentage of maximum usage of the power margin of each vehicle, i.e., the ratio between the value of the local droop curve corresponding to the frequency deviation
and the available margin of power. This plot confirms what already discussed: the algorithm distributes the effort in order to assign the same maximum relative usage to each vehicle’s power margin, in this case
.
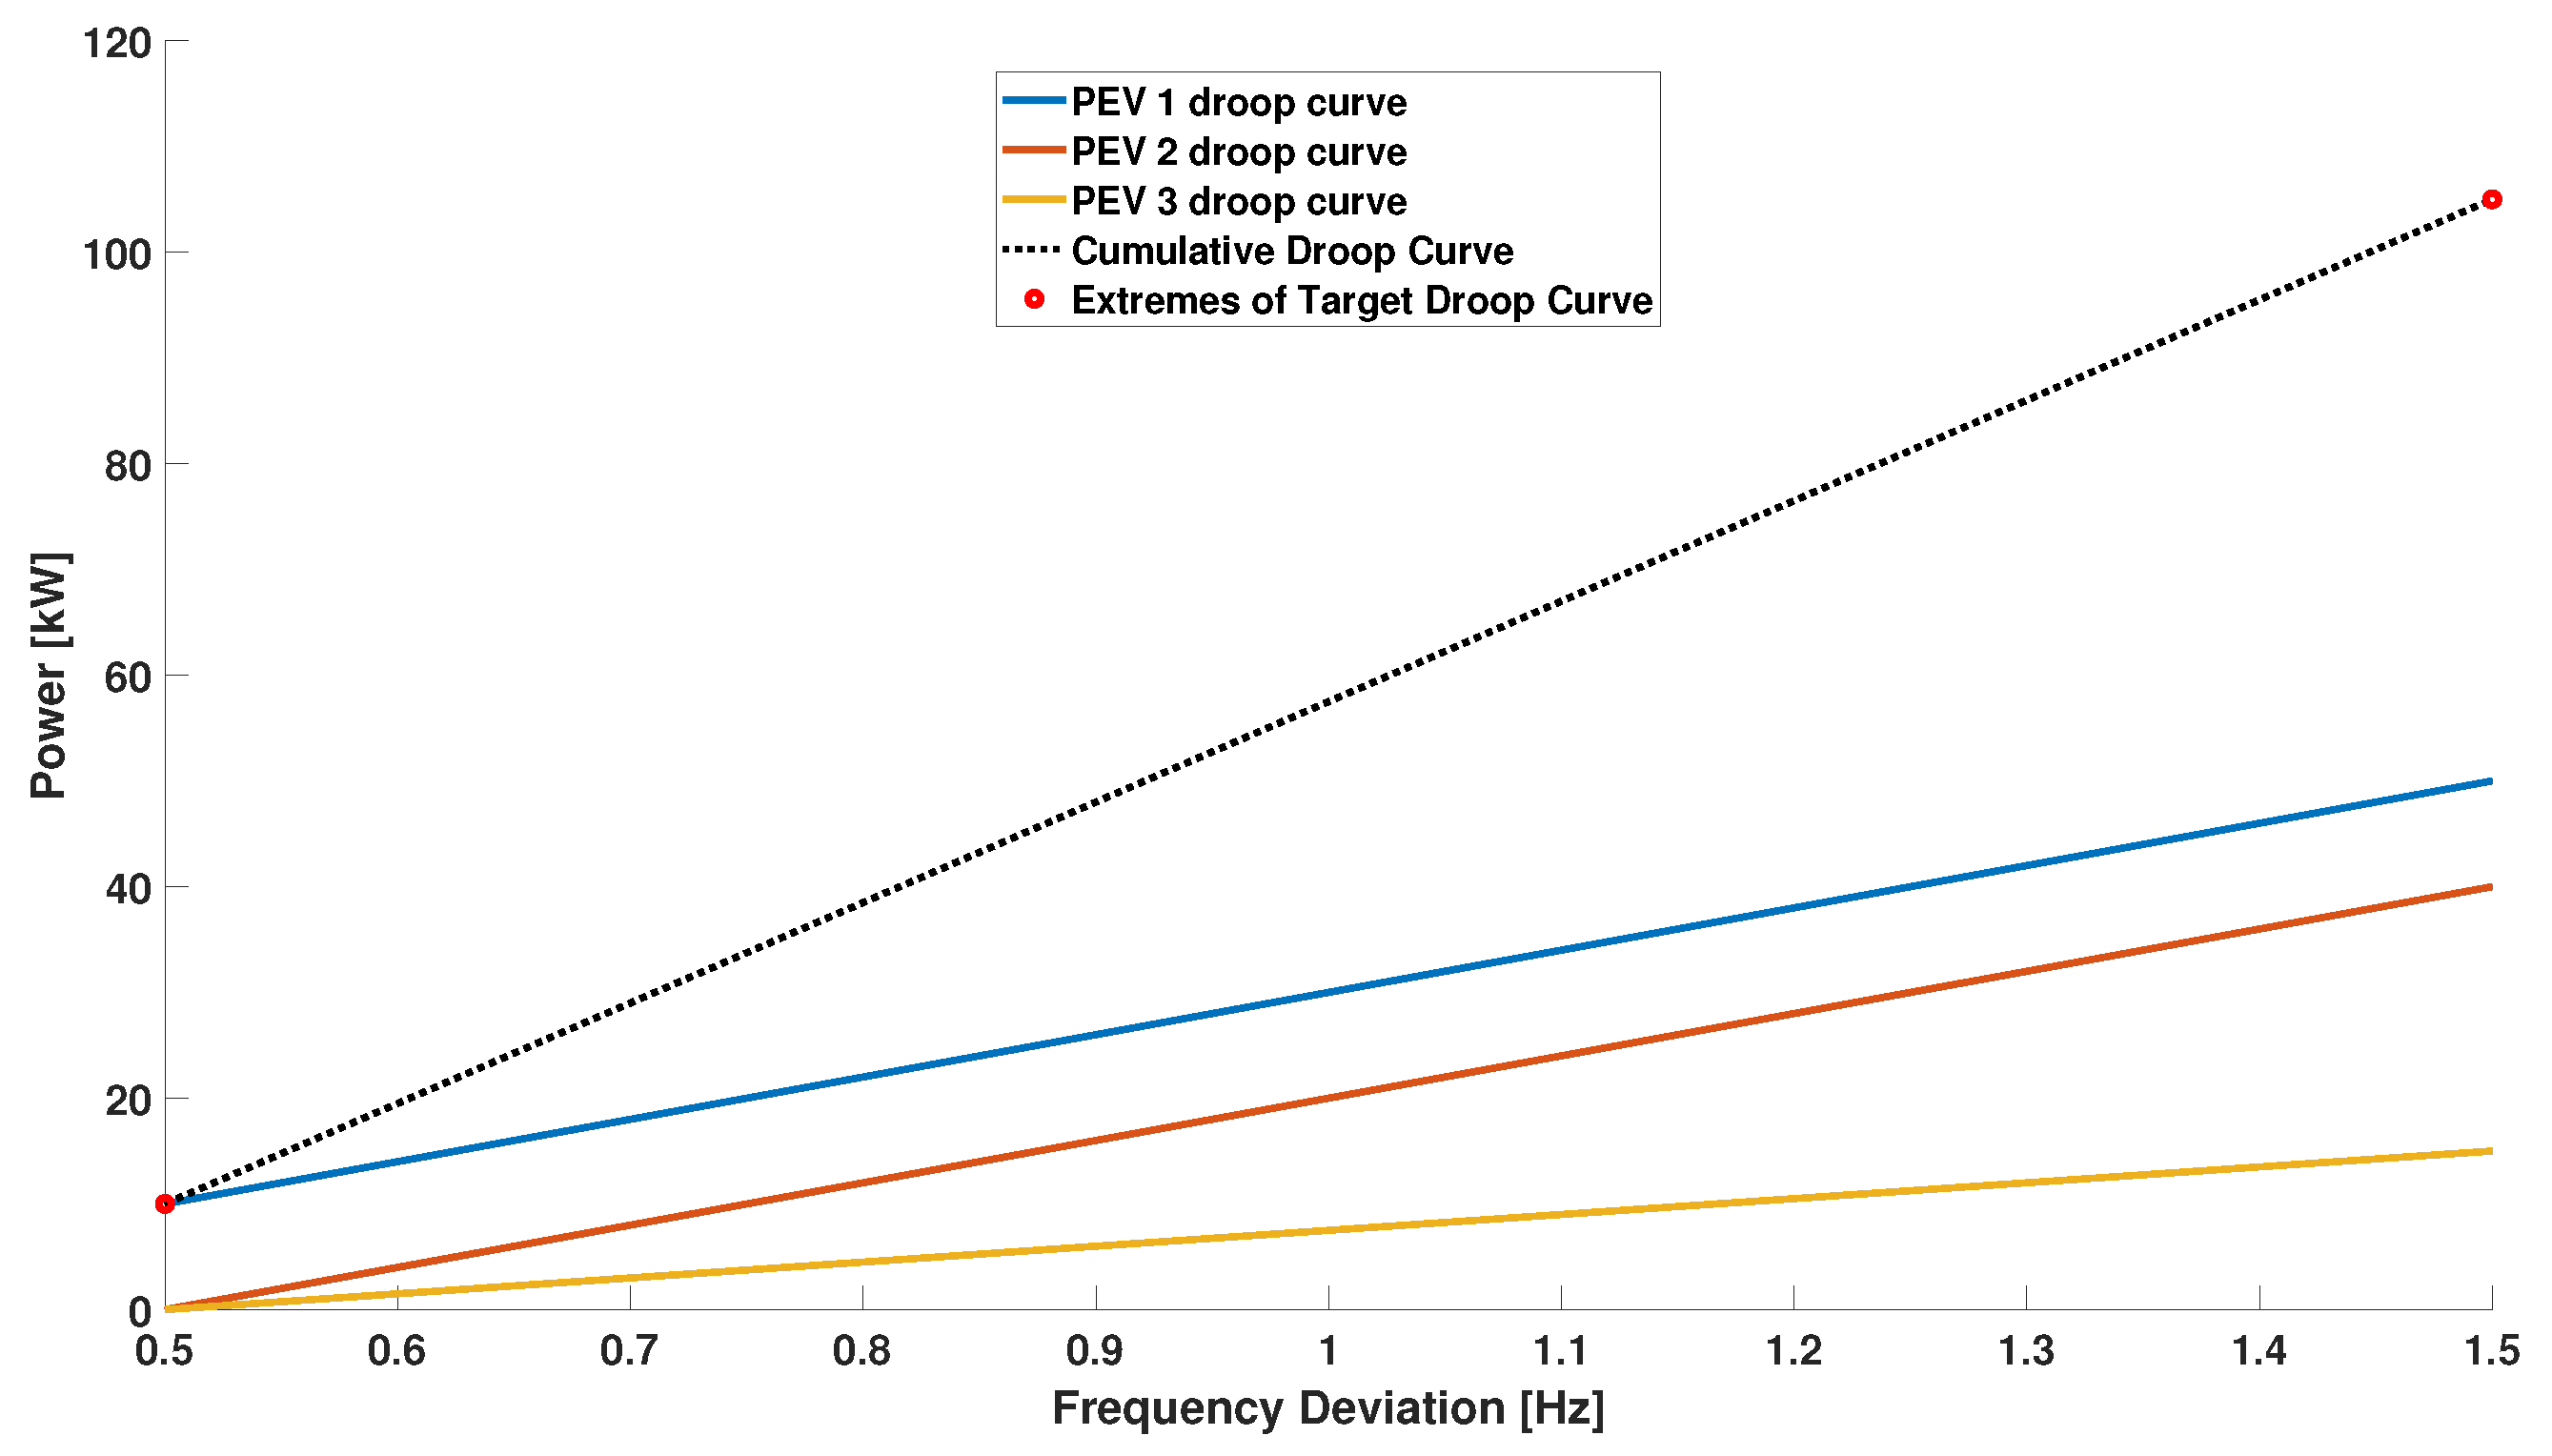
Typically, in smart charging, different charging power set-points are assigned to each charging session. As explained, this leads to different power margins, i.e., different levels of maximum contribution that could be provided by each PEV. This unbalance is considered by the proposed algorithm during the composition of the local droop curves. This is shown in the next simulation, which assumes three charging sessions characterized by different power margins, as summarized in
Table 1.
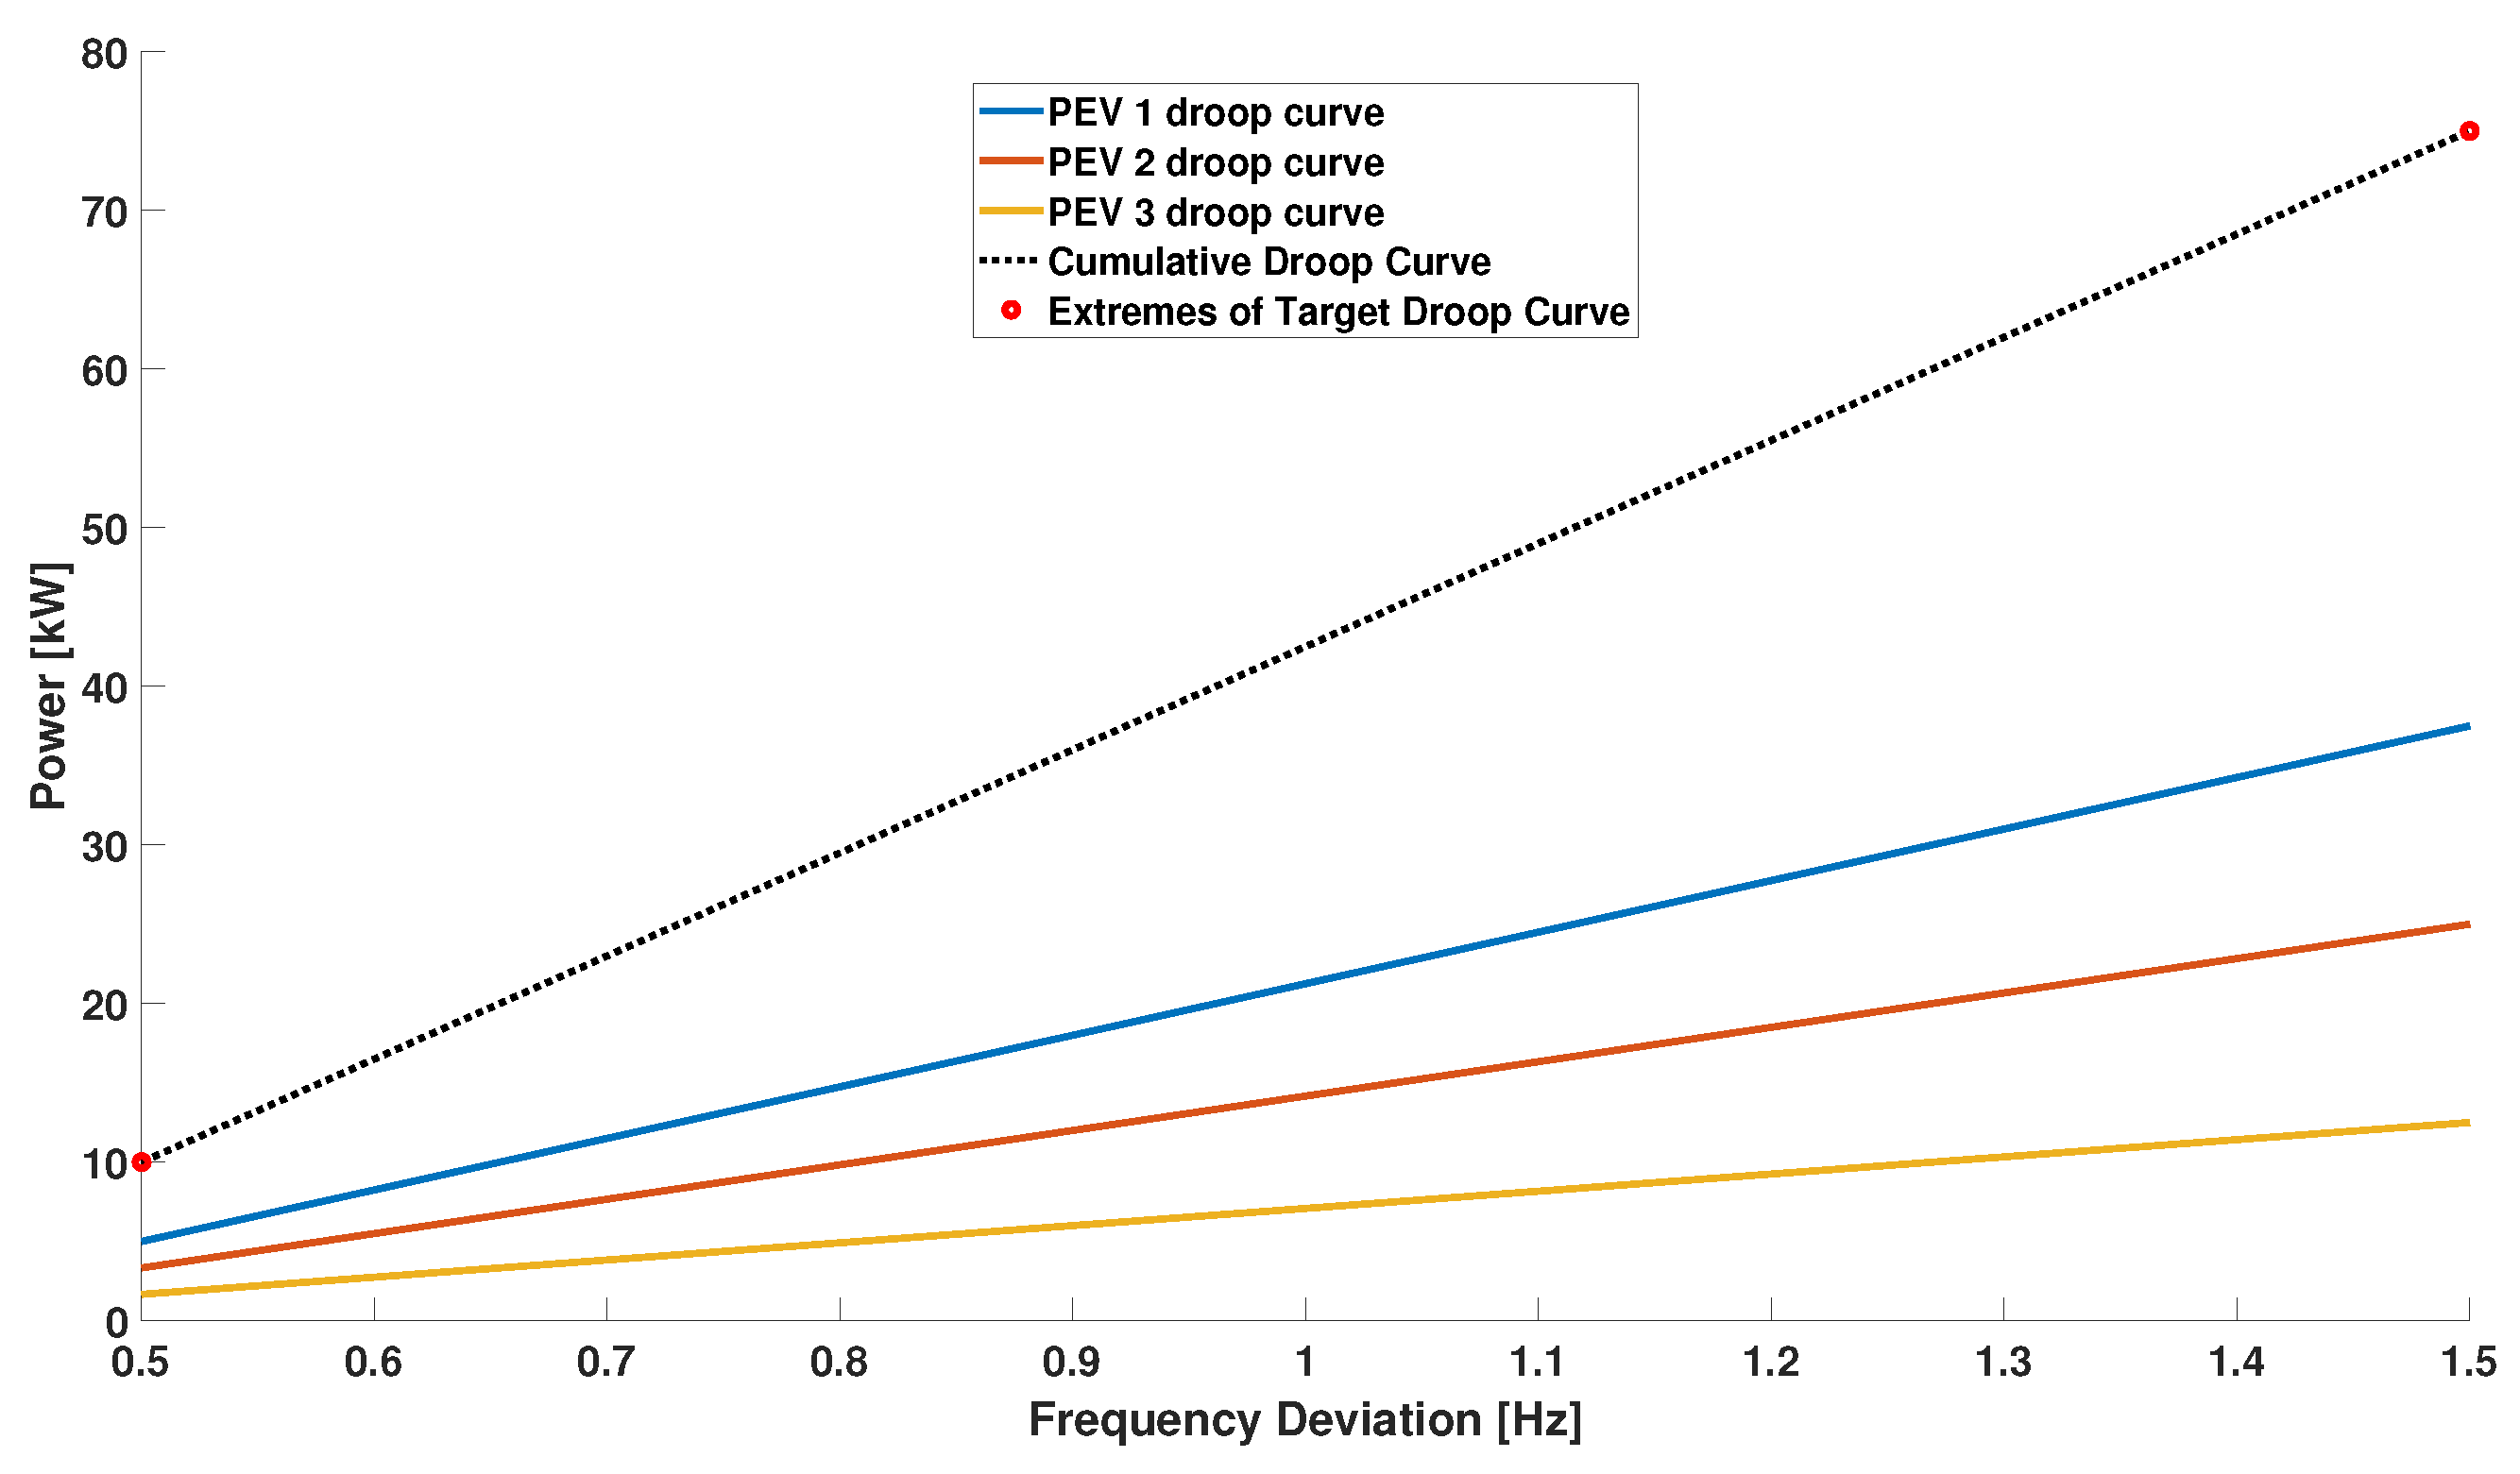
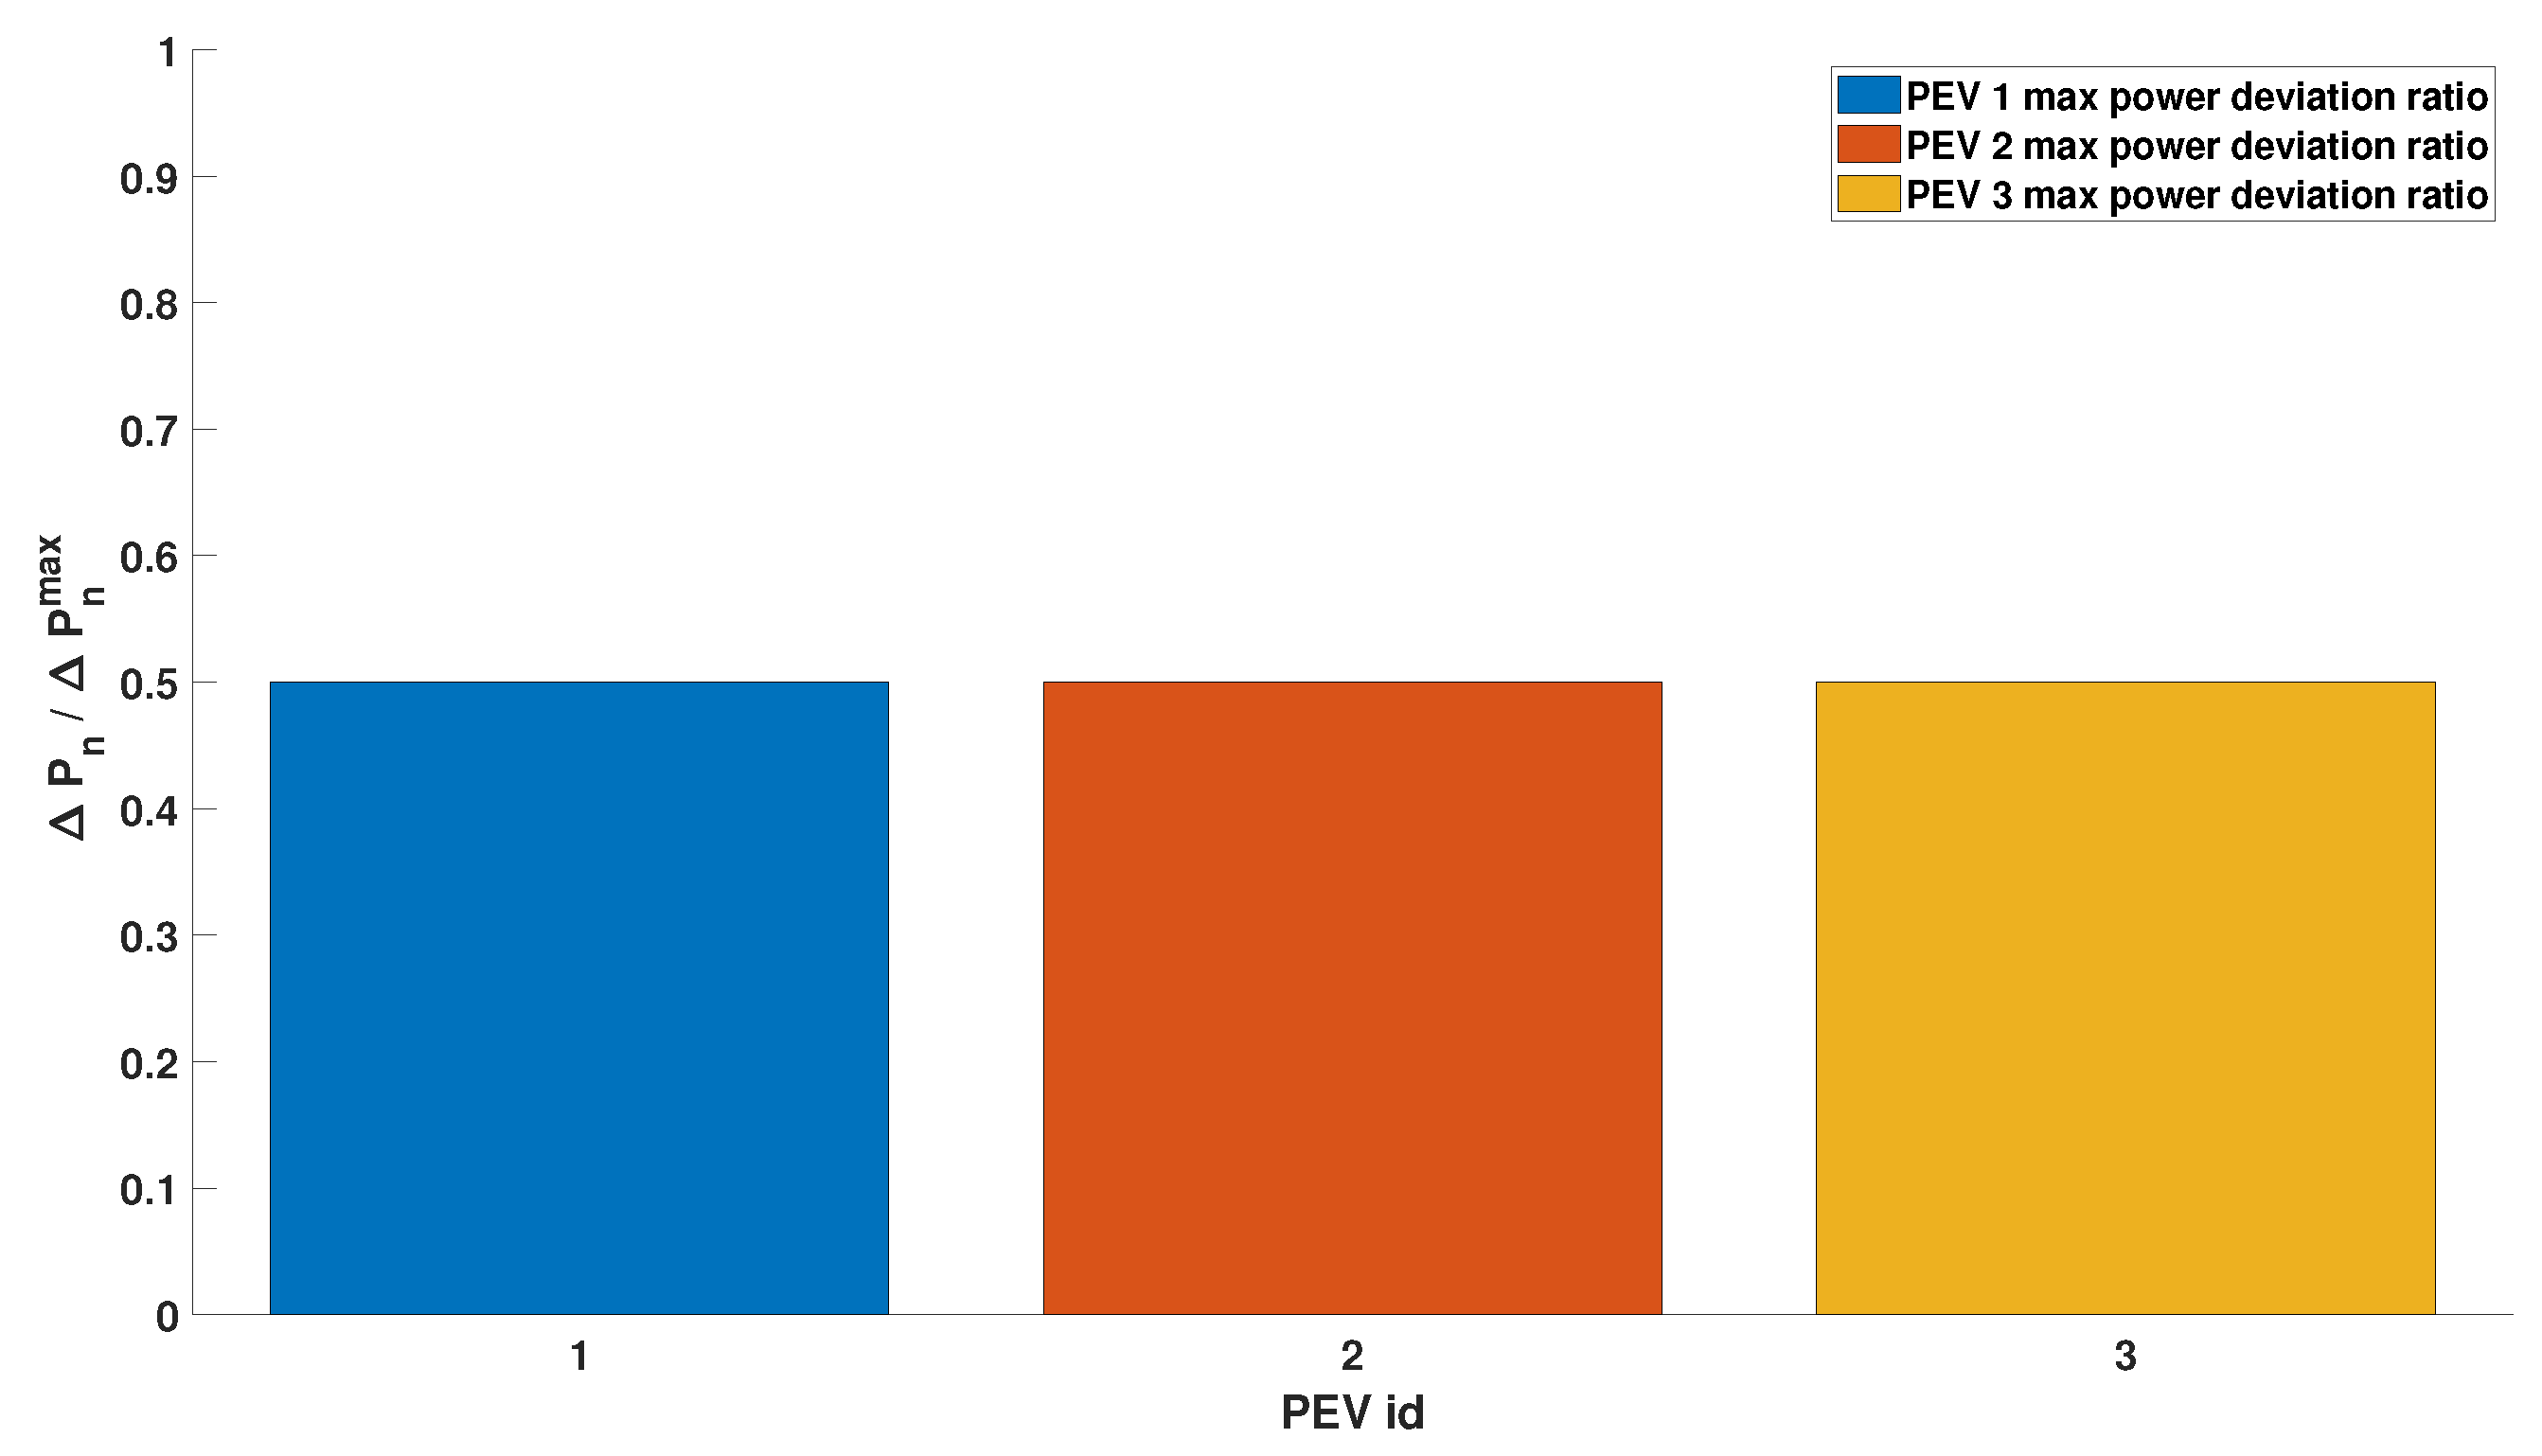
The global droop curve that has to be composed is characterized by a a maximum droop value of 75 kW, i.e., of the overall available margins. Note that all the charging sessions are performed at the of maximum power, so they are characterized by different absolute power margins, , but by the same percentage margin.
Figure 6 displays the droop curves assigned to each vehicle.
The algorithm allocates the curves in order to distribute the relative effort equally between the sessions.
Figure 7 highlights the equal distribution.
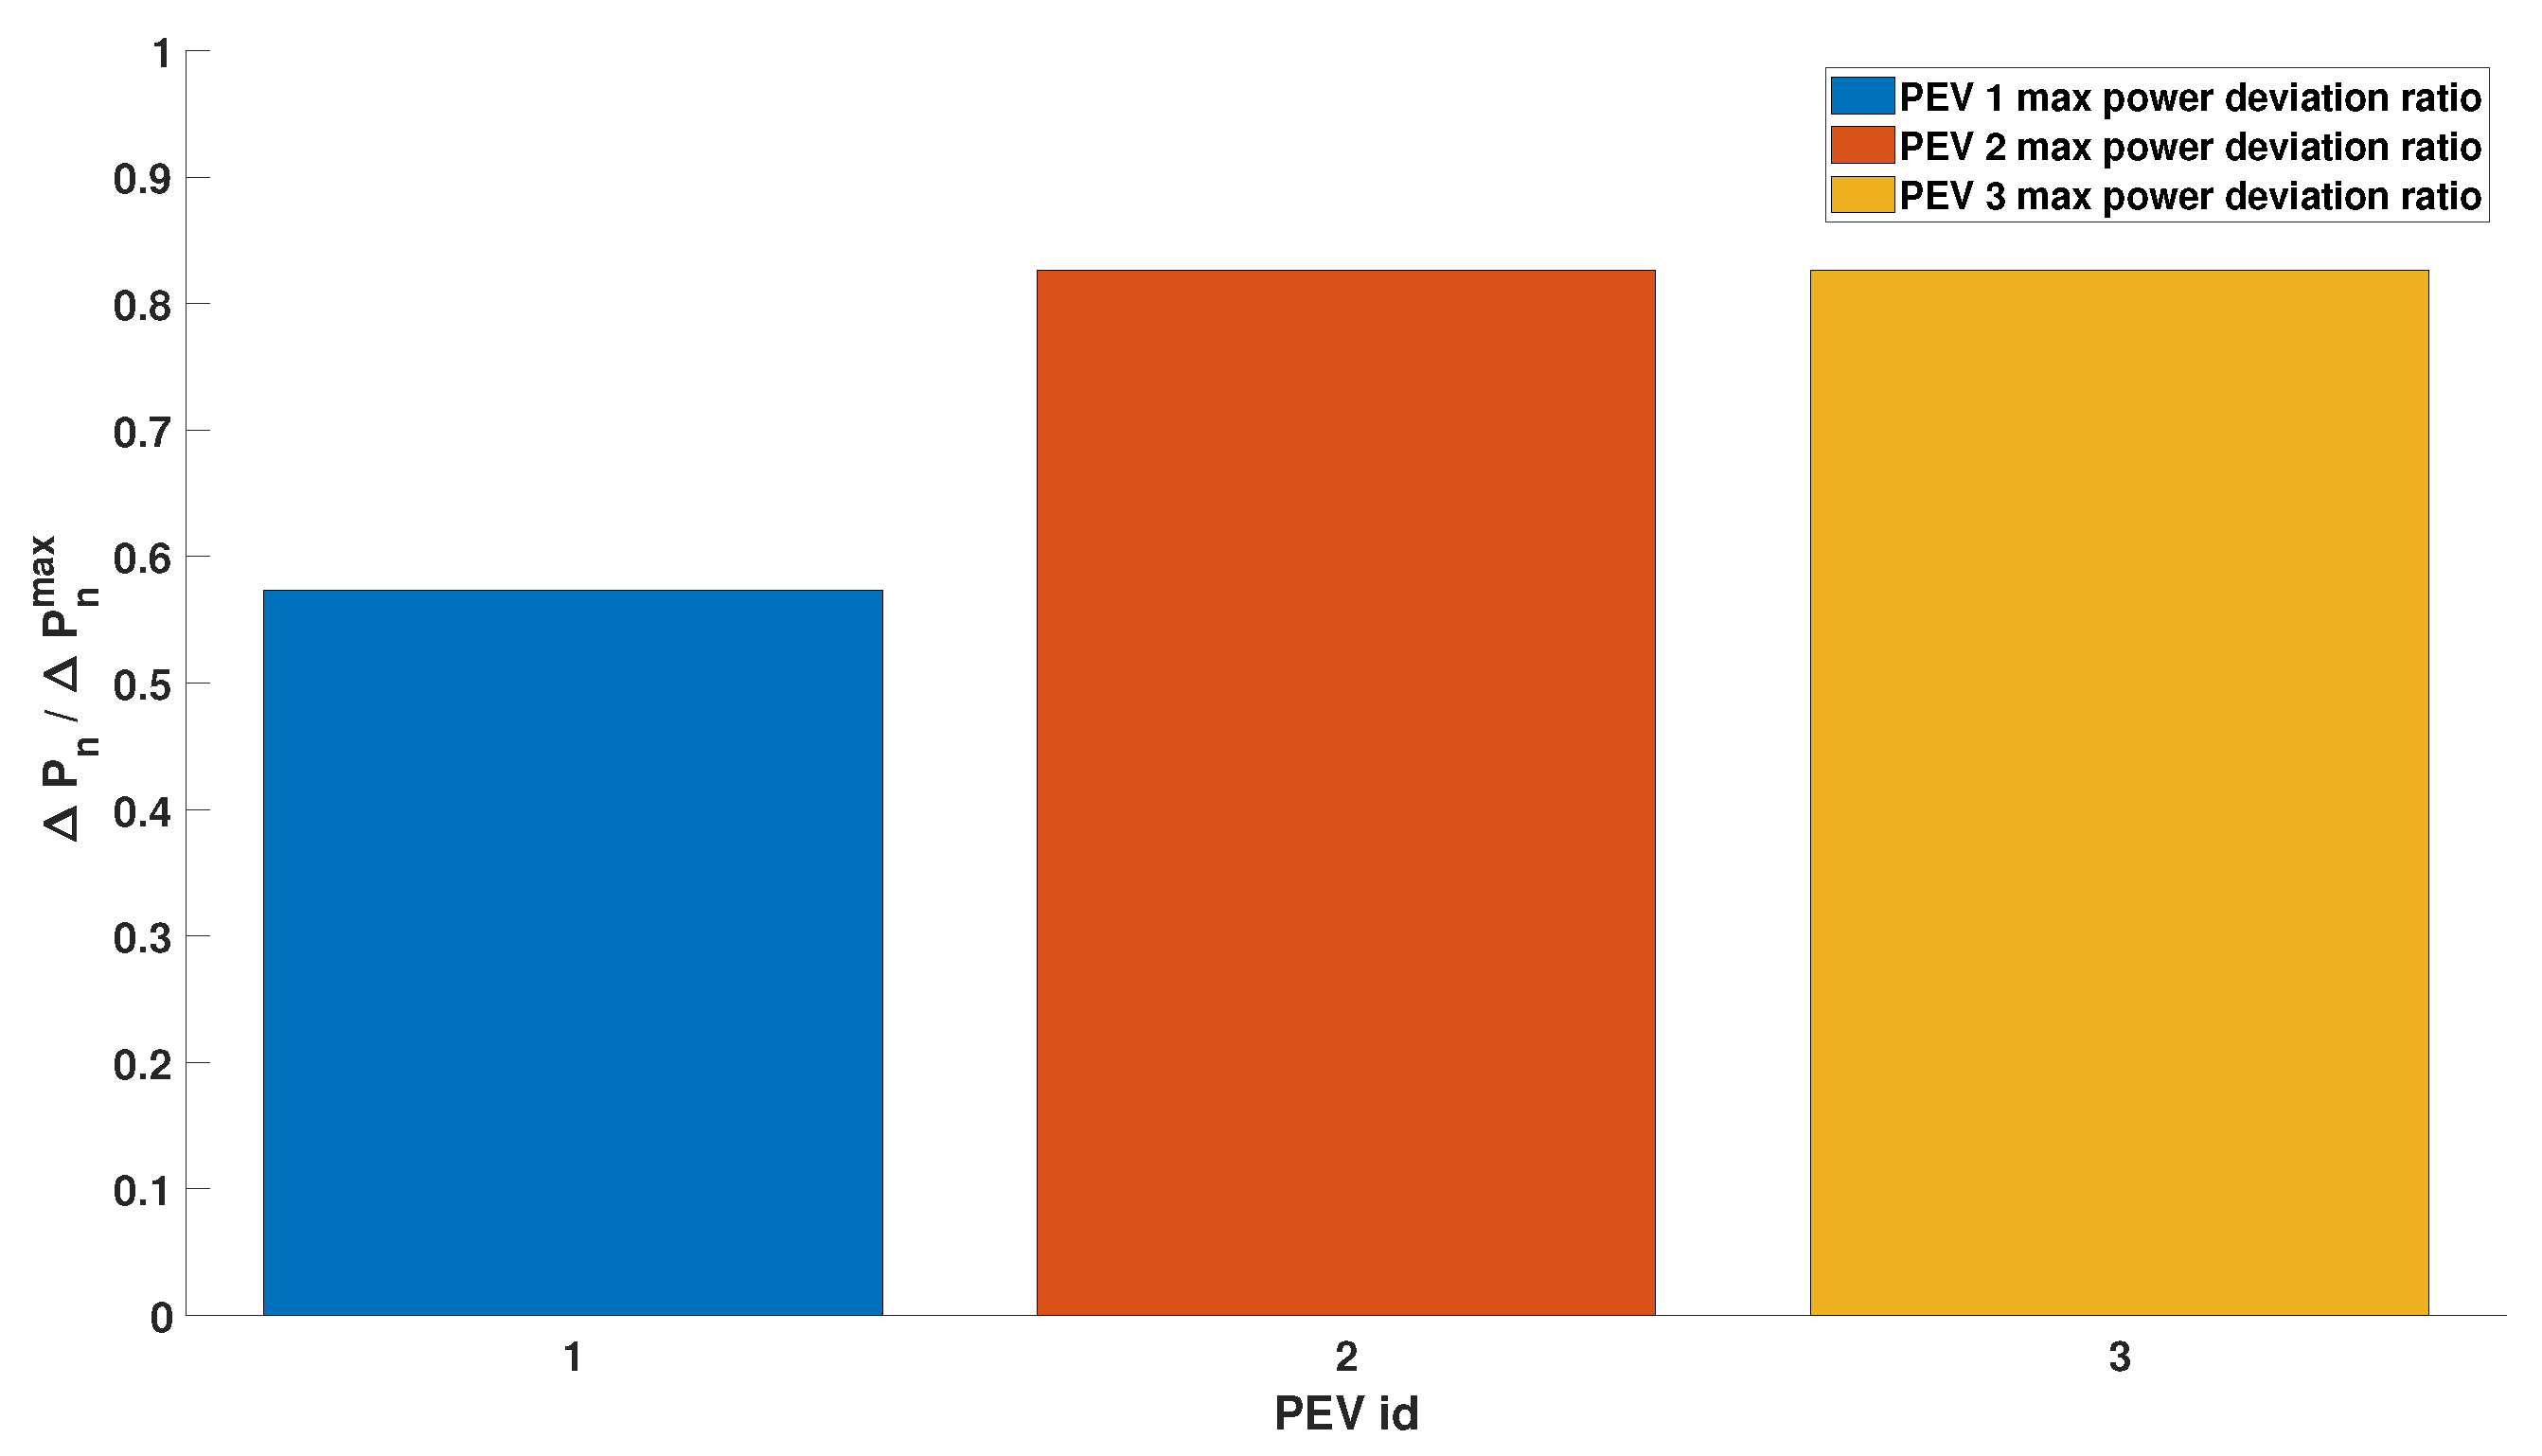
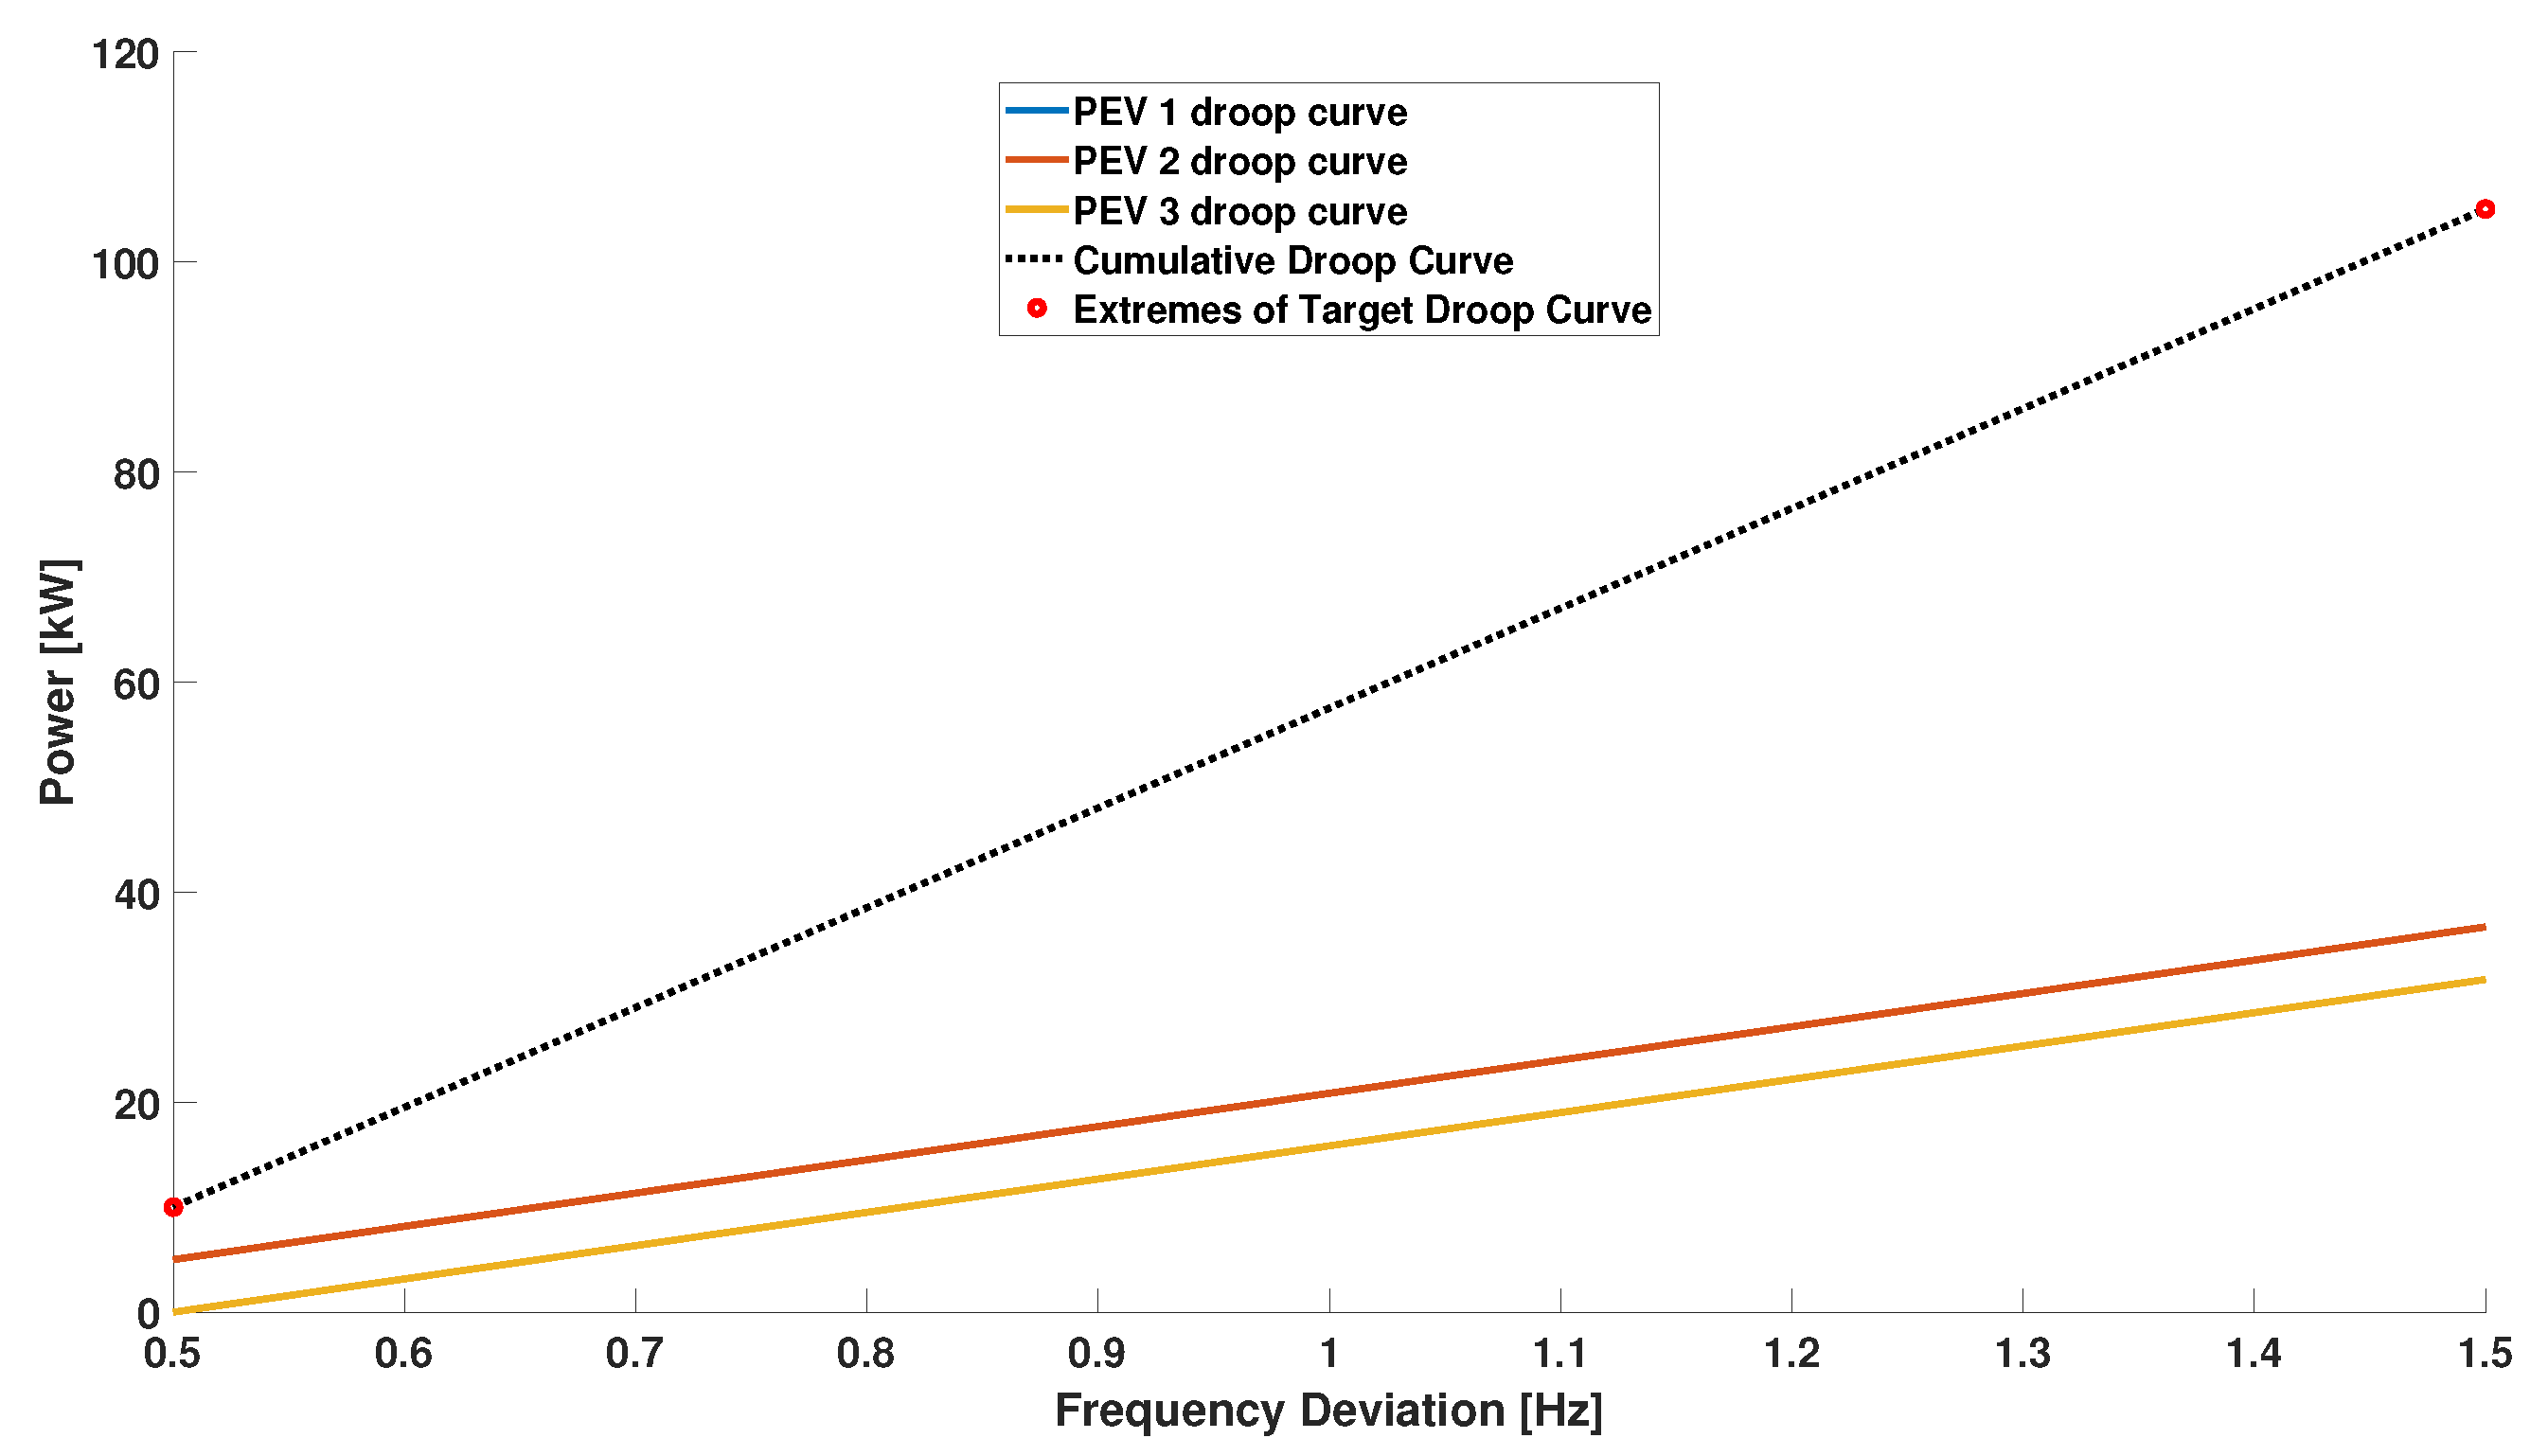
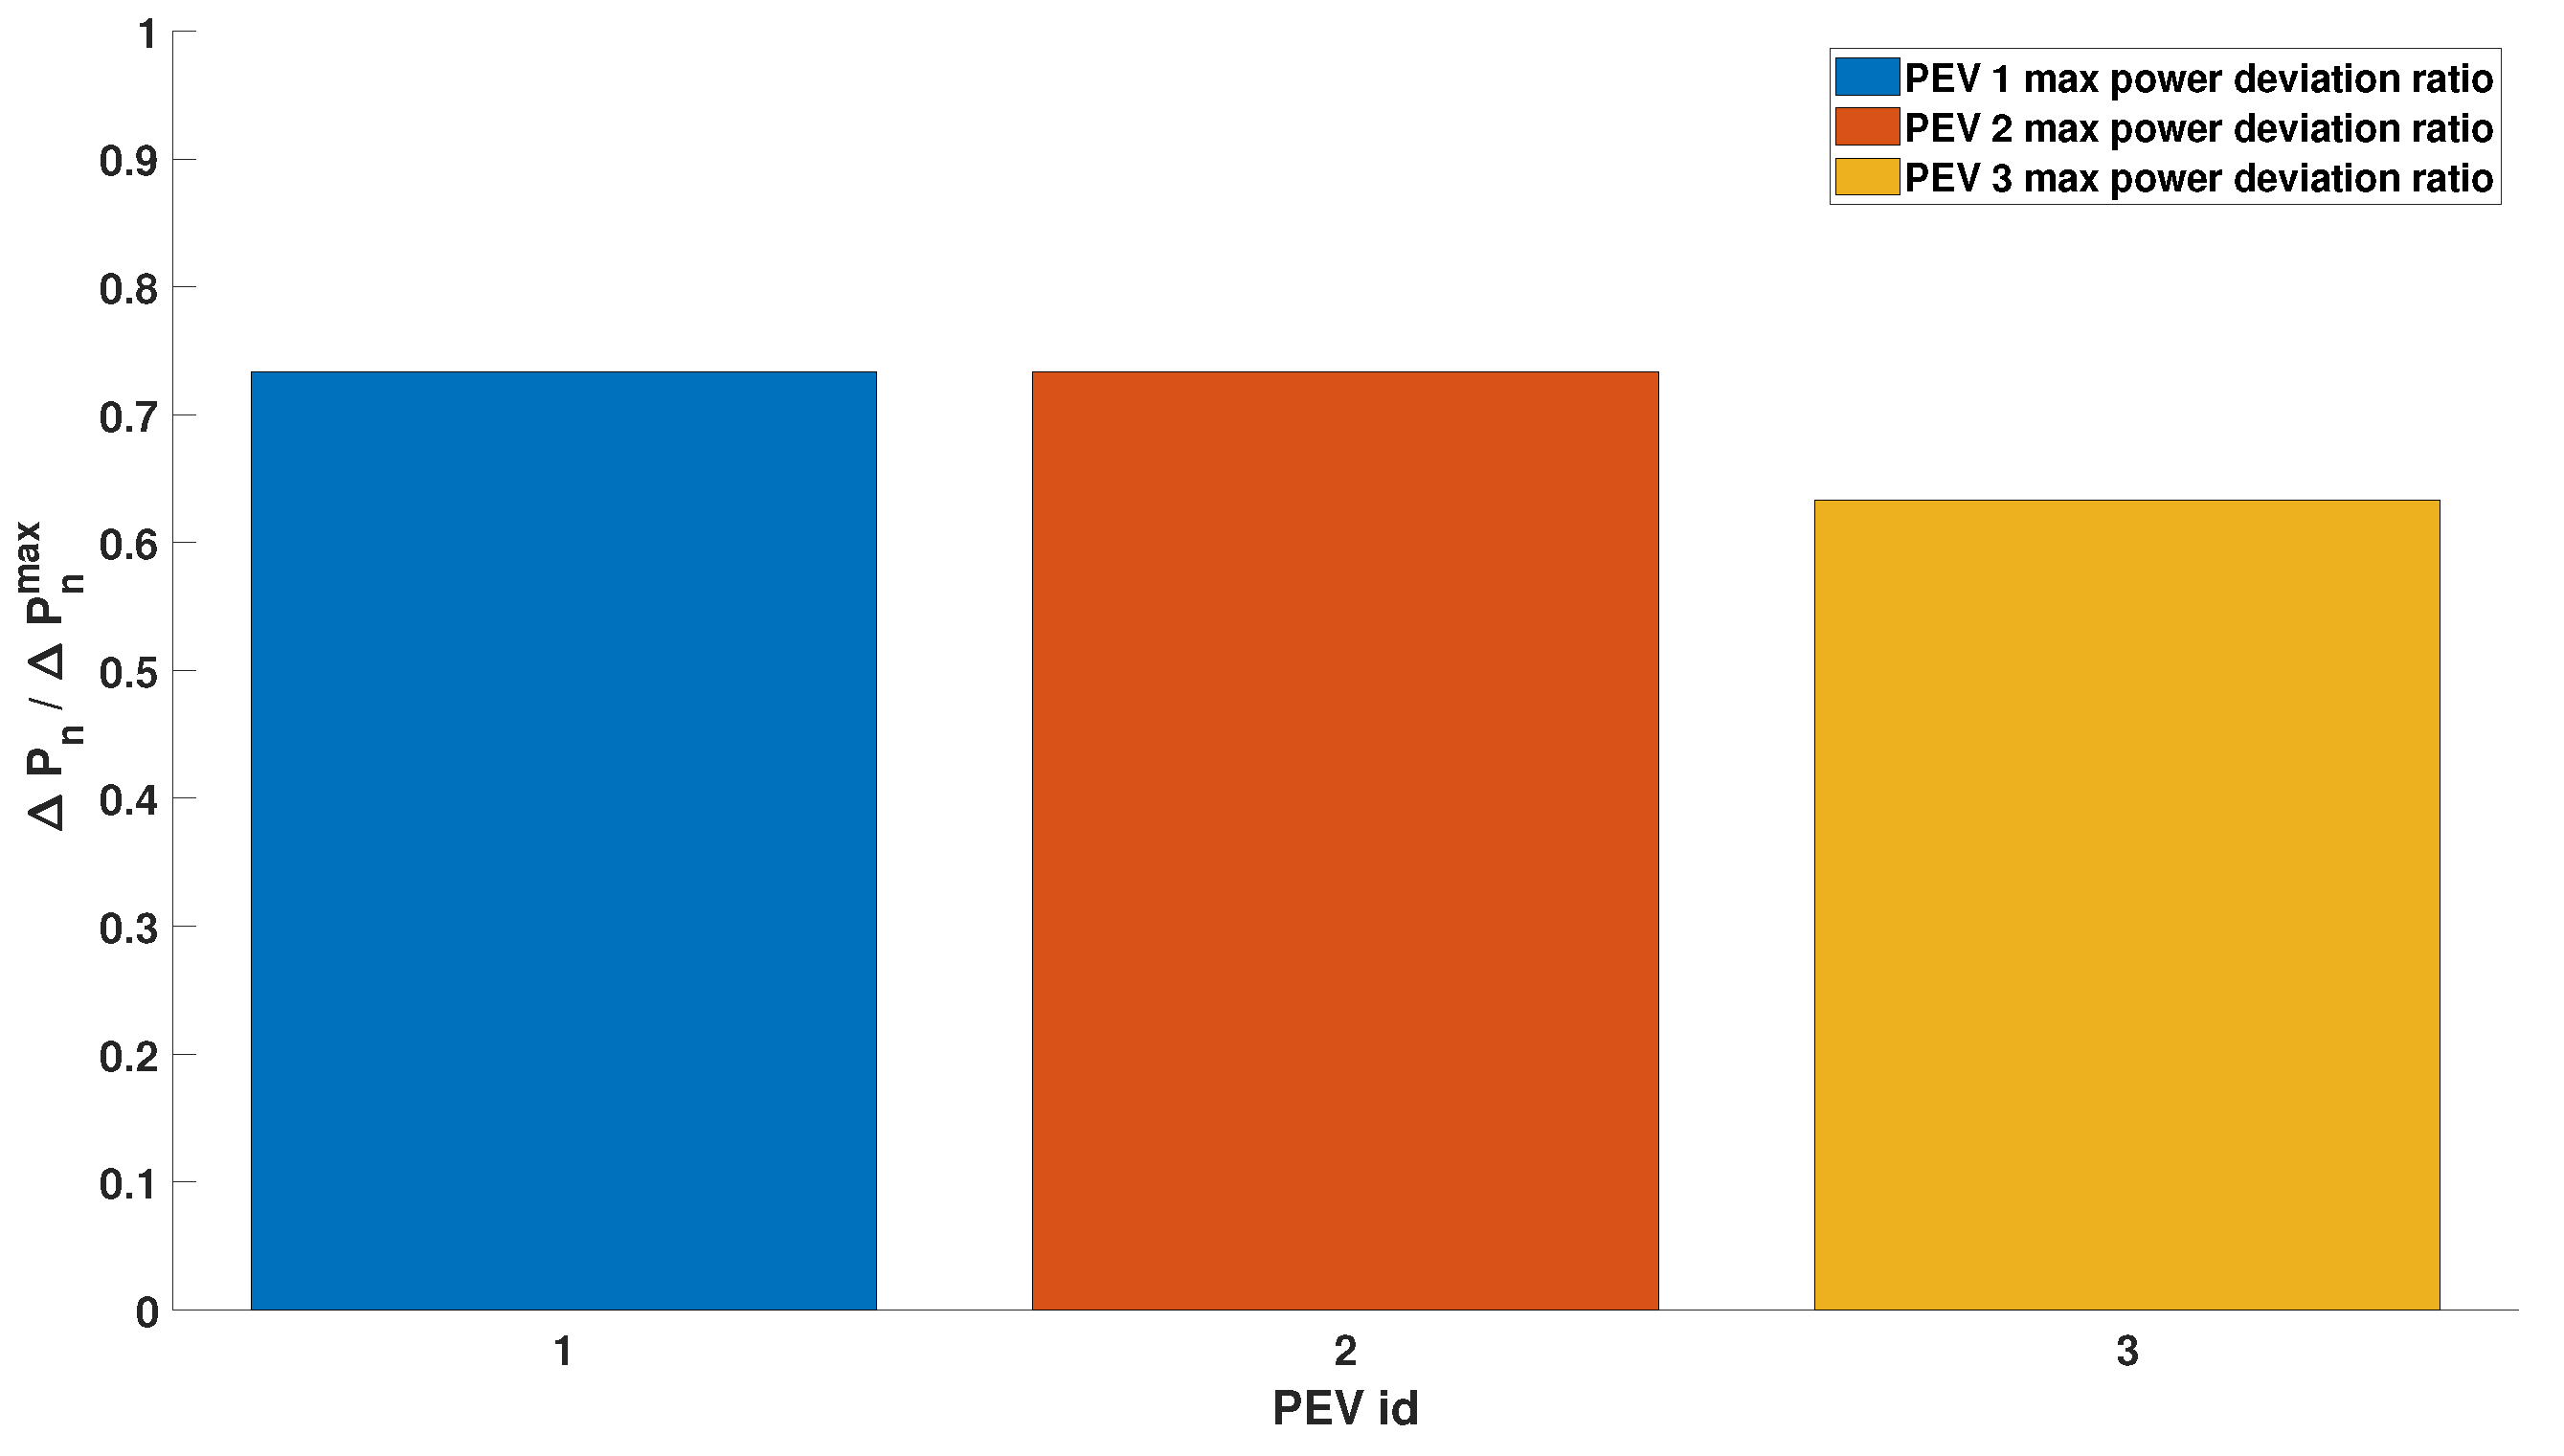
It is interesting to see the result of the same simulation, when the overall maximum power deviation increases. The same simulation is now performed with a maximum global droop curve value of 105 kW, i.e.,
of available margins. The increased request of power could be accomplished using the same strategy as before, so splitting the effort equally between the sessions. This strategy does not consider the fact that an equal distribution of power margins will impose a steeper droop curves to the sessions with larger margins, with a negative impact on the battery system. A steeper curve means a more aggressive response of the battery system to the frequency variations, with the consequently stress on power electronics and its effects on the battery temperature and cells health. The strategy presented in this work instead takes into account also the curve slope
and the intercept
. As a result, the system distributes the additional effort needed to reach the new target droop curve less equally (
Figure 8) but fair distributes the power electronics stress (
Figure 9).
5.2. Scenario 2: Local Droop Curves Assignment in an Unbalanced Scenario
The interconnection between the smart charging and the frequency regulation service is completed by considering the charging preferences expressed by the driver, i.e., the desired final state of charge and the charging time. Summarizing what already discussed about the target function (
10), the algorithm gives a priority in the assignment of droop curves to the PEVs with a greater state of charge error and/or a shorter dwelling time (i.e., to those PEVs that will benefit from an increase in the charging rate).
The simulations presented below (
Figure 10 and
Figure 11) will illustrate the capability of the designed algorithm to link the droop curve assignment with the charging status and the user preferences.
The balanced scenario is now re-proposed, but this time with different state of charge errors and dwelling times for the three PEVs.
Table 2 summarizes the charging session status at the time when the proposed algorithm for allocating local droop curves is run.
PEV 1 is characterized by the greater SOC error, followed by PEV 2. The algorithm recognizes this condition and prioritizes the assignment of power to these two vehicles. The prioritization is in turn weighted by the respective SOC error.
The SOC error is one of the two charging preferences taken into account in the droop curve assignment. In the above simulation, the dwelling time was the same for the three PEVs.
Figure 12 and
Figure 13 show the case in which the PEVs 1 charging session, characterized by a SOC error of
, is also characterized by a remaining dwelling time of
. In this case, the SOC error prioritization is compensated by the available dwelling time, so the algorithm identifies as optimal strategy to equal distribute the effort between the vehicles.
5.3. Notes on the Computational Complexity of the Algorithm
The optimization problem associated to the proposed algorithm is linear, with continuous variables. This is the category of optimization problems that is the most consolidated in the literature, and for which efficient and well established optimization algorithms exist. The optimization problem was built in Julia and solved with Gurobi 9.1 [
25].
Quadratic cost functions could be also used for this kind of problem, as they are an efficient choice in terms of effort distribution (e.g., the third term in the objective function could be replaced by the term , and similarly the last two terms). However, quadratic problems are more complex, and require more computational resources than linear ones.
Considering that this algorithm is designed to work in conjunction with a smart charging system that updates the charging set points with a rate of minutes, and considering the amount of power needed for the participation to the frequency regulation services (e.g., in Italy, the Pilot Project
fast reserve requires at least 5 MW of aggregated power [
23]), we have to face the issue of finding the solution of a large scale optimization problem in a short amount of time. For this reason, we decided to opt for a linear formulation. To test the scalability of the proposed algorithm, several simulation have been performed, considering scenarios of various dimension.
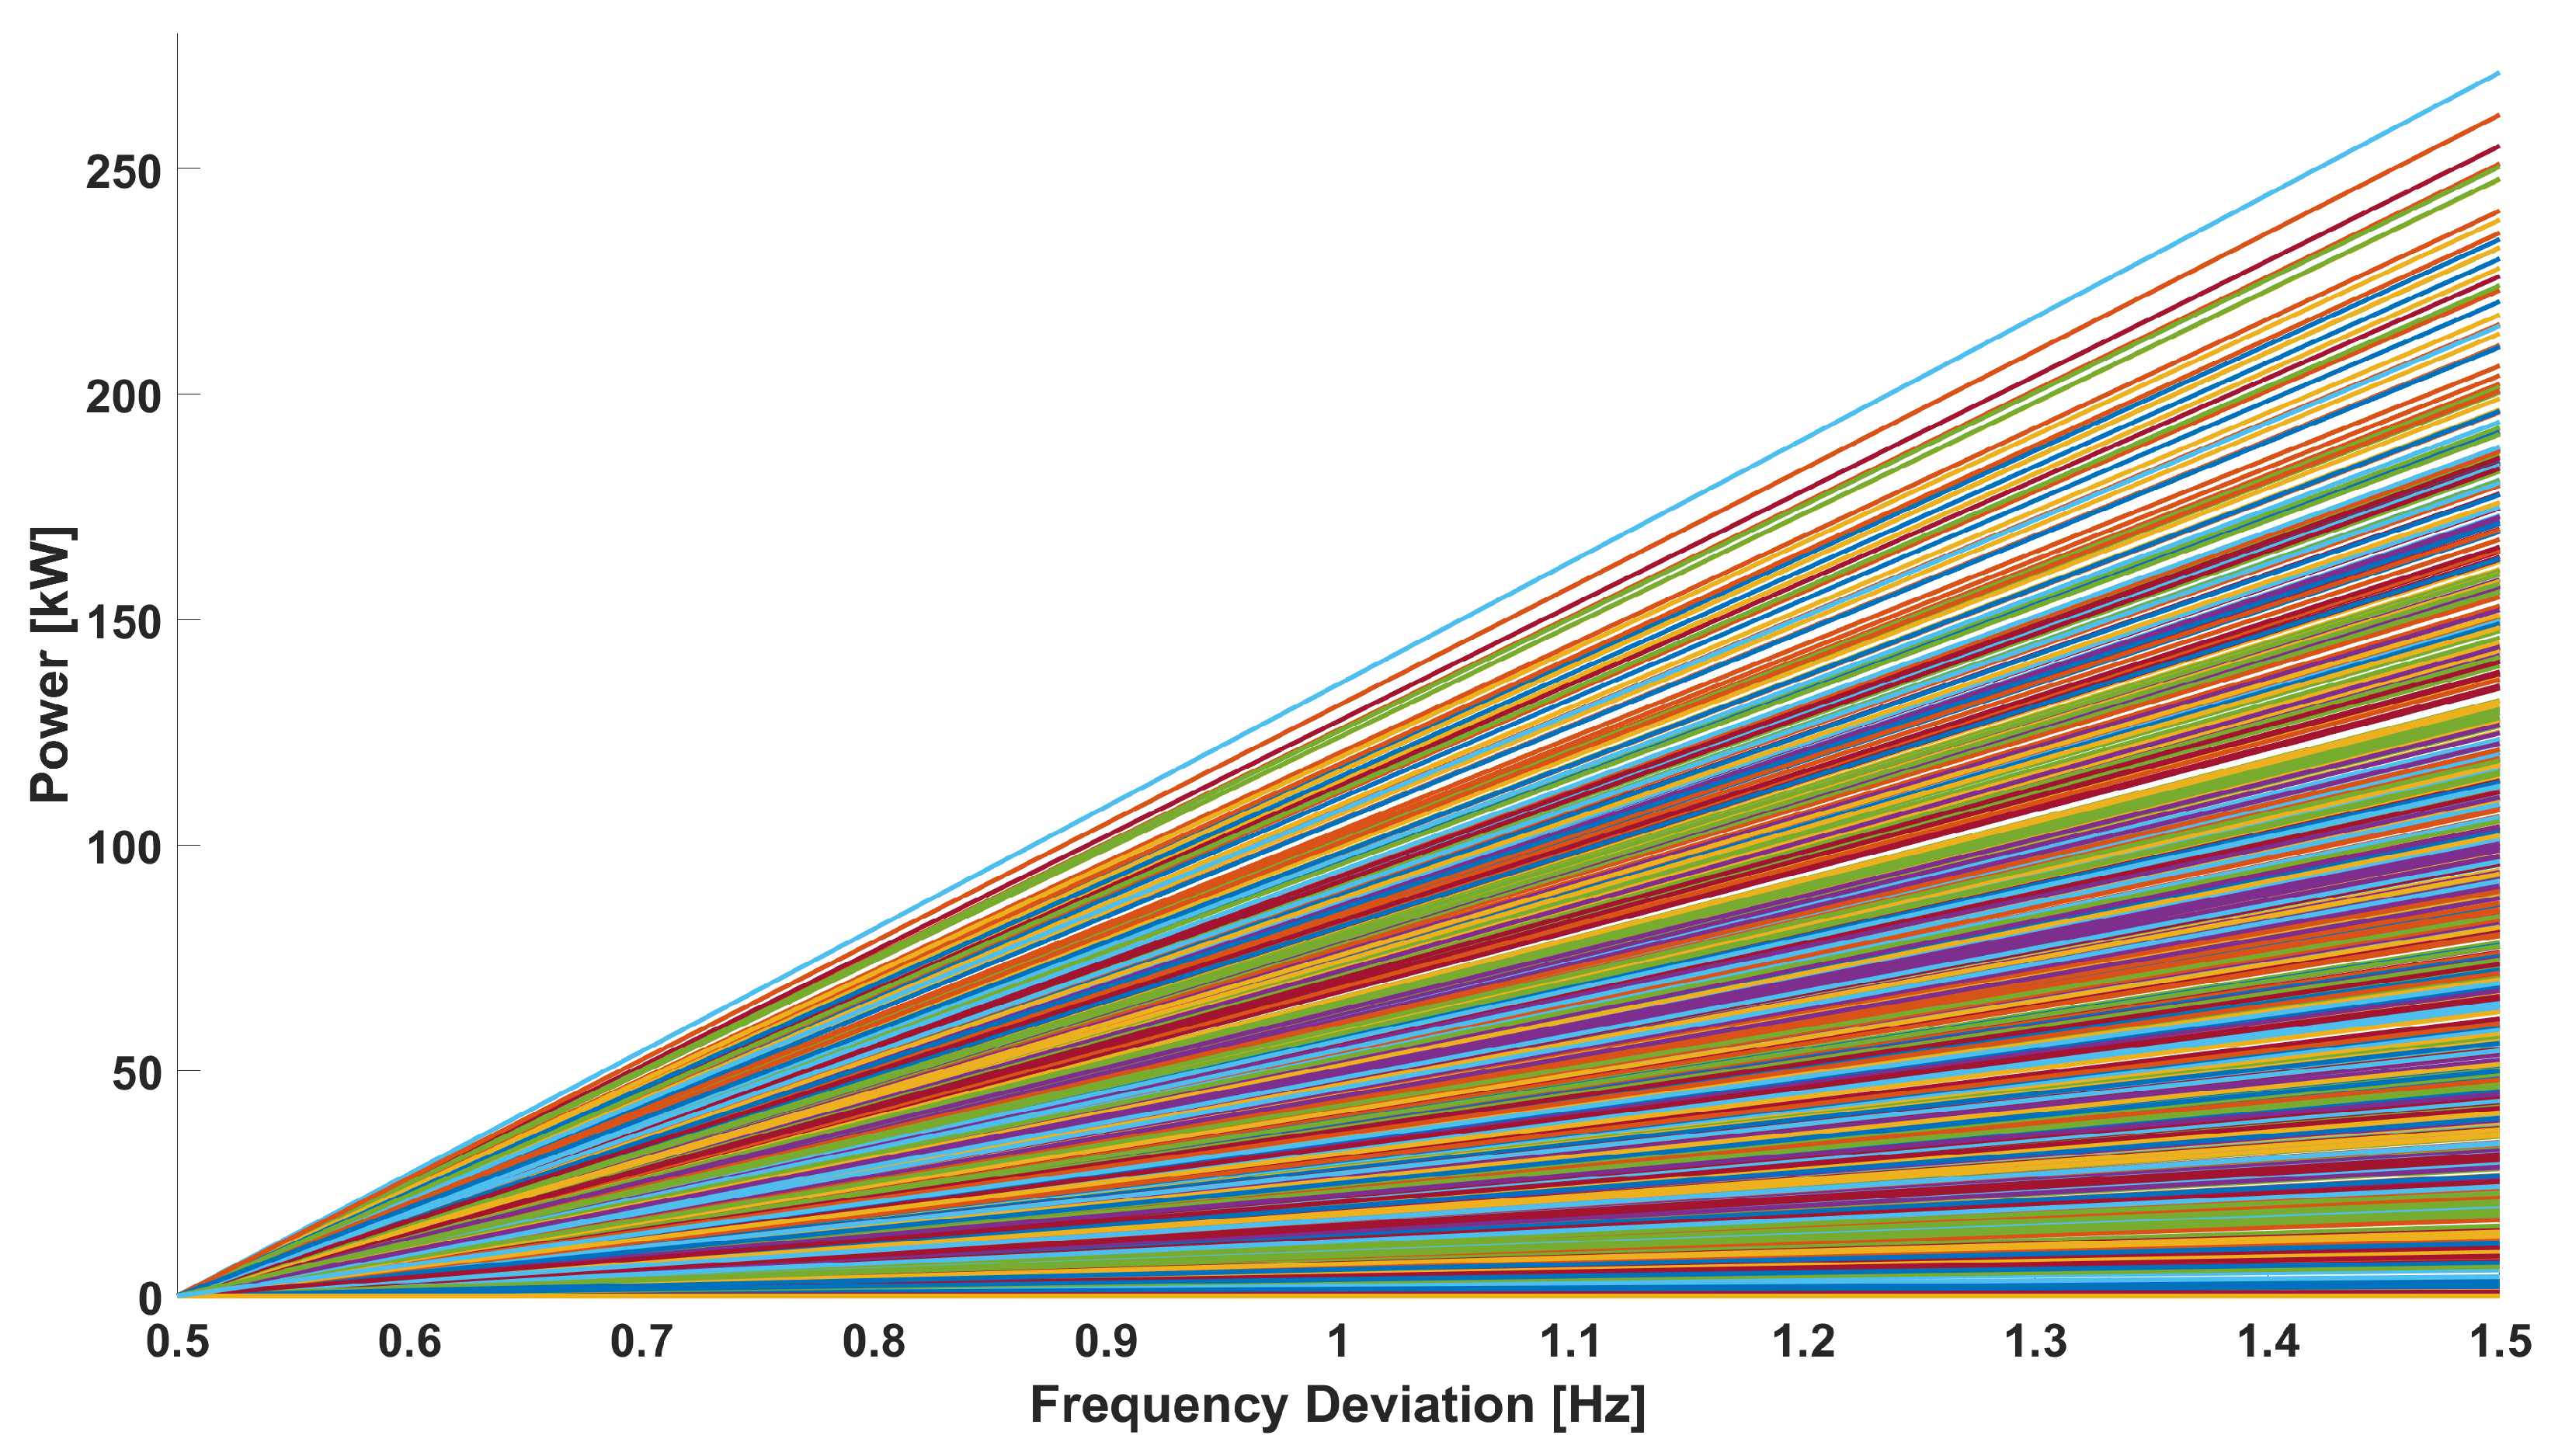
Figure 14 reports the result of local droop curves computation in a scenario with 1000 PEVs participating in the frequency regulation. This simulation does not consider a specific charging technology, the maximum charging and discharging power rates for a generic charging session are randomly chosen, respectively, between 0 kW and 150 kW, and −150 kW and 0 kW. Additionally, the user preferences are assigned randomly. The simulation shows how the proposed algorithm assigns different droop curves considering the current load area requirements (70% of the maximum available aggregated power margin), and the charging sessions status (the result is a uniform distribution of droop curves with no particular clustering). As already mentioned, being the problem linear with continuous variables, very low computational time was observed in various experiments, always between 1 and 1.3 s.
Finally, the algorithm was tested with 100,000 contemporary charging sessions. The solution time was always between 30 and 50 s, which is acceptable, in view of integrating the proposed algorithm with the smart charging algorithm.


 ,
, 


