
Role of Natural Gas Consumption in the Reduction of CO2 Emissions: Case of Azerbaijan


School of Public and International Affairs (SPIA), ADA University, 61 Ahmadbey Aghaoglu, Baku AZ1008, Azerbaijan
Energies 2021, 14(22), 7695; https://doi.org/10.3390/en14227695
Submission received: 25 October 2021
/
Revised: 13 November 2021
/
Accepted: 15 November 2021
/
Published: 17 November 2021
(This article belongs to the Collection Feature Papers in Energy, Environment and Well-Being)
Abstract
:Azerbaijan signed the Paris Agreement in 2016 and committed to cut greenhouse gas (GHG) emissions by 35% in 2030. Meanwhile, natural gas has been vital component in the total energy mix of Azerbaijan economy and accounted for almost 65% of the total energy consumption. In the overall electricity mix, natural gas-fired power plants generate 93% of the country’s electricity. Since global energy consumption is responsible for 73% of human-caused greenhouse-gas emissions, and CO2 makes up more than 74% of the total, this study investigates possible mitigation effects of the natural gas consumption on CO2 emissions for Azerbaijan. Author employed several cointegration methodologies, namely Bound testing Autoregressive Distributed Lag (ARDL) approach, Fully Modified Ordinary Least Squares (FMOLS), Dynamic Ordinary Least Squares (DOLS), and Structural Time Series model (STSM). Author of this paper found that when the share of natural gas increases 1 percent in the total energy mix, CO2 emission per capita decreases approximately 0.14 percent as a result of the ARDL, FMOLS, and DOLS models. All three models provide cointegration between the share of natural gas in the total energy mix and reduction in CO2 emissions.
1. Introduction
Global energy consumption is responsible for 73% of human-caused greenhouse-gas emissions. CO2 emissions make up 74% of greenhouse gas emissions [1]. For 2018, US Environmental Protection Agency (EPA) states that of in the total GHG emissions, 81% consisted of CO2 [2]. Climate Watch [3] data shows this figure as 74%. To keep the global temperature increase to less than 1.5 degrees Celsius, United Nations Environment Program, UNEP [4], estimates annual necessary decline in global GHG emission should be 7.6 per cent every year throughout 2020–2030. For a goal of limiting the global temperature increase to 2 degrees Celsius; a drop in emissions for the same period must be 2.7 per cent per year. Considering these blunt realities, Cohen [5], Xu and Lin [6] propose natural gas as a greener fossil fuel, attracting attention during The 21st Conference of the Parties (COP21) Paris Agreement Nationally Determined Contributions (NDCs) on CO2 mitigation targets and achieving a safer future for the world and humanity. Meanwhile, the increase in global gas consumption outpaced that of oil and coal during last two decades and made up 23% of total global energy demand, reaching its highest ever share [7].
There are numerous studies praising the merits of natural gas as a transition and bridging fuel in the path of adopting more renewable energy resources. For example, Ahmad et al. [8] showed that for the Indian economy, even though EKC (Environmental Kuznets Curve) hypothesis is invalid for other sources, in the gas consumption model, the EKC hypothesis exists. McGlade et al. [9] estimated that with carbon capture and storage (CCS) infrastructure, by 2050, natural gas could play a crucial role in the industrial and power generation sectors. They also confirm the conditional role of natural gas as a transition fuel to a low carbon future up until 2035. Natural gas has been named a “bridge fuel” to achieve worldwide reduction in CO2 emissions [10]. Nagabhushan et al. [11] imply that without commercializing CCS technologies, the era of natural gas as a bridge fuel will end. Qin et al. [12] believe natural gas could smooth the intermittency of renewable electricity generation and facilitate renewable energy penetration. Natural gas is also considered a transitional fuel to support renewable energy resources, in cases of intermittency and lack of reliability [13]. In the global energy structure, natural gas is expected to overtake oil as a leading fuel by 2040 [14]. Among fossil energies, coal produces the highest CO2 emissions. Since coal is a small part of Azerbaijan’s total energy mix, its CO2 intensity has been ignored in this study. However, for every ton burnt, oil produces 71.3 kg of CO2 per million British thermal units (mmBtu), while for natural gas the relative figure is 53.07 kg CO2/mmBtu [15]. To depict joint results of all these three fossil fuels in CO2 emissions Turkey emerges as a striking example. As one of the G20 countries, Turkey, which is heavily dependent on oil, gas, and coal imports, has ever increasing CO2 emissions [16]. Policymakers delayed ratification of the Paris agreement for six years [17]. Lack of availability of even greener alternative fossil fuel has become a challenging issue for policymakers. By covering energy data of 245 countries, Berdysheva and Ikonnikova [18] conclude that a transition away from coal generates relatively higher dependence on natural gas for energy importer countries. It is additional evidence on that demand for natural gas in the global energy demand will keep increasing.
Natural gas has been primary energy source for Azerbaijan, accounting for almost 65% of the total energy consumption in 2019 [19]. As The Organisation for Economic Co-operation and Development (OECD) [20] states, in 1995, natural gas-fired power plants generated just 16.9% of the country’s electricity production, whereas this figure reached 81% by 2018. For 2019, International Energy Agency (IEA) [21] reported this rate as more than 90% [21]. Put differently, during the last 15 years in electricity production, percentage shares of natural gas increased more than five times. For this reason, in Azerbaijan, energy security and electricity security can be used interchangeably. In the last 20 years, from 1999 to 2019, Azerbaijan natural gas consumption has more than doubled, and CO2 emission increased by over 28% [19]. In the overall electricity mix, natural gas-fired power plants generate 93% of the country’s electricity, whereas the share from hydroelectric dams and electricity from waste incineration is 6% and 1%, respectively [22]. The Ministry of Energy announced a specific target; by 2030, 30% of electricity generation will come from renewable sources [22]. Currently, the electricity sector accounts for 40% of all CO2 emissions globally. The shares of coal, gas, and oil in this total are 29%, 9% and 2%, respectively [23]. To fulfill the above-mentioned goal, during the last two years the Ministry of Energy of the Republic of Azerbaijan started three different renewable energy projects: two solar and one wind. These three projects will be implemented with international partners. With BP of the UK and Masdar of the United Arab Emirates, 240 MW and 230 MW solar power plants will be built, respectively, and with ACWA Power of the Kingdom of Saudi Arabia, construction of a 240 MW wind power plant will be completed. Additionally, since the total power generation capacity of Azerbaijan is 7516 MW, the Ministry of Energy plans to achieve a 30% target in three different periods up until 2030 [24,25,26,27]. As data is provided for one wind and one solar plant, the Ministry of Energy estimate that these two projects will reduce CO2 emissions by 600 thousand tons and natural gas consumption by 330 million cubic meters [24,26]. Furthermore, a global scale investment in renewables will gradually turn into a global imperative. IEA’s Net-Zero Emissions (NZE) by 2050 scenario shows that, by 2050, there should be large reductions in the use of fossil fuels. In 2020, oil, coal, and natural gas provided 30%, 26%, and 23% of total energy supply, respectively; that is almost 80% of the total. The share of fossil fuels in the total energy supply is supposed to decline to just over 20% by 2050. In exchange for this reduction, diversified renewable sources will provide two-thirds of total energy used [28]. In the same estimate, IEA suggests that, to achieve global net zero emissions by 2050, investment in new fossil-fuel supply projects must immediately cease. That kind of global imperative will have impactful implications for national policies. Available international funds for fossil fuel-powered projects will dry up in tandem with this global trend.
According to Sustainable Development Goals (SDG) Climate Action Goal 13, global CO2 emissions are supposed to decline 45% during 2010–2030, which requires collective global action [29]. In this manner, Intended Nationally Determined Contribution (INDC) of the Republic of Azerbaijan in the United Nations Framework Convention on Climate Change (UNFCCC) records state that considering 1990 as a base year, Azerbaijan has a target of a 35% reduction in the level of greenhouse gas emissions by 2030. By 2018, 81.5% of the total emissions in Azerbaijan came from the energy sector [30]. Currently, many studies conducted focus on large emitters, such as China, US, and BRICS. This study intends to fill the gap on studies related to resource-rich countries. Climate change imperative poses additional threats for the petro-states with the strong potential of triggering low fossil fuel demand and prices. Carbon Tracker Initiative [31] estimates that oil-rich countries will face potential risk of collectively losing 13 trillion dollars in government revenue by 2040. With the current Nationally Determined Contribution (NDC) for unconditional commitment, by 2030, Azerbaijan greenhouse gas emissions (GHG) will not exceed 65% of 1990 levels. That is, the country is committed to a 35% decrease in GHG emissions by 2030. Broadly, Sustainable Development Goal 13 and specifically, indicator 13.2.2 detail this. As a part of the Paris Climate accord, developed nations pledged to channel an annual 100 billion USD for developing countries between from 2020 to 2025. A recent OECD report shows that this goal will be fulfilled by 2023 [32]. For accelerating the transition to cleaner energy sources and tackling impacts of climate change, this support is vital for many developing nations. 26th UN Climate Change Conference of the Parties (COP26) have generated new negotiation strands for all the participating countries. It is timely to provide additional scholarly evidence on the reduction of CO2 emissions.
Considering the background, it is crucial to come up with statistically significant and economically meaningful empirical findings to provide a full-fledged policy advising options. In this manner, to get statistically consistent estimates, author employed several cointegration methodologies, namely the Bound testing ARDL approach, Fully Modified OLS (FMOLS), Dynamic OLS (DOLS), and Structural Time Series model (STSM). Each method has its own merits and drawbacks. Author used them to complement each other to offset any issues. For instance, ARDL is usually preferred due to its robust performance on small samples, and the possibility to incorporate stationary and non-stationary variables in the system. To test the sensitivity of long-run parameters obtained from ARDL, author employed DOLS and FMOLS. FMOLS, developed by Phillips and Hansen [33], adopts a non-parametric approach by adjusting long-run variance to overcomes the problems of serial correlation and endogeneity. On the other hand, Dynamic OLS Stock and Watson [34] is a parametric approach in which lags and leads are introduced to cope with simultaneity and small sample bias. STSM, introduced by Harvey [35], enables the coefficient of interest to vary and accommodate a non-linear stochastic trend. Considering the statistical superiority of the methodology, estimation results also have striking implications. This study finds a statistically and economically significant relationship between the share of natural gas in total energy mix and per capita CO2 emissions.
By providing insights about the role of natural gas as a “bridge fuel”, this paper intends to provide scholarly evidence for policymakers as well as researchers. It bluntly depicts the importance of developing renewable energy sources and questions the sustainability of the current energy mix pathway for Azerbaijan. This study finds that, with the increasing share of natural gas in total energy mix, Azerbaijan has managed to reduce CO2 emissions. This kind of emission reduction policy is mainly achieved by substituting oil with natural gas in power generation. Since 93% of the electricity generation already takes places within gas-fired power plants, a further increase in the share of natural gas may not be attainable. Put differently, findings of this study imply that even if Azerbaijan manages to increase its share of natural gas to one hundred percent in the total energy mix, unconditional commitment within the Nationally Determined Contribution (NDC) framework may not be achievable. So, results of this study suggest the necessity of a more diversified energy mix blended with renewable energy sources. In addition, findings of this study are applicable to other resource-rich countries. With the primary findings of this study, developed nations will also have additional scholarly evidence on the importance of annually delivering 100 billion USD support to the resource-rich countries along with poor nations for shifting their energy mix to clean energy and building resilience for ongoing/upcoming climate change.
The paper has been structured as follows: After the introduction, Section 2 provides a literature review of studies analyzing the role of natural gas on mitigating CO2 emissions, Section 3 specifies methodology and data, Section 4 presents the study’s estimation results and interpretations, while Section 5 provides the concluding remarks and policy implications.
2. Literature Review
To reveal both linear and non-linear effects, Lin and Agyeman [15] used data-driven nonparametric additive regression (NPAR) and found that expansion in natural gas consumption will gradually lower CO2 emissions. Their study arrived at this conclusion that using natural gas could reduce sub-Saharan Africa’s CO2 emissions. As natural gas is the most predominant source of electricity in Nigeria, Kim et al. [36] suggest that optimized electricity generating technologies are nuclear and gas due to the growing population. In their scenario, including reduction of CO2 emissions for the Nigerian case, starting from 2020, the country is supposed to decrease its share of oil power plants in electricity production and use natural gas as a transition fuel up until 2059. By citing 64% share of coal in energy consumption of China in 2015, Qin et al. [12] studied the challenges of using natural gas as a carbon mitigation option for world’s largest emitter of CO2. The study concludes that current carbon price in the pilot markets, which is USD 1–15/ton CO2, needs to be increased to achieve competition of natural gas over coal. They suggested that natural gas can play an important role in the transition to low-carbon energy and smooth the intermittency of renewable electricity generation [12]. Per unit of energy, burning coal emits two times more CO2 than natural gas. In its Nationally Determined Contributions (NDC), the Chinese government pledged to increase the use of natural gas to over 10% of energy consumption by 2020. It seems that this target has been missed. If conventional natural gas had been produced and consumed, CO2 emissions would have been reduced 4–9 percent from 2010 to 2020 and could have led to a 4–11 percent reduction for the 2020–2030 period. That would be fairly consistent with the UNEP (2019) estimates [12]. It seems that, because of price dilemma and insufficient natural gas infrastructure, this opportunity has also already been missed. As the Chinese case reveals clearly, it is quite an important issue to have wide use of natural gas for mitigating climate change effects. Compared with coal and oil, as the carbon intensity of natural gas is lower; expanding natural gas consumption will provide a smooth transition period from fossil fuels to renewable energy [6]. With the ARDL estimation results Dong et al. [37] finds that in the Chinese case, both natural gas and renewable energy consumption are effective in the reduction of CO2 emissions. However, in terms of CO2 emission reduction potential, natural gas has a stronger effect in the short run. Whereas in the long run, renewable energy consumption has a significant and negative impact on CO2 emissions.
Dong et al. [38] proved that natural gas is a favorable fossil fuel for CO2 emissions mitigation for BRICS countries. As they applied the panel augmented mean group (AMG) estimator, results show that a 1% increase in natural gas consumption could cause a decrease of 0.1641% in CO2 emissions in these countries. In terms of natural gas consumption’s mitigation impact on CO2 emission, an individual country AMG estimator shows that a 1% increase in natural gas consumption will cause as much as a 0.2171% decrease in the CO2 emissions. Author relates this relatively higher coefficient to the energy consumption structure of the country; the larger the share of natural gas in total energy consumption, the more CO2 mitigation effect of natural gas consumption gets. The EKC hypothesis turning years and turning points are also close for these countries, in which the share of natural gas is higher in total energy consumption. The study concludes that natural gas as a cleaner substitute to other fossil fuels. Their panel, based on the VECM Granger causality approach, shows that the direction of Granger causality is from natural gas to CO2 emissions in the context of the BRICS countries [38]. Keeping in mind that Nepal is the fourth most climate vulnerable country in the world, Bastola and Sapkota [39] find that Real GDP Granger causes CO2 emissions in the long run. Even though they do not make distinction for natural gas consumption, their study concludes with a feedback hypothesis between energy consumption and carbon emission. Since efficiency of natural gas in power generation much exceeds that of renewable technology, Malzi et al. [40] conclude that many developing nations will stick to natural gas in the near future.
3. Model, Data, and Methodology
3.1. Model
As mentioned above, Azerbaijan is a coal-free country. Meanwhile, burning fossil fuels emit CO2. As Lin and Agyeman [15] show, for every ton burnt, coal emits 95.35 kg of CO2 per million British thermal units (kgCO2/mmBtu), whereas oil, 71.3 kgCO2/mmBtu and natural gas, 53.07 kgCO2/mmBtu. Because of these emission values, natural gas is considered the greenest fossil fuel, and this study intends to focus only on natural gas consumption. Multivariate analysis in the study can be expressed with the following functional form in the Equation (1).
where COPC is the per capita CO2 emissions measured, GDPPC stands for the GDP per capita, ENINT is the energy intensity of the GDP, and NGSHARE is the share of natural gas in total energy consumption.
The employed functional form for analyzing the relationship between CO2 emissions and share of natural gas consumption in the total energy mix as well as with other fundamentals is expressed as follows. After the natural logarithm, Equation (1) can be re-written as follows:
where is a regression constant, , , and are elasticity parameters of income, energy intensity, and share of natural gas in total energy consumption, respectively, and finally is a regression residual term which is assumed to follow i.i.d properties. It is not a surprise to expect the income (proxied by real GDP per capita) elasticity, , to be positive. While an economy expands and grow over time, the consumption of energy and in turn CO2 emission will go up. The impact of economic growth and GDP are very well documented in the energy literature, for example Key et al. [41] provides an extensive literature review. In the same line of reasoning the energy intensity also accelerates the carbon emission footprint, which means that are expected to be positive. Following the discussions in the literature review, and according to the findings of Li and Su [42], Dong et al. [37,38,43,44,45], Zhao et.al [46], Jiang et.al [47], Alkhathlan and Javid [48], and Saboori and Sulaiman [49] the sign of is expected to be negative, since the consumption of natural gas is supposed to reduce the CO2 footprint.
3.2. Data
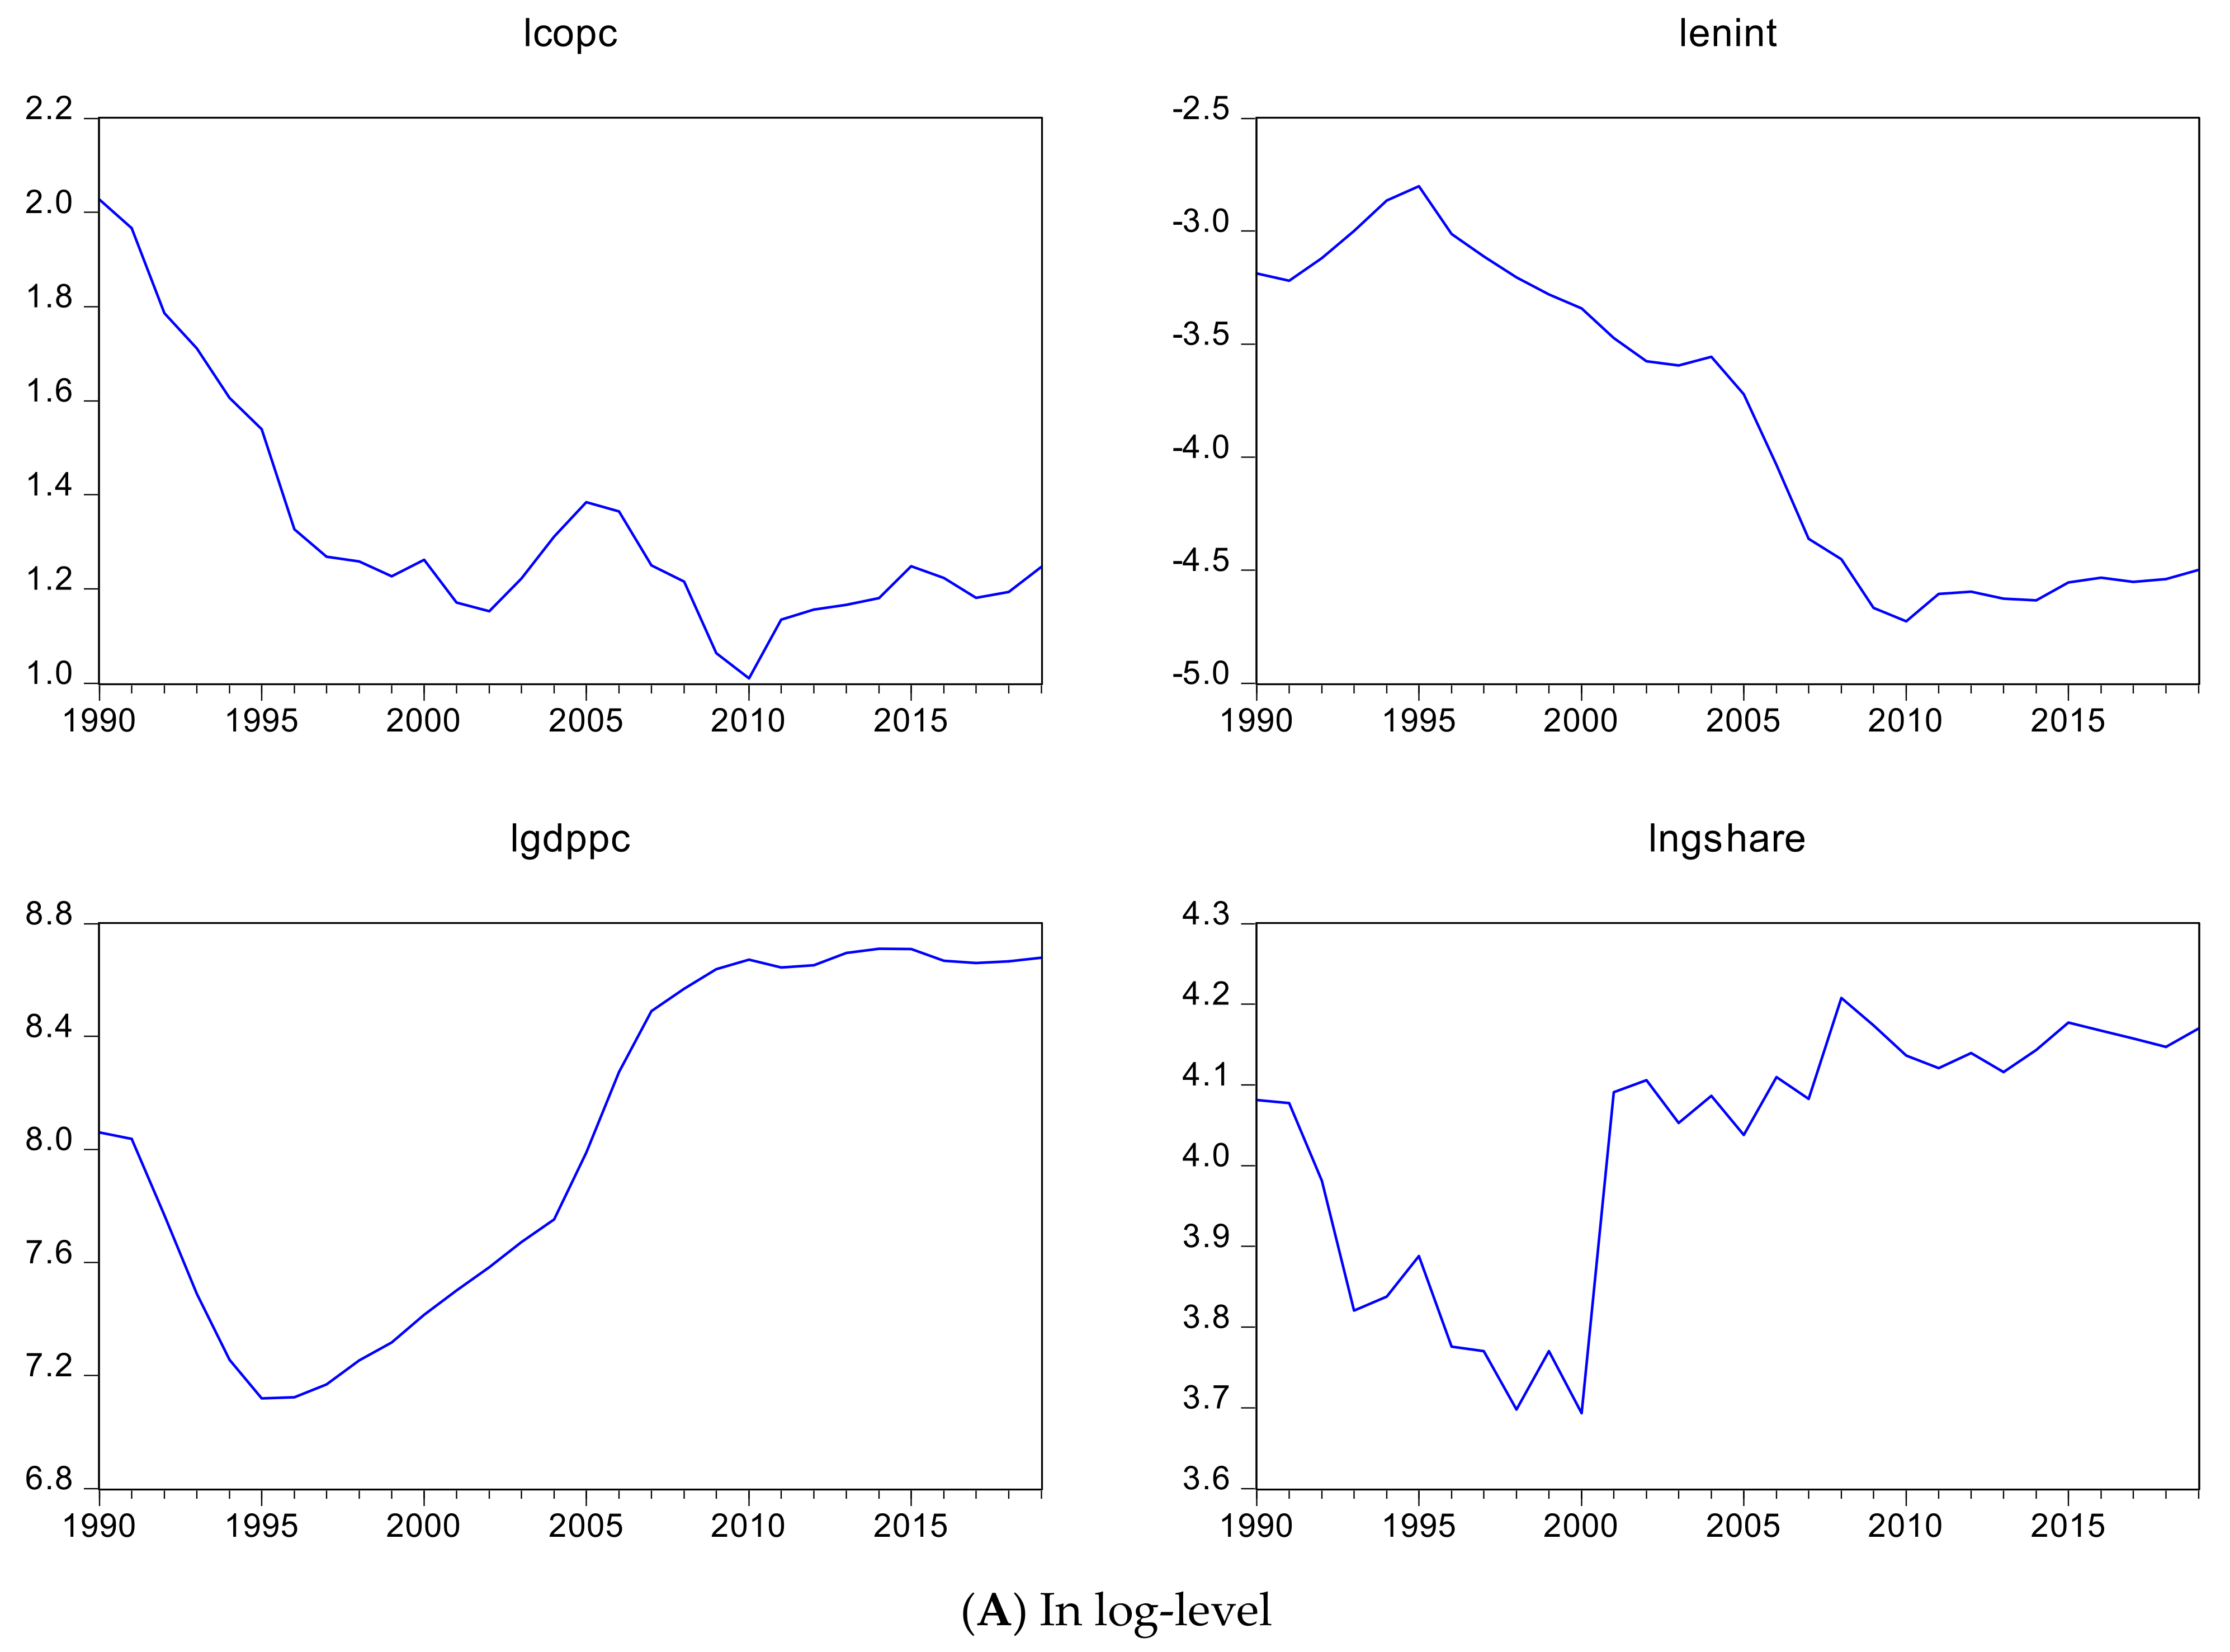
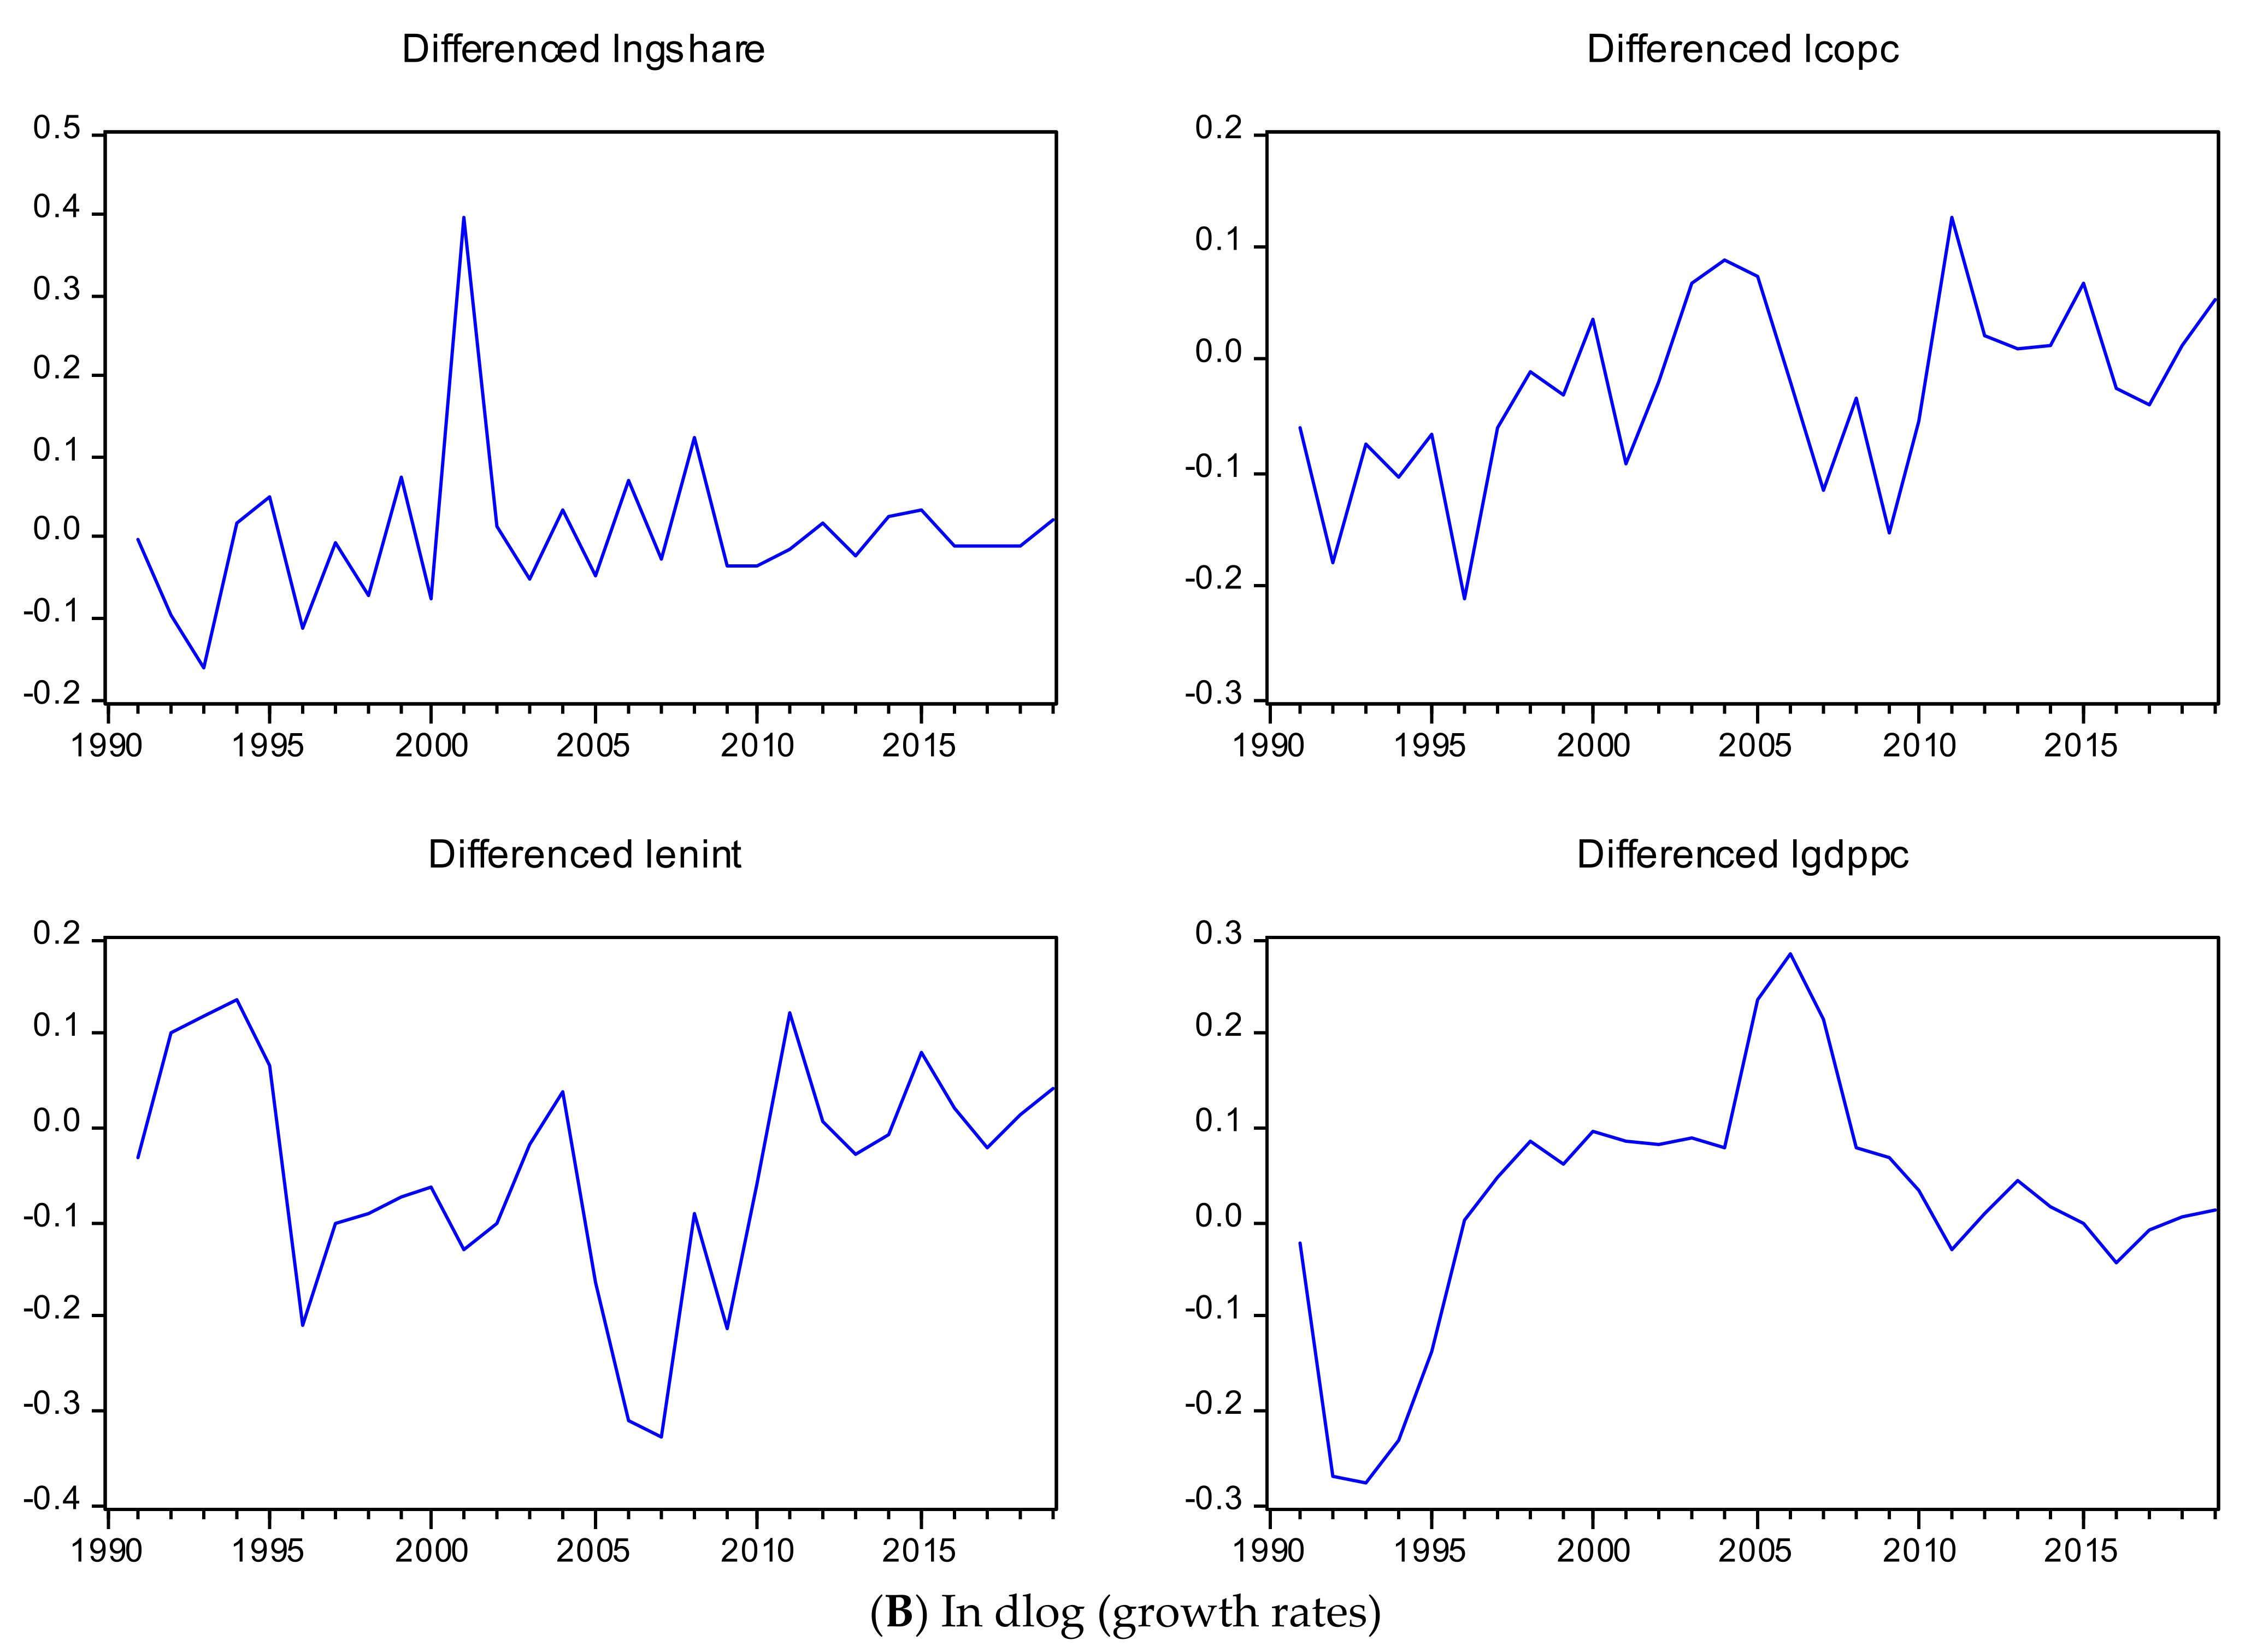
For the sample period, that is 1990–2019, annual data is utilized in this study. The unit of the per capita CO2 emissions is metric tons. By dividing total CO2 emissions collected from the BP Statistical Review of World Energy [19] by the population data from the World Development Indicators [50], CO2 emissions per capita was calculated. Per capita GDP at constant prices of 2010 in USD terms were extracted from the World Development Indicators [51]. Primary energy consumption collected from BP Statistical Review of World Energy [19] was divided by the GDP in constant 2010 USD World Development Indicators [51] dollars to get energy intensity. By dividing the natural gas consumption of Azerbaijan, with its primary energy consumption share of natural gas in total, energy consumption was calculated. The historical path of the variables in a logarithmic form and their growth rates are depicted in Figure 1. The variables in Panel A are shown in log-levels, and in Panel B are shown in differenced logs (growth rates). By 2019, the share of natural gas and oil in total was 65% and 33%, respectively. Precisely expressed, 97.51% of total energy consumption came from fossil fuels. In total energy consumption, renewable energy’s share is almost negligible. Any policy implication favoring development of renewable industries will shed additional light on mitigating climate change.
Figure 1 shows historical paths of variables (in log-levels and growth rates) used in this study. Emission per capita declined over time but slightly increased from 2010, as depicted in the left corner of Panel A of Figure 1. The energy intensity variable also followed a similar pattern, pointing out a close relationship. The share of gas in the total primary energy consumption has significantly increased since 2000. It is mainly because of switching electricity production from oil-fired power plants to gas-fired ones. As the OECD [20] states, in 1995, natural gas-fired power plants generated roughly 17% of the country’s electricity production. For 2019, IEA [21] reported this rate as more than 90%. Put it differently, during the last 25 years, shares of natural gas in total electricity production increased more than five times, reaching 93%. The GDP per capita of Azerbaijan was exposed to several structural changes impacted by persistent and permanent positive and negative events such as war, oil boom, and exchange rate shocks. Descriptive statistics of level variables are reported in Table 1.
3.3. Methodology
Since all variables depict some trending pattern, it makes it possible to apply cointegration approaches. To analyze the long-run relationship between CO2 emissions and its fundamentals, author employed several cointegration methods, such as the bound-testing approach (ARDL) and Dynamic OLS (DOLS), Fully modified OLS (FMOLS), and Structural Time series modeling (STSM) approach. In principle, all approaches are comprised of three steps: (i) Testing for non-stationarity (or stationarity) of series; (ii) testing for cointegration between the series; (iii) estimation of the cointegration equation. The study was conducted in the Eviews-12.
For testing variables’ unit root properties, the Augmented Dicky–Fuller (ADF), Phillips–Perron (PP). and Kwiatkowsk–Phillips–Schmidt–Shin (KPSS) unit root tests are used. Cointegration relationship between the variables is checked using the Hansen Instability Test, Variable Addition Test (VAT) developed by Park [52] Engle–Granger, Phillips–Oularies and Autoregressive Distributed Lags Bounds (ARDLBT), Pesaran and Shin [53]; Pesaran et al. tests [54].
4. Estimation Results and Interpretation
All variables depict the unit root process in the level and stationarity in the first difference. Test results indicated that we could employ a cointegration methodology.
For robustness purposes, author employed several unit roots tests in two specifications —only intercept, and intercept with the trend, as reported in Table 2. All variables exhibited non-stationarity in level and stationarity in the first difference, except the GDP per capita variable (lgdppc). Strangely, GDP per capita (in log terms) was found to be stationary in the second difference, i.e., I (2). Author found the trend to be significant (in the only intercept specification) in the level and first difference for the GDP per capita variable, so I (2). However, the KPSS test indicates that it is stationary in the first difference. The behavior of this variable mimics the underlying trend in the Azerbaijan Economy. The deep recession of the early years of 1990 was accompanied by war and a strong recovery. Starting from 2004, increased oil production coincided with high oil prices resulting in double-digit economic growth rates. Therefore, we see a significant spike in GDP per capita from 2004 up to 2008. In later years, the contribution of oil in GDP started to decline, and the growth rate began to show a moderate downward trend. These trend shifts may cause GDP per capita to behave like I (2). In particular, the later trend looks very smooth. Juselius [55] suggest that I (2) can be approximated with an I (1) stochastic trend around a broken liner deterministic trend by fitting sufficiently many deterministic trends to the data.
Unit root test are summarized in Table 2. ADF and PP tests (intercept spec.) for carbon emission variable (LCOPC) show that it is stationary in the level and the second difference. However, visual inspection clearly indicates a downward trend, with a steeper slope in the beginning and a smoother one at the last period of the sample. Probably, this smooth trend caused variables to behave like a mean-reverting process. The KPSS test, however, rejected stationarity in the level. Accounting for the trend in the second specification (intercept and trend) helped to yield the most probable results; that is, all tests showed that it is I (1). In other words, the variable has a unit root in level and stationary in the first difference.
The energy intensity variable (LENINT) also exhibits a similar problem. Due to the smooth trend at the end of the sample, the test only marginally indicates the presence of a unit root at a 10% significance level. Although the trend is significant in the second specification, the test now shows higher-order integration, which is not clear from visual inspection.
There is a level shift in the gas consumption variable (lngshare), as shown in Figure 1. This shift reflects a significant change in the energy mix of Azerbaijan. The trend is significant in ADF and PP tests, and therefore t statistics became higher. All tests indicate that lngshare variable resembles the I (1) process.
Next, after completing the unit root test, author moved on with the cointegration test. To get robust results, author employed several cointegration tests. The cointegration tests reported in Table 3 indicate a presence of a cointegration relationship between carbon emission per capita and gas consumption as well as its other fundamentals. The first two cointegration tests, Hansen instability and Park Added Variables tests, assume that the null hypothesis is cointegrated. Their probabilities were higher than the critical level such that the null was not rejected, so the series were cointegrated. On the other hand, Engle-Granger, Phillips-Oularies, and ARDLBT tests against the null series were not cointegrated. Their results are also in line with the previous ones; the null hypothesis is rejected, so the series are cointegrated.
From the estimation results for the different models reported in Table 4, it was found that when the share of natural gas increased 1 percent in the total energy mix, CO2 emission decreased approximately 0.14 percent because of the ARDL, FMOLS, and DOLS models. Even though the STSM model was relatively lower, all three models provided cointegration between the share of natural gas in the total energy mix and reduction in CO2 emissions. Income elasticity is almost close to unity in all specifications, reflecting very robust results. In other words, author of this paper found that a 1 percent increase in GDP per capita increased CO2 emission by 1 percent. The energy intensity variable was also found to have a unit coefficient, and it was not a surprise. For example, Climate Watch [30] data shows 81.5% of the total emissions in Azerbaijan came from the energy sector. Additionally, as BP [19] puts it, 98% of total energy consumption comes from oil and natural gas. A high share of hydrocarbons in total energy mix will translate into higher CO2 emissions.
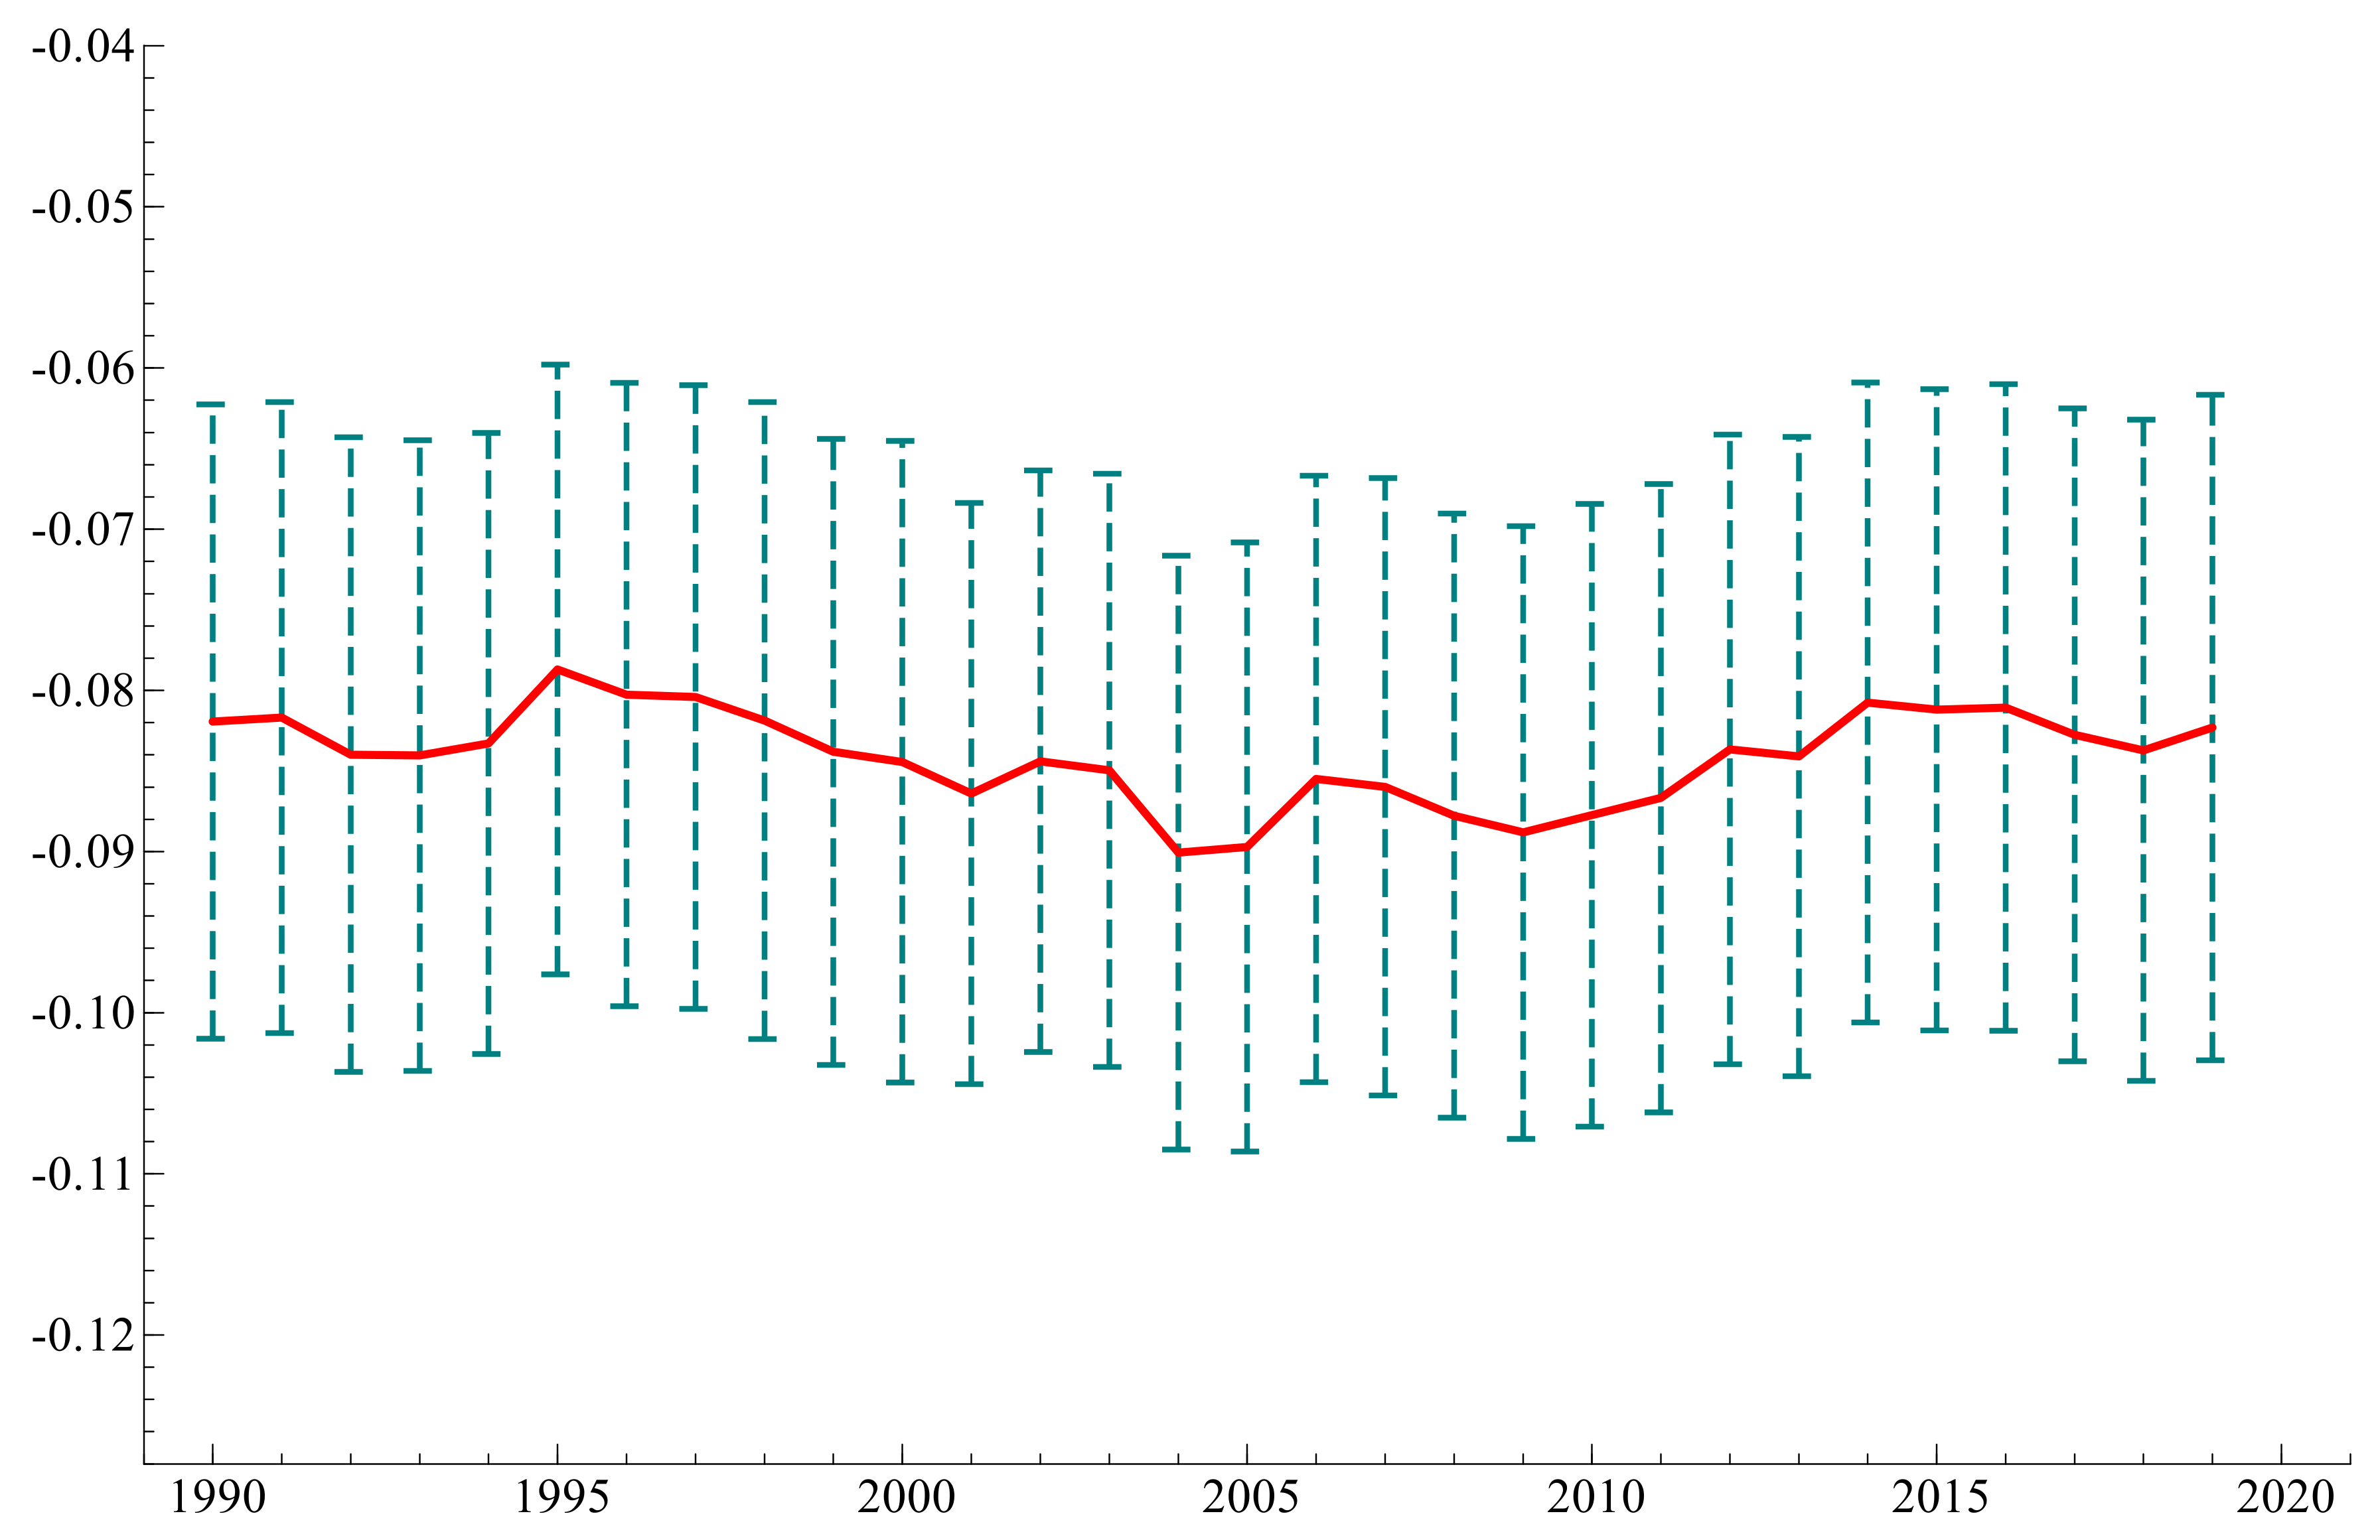
Author of this paper also reports the time-varying parameter of the share of gas consumption variable (lngshare) in Figure 2. Red line shows the share of gas consumption parameter and its variation over time; and dotted-lines indicate confidence intervals for these time-varying parameters; x-axis shows possible value for the share of gas consumption parameter. Estimations show that the coefficient is very stable and varies between −0.079 and −0.090 with a 99% confidence interval. Moreover, the result indicates that the parameter decreased from 1990 to 2005, though very slightly, indicating higher CO2 emission reduction impact. After 2005, the coefficient started to increase and convert to its previous level, mimicking the mean-reverting process. During future studies one may hypothesize that efficiency improvement in gas production and consumption technologies can cause the parameter to vary in a particular direction during the examined period. Efficient technologies consume less energy and therefore emit less CO2. One recent study found that it is a global phenomenon [56].
5. Conclusions and Policy Implications
This study analyzes the impact of natural gas consumption on mitigating CO2 emissions for Azerbaijan. Considering that natural gas provides 65% of total energy supply and 93% of electricity generation for Azerbaijan, this relationship provides many insights. Since 1995, oil-fired power plants have been replaced with natural gas-fired plants. The former accounted for 65% of power generation in 1995 and currently there are no functioning oil-fired power plants in Azerbaijan. Shifting sources of electricity generation to cleaner fossil fuel have had considerable impacts on the reduction of CO2 emissions. Together with these striking realities, estimation results of the ARDL, FMOLS, and DOLS models suggest that when the share of natural gas increases 1 percent in the total energy mix, CO2 emission per capita decreases approximately 0.14 percent. Even though the result of STSM model is relatively lower, the three given models provide cointegration between the share of natural gas in the total energy mix and its impact in the reduction of CO2 emissions. This result is in line with Lin and Agyeman’s [15] finding that when coal and oil consumption increases together with natural gas, its reducing effect on CO2 emissions is inhibited. Put differently, enhancing the share of natural gas in the total energy mix at the expense of a reduction of coal and oil matter more in terms of reducing CO2 emissions. Azerbaijan’s experience overlaps with the described shift mentioned by Lin and Agyeman [15].
Long-run elasticities calculated in this study between natural gas consumption and CO2 emissions imply that even if a country manages to boost its share of natural gas to 100% in its total energy mix (which is practically impossible), commitment to reducing greenhouse gas emissions (GHG) by 35% in 2030 will not be an attainable goal. Even though burning natural gas emits CO2, its production and transportation emits methane ( CH4). Azerbaijan is not only a natural gas consumer, the country also has increasing natural gas production. Over the last two decades, natural gas production in Azerbaijan increased four times; specifically between 2010–2020, production increased 59% [19]. In 1998, methane emissions in Azerbaijan were equal to 16.09 Mt CO2e (carbon dioxide equivalent); since then, there has been a rapid increase and this figure reached 51.22 Mt CO2e in 2010 and declined gradually to 43.60 Mt CO2e in 2018, according to the most recent data available [3]. By considering 1998, it means that within two decades, from 1998 to 2008, methane emissions increased by 2.7 times. Increasing methane emissions is also an issue for other resource-rich countries. Furthermore, since Azerbaijan’s political commitment is on total GHG emissions, the 35% reduction goal by 2030 seems unattainable. The more the country consumes natural gas, the more it will produce. Additionally, Azerbaijan is a net exporter of natural gas. Currently, operational Southern Gas Corridor (SGC), which plans to transport 10 billion cubic meters of Azerbaijani gas per year (bcm/y) to Europe, has been classified as a Project of Common Interest (PCI) by European Commission [57]. With this trend, there will trade-off between CO2 and CH4 emissions.
Urgency in the development renewable sources of energy is visible for Azerbaijan. As the IEA [21] puts it, in 2019 renewables provided 2% of the total primary energy supply and 8% of electricity production in Azerbaijan [21]. The target of the Ministry of Energy of the Republic of Azerbaijan on renewables development is quite ambitious. The Ministry announced that, by 2030, 30% of electricity generation will come from renewable sources [22]. On one hand, policymakers are supposed to employ a natural gas boon as a transition source of energy for sustainable and renewable energy, together with electricity security. On the other hand, urgent actions are required to meet the 2030 goal on the reduction of GHG emissions. For example, by considering rapid population growth, Kim et al. [36] suggest nuclear power as a best choice for another resource-rich country, Nigeria. In the meantime, climate change imperative poses additional threats for oil rich countries by leading to low fossil fuel demand and prices. In 2020, assets of the State Oil Fund of the Republic of Azerbaijan (SOFAZ) have been more than 100% of Azerbaijan GDP and it provided almost half of the State Budget revenues [58]. The Carbon Tracker Initiative [31] estimates that by 2040 potential government revenue is expected to decline more than 40% for Azerbaijan. As Felver [59] concludes, funding from developed nations pledged under the Paris Agreement is going to be a vital source for Azerbaijan to have a satisfactory transition to low carbon economy. Azerbaijani policymakers are supposed to explore this option too. For example, Nagabhushan [11] concludes that even though CCS relies on existing, well-understood technology, a global consensus on moving investments and regulatory support toward this technology has been elusive [11].
Azerbaijan submitted its updated NDC during the 26th UN Climate Change Conference of the Parties (COP26) and made an additional 40% GHG emissions reduction commitment for the 2030–2050 period [60]. That is, a 35% commitment of GHG emissions reduction is still a valid goal. An additional goal on GHG emissions reductions reveals that natural gas is supposed to be a “bridge fuel”, not the ultimate source of energy and electricity. Natural gas-fired plants generate 93% of electricity in Azerbaijan. That is, energy security and electricity security can be used interchangeably for Azerbaijan. In the main public document entitled “Strategic Roadmap”, it is officially stated that, after 2025, the share of natural gas in electricity production will be decreased, and renewable and sustainable sources will be developed. In this document, it is stated that investments will be evaluated for the following renewable sources: solar, wind, geothermal, and biomass [61]. After 2025, there will be only five years left to realize the 2030 commitment. It will imply and require a sharper decline in GHG emissions. According to the Ministry of Energy data, economically viable and technically feasible potential renewable energy sources are estimated to be 26940 MW, including 3000 MW of wind energy and 23 040 MW of solar energy [25]. Considering that, currently the total power generation capacity of Azerbaijan is 7516 MW [25]; the above estimation means Azerbaijan’s potential in renewable energy sources is almost untapped. Considering the Strategic Roadmap of the National Economy, Azerbaijan wants to be a high-income country after 2025. Azerbaijani policymakers envisage that, after 2025 income level of Azerbaijan will reach the level of EU’s Eastern European members [62]. In this manner, learning from the experience of the Czech Republic, Hungary, Poland, and Slovakia by considering technology maturity and policy incentives and other related details [63,64], Azerbaijani policymakers can adopt accelerated path on decarbonizing and diversification of energy sources and as well as high energy self-sufficiency.
Funding
This research received no external funding.
Institutional Review Board Statement
Not applicable.
Informed Consent Statement
Not applicable.
Data Availability Statement
Publicly available datasets were analyzed in this study. This data can be found in the following links: https://www.bp.com/en/global/corporate/energy-economics/statistical-review-of-world-energy.html; https://data.worldbank.org/indicator/SP.POP.TOTL and https://databank.worldbank.org/source/sustainable-development-goals-(sdgs)/Series/NY.GDP.PCAP.KD.
Acknowledgments
The author gratefully acknowledges the insightful comments from Jeyhun I. Mikayilov and Fuad Mammadov in the earlier drafts of this study. Author of this paper thanks editors of Energies and four anonymous referees for their insightful comments that greatly increased quality of current paper.
Conflicts of Interest
The author declares no conflict of interest.
References
- Ge, M.; Friedrich, J. 4 Charts Explain Greenhouse Gas Emissions by Countries and Sectors. World Resources Institute. Available online: https://www.wri.org/blog/2020/02/greenhouse-gas-emissions-by-country-sector (accessed on 24 August 2020).
- Overview of Greenhouse Gases. United States Environmental Protection Agency (EPA). Available online: https://www.epa.gov/ghgemissions/overview-greenhouse-gases (accessed on 25 August 2020).
- Historical GHG Emissions. Climate Watch. Available online: https://www.climatewatchdata.org/ghg-emissions?breakBy=gas&chartType=percentage&end_year=2018&start_year=1990 (accessed on 27 August 2021).
- United Nations Environment Programme Emission Gap Report. 2019. Available online: https://www.unenvironment.org/resources/emissions-gap-report-2019 (accessed on 28 August 2021).
- Cohen, E. Development of Israel's natural gas resources: Political, security, and economic dimensions. Resour. Policy 2018, 57, 137–146. [Google Scholar] [CrossRef]
- Xu, B.; Lin, B. Can expanding natural gas consumption reduce China’s CO2 emissions? Energy Econ. 2019, 81, 393–407. [Google Scholar] [CrossRef]
- Energy Futures Initiative (EFI). The Future of Natural Gas in a Deeply Decarbonized World. Expert Workshop Summary Report; EFI: Washington, DC, USA, 2021; Available online: https://energyfuturesinitiative.org/efi-reports (accessed on 26 August 2021).
- Ahmad, A.; Zhao, Y.; Shahbaz, M.; Bano, S.; Zhang, Z.; Wang, S.; Liu, Y. Carbon emissions, energy consumption and economic growth: An aggregate and disaggregate analysis of Indian economy. Energy Policy 2016, 96, 131–143. [Google Scholar] [CrossRef]
- McGlade, C.; Pye, S.; Ekins, P.; Bradshaw, M.; Watson, J. The future role of natural gas in the UK, A bridge to nowhere? Energy Policy 2018, 113, 454–465. [Google Scholar] [CrossRef] [Green Version]
- Dong, K.; Sun, R.; Wu, J.; Hochman, G. The growth and development of natural gas supply chains: The case of China and US. Energy Policy 2018, 123, 64–71. [Google Scholar] [CrossRef]
- Nagabhushan, D.; Russell, R.H.; Waltzer, K.; Thompson, J.; Beck, L.; Jaruzel, M. Carbon capture: Prospects and policy agenda for CO2-neutral power generation. Electr. J. 2021, 34, 106997. [Google Scholar] [CrossRef]
- Qin, Y.; Tong, F.; Yang, G.; Mauzerall, D.L. Challenges of using natural gas as a carbon mitigation option in China. Energy Policy 2018, 117, 457–462. [Google Scholar] [CrossRef]
- Becerra-Fernandez, M.; Cosenz, F.; Dyner, I. Modeling the natural gas supply chain for sustainable growth policy. Energy 2020, 205, 118018. [Google Scholar] [CrossRef]
- Kan, S.Y.; Chen, B.; Wu, X.F.; Chen, Z.M.; Chen, G.Q. Natural gas overview for world economy: From primary supply to final demand via global supply chains. Energy Policy 2019, 124, 215–225. [Google Scholar] [CrossRef]
- Lin, B.; Agyeman, S. Impact of natural gas consumption on sub-Saharan Africa’s CO2 emissions: Evidence and policy perspective. Sci. Total Environ. 2021, 760, 143321. [Google Scholar] [CrossRef]
- Abumunshar, M.; Aga, M.; Samour, A. Oil Price, Energy Consumption, and CO2 Emissions in Turkey. New Evidence from a Bootstrap ARDL Test. Energies 2020, 13, 5588. [Google Scholar] [CrossRef]
- Reuters. Turkey Ratifies Paris Climate Agreement; Last G20 Country to Do So. 2021. Available online: https://www.reuters.com/business/environment/turkey-ratifies-paris-climate-agreement-last-g20-country-do-so-2021-10-06/ (accessed on 17 October 2021).
- Berdysheva, S.; Ikonnikova, S. The Energy Transition and Shifts in Fossil Fuel Use: The Study of International Energy Trade and Energy Security Dynamics. Energies 2021, 14, 5396. [Google Scholar] [CrossRef]
- BP. Statistical Review of World Energy 70th Edition. 2021. Available online: https://www.bp.com/content/dam/bp/business-sites/en/global/corporate/pdfs/energy-economics/statistical-review/bp-stats-review-2021-full-report.pdf (accessed on 27 August 2021).
- Organization for Economic Co-operation and Development (OECD). Chapter 2: Investment in sustainable infrastructure in Azerbaijan. In Sustainable Infrastructure for Low-Carbon Development in Central Asia and the Caucasus Hotspot Analysis and Needs Assessment; OECD: Paris, France, 2019. [Google Scholar] [CrossRef]
- International Energy Agency (IEA). Azerbaijan Energy Profile, Country Report—April 2020. Available online: https://www.iea.org/reports/azerbaijan-energy-profile (accessed on 26 October 2020).
- OECD. Azerbaijan’s sustainable infrastructure investments. In Sustainable Infrastructure for Low-Carbon Development in the EU Eastern Partnership: Hotspot Analysis and Needs Assessment; OECD Publishing: Paris, France, 2021. [Google Scholar] [CrossRef]
- International Energy Agency (IEA). Global Energy-Related CO2 Emissions by Sector. 2021. Available online: https://www.iea.org/data-and-statistics/charts/global-energy-related-co2-emissions-by-sector (accessed on 18 October 2021).
- The Ministry of Energy of the Republic of Azerbaijan. Agreements on Wind Power Plant Project With Capacity of 240 MW Were Signed With “Acwa Power” Company. 2020. Available online: https://minenergy.gov.az/en/xeberler-arxivi/acwa-power-sirketi-ile-qoyulus-gucu-240-mvt-olan-kulek-elektrik-stansiyasi-layihesi-uzre-muqavileler-imzalanib (accessed on 12 November 2021).
- The Ministry of Energy of the Republic of Azerbaijan. The Use of Renewable Energy Resources in Azerbaijan. 2020. Available online: https://minenergy.gov.az/en/alternativ-ve-berpa-olunan-enerji/azerbaycanda-berpa-olunan-enerji-menbelerinden-istifade (accessed on 12 November 2021).
- The Ministry of Energy of the Republic of Azerbaijan. Agreements on Solar Power Plant Project With Capacity of 230 MW Were Signed With Masdar. 2021. Available online: https://minenergy.gov.az/en/foto-qalereya/masdar-sirketi-ile-qoyulus-gucu-230-mvt-olan-gunes-elektrik-stansiyasi-layihesi-uzre-muqavileler-imzalanib (accessed on 12 November 2021).
- The Ministry of Energy of the Republic of Azerbaijan. Ministry of Energy Starts Cooperation With BP on a 240MW Solar Energy Project in the Zangilan/Jabrayil Region. 2021. Available online: https://minenergy.gov.az/en/xeberler-arxivi/energetika-nazirliyi-bp-ile-zengilancebrayil-zonasinda-240-mvt-gucunde-gunes-enerjisi-layihesi-uzre-emekdasliga-baslayir (accessed on 12 November 2021).
- International Energy Agency (IEA). Net Zero by 2050: A Roadmap for Global Energy Sector 2021. Available online: https://www.iea.org/reports/net-zero-by-2050 (accessed on 12 November 2021).
- UNDP. Goal 13: Climate Action. 2020. Available online: https://www.undp.org/content/undp/en/home/sustainable-development-goals/goal-13-climate-action.html (accessed on 25 August 2020).
- Climate Watch. Greenhouse Gas Emissions and Emissions Targets. 2021. Available online: https://www.climatewatchdata.org/countries/AZE?source=PIK (accessed on 27 August 2021).
- Carbon Tracker Initiative. Beyond Petrostates: The Burning Need to Cut Oil Dependence in the Energy Transition. 2021. Available online: https://carbontracker.org/reports/petrostates-energy-transition-report/ (accessed on 12 March 2021).
- OECD. Forward-Looking Scenarios of Climate Finance Provided and Mobilized by Developed Countries in 2021–2025. Available online: https://www.oecd.org/environment/forward-looking-scenarios-of-climate-finance-provided-and-mobilised-by-developed-countries-in-2021-2025-a53aac3b-en.htm (accessed on 13 November 2021).
- Phillips, P.C.B.; Hansen, B.E. Statistical inference in instrumental variables regression with I (1) processes. Rev. Econ. Stud. 1990, 57, 99–125. [Google Scholar] [CrossRef]
- Stock, J.H.; Watson, M.W. A simple estimator of cointegrating vectors in higher order integrated systems. Econometrica 1993, 61, 783–820. [Google Scholar] [CrossRef]
- Harvey, A.C. Forecasting, Structural Time Series Models and the Kalman Filter; Cambridge University Press: Cambridge, UK, 1989. [Google Scholar]
- Kim, J.; Abdel-Hameed, A.; Joseph, S.R.; Ramadhan, H.H.; Nandutu, M.; Hyun, J.-H. Modeling Long-Term Electricity Generation Planning to Reduce Carbon Dioxide Emissions in Nigeria. Energies 2021, 14, 6258. [Google Scholar] [CrossRef]
- Dong, K.; Sun, R.; Dong, X. CO2 emissions, natural gas and renewables, economic growth: Assessing the evidence from China. Sci. Total Environ. 2018, 640–641, 293–302. [Google Scholar] [CrossRef] [PubMed]
- Dong, K.; Sun, R.; Hochman, G. Do natural gas and renewable energy consumption lead to less CO2 emission? Empirical evidence from a panel of BRICS countries. Energy 2017, 141, 1466–1478. [Google Scholar] [CrossRef]
- Bastola, U.; Sapkota, P. Relationships among energy consumption, pollution emission, and economic growth in Nepal. Energy 2015, 80, 254–262. [Google Scholar] [CrossRef]
- Malzi, M.J.; Sohag, K.; Vasbieva, D.G.; Ettahir, A. Environmental policy effectiveness on residential natural gas use in OECD countries. Resour. Policy 2020, 66, 101651. [Google Scholar] [CrossRef]
- Key, A.; Mendonça, D.S.; de Andrade, G.; Barni, C.; Fernando, M.; Cezar, A.; Kupek, E.; Fernandes, L. Hierarchical modeling of the 50 largest economies to verify the impact of GDP, population and renewable energy generation in CO2 emissions. Sustain. Prod. Consump. 2020, 22, 58–67. [Google Scholar]
- Li, R.; Su, M. The role of natural gas and renewable energy in curbing carbon emission: Case study of the United States. Sustainability 2017, 9, 600. [Google Scholar] [CrossRef] [Green Version]
- Dong, K.; Sun, R.; Li, H.; Liao, H. Does natural gas consumption mitigate CO2 emissions: Testing the environmental Kuznets curve hypothesis for 14 Asia-Pacific countries. Renew. Sust. Energ. Rev. 2018, 94, 419–429. [Google Scholar] [CrossRef]
- Dong, K.; Dong, X.; Jiang, Q. How renewable energy consumption lower global CO2 emissions? Evidence from countries with different income levels. World Econ. 2020, 43, 1665–1698. [Google Scholar] [CrossRef]
- Dong, K.; Dong, X.; Ren, X. Can expanding natural gas infrastructure mitigate CO2 emissions? Analysis of heterogeneous and mediation effects for China. Energ. Econ. 2020, 90, 104830. [Google Scholar] [CrossRef]
- Zhao, J.; Jiang, Q.; Dong, X.; Dong, K. Would environmental regulation improve the greenhouse gas benefits of natural gas use? A Chinese case study. Energ. Econ. 2020, 87, 104712. [Google Scholar] [CrossRef]
- Jiang, H.D.; Xue, M.M.; Dong, K.Y.; Liang, Q.M. How will natural gas market reforms affect carbon marginal abatement costs? Evidence from China. Econ. Syst. Res. 2021, 33, 1–22. [Google Scholar] [CrossRef]
- Alkhathlan, K.; Javid, M. Energy consumption, carbon emissions and economic growth in Saudi Arabia: An aggregate and disaggregate analysis. Energ. Policy 2013, 62, 1525–1532. [Google Scholar] [CrossRef]
- Saboori, B.; Sulaiman, J. Environmental degradation, economic growth and energy consumption: Evidence of the environmental Kuznets curve in Malaysia. Energ. Policy 2013, 60, 892–905. [Google Scholar] [CrossRef]
- World Bank. Population Data 2021. Available online: https://data.worldbank.org/indicator/SP.POP.TOTL?locations=AZ (accessed on 12 July 2021).
- World Bank. GDP Per Capita 2021. Available online: https://data.worldbank.org/indicator/NY.GDP.PCAP.KD?locations=AZ (accessed on 12 July 2021).
- Park, J.Y. Testing for unit roots and cointegration by variable addition. In Advances in Econometrics; Rhodes, G.F., Fomby, T.B., Eds.; JAI Press: Stamford, CT, USA, 1990; pp. 107–133. [Google Scholar]
- Pesaran, H.M.; Shin, Y. An Autoregressive Distributed Lag Modeling Approach to Cointegration Analysis. In Econometrics and Economic Theory in the 20th Century; Strom, S., Ed.; The Ragnar Frisch Centennial Symposium; Cambridge University Press: Cambridge, UK, 1999. [Google Scholar]
- Pesaran, M.H.; Shin, Y.; Smith, R.J. Bound Testing Approaches to the Analysis of Level Relationships. J. Appl. Econom. 2001, 16, 289–326. [Google Scholar] [CrossRef]
- Juselius, K. The Cointegrated VAR Model: Methodology and Applications; Oxford University Press: Oxford, UK, 2006. [Google Scholar]
- Rühl, C.; Erker, T.; Oil Intensity: The Curious Relationship between Oil and GDP. M-RCBG Associate Working Paper No. 164. Available online: https://www.hks.harvard.edu/centers/mrcbg/publications/awp/awp164 (accessed on 20 July 2021).
- European Commission (EC). Annex 2019. Available online: https://ec.europa.eu/energy/sites/ener/files/c_2019_7772_1_annex.pdf (accessed on 25 August 2020).
- State Oil Fund of the Republic of Azerbaijan (SOFAZ). Reports Archive. 2021. Available online: https://oilfund.az/en/report-and-statistics/report-archive (accessed on 29 August 2021).
- Felver, T.B. How can Azerbaijan meet its Paris Agreement commitments: Assessing the effectiveness of climate change-related energy policy options using LEAP modeling. Heliyon 2020, 6, e04697. [Google Scholar] [CrossRef]
- Ministry of Ecology and Natural Resources of Republic of Azerbaijan. Azerbaijan Announced New Commitments in the 26th UN Climate Change Conference of the Parties (COP26). 2021. Available online: http://eco.gov.az/az/nazirlik/xeber?newsID=13301 (accessed on 11 November 2021).
- Strategic Roadmap on the Development of Utilities in the Republic of Azerbaijan Approved by Decree of the President of the Republic of Azerbaijan. 2016. Available online: https://static.president.az/pdf/38542.pdf (accessed on 31 August 2021).
- Musayev, V. Strategic Roadmap on National Economy and Key Sectors of the Economy of Azerbaijan, Azerbaijan Economic Reforms Review. Center for Analysis of Economic Reforms and Communication. 2017. Available online: http://ecoreform.az/store//media/islahat_icmali/mart/strateji%20yol%20x%C9%99rit%C9%99si%20-eng1.pdf (accessed on 5 May 2020).
- Księżopolski, K.; Maśloch, G. Time Delay Approach to Renewable Energy in the Visegrad Group. Energies 2021, 14, 1928. [Google Scholar] [CrossRef]
- Pronińska, K.; Księżopolski, K. Baltic Offshore Wind Energy Development—Poland’s Public Policy Tools Analysis and the Geostrategic Implications. Energies 2021, 14, 4883. [Google Scholar] [CrossRef]
Figure 1.
Historical path of the variables.


Figure 2.
Time-varying parameter of the share of gas consumption variable, with 99% confidence interval.
Figure 2.
Time-varying parameter of the share of gas consumption variable, with 99% confidence interval.


Table 1.
Descriptive statistics of the variables.
| LCOPC | LENINT | LGDPPC | LNGSHARE | |
|---|---|---|---|---|
| Mean | 1.328 | −3.848 | 8.041 | 4.027 |
| Maximum | 2.027 | −2.801 | 8.712 | 4.208 |
| Minimum | 1.010 | −4.727 | 7.119 | 3.693 |
| Std. Dev. | 0.252 | 0.685 | 0.606 | 0.161 |
| Variation of coefficient | 18.943 | 17.790 | 7.534 | 3.989 |
| Observations | 30 | 30 | 30 | 30 |
Table 2.
Unit root test results.
| ADF | PP | KPSS | |||||
|---|---|---|---|---|---|---|---|
| Level | 1st Difference | Level | 1st Difference | Level | 1st Difference | ||
| Intercept | LCOPC | −3.7146 *** | −3.283 *** | −3.6575 *** | −3.283 *** | 0.626 | 0.1480 *** |
| LGDPPC | −1.718 | −1.590 | −0.742 | −1.834 | 2.622 | 0.192 *** | |
| LENINT | −0.992 | −2.624 * | −0.679 | −2.655 * | 0.626 | 0.148 *** | |
| LNGSHARE | −1.502 | −6.016 *** | −1.445 | −6.006 *** | 0.451 | 0.152 *** | |
| Intercept and trend | LCOPC | −2.849 | −4.008 *** | −2.190 | −4.020 *** | 0.153 | 0.084 *** |
| LGDPPC | −5.346 *** | −2.972 | −2.556 | −1.803 | 0.131 * | 0.136 * | |
| LENINT | −2.412 | −2.564 | −1.783 | −2.536 | 0.100 *** | 0.148 * | |
| LNGSHARE | −2.830 | −6.022 *** | −2.795 | −6.010 *** | 0.094 *** | 0.113 *** | |
Notes: 2 is taken as a maximum lag and optimal lag is chosen based on SIC; ***, * stands for rejection of null hypothesis at 1% and 10% significance level, respectively Null hypothesis for ADF and PP test is that “the series has a unit root.”, whereas KPSS test takes “stationary” as a null hypothesis.
Table 3.
Cointegration tests’ results.
| Hansen Instability * | Park Added Variables * | Engle–Granger | Phillips–Oularies | ARDLBT | ||||||
|---|---|---|---|---|---|---|---|---|---|---|
| Lc Statistic | Prob. | Test Value | p-Value | z-Statistic | Prob. * | Tau-Statistic Value | Prob. | F-Stat | Critical Values | |
| 0.109671 | >0.2 | 0.696955 | (0.4038) | −26.30617 | 0.0200 | −4.795443 | 0.0634 | 183.2534 | 10% | 3.586 |
| 5% | 4.306 | |||||||||
| 1% | 5.966 | |||||||||
* Hansen instability and PAV tests assumes for null hypothesis as series are cointegrated.
Table 4.
Long-run estimation results.
| Dependent Variable: Per Capita Carbon Dioxide Emission (LCOPC) | ||||
|---|---|---|---|---|
| ARDL | DOLS | FMOLS | STSM | |
| LGDPPC | 0.979 *** | 0.979 *** | 0.979 *** | 1.016 *** |
| LENINT | 1.022 *** | 1.021 *** | 1.021 *** | 1.007 *** |
| LNGSHARE | −0.136 *** | −0.143 *** | −0.148 *** | −0.079 to −0.090 *** |
***, stands for rejection of null hypothesis at 1% significance level, respectively. Constant term is included in all specifications.
Publisher’s Note: MDPI stays neutral with regard to jurisdictional claims in published maps and institutional affiliations. |
© 2021 by the author. Licensee MDPI, Basel, Switzerland. This article is an open access article distributed under the terms and conditions of the Creative Commons Attribution (CC BY) license (https://creativecommons.org/licenses/by/4.0/).
Share and Cite
MDPI and ACS Style
Gurbanov, S. Role of Natural Gas Consumption in the Reduction of CO2 Emissions: Case of Azerbaijan. Energies 2021, 14, 7695. https://doi.org/10.3390/en14227695
AMA Style
Gurbanov S. Role of Natural Gas Consumption in the Reduction of CO2 Emissions: Case of Azerbaijan. Energies. 2021; 14(22):7695. https://doi.org/10.3390/en14227695
Chicago/Turabian StyleGurbanov, Sarvar. 2021. "Role of Natural Gas Consumption in the Reduction of CO2 Emissions: Case of Azerbaijan" Energies 14, no. 22: 7695. https://doi.org/10.3390/en14227695
Note that from the first issue of 2016, this journal uses article numbers instead of page numbers. See further details here.