Article

Influence of Photovoltaic Development on Decarbonization of Power Generation—Example of Poland

by
Grzegorz Lew
1,*,
Beata Sadowska
2,
Katarzyna Chudy-Laskowska
3,
Grzegorz Zimon
1,* and
Magdalena Wójcik-Jurkiewicz
4
1
Department of Finance, Banking and Accountancy, Faculty of Management, Rzeszow University of Technology, 35-959 Rzeszow, Poland
2
Department of Accounting, Faculty of Economics, Finance and Management, University of Szczecin, 70-453 Szczecin, Poland
3
Department of Quantitative Methods, Faculty of Management, Rzeszow University of Technology, 35-959 Rzeszow, Poland
4
Department of Accounting, Institute of Management, College of Management Sciences and Quality, Cracow University of Economics, 31-510 Kraków, Poland
*
Authors to whom correspondence should be addressed.
Energies 2021, 14(22), 7819; https://doi.org/10.3390/en14227819
Submission received: 5 October 2021 / Revised: 17 November 2021 / Accepted: 18 November 2021 / Published: 22 November 2021
(This article belongs to the Collection Feature Papers in Energy, Environment and Well-Being)

Abstract

:
Climate change is becoming a global problem. In many countries, actions are taken with the main aim of reducing CO2 emissions. The main action, especially in developed countries, is decarbonization. The European Union has become one of the organizations that plays a leading role in decarbonization of the economy. For this reason, renewable energy sources are being intensively developed in the EU countries. Solar energy with the use of PV installations is developing the fastest. Poland is one of the European leaders in photovoltaic development, and according to estimates for 2021–2025, it will continue to be. The aim of this study was to find out the opinions of people toward actions related to the decarbonization policy in Poland. These opinions were obtained through the prism of respondents’ attitudes toward energy produced by means of PV micro-installations. A questionnaire survey was used in this research. The survey was conducted using the CAWI (Computer-Assisted Web Interview) technique. To analyze the results of the study, a Kruskal–Wallis ANOVA test and U–Mann Whitney test were used. Responses were obtained from 633 people. The results obtained from the survey allowed us to draw conclusions, which include the following: (1) a lack of general conviction of respondents about the effectiveness of Poland’s decarbonization policy on reducing global CO2 emissions, especially among those who show a higher willingness to use PV installations, (2) the willingness to use PV installations is motivated by economic rather than environmental benefits, (3) the need for more widespread public campaigns aimed at promoting the benefits of decarbonization and renewable energy sources, and (4) the finding that the respondents’ region of residence (with a different degree of insolation) mattered for the willingness to use PV installations.

1. Introduction

As a result of globalization processes and socio-economic development, activities to improve living conditions are increasing in many countries around the world. These activities are important factors that increase the demand for electricity globally [1,2,3,4,5,6,7,8]. Growing awareness of environmental and public health hazards [9,10,11,12] promotes the growing interest in renewable energy sources and decarbonization processes [13,14]. The share of renewable energy sources in gross final energy consumption was 20% in the European Union and 15% in Poland (Figure 1).
In Poland, coal is still the main source of electricity production. For this reason, the main objective of the decarbonization process is to reduce both the use and extraction of coal. Alternative energy sources are abundant; however, only those with low or zero emissions are relevant. For Poland, the decarbonization process is a unique challenge, as more than 80% of electricity is produced from coal or lignite (Figure 2).
The use of coal and other fossil fuels contributes to environmental degradation and adversely affects climate change. These impacts promote the development of a low-carbon economy [17,18,19,20,21,22,23,24]. In December 2019, the European Commission announced a communication called the European Green Deal (EGD), which is a plan to build a sustainable economy for European Union countries based on the challenges of combating climate and environmental change [25,26,27]. The EGD aims to reduce carbon emissions by 55% by 2030 and achieve climate neutrality by 2050 [28]. Currently, the fastest growing source of renewable energy is solar energy generation. Installed renewable energy capacity increased by over 256 gigawatts (GW) during the pandemic (2020–2021), which is the largest increase on record beginning in 2012. The net gain in renewable energy capacity outpaced the growth in capacity from fossil fuels and nuclear combined. China again leads the world in renewables, installing nearly half of all global installations in 2020, and it leads the global markets for concentrating solar thermal power (CSP), hydropower, solar PV, and wind power.
China added nearly 117 GW of renewable energy capacity in 2020 while injecting more renewable energy capacity into the grid in 2020 than the entire world did in 2013 and nearly doubling its capacity by 2019. Renewable energy has reached a record share—estimated at 29%—in the global energy mix [29]. Despite this progress, renewable energy development still faces challenges in achieving a larger share globally, which is in part due to continued investment in fossil fuel and nuclear-generating capacity.
This significant growth was driven not only by China but also by the United States and Vietnam. Favorable economic conditions in Vietnam boosted interest in distributed rooftop PV systems. In 2020, the growth in this type of solution’s market share was mainly due to a surge in installations prior to the removal of preferential tariffs in the country. Australia and Germany also saw significant growth in installed PV capacity as homeowners invested in retrofitting during the pandemic. In 2020, South Australia achieved one of the highest levels of solar generation in the world. The state’s power system became the first in the world where rooftop solar PV effectively eliminates grid electricity demand [29].
The share of installed PV solar panels in 2020 among the top 10 countries in this regard is shown in Figure 3.
In many countries, additional financial benefits that increase the attractiveness of investment in photovoltaics determine the dynamic development of solar energy production [31]. One of the breakthrough moments for the development of photovoltaics was the support introduced by European Union countries. Individual countries began to encourage investors to install photovoltaic systems by setting increasingly higher purchase prices for energy from this source or preferential treatment for prosumers using solar panels. This support was called the Feed-In Tariff (FIT). Regulations began to appear in various EU countries at very similar times. It is estimated that in the world, for the purpose of encouraging prosumers to invest in renewable energy sources, FIT is applied by about 70 countries, including the majority of the European Union [32].
The production of photovoltaic panels also entails an increased demand for silicon, solar glass, and silver, and in most countries, end-of-life recycling of panels—as a way to recover these resources and minimize the associated environmental impact—is only beginning to gain traction [29].
Projections for the growth of photovoltaics worldwide are ambitious, but the development to date indicates that they are achievable. Depending on the scenario, it is assumed that growth to 2025 could be two to three times that of 2020 (Figure 4).
The economic calculation also strongly supports the development of solar energy, as in recent years, the cost of obtaining one MWh from PV panels has been decreasing very dynamically, so that in 2020, it turned out to be the leader in the lowest cost among all alternative energy sources, not only renewable ones (Figure 5).
When analyzing the cost of one MWh of electricity obtained from PV, one may notice that it has been lower than the cost of producing electricity from fossil fuels and nuclear energy for several years now. At present, the cost of electricity obtained from solar energy is also lower than that of wind energy, and with such dynamic development, it should be expected that this cost will continue to decline. The analysis shown in Figure 5, which was conducted by the US investment bank Lazard [33], indicates that the difference with the cost of conventional power generation technologies will widen in favor of PV panels, especially as coal, gas, and nuclear power prices have increased recently.
For the reasons outlined above, the topic of using PV micro-installations to produce electricity is a timely and interesting topic in many ways. Many researchers are conducting research on the cost-effectiveness of using PV micro-installations [34,35] and the feasibility of their use in different conditions [36,37]. These studies are conducted in different countries, e.g., Sweden, Italy, and Switzerland, which take into account the specificities of these countries [38,39,40].
The authors conducted their study in Poland. Poland is a country that has a long tradition in coal mining and its applications in various industries, including electricity production. Therefore, the conducted research on the example of a society raised on the “culture of coal” fills a certain research gap concerning the process of decarbonization in the world. The society has always believed and still believes that it is the best source of obtaining energy.
The aim of this study was to find out the opinions of people toward actions related to the decarbonization policy in Poland. These opinions were obtained through the prism of respondents’ attitudes toward energy produced by means of PV micro-installations.
There has already been some research on public attitudes toward the implementation of the decarbonization policy in Poland [41]. Respondents in the survey expressed their opinion on what methods, or more specifically what renewable energy sources, can successfully replace the existing fossil energy sources. They pointed to PV installations as the most available source of renewable energy. The popularity of PV installations in the research results of other researchers led to an interesting research question: What is the opinion of people who are already willing to use PV installations about the decarbonization policy in Poland? This research question determined the research tool development process and identified an important research gap.
Analyzing the determinants of decarbonization in Poland [42], the effects of specific industries on the environment in Poland [43], with particular reference to the south-eastern region [44], and decarbonization issues in other countries [45,46,47], we determined the structure of the survey questionnaire.
A survey questionnaire was used as a research tool, which is one of the recognized methods of surveying respondents’ opinions in social sciences and also related to energy [48]. The opinions were obtained through the prism of the respondents’ attitudes toward energy produced by means of PV micro-installations. This source of energy was chosen because it is the most common and easily accessible source of renewable energy for “ordinary” residents.
The first section presents the assumptions for the introduction of electricity generation from renewable energy sources, the structure of renewable energy sources in Poland, and the development of photovoltaics in the world. The second section, which is divided into three sub-sections, presents the development of photovoltaics in Poland and the research area. It also discusses the research methods used to conduct (questionnaire survey) and develop the research results (Kruskal–Wallis ANOVA test and U Mann–Whitney test). In the last point of the second section, based on the structure of the survey questionnaire, the statistics of answers to particular survey questions are presented. The third section presents and discusses the results of the study that showed statistical significance. In the fourth section, against the background of various threats and assumptions of photovoltaic development in Poland in the coming years, the main conclusions of the study are presented. Finally, the limitations of the study and directions of future research interests of the authors are indicated.

2. Materials and Methods

2.1. Case of Poland

Solar Power Europe forecasts a dynamic growth of installed PV capacity in the coming years. The analysis shows that the Polish photovoltaic sector will develop at an average annual growth rate of 31% until 2025, which will give it third place in the world. Table 1 shows Poland’s place among the 20 countries with the highest PV growth rate.
For the past two years, photovoltaics in Poland have been developing extremely fast. According to the Polish Power Grid [16], the installed PV capacity at the end of 2020 was 3935 MW, which means an increase of 2463 MW compared to 2019. The installed PV capacity at the end of June 2021 was 5232 MW. This is a high growth rate; however, it will probably be slowed down by changing the rules of subsidizing PV installations by the state administration in Poland. These changes have been announced to take place as of 1 January 2022.
The highest growth in installed PV is observed in micro-installations (<10 kW) with 500 MW of capacity added in the first quarter of 2021. Prosumers using micro-installations use 77% of the installed PV capacity in Poland (at the end of 2020) [49]. Such a large share of prosumers using PV micro-installations was an important rationale to conduct the study in the group of potential users of this type of installation. Another important variable was to conduct the study in areas with varying degrees of sunshine (Figure 6) to see if the region of residence of the respondents mattered.
Undoubtedly, the increase in the popularity of PV micro-installations is influenced by the government program “Mój Prąd”, which, thanks to the EU funds, provides subsidies for investments in independent energy sources for households—in 2021, it is about 660 Euro and tax benefits.

2.2. Methods Used

The research tool was a survey questionnaire, and the survey was conducted using the CAWI (Computer-Assisted Web Interview) technique. The survey was anonymous. The survey was partial, and the research sample was selected using the snowball method in order to reach out to people living in the study area. The survey questionnaire was first sent to a few dozen people with a request to recruit more people for the study. The questionnaire was filled in by 633 people in total. The subject of this survey was to find out the opinions of people toward actions related to decarbonization policy in Poland. In this section, the authors focused specifically on determining the attitudes toward the decarbonization process of respondents who expressed a willingness to use PV installations. The survey form consisted of three parts. In the first part, socio-demographic information was collected. The second part consisted of semantic terms characterizing the basic possibilities of the decarbonization process. Respondents were given the opportunity to select the answers that, in their opinion, have the greatest potential to successfully accomplish the decarbonization process [51]. In the third section, respondents evaluated a number of theses. A five-point, bipolar Likert scale was used for evaluation, which included a neutral mean value [52]. In the scale used, a value of 1 meant a strongly negative opinion and 4 meant a strongly positive opinion.
These dependencies were analyzed by a Kruskal–Wallis ANOVA test and U Mann–Whitney test. These are nonparametric tests, and they do not require the fulfillment of the assumptions concerning the normal distribution of the quantitative variable or the homogeneity of variance in the studied groups. The U Mann–Whitney test was used when a quality variable had two categories, and a Kruskal–Wallis ANOVA test was used when a quality variable had more than two categories. The study was conducted at an α = 0.05 level of significance [53,54]. It was tested whether the assessment of intention and frequency of use of photovoltaics is associated and how with the opinions of the respondents regarding the decarbonization process.

2.3. Materials

The study was conducted in the period January–March 2021. The spatial scope of the social survey included people living primarily in two regions of Poland: the first in southeastern Poland (Podkarpackie, Małopolskie) and the second in northwestern Poland (Zachodniopomorskie). This was due to the different climatic conditions that prevail in these regions, with particular emphasis on the differences in insolation of these regions.
We selected six key industries for our study. When selecting industries for the study, we were guided primarily by their importance in the consumption of fossil fuels, including mining, energy, logistics, and the chemical industry (e.g., fertilizers), and their significance for the Polish economy: the construction industry, or the impact of the industry on the overall assessment of quality of life, rather than just the objective significance of human health or political pressure exerted by citizens who care about health care: the medical industry.
A detailed summary is presented in Table 2.
Since we used the snowball method to recruit new respondents, we included in the research also people from other regions, but there were only a few of them.

3. Results

On the basis of our study, we have established relationships between the assessment of willingness to use PV installations and respondents’ opinions on various issues related to the decarbonization process in Poland. The relationships (those that showed statistical significance) are presented in Table 3. In the following part of the study, those relationships that show a statistically significant relationship p < α were analyzed. These relationships were analyzed by the Kruskal–Wallis ANOVA test and U Mann–Whitney test. We assumed that when p < 0.05, there is a statistically significant relationship (indicated by *); when p < 0.01, there is a highly significant relationship (**); when p < 0.001, there is a very high statistically significant relationship (***). We presented the presentation of these data in the case of the data set of our study using the “box-and-whiskers” plot because with this distribution of data, it best represents the results.
The analysis of the responses of the respondents who express their willingness to use PV installations shows that statistically significant relationships are shown only in some of their responses. These correlations were analyzed, which are shown in the following figures.
Regarding the distribution of answers to the question of whether the decarbonization policy in Poland will contribute to the reduction of global CO2 emissions, 368 respondents answered in the affirmative, 107 thought not, and 158 had no opinion on the matter.
The responses of those who expressed willingness to use PV micro-installations were significantly related (*) to opinions on whether the decarbonization policy in Poland would reduce global CO2 emissions or not (p < α (p = 0.0409)).
The lack of association of decarbonization processes in Poland with the reduction of global CO2 emissions is mainly demonstrated by those who assess the willingness to use PV installations at a higher level (Figure 7).
Those with the highest willingness to use PV installations (mean 2.41) believe that the current decarbonization policy pursued in Poland will not contribute to reducing CO2 emissions. The chart also shows that the opinions of these people are the most varied.
Those who rate the willingness to use photovoltaics as slightly lower (mean score of 2.18) indicate that Poland’s decarbonization policy is related to reducing global CO2 emissions, but their opinions are more homogeneous. The group of people who rate their willingness to use PV the lowest (mean score of 2.08) have no opinion on the association of Poland’s decarbonization policy actions with reducing global CO2 emissions.
The authors of the study expected that those willing to use PV installations would choose PV panels for pro-environmental reasons and because they cared about environmental issues and a smooth decarbonization process. However, this does not seem to be the case. The study can be interpreted in such a way that the higher willingness to use PV systems is due to economic motives aimed at reducing the financial burden on households.
Respondents also indicated which industries, in their view, are most vulnerable to decarbonization processes and cited energy and mining as the most sensitive (Figure 8).
These indications were to be expected, since Poland has a strongly developed mining industry, both for hard coal and lignite. The power industry connected with the generation of electricity and system heat is also predominantly dependent on coal.
Statistical relationships between the willingness to use PV installations and the question regarding the industries that are most vulnerable to the impact of decarbonization policies occurred for three industries: mining, logistics, and the medical industry. For this reason, they were more closely examined.
Those who are more likely to use PV installations (p < α (p = 0.0173) (*), the average willingness to use score is 2.25 and opinions are mostly homogeneous) identified the mining industry (518 opinions) (Figure 9) as the most vulnerable industry to the impact of decarbonization policies. In contrast, among those who are less willing to use PV installations (p < α (p = 0.0462) (*), the mean score of willingness to use PV installations is 2.06), the opinions on this topic in the surveyed group are quite diverse; they identified logistics (192 opinions) (Figure 10) as the industry most susceptible to the impact of decarbonization policy.
Those respondents who are less willing to use PV installations (p < α (p = 0.0306) (*)) also identified the medical industry (50 opinions) (Figure 11) as the most vulnerable to the impact of decarbonization policies. The mean score of willingness to use PV installations is 1.92, and the responses of respondents in this group are very different.
The medical industry was selected for the study because of its key importance in creating a sense of security for respondents.
Summarizing the analysis of industries that are most impacted by decarbonization according to respondents, those who indicated mining (2.25) have the highest willingness to use photovoltaics, which is followed by those who indicated logistics (2.08) and last by those who chose the medical industry (1.92).
One of the questions answered by the respondents was how decarbonization policies can influence the course of socio-economic–environmental processes. The statistics of responses to this question are presented in Figure 12.
The study using the Kruskal–Wallis ANOVA test did not show a statistically significant relationship between the willingness to use PV installations and the indicated opinions on how decarbonization policies may affect the course of socio-economic–environmental processes, but the indication of these opinions is interesting in itself. Increases in energy prices (586 responses) and increases in fuel prices (421 responses) were to be expected; however, the response regarding increase in unemployment (422) is surprising. It is probable that such an opinion results from the prevailing narration in state media, which emphasizes—in particular—negative social effects of limiting coal extraction. On the other hand, the respondents’ opinion that investments will increase (this also means new jobs) and the use of public transport is positive.
During the survey, we also asked respondents what effects they expect from the implementation of decarbonization policies (Figure 13).
The authors expected the two most numerous responses (the survey confirmed the assumptions), but the responses regarding increased awareness (396) and changing consumer behavior (207) are responses that indicate the possibility of an increase in peoples’ desire to increase pro-environmental behavior.
The results of this study indicate the importance of social campaigns to promote pro-environmental attitudes and the need to raise public awareness of the consequences of the current consumption-based lifestyle.
The assessment of the willingness to use PV installations influences the opinions of respondents regarding the effects that decarbonization policies may bring. Those with a higher willingness to use PV installations (mean 2.24) indicated an increase in consumer awareness of pro-environmental activities (e.g., reducing energy consumption) p < α (p = 0.0219) (*) as an effect of decarbonization policies (Figure 14).
The assessment of willingness to use PV installations is related to the identification of the greatest barriers to decarbonization in transport in the case of lack of access to sources of investment financing p < α (p = 0.0018) (**) (Figure 15); people who are more willing to use PV installations indicated lack of access to sources of investment financing (mean 2.30), and the opinions in this group are more homogeneous than in the “others” group.
On the other hand, people who are less willing to use PV installations (p < α (p = 0.0459) (*), mean 2.13, and the variation of answers in this group is high) indicated a lack of interest in the topic of transport decarbonization as a barrier to transport decarbonization (Figure 16).
Indication of lack of access to funding sources as one of the main barriers to transport decarbonization should be interpreted as a lack of or insufficient financial support from the state in acquiring hybrid or electric transport modes.
Those who indicated a lower public willingness to use PV installations expressed a lack of interest in the topic of decarbonizing transportation. It can be concluded from this that the lack of interest in decarbonization means that many people have a low level of pro-environmental engagement. This is further evidence of the need for public campaigns that promote pro-environmental attitudes and raise public awareness on the consequences of the continued use of coal.
Willingness to use photovoltaics was related to the region where the respondents live p < α (p = 0.0344) (*). The highest willingness to use PV is shown by those living in the southeastern region (Podkarpacie—238 and Malopolska—89) with a mean score of 2.33 and the lowest by those living in the northwestern region (Zachodniopomorskie—233) with a mean score of 2.07. Those living in Podkarpacie have the most homogeneous opinions (opinion) on this topic, while those from the “others” group have the most diverse opinions. Willingness to use PV panels depending on the region is shown in Figure 17.
Willingness to use PV micro-installations also coincides with the level of insolation in Poland, as interviews conducted with some respondents show that only some of them are aware of the differences in insolation in the country. However, the location of Podkarpackie and Małopolskie regions in the most southern part of the country may suggest such a situation.

4. Discussion and Conclusions

The rapid development of photovoltaics in Poland is associated with several factors such as economic benefits, increased environmental awareness of the society, and a certain trend (fashion) among the middle class. However, our research shows that by far, the most important issue is the economic viability of investing in a PV micro-installation. The average annual electricity expenses of a household (four persons) in Poland are about 550 EUR (electricity consumption about 3000 kWh). On the other hand, the average cost of installing PV panels (with a capacity of 4000 kWp) is about 4400–5000 EUR. This means that assuming the use of the “Mój Prąd” program and deduction of the remaining investment value from the tax, the investment payback period varies from 6.5 to 8 years. Assuming also a manufacturer’s warranty of 25 years for PV panels and 10 or 15 years for the inverter, this investment is economically viable. The investment payback period may be shortened in the coming years due to rising electricity prices on global markets, especially in the European Union.
In Poland, a significant limitation to the development of photovoltaics is the electricity transmission grid, which has not been modernized for many years. For the reason that solar energy is produced during the daytime and its peak occurs during the midday hours, when the electricity consumption by households with PV micro-installations is relatively low, the surplus energy produced is transmitted to the grid. The power grids are not adapted to transmit such an amount of energy in such a short time, and this results in energy production limitations. This problem is particularly relevant for rural areas.
This problem is becoming serious in Poland because the government’s announcement of changes in the rules for subsidizing PV installations, changes in the rules for accounting for electricity production and consumption, and rising electricity prices have rapidly accelerated the number of investments in PV panels.
At the end of June 2021, the number of prosumers feeding electricity into the grid was 602,250 of which 602,021 were PV installations. Prosumers from PV installations doubled their electricity production during the year (Figure 18).
To illustrate the importance of electricity production from renewable energy sources, it should be mentioned that in June 2021, Polish power plants produced 13,684.5 GWh of electricity, of which 2074.3 GWh came from renewable energy sources (15%).
Wind has the largest share in the production of energy from renewable sources—695 GWh. Biogas plants produce the least—107.5 GWh. Photovoltaic power plants showed the highest dynamics of electricity production growth in June (a year ago in June, production was 235.6 GWh, while in June 2021, it was 633.3 GWh, i.e., an increase of 168.8%) [55].
In September 2020, the draft Energy Policy of Poland until 2040 was presented [56]. In the assumptions presented therein, the share of coal in the energy consumption structure is to decrease to 56% in 2030 (although, depending on the actions of the European Union and prices of CO2 emission allowances, it is estimated that this level may be even 37.5%). At the end of the planned period—that is, in 2040—the share of coal was set at 28%.
An alternative to coal combustion (both hard coal and lignite) will be renewable energy sources, which are to be used in all areas of the economy. According to the draft, in 2030, the share of RES in the energy consumption structure is to be at least 23%.
The project projected a significant increase in solar PV capacity to about 5–7 GW in 2030 by about 10–16 GW in 2040. The 2030 assumptions were already met in 2021 for reasons previously mentioned.
The change in the assumptions of the subsidy for PV installations will mean a change in the way electricity production and consumption are accounted for, as is the case e.g., in Germany. All electricity produced will be sold by the prosumer to an electricity trading company, and the electricity consumed will be purchased from that company. The price of selling electricity by prosumers is estimated to be three times lower than the price at which they will have to buy it. At present (2021), Poland has a system in place whereby the surplus electricity generated by PV systems is “stored” by the energy trading operator and, at times of shortage, collected from it. The operator gives back, free of charge, 80% of the surplus for installations < 10 kW and 70% for installations > 10 kW. It is estimated that this change will cause a decrease in interest in micro-installations (<10 kW), but the growth of larger PV installations should be stable. This is another interesting research topic that can be investigated once the new rules are in place.
Another important change that may affect the way the Polish society perceives the use of PV installations is the announcement of the necessity to use energy storage facilities with each PV installation. The need to invest in storage facilities will reduce the profitability of such investments.
In the context of the upcoming announced changes, the conclusions of our research are not optimistic, as the research shows that the main reason for investing in PV panels is financial incentives; this also applies to other pro-environmental activities such as changing central heating boilers from coal to low-emission ones and changing the mode of public transport from cars to public transport.
The lack of these incentives will certainly hinder the transition to renewable energy. Studies indicate that the society is slowly opening up to renewable energy [41,57,58,59,60,61,62,63]. However, in Poland, a big barrier is the attachment to coal [64,65]. Regions that depend on work in mines will never be in favor of changes toward decarbonization. It is hardly surprising, since the mining industry is the only professional group in Poland where the disastrous financial results of state-owned mining-related companies do not affect the increase in salary levels. However, in other regions, the society sees the need for changes [66,67]. In Poland, peaks in energy production from the sun are already a major problem for grid operators and will continue to be so. If appropriate storage facilities do not appear in Poland in the near future, operators will have to shut down some wind farms in situations where the sun will be blowing strongly for a longer period of time.
A survey of 633 respondents was conducted using a questionnaire to gauge respondents’ attitudes toward activities related to the decarbonization policy in Poland. These actions were examined through the prism of respondents’ willingness to use PV installations. The willingness to use PV installations was considered as an independent variable, and respondents’ opinions on other activities related to the decarbonization policy in Poland were examined against this variable.
In conclusion, the most important results of the survey conducted on 633 respondents include the following:
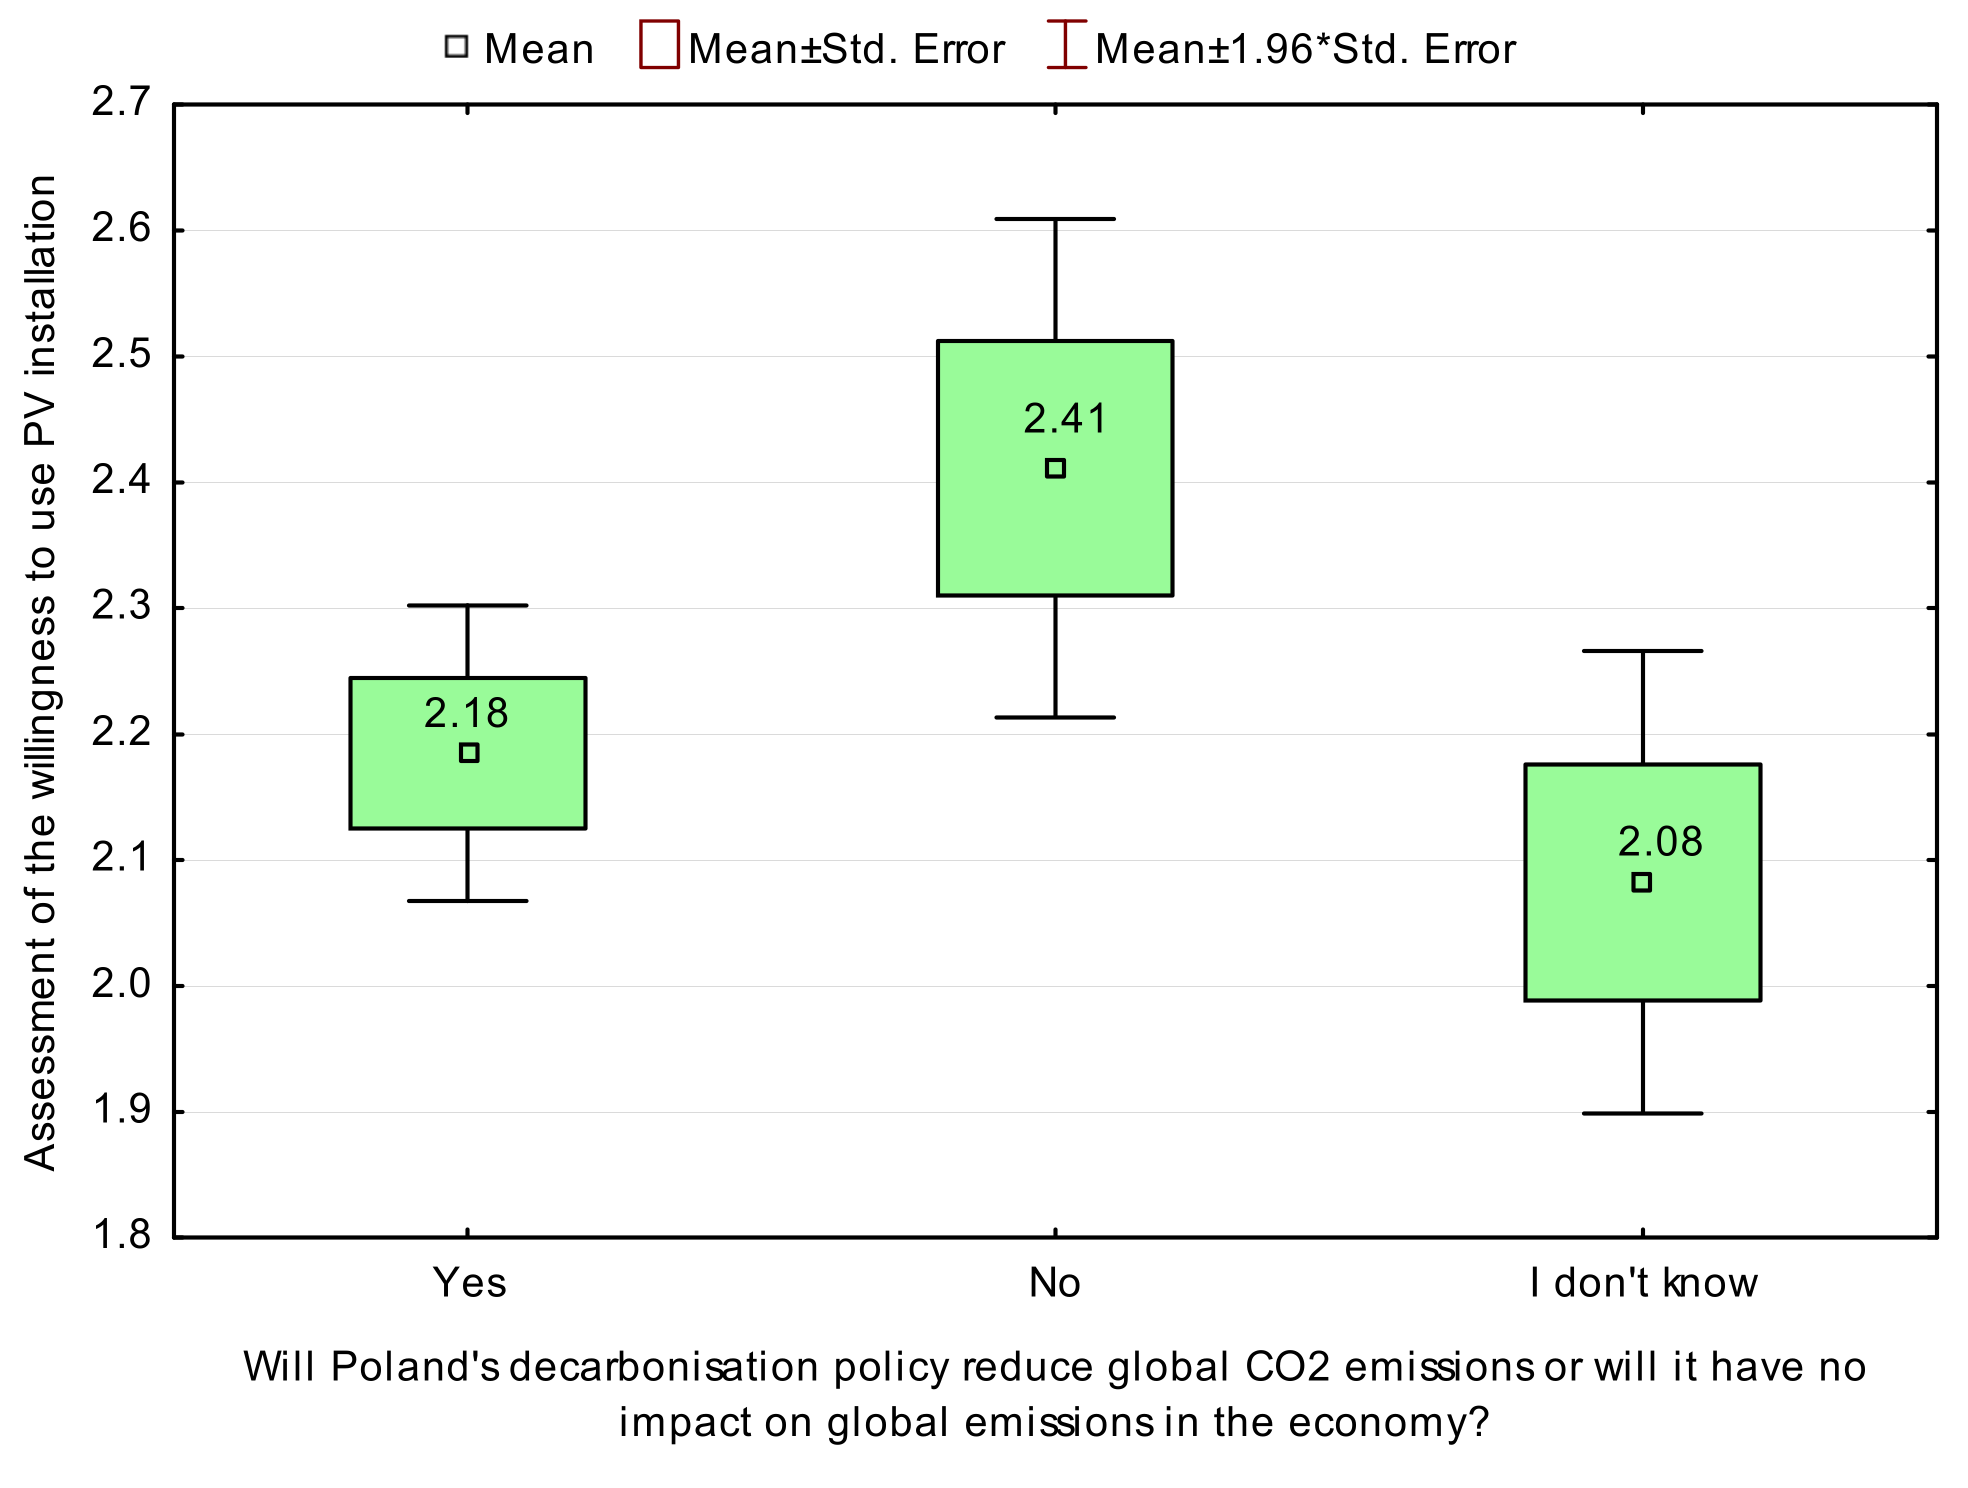
  • Respondents believe that the current decarbonization policy that is being pursued in Poland is likely to contribute to reducing global CO2 emissions. However, the opinion is not unequivocal—368 respondents positively assessed such a statement, 107 were against, and 158 had no opinion. A lack of opinion in the authors’ opinion should also be treated as a negative assessment. This result indicates that there is too little decarbonization activity in Poland and low trust in decision makers of decarbonization policy at the state level. It is also worrying that among those with a higher willingness to use PV installations, those who negatively assess the impact of Poland’s decarbonization policy on global CO2 emissions are in the majority;
  • Despite a higher willingness to use PV installations, respondents negatively assess the impact of decarbonization policies on global CO2 emissions. This can be interpreted as a lack of pro-environmental motivators to use PV installations. Economic effects should be considered as the main motivator for installing PV panels;
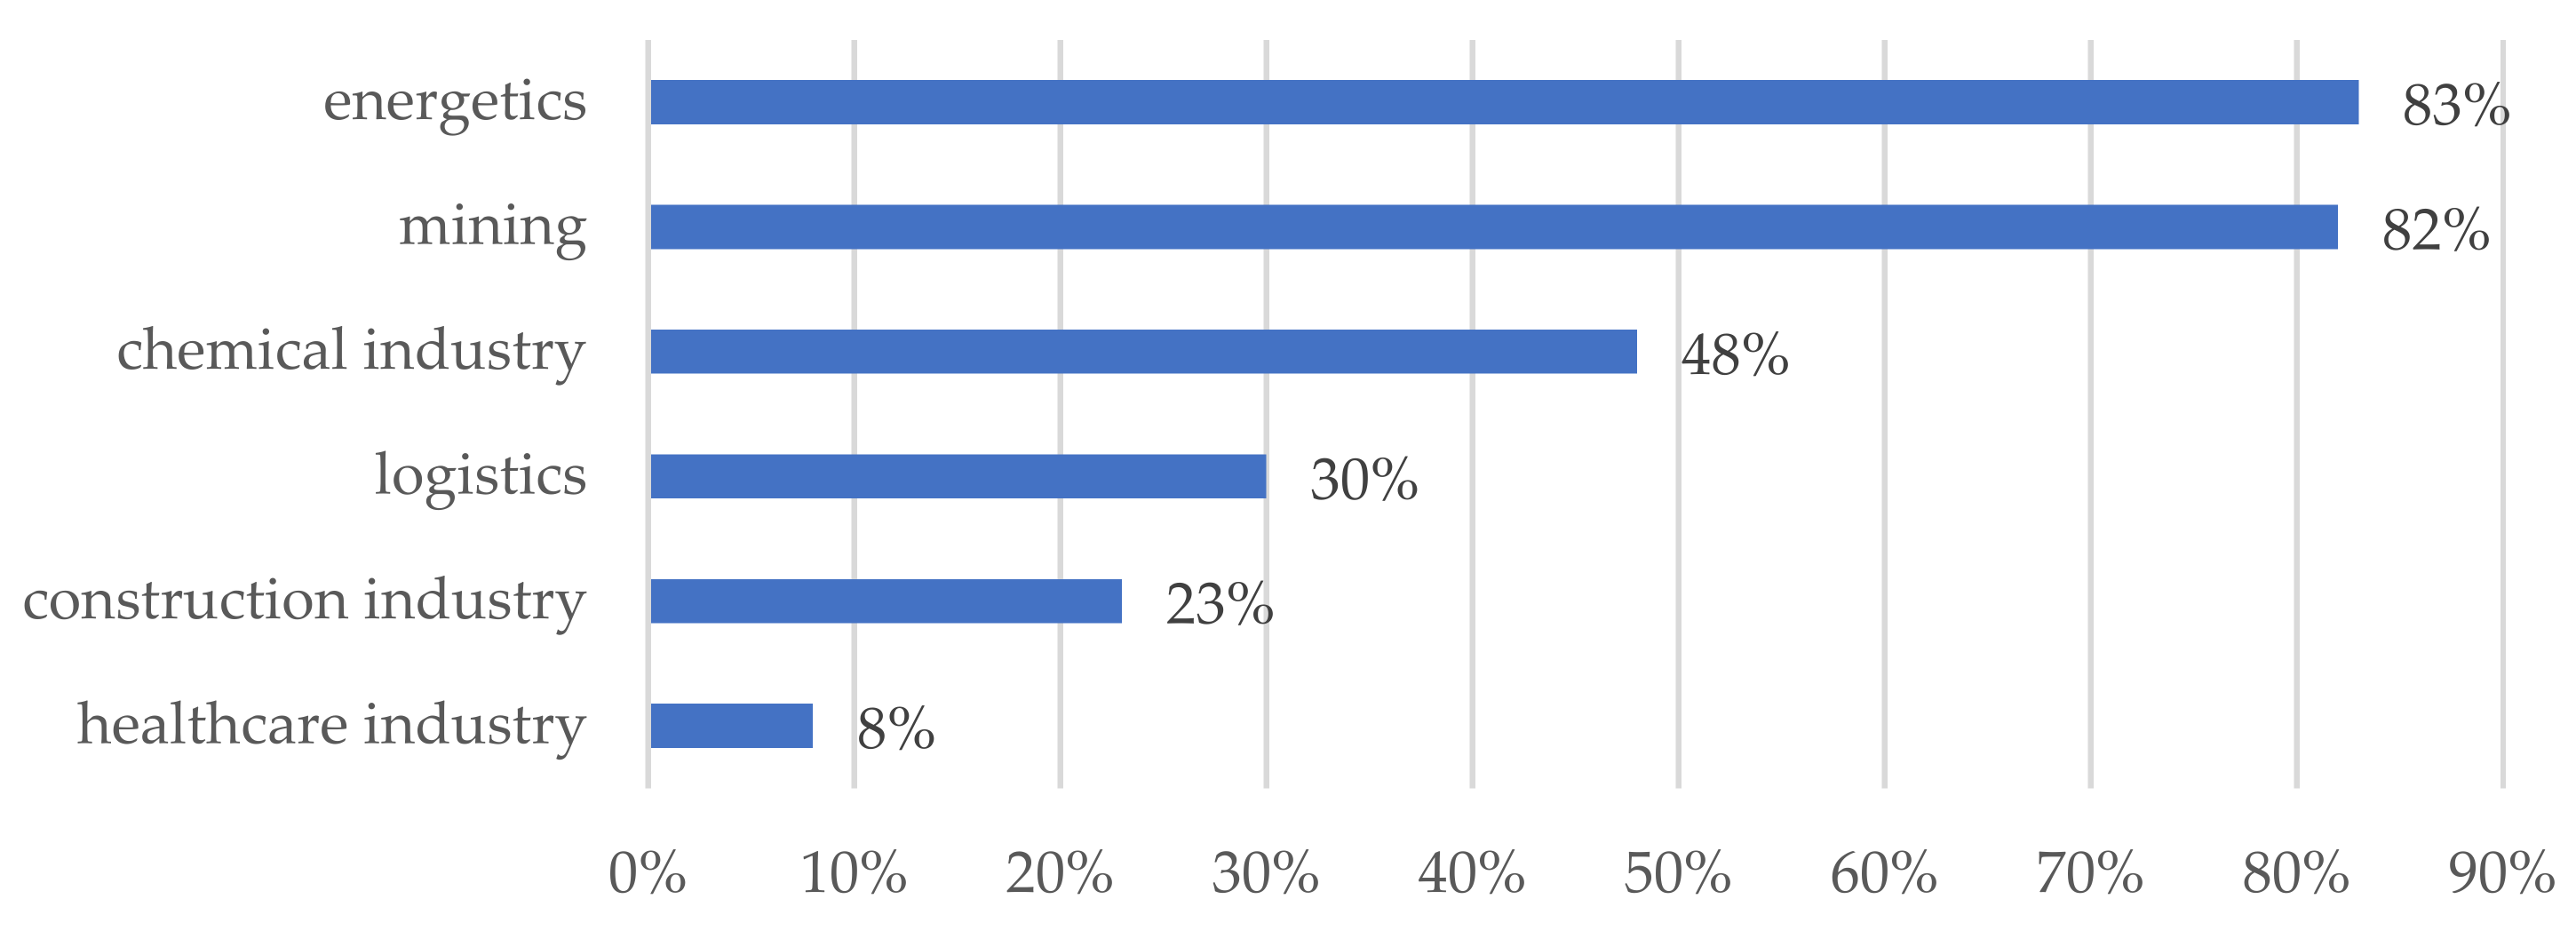
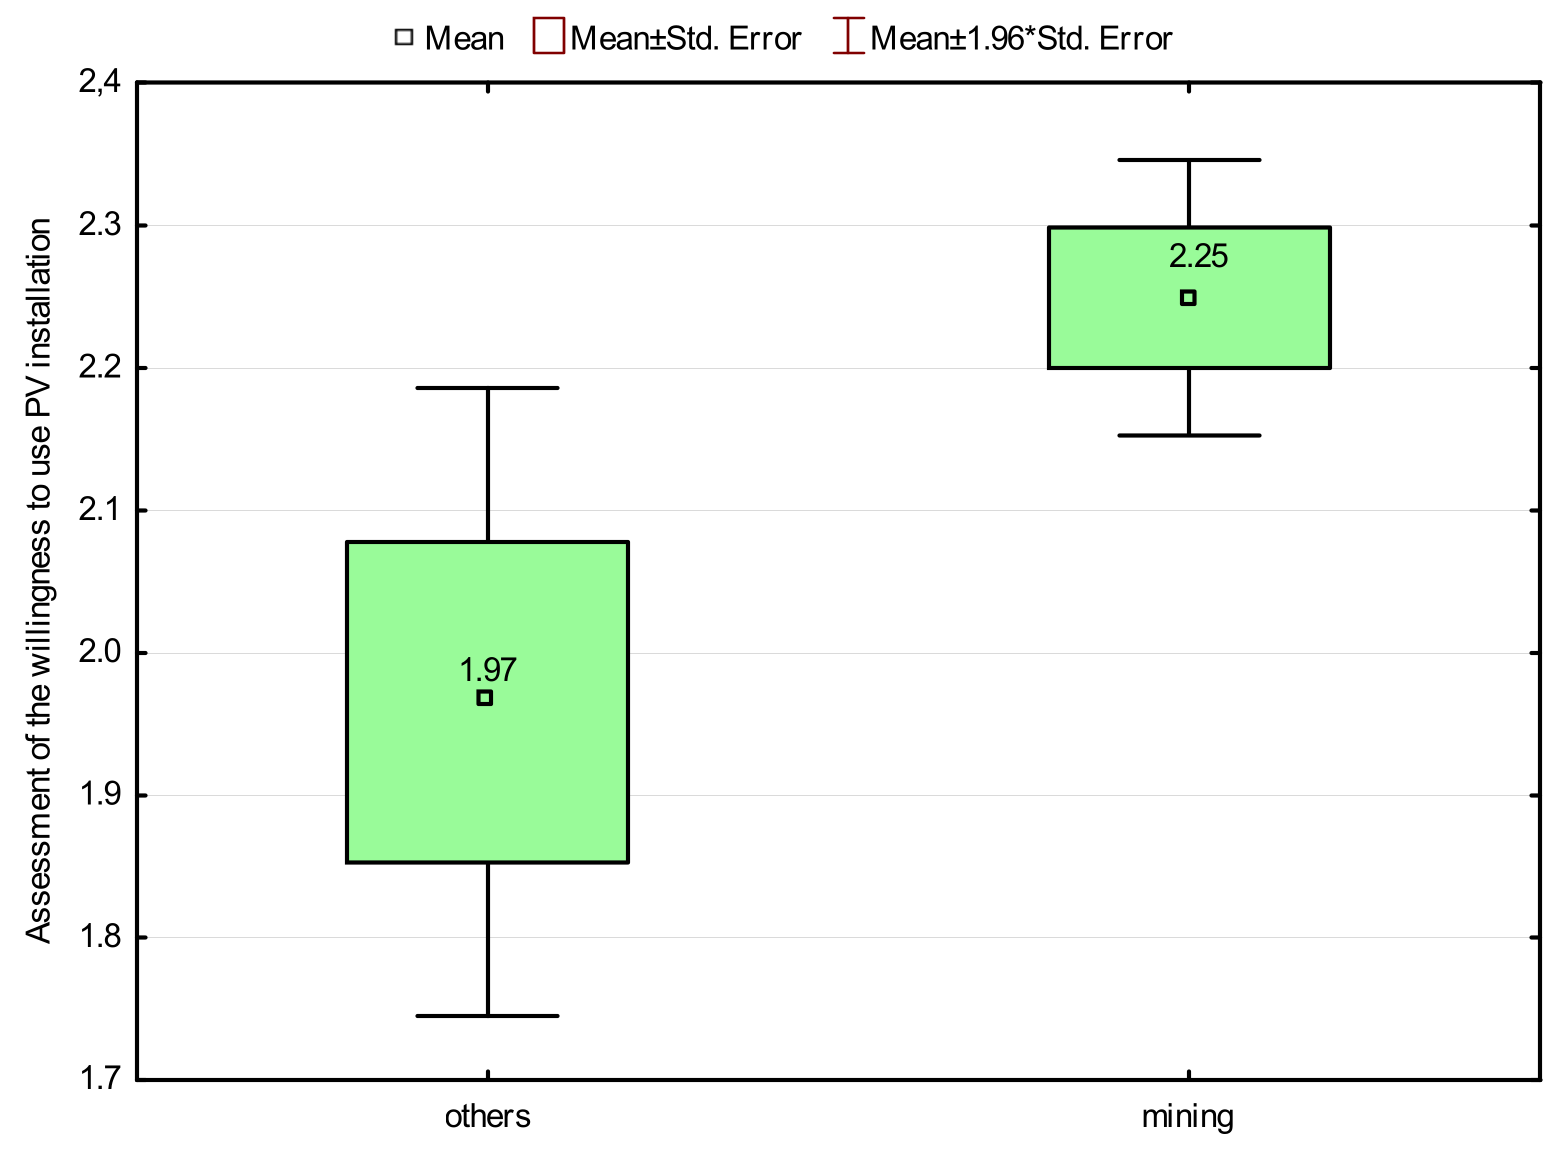
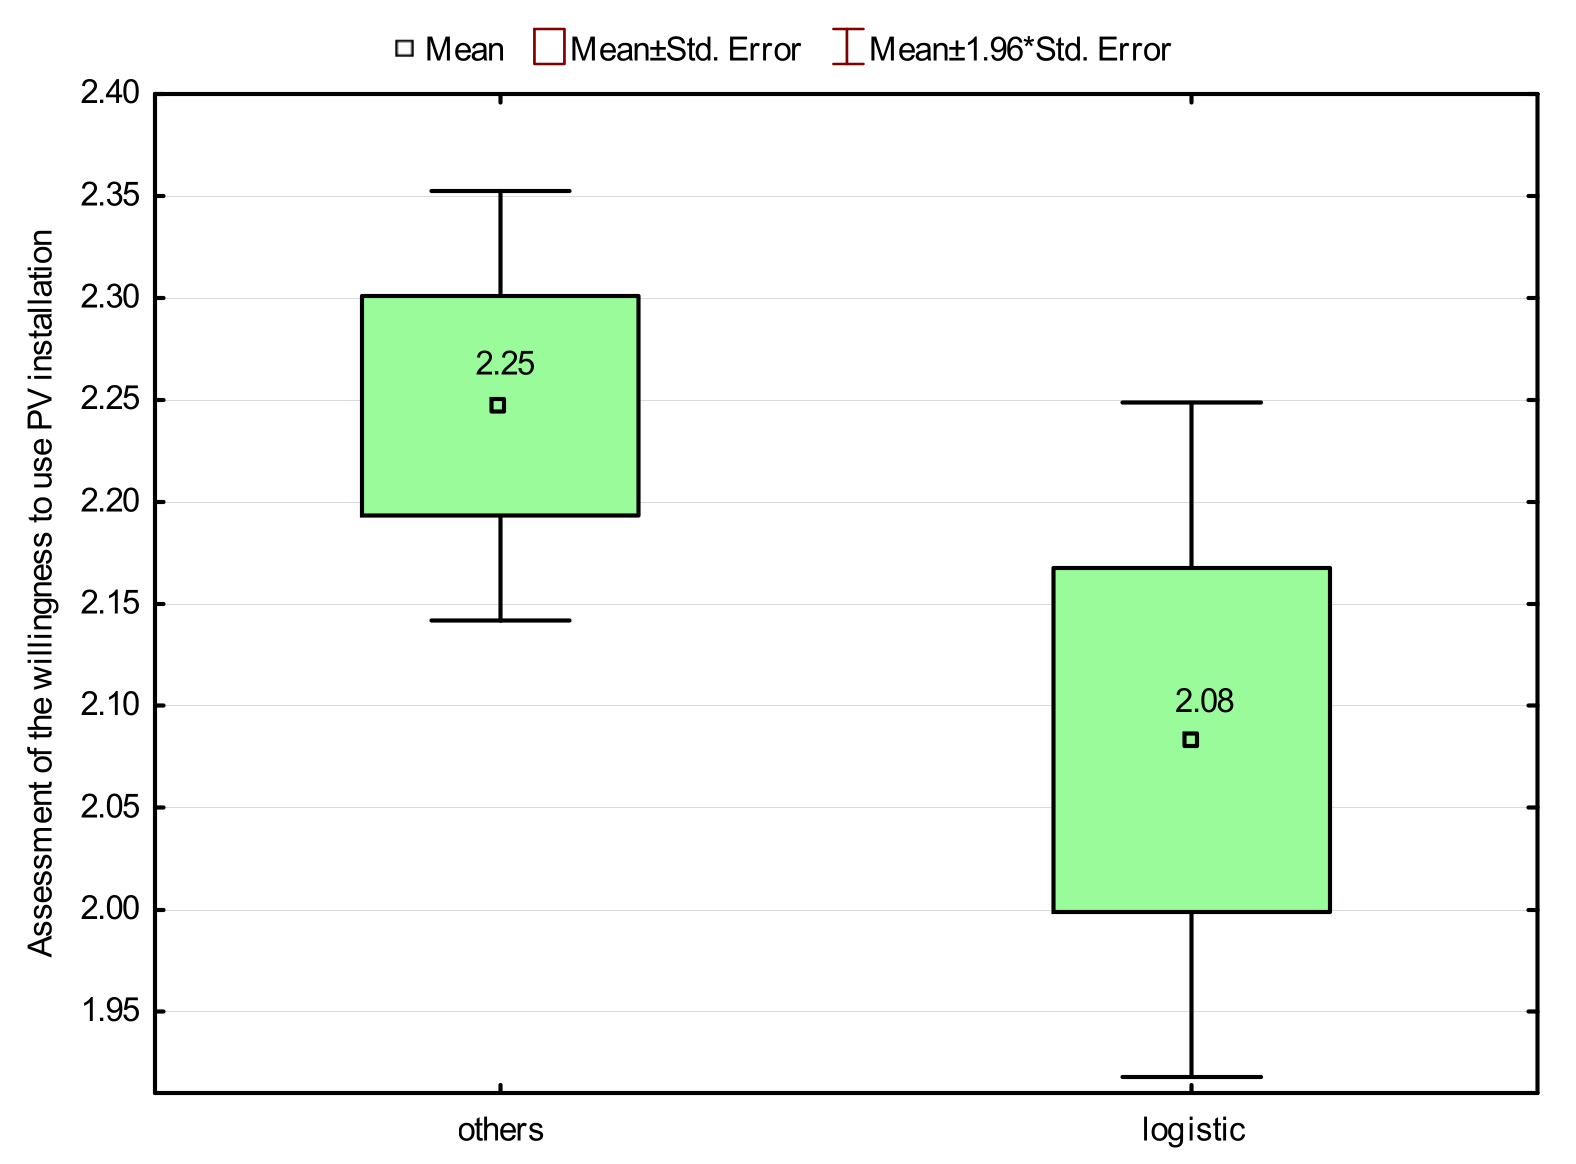
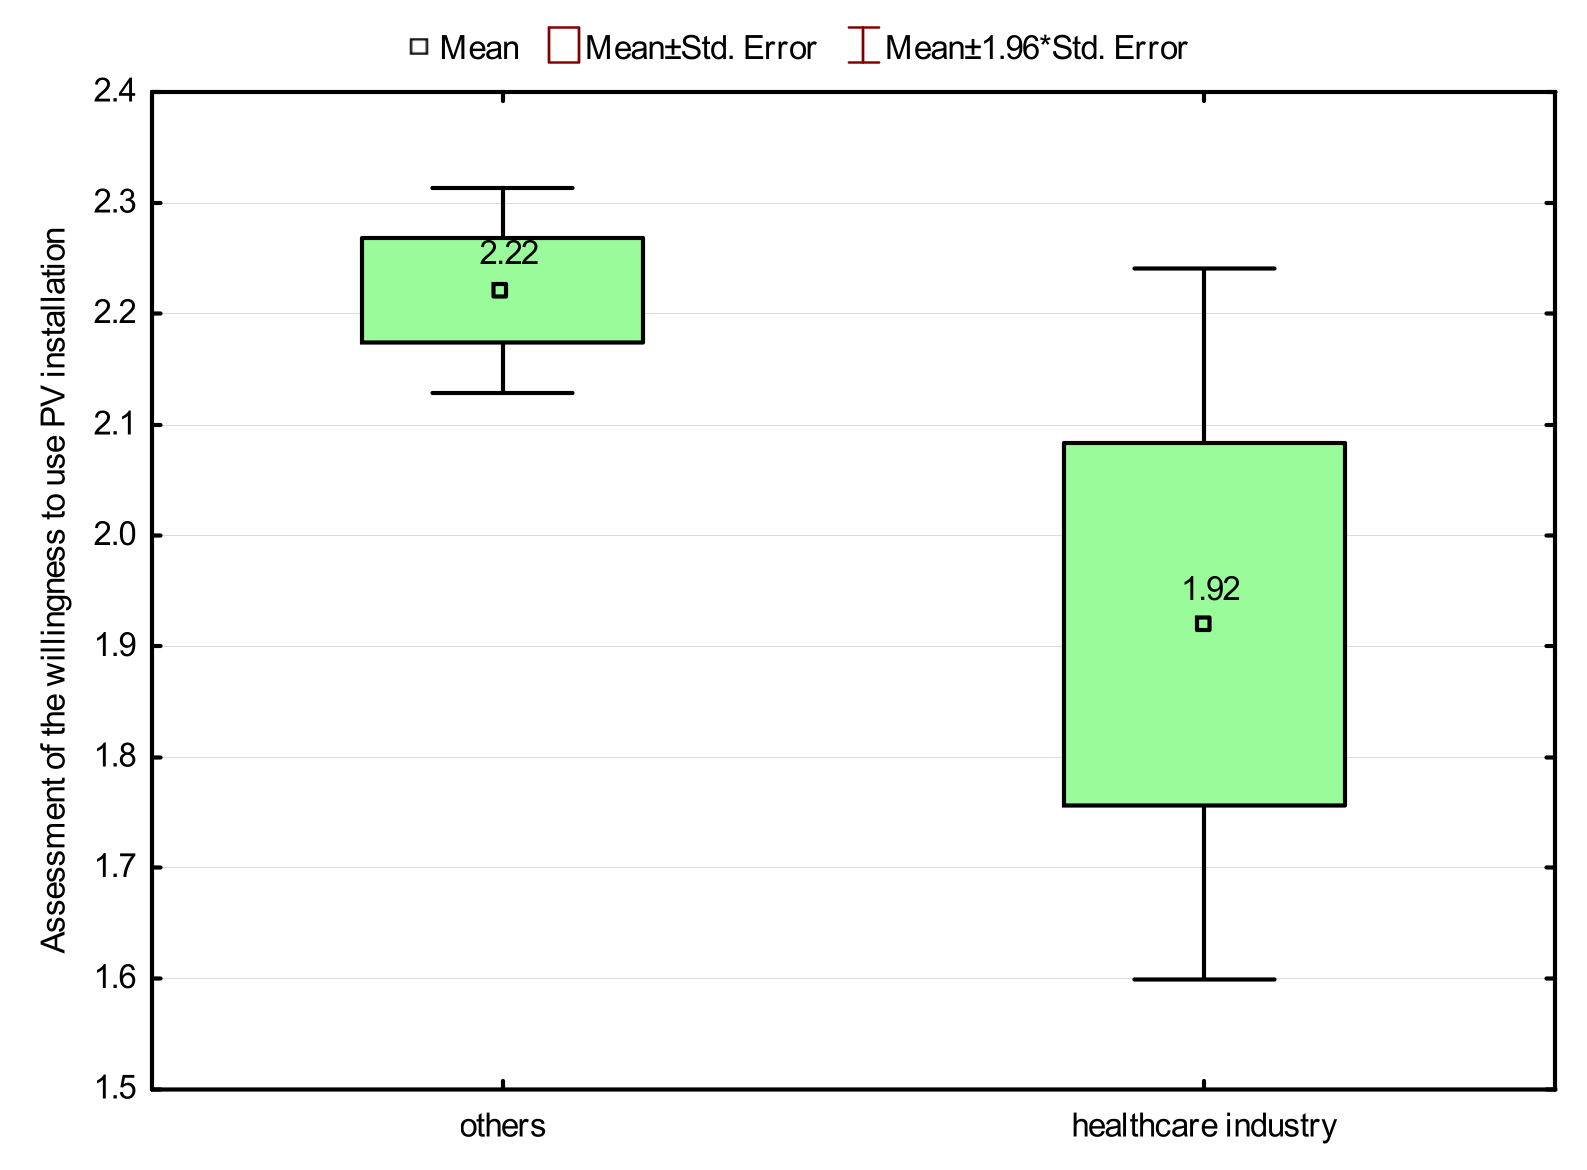
  • Respondents indicated the energy industry, mining, and chemical industry as the most susceptible to the decarbonization process, respectively, but those who are more inclined to use PV installations indicate mining as the most susceptible industry to decarbonization policies;
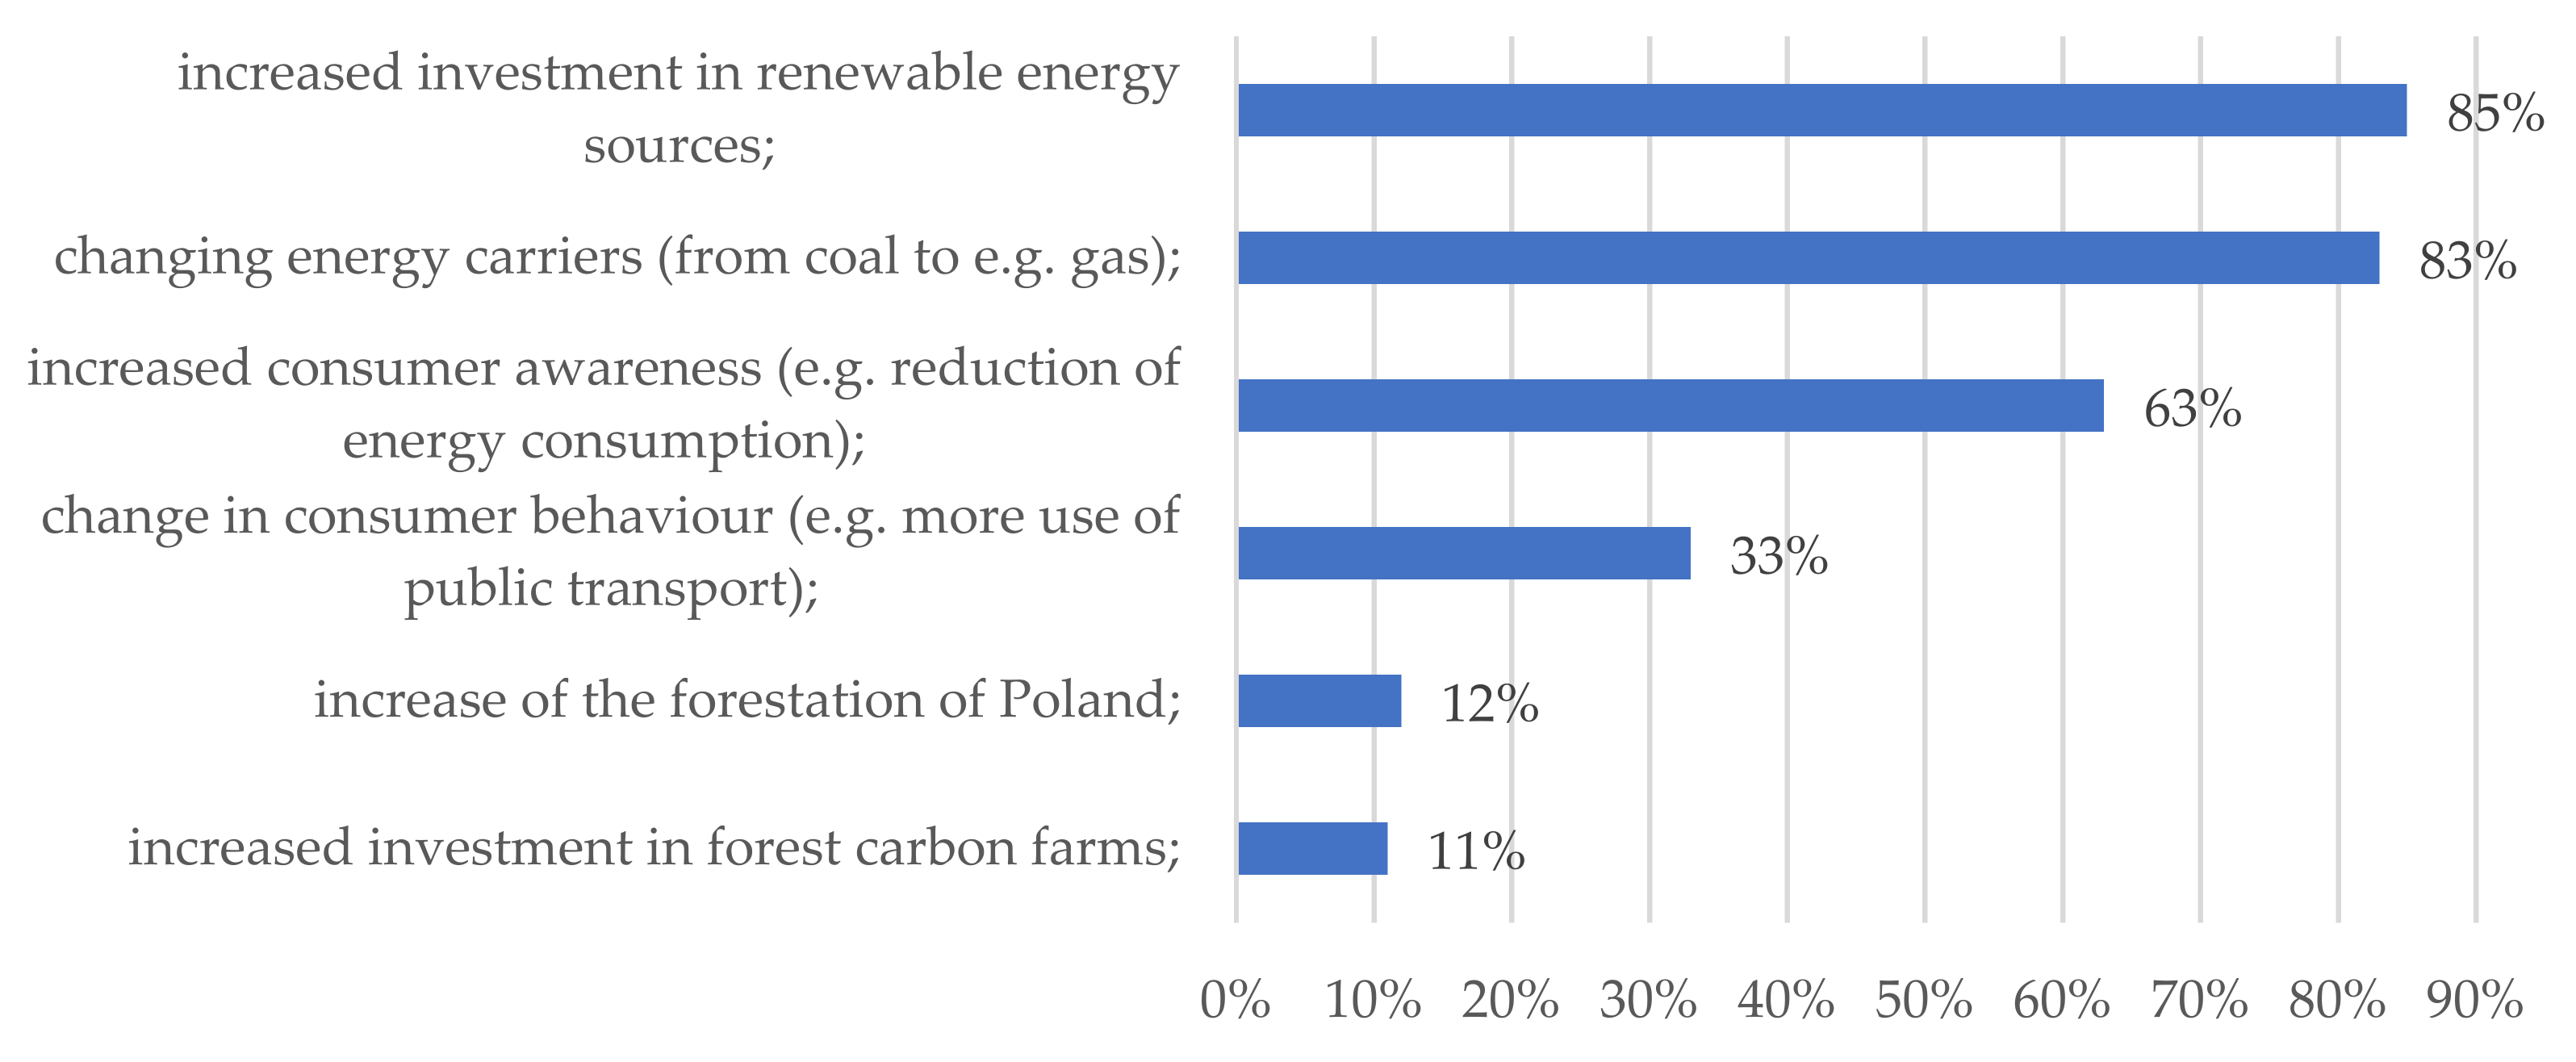
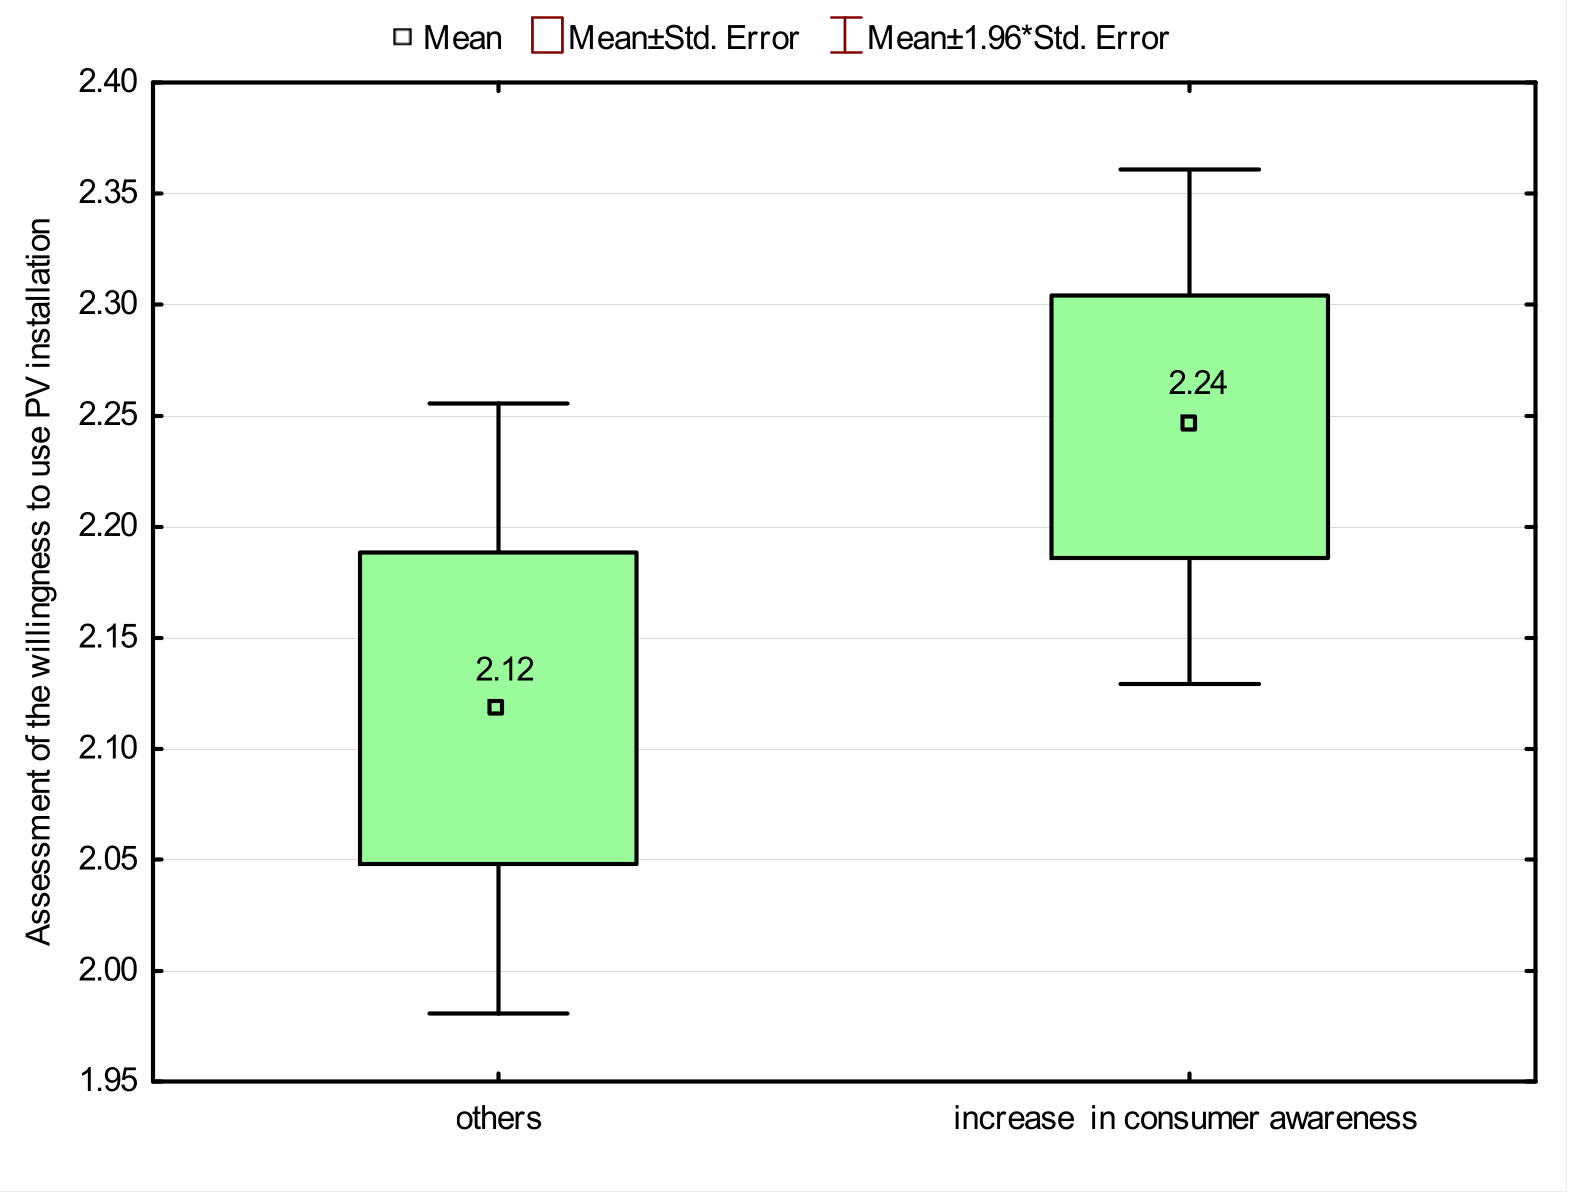
  • According to the survey, the main effects of decarbonization policy include increased investment in RES, change of energy carriers, and increased public awareness. The latter effect was indicated mainly by people who have the highest willingness to use PV installations;
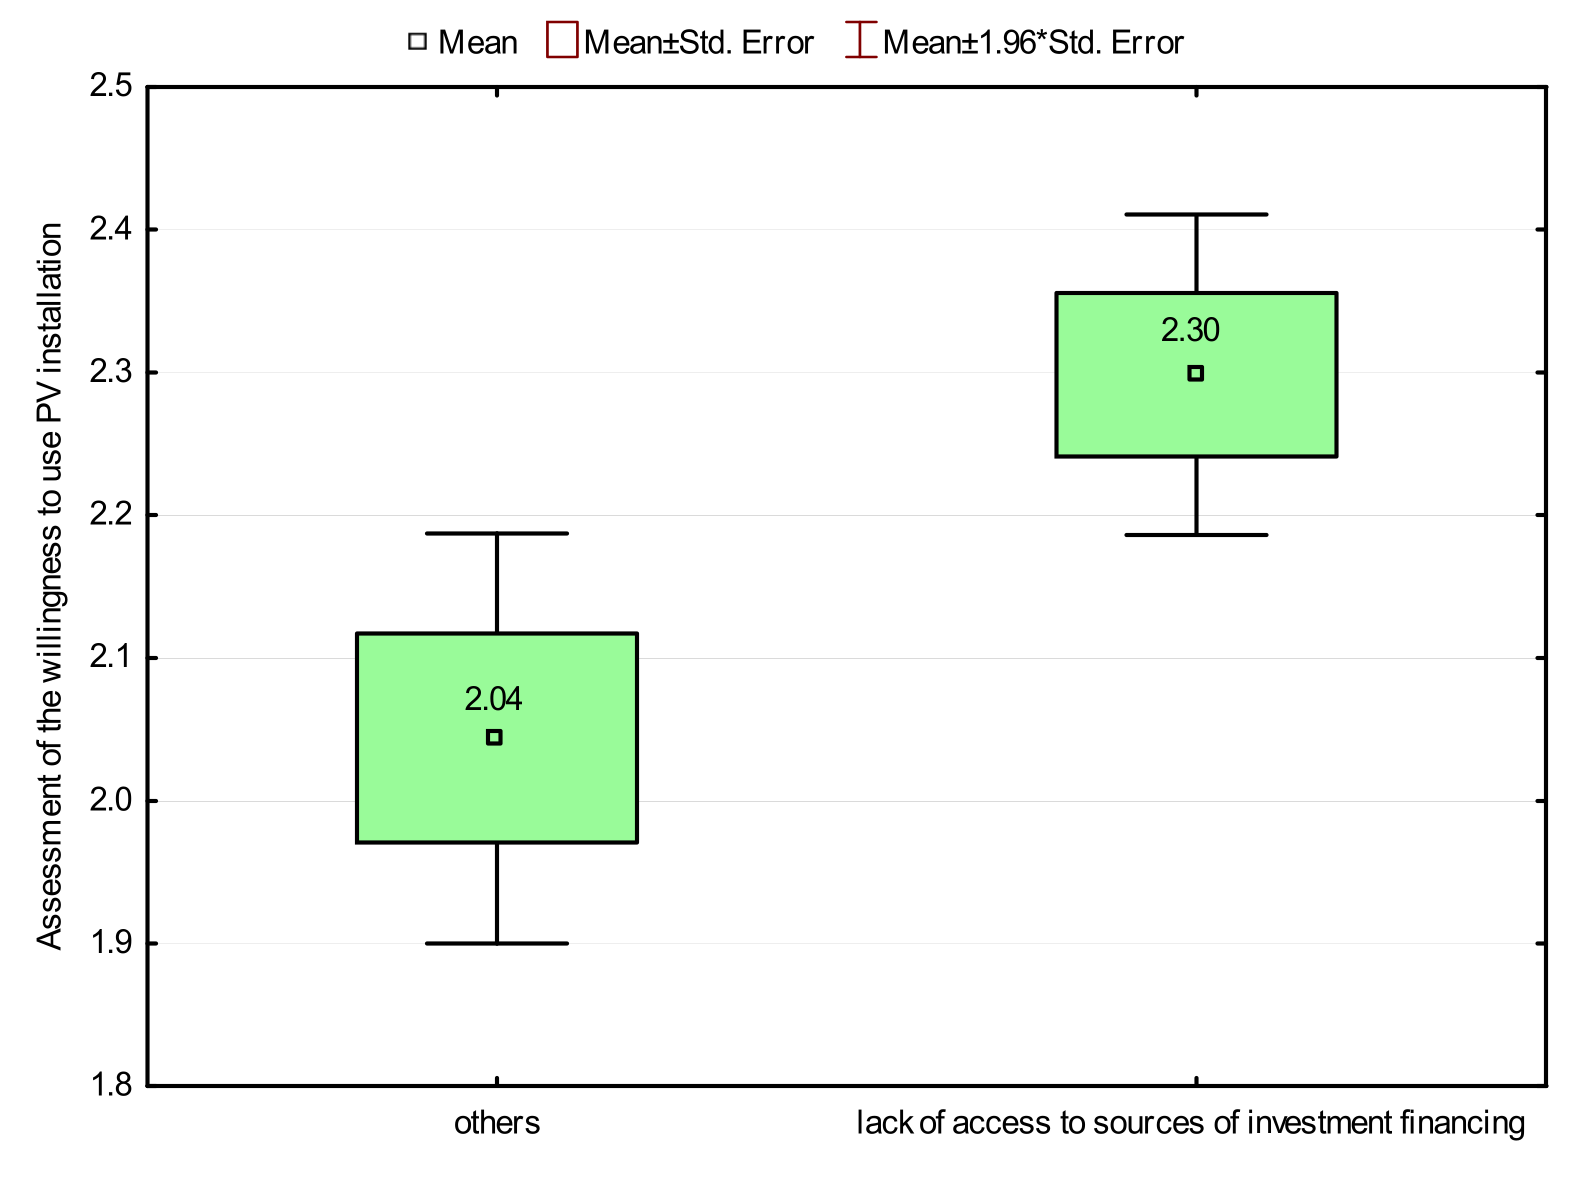
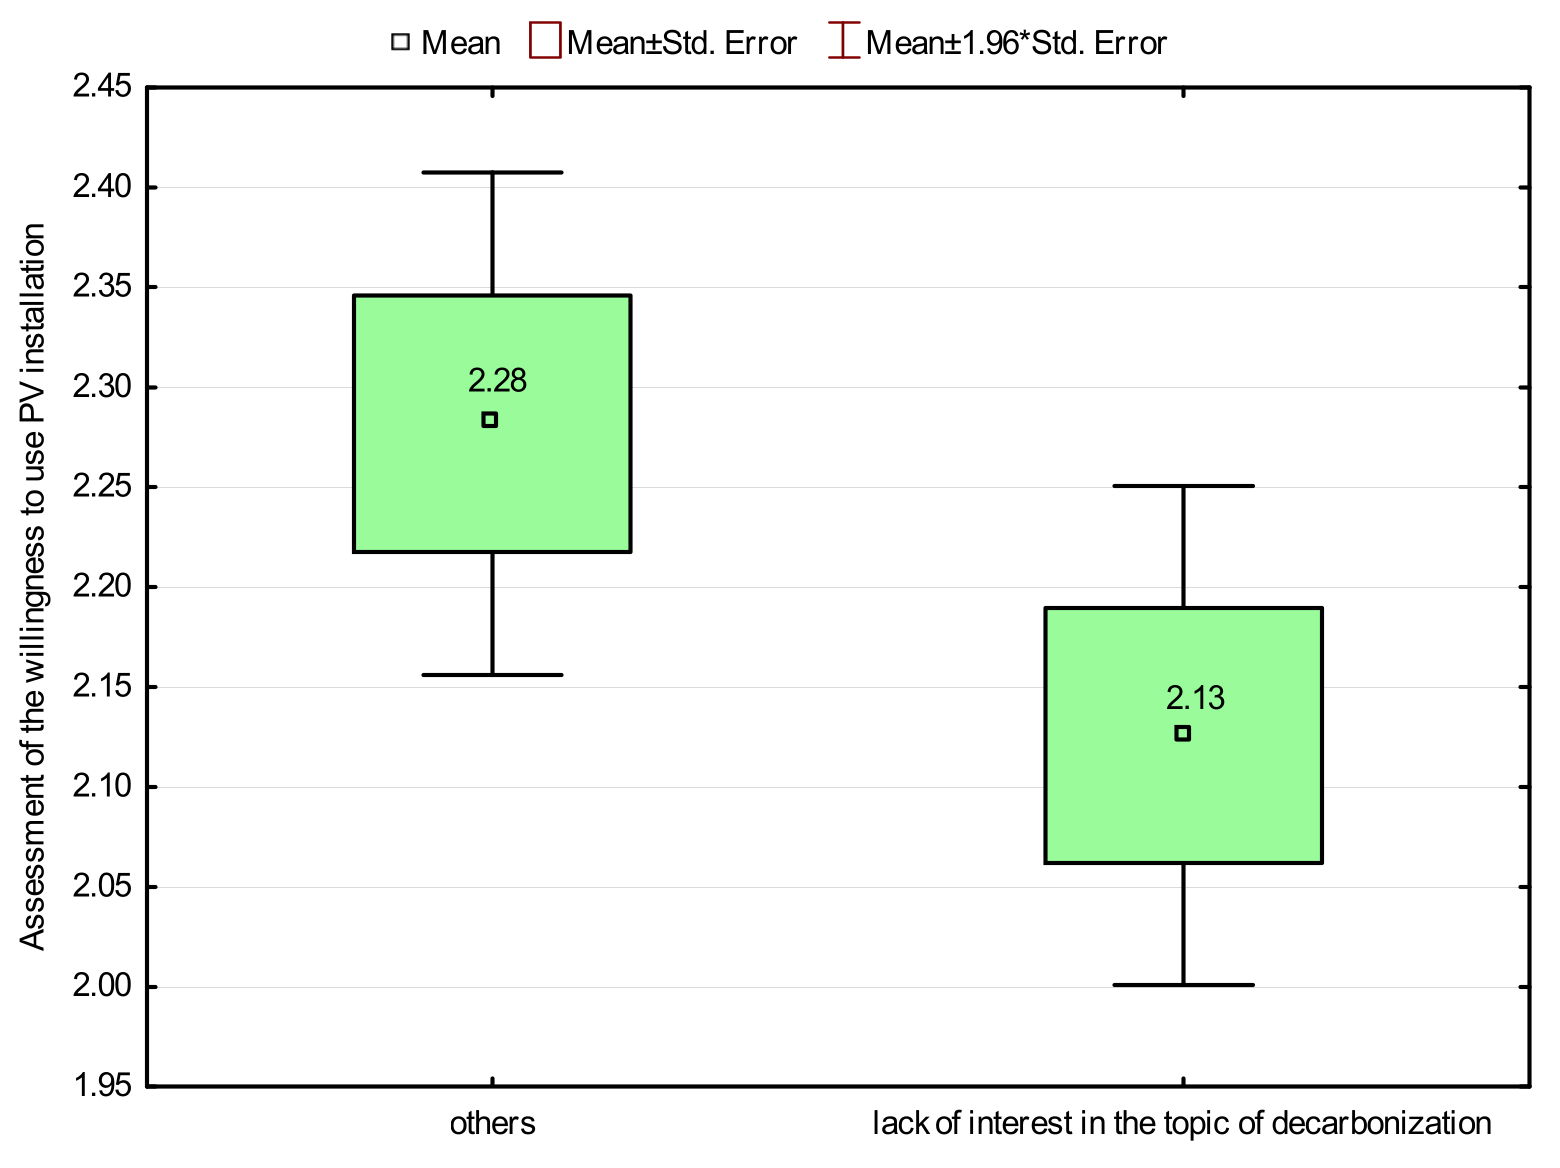
  • In the context of the above conclusion, the results according to which the biggest barriers to decarbonization of transport are lack of access to sources of financing for green investments and lack of interest in decarbonization among the public should also be interpreted. For this reason, it is necessary to expand and in some cases initiate intensive public campaigns aimed at educating the public on human impact on climate change, environmental protection, decarbonization processes, change of habits, and individual care for the environment;
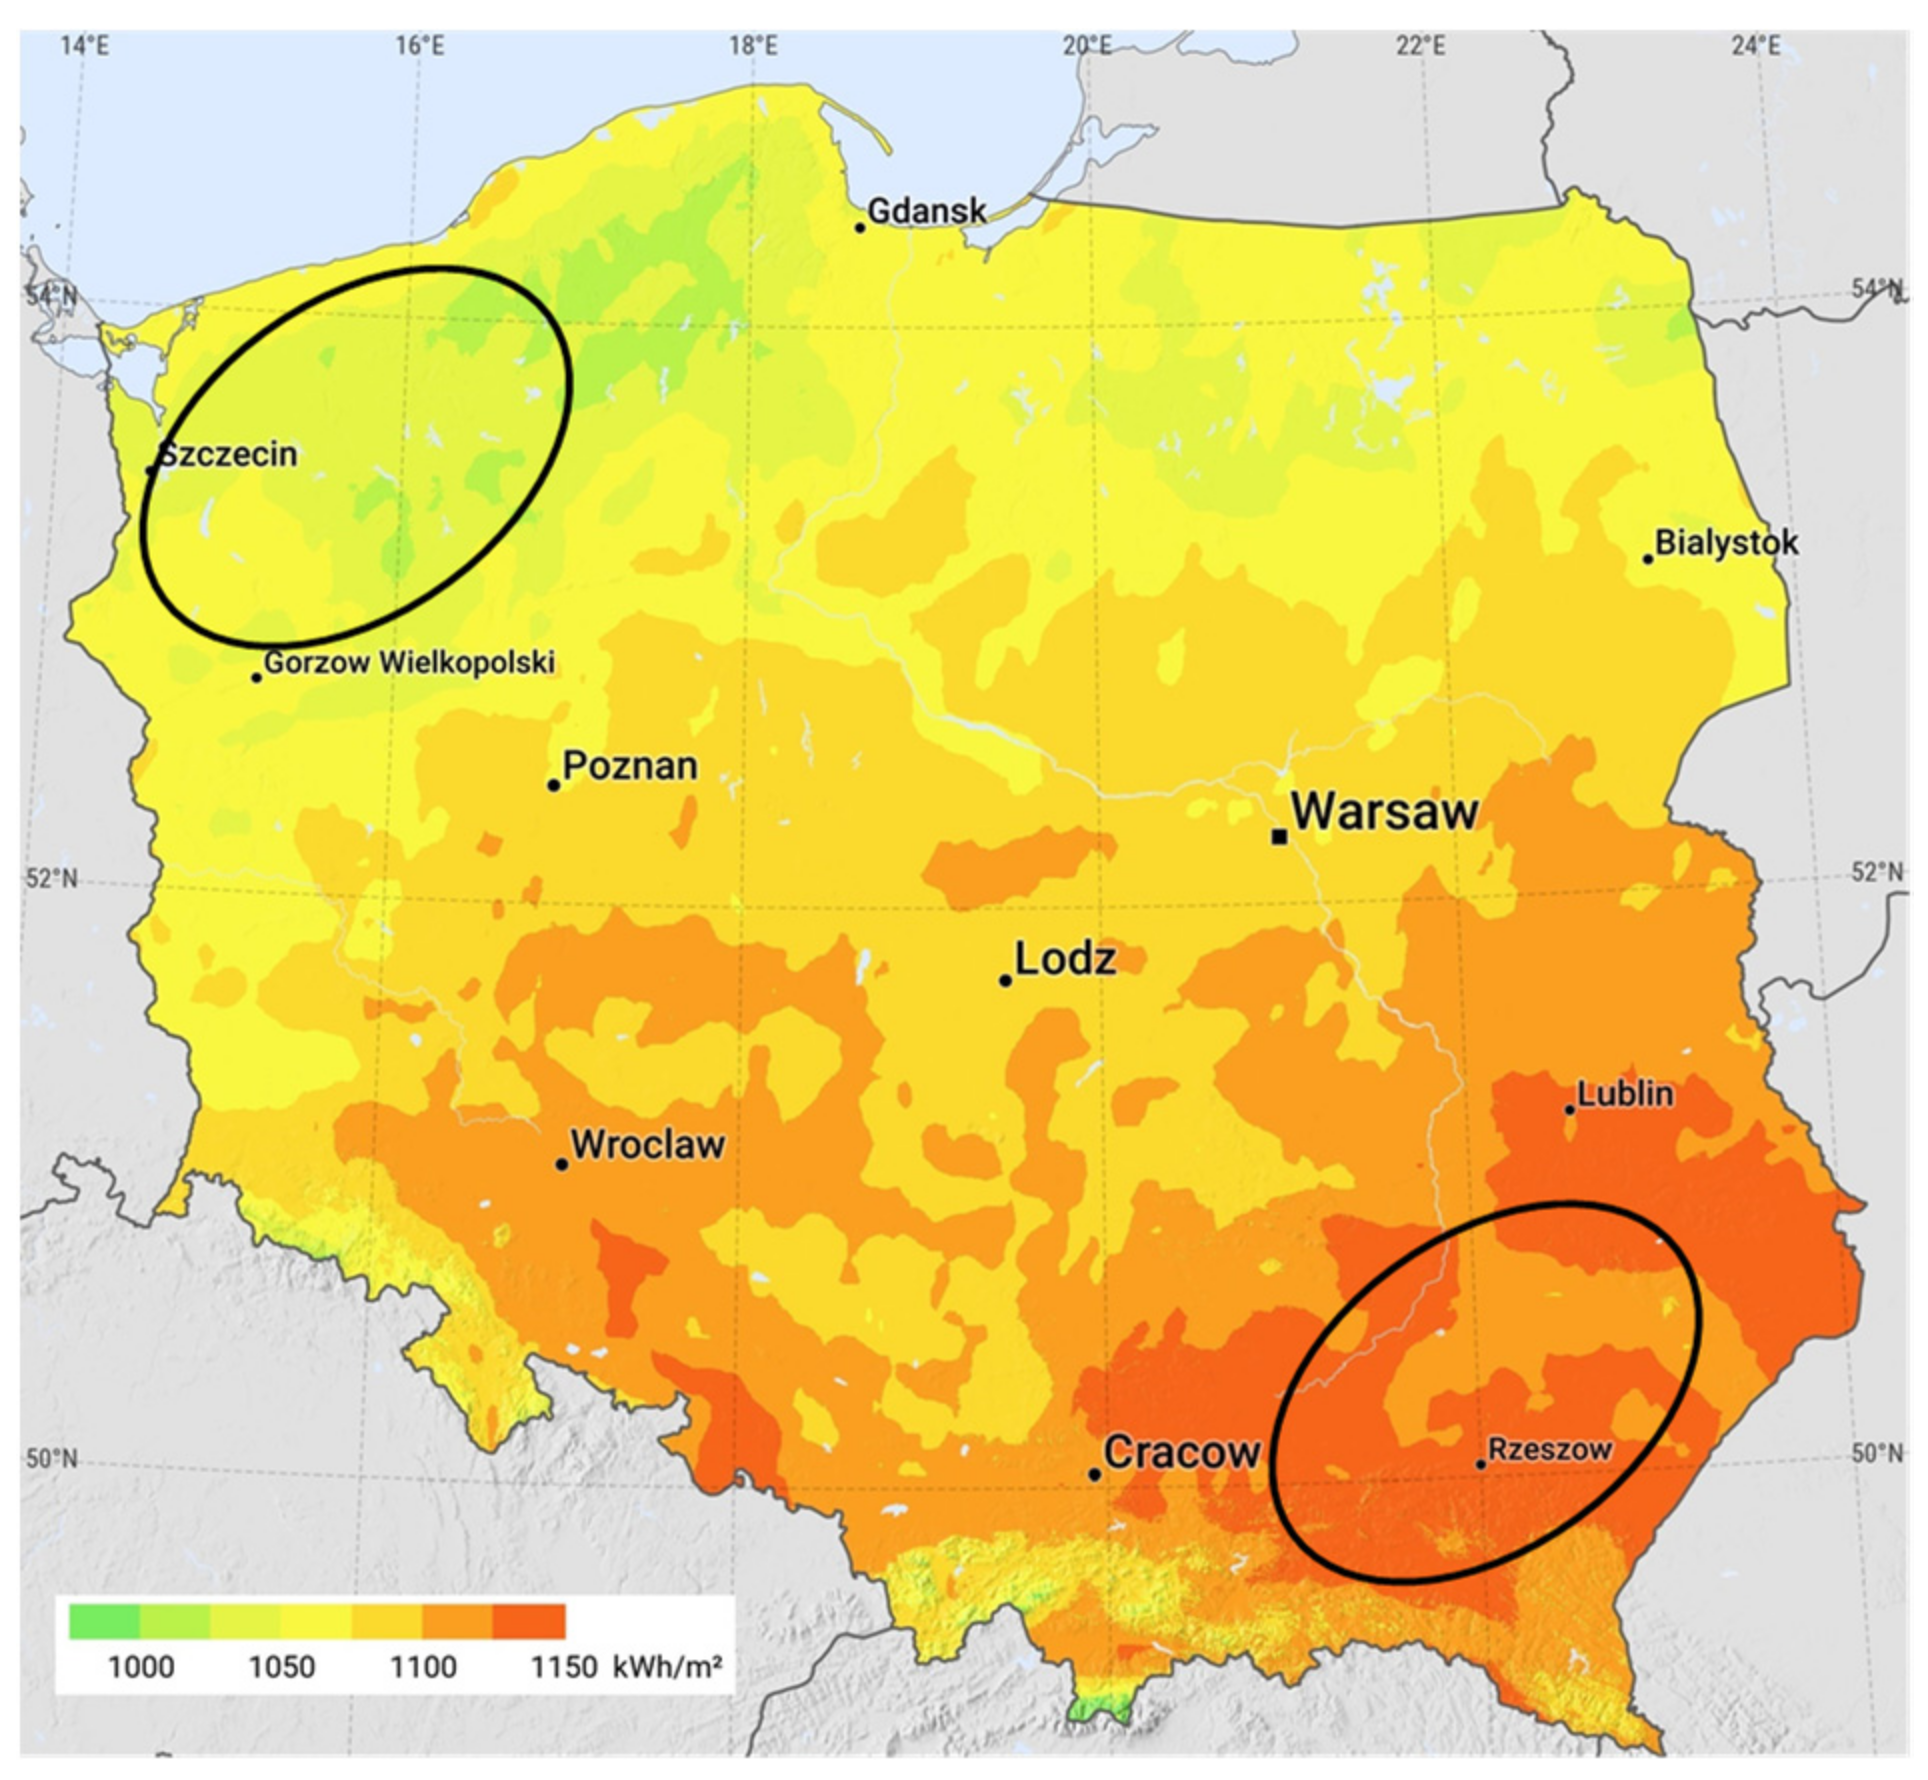
  • Region was important in assessing the willingness to use PV installations. Respondents living in the southeast region, which has better insolation, are more likely to use PV installations. Better insolation means that PV installations can be of smaller capacity. It also shortens the payback period of PV installation.
These conclusions also provide recommendations for decision makers at the national or regional level; in order to improve the implementation of decarbonization measures in Poland, there is a need for much greater public awareness campaigns on the effects of coal combustion and pro-environmental actions and greater use of economic incentives to encourage the development of green energy.
The installation of PV panels is often treated as an economically viable investment [68,69,70,71] rather than as a pro-environmental activity, which also demonstrates the low environmental awareness of the Polish society.
An important limitation of the study was the still low environmental awareness of the Polish society. The poor power grid infrastructure in many regions of Poland causes growing problems with connecting new prosumers, which translates into lower willingness to use green energy, including PV installations, among the respondents. Taking into account that public media in Poland are unfavorable to the EU, the public is not sufficiently interested in environmental issues, which are presented as an oppression of the EU. Sample size and structure were also important limitations of the study. Although the sample consisted of 633 people, there is a need to increase this sample in the future. The sample was also heavily dominated by women, which should be averaged out in the future so that the number of people representing each gender is similar. However, the predominance of women in the study means that the authors intend to attempt in future studies to investigate whether gender or education (technical or social) has an impact on expressed opinions related to the propensity to use green energy installations, including PV installations.
Despite the limitations caused by the COVID-19 pandemic, few interviews also identified the concerns of potential investors in PV installations regarding the possibility of their damage by weather conditions. The solution to this problem is insurance offered in various countries [72].
Further interesting research directions should include energy storage technologies, smart metering of production and especially energy consumption, optimization of energy management, electromobility, and alternative fuels with a special focus, perhaps, on hydrogen fuels.

Author Contributions

Conceptualization, G.L., B.S. and G.Z.; methodology, G.L., B.S. and K.C.-L.; validation, B.S. and M.W.-J.; formal analysis, K.C.-L.; investigation, G.L., B.S., K.C.-L. and G.Z.; writing—original draft preparation, G.L., B.S., K.C.-L., G.Z. and M.W.-J.; writing—review and editing, G.L., B.S. and G.Z.; visualization, G.L. and K.C.-L.; funding acquisition, B.S. and M.W.-J. All authors have read and agreed to the published version of the manuscript.

Funding

The project is partially financed within the framework of the program of the Minister of Science and Higher Education under the name “Regional Excellence Initiative” in the years 2019–2022; project number 001/RID/2018/19; the amount of financing PLN 10,684,000.00. This publication was co-financed by a subsidy granted to the Cracow University of Economics.

Institutional Review Board Statement

Not applicable.

Informed Consent Statement

Not applicable.

Data Availability Statement

The data used for the research come from the sources indicated in the article.

Conflicts of Interest

The authors declare no conflict of interest.

References

  1. Owusu, P.A.; Asumadu-Sarkodie, S. A Review of Renewable Energy Sources, Sustainability Issues and Climate Change Mitigation. Cogent Eng. 2016, 3, 1167990. [Google Scholar] [CrossRef]
  2. Li, Z.; Yano, A.; Cossu, M.; Yoshioka, H.; Kita, I.; Ibaraki, Y. Electrical Energy Producing Greenhouse Shading System with a Semi-Transparent Photovoltaic Blind Based on Micro-Spherical Solar Cells. Energies 2018, 11, 1681. [Google Scholar] [CrossRef] [Green Version]
  3. King, C.W.; Hall, C.A.S. Relating Financial and Energy Return on Investment. Sustainability 2011, 3, 1810–1832. [Google Scholar] [CrossRef] [Green Version]
  4. Del Río, P.; Peñasco, C.; Mir-Artigues, P. An overview of drivers and barriers to concentrated solar power in the European Union. Renew. Sustain. Energy Rev. 2018, 81, 1019–1029. [Google Scholar] [CrossRef]
  5. Abdeltawab, H.M.; Mohamed, Y.A.I. Distributed Battery Energy Storage Co-Operation for Renewable Energy Sources Integration. Energies 2020, 13, 5517. [Google Scholar] [CrossRef]
  6. Meijer, L.; Huijben, J.; Van Boxstael, A.; Romme, G. Barriers and drivers for technology commercialization by SMEs in the Dutch sustainable energy sector. Renew. Sustain. Energy Rev. 2019, 112, 114–126. [Google Scholar] [CrossRef]
  7. Foxon, T.; Gross, R.; Chase, A.; Howes, J.; Arnall, A.; Anderson, D. UK innovation systems for new and renewable energy technologies: Drivers, barriers and systems failures. Energy Policy 2005, 33, 2123–2137. [Google Scholar] [CrossRef]
  8. Cucchiella, F.; D’Adamo, I.; Gastaldi, M. Future trajectories of renewable energy consumption in the European Union. Resources 2018, 7, 10. [Google Scholar] [CrossRef] [Green Version]
  9. Samadi, S. The Social Costs of Electricity Generation—Categorising Different Types of Costs and Evaluating Their Respective Relevance. Energies 2017, 10930, 356. [Google Scholar] [CrossRef] [Green Version]
  10. Solarin, S.A. An Environmental Impact Assessment of Fossil Fuel Subsidies in Emerging and Developing Economies. Environ. Impact Assess. Rev. 2020, 85, 106443. [Google Scholar] [CrossRef]
  11. Qin, Z.; Zhuang, Q.; Cai, X.; He, Y.; Huang, Y.; Jiang, D.; Lin, E.; Liu, Y.; Tang, Y.; Wang, M.Q. Biomass and biofuels in China: Toward bioenergy resource potentials and their impacts on the environment. Renew. Sustain. Energy Rev. 2018, 82, 2387–2400. [Google Scholar] [CrossRef]
  12. Kluts, I.; Wicke, B.; Leemans, R.; Faaij, A. Sustainability constraints in determining European bioenergy potential: A review of existing studies and steps forward. Renew. Sustain. Energy Rev. 2017, 69, 719–734. [Google Scholar] [CrossRef] [Green Version]
  13. Caruso, G.; Gattone, S.A. Waste management analysis in developing countries through unsupervised classification of mixed data. Soc. Sci. 2019, 8, 186. [Google Scholar] [CrossRef] [Green Version]
  14. Sarkar, M.; Sarkar, B. How does an industry reduce waste and consumed energy within a multi-stage smart sustainable biofuel production system? J. Clean. Prod. 2020, 262, 121200. [Google Scholar] [CrossRef]
  15. Energia 2021. Enegry 2021. GUS. Available online: https://stat.gov.pl/obszary-tematyczne/srodowisko-energia/energia/energia-2021-folder,1,9.html (accessed on 13 September 2021).
  16. Available online: www.pse.pl (accessed on 12 September 2021).
  17. Kiuila, O. Decarbonization perspectives for the Polish economy. Energy Policy 2018, 118, 69–76. [Google Scholar] [CrossRef]
  18. Bukowski, M.; Majewski, J.; Sobolewska, A. Macroeconomic Electric Energy Production Efficiency of Photovoltaic Panels in Single-Family Homes in Poland. Energies 2021, 14, 126. [Google Scholar] [CrossRef]
  19. Dovì, V.; Battaglini, A. Energy Policy and Climate Change: A Multidisciplinary Approach to a Global Problem. Energies 2015, 8, 13473–13480. [Google Scholar] [CrossRef] [Green Version]
  20. Sher, F.; Curnick, O.; Azizan, M. Sustainable Conversion of Renewable Energy Sources. Sustainability 2021, 13, 2940. [Google Scholar] [CrossRef]
  21. Kurzak, L. Microinstallations Based on Renewable Energy Sources in the Construction Sector. In IOP Conference Series: Materials Science and Engineering; IOP Publishing Ltd.: Bristol, UK, 2017; Volume 245. [Google Scholar] [CrossRef]
  22. Loh, P.S.; Alnoor, H.I.M.; He, S. Impact of Climate Change on Vegetation Cover at South Port Sudan Area. Climate 2020, 8, 114. [Google Scholar] [CrossRef]
  23. Li, H.; Song, W. Characteristics of Climate Change in the Lancang–Mekong Sub-Region. Climate 2020, 8, 115. [Google Scholar] [CrossRef]
  24. Marks-Bielska, R.; Bielski, S.; Pik, K.; Kurowska, K. The Importance of Renewable Energy Sources in Poland’s Energy Mix. Energies 2020, 13, 4624. [Google Scholar] [CrossRef]
  25. Communication from the Commission to The European Parliament, The European Council, The Council, The European Economic and Social Committee and The Committee of The Regions—The European Green Deal, Brussels, 11.12.2019 COM (2019) 640, European Commission. Available online: https://ec.europa.eu/info/strategy/priorities-2019-2024/european-green-deal_en (accessed on 13 September 2021).
  26. Nikas, A.; Gambhir, A.; Trutnevyte, E.; Koasidis, K.; Lund, H.; Thellufsen, J.; Mayer, D.; Zachmann, G.; Miguel, L.; Ferreras-Alonso, N.; et al. Perspective of comprehensive and comprehensible multi-model energy and climate science in Europe. Energy 2020, 215, 119153. [Google Scholar] [CrossRef]
  27. Glavic, P.; Pintaric, Z.N.; Bogataj, M. Process Design and Sustainable Development—A European Perspective. Processes 2021, 9, 148. [Google Scholar] [CrossRef]
  28. The European Climate Pact: Empowering Citizens to Shape a Greener Europe. European Commission. 2020. Available online: https://fedarene.org/the-european-climate-pact-empowering-citizens-to-shape-a-greener-europe (accessed on 13 September 2021).
  29. United Nations Environment Programme. Renewables 2021 Global Status Report; Renewable Energy Policy Network for the 21st Century; United Nations Environment Programme: Nairobi, Kenya, 2021. [Google Scholar]
  30. Global Market Outlook. For Solar Power 2021–2025. Solar Power Europe. Available online: www.solarpowereurope.org (accessed on 13 September 2021).
  31. Alhammami, H.; An, H. Techno-economic analysis and policy implications for promoting residential rooftop solar photovoltaics in Abu Dhabi, UAE. Renew. Energy 2021, 167, 359–368. [Google Scholar] [CrossRef]
  32. Couture, D.; Kreycik, C.; Williams, E. A Policymaker’s Guide to Feed-in Tariff Policy Design; NREL: Golden, CO, USA, 2010. [Google Scholar]
  33. Lazard’s Levelized Cost of Energy Analysis—Version 14.0; Lazard: Hamilton, Bermuda, 2020; Available online: www.lazard.com (accessed on 14 September 2021).
  34. D’Adamo, I.; Gastaldi, M.; Morone, P. The post COVID-19 green recovery in practice: Assessing the profitability of a policy proposal on residential photovoltaic plants. Energy Policy 2020, 147, 111910. [Google Scholar] [CrossRef] [PubMed]
  35. Bukowski, M.; Majewski, J.; Sobolewska, A. Macroeconomic Efficiency of Photovoltaic Energy Production in Polish Farms. Energies 2021, 14, 5721. [Google Scholar] [CrossRef]
  36. Iwaszczuk, N.; Trela, M. Analysis of the Impact of the Assumed Moment of Meeting Total Energy Demand on the Profitability of Photovoltaic Installations for Households in Poland. Energies 2021, 14, 1637. [Google Scholar] [CrossRef]
  37. Angowski, M.; Kijek, T.; Lipowski, M.; Bondos, I. Factors Affecting the Adoption of Photovoltaic Systems in Rural Areas of Poland. Energies 2021, 14, 5272. [Google Scholar] [CrossRef]
  38. Öhrlund, I.; Stikvoort, B.; Schultzberg, M.; Bartusch, C. Rising with the sun? Encouraging solar electricity self-consumption among apartment owners in Sweden. Energy Res. Soc. Sci. 2020, 64, 101424. [Google Scholar] [CrossRef]
  39. Colasante, A.; D’Adamo, I.; Morone, P. Nudging for the increased adoption of solar energy? Evidence from a survey in Italy. Energy Res. Soc. Sci. 2021, 74, 101978. [Google Scholar] [CrossRef]
  40. Riveros, J.Z.; Kubli, M.; Ulli-Beer, S. Prosumer communities as strategic allies for electric utilities: Exploring future decentralization trends in Switzerland. Energy Res. Soc. Sci. 2019, 57, 101219. [Google Scholar] [CrossRef]
  41. Wójcik-Jurkiewicz, M.; Czarnecka, M.; Kinelski, G.; Sadowska, B.; Bilińska-Reformat, K. Determinants of Decarbonization in the Transformation of the Energy Sector: The Case of Poland. Energies 2021, 14, 1217. [Google Scholar] [CrossRef]
  42. Drożdż, W.; Kinelski, G.; Czarnecka, M.; Wójcik-Jurkiewicz, M.; Maroušková, A.; Zych, G. Determinants of Decarbonization—How to Realize Sustainable and Low Carbon Cities? Energies 2021, 14, 2640. [Google Scholar] [CrossRef]
  43. Zyśk, J.; Wyrwa, A.; Suwała, W.; Pluta, M.; Olkuski, T.; Raczyński, M. The Impact of Decarbonization Scenarios on Air Quality and Human Health in Poland—Analysis of Scenarios up to 2050. Atmosphere 2020, 11, 1222. [Google Scholar] [CrossRef]
  44. Kud, K.; Woźniak, M.; Badora, A. Impact of the Energy Sector on the Quality of the Environment in the Opinion of Energy Consumers from Southeastern Poland. Energies 2021, 14, 5551. [Google Scholar] [CrossRef]
  45. Toktarova, A.; Karlsson, I.; Rootzén, J.; Göransson, L.; Odenberger, M.; Johnsson, F. Pathways for Low-Carbon Transition of the Steel Industry—A Swedish Case Study. Energies 2020, 13, 3840. [Google Scholar] [CrossRef]
  46. Nasirov, S.; O’Ryan, R.; Osorio, H. Decarbonization Tradeoffs: A Dynamic General Equilibrium Modeling Analysis for the Chilean Power Sector. Sustainability 2020, 12, 8248. [Google Scholar] [CrossRef]
  47. Kittel, M.; Goeke, L.; Kemfert, C.; Oei, P.-Y.; von Hirschhausen, C. Scenarios for Coal-Exit in Germany—A Model-Based Analysis and Implications in the European Context. Energies 2020, 13, 2041. [Google Scholar] [CrossRef] [Green Version]
  48. Sovacool, B.K.; Axsen, J.; Sorrell, S. Promoting novelty, rigor, and style in energy social science: Towards codes of practice for appropriate methods and research design. Energy Res. Soc. Sci. 2018, 45, 12–42. [Google Scholar] [CrossRef]
  49. Instytut Energetyki Odnawialnej. Raport Fotowoltaiki w Polsce; Instytut Energetyki Odnawialnej: Warszawa, Poland, 2021; Available online: www.ieo.pl (accessed on 14 September 2021).
  50. Available online: www.ecovisa.pl/wiedza-aktualnosci/aktualności/87-naslonecznienie-w-polsce-a-fotowoltaika (accessed on 19 October 2021).
  51. Steinberg, L.; Rogers, A. Changing the Scale: The Effect of Modifying Response Scale Labels on the Measurement of Personality and Affect. Multivar. Behav. Res. 2020, 1–15. [Google Scholar] [CrossRef]
  52. Chyung, S.Y.; Roberts, K.; Swanson, I.; Hankinson, A. Evidence-Based Survey Design: The Use of a Midpoint on the Likert Scale. Perform. Improv. 2017, 56, 15–23. [Google Scholar] [CrossRef] [Green Version]
  53. Aczel, A.D.; Sounderpandian, J. Complete Business Statistics; McGraw-Hill Primis: Boston, MA, USA, 2009. [Google Scholar]
  54. Fahrmeir, L.; Kneib, T.; Lang, S.; Marx, B. Regression: Models, Methods and Applications; Springer: Berlin/Heidelberg, Germany, 2013. [Google Scholar]
  55. Liczba Prosumentów Przekroczyła 600 Tysięcy. Available online: www.rynekelektryczny.pl/energia-elektryczna-ze-zrodel-odnawialnych (accessed on 19 September 2021).
  56. Available online: https://www.gov.pl/web/klimat/polityka-energetyczna-polski (accessed on 19 September 2021).
  57. Palma, H.H.; Ibarra, K.H. Evaluation of photovoltaic energy projects using the real options valuation. Int. J. Energy Econ. Policy 2020, 10, 256–265. [Google Scholar] [CrossRef]
  58. Zenghelis, D. Securing Decarbonization and Growth. Natl. Inst. Econ. Rev. 2019, 250, R54–R60. [Google Scholar] [CrossRef]
  59. Brodny, J.; Tutak, M. Analyzing similarities between the European Union countries in terms of the structureand volume of energy production from renewable energy sources. Energies 2020, 13, 913. [Google Scholar] [CrossRef] [Green Version]
  60. Svazas, M.; Navickas, V.; Krajnakova, E.; Nakonieczny, J. Sustainable supply chain of the biomass cluster as a factor for preservation and enhancement of forests. J. Int. Stud. 2019, 12, 309–321. [Google Scholar] [CrossRef]
  61. Stolarski, M.J.; Warminski, K.; Krzyzaniak, M. Energy value of yield and biomass quality of poplar grown intwo consecutive 4-year harvest rotations in the north-east of Poland. Energies 2020, 13, 1495. [Google Scholar] [CrossRef] [Green Version]
  62. Kath, C.; Nitka, W.; Serafin, T.; Weron, T.; Zaleski, P.; Weron, R. Balancing Generation from Renewable Energy Sources: Profitability of an Energy Trader. Energies 2020, 13, 205. [Google Scholar] [CrossRef] [Green Version]
  63. Caruso, G.; Colantonio, E.; Gattone, S.A. Relationships between renewable energy consumption, social factors, and health: A panel vector auto regression analysis of a cluster of 12 EU countries. Sustainability 2020, 12, 2915. [Google Scholar] [CrossRef] [Green Version]
  64. Zimon, G.; Zimon, D. The Impact of Purchasing Group on the Profitability of Companies Operating in the Renewable Energy Sector—The Case of Poland. Energies 2020, 13, 6588. [Google Scholar] [CrossRef]
  65. Zimon, G. An assessment of the strategy of working capital management in polish energy companies. Int. J. Energy Econ. Policy 2019, 9, 552–556. [Google Scholar] [CrossRef] [Green Version]
  66. Baskutis, S.; Baskutiene, J.; Navickas, V.; Bilan, Y.; Cieśliński, W. Perspectives and Problems of Using Renewable Energy Sources and Implementation of Local “Green” Initiatives: A Regional Assessment. Energies 2021, 14, 5888. [Google Scholar] [CrossRef]
  67. Fang, Z.; Bai, H.; Bilan, Y. Evaluation Research of Green Innovation Efficiency in China’s Heavy Polluting Industries. Sustainability 2020, 12, 146. [Google Scholar] [CrossRef] [Green Version]
  68. Merlo, P.; Dankiewicz, R.; Ostrowska-Dankiewicz, A. Probabilistic and statistical methods of risk analysis in the investments effectiveness evaluation and their application in business practice. Actual Probl. Econ. 2013, 150, 437–446. [Google Scholar]
  69. Luchko, M.; Lew, G.; Ruska, R.; Vovk, I. Modelling the optimal size of investment portfolio in a non-state pension fund. J. Int. Stud. 2019, 12, 239–252. [Google Scholar] [CrossRef] [PubMed]
  70. Lyeonov, S.; Pimonenko, T.; Bilan, Y.; Štreimikienė, D.; Mentel, G. Assessment of Green Investments’ Impact on Sustainable Development: Linking Gross Domestic Product Per Capita, Greenhouse Gas Emissions and Renewable Energy. Energies 2019, 12, 3891. [Google Scholar] [CrossRef] [Green Version]
  71. Vasylieva, T.; Pavlyk, V.; Bilan, Y.; Mentel, G.; Rabe, M. Assessment of Energy Efficiency Gaps: The Case for Ukraine. Energies 2021, 14, 1323. [Google Scholar] [CrossRef]
  72. Dankiewicz, R.; Simionescu, M. The insurance market in Romania: A macroeconomic and a microeconomic approach. Transform. Bus. Econ. 2020, 19, 248–261. [Google Scholar]
Figure 1. Share of renewable energy sources in gross final energy consumption. Source: Own study based on [15].
Energies 14 07819 g001
Figure 2. Structure of electricity generation sources in Poland (July 2021). Source: Own study based on data from Polish Power Grid [16].
Energies 14 07819 g002
Figure 3. Share of installed PV solar panels in 2020. Source: Own elaboration based on [30].
Energies 14 07819 g003
Figure 4. Forecasted increase in solar energy capacity. Source: Own study based on [30].
Energies 14 07819 g004
Figure 5. Change dynamics of production costs of 1 MWh. Source: Own elaboration based on [33].
Energies 14 07819 g005
Figure 6. Insolation map of Poland with study areas marked. Source: Own elaboration based on [50].
Energies 14 07819 g006
Figure 7. Will the decarbonization policy in Poland contribute to reducing global CO2 emissions vs. assessment of the willingness to use PV installations.
Energies 14 07819 g007
Figure 8. Statistics on responses to the question: Which sectors of the economy are most vulnerable to the impact of decarbonization policies?
Energies 14 07819 g008
Figure 9. Which sectors of the economy are most affected by the decarbonization policy (mining) vs. assessment of the willingness to use PV installations?
Energies 14 07819 g009
Figure 10. Which sectors of the economy are most affected by decarbonization policies (logistics) vs. assessment of the willingness to use PV installations?
Energies 14 07819 g010
Figure 11. Which sectors of the economy are most affected by the decarbonization policy (medical industry) vs. assessment of the willingness to use PV installations?
Energies 14 07819 g011
Figure 12. Statistics of responses to the question: Which sectors of the economy are most vulnerable to the impact of decarbonization policies?
Energies 14 07819 g012
Figure 13. Statistics of responses to the question: What effects can decarbonization policies have?
Energies 14 07819 g013
Figure 14. What effects can decarbonization policies have: increased consumer awareness (e.g., reducing energy consumption) vs. assessment of the willingness to use PV installations.
Energies 14 07819 g014
Figure 15. What is the biggest barrier to decarbonization in transport (lack of access to finance for investment) vs. assessment of the willingness to use PV installations.
Energies 14 07819 g015
Figure 16. What is the biggest barrier to decarbonization in transport (lack of public interest in decarbonization) vs. assessment of the willingness to use PV installations.
Energies 14 07819 g016
Figure 17. Region vs. assessment of the willingness to use PV installations.
Energies 14 07819 g017
Figure 18. Electricity production from RES in GWh. Data from June 2020 and 2021. Source: own elaboration based on [55].
Energies 14 07819 g018
Table 1. Poland’s place in the PV development forecast until 2025.
Country2020 Total Capacity (MW)By 2025 Total Capacity Medium Scenario (MW)2021–2025 New Capacity (MW)2021–2025 Compound Annual Growth Rate (%)
Denmark164411,402975847%
United Arab Emirates24049861745733%
Poland390115,11911,21831%
Brazil761326,02918,41628%
Taiwan581819,53513,71727%
Netherlands10,32431,02820,70425%
India45,918133,93588,01724%
Spain14,15337,65423,50122%
China253,404662,818409,41421%
Australia21,05355,48234,42921%
South Korea14,97736,64721,67020%
France10,96727,63116,66420%
United States95,519224,991129,47219%
Turkey676715,511874418%
Mexico680815,531872318%
Vietnam18,07036,77418,70415%
Germany54,60998,31343,70412%
Japan71,182109,66338,4819%
United Kingdom13,78020,54767678%
Italy21,19129,56883777%
Source: Own elaboration based on [30].
Table 2. Summary of survey results.
VariableN%
Gender
male17528%
female45872%
Region
podkarpackie (southeastern region)23838%
zachodniopomorskie (northwestern region)23337%
małopolskie (southeastern region)8914%
others7311%
Will the decarbonization policy in Poland contribute to the reduction of global CO2 emissions, or will it have no effect on global emissions in the economy?
yes36858%
no10717%
I don’t know15825%
Which sectors of the economy will be most easily affected by decarbonization policies?
mining51882%
energetics52783%
logistics19230%
chemical industry30348%
healthcare industry508%
construction industry14723%
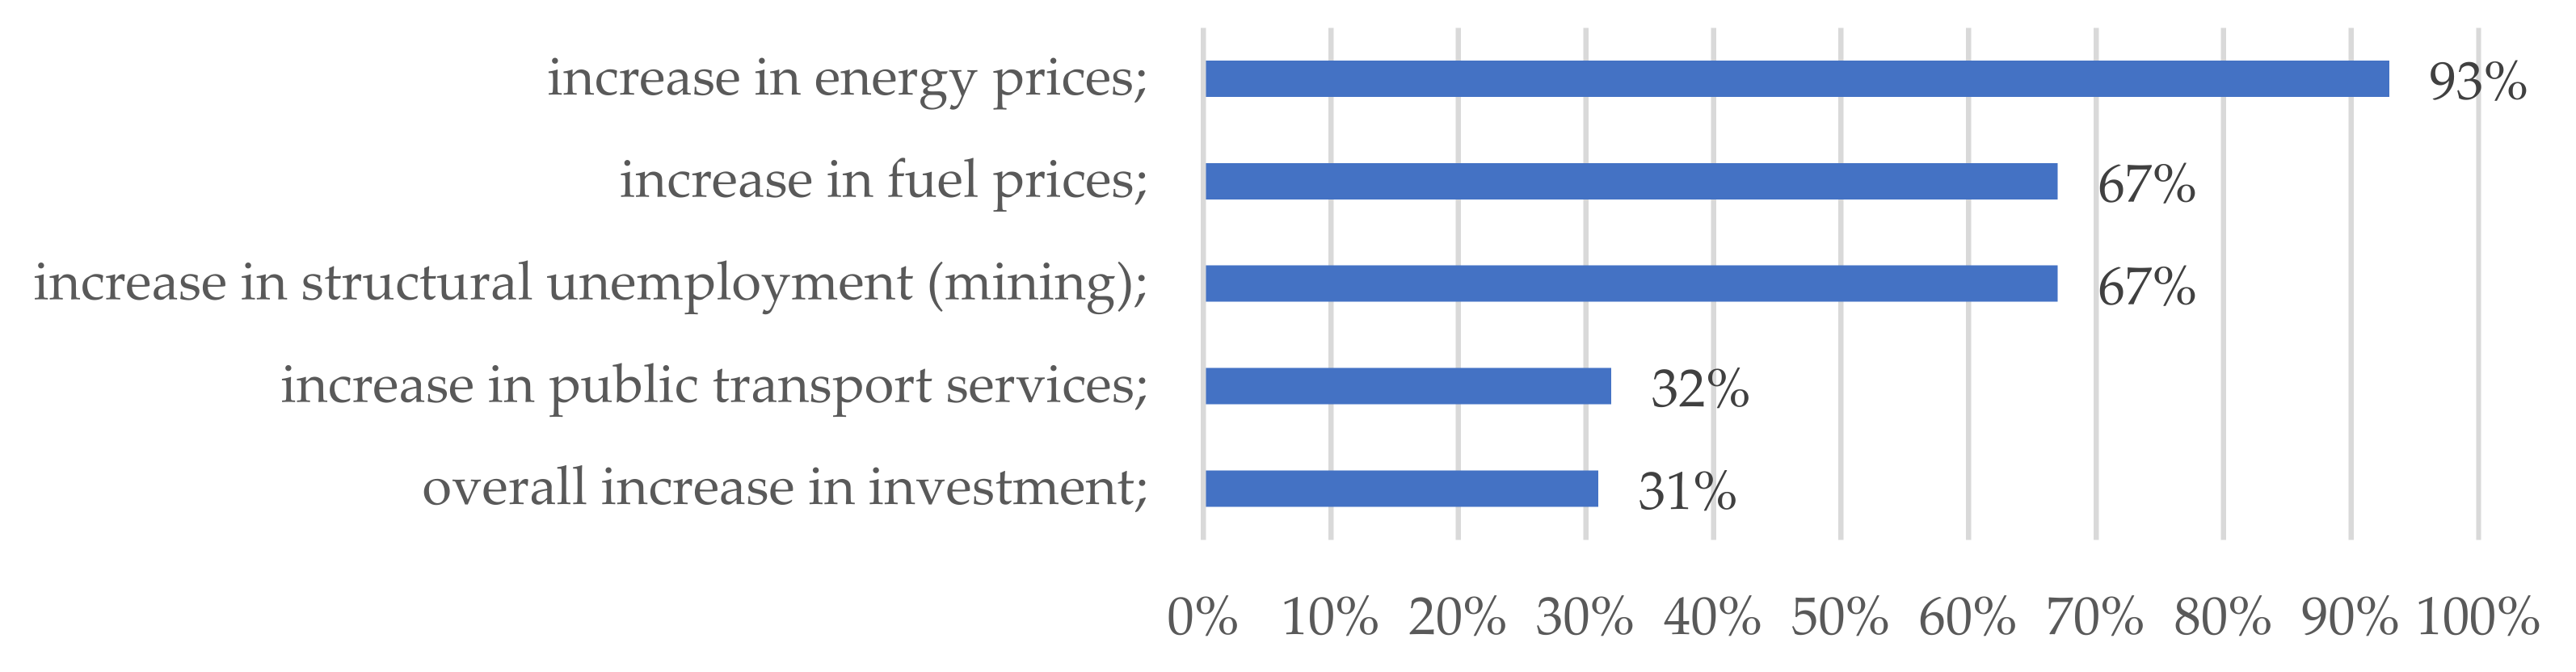
How will decarbonization policies affect socio-economic–environmental processes?
there will be an overall increase in investment;19431%
there will be an increase in public transport services;20232%
there will be an increase in structural unemployment (mining);42267%
there will be an increase in fuel prices;42167%
there will be an increase in energy prices;58693%
What effects can decarbonization policies have?
increased investment in renewable energy sources;53685%
increased consumer awareness (e.g., reduction of energy consumption);39663%
changing energy carriers (from coal to e.g., gas);52483%
change in consumer behavior (e.g., more use of public transport);20733%
increase in the forestation of Poland;7512%
increased investment in forest carbon farms;6911%
Will people living in rural areas and using solid fuel (coal) easily change their preferences to use other energy sources?
I don’t know498%
no13521%
probably no34855%
probably yes9114%
yes102%
Are you going to use public transportation more often by giving up your own transportation?
I don’t know10316%
no10917%
probably no20833%
probably yes14623%
yes6711%
Would you change your current car for an electric car?
I don’t know14421%
no7912%
probably no11920%
probably yes18730%
yes10416%
What is the biggest barrier to decarbonization in transportation?
the mentality of society;43268%
lack of access to sources of investment financing;38260%
lack of interest in the decarbonization of society;34254%
lack of interest in the topic of decarbonization at the local government level;23337%
low level of knowledge on decarbonization;39863%
Source: own elaboration.
Table 3. Results of determining the relationship of individual responses with respect to the assessment of willingness to use PV installations.
Variablep
Will the decarbonization policy in Poland contribute to the reduction of global CO2
emissions or will it have no effect on global emissions in the economy?
0.0409 *
Which sectors of the economy will be most easily affected by decarbonization policies?
mining0.0173 *
logistics0.0462 *
healthcare industry0.0306 *
What effects can decarbonization policies have?
increased consumer awareness (e.g., reduction of energy consumption)0.0219 *
What is the biggest barrier to decarbonization in transportation?
lack of access to sources of investment financing;0.0018 **
lack of interest in the decarbonization of society;0.0459 *
Region0.0344 *
Source: own elaboration based on Kruskal–Wallis ANOVA test and U Mann–Whitney test.
Publisher’s Note: MDPI stays neutral with regard to jurisdictional claims in published maps and institutional affiliations.

