1. Introduction
The rapid industrialization process in Poland left a heavy burden on the environment. Despite consistent economic growth in recent years [
1], today, in the COVID-19 era [
2], the Polish economy needs to find a way forward, which would incorporate a promise of digital transformation [
3] and take into account expectations of the stakeholders [
4]. The energy sector is in the spotlight as it exemplifies both challenges and possibilities that the economy is facing [
5]. In the past, energy under various forms was available without paying any attention to the environmental effort of such energy generation. The EU introduced three directives to tackle the air pollution problem: the LCP Directive, the MCP Directive, and the IE Directive. These directives are focused predominantly on decreasing relative values of emissions. This approach led to a significant drop in TSP emissions from 1156 kt in 1990 to 343 kt in 2019 overall. Greenhouse gases (GHG) emissions were 382 Mt in 1990 and 322 Mt in 2019. This paper presents how the Hubgrade solution contributes to harmful emissions reduction in the Warsaw district heating system and simulates how it could address emissions in the Metropolis GZM district heating system.
Metropolis GZM, in Polish “Górnośląsko-Zagłębiowska Metropolia”, refers to an association of 41 municipalities located in southern Poland. Metropolis GZM was established to carry out regional tasks, which were to build a strong, industrial region in the national and international arena and to create an image of an attractive space for living, investing, and visiting. For the years 2018–2022, five priority strategic goals have been set [
6]:
Create a metropolitan study. The study is a formal urban planning document. It supports the development of green cities, reduction of wastes, and consumption reduction of water and electricity.
Integrate public transport providers. It should include integration of tariffs and ticket systems, new intercity connections, and the purchase of zero-emission buses.
Support the implementation of tasks by the member states through subsidies from the Solidarity Fund and in projects related to the senior policy.
Promote the metropolitan association and its area. It should include building the metropolitan brand and identity among residents of the GZM.
Develop the Metropolitan Socio-Economic Observatory and a platform for good practices and internal management system.
All the goals can be achieved by various means, but they have to be simultaneous to meet the ambitious European Green Deal standards. However, there is a reason why climate neutrality was set as the first of the strategic goals. The historical culture of Silesia, mining and metallurgy, led to significant degradation of the region. Mining activity was dictated by huge coal seams located under the GZM and the surrounding areas. Access to cheap but unsustainable coal-based energy is the reason why local and national heat and electricity generation sources are strongly dependent on coal. This goal is also in line with the vision of The European Green Deal, which states that energy efficiency must be prioritized, and, at the same time, the EU’s energy supply needs must be secure and affordable for consumers and businesses [
7].
This can be accomplished by various activities. The concept of sharing economy may be a partial solution to minimize consumption of energy [
8]. However, in order to meet the ambitious goals of The European Green Deal, all activities must be carried out simultaneously. One of these goals is to increase energy efficiency. Metropolis GZM, thanks to the relatively strong population density and an extensive network of district heating (DH) systems, creates a potential for savings through the use of intelligent technologies in DH systems.
To benefit from favoring geospatial conditions, a high level of coordination between stakeholders is necessary. GZM Metropolis can play a pivotal role in this process, which can result in the implementation of a smart city concept [
9].
There is a necessity to develop suitable instruments in the decision-making process by the authorities, since the demand for intelligent solutions in service of operational cost reduction of the cities is growing. These instruments should include advanced technologies and social actions related to cooperation with residents and supporting social capital. In addition to advanced technologies, the importance of soft potentials is growing, including technology, talent, tolerance, and trust—jointly known as 4T. This 4T potential supports the intelligence, entrepreneurship, and innovation of a city. The presence of 4T in smart city management is a quality measure of the life of the inhabitants and its competitive position in the metropolis. Metropolis GZM had gone through a similar process before with the transportation network in which user experience improved through the integration of providers and smart technologies. District heating is another area in which creating soft potential, particularly in building trust among stakeholders, may transform into energy efficiency benefits and thus support the European Green Deal goals [
10].
The effects of the implementation of smart technologies in the district heating network are not fully discussed in the existing literature, although there are some mentions [
11,
12]. This paper summarizes the application of smart solutions in the Warsaw district heating system, in which heat consumption is comparable to Metropolis GZM. Based on this summary, the authors simulated energy-saving opportunities and harmful emissions reduction potential in the GZM region. It is worth mentioning the fact that lack of competitiveness in the DHS sector has caused stagnation, and monopolistic conditions are natural to this branch, unlike in electric energy markets [
13].
2. Generations of District Heating Systems
The development of technology and changes in urban evolution has caused modern district heating networks to not resemble those which were built 200 years ago [
14]. To differentiate types of networks that exist, special nomenclature evolved as the district heating technology changed.
“First-generation” district heating systems started the existence of district heating at the end of the 19th century in the USA and Western Europe and used steam as a medium of heat carrier. The temperature of steam reached up to 150 °C.
In “second generation” heating systems, the heat carrier had been changed into pressurized water with a temperature above 130 °C, transmitted through steel pipes without good insulation which ran in concrete channels. This technology was used from the 1930s and was popular until the 1970s, especially in socialist countries, including Poland. Both of these technologies are characterized by high transmission losses.
The technology that is the most common in district heating systems at the moment of writing this paper are the “third-generation” systems (3G DHS) [
11]. The main difference distinguishing this generation from the previous is the prefabricated technology in which pipes are built. Prefabrication means that pipes are produced integrated with insulation. Third-generation systems are supplied with pressurized hot water, whose temperature is often below 100 °C.
“Fourth generation” district heating systems (4G DHS) are difficult to characterize, and they are not very popular yet. As energy efficiency has become a global trend, it is impossible to stop the transformation of the state-of-the-art district heating technology. Future district heating systems will have to meet challenges, such as the ability to supply existing buildings as well as low-energy buildings at the same time, reduction of network losses, and the ability to integrate existing heat sources with renewable energy sources (RES) [
15]. Thus, the fourth generation is expected to be supplied with low-temperature water that ranges from 30 °C−70 °C. To improve energy efficiency and meet the abovementioned challenges, coordination of the performance of the buildings and the district heating system is required. Intelligent control of performance and smart metering of the network together with reasonably accurate weather forecasting may play a crucial role in the optimization of heat consumption. Intelligent algorithms and remote control of valves allows predicting the required need for heat and supplying the building with it without excess, and, as a result, maximizing energy efficiency. According to Li and Nord [
12], smart district heating, thereby 4G DHS, consists of three essential parts: physical network (PN), Internet of Things (IoT), and intelligent decision system (IDS). Installation and integration of those three parts may be beneficial in terms of flexibility in the demands of the buildings, as the concrete structure of the building is used as a short-term heat storage system.
The idea of a “fifth-generation” system (5G DHCS: fifth-generation district heating and cooling) is not yet widespread. The main concept of 5G DHCS combines the system of district heating and district cooling. The carrier used in this technology is at ultra-low temperature. The use of RES is anticipated to be at the highest level guided by the principle of closing energy loops as much as possible [
16]. The difference of heat carrier temperature in 3G DHS and 5G DHCS is significant enough that the return flow of 3G DHS may be a supply for 5G DHCS. Such a solution has been proposed in the urban renovation project for the district Hertogensite in Leuven (Belgium) [
17].
2.1. Selected Projects Funded by the European Union Regarding Smart DH Systems
The European Union has allocated a great number of funds for research and innovation. Within the Horizon 2020 program, many scientific projects have been launched to increase energy efficiency and reduce the impact on the environment. Among projects in the DH field, the following can be mentioned [
18]: FLEXYNETS [
19], STORM [
20], InDeal [
21], and OPTi [
22].
FLEXYNETS was an H2020 European Project that received funding under grant agreement no. 649820. The idea of the project was to integrate low-temperature heat sources, low-temperature waste heat, and RES with a DH network that works at neutral temperature of 15 °C−30 °C. The project mitigates heat losses resulting from the difference of ambient and the district heating network temperature, since the heat exchange drops as the temperature difference drops. Regarding the fact that the operating temperature of the network may be both a source of heat and a source of coolness, the idea is in line with the assumptions of 5G DHCS. Reversible heat pumps are used to enable heat exchange between internal building installation and the network [
19].
STORM was an H2020 European Project that received funding under grant agreement no. 649743. As a part of the project, a special controller was designed and implemented. The goal of the implementation of the device was to increase the use of waste heat, RES, and boost energy efficiency at the district level. The STORM project was based on self-learning algorithms that operate on special designed smart network controllers. Two pilot projects have been launched and tested, unveiling the hidden potential of digitalization in the district heating field. Demonstration sites in Heerlen (The Netherlands) and Rottne (Sweden) proved the thesis of the research, with peak shavings (12.75% in Rottne), capacity improvements (42.1% in Heerlen), electricity purchase price reduction, and overall CO
2 emission reduction [
20].
InDeal is an H2020 European Project that received funding under grant agreement no. 696174. InDeal was a multidisciplinary project whose selected objectives are as follows: development of a short-term weather forecasting tool, development of new insulation materials, development of storage management tool to monitor and control production, development of artificial intelligence metering, and development of web control platform. The InDeal system has been tested in real conditions at two pilot sites (the DH network in Vransko, Slovenia, and the DHC networks in Montpellier, France) [
21].
OPTi is an H2020 European Project that received funding under grant agreement no. 649796. The project focused on the way DH is architected, controlled, and operated. The main goal was to reduce peak demand, lower supply temperature, optimize network operation, and reduce (very specific for the test site) geographic restrictions. By building a network simulation tool, forecasting weather conditions and heat demand tool, and creating a virtual valve mechanism that gives users control over their thermal comfort, the goal of the project has been achieved. The concept was analyzed at two demonstration sites: Luleå (Sweden) and Majorca (Spain) [
22].
2.2. Selected Commercially Implemented Systems of Smart Managed District Heating Systems
Proof that intelligent solutions in the district heating field are no longer only in the research and development phases is the fact that there are commercial solutions. There are available proposals on the market that bring not only economic benefits but also environmental benefits. Selected examples of such solutions are mentioned below.
Building Energy Services-Hubgrade (BES-Hubgrade) is a service proposed by Veolia Energia Warszawa S.A. company (Poland) [
23]. Through technical solutions, based on intelligent and remotely managed control devices, this service enables optimization of thermal energy consumption in connection to the service buildings. Continuous monitoring of parameters in the network, weather forecast analysis, multi-point temperature measurements, and a remote control system ensures the thermal comfort and simultaneous reduction of thermal energy consumption in the building, which translates into a lower carbon footprint in the heat production process and lower charges for citizens of the buildings. In addition, the system increases reliability and improves the efficiency of devices in the substation. Optimal energy consumption reduces the emission of gases harmful to the environment, since BES-Hubgrade is offered primarily in a region where approximately 90% of the heat comes from coal [
24].
Smart Heat Grid Solutions™ and Smart Heat Building Solutions™ are intelligent management business proposals provided by NODA Intelligent Systems [
25]. NODA Smart Heat Building is a solution that uses a self-learning and adaptive mathematical model that enables various scenarios, with sensors, which satisfy the system with continuous temperature monitoring, and enables calculation of the energy balance of the property and regulation of the existing control system of the heating substation. The solution is a comparable proposition to the BES-Hubgrade, pursuing similar goals with similar mechanisms. NODA Smart Heat Grid is a tool that allows reducing the use or eliminating the operation of peak heat sources during peak load periods. Thanks to the control of the interaction between the production conditions and the needs of consumers, NODA Smart Heat Grid is also able to cool the return water more, which translates into an increase in the efficiency of electricity generation in cogeneration systems with a steam turbine and thus increase in energy efficiency. In addition, the tool allows for the use of connected entities as virtual hot water tanks.
Smart Active Box (SAB) is a predictive maintenance system provided by Arne Jensen AB (Sweden) designed for managing the condition of district heating pipes [
26]. The system is equipped with features different from previously mentioned systems. It is a device that collects specific data as acoustic vibrations (Delta-t
®) to predict leakage in the district heating network. By using statistics, the system can monitor wear-down and corrosion levels and inform whether the line is to be replaced or not. Such a solution brings efficiency in maximization of the utilization of the pipes and thus minimization of the cost and carbon footprint, caused by the energy-consuming production process of pipes. However, the most important feature is that the system minimizes downtime. Sensors such as oxygen meters, temperature sensors, or flood sensors provide additional information about the situation in a heating chamber.
iSENSE™ is another smart solution for district heating networks, which is developed by Vexve Oy (Finland) [
27]. The system consists of three monitoring solutions: iSENSE Opti for real-time monitoring and optimal control of the district heating network, iSENSE Pulse for leakage detection, and iSENSE Chamber for online monitoring of the conditions in a heating chamber.
3. Materials and Methods
3.1. GZM Boundary Assumption
In later references, GZM is understood as a collection of counties (second-layer units of local governments pol. “powiaty”). The list of assumed GZM counties is as follows:
Powiat m.Bytom
Powiat tarnogórski
Powiat m.Piekary Śląskie
Powiat m.Gliwice
Powiat gliwicki
Powiat m.Zabrze
Powiat m.Katowice
Powiat m.Chorzów
Powiat m.Mysłowice
Powiat m.Ruda Śląska
Powiat m.Siemianowice Śląskie
Powiat m.Świętochłowice
Powiat m.Sosnowiec
Powiat będziński
Powiat m.Dąbrowa Górnicza
Powiat m.Tychy
Powiat bieruńsko-lędziński
Powiat mikołowski
Powiat pszczyński was not included in the list, since only one municipality from this county (Kobiór) belongs to GZM, and data from bigger municipalities that belong to this county could significantly affect the quality of results.
Municipalities such as Krupski Młyn, Tworóg, Miasteczko Śląskie, Kalety (Powiat tarnogórski), Toszek, Wielowieś (Powiat gliwicki), Orzesze and Ornontowice (Powiat mikołowski) were included into GZM, although they do not belong to it, as they constitute a whole in a given county and it is not possible to exclude them from the data.
This concept is not fully covered in reality; however, the differences in boundaries are small, and the quality and availability of data in Statistics Poland’s databases for GZM understood in this way is much greater.
3.2. Methodology of Calculating Heat Savings
Because weather conditions are unique for every year, and to provide an accurate and reliable measurement method, a special index of heat consumption was developed, which is calculated as follows:
where KPI(
n) is an index of heat consumption over the reading period (
n), Q(
n) is heat consumption reading over the (
n) period, and HDD(
n) is the sum of the daily differences over the (
n) period between the reference temperature of 18 °C and the average outdoor temperature during the day, expressed in °C, calculated for average daily temperatures less than or equal to 14 °C. In the case of an average daily outside temperature above 14 °C and in the months of June, July, and August, the HDD value is zero.
The heat consumption index in the following year is expressed by Equation (2).
Since, in many cases, accurate billing readings are not made on the first or last day of the month, a special formula has been developed that calculates consumption in a given month based on readings often performed in the middle of the month. In such cases, heat consumption in a given month Q(M) is calculated as the sum of the products of the heat consumption index for the first period KPI(
n) and the number of heating degree days (from the beginning of the month to the moment of measurement) HDD(Ma) and the analogous product of the heat consumption index for the second period of the month KPI(
n + 1) and the number of degree days (from reading point till the end of the month) HDD(Mb).
Theoretical base heat consumption (Q)
base is calculated monthly as the product of the KPI(M)
base heat consumption index in the base year and the number of HDD in the corresponding month. KPI(M)
base is the average heat consumption Q
ave(M) and HDD
ave(M) over the previous five years.
In the end, heat savings achieved through intelligent management of the heating subsystem, are calculated as the difference between theoretical base heat consumption and actual heat consumption reading monthly.
3.3. Comparison
Table 1 depicts that taking Warsaw DH system as a reference point is justified, because of the comparable length of the grid, which is 17% smaller in Warsaw, the cubature of the heated buildings, which is 37% higher in Warsaw than in GZM: the volume of the sold heat is 25% higher in Warsaw and, at the same time, the volume of the sold heat per 1 dam is 19% lower in Warsaw.
4. Calculations and Results
4.1. Number of Heating Degree Days in the Analyzed Period
As mentioned in
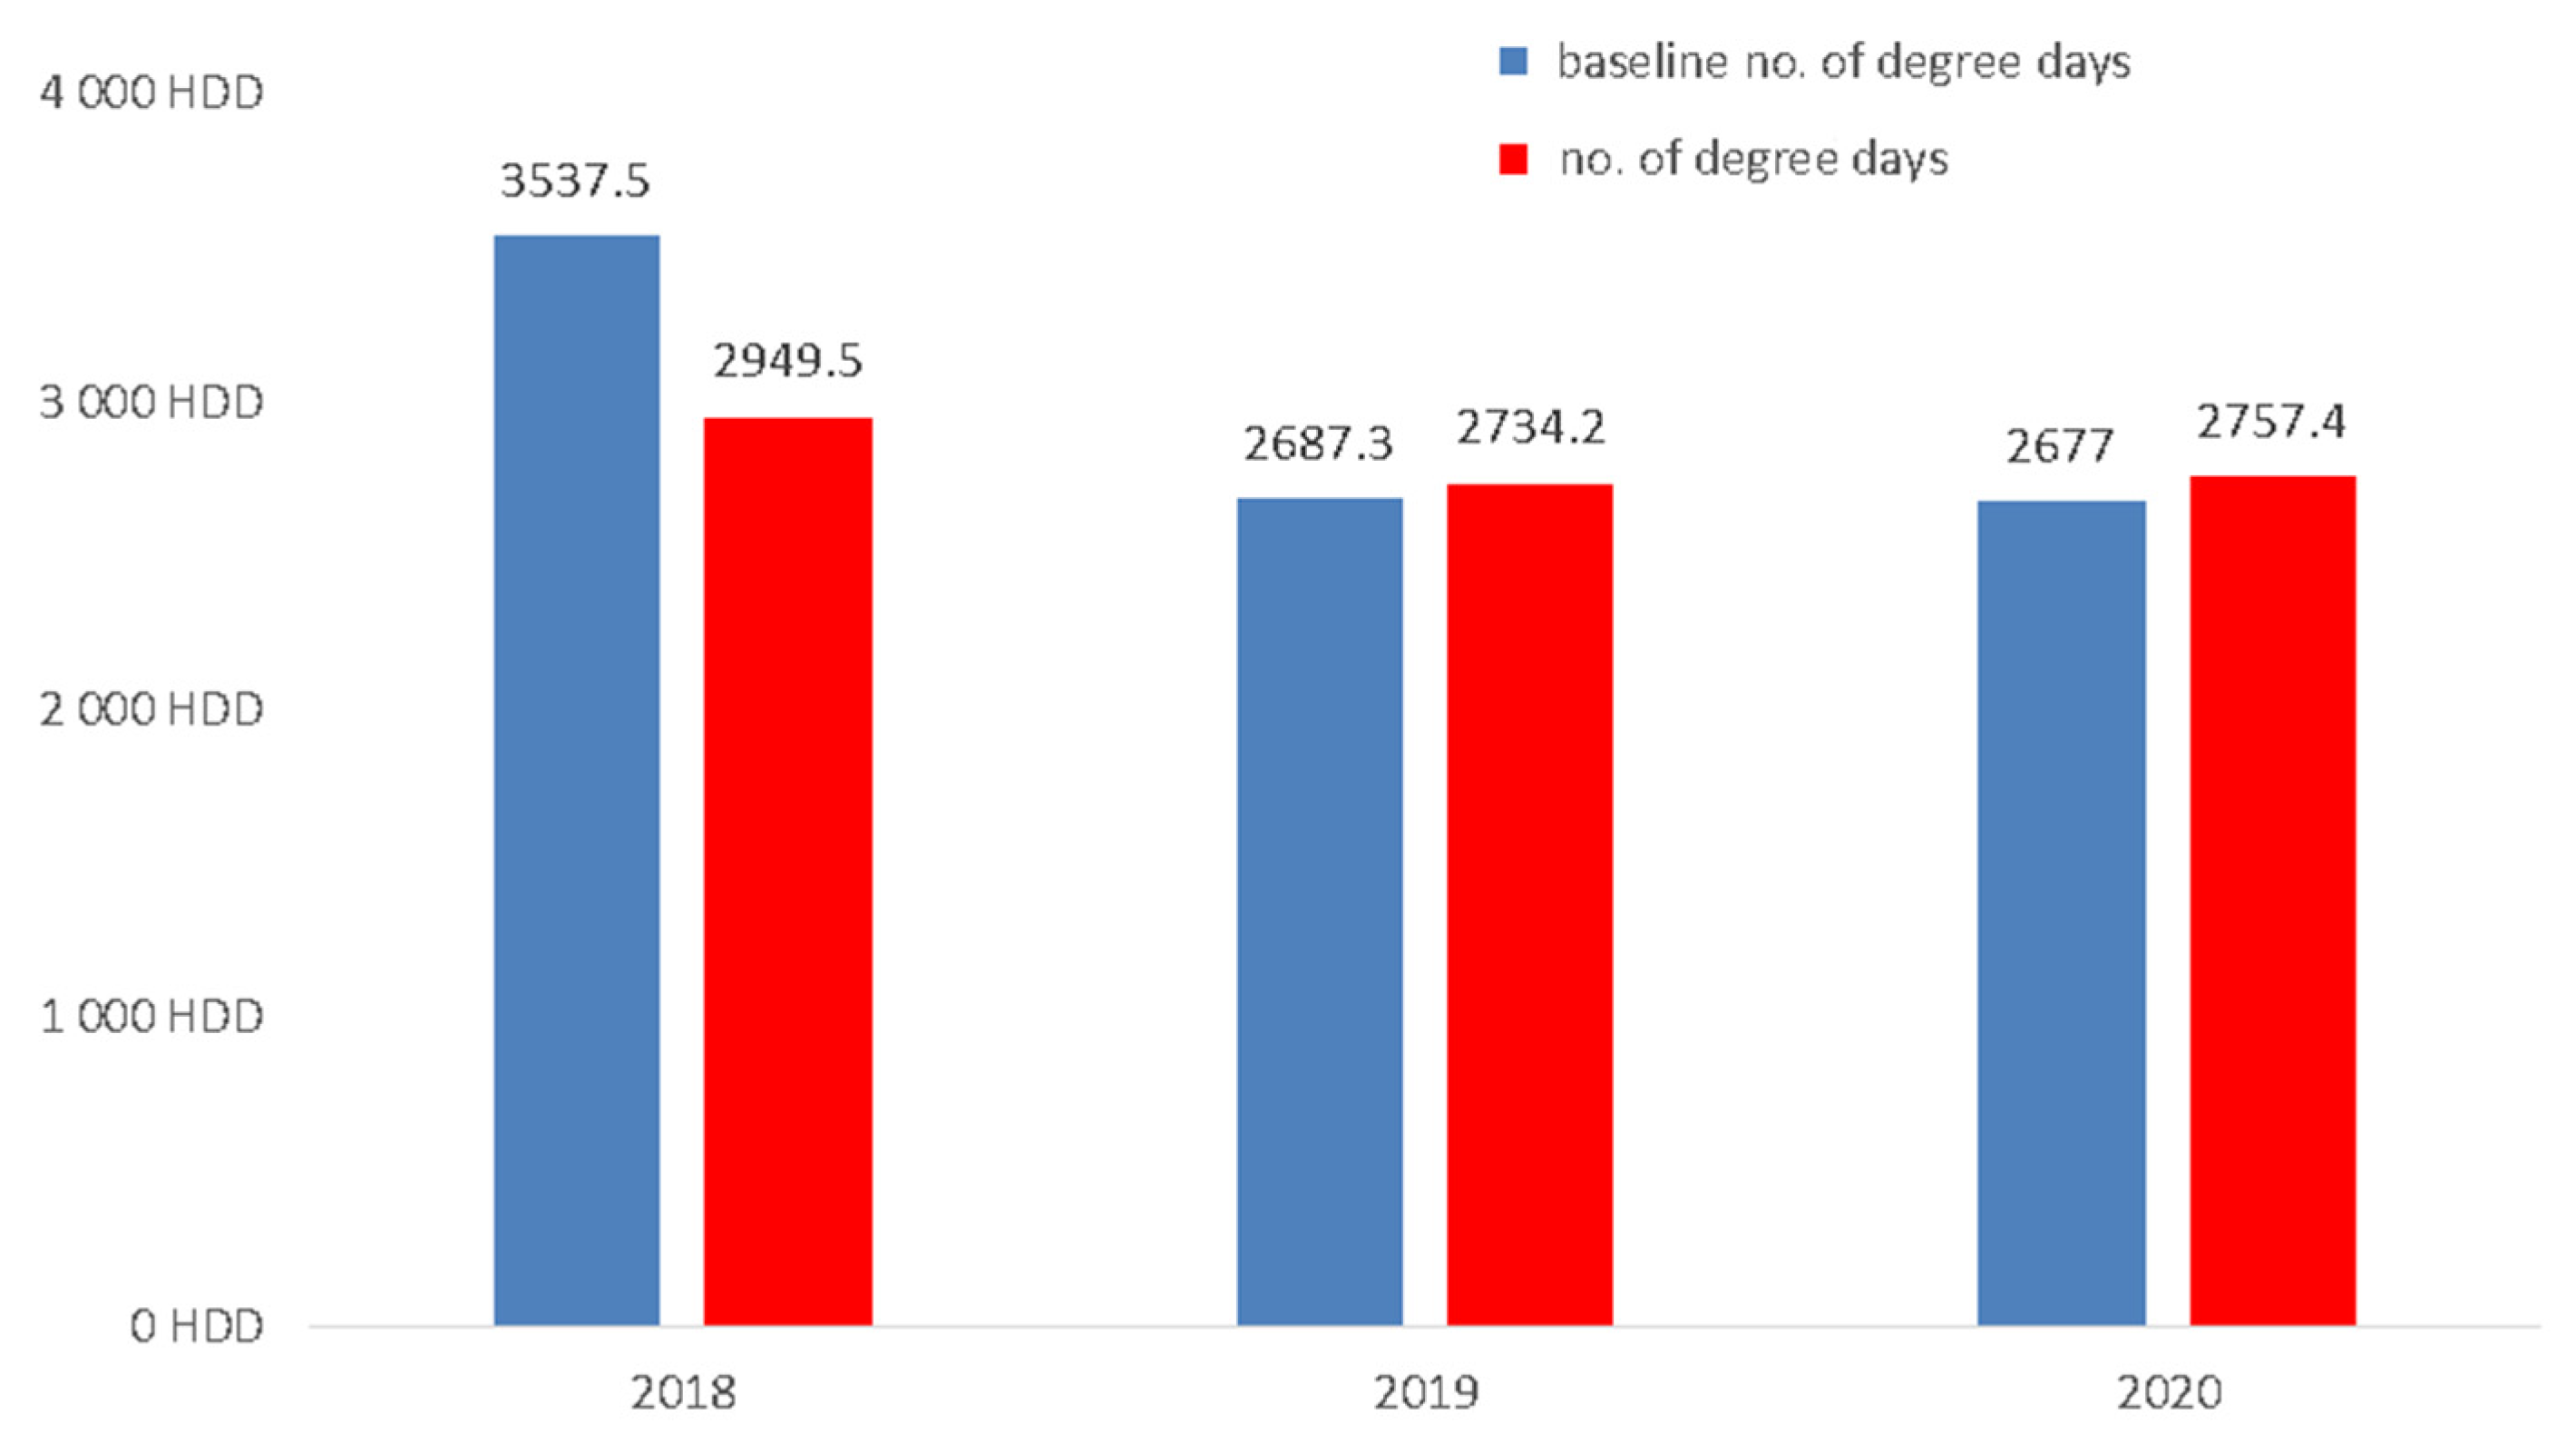
Section 2.2, to compare the real impact of the adopted solutions, the following numbers of heating degree days were taken into account concerning the baseline, which is a base year. In
Figure 1 the numbers of heating degree days between the years 2018 and 2020 are presented.
It is visible that the number of heating degree days in 2018 is almost 20% lower than the baseline. In 2019, the number of heating degree days was 1.7% higher than the baseline, and in 2020, the number of heating degree days was 2.9% higher than the baseline. This implies the necessity of taking into account the number of heating degree days in the assessment of the achieved level of saving.
4.2. Hubgrade Performance Assessment
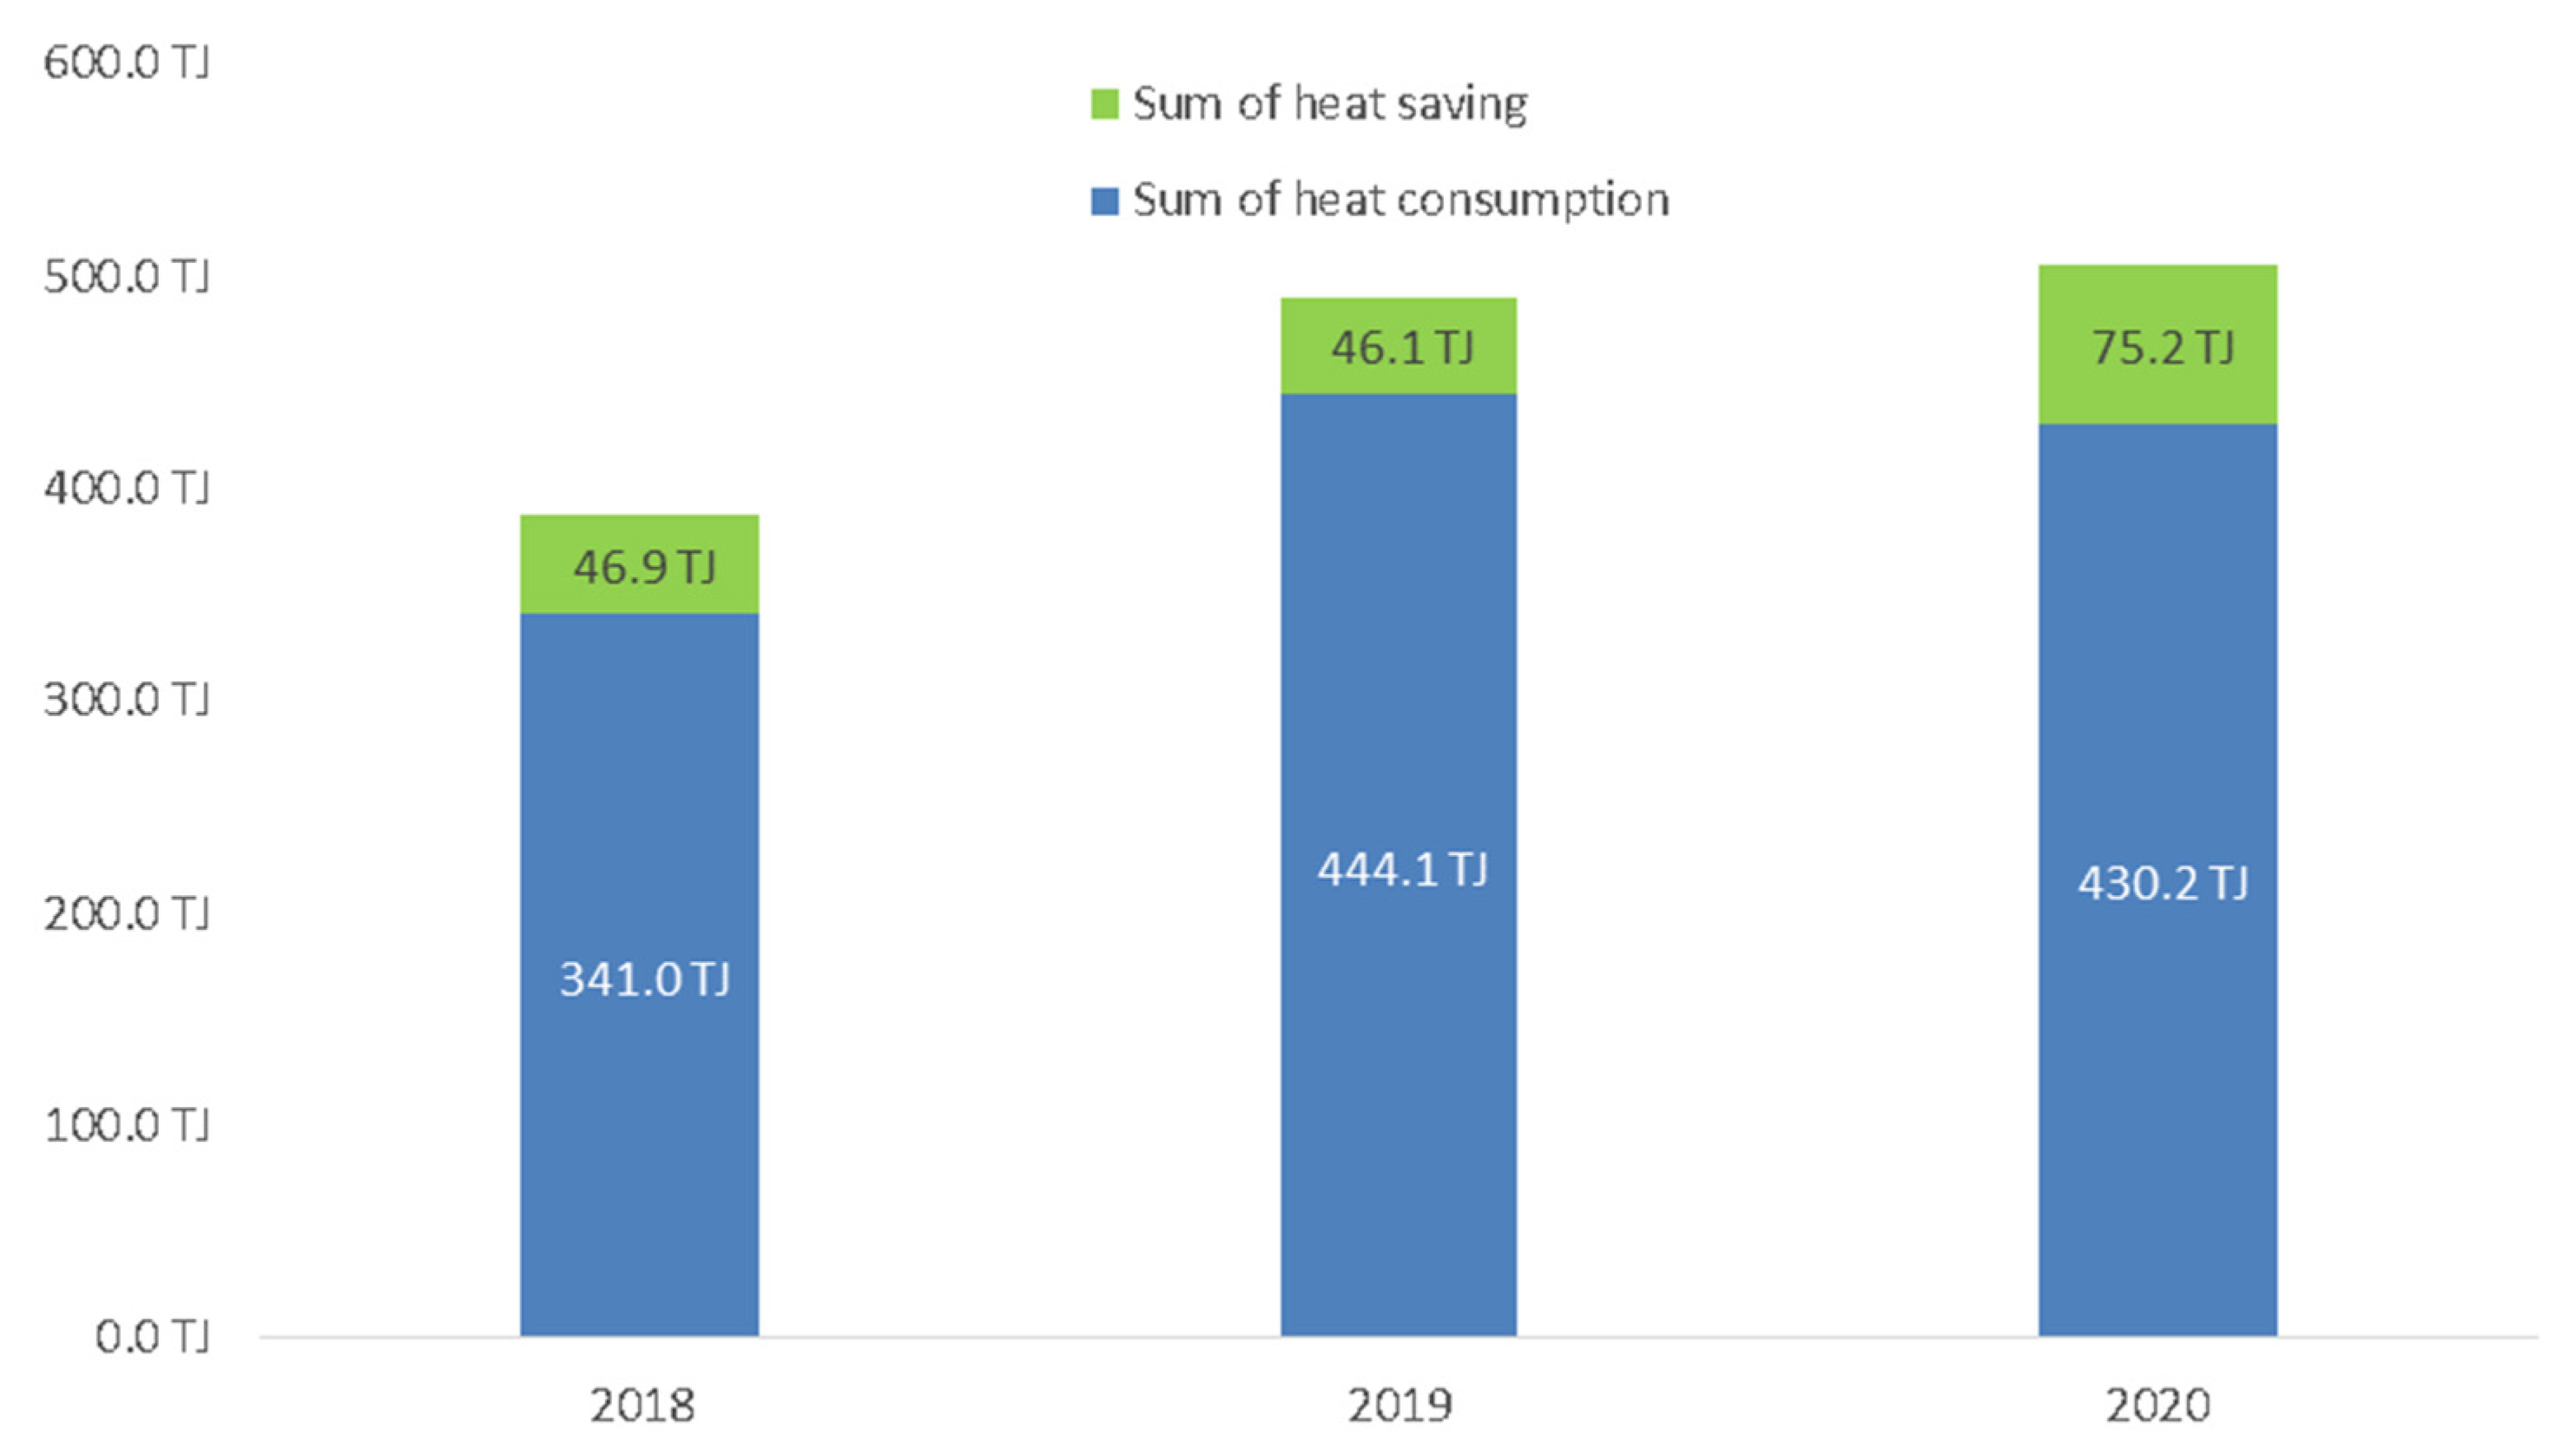
Assessment of the achieved level of savings began by rejecting incomplete data and choosing the complete dataset of consumption and savings between the years 2018 and 2020. The result is shown in
Figure 2.
Then, the following question was posed: if the application of Hubgrade solution had contributed the level of savings or not. The calculated correlation coefficient of Hubgrade application concerning the achieved savings is close to 1, which implies that there is a tight relation between the application of Hubgrade and heating energy saving.
On average, between 2018 and 2020, heating energy saving was at the level of 13.8%. It is worth mentioning that the great majority of buildings in Warsaw that were taken into account have already undergone thermo-modernization.
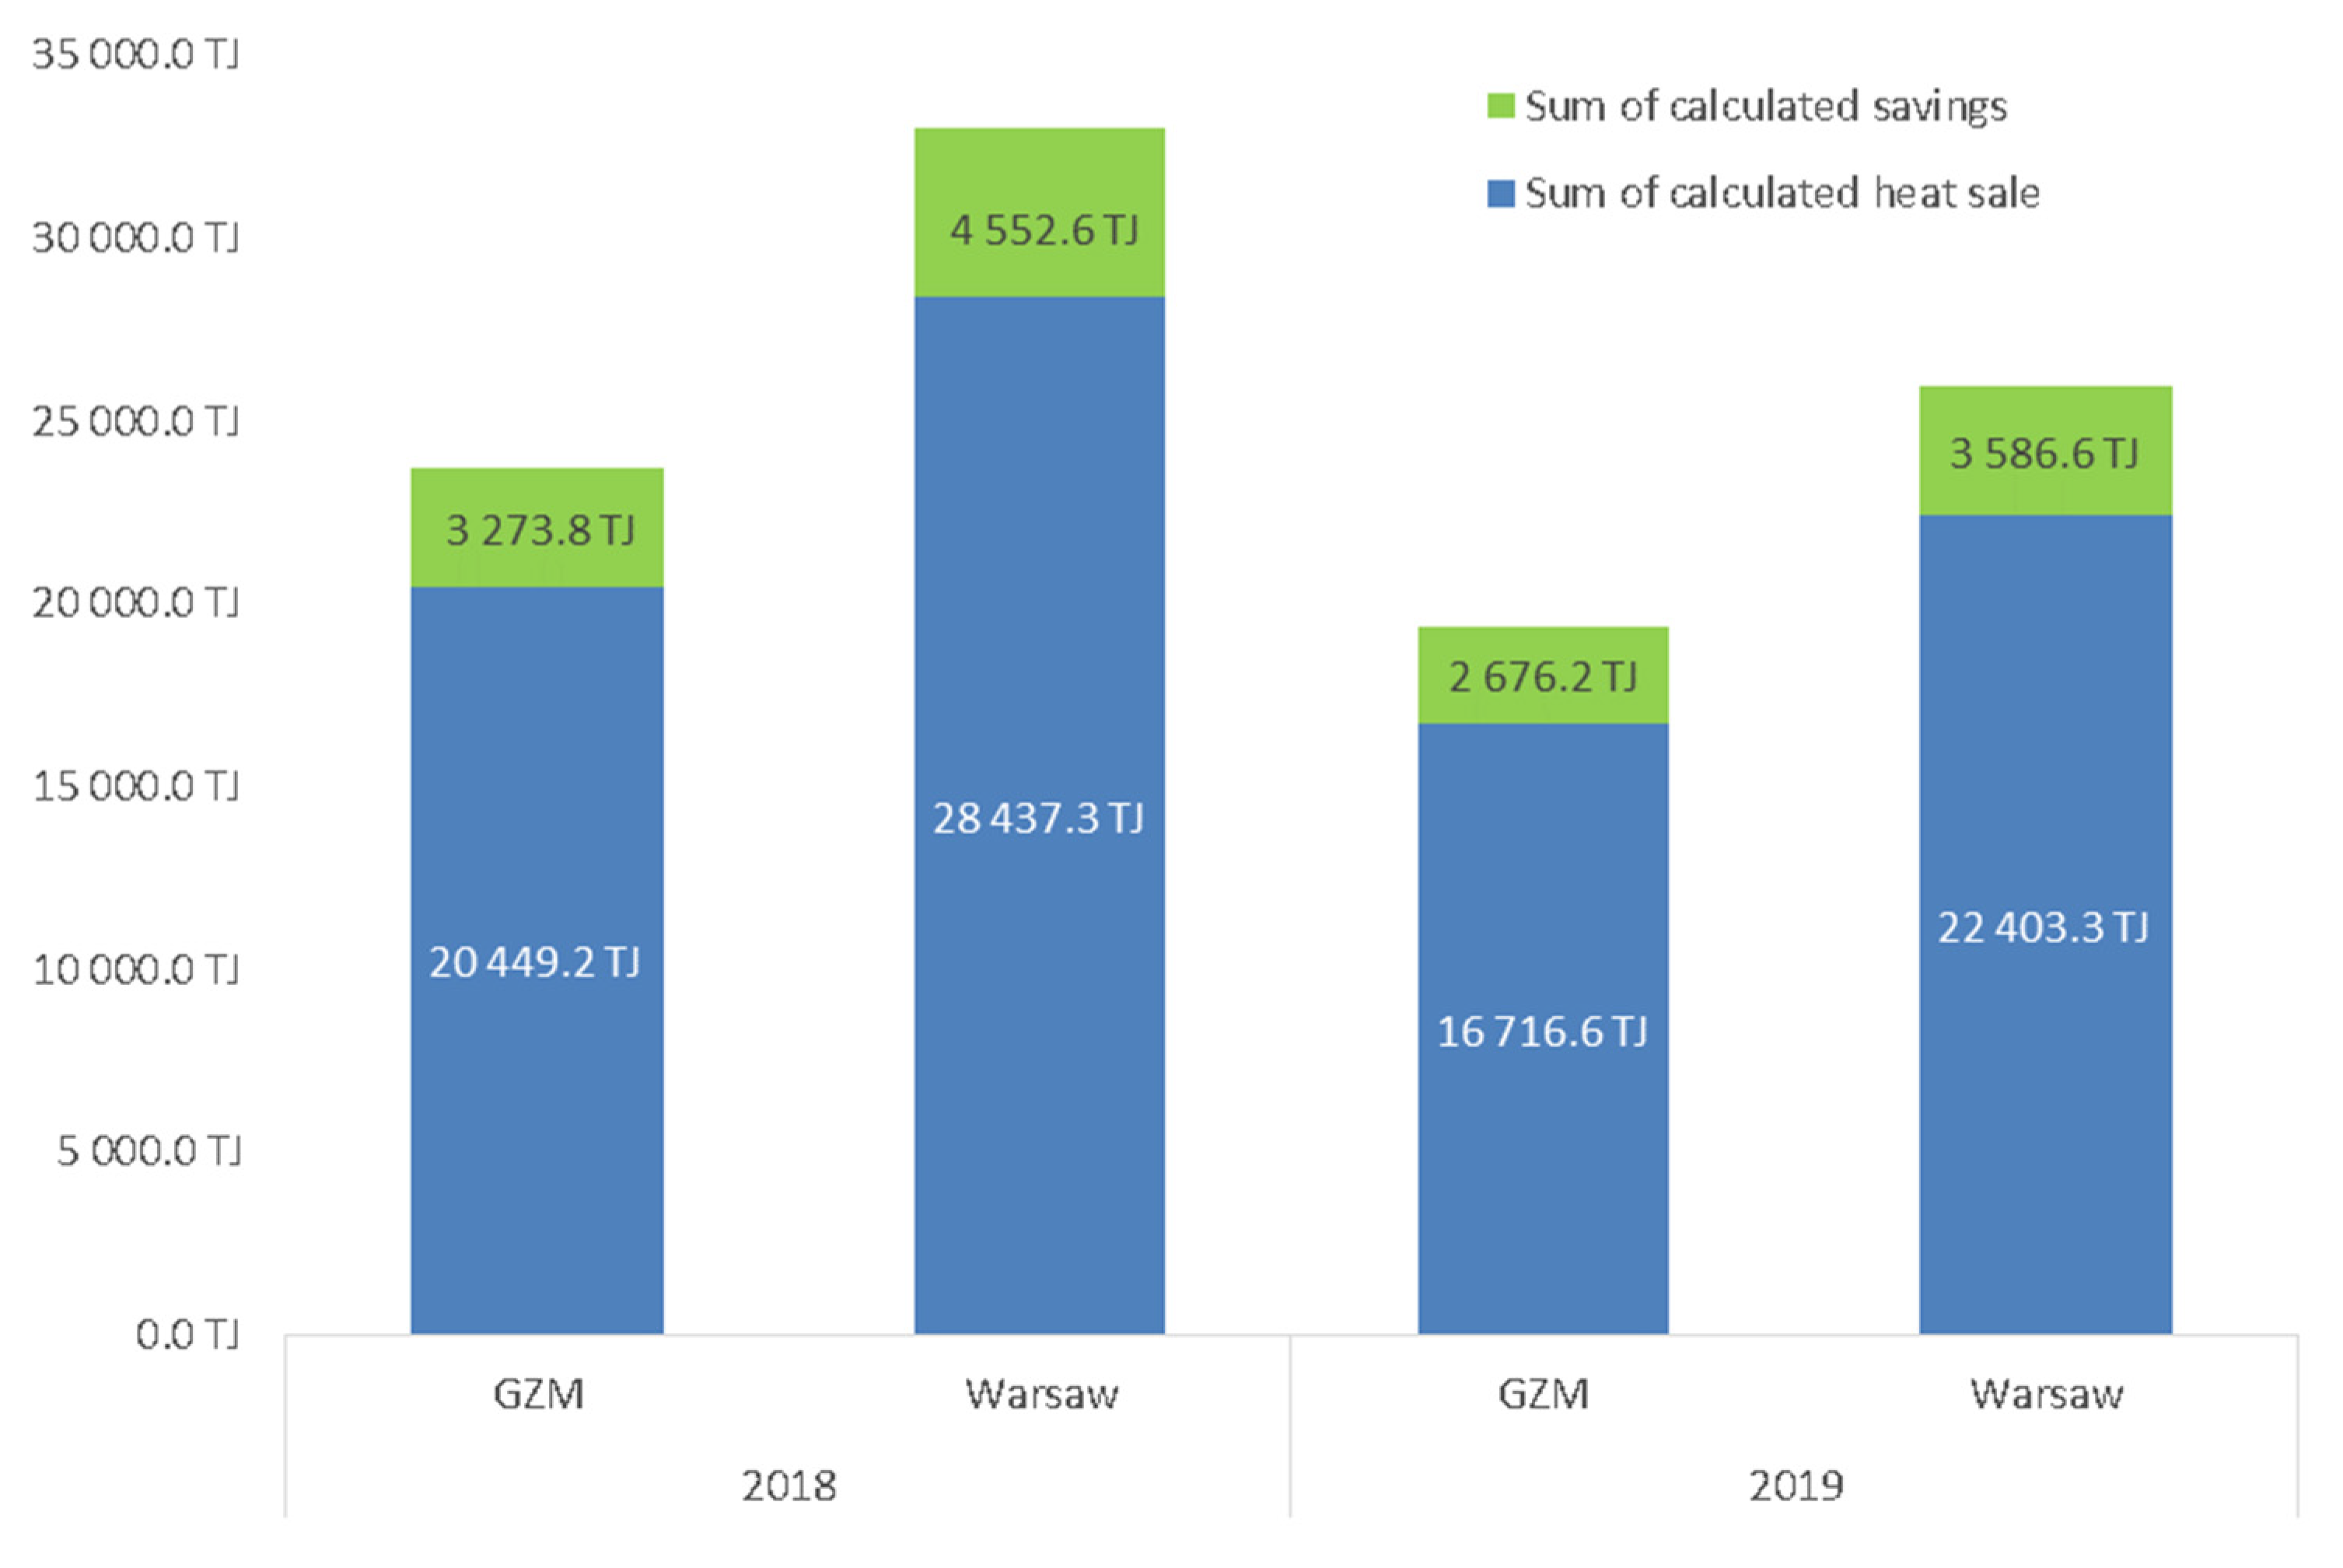
Basing on the achieved results and taking into account comparison of district heating systems in Warsaw and the one in GZM, the following thesis was assumed: both Warsaw and GZM have similar size and potential to apply Hubgrade solution, and, because both these systems are located in the same climate zone, it will be possible to achieve similar results.
Figure 3 presents a simulation of the results of Hubgrade application in the whole GZM and Warsaw district heating systems.
In total, this saving in GZM and Warsaw could reach up to 7044 TJ of heating energy, which is enough to supply heat to the whole of Chorzów city or the whole tarnogórski county.
4.3. Comparison of the Local Means of Energy Production to Forecast the Harmful Emissions Volume
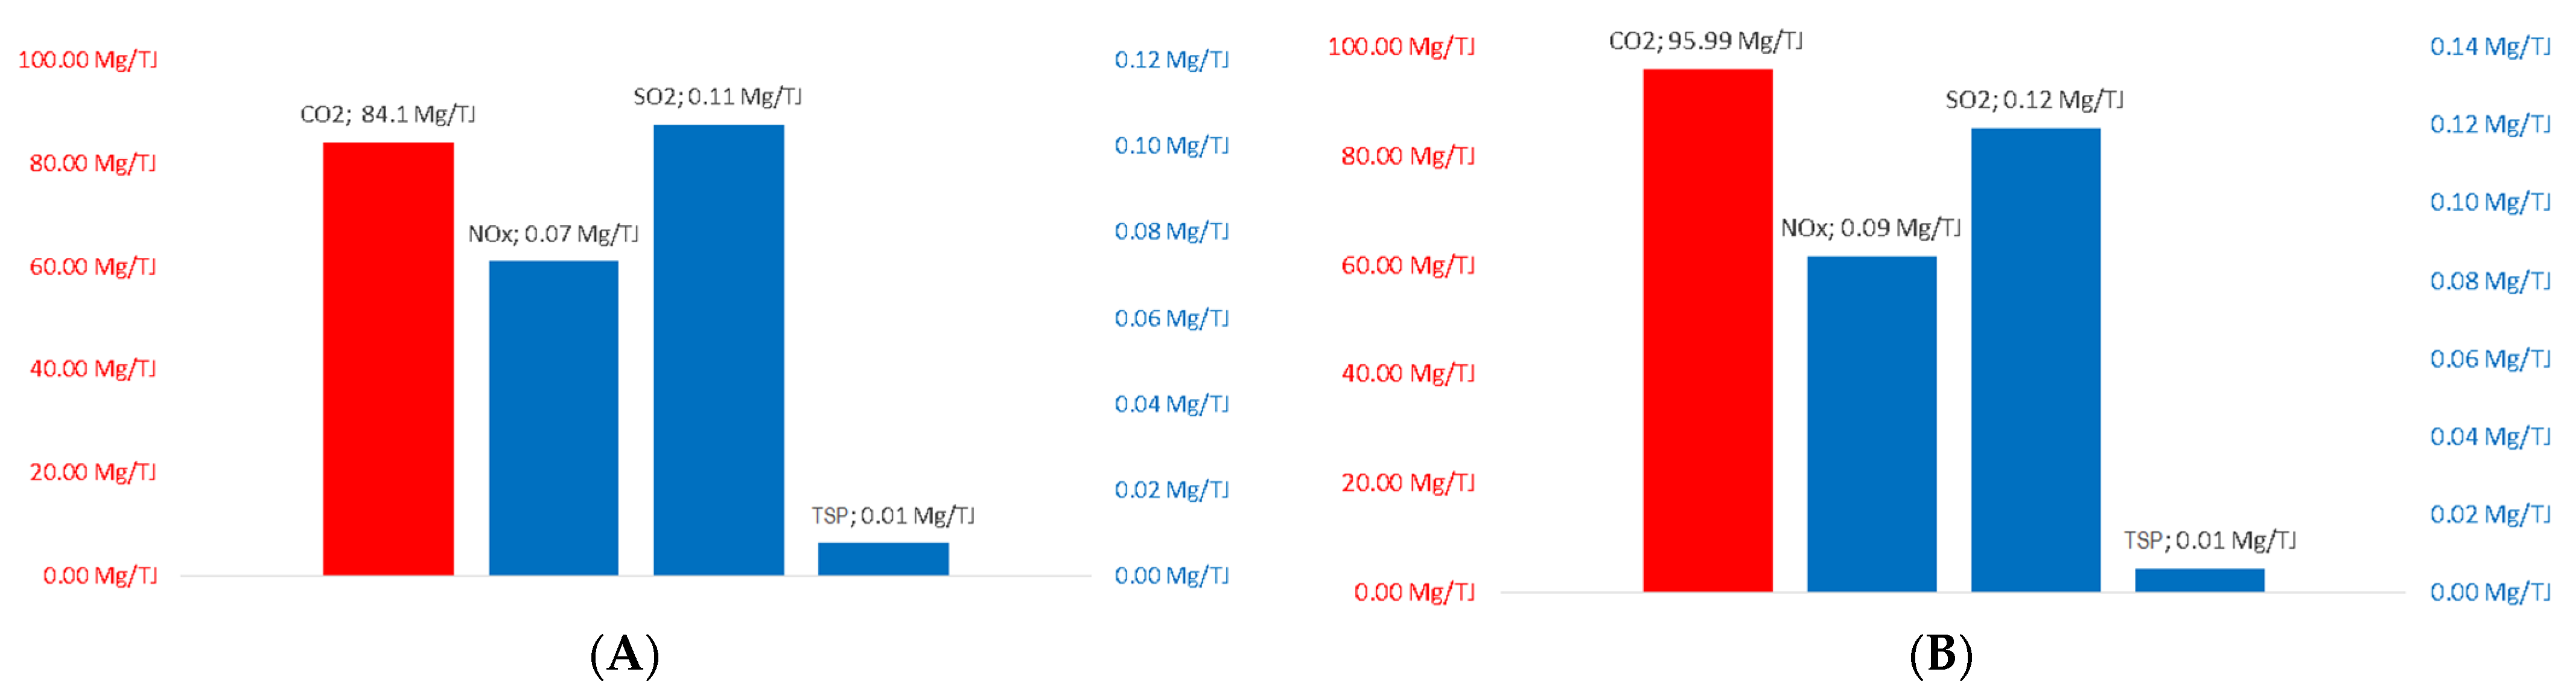
In
Figure 4, fuel mix from GZM and Warsaw is presented. Data for this figure were obtained from the official reports of the appropriate local heat suppliers, and they are as follows:
This would reflect emission reduction as presented in the
Table 2:
The calculated emission savings show that there is a potential of decreasing emission by application of smart control on the local substation. Additionally, it shows that emission of TSP from central heat sources are at a low level in comparison to local unsupervised heat sources.
5. Conclusions
In Poland, there is still huge potential to adopt smart technologies in district heating systems to reduce harmful emissions. The simulated savings of 275 kt CO2 show that it may reduce harmful emissions by 16%. The cost of application of Hubgrade is lower than the cost of changing heat production technology, while it produces significant environmental results without affecting the thermal comfort of the end-user.
Comparison of the two similar district heating systems suggests that there is also a huge diversity of energy production means, and, as a result, absolute values of emissions in one region of Poland can differ from emissions in the other. Results of the study carried out suggest that the absolute values of the GZM emissions are smaller than the ones in the Warsaw district heating system, but at the same time, the potential for emission reductions stays at a very high level.
In more distributed systems, reduction of harmful emissions can be even greater, but at the same time, the options of emissions reduction are greater, i.e., by application of the centrally supervised distributed heat pumps in combination with the existing district heating system. This will be the subject of further scientific investigation.
Author Contributions
Conceptualization, G.K., A.S. and K.C.; methodology, G.K., J.S., A.S. and P.B.; software, K.C.; validation, G.K., A.S. and P.B.; formal analysis, J.S., A.S. and G.K.; investigation, G.K., J.S., A.S. and K.C.; resources, G.K., J.S., A.S. and K.C.; data curation, K.C. and A.S.; writing—original draft preparation, J.S., A.S. and K.C.; writing—review and editing, G.K., J.S., A.S. and P.B.; visualization, K.C., A.S. and P.B.; supervision, G.K. All authors have read and agreed to the published version of the manuscript.
Funding
The project is funded under the program of the Minister of Science and Higher Education titled “Regional Initiative of Excellence” in 2019–2022, project number 018/RID/2018/19, the amount of funding PLN 10788423.16.
Institutional Review Board Statement
Not applicable.
Informed Consent Statement
Not applicable.
Data Availability Statement
The data presented in this study concerning GZM are publicly available. The data concerning Warsaw DHN are available on request from the corresponding author, and these data are not publicly available since they are based on the authors own elaboration.
Conflicts of Interest
The authors declare no conflict of interest.
Abbreviations
| Abbreviation | Meaning |
| BES | Building energy services |
| DHCS | District heating and cooling system |
| DHN | District heating network |
| DHS | District heating system |
| EU | the European Union |
| GZM | Polish: Górnośląsko-Zagłębiowska Metropolia |
| H2020 | Horizon 2020: an EU research and innovation programme with funding available over 7 years (from 2014 to 2020) |
| HDD | Heating degree days: no. of days when the average outdoor temperature is no greater than 14 °C |
| IDS | Intelligent decision system |
| IED Directive | Industrial Emissions Directive 2010/75/EU of the EU |
| IoT | Internet of Things |
| KPI | Heat consumption index |
| LCP Directive | Large Combustion Plant Directive 2001/80/EC of the EU |
| MCP Directive | Medium Combustion Plant Directive (EU) 2015/2193 of the EU |
| PN | Physical Network |
| RES | Renewable energy sources |
| SAB | Smart Active Box, a predictive maintenance system by Arne Jensen AB |
| STORM | Smart Freight Transport and Logistics Research Methodologies, an EU founded project |
| TSP | Total suspended particulate matter |
References
- Gorynia, M.; Matysek-Jędrych, A.; Mińska-Struzik, E. Poland on the path of competitiveness growth. In Competitiveness and Economic Development in Europe; Routledge: London, UK, 2021; ISBN 978-1-00-309536-1. [Google Scholar]
- Dyduch, W.; Chudziński, P.; Cyfert, S.; Zastempowski, M. Dynamic Capabilities, Value Creation and Value Capture: Evidence from SMEs under COVID-19 Lockdown in Poland. PLoS ONE 2021, 16, e0252423. [Google Scholar] [CrossRef]
- Jedynak, M.; Czakon, W.; Kuźniarska, A.; Mania, K. Digital Transformation of Organizations: What Do We Know and Where to Go Next? J. Organ. Change Manag. 2021, 34, 629–652. [Google Scholar] [CrossRef]
- Wójcik-Jurkiewicz, M.; Czarnecka, M.; Kinelski, G.; Sadowska, B.; Bilińska-Reformat, K. Determinants of Decarbonisation in the Transformation of the Energy Sector: The Case of Poland. Energies 2021, 14, 1217. [Google Scholar] [CrossRef]
- Malec, M.; Kinelski, G.; Czarnecka, M. The Impact of COVID-19 on Electricity Demand Profiles: A Case Study of Selected Business Clients in Poland. Energies 2021, 14, 5332. [Google Scholar] [CrossRef]
- Strategy for Metropolis GZM. Available online: https://metropoliagzm.pl/en/stategia/ (accessed on 19 June 2021).
- The European Green Deal. Available online: https://ec.europa.eu/info/strategy/priorities-2019-2024/european-green-deal_en (accessed on 13 November 2021).
- Wojcik-Jurkiewicz, M.; Lubicz-Posochowska, A.; Czarnecka, M.; Kinelski, G.; Sadowska, B. Legal Aspects of Sharing Economy: The Case of Games’ Platforms. Eur. Res. Stud. J. 2021, XXIV, 1196–1210. [Google Scholar] [CrossRef]
- Zamasz, K.; Mucha-Kuś, K.; Sorychta-Wojsczyk, B.; Musioł-Urbańczyk, A.; Tchórzewski, S.; Kinelski, G.; Lis, M.; Wydawnictwo, A.M. Project Management in Public Administration: The Case of Metropolis GZM; Wydawnictwo Adam Marszałek: Toruń, Poland, 2020; ISBN 978-83-8180-323-6. [Google Scholar]
- Drożdż, W.; Kinelski, G.; Czarnecka, M.; Wójcik-Jurkiewicz, M.; Maroušková, A.; Zych, G. Determinants of Decarbonization—How to Realize Sustainable and Low Carbon Cities? Energies 2021, 14, 2640. [Google Scholar] [CrossRef]
- Grzegórska, A.; Rybarczyk, P.; Lukoševičius, V.; Sobczak, J.; Rogala, A. Smart Asset Management for District Heating Systems in the Baltic Sea Region. Energies 2021, 14, 314. [Google Scholar] [CrossRef]
- Li, H.; Nord, N. Transition to the 4th Generation District Heating—Possibilities, Bottlenecks, and Challenges. Energy Procedia 2018, 149, 483–498. [Google Scholar] [CrossRef]
- Pająk, K.; Kinelski, G. Competitive Market and Sources of Its Advantages in the Electric Energy Subsector. Prog. Econ. Sci. 2017, 4, 347–360. [Google Scholar] [CrossRef]
- Kinelski, G. The Main Factors of Successful Project Management in the Aspect of Energy Enterprises’ Efficiency in the Digital Economy Environment. Polityka Energy Energy Pol. J. 2020, 23, 5–20. [Google Scholar] [CrossRef]
- Lund, H.; Werner, S.; Wiltshire, R.; Svendsen, S.; Thorsen, J.E.; Hvelplund, F.; Mathiesen, B.V. 4th Generation District Heating (4GDH). Energy 2014, 68, 1–11. [Google Scholar] [CrossRef]
- Boesten, S.; Ivens, W.; Dekker, S.C.; Eijdems, H. 5th Generation District Heating and Cooling Systems as a Solution for Renewable Urban Thermal Energy Supply. Adv. Geosci. 2019, 49, 129–136. [Google Scholar] [CrossRef] [Green Version]
- Buffa, S.; Cozzini, M.; D’Antoni, M.; Baratieri, M.; Fedrizzi, R. 5th Generation District Heating and Cooling Systems: A Review of Existing Cases in Europe. Renew. Sustain. Energy Rev. 2019, 104, 504–522. [Google Scholar] [CrossRef]
- Loureiro, T.; Rämä, M.; Sterling, R.; Cozzini, M.; Vinyals, M.; Descamps, M.; Birk, W.; Unkaya, G.; Fuligni, F.; Doračić, B.; et al. District Energy Systems: A Collaborative Exchange of Results on Planning, Operation and Modelling for Energy Efficiency. Proceedings 2018, 2, 1127. [Google Scholar] [CrossRef] [Green Version]
- Flexynets. Available online: http://www.flexynets.eu/en/ (accessed on 13 June 2021).
- STORM. Available online: https://storm-dhc.eu/en (accessed on 13 June 2021).
- InDeal. Available online: http://www.indeal-project.eu/ (accessed on 13 June 2021).
- OPTi. Available online: http://www.opti2020.eu/ (accessed on 13 June 2021).
- BES—Hubgrade (Building Energy Services—Hubgrade). Available online: https://energiadlawarszawy.pl/zarzadzanie-energia-cieplna-w-budynku/ (accessed on 13 June 2021).
- The Structure of Primary Fuels Used to Generate Heat in 2020 for the Needs of the Warsaw District Heating System. Available online: https://energiadlawarszawy.pl/wp-content/uploads/sites/4/2021/04/Struktura-paliw-2020.pdf (accessed on 13 June 2021).
- NODA Smart Heat Grid SolutionsTM & NODA Smart Heat Building SolutionsTM. Available online: http://noda-polska.pl/ (accessed on 13 June 2021).
- SAB—Smart Active Box. Available online: https://www.smartactivebox.com/sab/ (accessed on 13 June 2021).
- ISENSE. Available online: https://www.vexve.com/en/isense/ (accessed on 13 June 2021).
- Statistics Poland—Heating Network in Licensed Entities; GUS: Warszawa, Poland. Available online: https://stat.gov.pl/ (accessed on 13 November 2021).
- Statistics Poland—Cubic Volume of Buildings with Central Heating by Location; GUS: Warszawa, Poland. Available online: https://stat.gov.pl/ (accessed on 13 November 2021).
- Statistics Poland—Sale of Heating Energy during the Year by Location; GUS: Warszawa, Poland. Available online: https://stat.gov.pl/ (accessed on 13 November 2021).
| Publisher’s Note: MDPI stays neutral with regard to jurisdictional claims in published maps and institutional affiliations. |
© 2021 by the authors. Licensee MDPI, Basel, Switzerland. This article is an open access article distributed under the terms and conditions of the Creative Commons Attribution (CC BY) license (https://creativecommons.org/licenses/by/4.0/).


 ,
, 


