1. Introduction
The amount of urban domestic garbage waste grows rapidly with economic and social development in developing countries and this includes China, where it reached 343 million tons in 2019 [
1]. The first priority was to control environmental hazards, so facilities for sanitary landfill (53.0%) and mixed waste incineration (43.8%) were increased initially [
2]. Then attention turned to food waste, which comprises 50–70% of urban domestic garbage in China (nearly 20% higher than averaged globally) [
3]. This food waste component is the source of many of the serious environmental problems created when the mixed waste goes into landfill and incineration, because it produces methane and leachates [
4,
5]. If food waste is sorted and diverted into processes, such as composting or anaerobic digestion (AD), then much lower carbon emissions will be produced [
6,
7]. Furthermore, the diversion of food waste in China would create other benefits through more effective use and re-use of resources and land use [
7]. In China, as with other countries, the pathway to achieving tangible improvements in food waste diversion has been very slow; there are very few long-term, large scale successful food waste sorting program in the world. Only some unsuccessful or small-scale pilots in the USA [
6], e.g., from producer-pay related policies; in Chinese Taiwan from policies requiring residents to meet the waste trucks on the street [
8]; community-based bespoke pilots in Sweden [
9], Thailand [
10] and Umea [
11]. However, in Shanghai there have finally been significant indicators of success seen since the introduction of the 2019 policies. In this paper we focus on step-wise improvements to energy production from waste management which were identified immediately after the 2019 policy implementation in Shanghai, and investigate why they are being achieved now instead of previously.
China has progressed through several rounds of national programs since 2000 to develop waste sorting systems. However, most of them failed, or were not considered successful, because of different reasons [
3]. The main challenge was that a complete, multi-sectoral waste sorting management system cannot be built all at once [
7], as it requires four interrelated domains of: waste sorting at source, separate waste type collections, separate transportation, and separate treatment. These occur at different levels and with different stakeholders; in Shanghai, the waste sorting and collection happens at the community level, transportation must be coordinated between public and private agencies, and appropriate facilities require investment, construction and city planning permissions. If there is something wrong in any stage, the whole urban waste sorting management system cannot run effectively. For example, several large-scale composting projects failed because residents did not sort at source properly and the material was contaminated with non-organics; this cancelled the benefits of the bespoke collection and transportation systems [
12]. By the time the residents developed better sorting skills and habits, the AD investment might have switched to incineration—much lower resource value, and does not need the expensive separate collection/transportation already set up. Thus, although the performance of residents in sorting their waste is an ongoing and pervasive challenge globally [
11], getting all the stakeholders to align at the same time was also elusive.
China’s national approach towards residential recycling unfolded over many years. In 2017 a new policy: “State Council on Forwarding the Notice of the Implementation Plan of the Waste Classification System of the Ministry of Housing and Urban-Rural Development (MOHURD)” set targets of a minimum of 35% for recycling rates for domestic waste by 2021, and 46 important cities were designated to implement waste sorting [
13]. Recently that work has accelerated [
14], and by January 2021 twenty-five of those cities had brought in municipal domestic management regulations. Five provincial governments also established municipal domestic management regulations by 2020 [
15]. Shanghai is one of those five provinces.
Shanghai is the biggest city in the world with a population of 24 million, with rapid recent growth as part of a national urbanization program. It has gone through several long-term stages of reflective development of waste sorting programs and policies, as summarized in
Table 1 [
16]. There were initial pilot programs at community level, and repeated changes to the categories of waste separation as more local experience was gained and the city systems changed. From 2014 the same four categories of waste have been used (hazardous waste, recyclables, food waste and residual waste), and pilot systems were trialed at increasingly bigger scales (at ward and then district levels). In parallel, much development of legislation pathways occurred, culminating in the passing of the Shanghai Municipal Domestic Waste Management Regulations in January 2019. Finally, these were made compulsory for implementation in July 2019, and immediately after this, a significant increase in sorted food waste was reported (detailed below).
In this paper we wish to report on our investigation of the impact of this major milestone of waste management on the diversion of food waste, with its consequences for energy production. We will make use of official Municipal published data on waste streams, supplemented with comparisons to our own field data spanning several years. We will also make use of energy production data provided by facilities locally to estimate actual energy production changes since the July 2019 legislation. We find that energy production from waste had step-wise increases correlated to the July 2019 legislation, which suggests that outputs from infrastructure should perhaps not be judged without knowledge of possible blockages from behavioral dimensions. However, further specialized studies would be needed to show a causal link.
2. Materials and Methods
The research question is: What was the impact of the July 2019 law, compared to the accumulation of prior policy implementation work, on energy production from food waste? Our methodology was to identify contributing factors and impacts and then examine if they were likely due to this law, or prior government actions. To conduct this, we would: (i) identify the unique elements of the July 2019 policy; (ii) identify the implementation activities related to them, both those put in place long before and soon after July 2019; (iii) scrutinize government tonnage data on waste and recycling streams immediately before and after July 2019.
2.1. Policy Analysis—What Elements in this Policy Are Different?
We analyzed the concepts embedded in the waste sorting policies published before the July 2019 law and those within it, to determine which were unique to the latter. This included the responsibilities of all related government departments, different levels of government, and residents in (typically walled and gated) communities, transportation, and final disposal arrangements. The requirements for the policy implementations were also compared.
2.2. Implementation Activities—Just before and after July 2019?
We extracted information on ongoing waste policy implementation from our own studies in Shanghai since 2011 [
17,
18,
19,
20,
21,
22,
23,
24,
25,
26] and from current ongoing studies, to determine which, if any, recent implementation activities affiliated with the July 2019 policy were different to previous ones. These data held by our own research team includes observations in more than 100 communities, semi-structured interviews of key informants from a wide range of stakeholders, including government authorities at municipal, district, and ward level, Chinese not-for-profit groups, local residents, community committee members, resident associations, and estates management companies.
2.3. Reported Tonnages, Disposal Methods and Energy Production
We researched and analysed official government sources of information with respect to pre/post July 2019 to understand the impacts of the new policy in particular (compared to the accumulated effect of previous ones) on the tonnages, disposal methods and energy production efficiencies of the main waste streams.
3. Results
3.1. Policy Analysis—New Elements in this Policy
A very important difference in the policy of July 2019 was that it passed into law in the Shanghai Municipal People’s Congress. This means it has a legal status. The other policies before July 2019 did not.
Second, it contains many detailed requirements for particular roles and responsibilities of different stakeholders, such as the different departments and levels of government authorities, community committees, housing associations, residents, and related businesses. Of those, the biggest change was for residents and the emphasis of their waste sorting responsibility at a community level. The specification is very clear: residents are responsible for sorting at source, not the recycling volunteers or assistants, and not the cleaners.
Third, there was a clear indication that third parties—and especially Chinese NFP organizations—with expertise in public engagement and/or environmental topics were useful, and local government authorities were encouraged to buy their services. This was not the case in earlier policies but was increasingly so, and parallel policies were developed which gave official status to such third parties, in particular the use of their services for community work, and to provide training and support for local volunteers who would encourage residents in their new behavior of sorting out food waste.
Fourth, for the government authority at street/ward level, and the local governance body of the community committee, the management of waste sorting became, formally, a regular and important job to be monitored by higher government authorities every month or quarter. Previously, it was only focused on during periods when higher government authorities temporarily emphasized it.
3.2. Implementation Activities Observed in the Field before and after this Policy
As illustrated in
Figure 1, the July 2019 policy was associated with significant changes to the entire waste management system across the dimensions of community-level sorting, collection and treatment.
Prior to July 2019, many Shanghai residents could place their unsorted waste in bins available at each floor of the apartment buildings, or at least near the building entrance. Cleaners affiliated to that community would be permitted to remove from these recyclable materials if they wished, for private sale to informal collectors (many residents also accumulated recyclables in their homes and then called informal collectors to purchase them at the door). Any central community ‘waste stations’ were similar to sheds, only used for storage. Usually, a bin for hazardous waste could also be found there, or near the community gate.
Over several years, while the government invested in facilities and equipment, improvements in recycling performance were not seen—and this was found to be for several reasons [
17]. Some communities had made a few changes as early as 2015, as part of pilot programs, but these were not necessarily taken seriously or productive for good sorting, depending on each local case. Some communities had piloted particular types of programs, such as one based on smart cards, where residents could obtain credits for correct sorting [
25]. Some communities had experienced mismatched programs, such as information-based ones [
19], which sometimes did not actually provide appropriate bins for sorting. Others had intensive involvement of volunteers [
20,
21,
22], and increasingly, local Chinese not-for-profit organizations offered localized advice [
24] and improvements in the use of door-stepping [
18], but these might then stop abruptly, and many experienced more than one pilot program and changes to their recycling systems. However, after the July 2019 law, all communities were consistently prepared and ready; any bins still inside residential buildings in the city were removed, and residents now had to walk to the waste stations situated in their communities—normally within 400 m, which was known not to diminish recycling performance [
23]. These were new or refurbished to contain four categories of bins (food waste, recyclables, hazardous and residual), information posters, a hand-washing sink, and sometimes a tool to break open bags. In total the city had provided over 21,000 new or refurbished waste stations over several years, one for every 300–500 households. When the new law arrived in 2019, volunteers and cleaners would take shifts during busy periods, recommended to be a total of four hours every day, for at least 6 weeks, standing at the waste station to explain and demonstrate to residents how to sort their waste—including emptying their bags of food waste into the correct bin and throwing the empty bag elsewhere. The new law was highly publicized across the city, and it was very clear that the residents had the role of separating their waste before depositing it. The volunteers and cleaners were only there to help, guide or remind them. Residents could in principle be financially penalized (fined) for repeated flouting of their responsibility to sort, but this rarely happened, and residents were mostly simply instructed to correct their actions [
27].
At the transport stage, the single-type residual waste trucks were replaced with four different types, one for each waste category (
Figure 1). Most of the recyclables arriving in the community bins continued to be collected by the cleaners, but they now sold these onwards to formal collectors: organized service providers situated in each ward with government-subsidized warehousing or storage if needed. These formal collectors could buy and document many types of recyclable waste, regardless of whether it had high or low value. Sometimes the local government incentivized the collection of lower-value waste, such as yoghurt containers.
At the final treatment stage, the pre-existing landfill and incineration disposal facilities were augmented with many different technologies, usually piloted by businesses. For example, compost and anaerobic digestion facilities for food waste, and a wider range of options for recyclable materials and some hazardous waste.
Altogether this meant that, for the first time, every stakeholder in the urban waste management system had their roles relative to others encased in legislation: the different elements were related to each other in a holistic document which defined how they, together, comprised the final city-wide system. Although many stakeholders had been ‘rehearsing’ their roles for some time, this was the first time that all residents and their related local governance systems (community and ward offices) were integrated into the rest of the system in an enforceable legislative manner.
3.3. Recycling Performance Results
Data on waste sorting performance in terms of tonnages of waste streams and contamination data, before and after the July 2019 law, were collected from Shanghai government brief reports and announcements published online at different times [
28,
29,
30]. (This is commonly how such government information is published). The installed capacities of different disposal methods, and data about their operation factors before and after July 2019, were obtained from relevant staff at the Shanghai Landscaping and City Appearance Administrative Bureau, which is the main department responsible for waste sorting. This allowed us to estimate the overall energy production coming from incineration and anaerobic digestion.
3.3.1. Changes in Tonnages of Waste Streams before and after the New Law
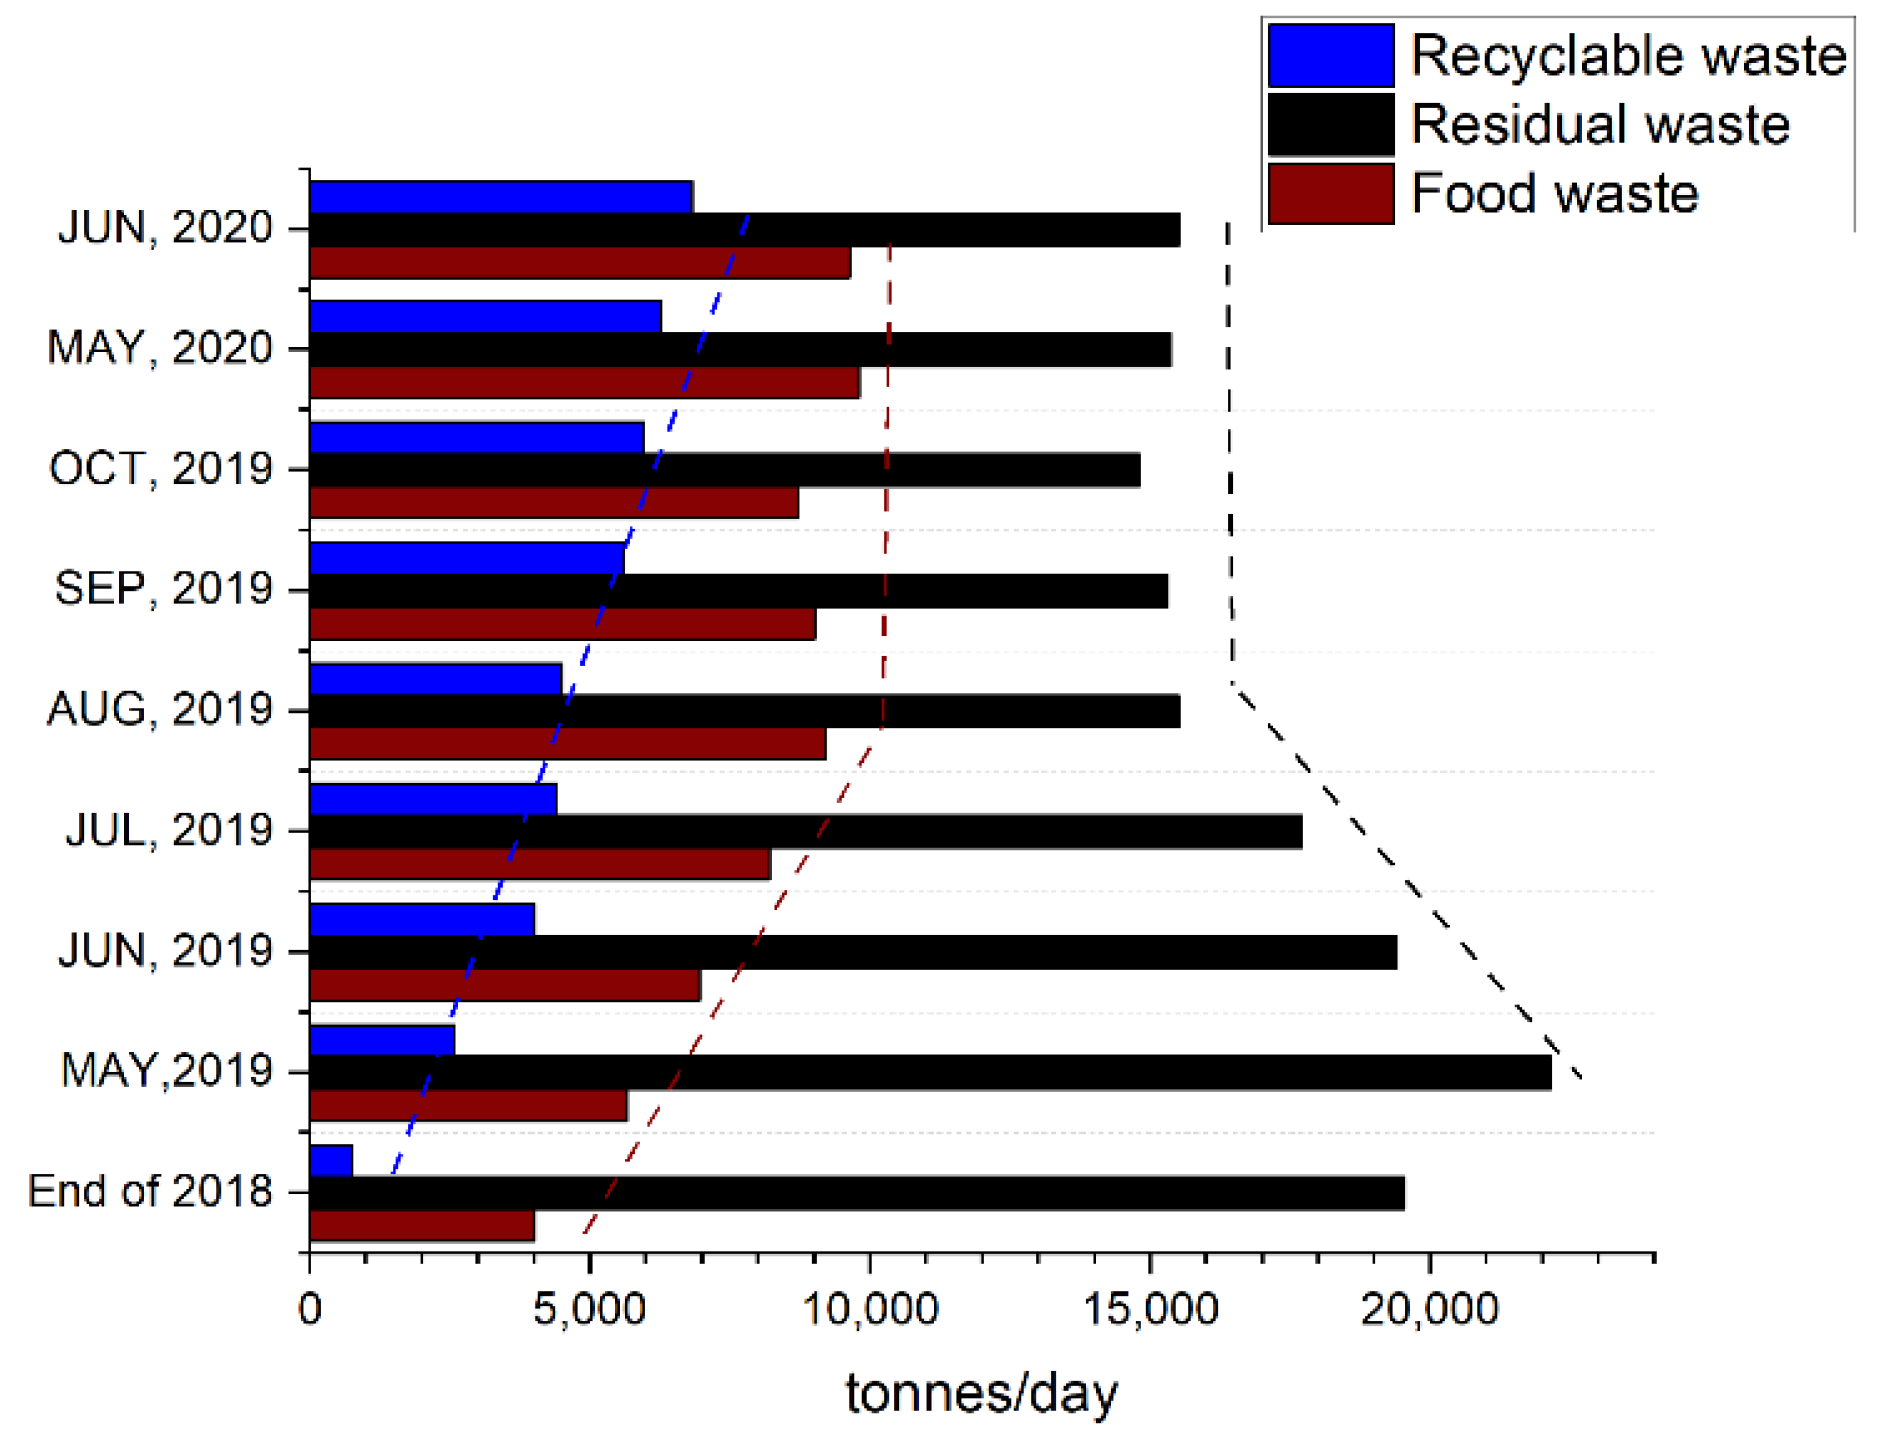
Figure 2 shows the total tonnages of Shanghai’s different waste streams per day from the end of 2018 to June 2020 [
28,
29]. The sorted food waste tonnage increased sharply from 4000 t/day to become stable at 9000–10,000 t/day. The tonnage of the residual waste decreased quickly from about 20,000 t/day to become stable at about 15,000–16,000 t/day. The total weight of sorted recyclables waste collected formally increased very sharply from 750 t/day to about 7000 t/day, and the hazardous waste also increased quickly from 0.27 t/day to 3.3 t/day. In sum, the mixed residual waste decreased, as the sorted specialized waste streams increased.
3.3.2. Changes in Contamination Levels
Contamination levels were not generally measured or well-documented until as late as 2018. Any values that our research team were able to elicit from government officials or community workers were always found to be rough estimates made by eye: if there were formal measures, we were not able to find them. Our own series of research studies [
17,
18,
19,
20,
21,
22,
23,
24,
25,
26] showed that in most cases the contamination levels were so bad that the so-called ‘sorted’ food waste streams were indistinguishable from the ‘unsorted’ stream, labelled ‘residual’ [
17]. Only communities with high levels of interest from the residents, who for example saw themselves as an ‘eco-community’, or those with a deep impact from local volunteers or Chinese NFPs, appeared to produce sorted food waste with low contamination [
20]. Even the communities with incentives delivered by smart cards (also known as Green Account [
23]), did not show good results for decreasing contamination. This state of affairs reflects the emphasis of the Municipality to first focus on rolling out facilities, and only later on contamination levels (CL) and participation rates (PR).
Immediately after the July 2019 policy, Shanghai Municipality reported that 60% of communities were doing a ‘good job’ with contamination levels [
29]. Two years later in July 2021, it reported ‘nearly 100%’ [
30]. One of the ways in which the CL were controlled was that the collection vehicle crews were told to reject waste from communities which were contaminated. Government staff reported that cameras were used to inspect the CL from the collection vehicles as they unloaded onto boats (to be transported further in larger containers). Soon, standards of CL < 2% were being achieved.
3.3.3. Changes in Disposal Treatment of Waste before and after the New Law
As shown in
Figure 3 and
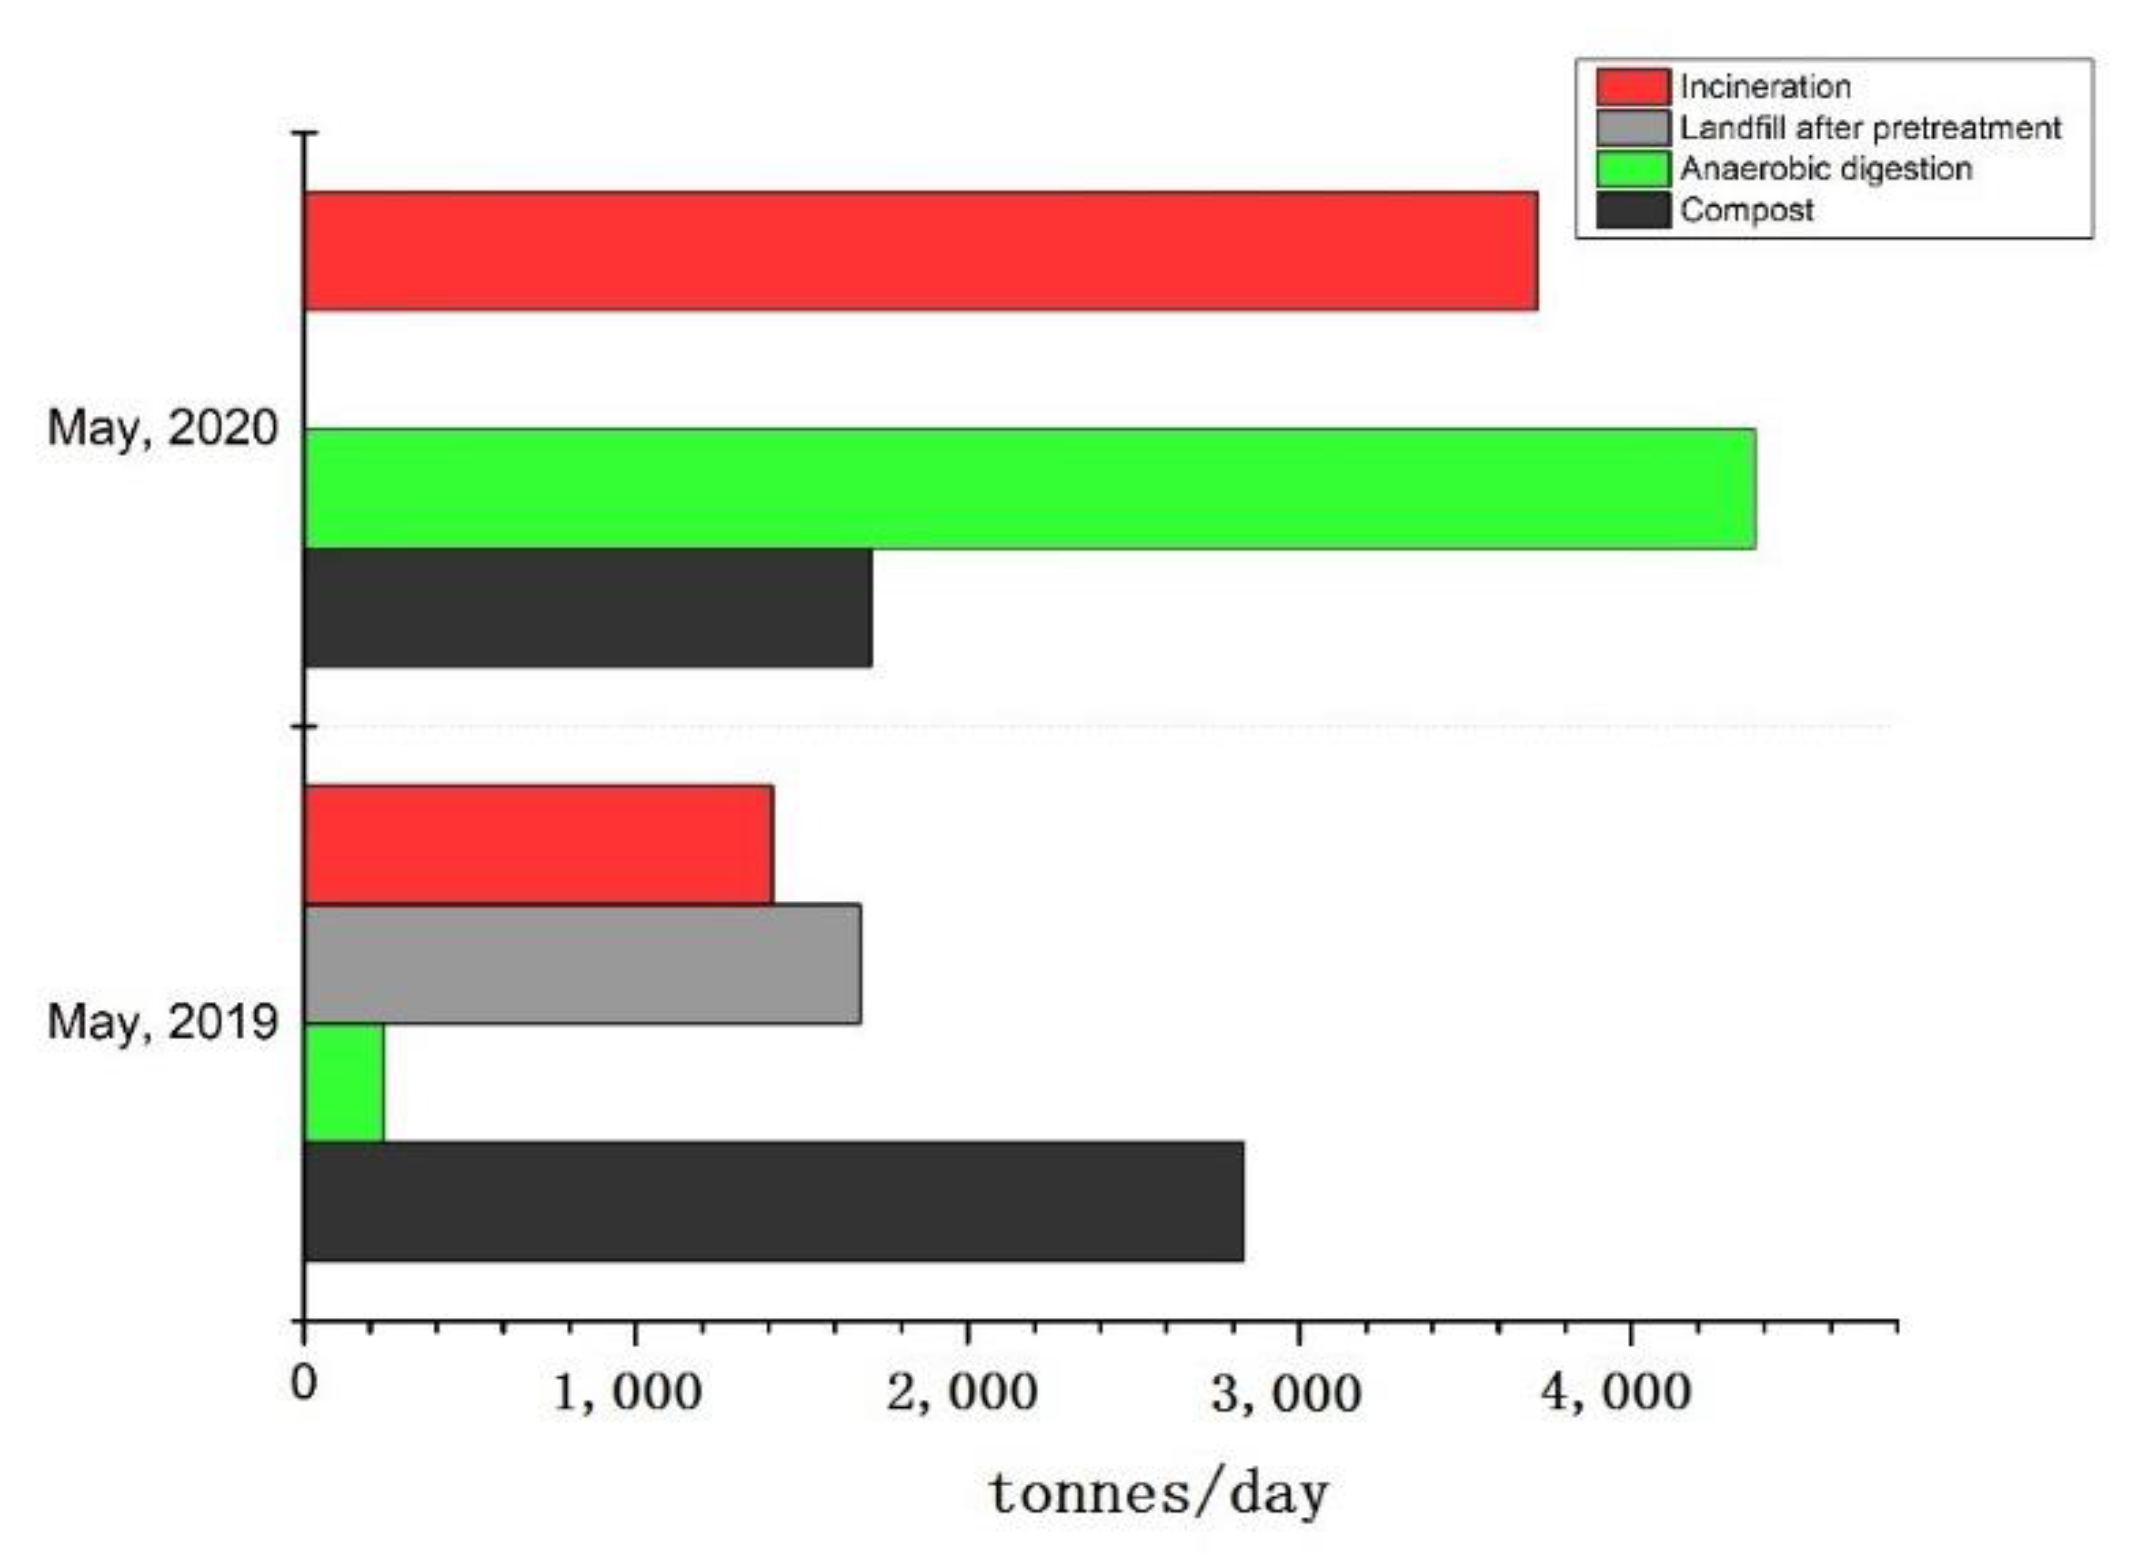
Figure 4, the proportion of tonnage of sorted food waste and residual waste at different treatment types of facilities also changed. For example, the main food waste treatment technologies changed from being compost (46%), landfill (27%), and incineration (23%), to anaerobic digestion (45%), incineration (38%), and compost (17%) [
31]. In particular, the anaerobic digestion treatment capacity increased greatly from 242 tons/day to 4372 tons/day. Importantly for carbon reductions, no food waste goes into landfill any more. However, 3716 tons of sorted food waste must still go into incinerators at the moment, because improvements in the sorting and transportation stages have overtaken the needed changes in treatment facilities. At the same time, the proportional use of landfill-to-incineration treatment for residual waste treatment changed from 82:18 to 45:55 (
Figure 3).
3.4. Changes in Energy Production from Incineration and AD
As shown in
Table 2, total incineration electrical energy production increased by around 60% after the July 2019 law. One reason is that incinerator capacities increased as shown in
Figure 3 and
Figure 4. Another reason is that electrical energy production per ton increased when the proportion of (wet) food waste sent to it was reduced, since it was diverted to AD facilities instead once it was sorted.
As shown in
Table 3, the AD energy production per day in Shanghai increased by a factor of 18 after the July 2019 law. This was not only due to the large increase in tonnage of sorted food waste, but also because the AD capacity increased (shown in
Figure 4). There currently remains about 3000 tons/day of food waste which cannot be disposed of by AD, but should be in the future, when AD capacity is increased further.
In summary, the average energy production per ton of waste before and after the new law (i.e., data from May 2019 to May 2020) increased from 0.20 MWh to 0.33–0.38 MWh (disregarding any energy production from landfill). This means the average energy extracted per ton of waste nearly doubled after the new 2019 law. Within this, the contribution of AD to overall energy production, as a percentage of all energy production by waste treatment, increased from the range of 0.7–1.1% (May 2019) to 8.4–10.6% (May 2020). If all sorted food waste could be treated by AD, that percentage would increase to around 23%.
4. Discussion
The findings indicate that many aspects of the waste management system for residential municipal waste have changed in Shanghai, especially from 2014 to 2018. However, the achievements in terms of uncontaminated tonnages of food waste suited for diversion away from landfill and incineration were not seen until after the implementation of the July 2019 policy.
Infrastructure, such as community waste stations for different bins for different waste streams, and specialized collection vehicles and logistics to collect them, were built up over several years, after some initial experimentation. A variety of programs were also piloted to mobilize the residents’ behaviors to perform source-sorting of their food waste. However, good results at the metropolis level were not seen in that period, except for localized programs or in particular communities at small scale or short periods.
Right up to the July 2019 law implementation, contamination levels were generally too high for food waste to be useful for anaerobic digestion to produce biogas. Previous unsuccessful attempts to utilize it for composting had resulted in the closure of some composting facilities. However, immediately after July 2019, the CL began to improve on a large scale, and careful source separation by residents became the norm. This is an achievement not reported anywhere in the world, beyond some small-scale or short-term examples [
6,
8,
9,
10,
11]. Initially there were volunteers or paid assistants in communities to oversee the deposits made by residents; some continued that practice into the second year, while other communities reduced it as residents developed embedded habits. As the major landfill site for Shanghai (Lao Gang facility) reached capacity and closed, several AD facilities were constructed, including at that site, to process the increasing tonnages of good quality diverted food waste. In short, between the announcement of the new policy in January 2019, and one year after its mandatory implementation (July 2020), the waste management system for residential waste changed very significantly in every dimension.
To understand why the final outcome was suddenly achieved—namely large tonnages of cleanly diverted food waste which allowed a shift from landfill to AD—it is necessary to note that the biggest changes occurred right around July 2019. The passing of the policy into law, and its crystal-clear role allocations, including for residents, seems to have provided the final element to bring the rest into fruition. Although all stakeholders needed to perform their part, they also needed to perform it in cooperation with each other, and the July 2019 policy was the first document which clearly set out the relative roles. Crucially, this included the residents, and roles for community management which could feasibly facilitate the residents to shift their behavior. The transport systems, collection systems, and local and district transfer facilities had all rehearsed their parts, and the residents had several years of hearing that the city was determined to develop a waste recycling system. The policy of July 2019 provided the last piece: sorting behavior of the residents, which would rest upon the other preparation work from the previous years.
Shanghai is one of the biggest cities in the world. The waste sorting performance after the implementation of the July 2019 law is a huge success compared with other metropolises, even Tokyo [
33], and Seoul [
34]. Nearly 9200 tons/day of food waste is now sorted, which means nearly 70% of residential food waste. It is interesting that no other cities in China have yet managed to achieve sustained or large-scale success with residential food waste sorting in terms of contamination levels or scale. Therefore, there is clearly a need for further studies of the Shanghai example to understand how it was made to work. The indications from our findings are that the habitual behavior changes of residents at a community level were the most critical final element. The underpinning reasons for that would be useful to determine through more research. The final impact is almost 10,000 tons per day less organic material going to landfill and fossil-driven incineration where it produces greenhouse gases, in exchange for the production of around 4000 MWh/day
more energy from biogas and exothermic energy-from-waste combustion.
5. Conclusions
Shanghai has achieved a step-wise increase in the tonnages of residential food waste which are effectively sorted so that they can be diverted from landfill and fossil-driven incineration. The city now produces around 10,000 tons per day of sorted food waste in an integrated system that has responded with an increase in AD facilities and reduction of landfill, and an increase in electricity generation from biogas and energy-from-waste combustion.
The suddenness of the improvements is chronologically correlated to the July 2019 policy becoming a legal mandate, with clear roles for all stakeholders, including residents, who responded to community-level management to successfully change their recycling behavior. Whether or not that was a causal link cannot be established in this study, but the data show a step-wise change in energy produced from the waste, compared to before and after the 2019 policy implementation, which is highly suggestive and could be examined with a separate study designed for that purpose. However, it is clear that good sorting behavior alone could not achieve the energy increases, even if all the engineering and transportation infrastructures were already in place. However, bad sorting behavior could prevent infrastructure investments from showing energy results. Therefore, this study suggests that the status of behavioral factors may well be a highly significant blockage in the final achievement of energy production from residential waste. It implies that perhaps the behavioral dimension should be held more to account for the overall performance of energy production achieved from integrated waste management systems. A further study of the causal links in this case would be very useful.
The full contribution of energy-extraction facilities and technologies, such as energy-from-waste incinerators and anaerobic digestion plant might not be able to be judged unless.
To researchers of energy-from-waste, or resource valuation, or circular economy, it might be very puzzling However, it is known that many steps over several previous years: recycling facilities, infrastructure, vehicles, transfer stations and disposal facilities, all experimented with, rehearsed, and finally coordinated to produce a success which to date has extended over more than 26 months.


