Article

The Electrification of Conventional Industrial Processes: The Use of Mechanical Vapor Compression in an EtOH–Water Distillation Tower

by
Andrea Liberale Rispoli
1,
Giacomo Rispoli
2,
Nicola Verdone
1,
Annarita Salladini
2,
Emanuela Agostini
2,
Mirko Boccacci
2,
Maria Paola Parisi
1,
Barbara Mazzarotta
1 and
Giorgio Vilardi
1,*
1
Department of Chemical Engineering Materials Environment, “Sapienza” University of Rome, via Eudossiana 18, 00184 Rome, Italy
2
MyRechemical S.p.A., via di Vannina 88, 00156 Rome, Italy
*
Author to whom correspondence should be addressed.
Energies 2021, 14(21), 7267; https://doi.org/10.3390/en14217267
Submission received: 8 October 2021 / Revised: 31 October 2021 / Accepted: 1 November 2021 / Published: 3 November 2021
(This article belongs to the Special Issue Recovery of Solid Waste in Industrial and Environmental Processes)

Abstract

:
The aim of this study is to analyze the exergetic, environmental, and economic impact of the electrification of a bio-refinery plant, considering the application of Mechanical Vapor Compression (MVC) to a conventional water–ethanol distillation column in the context of bioethanol production. The process was implemented in AspenPlus® and Aspen Exchange Design and Rating (EDR) simulation environments, where a sensitivity analysis was also carried out, considering four scenarios characterized by different compressions’ operative conditions, and including a Coefficient of Performance (CoP) analysis of the proposed solution with MVC. Exergetic and economic analyses were performed, and the relevant impacts on Operative Expenditure (OpEx) and Capital Expenditure (CapEx) were analyzed. Comparing the base case scenario with the proposed solution, a reduction of operative costs of around 63% was achieved. Finally, an environmental analysis was carried out, showing a remarkable reduction in the carbon footprint of the unit, with a carbon dioxide emission reduction of almost 80% for the MVC solution, in line with RED target requirements.

1. Introduction

In recent years, an alarming increase in CO2 emissions has been noticed due to a rapid growth in the industrial sector [1,2]; in 2019, the concentration of carbon dioxide in the atmosphere reached the value of 409 ppmv. This peak value, registered for the first time after almost 1 million years, is alarming, especially if compared with the levels of the last century, where the 300 ppmv threshold was never crossed [3].
For the reasons mentioned above, it is necessary to reduce greenhouse gas emissions from industrial plants [4]. With this target in mind, the United Nations Framework Convention on Climate Change (UNFCC) came to a new agreement in 2015 with the aim of limiting the increase of the average atmospheric temperature to 2 °C with respect to the pre-industrial Era [5]. To achieve this goal, the total amount of CO2 emissions in the atmosphere must be limited to only 1000 Gt by 2100.
Finally, with the last agreement of the UE Climate Action, called the 2050 Long-Term Strategy, all European countries must achieve “carbon neutrality” by 2050, meaning that net greenhouse gas emissions must be zero by 2050 [6].
During the last few years, the Renewable Energy Directive (RED) has been implemented, with the aim of reducing carbon footprints so as to achieve the EU’s objective of climate neutrality by 2050 [7]. This revised RED establishes a common framework to promote energy from renewable sources in electricity, heating and cooling and in the transport sectors for the 2021–2030 period, but it also includes as part of the definition of “recycled carbon fuels” liquid and gaseous fuels produced either from liquid or solid waste streams of non-renewable origin or from waste processing gases and exhaust gases of non-renewable origin. This means that fuels derived from non-renewable waste streams, e.g., fossil waste (plastic, rubber, gaseous wastes, etc.) could be promoted through transport targets and support schemes but could not be considered under the overall renewable energy target [8]. As declared in the Directive, despite their fossil origin, recycled carbon fuels will still be evaluated in the Renewable Energy Directive in order to incorporate the following criteria: greenhouse gas (GHG) emissions savings need to be at least 70% compared to fossil fuels; energy inputs need to be counted in a similar way to electricity; and fossil energy inputs are to be calculated for biofuels when determining their GHG performance.
Under this scenario, one possible way to achieve the above target, and to exploit RED II in a bioethanol production process, is by municipal waste valorization. In this case, a liquid fuel, such as ethanol, is produced from a waste source [9,10] and the electrification of the heat transfer units allows to decrease the overall GHG emissions. The conversion of heating consumption into electrical consumption would be an important step in the energy transition route, once coupled to an increasing share of renewables in the grid, with the aim of meeting the GHG target imposed by RED II. This strategy can be adopted by increasing the use of green energy sources to reduce CO2 emissions and fossil fuel dependency [11,12,13,14,15,16].
Electrification is a well-known process used in various contexts. A number of scientific papers in the literature are focused on the electrification of chemical plants, such as that by Chen et al. [17], dealing with direct and indirect electrification in methanol production.
Another study, by Cui et al. [18], analyzed the possible reduction of the costs and CO2 emissions of an azeotropic pressure swing distillation, thanks to electrification based on self-heated recovery technology in a water–tetrahydrofuran system. The conclusions of this article showed that the electrical-driven solution accounts not only for a reduction of 83% in CO2 emissions with respect to the conventional method, but also for a reduction of 23% of operative costs.
As far as bioethanol is concerned, Chen et al. [19] made a review on a wide range of recycling techniques for bioethanol production from lignocellulosic biomass. In their work, they found bioethanol to be a promising substitute for fossil fuels in term of energy transition, which would help to mitigate GHG emissions. In this review, different applications, including pretreatment, fermentation and distillation, have been discussed.
In this work a bioethanol production plant from waste conversion was considered, focusing c mainly on an electrical-driven solution for the azeotropic water-ethanol distillation tower. The strategy used is Mechanical Vapor Compression (MVC), which converts the steam consumption required to boil the bottom of the column into electrical consumption. According to the authors’ knowledge, this is the first work where a complete evaluation of the MVC implementation in the ethanol–water distillation operation is reported, focusing on the possibility of carbon footprint reduction.
The aim of the proposed architecture is to reduce CO2 emissions related to fossil-based steam consumption by switching to sustainable electrical energy sources. The GHG emissions reduction was directly related to the substitution of steam from natural gas boiler with an electrical-driven compressor.
Finally, a techno-economic analysis, to evaluate the economic feasibility of this solution, is carried out, in which both economic and environmental perspectives are adopted.

2. Materials and Methods

Mechanical Vapor Compression (MVC) is a well-known technology in the field of chemical process engineering, which provides a means of reducing utility consumption in a distillation column. It is based on vapor distillate compression, which increases its condensing temperature at least 5 °C above the boiling temperature at the bottom [20], and so allowing its condensing heat to boil the bottom fraction. In this way, the utility consumption associated with condensing steam and cooling water is limited, or eliminated, and is switched into electrical consumption related to the power absorbed by the compressor. Generally, when heat pumps are involved in this type of process, the condenser may be completely replaced with a compressor, since the overheated vapor exiting the compressor works as a heating medium for the boiling of the boil-up: in this way, only one heat exchanger is necessary, working at the same time as the reboiler and condenser unit.

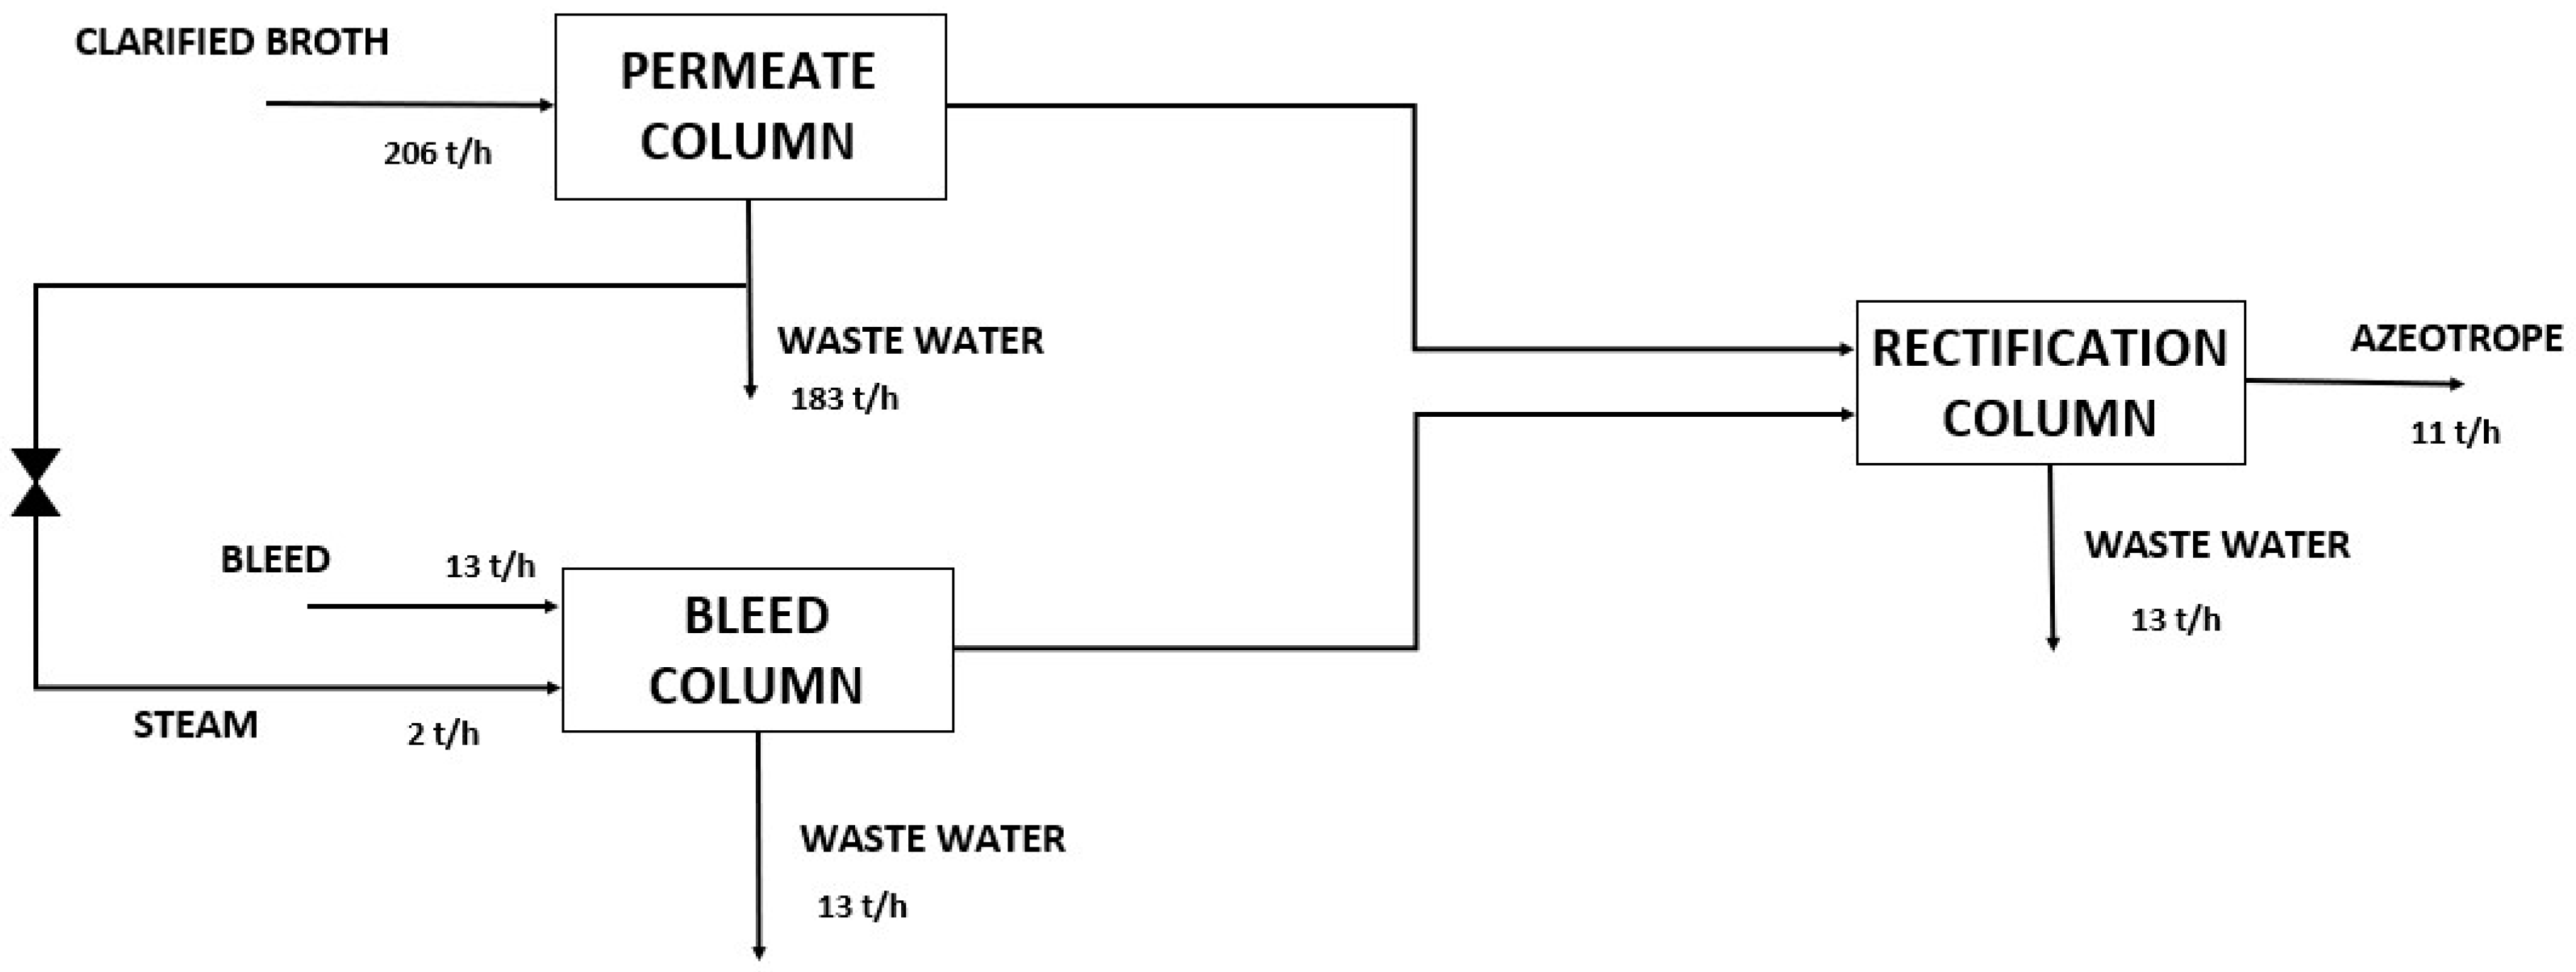
2.1. Description of the “Base Case” Plant

The distillation column considered for upgrading through MVC is part of a typical water–ethanol distillation section. This unit is part of a bioethanol production unit, which is a section in a waste-to-ethanol production process. The reference plant accounts for an ethanol capacity of 62 kt/y, starting from about 192 kt/y of waste.
Syngas required for bioethanol production comes from the gasification of so-called Refuse Derived Fuel [21]; once purified from pollutant compounds, syngas is fed into a fermentation reactor where a mixture of ethanol and alcohols are produced (the liquid mixture is mainly composed of 96 wt% water and 4 wt% ethanol, with traces of methanol, acetic acids, and other alcohols [22]). Typically, this stream, the so-called broth, is fed into the distillation unit, together with a bleed stream coming from the reactor itself, where the ethanol is concentrated up to its azeotropic concentration. Finally, since an azeotrope concentration is reached on top of the last column, an additional unit, located downstream of the distillation, is required to refine ethanol to a specified fuel grade quality characterized by a minimum ethanol concentration of 98.7 wt% [23]. This section is not represented in this study, which is focused mainly on the distillation unit improvement.
Figure 1 shows the block diagram of a typical water ethanol distillation unit, composed of three distillation columns [22].
The broth feed (206 t/h) is fed into the permeate atmospheric column, where a distillate vapour composed of 33 wt% of ethanol is obtained [22,24].
The second column, identified as the bleed column in Figure 1, operates under vacuum conditions and is fed with the bleed of the fermentation reactor (13 t/h), producing a distillate composed of 33 wt% of ethanol [22,24].
The bottom streams of both the permeate and bleed columns are mainly composed of water, containing traces of by-products, such as acetic acid and methanol, which are generally sent to a wastewater treatment plant.
Finally, the third column represented in Figure 1 is the atmospheric rectification column, where the distillate of the other two columns is fed and the azeotrope ethanol–water solution is produced on the top (11 t/h).
At the bottom of the rectification column is a stream of spent water which generally goes together with the contents at the bottom of the permeate and bleed columns to a wastewater treatment plant, which is especially important given the environmental aim of recovering and reusing water as much as possible.

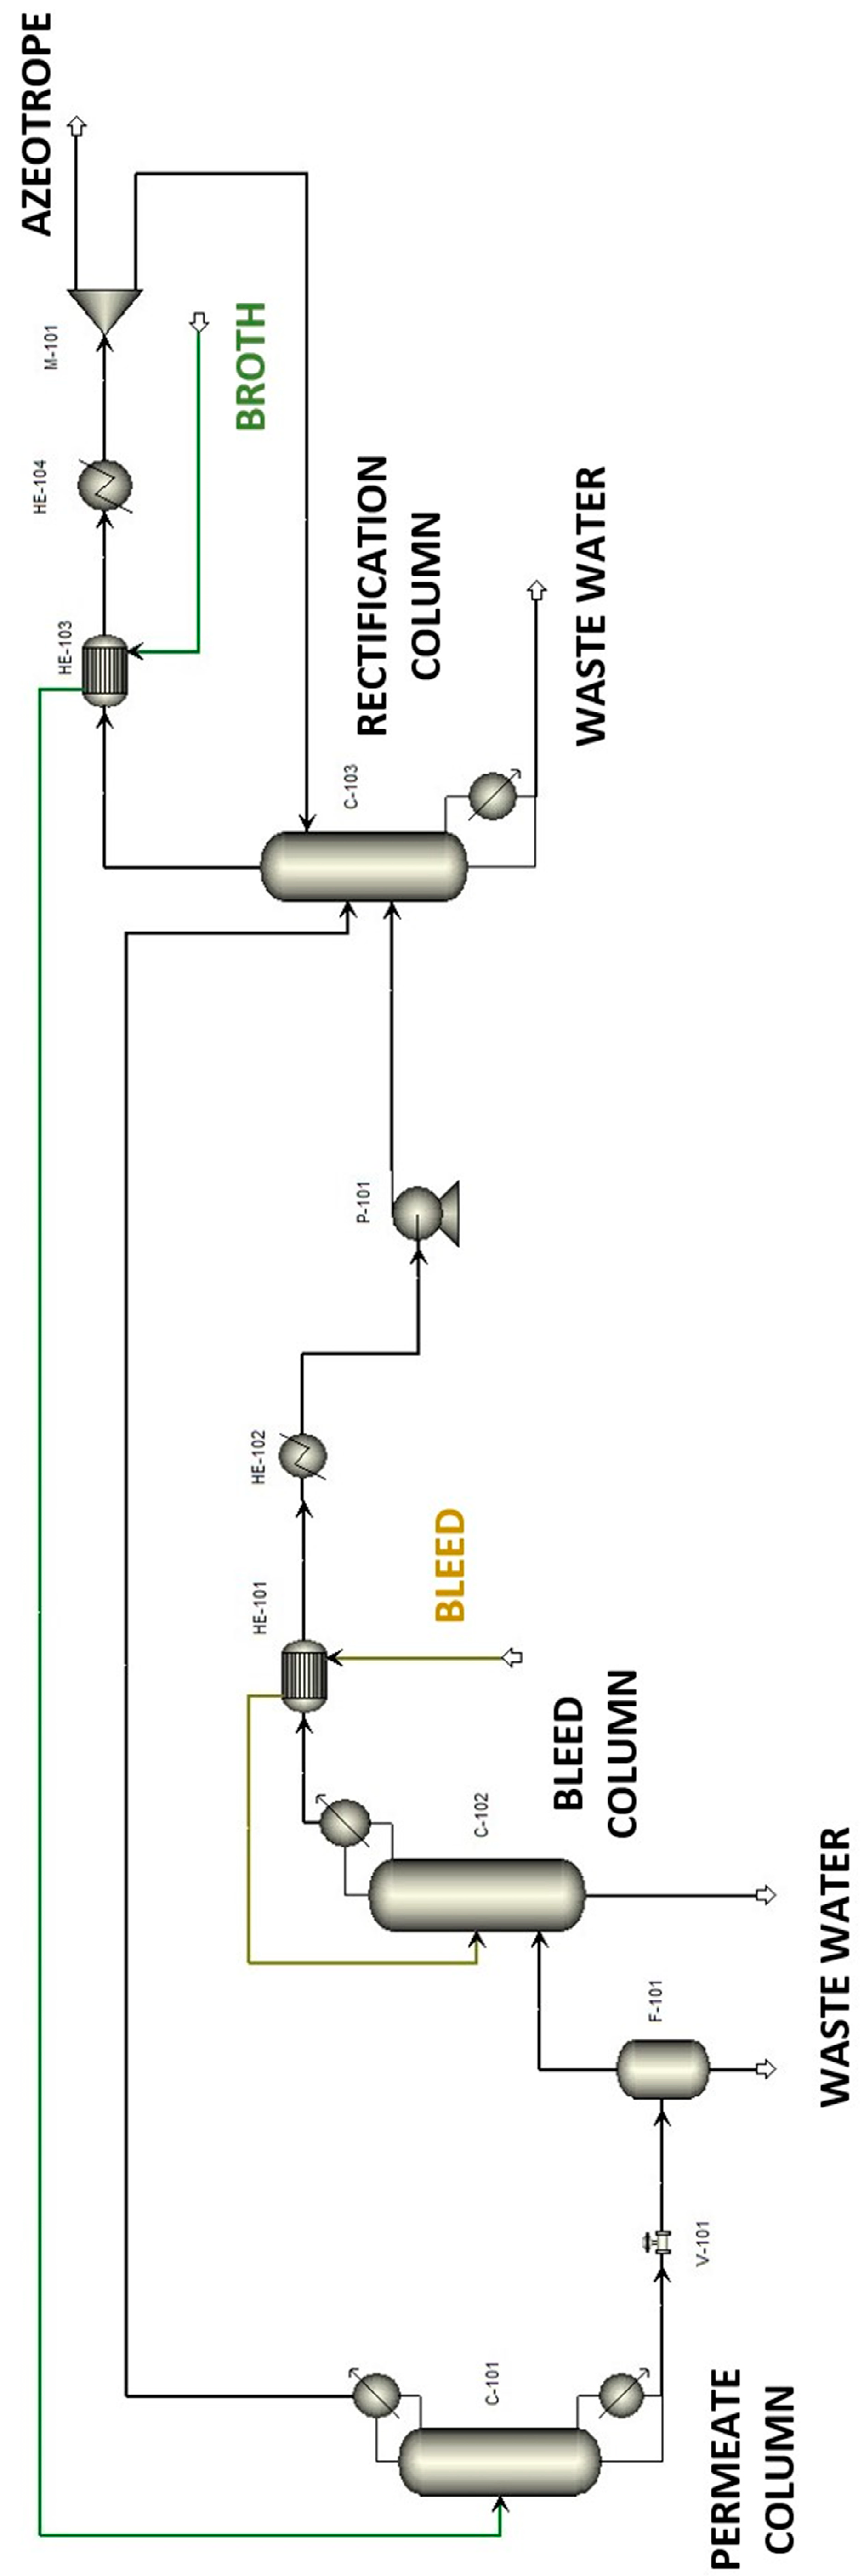
2.2. Process Layout: Original and Upgraded Process Scheme

2.2.1. Thermodynamic System

Before starting the simulation on the AspenPlus® software, the authors carried out a literature review in order to evaluate the optimal thermodynamic model to describe the analyzed system.
It is well known that NRTL (Not-Random Two Liquids) is the model most often used for water–ethanol mixture VLE modeling [25]. Accordingly, the NRTL system used in this work describes with great accuracy the results obtained in the literature [26,27], as can be seen in Figure 2, which shows the overlap of the data reported in the literature and those obtained in the author’s simulation.
The pressure for the continuous line and the round literature data is 13.15 kPa, whereas the pressure for the dotted line and the square literature data is 19.71 kPa [21,22]. Concerning higher pressure, the reliability of the thermodynamic system proposed has already been reported in the literature [28].

2.2.2. Process Layout

Initially, a simulation in the AspenPlus® environment of the entire typical water–ethanol distillation unit was carried out. The scheme of the section is represented in Figure 3.
The simulation was carried out under the hypothesis of considering water and ethanol as the only two chemical species present in the system, since all the other by-products formed in the fermentation reaction, such as acetic acid, methanol, etc., have negligible concentrations (under 5 ppmv [22]). The second fundamental hypothesis at the base of the simulation is the equivalence between the compositions of broth and bleed. This assumption derives from a previous study [29], in which it was noticed that the bleed and broth streams differ only with respect to the presence of the biocatalyst dragged from the fermentation reactor. The presence of the biocatalyst was neglected in the study, due to its low concentration.
The permeate column (C-101 in Figure 3) is fed with the broth stream (206 t/h), which is the product of the fermentation reactor, composed of 96 wt% water and 4 wt% ethanol. This column produces a distillate stream with a composition of 33 wt% ethanol and 67 wt% water, and is then fed into the rectification column, located downstream, in the vapor phase.
The bleed column (C-102 in Figure 3) is fed with the bleed of the fermentation reactor (13 t/h), which for this simulation has the same composition of the broth, indicated above [22]. Additionally, this column produces a distillate with the same composition of the permeate column distillate; then, the distillate is condensed due to thermal recovery with the feed of the bleed column itself (HE-101 in Figure 3) and a water cooler (HE-102). It is then sent to the rectification column (C-103 in Figure 3).
The bottom of both columns, mainly composed of water, as previously described, is sent for further treatment, not covered in this work.
The bleed column is provided with a direct steam injection, from the permeate column bottom and expanded into the valve V-101 to the bleed column bottom pressure.
Finally, in the third column (i.e., the rectification column), the distillate of the former two columns is further concentrated up to the azeotropic concentration of 94.4 wt% ethanol on the top. The bottom stream, mainly water, is mixed with the other two bottom streams of the previous columns and sent for further treatment. The rectification column is provided with a reboiler at the bottom and two condensers at the top. The first condenser (HE-103 in Figure 3) is a thermal recovery, in which the broth is preheated and the azeotrope vapor is partially condensed, whereas the second condenser (HE-104 in Figure 3) is fed with cooling water and is needed to condensate the remaining vapor.
From this scheme, the rectification column (C-103) was found to be the best place to locate the mechanical vapor compression unit. This choice was related to the facts that:
  • In the first distillation column, the MVC cannot be introduced, since the produced distillate is in the vapor phase; so if the MVC were to be applied here, the distillate would condensate, recovering heat from this solution, but in the meantime, due to condensation, the duty coming from the previous vapor distillate stream would be lost and the third’s column reboiler would require a higher overall duty;
  • In the second column, the introduction of MVC was discarded, due to the absence of a reboiler. The operating conditions are not suitable for MVC application in any case. As a matter of fact, the top of the permeate column works under vacuum conditions, so introducing MVC at this point would imply a remarkable increase of electrical consumption and a multiplication of issues related to the complexity of the control and the consumption of the unit. Moreover, if MVC were applied here, the heat recovered would be less than that obtained from the rectification column, due to the lower flowrate involved, impacting in the meantime on a more CapEx expensive compressor.
As for the rectification column, MVC was applied to a part of the vapor distillate stream, since the goal of the overall process was to improve, by heat integration, the overall consumption, including cooling water consumption. This part will be described in detail later.
Figure 3 shows the simulation scheme of the whole unit described above and represented as a block diagram in Figure 1.
Figure 4 shows the rectification column (C-103 in Figure 3) coupled with MVC.
The vapor stream exiting from the top of the column, C-103 (T = 78 °C; P = 100 kPa; total pressure drops 40 kPa), enters first the heat recovery section, HE-103 (9.5 MW), where it is partially condensed to preheat the broth. The condensed fraction, which is around 80% of the total vapor distillate stream entering HE-103, is separated in F-102 from the liquid and is partially sent back to the column as part of the reflux (through splitter S-102), and partially composes the product of the distillation tower. This HE-103 heat recovery is quite important to limit intensive cooling water usage for distillate condensation, which takes place in HE-106. The remaining vapor is further divided in the splitter S-101, where only the flowrate that guarantees heat for the reboiler is fed in the compressor K-101, while the remaining part is directly sent to the condenser HE-106 through the mixer M-102. The compressor increases the vapor pressure, up to around 400 kPa, so that the condensation temperature of vapor is at least 5 °C greater than the boiling temperature of the bottom [30]; the heat for the vaporization of the boil-up is given in the condenser–reboiler heat exchanger HE-105 (Figure 4), partially by the cooling of superheated vapor exiting from the compressor, but mainly by condensing the vapor itself.
After being condensed, the stream has to be expanded in valve V-102, in order to come back to the column’s top pressure of 100 kPa. While this is being done, the expanded stream partially evaporates, and for this reason a condenser is necessary to receive the residual vapor which is split upstream of the compressor. Vapor and liquid are separated in F-103. The vapor is then sent to the condenser HE-106 through the mixer M-102, where the vapor split before the compressor is also sent, and then mixed again with the liquid to give rise to the column reflux.
Finally, the residue is removed from the splitter S-103.
Regarding the compressor, in order to analyze how MVC improves the overall efficiency of the process, the Coefficient of Performance (CoP) was calculated, as represented in Equation (1):
C o P = Q W
where Q (kW) is the duty required to condensate the vapor stream that goes into MVC and W (kW) is the work of the compressor [31].
In the Aspen Plus® simulation environment, the columns were simulated with the RadFrac block, considering a number of stages that reflect the number of trays reported in the work of Herbert [24]. For the compressor, an isentropic efficiency of 80% was considered [32].

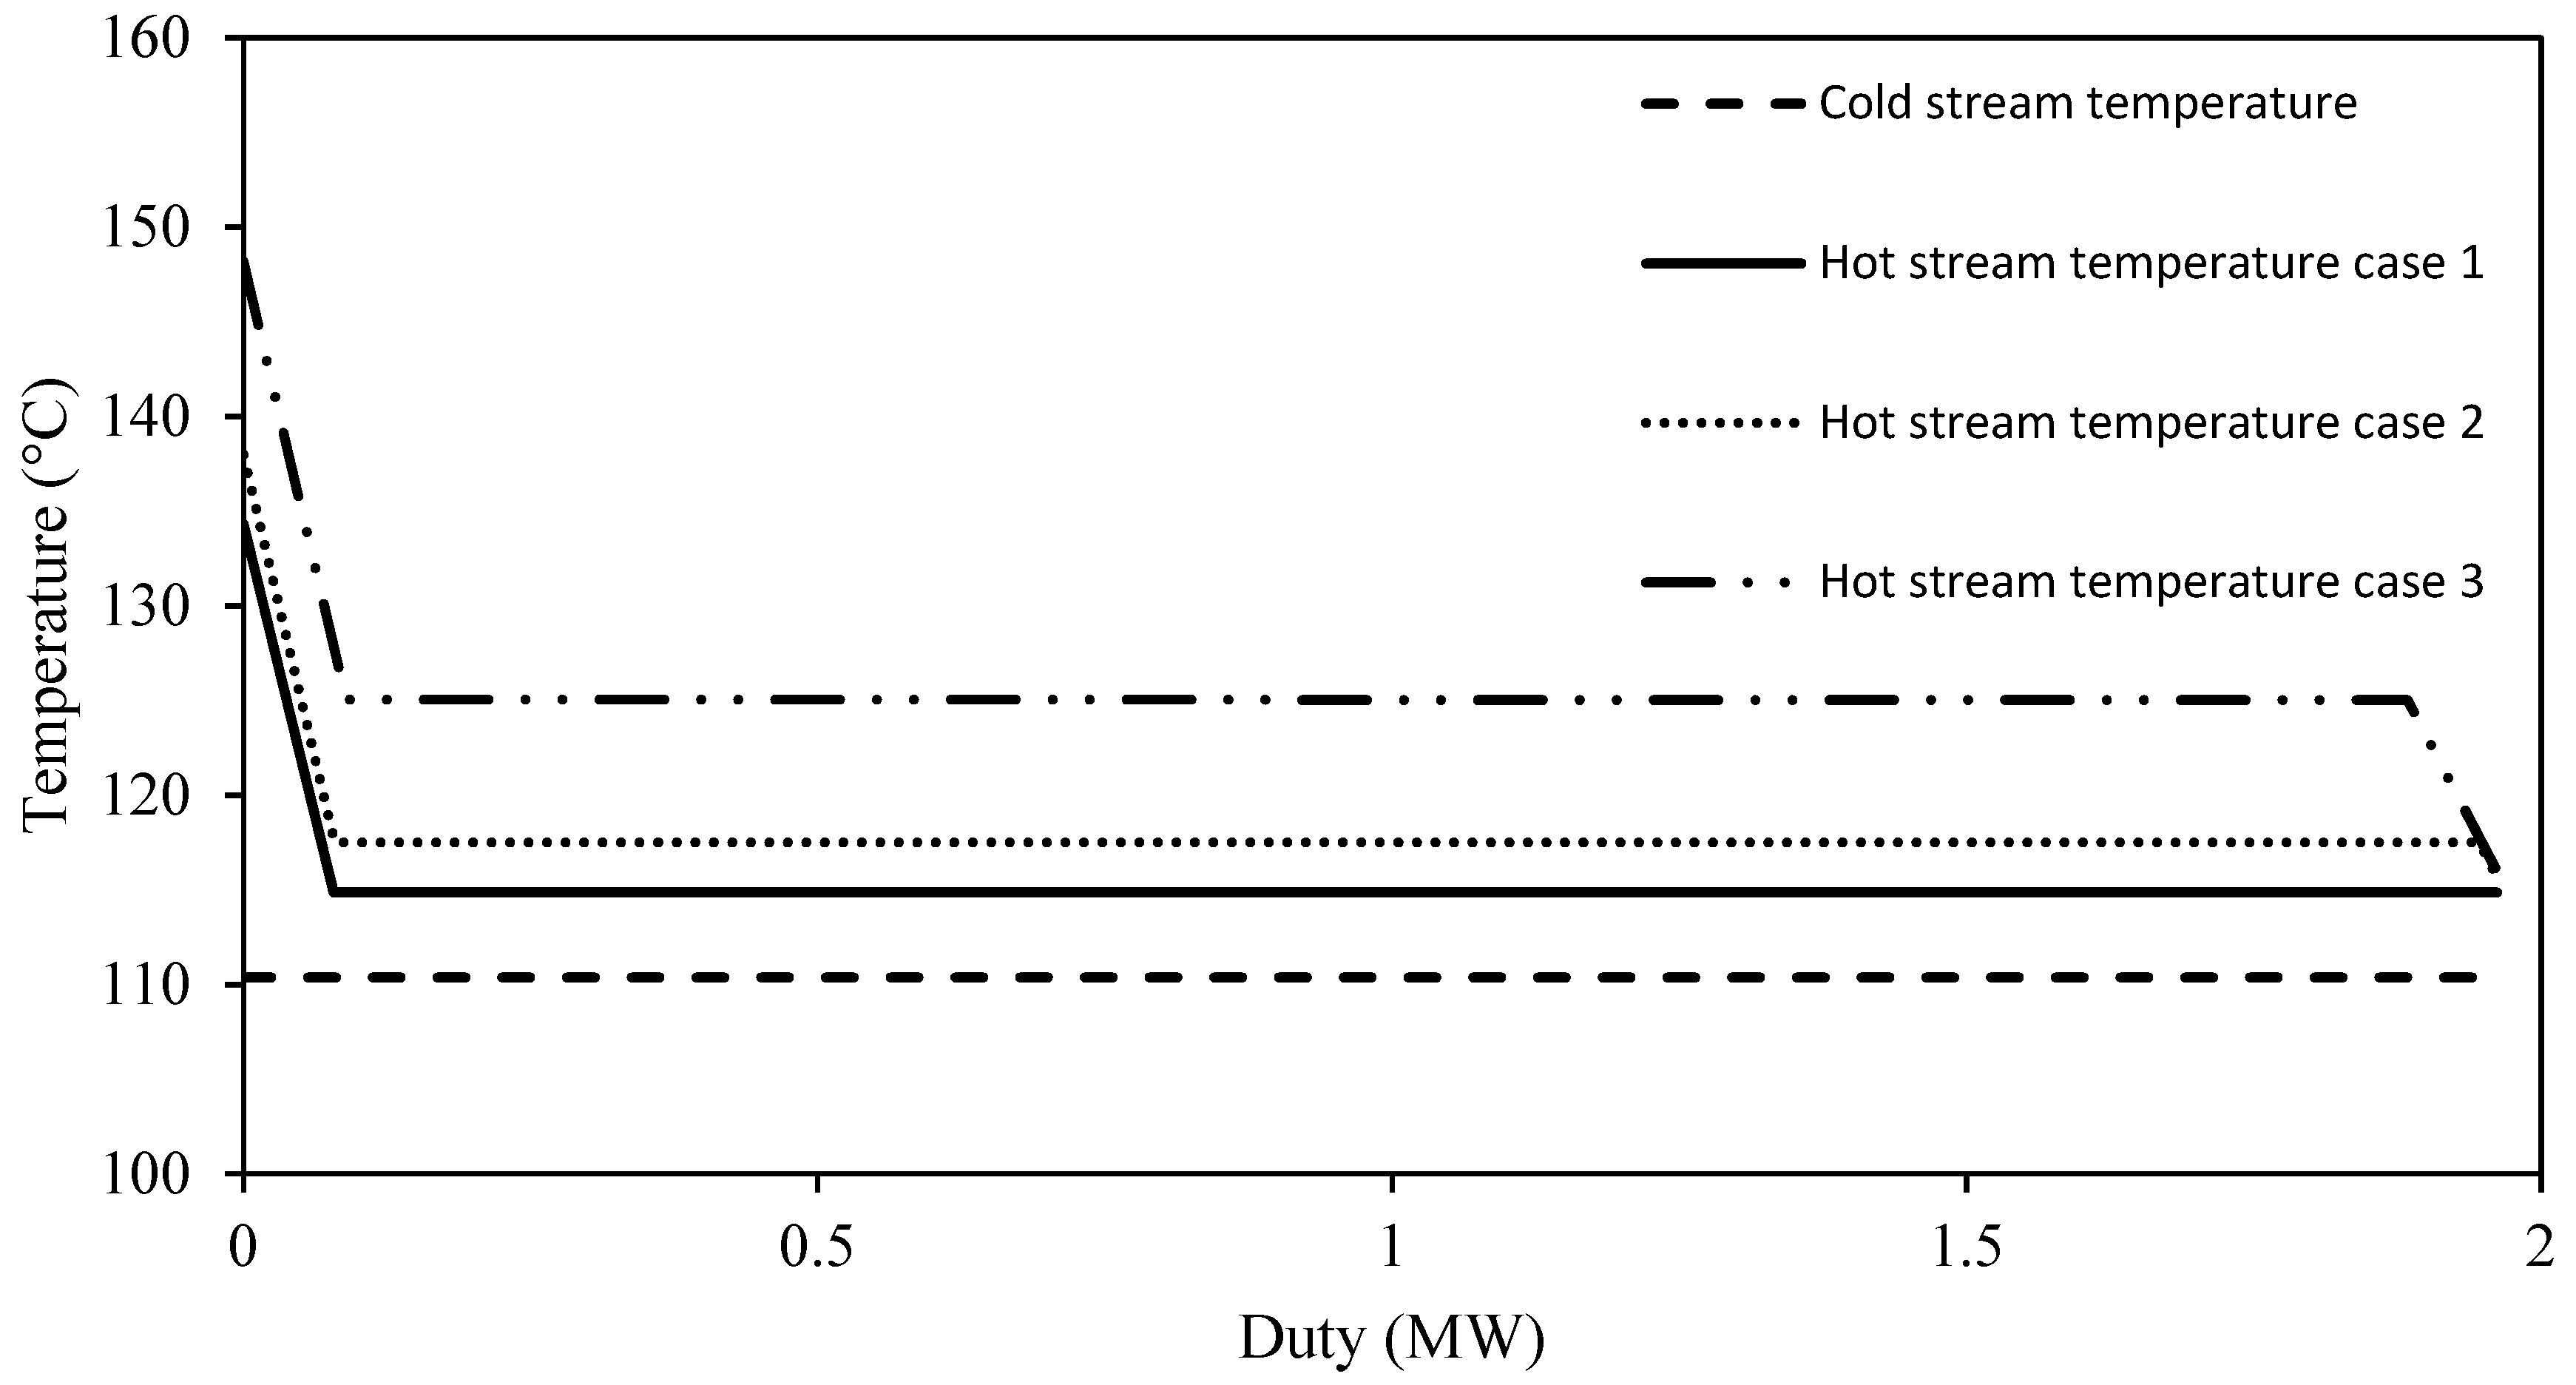
2.3. Compressor and Heat Exchanger Sensitivity Analysis

A sensitivity analysis was carried out, varying the outlet compressor pressure in order to analyze the variation in both compressor power and the reboiler–condenser heat exchanger area.
Starting from the first alternative case, in which the minimum outlet compressor pressure that guarantees the minimum temperature approach to the exchanger has been selected [30], three additional cases were analyzed in which the outlet pressure was increased step by step.
It has to be noted that varying the outlet pressure of the compressor also varied the flowrate required in the condenser–reboiler exchanger; for this reason, a sensitivity analysis on the heat exchanger device was performed with Aspen Design and Ratings® software to determine the relevant impact on the exchange area of this device.
Finally, the sensitivity analysis also affects the CoP of the compressor, and for this reason this parameter was also take into consideration to choose the best case.

3. Techno-Economical Evaluation

3.1. Techno-Economic Feasibility

To assess the techno-economic feasibility of the proposed scheme based on MVC technology coupled to a rectification column of a water ethanol distillation unit, both the CapEx and OpEx associated with the upgraded scheme were estimated, as well as the carbon footprint variation of the two solutions (steam consumption versus electric power consumption).
The greenhouse gas emissions resulting from the operation of the rectification column are related to the production of the steam used in the reboiler. The following assumptions were adopted:
  • The indirect emission of electric power derives from the Italian energy mix and accounts for an average emission factor of 0.29 kgCO2/kWh [33].
  • Steam is produced in an auxiliary boiler by burning natural gas, with a thermal efficiency of 90% [34], thus resulting in an emission factor equal to 0.14 kgCO2/kg steam.
  • The implementation of the MVC principle, by introducing a compressor, obviously leads to an increase in the CapEx. Relevant investment cost was calculated considering a correlation factor equal to 3 M€/MW among the compressor work and its capital cost [35].
  • Regarding the heat exchanger, a correlation factor of 200 €/m2 [36] was used.
  • The Operative Cost was derived considering the annual cost associated with the consumption of that utility, on the basis of 8000 operating hours per year [35,36].
  • Cooling water, available at 28 °C, has a unitary cost of 0.03 €/m3.
  • Steam has a unitary cost of 24 €/t.
  • Carbon tax, given by the carbon footprint, has a unitary emission cost of 0.036 €/kgCO2 emitted.
  • Maintenance has an annual cost equal to 2% of the CapEx.
  • Natural gas has a unitary cost of 0.24 €/Sm3.
  • Electric energy has a cost of 90 €/MWh.
For both CapEx and OpEx, the difference with respect to the base case was considered. Regarding CapEx, the costs of the compressor and the added condenser were considered, because they are the unique devices added in the scheme, with respect to the base case unit.
Finally, the authors carried out a sensitivity analysis, in which the effect of a variation for the carbon tax value was studied. This analysis was necessary given the significant fluctuations in this variable over the years.

3.2. Exergy Analysis

The exergy analysis of the different process schemes was performed. As is well known, this analysis is based on the second principle of thermodynamics and it overcome the limits of energy efficiency analysisby evaluating exergy lost as waste streams and as irreversibility [37].
In this study, both chemical and physical exergy of feed and the products of the rectification columns are taken into account. The two configurations analyzed here are analogous except for the replacement of the reboiler with the MVC architecture.
The exergy balance is composed of two terms: the physical exergy and the chemical exergy.
The physical exergy was calculated in the Aspen Plus® simulation environment, using the Equation (2) [38]:
E x i n / o u t p h = M i n / o u t [ ( H H 0 ) T 0 ( S S 0 ) ]  
where M is the molar flowrate of the considered stream (kmol/h), H and S are the stream molar enthalpy and entropy, respectively, and the suffix 0 refers to standard ambient condition (i.e., P = 1 atm and T = T0 = 25 °C).
The chemical exergy was calculated with Equation (3) [38]:
E x i n / o u t c h = M i n / o u t ( i n x i e x i c h 0 + R T 0 i n x i ln ( x i ) )
where n = number of chemical species (-), xi = mole fraction of the i-th species (-), exich = standard chemical exergy of the i-th species at P = 1 atm and T = T0 = 25 °C (reported in [39]) (kJ/mol), and R = gas constant (kJ/kmol K).
Then, the exergy efficiency and the destructed exergy of the unit, as reported in Equations (4) and (5), respectively, are estimated as follows [38]:
η = E x o u t t o t E x i n t o t
E x d t o t = E x i n t o t E x o u t t o t = T 0 S g e n
where Extotin and Extotout are the total exergy entering and leaving the system, respectively, and Sgen is the generated entropy (kJ/K kmol).
The waste exergy was calculated and considered equal in this case to the exergy of the bottom of the rectification column, since it is the only stream that represents waste in the system and which is not upgraded as a product or re-used in the same cycle.
Finally, irreversibility was calculated as the difference between the total destructed exergy and the total exergy of the waste, as expressed in Equation (6) [38]:
I r r e v e r s i b i l i t y = E x d t o t E x w a s t e t o t
The aim of this analysis is to evaluate both the efficiency and irreversibility of the proposed scheme with respect to the conventional one in terms of thermodynamic analysis output. For a distillation column, the Extotout term is calculated as the difference between the total exergy associated with the feeds and the total exergy of the products, whereas the Extotin term is the total exergy directly provided to the reboiler, as reported in a previous work [33].

4. Results

4.1. Base Case Scenario Results

For the base case, a cooling water consumption of 232 m3/h and a consumption of condensing steam of 3.5 t/h were calculated.
In Table 1, the distillate and residue flowrates, along with the condenser and reboiler duties of the three columns are reported: their value clearly indicates that the best choice is to adopt MVC technology for the rectification column. Indeed, the condenser and the reboiler can be easily merged into a single device, since their duty is almost the same, with a compressor added to increase the condensing temperature of the distillate. The MVC solution was applied only in this point, as explained in paragraph 2.2.

4.2. Mechanical Vapor Compression Results

Table 2 shows the alternative case results, with the MVC implemented in the rectification column.
Moving from the base case to the alternative case coupled to MVC, the rectification column operative conditions and thermal recovery were assumed to be constant. The first MVC simulation was performed by adopting quite a low difference between the compressed distillate condensing temperature and the bottom boiling one (i.e., 5 °C) and no condensate undercooling.
An amount of 47,000 kg/h of vapor leaves the top of column 1, and, in the thermal recovery, around 36,000 kg/h of this vapor is condensed; thus, only the remaining 10,400 kg/h of vapor can be used in the MVC.
The first MVC simulation was performed by adopting a 5 °C difference between the compressed distillate condensing temperature and the bottom boiling one; under this hypothesis, 8200 kg/h of vapor are fed to the compressor, to increase their pressure from 100 to 370 kPa with a compressor power consumption equal to 0.35 MW. This device presented a CoP of 5.71, consistent with other similar studies, such as the one carried out by Li et al. [31], in which this parameter was equal to 5.44. When the MVC is introduced into the scheme, steam consumption is zero and the cooling water consumption remarkably decreased down to 92 m3/h.
In Figure 5, a Q-T diagram of the condenser–reboiler exchanger (HE-105 in Figure 4) is represented.
The vapor leaves the compressor as overheated vapor and guarantees the required heat partially with de-superheating, but mainly with condensation.
The heat exchanger was simulated as a vertical thermosiphon in an Aspen Exchange Design & Rating® environment, and an area for this device was estimated at 234 m2.

Compressor Sensitivity Results

In this sensitivity study, four different compressor discharge pressure values were considered:
Case 0, with an outlet pressure of 370 kPa;
Case 1, with an outlet pressure of 400 kPa;
Case 2, with an outlet pressure of 450 kPa;
Case 3, with an outlet pressure of 500 kPa.
In Table 3, the sensitivity results are reported.
Table 3 shows that when the outlet compressor pressure is increased, the compressor work initially decreases and then goes up again, whereas the temperature increases; this happens because the required stream in Case 1 is much less than in the alternative case; if the pressure is further increased, the work increases again, since the compression ratio becomes the predominant factor.
Regarding the CoP, a significant increase of this value was not reachable, since the heat in the condenser–reboiler is fixed, due to the fixed value of duty Q. For this reason, the only way to increase the coefficient of performance is to reduce the work of the compressor, and this was actually done, by analyzing different scenarios, as reported in Table 3. This consideration clarifies the trend of this parameter, which has a maximum corresponding to Case 1, with a CoP of 6.77, which corresponds to the minimum compressor consumption, and then it decreases again. In other works, the Coefficient of Performance was raised by increasing the flowrate in the compressor, in order to increase the numerator in Equation (1), and so the CoP itself [31]; however, as mentioned in the paragraphs above, it was not possible in this case, since the architecture of the system and the goal of the overall process was to improve the overall consumption by heat integration, including cooling water consumption.
Figure 6 shows the Q-T diagrams of the various cases.
Table 3 shows a decreasing trend of the heat exchange area with respect to the discharge pressure, which is interrupted in Case 3 by a remarkable increase. This trend is explained in Figure 6: considering in every case a minimum difference of temperature for the two fluids at 5 °C, for Cases 1 and 2, the condensing–boiling remains the predominant mechanism inside the exchanger, thus, the heat transfer coefficient remains approximately constant and the larger difference between the condensing and the boiling temperatures has decreased the exchange area, as reported in Table 3. On the other hand, in Case 3, the subcooling becomes relevant, and for this reason the overall heat exchange coefficient shows a remarkable decrease, with a consequent increase of the area.
The MVC technology has been studied for several years in the field of distillation and it allows to upgrade the energy of the unit by the compression of a lower pressure vapor in order to make the energy available to execute work [40]. The first important consideration was raised in the work of Palacios et al. [40], where a pinch analysis approach was performed towards the condenser–reboiler device. Indeed, also in this study, the pressure reached from the gas leaving the compressor strictly depends on the temperature of the heated fluid.
Moreover, Canales and Marquez [41] dealt with this issue in the case of water–ethanol distillation, obtaining appreciable results in a pilot plant in both dynamic and steady states, with an energy saving around 50%.
As for the present study, another example where the CoP value increased because of MVC implementation was the work of Enweremadu et al. [38]. In the cited study, heat pumps were used to reduce energy consumption in a water–ethanol conventional distillation column. The authors focused on the expression of some common features of the application of the MVC principles into a distillation tower, such as the effects of a pressure increase across the compressor, column heat loss, and the overall transfer coefficient in the condenser–reboiler in term of Prandtl, Reynolds, and Nusselt numbers. The results showed that these parameters, once included in the model equations, have a concrete impact on the solution, for instance, increasing the compressor power input required and decreasing the coefficient of performance.
Finally, the possibility of applying MVC in a water–ethanol distillation tower was examined also by Oliveira et al. [42]. In this study, the authors dealt with a simulation model representing the process in term of mass and energy balances and a Coefficient of Performance. The results mainly confirm those obtained in this work, showing a very similar pattern with respect to the CoP. Moreover, the conclusion about the convenience of the MVC from both energetic and environmental points of view was supported.

4.3. Economic Evaluation Results

For the economic analysis reported in this paragraph, the authors started analyzing the OpEx of the base case scheme, focusing on the rectification column [31].
Table 4 shows the OpEx for the base case, without the MVC.
In the base case, the Operative Costs are related to the consumption utilities as cooling water and steam. Table 4 shows that steam cost has the biggest impact, followed by the carbon tax—that is, in all cases linked to the steam itself because the emissions of CO2 are directly associated to steam production.
From the calculations, the OpEx related to the rectification column, in the base case, is 0.87 M€/y.
After the introduction of the MVC, the CapEx was calculated for every case reported in the previous paragraph, in order to identify the economic optimum. The analysis was carried out considering the variation that MVC introduces into the scheme; for this reason, the analysis concerns the cost of the compressor, with a correlation factor of 3 M€/MW, and the cost of the heat exchanger, with a correlation factor of 200 €/m2. For this last device, the cost reported is the difference between the exchanger required for the column when MVC was considered and the cost of the device required in the base case, for which an area of 107 m2 was calculated.
Table 5 reports the CapEx cost for the unit.
As shown in Table 5, Case 1 represents the case that minimizes the total CapEx (i.e., the economic optimum for the unit).
The following economic analysis carried out was the OpEx analysis, in order to evaluate here the best case also.
Table 6 shows the OpEx calculation procedure after the application of the MVC, referring to the alternative case.
When the MVC technology is adopted, steam consumption is zero; for this reason, it does not appear in the OpEx. Nevertheless, MVC adoption led to an electric energy demand increase, with a cost of 0.25 M€/y, as reported in Table 6. In addition, the maintenance cost of the compressor, equal to 2% of the CapEx for the compressor itself, has to be added. The amount of cooling water needed in the process is much less with respect to the former case, since it is only needed to condense the remaining vapor that bypasses the condenser–reboiler exchanger. Finally, since no more natural gas has to be burnt to produce the required steam, the carbon dioxide emissions, and consequently the carbon tax, are significantly reduced, from 490 kgCO2/h and 0.14 M€/y, respectively, for base case, to about 102 kgCO2/h and 0.03 M€/y in the MVC case.
Finally, an OpEx analysis was performed for every case shown, to compare the results, as is shown in Table 7.
Table 6 and Table 7 show that, for both the CapEx and OpEx, Case 1 represents the best case and the economic optimum for the unit, because the minimization of the compressor’s work has a notable impact not only on the cost of the compressor but also on the power consumption and, indirectly, on the carbon tax and so on the OpEx in general.
As a conclusion of this analysis, applying the MVC technology, both the OpEx and the carbon footprint of the ethanol purification process were considerably reduced, passing from 0.87 M€/y to 0.26 M€/y (i.e., 0.61 M€/y, that corresponds to a reduction of 63%) and from 490 kgCO2/h to 84.1 kgCO2/h (79% of reduction), respectively. The change of the distillation process scheme also leads to an increase of the CapEx of 0.91 M€, which, with the calculated ∆OpEx, would be recovered in about 1.5 years.
The results of the sensitivity analysis on the carbon tax value are reported in Figure 7.
The sensitivity analysis on the carbon tax value showed an important result: a notable variation of the OpEx for the Year 0 case (before the application of the MVC) occurred, whereas the OpEx variation for the Year 1 case (after the application of MVC) is almost negligible. This means that, since the cost of the tax due to the emission of carbon dioxide will increase, the appeal of MVC, leading as it does to lower CO2 emissions into the atmosphere with respect to the base case, will grow with each passing year.

4.4. Exergetic Analysis Result

Focusing only on the base case and the alternative cases, chemical and physical exergy were calculated for the entering feeds, distillate from the broth column and distillate from the permeate column, and for the outgoing products (distillate and bottom), as previously reported. These values, reported in Table 8, are the same for the conventional case and all the alternative cases studied in this article.
The differences between the conventional case and the alternative cases presented in this work, from an exergetic viewpoint, are due only to the replacement of the condensing steam (for which a total exergy was calculated of 556 kW) with MVC.
For the conventional case, an exergy efficiency of 89.8%, a waste of 472 kW, and an irreversibility of 8970 kW were estimated. The waste is the same for the conventional case and all the studied cases, since it is related only to the bottom of the rectification column.
Table 9 reports the results for all the alternative cases.
Table 9 shows a limited increase of exergetic efficiency, from 89.8% to 90.1%, with the implementation of the MVC with respect to the conventional configuration. The size of the compressor and the architecture of the scheme limit the advantage in terms of exergetic efficiency, but this analysis proves that the application of mechanical vapor compression brought a real profit to the unit, even from an exergetic point of view, since a decrease of the waste exergy stream was obtained.

5. Conclusions

This work is inserted in the frame of innovative technologies and is focused on the reduction of greenhouse gas emissions from refinery plants, according to the principle of energy transition and the electrification concept, in line with the requirements of RED II. In this work, the potential application of electrification in a conventional ethanol purification plant was investigated in detail, renewable sources were adopted for electrical energy production in accordance with the principles of a green economy to recycle waste and produce a carbon fuel. The simulation of the whole distillation unit was carried out with the software AspenPlus®, using which the authors selected the best option in terms of a column to be coupled with MVC (Mechanical Vapor Compression). Then, the base scheme for the rectification column with MVC was simulated and a sensitivity analysis on the compressor addition was performed. The obtained results allowed the choice of the best case that minimizes electrical consumption as well as the cost of running the machine. CoP analysis was also performed, and the obtained results were in line with previous studies. Therefore, two fundamental analyses, especially in an energy transition perspective, were carried out: an economic analysis and an environmental one. These two analyses are strictly correlated, due to the carbon tax, which economically quantifies the price of CO2 emissions. It has been reported that, despite an increase in capital cost due to the necessity of a compressor, there is a notable reduction (63%) of the operative costs and a remarkable reduction of carbon dioxide emissions (i.e., a 79% reduction of the overall carbon footprint related to the column operation). Finally, also, the exergetic analysis shows improved efficiency because of the waste exergy stream reduction. Exergetic analysis allowed the quantification of possible improvements related to waste minimization, overcoming the limits of first-principle analysis, which does not take into account the influence of waste streams in its efficiency estimation. The significant reduction of carbon dioxide emissions led to the conclusion that electrification is a potential way to decrease the carbon footprint associated with the production of ethanol. Moreover, given the large number of distillation towers in the chemical industry, the authors are confident that this solution can be applied in different processes, allowing for the fulfilment of the UE goal of carbon neutrality by 2050 and the target of RED II with respect to GHG to be reached. As per the environmental point of view, the exergetic analysis was carried out to underline the improvement that MVC leads to. The results of the present work prove both the practical and economic feasibility, as well the environmental advantages, of electrification solutions in bioethanol production plants. Furthermore, it has been proven that global carbon footprint reduction can be achieved only by acting on each ancillary and/or main unit of a whole plant.

Author Contributions

Conceptualization, A.L.R. and G.R.; methodology, A.L.R., A.S., E.A., M.B., M.P.P. and B.M.; software, A.L.R., E.A. and M.B.; validation, A.L.R., A.S., E.A., M.B., N.V. and G.V.; visualization, A.L.R.; resources, G.R. and N.V.; data curation, A.L.R.; writing—original draft preparation, A.L.R., E.A. and M.B.; writing—reviewing and editing, all authors; supervision, G.V. All authors have read and agreed to the published version of the manuscript.

Funding

This research received no external funding.

Institutional Review Board Statement

Not applicable.

Informed Consent Statement

Not applicable.

Conflicts of Interest

The authors declare no conflict of interest.

References

  1. Hu, Z.; Li, C.; Zhang, D. Interactions of dynamic supercritical CO2 fluid with different rank moisture-equilibrated coals: Implications for CO2 sequestration in coal seams. Chin. J. Chem. Eng. 2021, 35, 288–301. [Google Scholar] [CrossRef]
  2. Liu, Q.; Shi, Y.; Zhong, W.; Yu, A. Co-firing of coal and biomass in oxy-fuel fluidized bed for CO2 capture: A review of recent advances. Chin. J. Chem. Eng. 2019, 27, 2261–2272. [Google Scholar] [CrossRef]
  3. Lindsey, R. Climate Change: Atmospheric Carbon Dioxide. 2020. Available online: https://www.climate.gov/news-features/understanding-climate/climate-change-atmospheric-carbon-dioxide (accessed on 1 November 2021).
  4. Zhen, M.; Song, B.; Liu, X.; Chandankere, R.; Tang, J. Biochar-mediated regulation of greenhouse gas emission and toxicity reduction in bioremediation of organophosphorus pesticide-contaminated soils. Chin. J. Chem. Eng. 2018, 26, 2592–2600. [Google Scholar] [CrossRef]
  5. Dyer, H.C. Energy and climate change. Routledge Handb. Glob. Environ. Polit. 2013, 361–372. [Google Scholar] [CrossRef]
  6. Nayak, J.K.; Ghosh, U.K. Microalgal remediation of anaerobic pretreated pharmaceutical wastewater for sustainable biodiesel production and electricity generation. J. Water Process Eng. 2020, 35, 101192. [Google Scholar]
  7. Parlament, E. Regulation (Eu) 2017/745 of the European Parliament And of the Council. Ind. Med. Gaz. 2017. [Google Scholar] [CrossRef]
  8. Zero Waste Europe. Joint Briefing: Recycled Carbon Fuels in the Renewable Energy Directive. 2021, Volume 1. Available online: https://zerowasteeurope.eu/wp-content/uploads/2019/04/NGO-joint-briefing-RCF.pdf (accessed on 1 November 2021).
  9. Wilberforce, T.; Sayed, E.T.; Abdelkareem, M.A.; Elsaid, K.; Olabi, A.G. Value added products from wastewater using bioelectrochemical systems: Current trends and perspectives. J. Water Process Eng. 2021, 39, 101737. [Google Scholar] [CrossRef]
  10. Hoarau, J.; Caro, Y.; Grondin, I.; Petit, T. Sugarcane vinasse processing: Toward a status shift from waste to valuable resource. A review. J. Water Process Eng. 2018, 24, 11–25. [Google Scholar] [CrossRef]
  11. Tao, Y.; Li, H.; Wen, Z.; Chen, H.; Xu, W.; Evans, S. A hybrid scenario analysis for the selection of future greenhouse gas emissions reduction technologies in China’s oil and gas industry. J. Clean. Prod. 2019, 223, 14–24. [Google Scholar] [CrossRef]
  12. Riemer, P. Greenhouse Gas Mitigation Technologies, an Overview of the CO2 Capture, Storage and Future Activities of the IEA Greenhouse Gas R&D Programme. Energy Convers. Manag. 1996, 37, 665–670. [Google Scholar]
  13. Liaposhchenko, O.; Marenok, V.; Skydanenko, M.; Pavlenko, I.; Ochowiak, M.; Mižáková, J.; Pitel’, J.; Storozhenko, V.; Smyrnov, V.; Shmatenko, V. Modeling of technological processes for a rectification plant in second-generation bioethanol production. Processes 2021, 9, 944. [Google Scholar] [CrossRef]
  14. Variny, M.; Furda, P.; Švistun, L.; Rimár, M.; Kizek, J.; Kováč, N.; Illés, P.; Janošovský, J.; Váhovský, J.; Mierka, O. Novel concept of cogeneration-integrated heat pump-assisted fractionation of alkylation reactor effluent for increased power production and overall CO2 emissions decrease. Processes 2020, 8, 183. [Google Scholar] [CrossRef] [Green Version]
  15. Marton, S.; Svensson, E.; Subiaco, R.; Bengtsson, F.; Harvey, S. A steam utility network model for the evaluation of heat integration retrofits—A case study of an oil refinery. J. Sustain. Dev. Energy Water Environ. Syst. 2017, 5, 560–578. [Google Scholar] [CrossRef] [Green Version]
  16. Svensson, E.; Morandin, M.; Harvey, S.; Papadokonstantakis, S. Studying the role of system aggregation in energy targeting: A case study of a swedish oil refinery. Energies 2020, 13, 958. [Google Scholar] [CrossRef] [Green Version]
  17. Chen, C.; Lu, Y.; Banares-Alcantara, R. Direct and indirect electrification of chemical industry using methanol production as a case study. Appl. Energy 2019, 243, 71–90. [Google Scholar] [CrossRef]
  18. Cui, C.; Long, N.V.D.; Sun, J.; Lee, M. Electrical-driven self-heat recuperative pressure-swing azeotropic distillation to minimize process cost and CO2 emission: Process electrification and simultaneous optimization. Energy 2020, 195, 116998. [Google Scholar] [CrossRef]
  19. Chen, J.; Zhang, B.; Luo, L.; Zhang, F.; Yi, Y.; Shan, Y.; Liu, B.; Zhou, Y.; Wang, X.; Lü, X. A review on recycling techniques for bioethanol production from lignocellulosic biomass. Renew. Sustain. Energy Rev. 2021, 149, 111370. [Google Scholar] [CrossRef]
  20. Sinnott, R.K. Coulson & Richardson Chemical Engineering; Elsevier: Oxford, UK, 2005. [Google Scholar]
  21. Borgogna, A.; Salladini, A.; Spadacini, L.; Pitrelli, A.; Annesini, M.C.; Iaquaniello, G. Methanol production from Refuse Derived Fuel: Influence of feedstock composition on process yield through gasification analysis. J. Clean. Prod. 2019, 235, 1080–1089. [Google Scholar] [CrossRef] [Green Version]
  22. Jacques, K.A.; Lyons, T.P.; Kelsall, D.R. The Alcohol Textbook; Nottingham University Press: Nottingham, UK, 2003; ISBN 1-897676-13-1. [Google Scholar]
  23. European Union. European Fuel Ethanol Specification EN 15376:2014 (E); 2014; Volume 2014, p. 15837. Available online: https://standards.iteh.ai/catalog/standards/cen/6611fd35-d066-4b86-a711-fd2c83b3333c/en-15376-2014 (accessed on 1 November 2021).
  24. Herbert, T. Practical Distillation Control; Springer: New York, NY, USA, 2000; ISBN 9781475702798. [Google Scholar]
  25. Graczová, E.; Šulgan, B.; Steltenpohl, P. tert-Butanol–water mixture separation by extractive distillation: Application of experimental data in process simulations. Sep. Purif. Technol. 2020, 251, 116968. [Google Scholar] [CrossRef]
  26. Voutsas, E.C.; Pamouktsis, C.; Argyris, D.; Pappa, G.D. Measurements and thermodynamic modeling of the ethanol-water system with emphasis to the azeotropic region. Fluid Phase Equilib. 2011, 308, 135–141. [Google Scholar] [CrossRef]
  27. Renon, H.; Prausnitz, J.M. Estimation of parameters for the nrtl equation for excess gibbs energies of strongly nonideal liquid mixtures. Ind. Eng. Chem. Process Des. Dev. 1969, 8, 413–419. [Google Scholar] [CrossRef]
  28. Puentes, C.; Joulia, X.; Athès, V.; Esteban-Decloux, M. Review and Thermodynamic Modeling with NRTL Model of Vapor-Liquid Equilibria (VLE) of Aroma Compounds Highly Diluted in Ethanol-Water Mixtures at 101.3 kPa. Ind. Eng. Chem. Res. 2018, 57, 3443–3470. [Google Scholar] [CrossRef] [Green Version]
  29. Salladini, A.; Agostini, E.; Borgogna, A.; Iaquaniello, G. Waste feedstocks for sustainable chemicals and fuels. Stud. Surf. Sci. Catal. 2020, 179, 193–213. [Google Scholar]
  30. Richardson, J.F.; Harker, J.H.; Backhurst, J.R. Coulson and Richardson’s Chemical Engineering. Chem. Eng. 2007, 2. [Google Scholar] [CrossRef]
  31. Li, Y.; Wu, H.; Liang, X.G.; Rong, C.; Chen, H. Experimental study of waste concentration by mechanical vapor compression technology. Desalination 2015, 361, 46–52. [Google Scholar] [CrossRef]
  32. Hanlon, P. Compressor Handbook; McGraw-Hil: New York, NY, USA, 2001; ISBN 0070260052. [Google Scholar]
  33. ENEA. Analisi Trimestrale del Sistema Energetico Italiano. 2020. Available online: https://www.enea.it/it/seguici/pubblicazioni/pdf-sistema-energetico-italiano/02-analisi-trimestrale-2020.pdf (accessed on 1 November 2021).
  34. Durkin, T. Boiler System Efficiency. Ashrae J. 2006, 48, 51–57. [Google Scholar]
  35. Peters, M.; Timmerhaus, K. Plant Design and Economics for Chemical Engineers; McGraw-Hill: New York, NY, USA, 1991; ISBN 0070496137. [Google Scholar]
  36. Turton, R.; Shaeiwitz, J.A.; Bhattacharyya, D.; Whiting, W.B. Analysis, Syngthesis and Design of Chemical Processes; Pearson Education: Upper Saddle River, NJ, USA, 2008; ISBN 0975442201. [Google Scholar]
  37. Rispoli, A.L.; Verdone, N.; Vilardi, G. Green fuel production by coupling plastic waste oxy-combustion and PtG technologies: Economic, energy, exergy and CO2-cycle analysis. Fuel Process. Technol. 2021, 221, 106922. [Google Scholar] [CrossRef]
  38. Wilson, M.R. The Exergy Method of Thermal Plant Analysis; Elsevier: Amsterdam, The Netherlands, 1988; Volume 16, ISBN 0408013508. [Google Scholar]
  39. Gharagheizi, F.; Ilani-Kashkouli, P.; Hedden, R.C. Standard molar chemical exergy: A new accurate model. Energy 2018, 158, 924–935. [Google Scholar] [CrossRef]
  40. Palacios-Bereche, R.; Ensinas, A.V.; Modesto, M.; Nebra, S.A. Mechanical vapour recompression incorporated to the ethanol production from sugarcane and thermal integration to the overall process applying pinch analysis. Chem. Eng. Trans. 2014, 39, 397–402. [Google Scholar]
  41. Canales, E.R.; Máruez, F.E. Operation and Experimental Results on a Vapor Recompression Pilot Plant Distillation Column. Ind. Eng. Chem. Res. 1992, 31, 2547–2555. [Google Scholar] [CrossRef]
  42. Oliveira, S.B.M.; Marques, R.P.; Parise, J.A.R. Modelling of an ethanol-water distillation column with vapour recompression. Int. J. Energy Res. 2001, 25, 845–858. [Google Scholar] [CrossRef]
Figure 1. Distillation unit’s block diagram.
Energies 14 07267 g001
Figure 2. T-x-y graph of water–ethanol equilibrium: comparison between experimental data and NRTL predicted data [26].
Energies 14 07267 g002
Figure 3. Scheme for the distillation unit base case scenario.
Energies 14 07267 g003
Figure 4. Scheme for the alternative case.
Energies 14 07267 g004
Figure 5. Q-T diagram of the condenser–reboiler (HE-105 in Figure 4) exchanger for the first alternative case.
Energies 14 07267 g005
Figure 6. Q-T diagram of Cases 1, 2, and 3 of the condenser–reboiler (HE-105 in Figure 4).
Energies 14 07267 g006
Figure 7. Carbon tax sensitivity analysis results.
Energies 14 07267 g007
Table 1. Base case simulation results.
Simulation Results
UnitPermeate ColumnBleed ColumnRectification Column
Distillatet/h22211
Residuet/h1851313
Condenser dutyMW--2.7
Reboiler dutyMW14.6-2
Table 2. MVC results.
MVC Results
UnitDuty
Condenser–reboiler MW2
Top condenserMW1
Table 3. Compressor data sensitivity analysis results.
Compressor Sensitivity Results
UnitAlternative CaseCase 1Case 2Case 3
Outlet pressurekPa370400450500
Outlet compressor Temperature °C131138144148
Compressor feedkg/h8200785078007700
Compressor’s electric power consumptionMW0.350.290.320.34
Heat exchanger’s aream2234154130158
Heat transfer coefficient W m 2 K 9219591019753
CoolingΔ T M L 1 °C12.429.315.5635.5
CondensingΔ T M L 2 °C547.515
Sub-coolingΔ T M L 3 °C--6.59.8
CoP-5.716.776.255.71
Table 4. OpEx for the base case.
OpEx for the Base Case
UnitUnitary ValueUnitFlowrateUnitCost
Cooling water€/m30.03m3/h232M€/y0.056
Steam€/t24t/h3.5M€/y0.67
Carbon Tax€/kgCO20.036kgCO2/h490M€/y0.14
TOT M€/y0.87
Table 5. CapEx cost.
CapEx Cost of the Unit
Compressor’s Work
(MW)
Additional Area (m2)Compressor’s Cost
(M€)
Heat Exchanger’s Cost
(M€)
Total Cost
(M€)
Alternative case0.351271.050.0251.08
Case 10.29470.90.0090.91
Case 20.32230.960.0050.97
Case 30.351231.050.0241.07
Table 6. OpEx for the MVC alternative case.
OpEx for the MVC Case
UnitUnitary ValueUnitFlowrateUnitCost
Cooling water€/m30.03m3/h92.3M€/y0.02
Electric energy€/MWh90MW0.35M€/y0.25
Carbon Tax€/kgCO20.04kgCO2/h101.5M€/y0.03
Maintenance% CapEx2 0.02
TOT M€/y0.32
Table 7. OpEx results.
OpEx for the MVC Case
UnitUnitary Value
Alternative CaseM€/y0.32
Case 1M€/y0.26
Case 2M€/y0.28
Case 3M€/y0.29
Table 8. Exergy results for the distillation column.
Exergy Results for the Distillation Column
Chemical Exergy (kW)Physical Exergy (kW)
Feed 1 16.9 × 1042291
Feed 2 22.1 × 10451
Distillate8.3 × 10444
Bottom239232
1 Feed 1 refers to the feed coming from the permeate column. 2 Feed 2 refers to the feed coming from the bleed column.
Table 9. Exergy results for alternative cases.
Exergy Results
Efficiency (%)Irreversibility (kW)
Alternative Case90.19.23 × 103
Case 190.19.17 × 103
Case 290.19.20 × 103
Case 390.19.23 × 103
Publisher’s Note: MDPI stays neutral with regard to jurisdictional claims in published maps and institutional affiliations.

