
Comparative Study of Experimentally Measured and Calculated Solar Radiations for Two Sites in Algeria

 , ,
, ,  ,
,
Abstract
:1. Introduction
2. The Principle of the Proposed Model
3. Main Parameters of the Studied Models
3.1. Linke Turbidity Factor
3.2. Solar Declination Angle
3.3. Clearness Index
3.4. Sunshine Duration (S)
3.5. Sunshine Ratio ()
4. Main Models Presentation
4.1. Estimation of Solar Radiation under Clear Skies
4.1.1. Semi Empirical Model of Perrin de Brichambaut
4.1.2. Capderou Model 1987
4.1.3. R.Sun Model
4.1.4. Full Perrin de Brichambaut Model
4.2. Estimation of the Solar Radiation under Variable Sky Clearness
4.2.1. Meteorological Models
Estimation of Monthly Averaged Daily Global Solar Irradiation: Coppolino Model 1989
Estimation of the Monthly Global Solar Irradiation: SivKov Model 1964
5. Experimental Radiometric Characterization of Senia and Tlemcen
5.1. Study of Daily Sunshine Data
5.1.1. Evolution of the Sunshine Daily Sequences
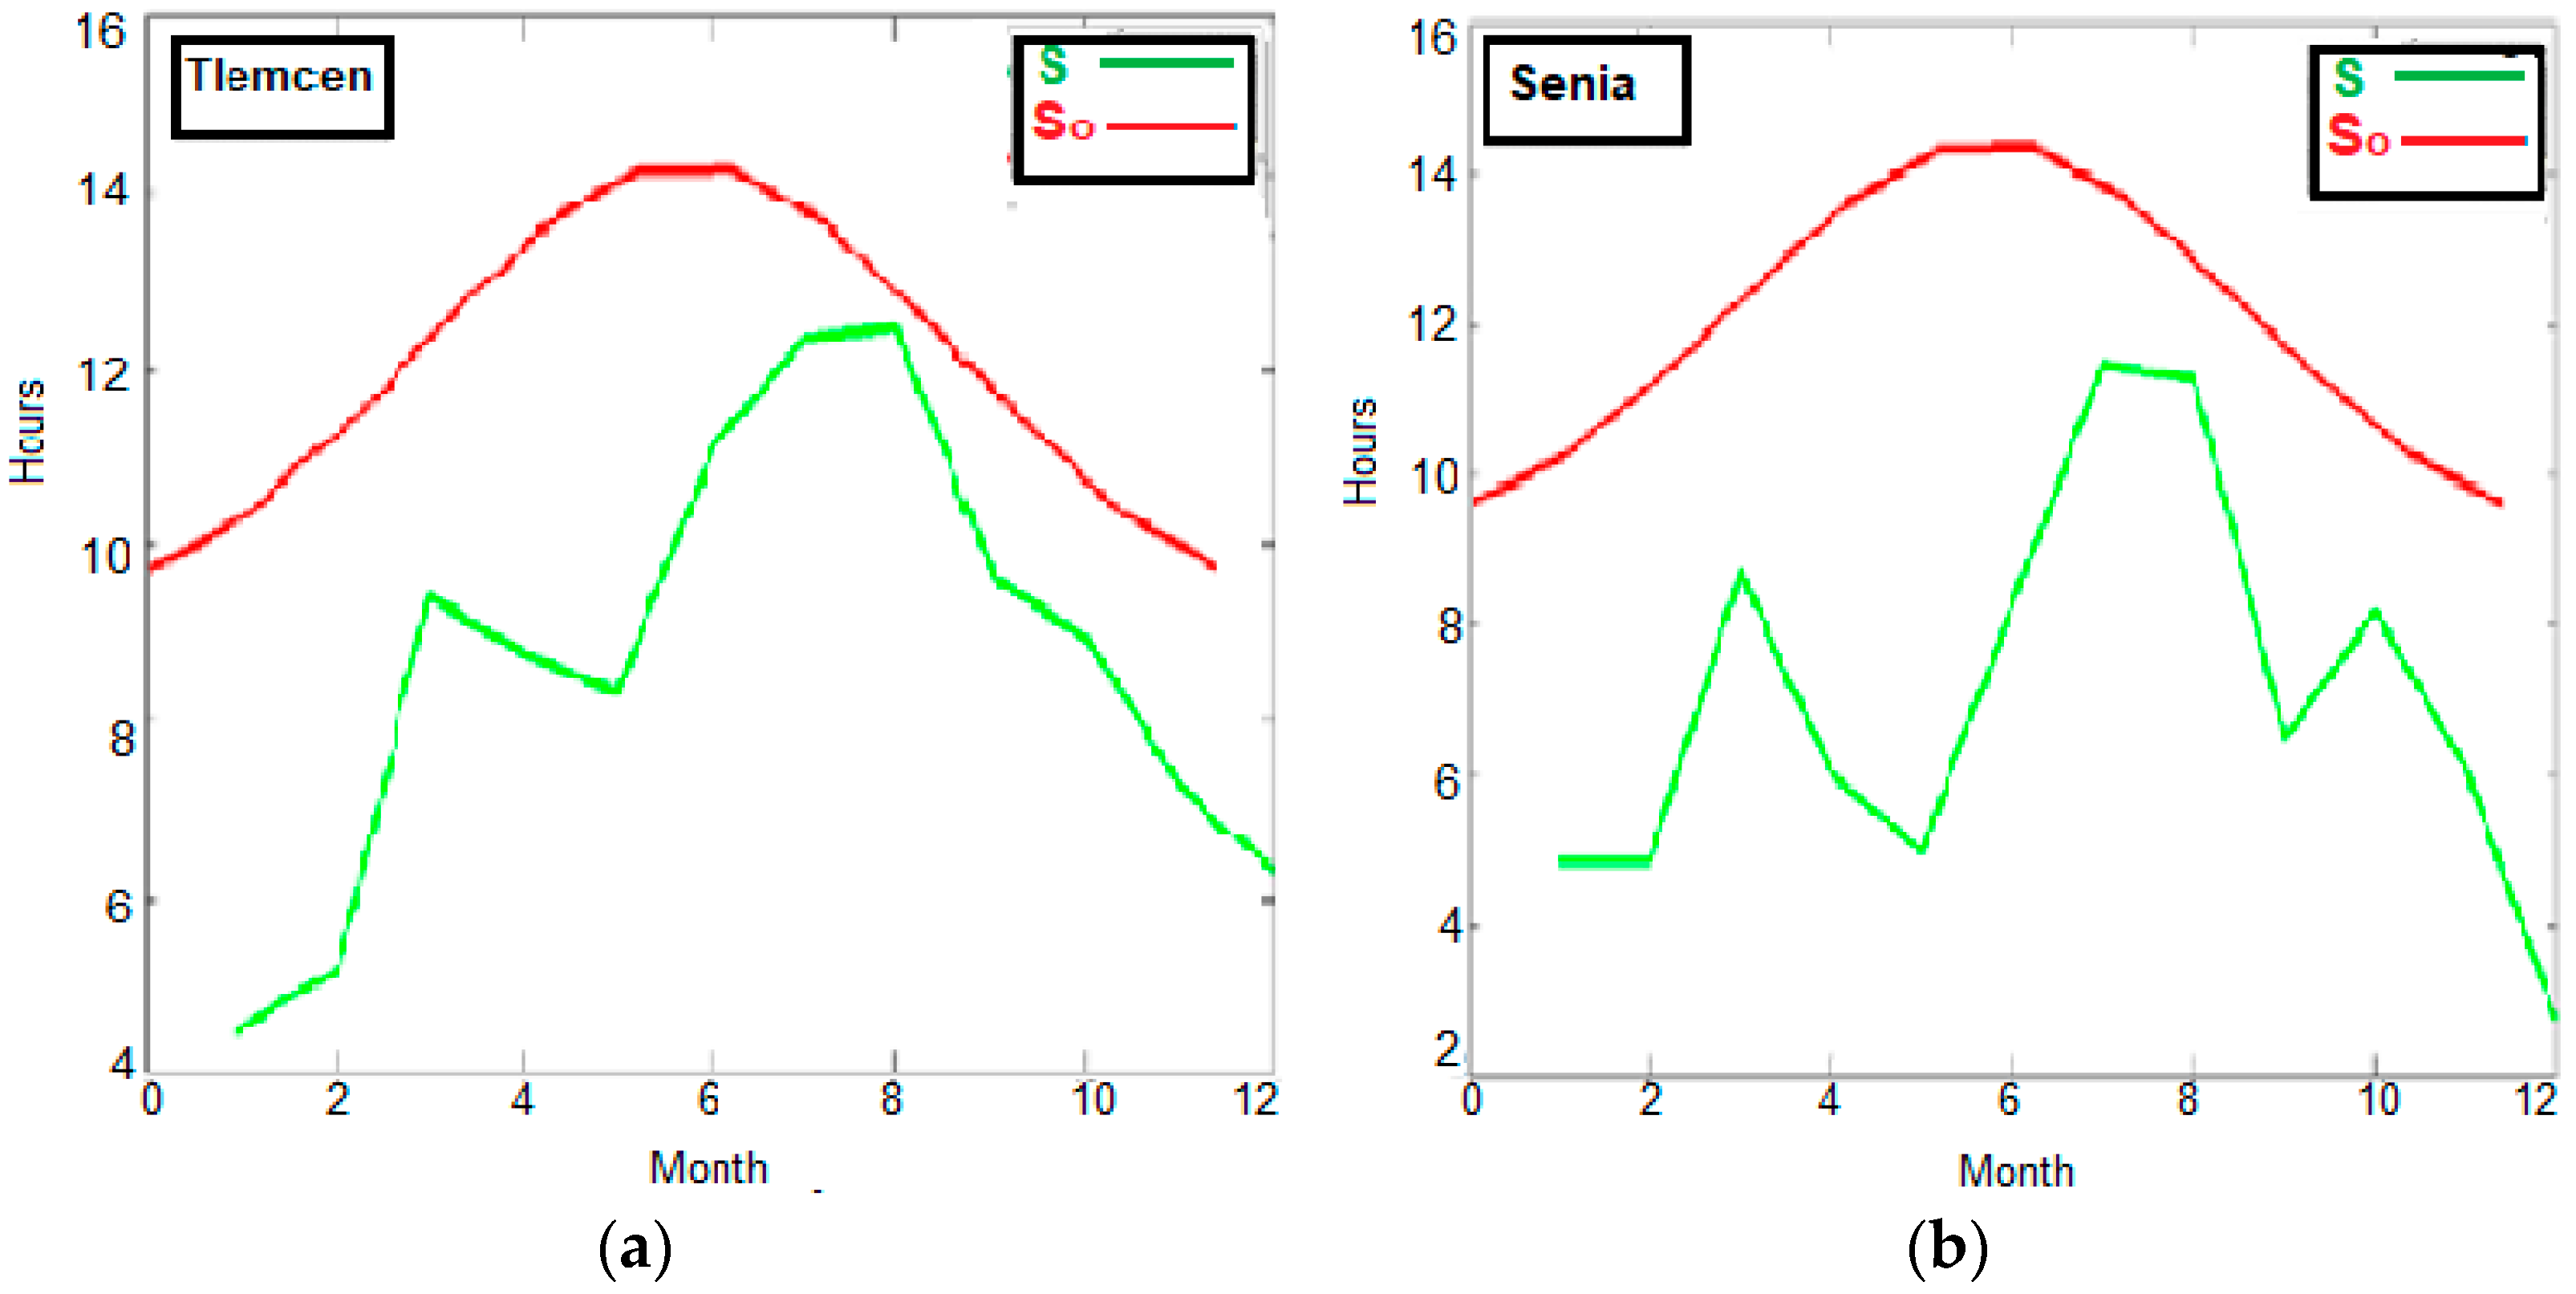
5.1.2. Analysis of the Monthly Average Sunshine
5.1.3. Histograms of Monthly Sunshine for Both Sites
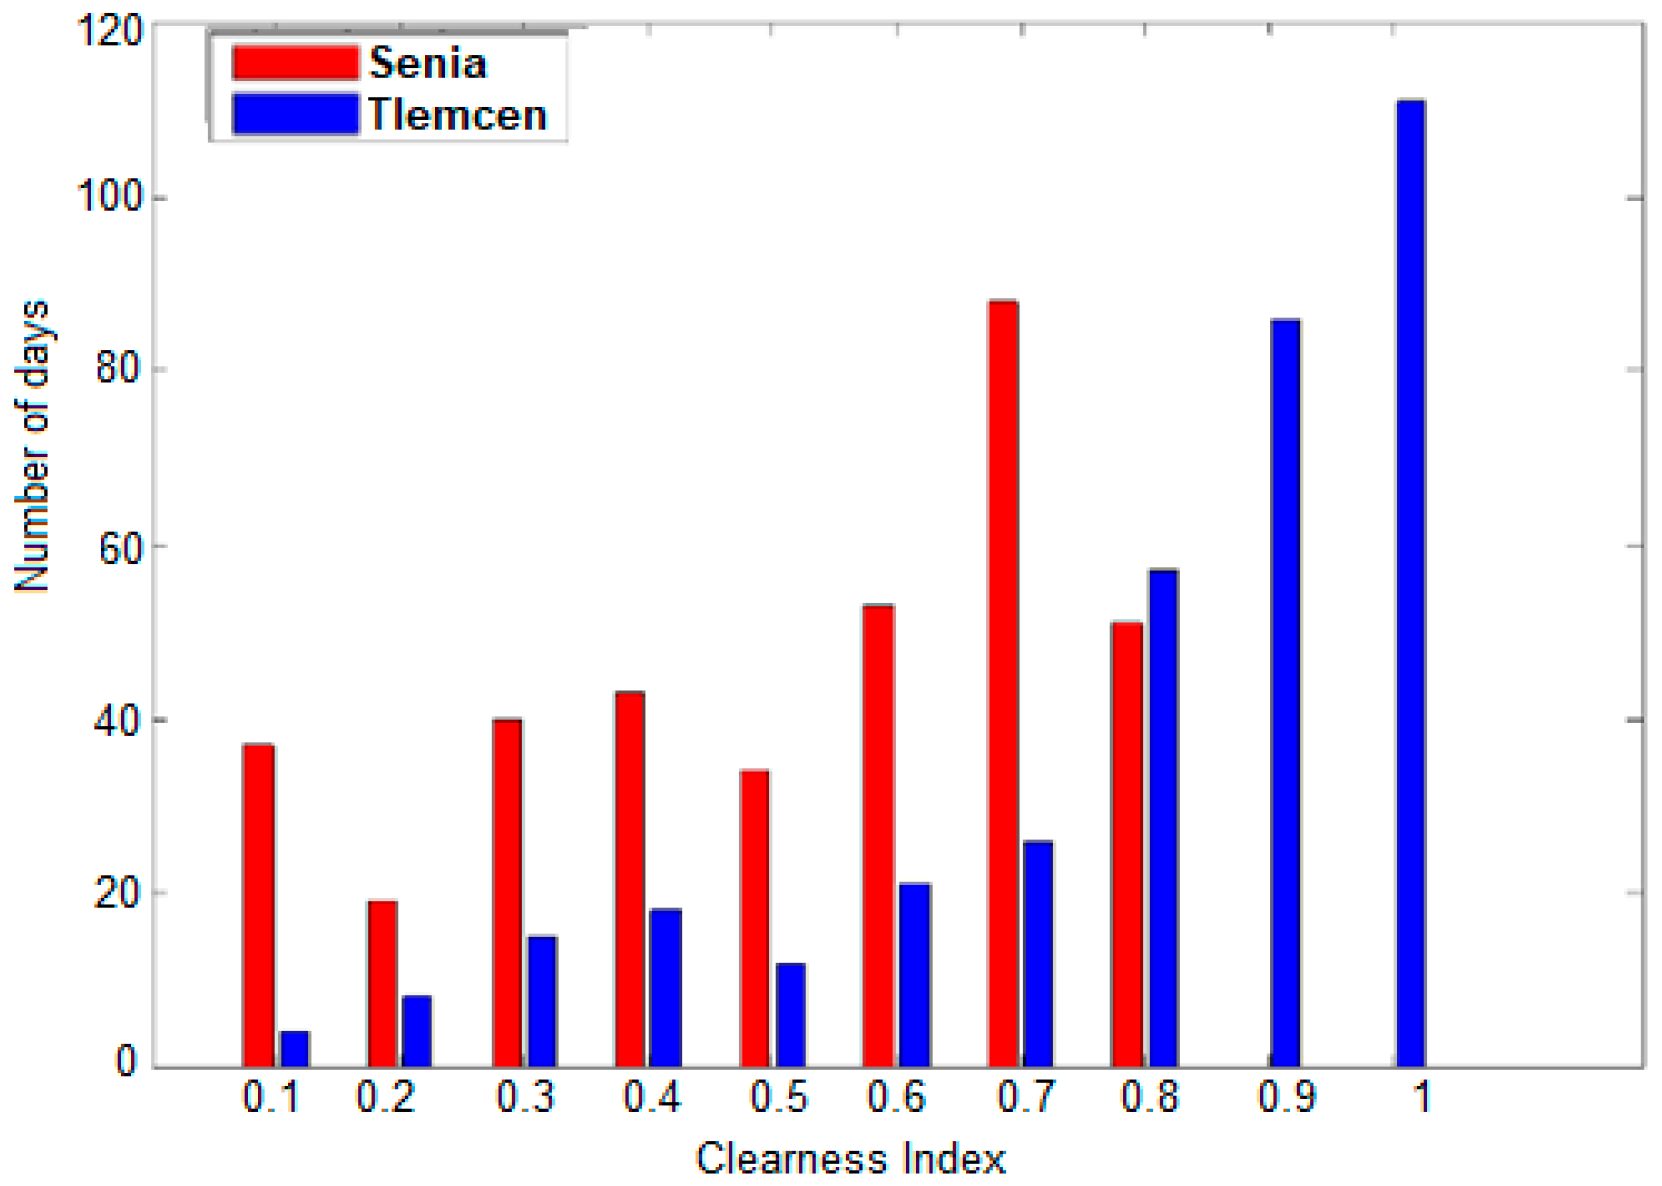
5.2. Distribution of the Daily Clearness Index
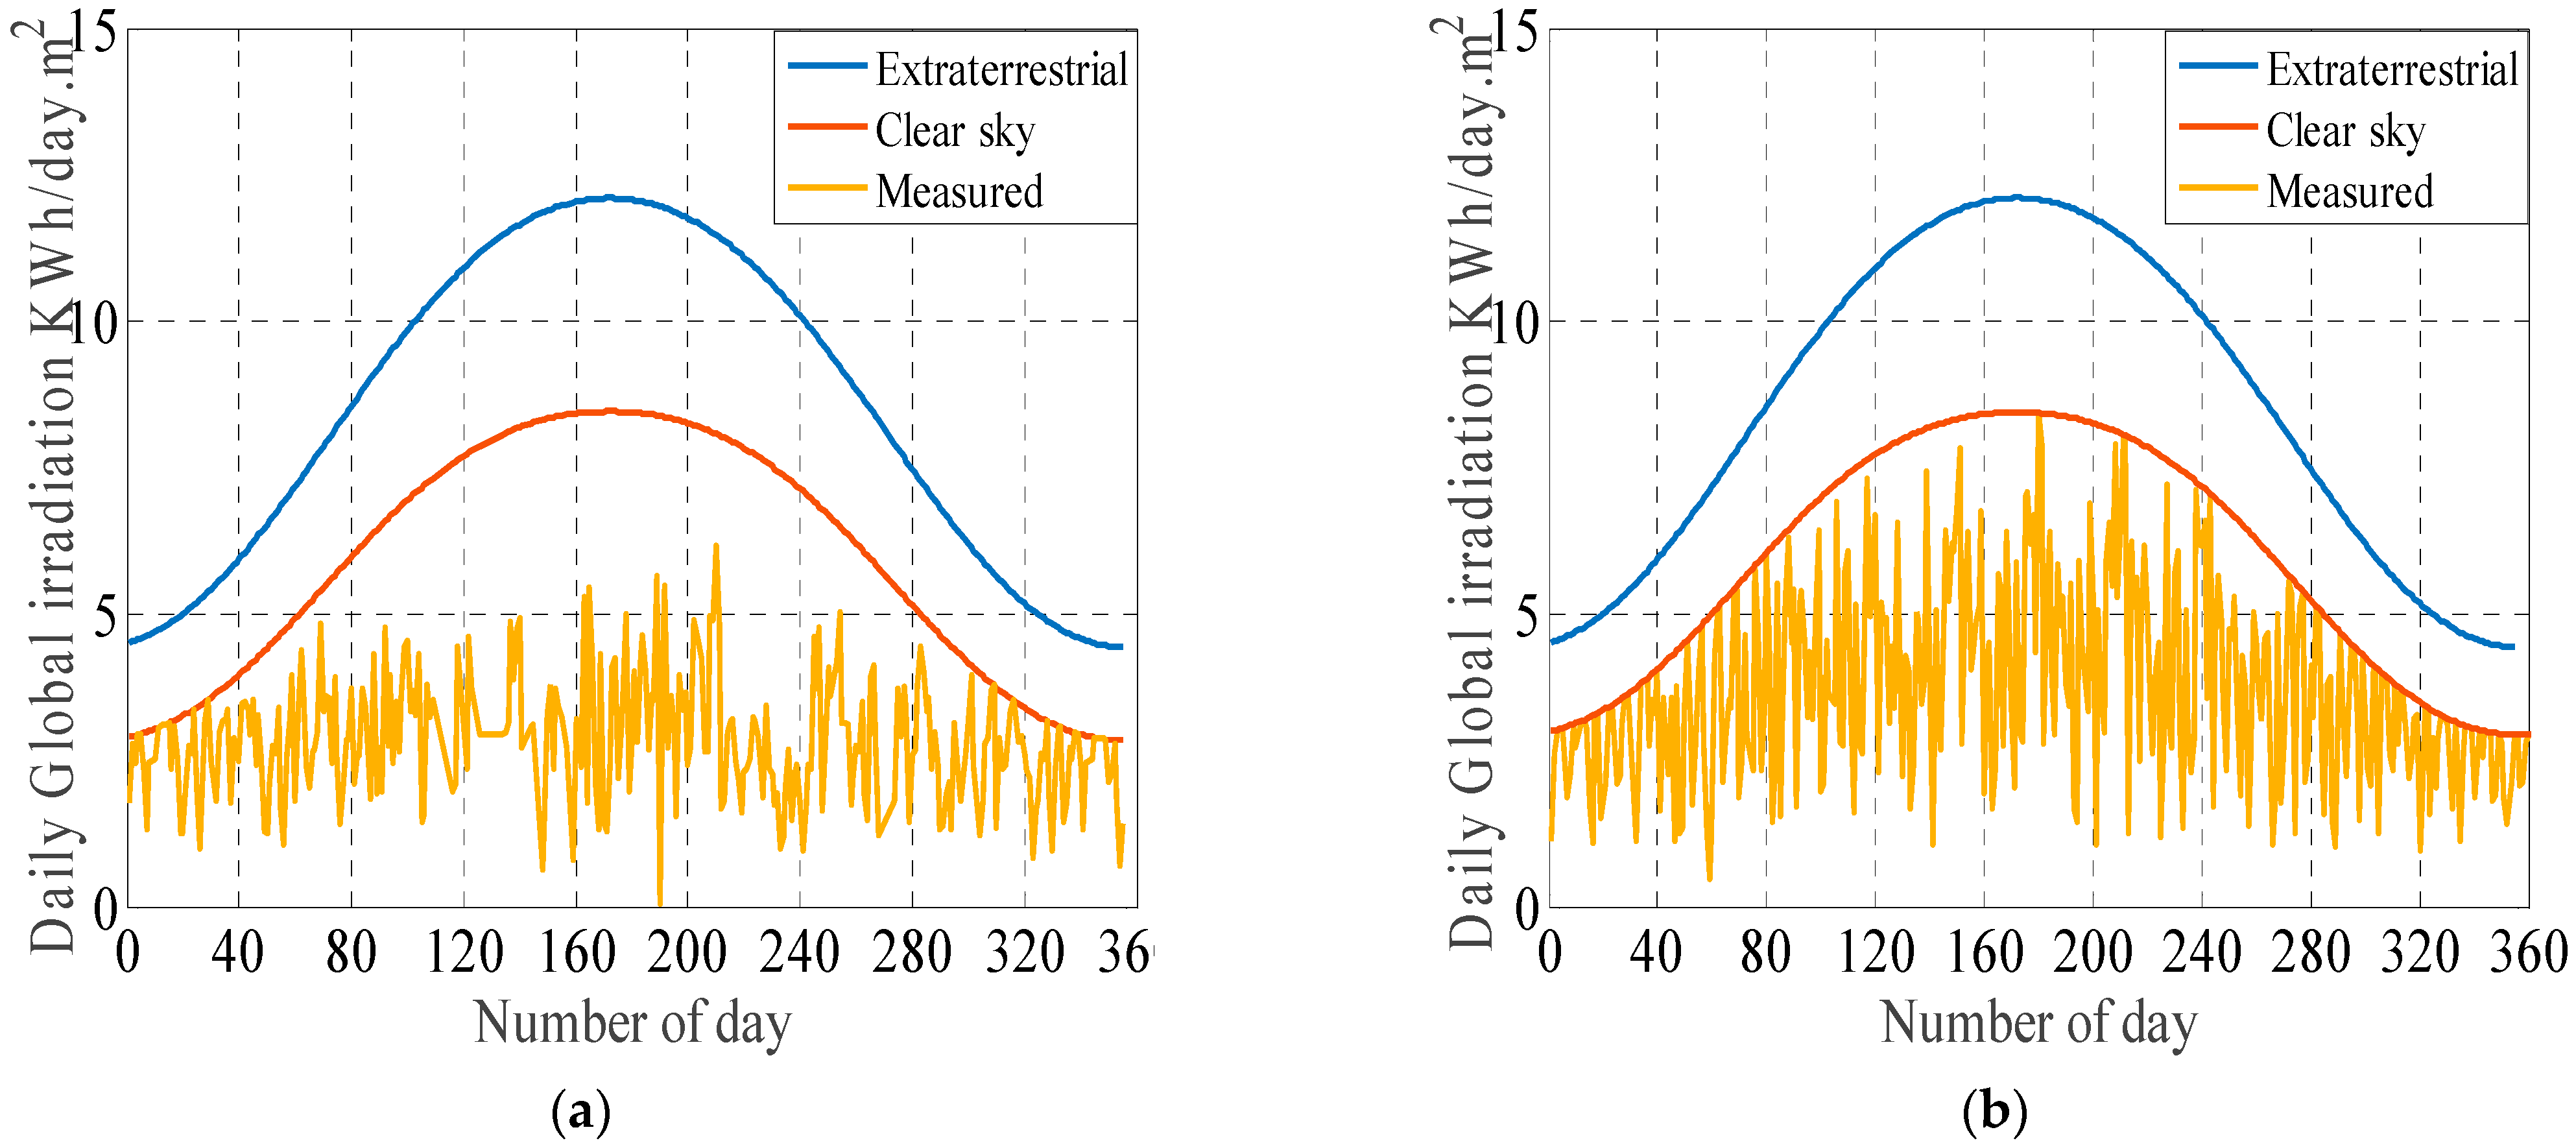
5.3. Annual Evolution of Daily Global Irradiations Measured on a Horizontal Plane
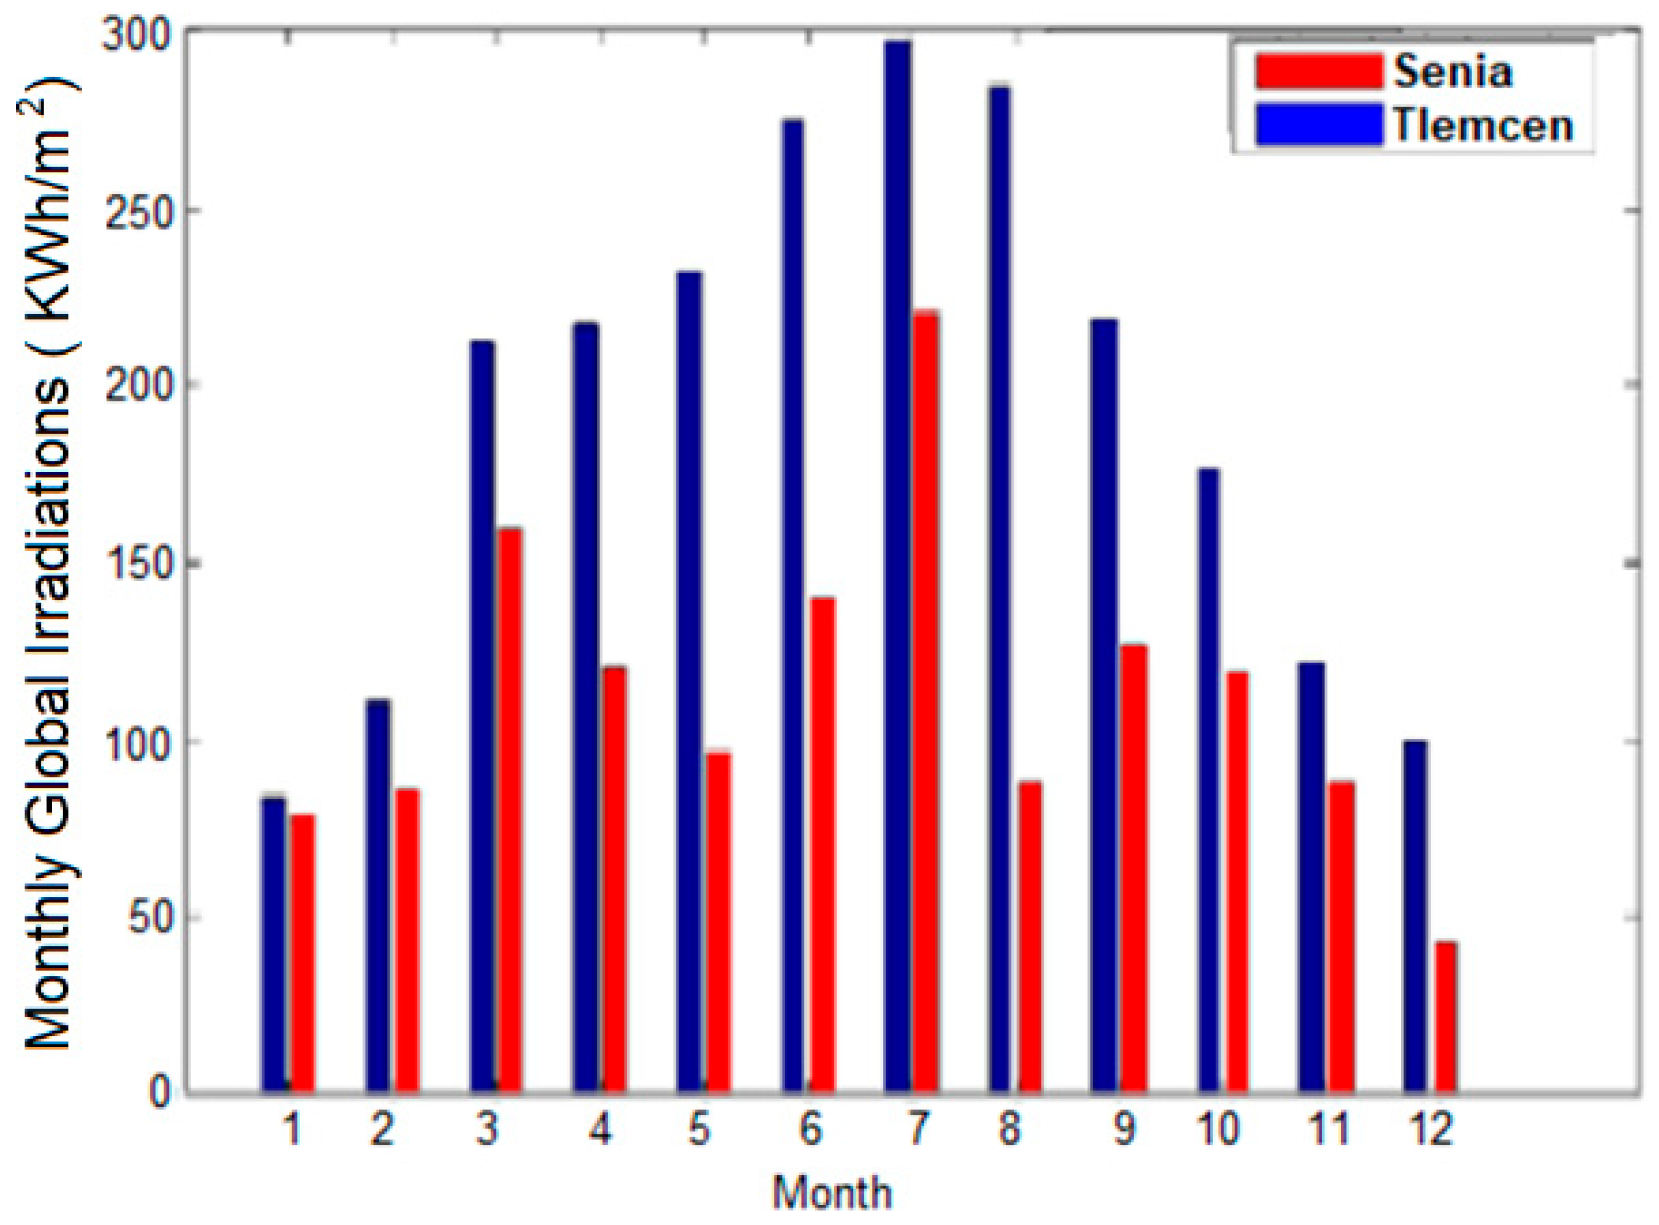
5.4. Histograms of Annual Change in Monthly Global Irradiations for Both Sites
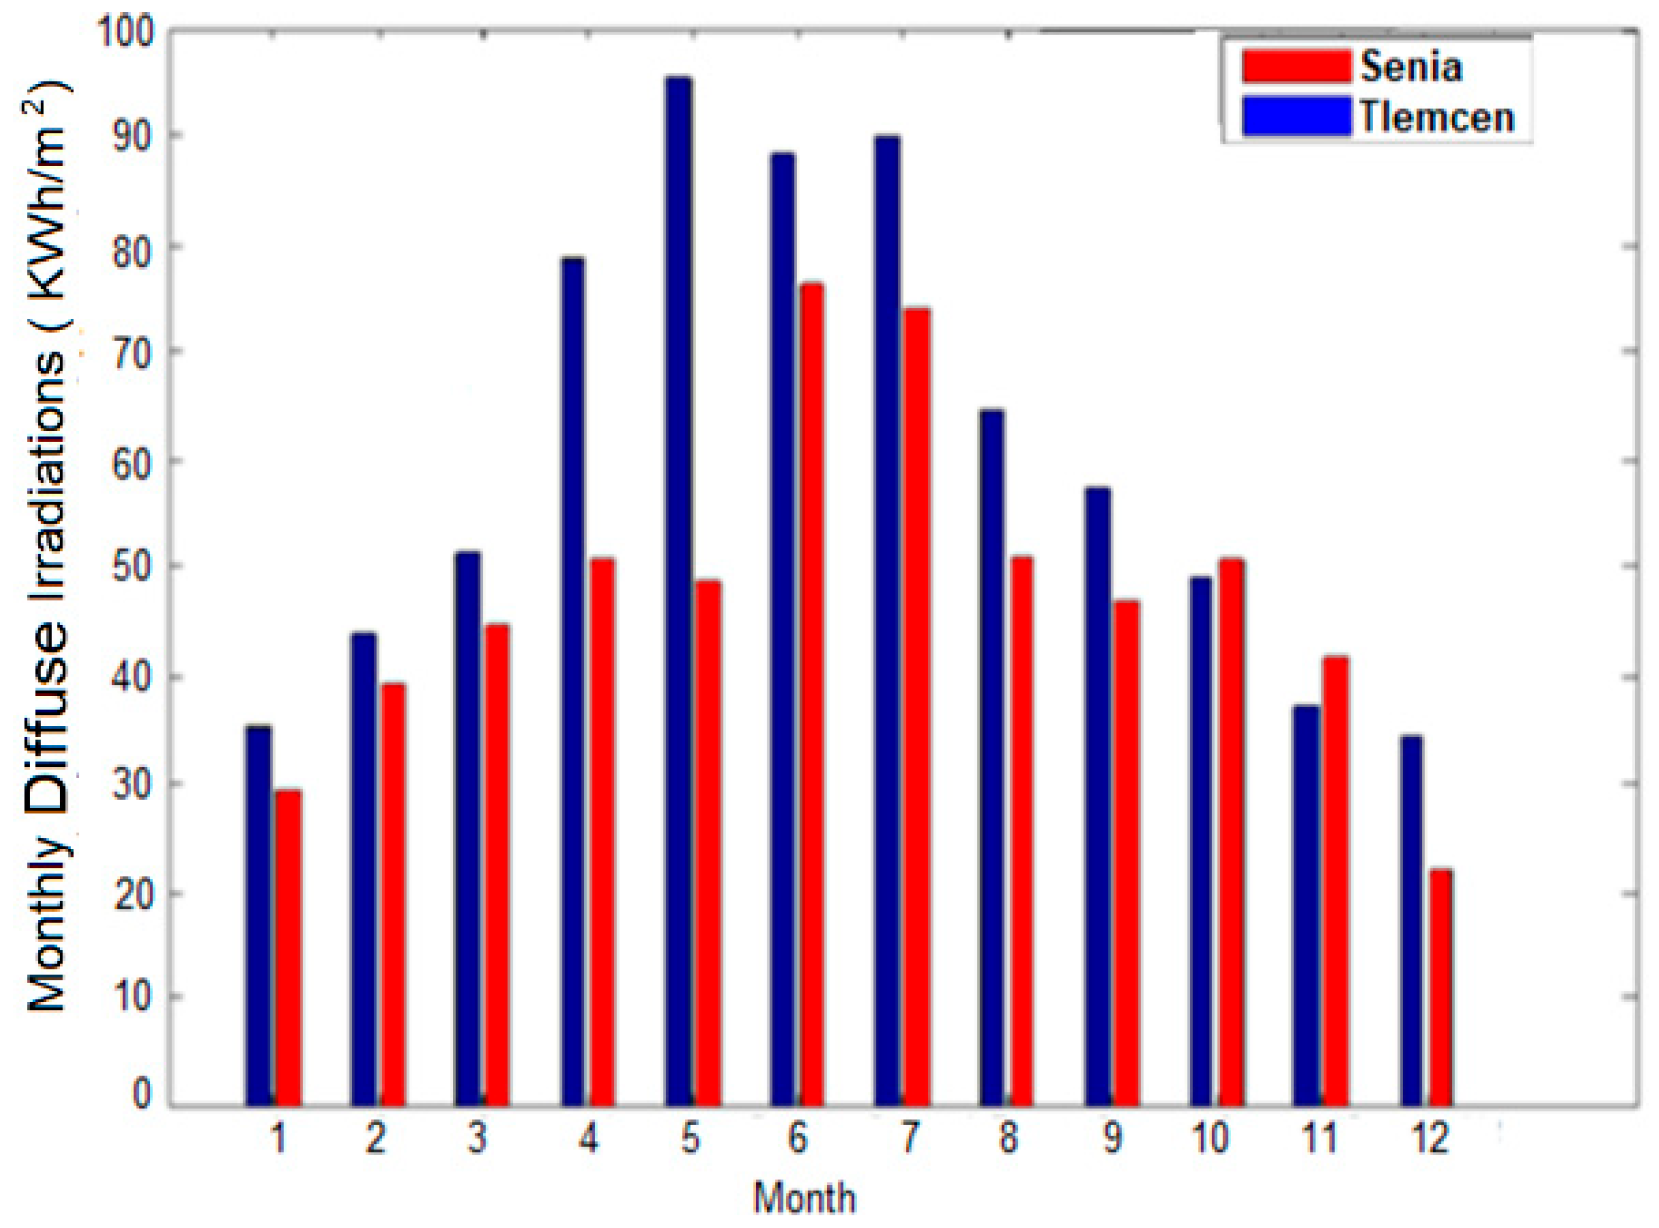
5.5. Histograms of Monthly Diffuses Irradiation Measured on Horizontal Plane for Both Sites
6. Validations Based on Previous Work in Literature
6.1. Validation Based on Capderou and R.Sun Models
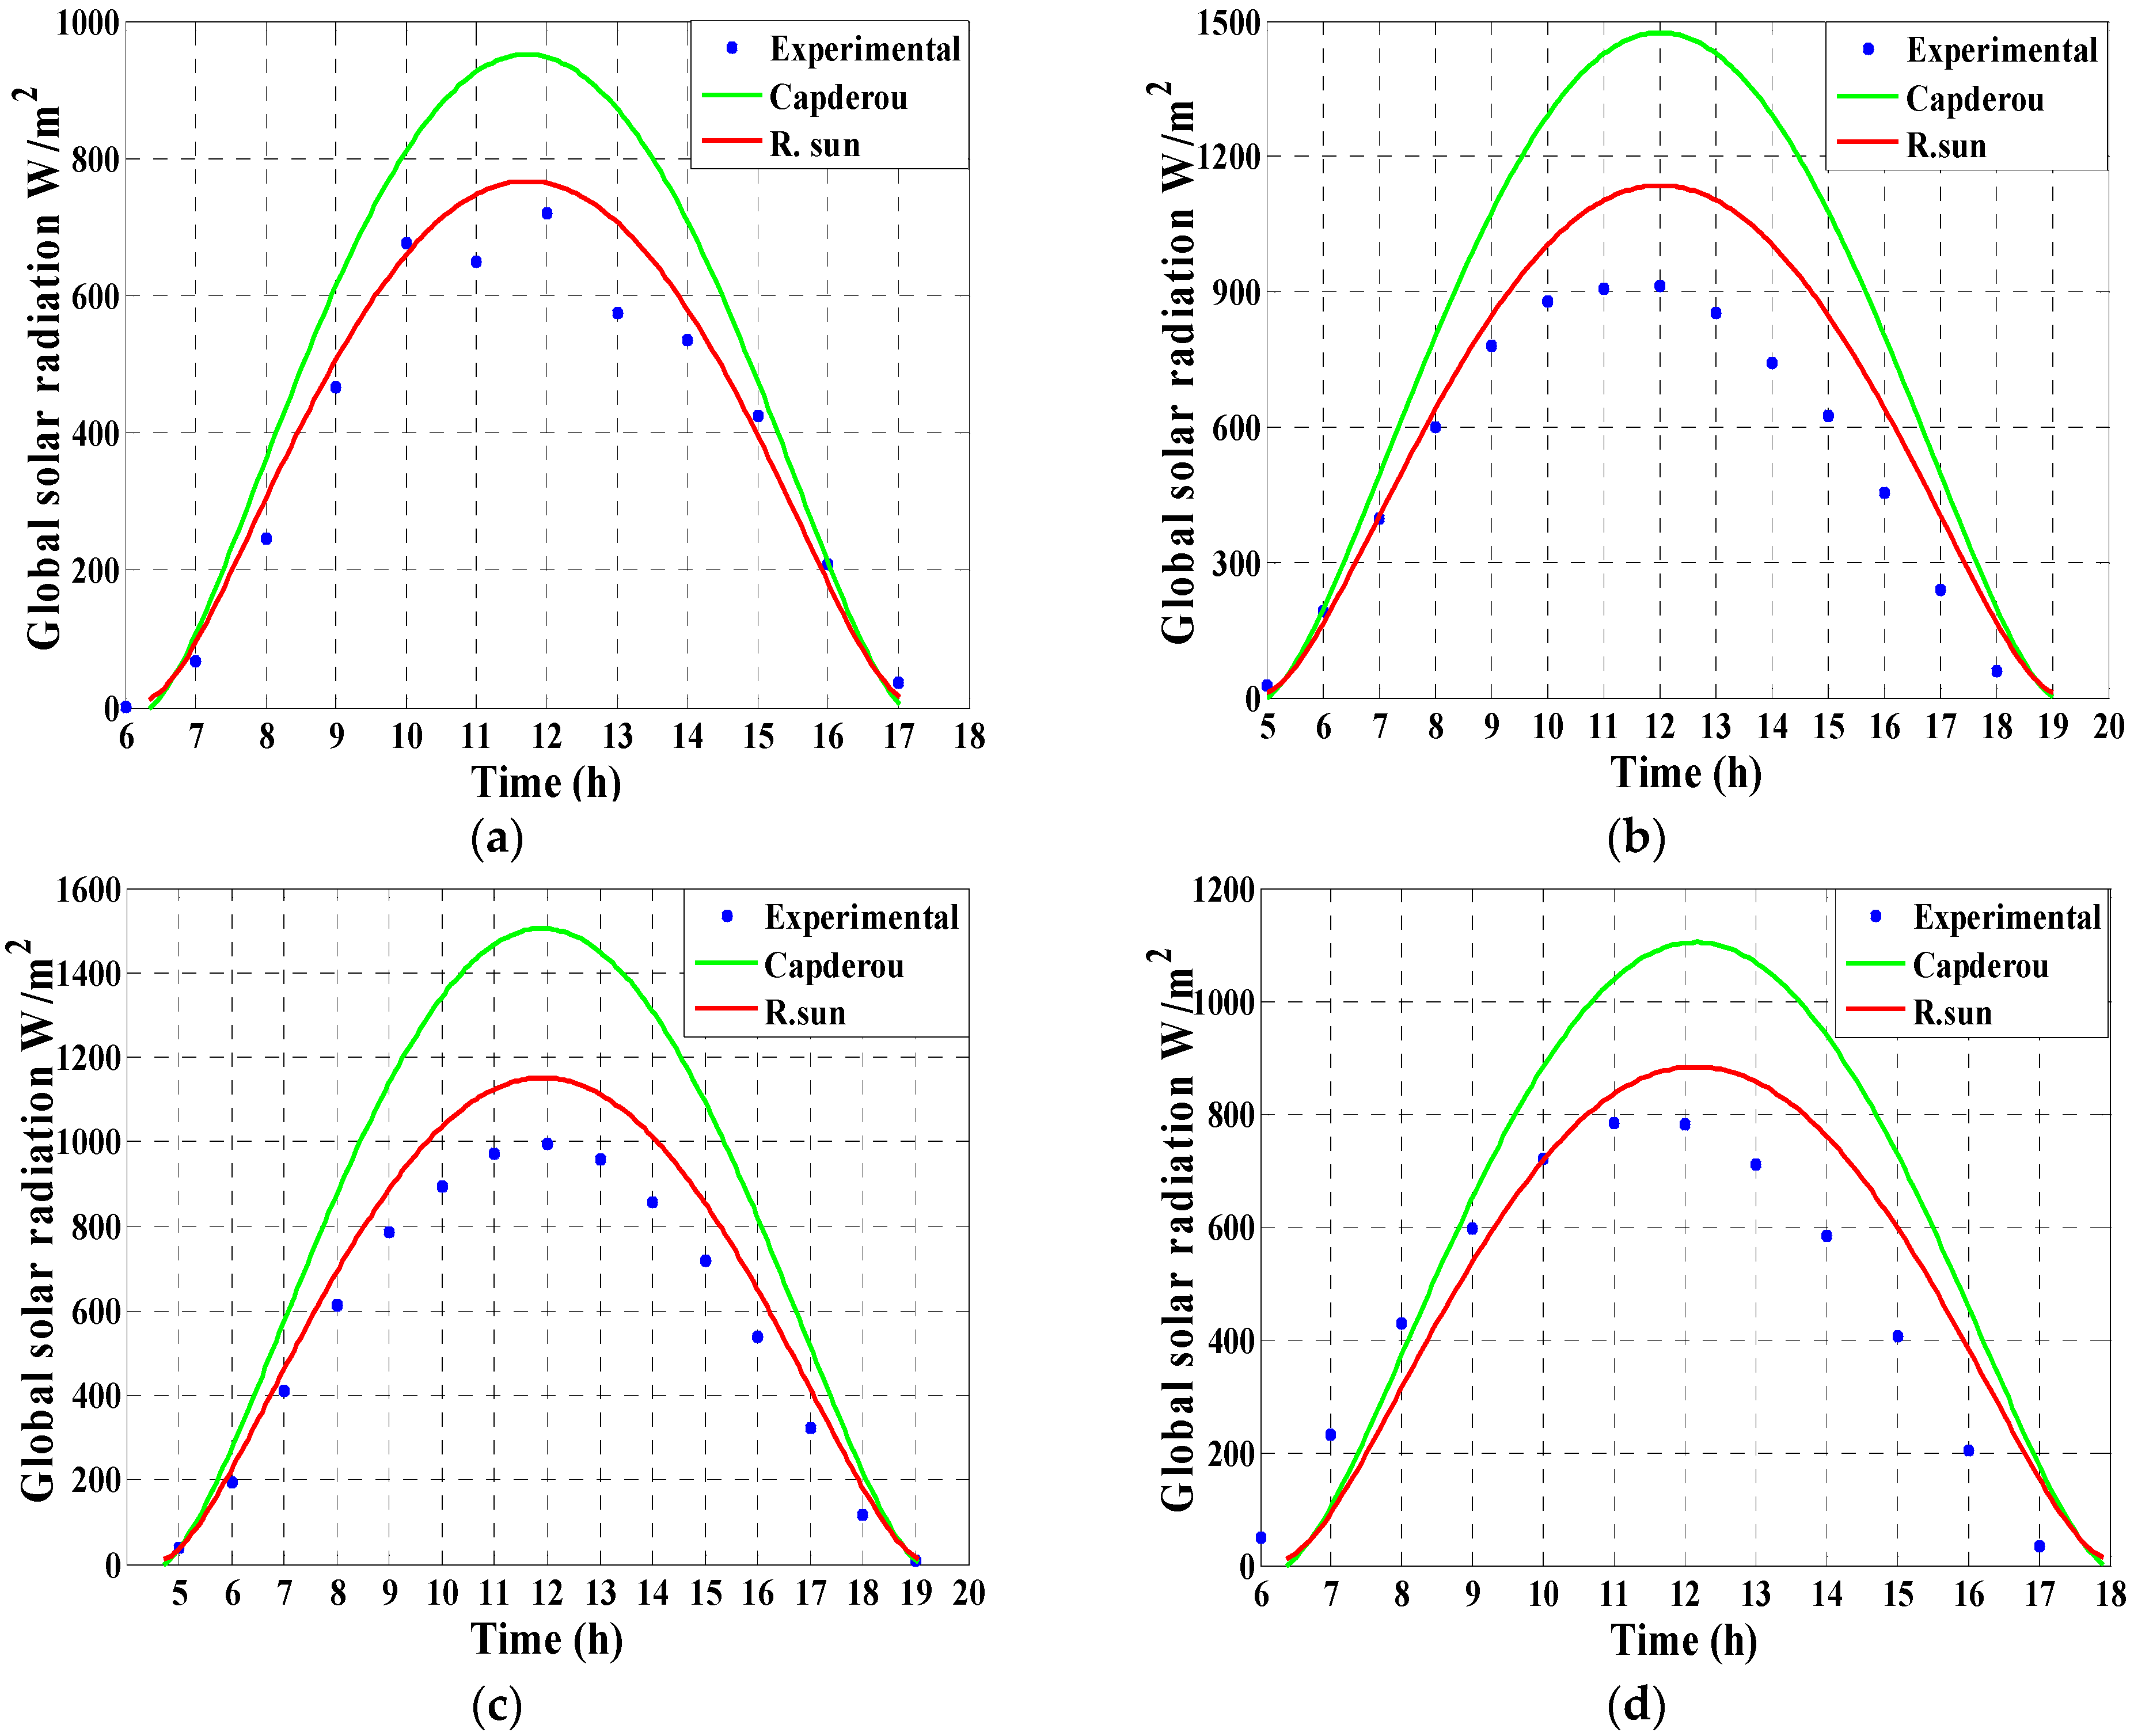
6.1.1. Results Obtained on the Site of Senia
Global Solar Radiations
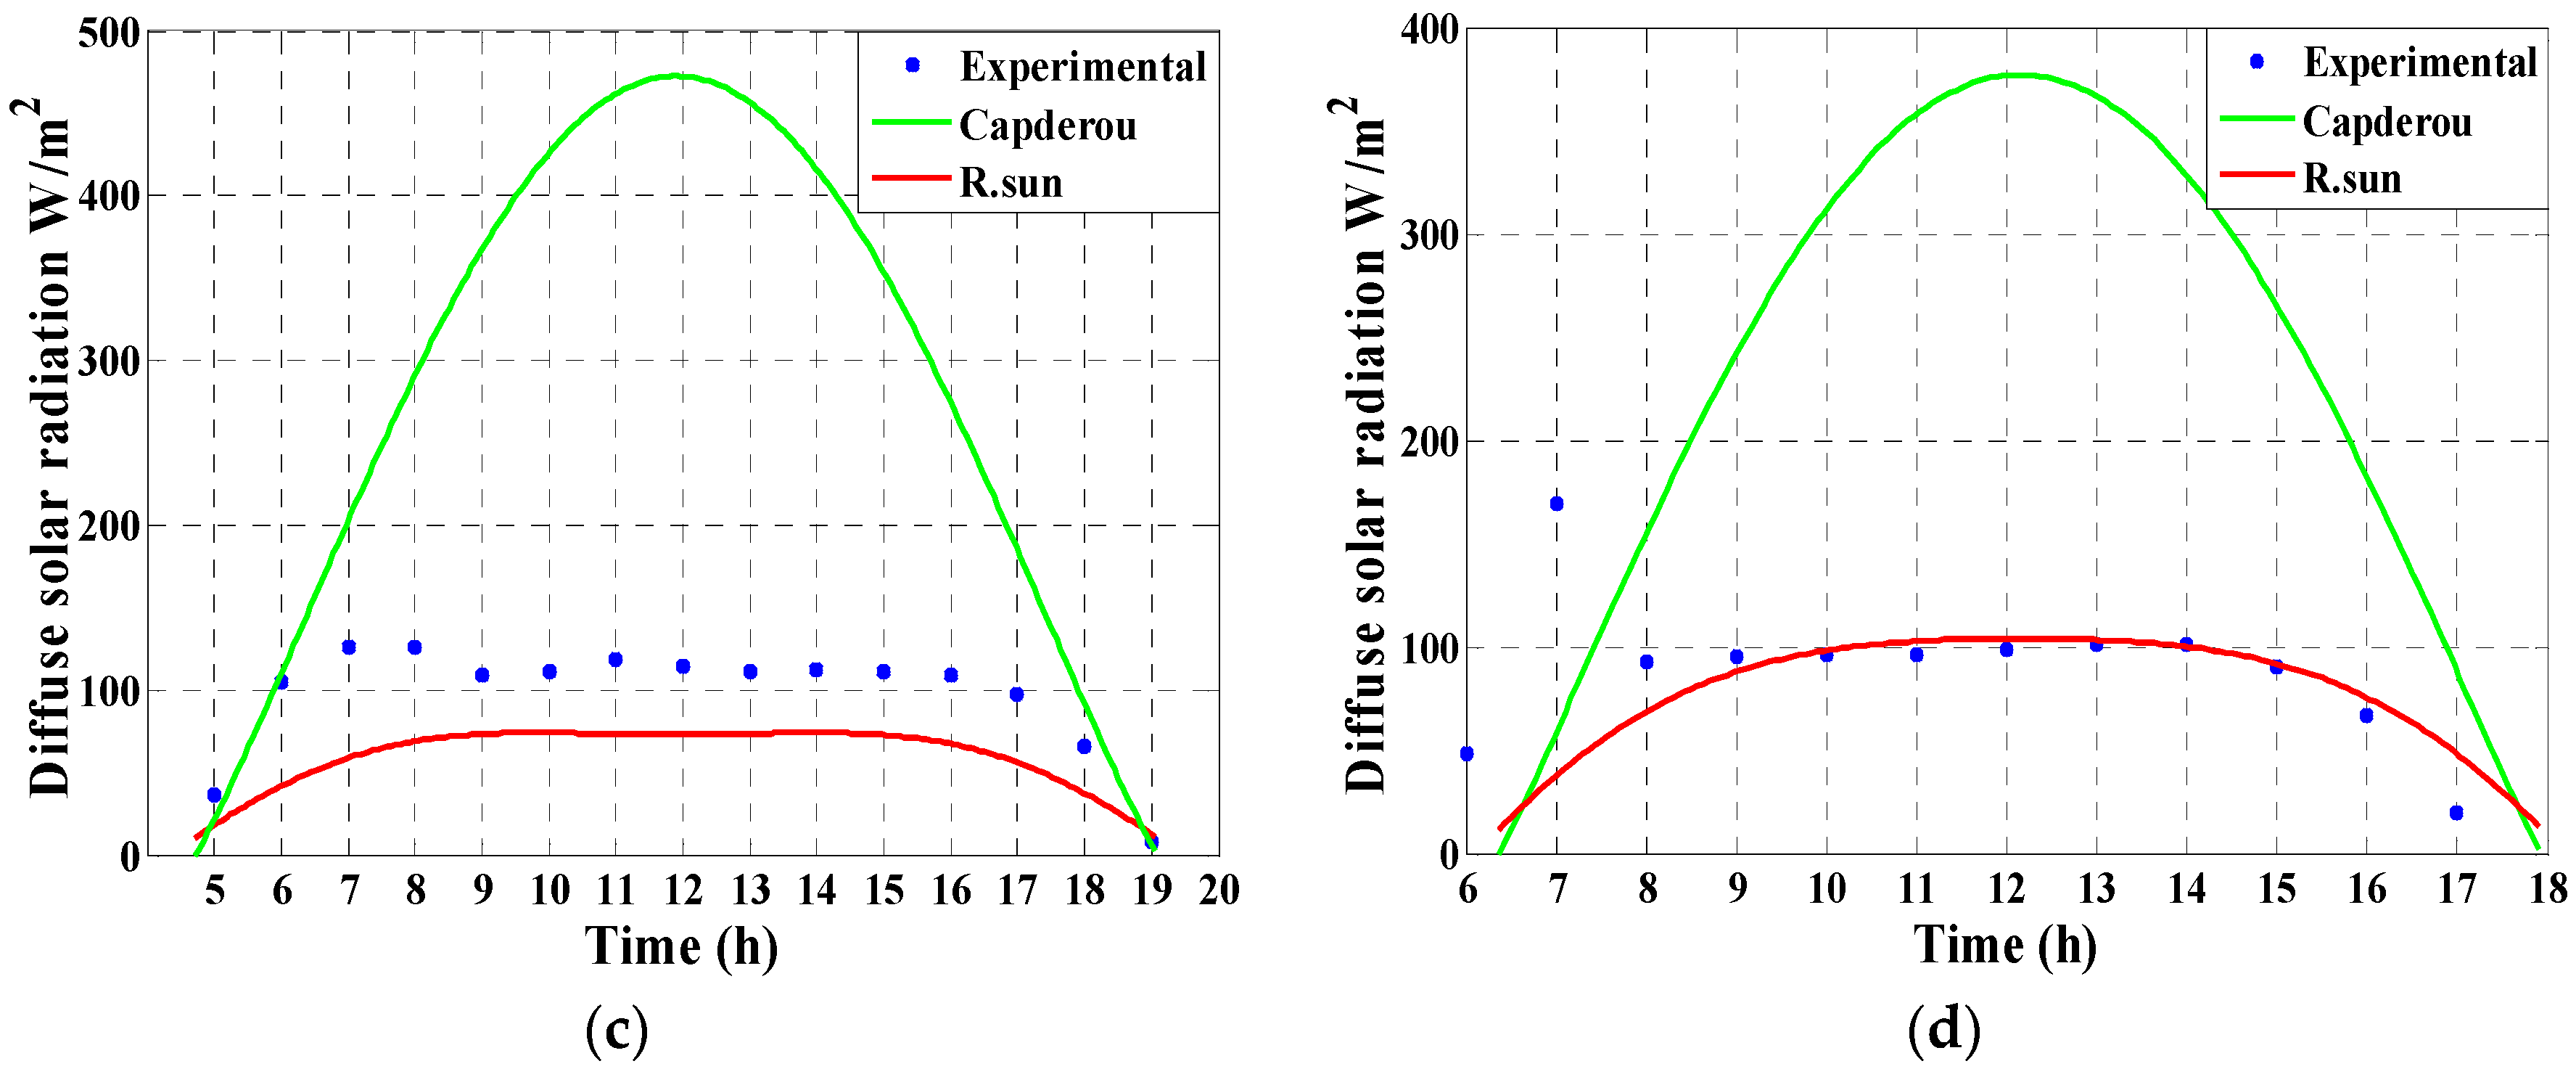
Diffuse Solar Radiations
6.1.2. Results Obtained on the Site of Tlemcen
Global Solar Radiations
Diffuse Solar Radiations
6.1.3. Discussion and Interpretations
6.2. Validation of the Proposed Model Based on the Monthly Averages Results of the Global Solar Irradiation Obtained Experimentally and by the Coppolino Model
6.2.1. The Monthly Averages Results of the Global Solar Irradiation for Both Sites
6.2.2. Discussion and Interpretations
6.3. Validation of the Proposed Model Based on the Obtained Daily Cummulative Global Solar Irradiation under Clear Sky from the Experimental and the Mefti Model (1996)
6.3.1. The Daily Accumulative Results under Clear Sky for Both Sites
6.3.2. Discussion and Interpretation
6.4. Validation of the Proposed Model Based on the Obtained Daily Cummulative Global Solar Irradiation under Clear Sky from the Experimental and Sivkov Model (1964)
6.4.1. The Monthly Cumulative Results of the Global Solar Irradiation Obtained Experimentally and Based on the Sivkov Model
6.4.2. Discussion and Interpretations
6.5. Discussions on the Overall Obtained Results
7. Conclusions
Author Contributions
Funding
Institutional Review Board Statement
Informed Consent Statement
Data Availability Statement
Acknowledgments
Conflicts of Interest
References
- Fekkak, B.; Menaa, M.; Boussahoua, B. Control of transformerless grid-connected PV system using average models of power electronics converters with MATLAB/Simulink. Sol. Energy 2018, 173, 804–813. [Google Scholar] [CrossRef]
- Capderou, M. Atlas Solaire de L’algerie: Aspect Energétique; Tome 1; Office des Publications Universitaires: Algiers, Algeria, 1985; Volumes 1–2. [Google Scholar]
- Mefti, A. Contribution à la Détermination du Gisement Solaire par Traitement de Données Solaires au sol et D’images Météosat. Ph.D. Thesis, University of Science and Technology Houari Boumediene, Bab Ezzouar, Algiers, 2007. [Google Scholar]
- Qu, Z. La Nouvelle Méthode Heliosat-4 Pour L’évaluation du Rayonnement Solaire au Sol. Ph.D. Thesis, Ecole Nationale Supérieure des Mines de Paris, Paris, France, 2013. [Google Scholar]
- Fariza, M. Détermination du Gisement Solaire par Traitement D’images MSG. Master’s Thesis, Mouloud Maameri University of Tizi-Ouzou, Tizi Ouzou, Algiers, 2010. [Google Scholar]
- Makade, R.G.; Chakrabarti, S.; Jamil, B. Prediction of global solar radiation using a single empirical model for diversified locations across India. Urban Clim. 2019, 29, 100492. [Google Scholar] [CrossRef]
- Perveen, G.; Rizwan, M.; Goel, N. Intelligent model for solar energy forecasting and its implementation for solar photovoltaic applications. J. Renew. Sustain. Energy 2018, 10, 063702. [Google Scholar] [CrossRef]
- Da Silva, M.B.P.; Escobedo, J.F.; Rossi, T.J.; dos Santos, C.M.; da Silva, S.H.M.G. Performance of the Angstrom-Prescott Model (AP) and SVM and ANN techniques to estimate daily global solar irradiation in Botucatu/SP/Brazil. J. Atmos. Sol.-Terr. Phys. 2017, 160, 11–23. [Google Scholar] [CrossRef]
- Beyazıt, N.I.; Ünal, F.; Bulut, H. Modeling of the hourly horizontal solar diffuse radiation in Sanliurfa, Turkey. Therm. Sci. 2020, 24, 939. [Google Scholar] [CrossRef]
- Güçlü, Y.S.; Yeleğen, M.Ö.; Dabanlı, İ.; Şişman, E. Solar irradiation estimations and comparisons by ANFIS, Angström–Prescott and dependency models. Sol. Energy 2014, 109, 118–124. [Google Scholar] [CrossRef]
- Muzathik, A.M.; Ibrahim, M.Z.; Samo, K.B.; Nik, W.W. Estimation of global solar irradiation on horizontal and inclined surfaces based on the horizontal measurements. Energy 2011, 36, 812–818. [Google Scholar] [CrossRef]
- Mubiru, J. Using artificial neural networks to predict direct solar irradiation. Adv. Artif. Neural Syst. 2011, 2011, 142054. [Google Scholar] [CrossRef] [Green Version]
- Medeiros, F.J.D.; Silva, C.M.; Bezerra, B.G. Calibration of ångström-Prescott equation to estimate daily solar radiation on Rio Grande do Norte state, Brazil. Rev. Bras. Meteorol. 2017, 32, 409–416. [Google Scholar] [CrossRef] [Green Version]
- Dervishi, S.; Mahdavi, A. Computing diffuse fraction of global horizontal solar radiation: A model comparison. Sol. Energy 2012, 86, 1796–1802. [Google Scholar] [CrossRef] [Green Version]
- Li, F.; Zhong, L.; Cheung, S.G.; Wong, Y.; Shin, P.; Lei, A.; Zhou, H.; Song, X.; Tam, N. Is Laguncularia racemosa more invasive than Sonneratia apetala in northern Fujian, China in terms of leaf energetic cost? Mar. Pollut. Bull. 2020, 152, 110897. [Google Scholar] [CrossRef] [PubMed]
- Hofierka, J.; Suri, M. The solar radiation model for Open source GIS: Implementation and applications. In Proceedings of the Open Source GIS-GRASS Users Conference, Trento, Italy, 11–13 September 2002; Volume 2002, pp. 51–70. [Google Scholar]
- Badescu, V.; Gueymard, C.A.; Cheval, S.; Oprea, C.; Baciu, M.; Dumitrescu, A.; Iacobescu, F.; Milos, I.; Rada, C. Accuracy and sensitivity analysis for 54 models of computing hourly diffuse solar irradiation on clear sky. Theor. Appl. Clim. 2013, 111, 379–399. [Google Scholar] [CrossRef]
- Dogniaux, R. Representation Analytique des Composantes du Rayonnement Solaire; Serie A No. 83; The Royal Meteorological Institute of Belgium: Brussels, Belgium, 1974. [Google Scholar]
- López, G.; Batlles, F.J. Estimate of the atmospheric turbidity from three broad-band solar radiation algorithms. A comparative study. Ann. Geophys. Eur. Geosci. Union 2004, 22, 2657–2668. [Google Scholar] [CrossRef]
- Klimenta, D.; Lekic, J.; Arsic, S.; Tasic, D.; Krstic, N.; Radosavljevic, D. A Novel Procedure for Quick Design of Off-Grid PV Water Pumping Systems for Irrigation. Elektron. Elektrotechnika 2021, 27, 64–77. [Google Scholar] [CrossRef]
- Mahjoubi, A. Global Solar Radiation in Two Tunisian Cities: Comparison of Prediction and Measured Data. J. Sustain. Energy 2018, 4, 101–109. [Google Scholar]
- Marif, Y.; Chiba, Y.; Belhadj, M.M.; Zerrouki, M.; Benhammou, M. A clear sky irradiation assessment using a modified Algerian solar atlas model in Adrar city. Energy Rep. 2018, 4, 84–90. [Google Scholar] [CrossRef]
- Abdeladim, K.; Razagui, A.; Semaoui, S.; Arab, A.H. Updating Algerian solar atlas using MEERA-2 data source. Energy Rep. 2020, 6, 281–287. [Google Scholar] [CrossRef]
- Flores, J.L.; Karam, H.A.; Marques Filho, E.P.; Pereira Filho, A.J. Estimation of atmospheric turbidity and surface Radiative parameters using broadband clear sky solar irradiance models in Rio de Janeiro-Brasil. Theor. Appl. Climatol. 2016, 123, 593–617. [Google Scholar] [CrossRef]
- Chabane, F.; Guellai, F.; Michraoui, M.Y.; Bensahal, D.; Bima, A.; Moummi, N. Prediction of the global solar radiation onnclined area. Appl. Sol. Energy 2019, 55, 41–47. [Google Scholar] [CrossRef]
- Gougui, A.; Djafour, A.; Khelfaoui, N.; Boutelli, H. Empirical models validation to estimate global solar irradiance on a horizontal plan in Ouargla, Algeria. In AIP Conference Proceedings; AIP Publishing LLC: Melville, NY, USA, 2018; Volume 1968, p. 030045. [Google Scholar]
- Ammar, R.B.; Ammar, M.B.; Oualha, A. Photovoltaic power forecast using empirical models and artificial intelligence approaches for water pumping systems. Renew. Energy 2020, 153, 1016–1028. [Google Scholar] [CrossRef]
- Alam, F.; Rehman, S.U.; Rehman, S.; Jahangir, M.; Shoaib, M.; Siddiqui, I.; Ulfat, I. Empirical model development for the estimation of clearness index using meteorological parameters. Turk. J. Electr. Eng. Comput. Sci. 2019, 27, 4429–4441. [Google Scholar] [CrossRef]
- Akinpelu, J.A.; Olawale, O.K.; Omole, O.T. Estimation of global solar radiation for Ikeja, Enugu and Kano, Nigeria. J. Appl. Sci. Environ. Manag. 2018, 22, 1877–1880. [Google Scholar] [CrossRef] [Green Version]
- Smaili, K.; Merzouk, N.K.; Merzouk, M. Solar Climatic Atlas of Daily Usability by Variable Sky in Algeria. In Proceedings of the 2019 7th International Renewable and Sustainable Energy Conference (IRSEC), Agadir, Morocco, 27–30 November 2019; pp. 1–6. [Google Scholar]
- Gairaa, K.; Benkaciali, S.; Guermoui, M. Clear-sky models evaluation of two sites over Algeria for PV forecasting purpose. Eur. Phys. J. Plus 2019, 134, 534. [Google Scholar] [CrossRef]
- Geiger, M.; Diabaté, L.; Ménard, L.; Wald, L. Controlling the quality of solar irradiation data by means of a web service. In European Geophysical Society, 27th General Assembly; European Geophysical Society: Munich, Germany, 2002; p. A-03419. [Google Scholar]
- Kasten, F. The Linke turbidity factor based on improved values of the integral Rayleigh optical thickness. Sol. Energy 1996, 56, 239–244. [Google Scholar] [CrossRef]
- Coppolino, S. Validation of a very simple model for computing global solar radiation in the European, African, Asian and North American areas. Sol. Wind. Technol. 1990, 7, 489–494. [Google Scholar] [CrossRef]
- Coppolino, S. A very simple model for computing global solar radiation. Sol. Wind Technol. 1990, 7, 299–303. [Google Scholar] [CrossRef]
- Sivkov, S.I. To the method of computing possible radiation in Italy. Trans. Main. Geophys. Obs. 1964, 160, 1–20. [Google Scholar]


| Month | R2 | RMSE | R2 | RMSE | ||||
| January | −0.8711 | 0.9009 | 0.9149 | 0.0741 | −1.4285 | 1.2373 | 0.8698 | 0.0916 |
| February | −0.6610 | 0.8740 | 0.7563 | 0.1150 | −1.1398 | 1.1182 | 0.8760 | 0.0820 |
| March | −0.8708 | 0.9209 | 0.9377 | 0.0535 | −1.2194 | 1.1071 | 0.8941 | 0.0696 |
| April | −0.6582 | 0.8469 | 0.7891 | 0.0816 | −1.0257 | 1.0353 | 0.7409 | 0.0902 |
| May | −0.4654 | 0.8236 | 0.5485 | 0.1319 | −0.8992 | 1.0019 | 0.7023 | 0.1076 |
| June | −0.3928 | 0.8421 | 0.2657 | 0.1903 | −1.0962 | 1.1015 | 0.8250 | 0.0929 |
| July | −0.1272 | 0.4324 | 0.0595 | 0.0939 | −0.1094 | 0.4093 | 0.0224 | 0.0958 |
| August | −0.4274 | 0.9171 | 0.3012 | 0.1246 | −1.6606 | 1.0743 | 0.6584 | 0.0871 |
| September | −0.6342 | 0.7925 | 0.7746 | 0.0892 | −0.7731 | 0.8320 | 0.4171 | 0.1434 |
| October | −0.7996 | 1.0177 | 0.4918 | 0.1669 | −1.3770 | 1.2564 | 0.6943 | 0.1298 |
| November | −0.6278 | 0.8859 | 0.7114 | 0.1207 | −1.3941 | 1.3018 | 0.7706 | 0.1075 |
| December | −0.7568 | 0.9003 | 0.8369 | 0.1077 | −1.3762 | 1.2171 | 0.7999 | 0.1193 |
| Month | R2 | RMSE | R2 | RMSE | ||||
| January | −0.8302 | 0.9114 | 0.9122 | 0.0803 | −0.9663 | 1.0971 | 0.9177 | 0.0777 |
| February | −0.8217 | 0.9240 | 0.8269 | 0.1056 | −0.9336 | 1.0556 | 0.7998 | 0.1135 |
| March | −0.8065 | 0.8574 | 0.7957 | 0.0828 | −0.7203 | 0.8720 | 0.5971 | 0.1163 |
| April | −0.6337 | 0.8338 | 0.7536 | 0.0996 | −0.7637 | 0.9755 | 0.8367 | 0.0811 |
| May | −0.6105 | 0.8220 | 0.8338 | 0.0771 | −0.7097 | 0.9516 | 0.8688 | 0.0685 |
| June | −0.7927 | 0.9516 | 0.8220 | 0.0829 | −0.9871 | 1.1492 | 0.9282 | 0.0527 |
| July | −0.4887 | 0.7073 | 0.4170 | 0.0654 | −0.9829 | 1.1429 | 0.7544 | 0.0425 |
| August | −0.6820 | 0.8205 | 0.4996 | 0.0549 | −1.0703 | 1.1808 | 0.7406 | 0.0395 |
| September | −0.6698 | 0.7980 | 0.6193 | 0.0934 | −0.8924 | 1.0202 | 0.7717 | 0.0724 |
| October | −0.7527 | 0.8698 | 0.8040 | 0.0887 | −1.0151 | 1.1489 | 0.9004 | 0.0635 |
| November | −0.8734 | 0.9638 | 0.8707 | 0.0924 | −1.0704 | 1.1805 | 0.8700 | 0.0926 |
| December | −0.8205 | 0.9406 | 0.8938 | 0.0871 | −1.0378 | 1.1413 | 0.8874 | 0.0898 |
| Sky Clearness | A(W/m2) | B(W/m2) | C(W/m2) | D(W/m2) | E |
|---|---|---|---|---|---|
| Dark blue sky | 1300 | 87 | 6 | 1150 | 1.15 |
| Clear blue sky | 1230 | 125 | 4 | 1080 | 1.22 |
| Month | Jan | Feb | Mar | Apr | May | Jun | Jul | Aug | Sep | Oct | Nov | Dec |
|---|---|---|---|---|---|---|---|---|---|---|---|---|
| Day in Month | 17 | 16 | 16 | 15 | 15 | 11 | 17 | 16 | 15 | 15 | 14 | 10 |
| Day in Year | 17 | 47 | 75 | 105 | 135 | 162 | 198 | 228 | 258 | 288 | 318 | 344 |
| Site | Senia | Tlemcen |
|---|---|---|
| Duration (In Hours) | 2233.5 | 3104.4 |
| Month | Experimental | Proposed Model | Er1% | Coppolino Model | Er2% |
|---|---|---|---|---|---|
| January | 9.1114 | 9.1660 | 0.5997 | 8.2871 | 8.9927 |
| February | 11.0130 | 11.0563 | 0.3926 | 11.9424 | 8.4059 |
| March | 18.1234 | 18.5384 | 2.2898 | 11.9424 | 8.4059 |
| April | 19.2266 | 19.2905 | 0.3323 | 16.6103 | 19.2706 |
| May | 19.4342 | 19.5692 | 0.6948 | 13.4004 | 30.8333 |
| June | 18.0808 | 18.0808 | 0.0000 | 17.3143 | 4.2392 |
| July | 25.5268 | 25.5565 | 0.1164 | 18.7369 | 26.5680 |
| August | 10.1663 | 10.1019 | 0.6335 | 15.0157 | 48.0037 |
| September | 17.5243 | 17.4682 | 0.3206 | 15.9186 | 9.1922 |
| October | 13.6263 | 13.6527 | 0.1941 | 12.5596 | 7.8132 |
| November | 10.3746 | 10.6091 | 2.2606 | 10.8900 | 4.8578 |
| December | 7.4383 | 7.4201 | 7.4201 | 1.2059 | 83.9933 |
| Annual Mean | 14.9705 | 15.0425 | 0.4807 | 13.0360 | 12.9220 |
| Month | Experimental | Proposed Model | Er1% | Coppolino Model | Er2% |
|---|---|---|---|---|---|
| January | 10.7582 | 10.8067 | 0.4505 | 8.4171 | 21.6636 |
| February | 14.1571 | 14.2167 | 0.4210 | 10.2529 | 27.4620 |
| March | 24.5698 | 24.6340 | 0.2613 | 14.6149 | 40.4113 |
| April | 25.9839 | 26.0739 | 0.3464 | 20.2534 | 21.9777 |
| May | 27.0138 | 26.9943 | 0.0723 | 19.0394 | 29.5411 |
| June | 33.0110 | 33.0197 | 0.0264 | 21.1020 | 36.0665 |
| July | 34.0701 | 34.5203 | 0.4370 | 23.8638 | 30.4351 |
| August | 32.7533 | 33.0826 | 1.0053 | 22.8061 | 30.0678 |
| September | 25.9843 | 26.2232 | 0.9196 | 18.5853 | 28.2222 |
| October | 20.0092 | 20.3003 | 1.4548 | 14.1162 | 29.0292 |
| November | 14.5769 | 14.7367 | 1.0965 | 11.1648 | 23.1540 |
| December | 11.4754 | 11.5699 | 0.8235 | 5.6641 | 50.2280 |
| Annual Mean | 22.8885 | 23.0148 | 0.5516 | 15.8231 | 30.6882 |
| Date Under Clear Sky | Experimental | Proposed Model | Er1% | Mefti Model | Er2% |
|---|---|---|---|---|---|
| 16 February | 4.61 | 4.52 | 1.95 | 4.4545 | 3.3734 |
| 20 May | 7.6664 | 7.97 | 3.81 | 7.7532 | 1.1328 |
| 1 July | 8.4192 | 8.65 | 2.85 | 7.9255 | 5.8636 |
| 2 October | 5.5308 | 6.22 | 4.75 | 5.8636 | 0.7042 |
| Date Under Clear Sky | Experimental | Proposed Model | Er1% | Mefti Model | Er2% |
|---|---|---|---|---|---|
| 22 February | 4.9981 | 4.71 | 5.76 | 3.5192 | 29.5893 |
| 8 May | 9.0667 | 9.12 | 0.59 | 6.8388 | 24.5675 |
| 29 July | 10.8247 | 10.79 | 0.32 | 7.9681 | 26.3894 |
| 26 October | 7.1156 | 6.99 | 1.77 | 5.9400 | 16.5207 |
| Date by Clear Sky | Experimental | Proposed Model | Er1% | Sivkov Model | Er2% |
|---|---|---|---|---|---|
| January | 282.4536 | 281.52 | 0.33 | 265.1043 | 6.1424 |
| February | 308.3654 | 307.28 | 0.35 | 319.0375 | 3.4609 |
| March | 561.8252 | 550.99 | 1.93 | 553.3256 | 1.5129 |
| April | 422.9844 | 410.01 | 3.07 | 517.8925 | 22.4377 |
| May | 349.8155 | 320.54 | 8.37 | 522.2069 | 30.8333 |
| June | 506.2628 | 499.57 | 1.32 | 622.7134 | 49.2806 |
| July | 791.3303 | 780.11 | 1.42 | 824.0640 | 23.0020 |
| August | 315.1566 | 300.02 | 4.80 | 585.2954 | 48.0037 |
| September | 455.6330 | 522.82 | 14.75 | 502.0081 | 4.1365 |
| October | 422.4143 | 411.97 | 2.47 | 452.2510 | 7.0634 |
| November | 311.2382 | 301.19 | 3.23 | 319.5519 | 2.6712 |
| December | 156.2049 | 171.92 | 10.06 | 176.8331 | 13.2059 |
| Annual Cumulative | 4883.6842 | 4857.94 | 0.53 | 5660.2837 | 15.9019 |
| Date by Clear Sky | Experimental | Proposed Model | Er1% | Sivkov Model | Er2% |
|---|---|---|---|---|---|
| January | 301.2310 | 288.23 | 4.32 | 256.0410 | 15.0018 |
| February | 396.4000 | 381.12 | 3.85 | 341.4205 | 13.8697 |
| March | 761.6642 | 735.01 | 3.5 | 600.1289 | 21.2082 |
| April | 779.5162 | 763.18 | 2.1 | 660.2086 | 15.3053 |
| May | 837.4283 | 800.14 | 4.45 | 689.6181 | 17.65.05 |
| June | 990.3302 | 955.99 | 3.47 | 833.3348 | 15.8528 |
| July | 1065.500 | 1005.09 | 5.67 | 889.2017 | 16.5440 |
| August | 1015.400 | 1002.13 | 1.31 | 857.7873 | 15.5183 |
| September | 779.5284 | 719.19 | 7.74 | 646.1216 | 17.1138 |
| October | 620.2838 | 588.29 | 5.16 | 520.6633 | 16.0605 |
| November | 437.3076 | 398.37 | 8.9 | 377.9954 | 13.5630 |
| December | 358.6669 | 329.30 | 8.19 | 308.4884 | 13.2822 |
| Annual Cumulative | 8343.2564 | 7966.04 | 4.52 | 6981.0096 | 16.33 |
Publisher’s Note: MDPI stays neutral with regard to jurisdictional claims in published maps and institutional affiliations. |
© 2021 by the authors. Licensee MDPI, Basel, Switzerland. This article is an open access article distributed under the terms and conditions of the Creative Commons Attribution (CC BY) license (https://creativecommons.org/licenses/by/4.0/).
Share and Cite
Fekkak, B.; Merzouk, M.; Kouzou, A.; Kennel, R.; Abdelrahem, M.; Zakane, A.; Mohamed-Seghir, M. Comparative Study of Experimentally Measured and Calculated Solar Radiations for Two Sites in Algeria. Energies 2021, 14, 7441. https://doi.org/10.3390/en14217441
Fekkak B, Merzouk M, Kouzou A, Kennel R, Abdelrahem M, Zakane A, Mohamed-Seghir M. Comparative Study of Experimentally Measured and Calculated Solar Radiations for Two Sites in Algeria. Energies. 2021; 14(21):7441. https://doi.org/10.3390/en14217441
Chicago/Turabian StyleFekkak, Bouazza, Mustapha Merzouk, Abdallah Kouzou, Ralph Kennel, Mohamed Abdelrahem, Ahmed Zakane, and Mostefa Mohamed-Seghir. 2021. "Comparative Study of Experimentally Measured and Calculated Solar Radiations for Two Sites in Algeria" Energies 14, no. 21: 7441. https://doi.org/10.3390/en14217441