Article

Feasibility of Low Carbon Renewable Energy City Integrated with Hybrid Renewable Energy Systems

Renewable Heat Integration Research Lab, Korea Institute of Energy Research, Daejeon 34129, Korea
*
Author to whom correspondence should be addressed.
Energies 2021, 14(21), 7342; https://doi.org/10.3390/en14217342
Submission received: 16 October 2021 / Revised: 2 November 2021 / Accepted: 3 November 2021 / Published: 4 November 2021

Abstract

:
This study evaluated the energy saving potential of renewable energy generation systems based on integrated solar energy in an urban environment. The solar city concept was implemented using photovoltaic (PV) and solar thermal systems. As a case study, the Sejong national pilot smart city in South Korea was selected to evaluate the renewable energy penetration rate. For evaluating the proposed renewable energy systems, the electrical and thermal loads of the smart city were estimated using field measurement data. Then, the renewable energy penetration rate of the city was evaluated. The HomerPro software was used to analyze the PV generation and operating energy consumption of the natural gas (NG) generator with a district heating network. The thermal load-supporting potential of the solar thermal system was estimated using the TRNSYS software. The results showed that the proposed urban integrated renewable energy system could meet over 30% of the renewable energy penetration rate and the levelized cost of energy and total net present cost was 7% lower than the base case system (i.e., NG generator). The proposed system also exhibited 38% less CO2 emissions than the base case system.

1. Introduction

In recent years, extensive efforts have been made to increase the applicability of various renewable energy systems to cities to respond to climate crisis beyond climate change. As part of such efforts, various studies have been conducted on the establishment of “solar cities” based on renewable energy using photovoltaic (PV) systems on roofs in cities [1,2,3].
To increase the renewable energy penetration rate in cities based on renewable energy systems, the area for installing PV systems needs to be secured on roofs and adequate solar radiation is required [3]. The problem of energy shortages in cities can be addressed through the installation of renewable energy systems, and an increase in the renewable energy penetration rate of a city improves the energy efficiency of passive and active systems in buildings. Various studies related to the possibility of increasing building efficiency in cities have also been conducted, and an energy saving of approximately 20–40% has been predicted [4,5,6]. Taminiau et al. [2] presented the concepts of a “savings city” in terms of energy efficiency and a “solar city” based on the installation of PV systems in the city of Daejeon, and analyzed the possibility of a sustainable city. They found that a renewable energy penetration rate of 56% per year could be achieved if PV systems were installed on the roofs of all buildings in Daejeon and building efficiency was improved.
Studies have also been conducted on measures to apply various hybrid renewable energy systems (HRESs) to cities [7]. In particular, because grid parity can be reached when self-sufficiency exceeds 40% due to the installation of PV systems, increasing the energy supply from renewable energy sources through the application of various energy storage and conversion systems is required [8]. In addition, power storage methods such as batteries, as well as the application of renewable energy for heat, are required. District heating has long been applied in various ways to utilize the urban heat island problem and has the benefits of increased heat supply efficiency and reduction of particulate matter [9]. Recently, various efforts have been made to increase the renewable energy share of thermal energy in addition to electricity. In particular, interest in the application of renewable energy to fourth generation district heating has been increasing [10,11]. Methods of utilizing electricity, as well as renewable thermal energy and various waste heat sources based on the district heating network, are also important technologies to reduce national carbon emissions by implementing a low carbon emission city. In Europe, district heating is expected to play an important role in reducing carbon emissions in cities in a cost-effective manner [12,13].
Studies have also been conducted on grid-isolated HRES that combine various renewable energy sources [14]. Most such studies have been focused on the design of systems optimized for power supply in middle-income countries or in the residential sector [15]. In addition, various studies have been conducted on the energy saving effect in buildings or communities when PV, solar thermal (ST), or photovoltaic-thermal (PVT) systems are used [16,17,18]. The effect of using PV, ST, and PVT systems in the same area has also been analyzed [19,20]. The Homer software is most commonly used in studies related to energy optimization in cities [15,21]. It calculates energy consumption in buildings, communities, and industrial sectors; the energy generation of various systems such as PV, wind power, combined heat and power (CHP), and diesel or gas engines; and energy balance through energy storage devices such as batteries; and analyzes the operating cost to derive optimized results. It can also calculate a part of the thermal load, such as the waste heat recovery from CHP and electricity generation. Various studies related to the design, optimization, and operation of urban energy systems have been conducted using the Homer software. Lozano et al. [22] proposed a diesel–solar hybrid system as the most cost-efficient system in various islands in the Philippines and analyzed its economic efficiency. Lim et al. [23] proposed and analyzed a system for hydrogen, ammonia, and urea generation as a combined HRES and biogas wastewater treatment plant. Zubair et al. [24] analyzed the applicability of PV and wind power generation systems for realizing a net-zero energy building. Nyoni et al. [25] analyzed the applicability of floating photovoltaic and on-shore wind turbines to the Zambian region. Shah et al. [26] researched a combination of PV, batteries, and CHP as a U.S. hybrid distributed energy system. Luerssen et al. [27] compared battery and thermal energy storage with diesel-powered engines using TRNSYS software. Medved et al. [28] investigated zero energy buildings with PV integrated with heat and cold storage and batteries. It was found that optimized storages increase the matching fraction of power and load. Morvaj et al. [29] studied integrated district heating and PV systems for reducing urban carbon emissions. Guen et al. [30] investigated improving energy sustainability using renewable energy systems and building renovations in Swiss villages. So far, urban energy simulations have rarely been conducted with the integration of HomerPro and TRNSYS software. This research investigated the design of the urban renewable energy systems for enhancing the renewable energy penetration rates and reducing carbon emission by using HomerPro and TRNSYS to analyze electricity and thermal district heating networks.
Research related to the combination of PV and ST systems with low temperature district heating networks at 60 °C, which use waste heat from power plants, has not been conducted for cities. In particular, renewable thermal energy systems, such as ST systems, have not been analyzed. However, to make a comprehensive judgment, it is necessary to consider both electricity and thermal energy for implementing a low carbon emission city.
In this study, the possibility of implementing a low carbon emission city for electricity and heat by minimizing carbon emissions from a new city was examined through simulation. The Sejong national pilot smart city in South Korea was analyzed as a case study. A natural gas generator was selected as the source system for electricity and heat in the new city in the base case. In Case 1, PV systems and batteries were installed on roofs and in empty spaces. In Case 2, PV systems were installed on roofs and ST systems in empty spaces. In addition, batteries and thermal energy storage (TES) were applied. Regarding the analysis of urban energy, HomerPro software was used for electricity and TRNSYS for the thermal energy systems based on the load data of previous studies. The optimization of operating cost and carbon emissions was then analyzed using HomerPro.

2. Methodology

2.1. Model Development

The simulation process is illustrated in Figure 1. In this study, nonresidential buildings were analyzed based on the measurement data of the Jincheon ecofriendly energy town [31], and residential buildings were analyzed using simulation data derived from the measurement data [32] to calculate the power consumption data, heating load data, and hot water supply load data of the buildings. Meteorological data were analyzed using the Meteonorm software. The capacity of a small cogeneration plant required for a new city was calculated through the Homer software, and the installation capacity of the energy storage system (ESS) to minimize burden on the PV power generation and grid was derived through the HomerPro software. In this instance, the empty areas planned in the Sejong smart city and the roof areas of buildings were utilized in the simulation to analyze the renewable energy penetration rate of the city and the carbon emission reduction effect, according to the installation areas of PV and ST systems. The area available for the installation of PV and ST systems was assumed to be 60% of the roof area of the buildings. The capacities of the ST systems and TES to store the heat generated from the systems were analyzed through the TRNSYS software. The capacity of the cogeneration plant was calculated under the assumption that insufficient heating and hot water supply loads from the thermal energy obtained through the ST systems were supplemented by the plant.

2.1.1. Thermal and Electric Loads

In this study, the buildings were divided into residential and nonresidential buildings, and the nonresidential buildings were classified according to their use, such as commercial and educational facilities and public buildings. To calculate the energy consumption and requirements for each type of building based on its use, the previously analyzed data were applied to the residential and nonresidential buildings. Nonresidential buildings were matched to buildings with different uses in the Jincheon ecofriendly energy town and the load was derived by calculating the ratios of the total floor areas of the buildings. The load for residential buildings was derived from the loads in previous studies on residential buildings based on the ratios of the total floor areas.
The Jincheon ecofriendly energy town, which was used for calculating the load of nonresidential buildings, consists of seven buildings, a high school, youth center, public health center, library, childcare center, daycare center, and management center. The high school was used for the buildings related to the school, the public health center was matched with the hospital, and buildings related to health care, childcare and daycare centers were matched with the childcare and daycare buildings. The library was matched with commercial buildings and the management center was matched with public buildings. The main heat source system for these buildings is an ST system composed of a 1600 m3 solar collector and 4000 m3 seasonal thermal ESS. The thermal energy produced in the management center was intended for consumption within the premises and distribution to the remaining six buildings (or five buildings excepting the high school) through a pipe network. The details of each building can be found in previous studies [31]. Through previous studies [31], data on the electricity, cooling, heating, and hot water supply loads, including the plug load used in each public building, were acquired through the measurement equipment. During a demonstration operation performed for two years from June 2017 to May 2019, the ecofriendly energy town achieved thermal energy self-sufficiency; on average, 605 MWh per year of thermal energy and 141 MWh per year of cold energy were supplied to the town. The average annual power generation from the PV systems in the town was 1059.6 MWh, which was 139% higher than the annual electricity consumption of 764.4 MWh. Thus, the electrical energy generation also created an energy surplus beyond the town scale net-zero.
The measurement data of the daycare center, childcare center, and high school were used for the educational facilities among the buildings planned in the Sejong national pilot smart city, and the measurement data of the library were used for the commercial facilities. The data of the library and youth center were used for the public facilities. The total floor areas of each building in the Sejong national pilot smart city were considered in the analysis.
The load data of residential buildings in a previous study were used to analyze the load of the residential buildings in this study [32]. The measurement data were analyzed to calculate the electricity consumption data of residential buildings, including the plug load. Cooling, heating, and hot water supply loads were analyzed using the TRNSYS simulation software. Based on the data used for the analysis, the annual energy consumptions for electricity and heating/hot water supply were found to be 0.9 and 1.1 kWh/m2.

2.1.2. Photovoltaic System and Power Converter

To predict the performance of the PV panel, the incident radiation of the PV panel was analyzed using the HDKR model (Hay, Davies, Kluster, Reindl) proposed by Duffie and Beckman [33]. Based on this model, the power generated by the PV panel was calculated using Equation (1) [34].
P P V = Y P V f P V G ¯ T G ¯ T , S T C 1 + α P T c T c , S T C
where P P V is the power supplied by the photovoltaic panels (kW), Y P V is the rated capacity or power output of the PV array under the standard test condition (kW), f P V is the PV derating factor, G ¯ T and G ¯ T , S T C are the solar radiation incident on the PV array in the current time step (kW/m2) and under the standard test conditions ( G ¯ T , S T C = 1 kW/m2), respectively, α P is the temperature coefficient (%/°C), and T c and T c , S T C are the module temperature in the current time step and under the standard test conditions ( T c , S T C = 25 °C). In this study, f P V was assumed to be 80%, considering the decrease in efficiency due to scaling caused by dust after the installation of the PV panel [7].
For the analysis of economic efficiency, the capital cost of the PV panel was estimated to be 2710 $/kW for the distributed residential PV and 1762 $/kW for the commercial PV. The replacement cost was set to 80% of each capital cost. The annual operation and maintenance (O&M) cost was estimated to be 27 $/kW-year for residential PV and 19 $/kW-year for commercial PV, and the lifetime was assumed to be 25 years [35].

2.1.3. Battery

PV systems, which are most significantly affected by solar radiation, exhibit intermittent and fluctuating power generation depending on the climate and solar radiation. For the stabilization of the power grid, it is necessary to store surplus electricity produced from renewable energy by installing batteries, and to supply electricity from the batteries to reduce the peak load of electricity. In this study, a generic 1 kWh lead acid battery was used in the simulation. Lead acid batteries have a low price and are good for configuring the module Energy Storage System. This battery was assumed to have a nominal voltage of 12 V, capacity ratio of 0.43, rate constant of 0.827/h, roundtrip efficiency of 80%, and maximum charge rate of 1 A/Ah. The capacity of the battery was analyzed using HOMER Optimizer.
In the analysis of economic efficiency, it was assumed that the capital cost was 1500 $/kWh, replacement cost was 1200 $/kWh, and O&M cost was 40 $/kWh-year. The lifetime was assumed to be 10 years and the minimum state of charge to be 40%.

2.1.4. Power Converter

A power converter is an important device that can convert the DC power produced by the PV panels and stored in batteries to the AC power used in buildings in cities. In this study, the capacity of the converter was calculated according to the PV and battery capacity by using HOMER Optimizer, and it was found that the capital cost was 300 $/kW with a lifetime of 15 years, an inverter efficiency of 95%, and a rectifier efficiency of 95%.

2.1.5. Natural Gas (NG) Generator

In this study, it was assumed that a natural gas (NG) CHP generator was installed to supply the main electricity and district heating in the city. The NG used in this study was set to have a density of 0.79 kg/m3 and a lower heating value of 45 MJ/kg [7]. The combustion turbine (CT) type, combined cycle (CC) type, and combined cycle with carbon capture sequestration (CC–CCS) type of NG generators are generally analyzed [35]. The CC–CCS type NG generator can be configured without providing thermal energy to increase electrical efficiency [36]. However, since this paper uses a low temperature thermal network (60 °C), we assumed that the thermal energy can be served to the thermal network. The capital costs for each type were 928, 1049, and 2571 $/kW as of 2020. Because each type exhibits CO2 emissions of 0.015, 0.016, and 0.002 kg/kWh, respectively, power generation systems will be constructed based on the CC–CCS type in the future in light of global efforts to reduce carbon emissions, such as through carbon neutrality. Therefore, in this study, the installation of a CC–CCS type NG generator was assumed. The capital cost was assumed to be 2571 $/kW, the replacement cost to be 2056.8 $/kW (80% of the capital cost), the O&M cost to be 65 $/kW-year, and the lifetime to be 15 years [35]. The heat recovery ratio of this generator was set to 40%, the minimum load ratio to 25%, and the minimum run-time to 143 min [37]. In the economic efficiency analysis, the NG cost was assumed to be 0.4 $/m3, which was obtained by converting the annual average gas price for power generation in South Korea in 2020 (447.34 Won/m3) based on the exchange rate of 1114 Won/$ [38].

2.1.6. Solar Thermal System and Thermal Energy Storage

In this study, the solar collector and heat storage system were designed to supply hot water in summer, as well as some heating and hot water supply in winter. This was intended to solve the overheating problem in summer, which is one of the problems with ST systems, and to reduce the operating time of the generator. Flat-plate solar collectors were selected for the ST systems. The performance of the ST systems was analyzed using the solar collector test data provided by the domestic manufacturer, as shown in Equation (2). The total area per collector was 2.0 m2, and the capacity of the TES was selected to solve the overheating problem of ST systems in summer.
The TRNSYS 18 software was used to simulate the ST systems and TES. TYPE 301 was used as the solar collector module. This simulation module was verified through comparison with the experimental data from a previous study, and it was found that the solar collector module and TES module used in this study showed minor errors of 1.7 and 0.7%, respectively [39]. In the economic efficiency analysis, the IRENA report [40] was referred to for the system cost, including the cost of the ST systems and TES. According to the report, the system scale affects the total installed cost of the system, and a tendency to drop below 500 $/kW when the thermal capacity exceeds 10 MW was confirmed. Therefore, in this study, analysis was conducted based on 500 $/kW. Based on the efficiency of the ST systems used in this study, the thermal capacity of the ST systems per area was calculated to be 0.7 kW/m2. The annual O&M cost was assumed to be 1.5% of the total capital cost. In this study, the exchange rate of 1.17 $/EUR was applied.
η S T = 0.7208 4.7999 t m t a G
The heat generated from the power plants is supplied to the city, but there are cases in which 100% of the load is not covered by the power plants. Therefore, a gas-fired boiler was considered in the simulation to respond to the case in which the heating and hot water supply loads cannot be covered by an array of power plants or ST systems. The gas-fired boiler was set to use NG as in the case of the generator, and its efficiency was set to 85%.

2.2. Optimization Framework

In this study, minimizing the total net present cost (NPC) of the system for supplying electricity and heat in the Sejong smart city was set as the objective function for optimizing the combination and capacity of various systems. To this end, the capacity of the NG generator was calculated, and the installation capacities of the PV systems, inverter, and battery were derived through optimization analysis. The optimization tool of the HomerPro software was used to optimize the capacity of the system. In addition, economic efficiency analysis was conducted for the case of installing ST systems and TES when compared with PV systems. Regarding the optimization of the NPC, the NG generator has the benefit of low initial cost, but the shortcoming of high operating cost due to the use of NG, whereas various renewable energy systems have the benefit of low operating cost despite the high initial cost. Thus, long-term life-cycle cost analysis is required. In general, the NPC is calculated using Equation (3).
NPC = T A C 1 + I r N 1 I r 1 + I r N = T C A C R F i , n
where TAC is the total annualized cost ($), N is the project life (years), I r is the real interest rate, CRF is the capital recovery factor based on the interest rate (%), and n is the project lifetime in the current time step. In this study, N was set to 25 years and I r to 2.1%.

3. Simulation

3.1. Case Study Site: Sejong National Pilot Smart City

The Sejong smart city was established to create an ecofriendly city that is self-sufficient in energy through renewable energy optimization [41]. Therefore, it aims at a zero-energy city and a building energy efficiency rating of 1++ (60–90 kWh/m2y for residential buildings and 80–140 kWh/m2y for nonresidential buildings), and attempts to achieve level 5 in zero-energy building certification (renewable energy penetration rate: 20–40%). To achieve these goals, it is necessary to increase the renewable energy penetration rate through the implementation of a solar energy city. In this study, an attempt was made to achieve the above goals by using PV systems as the main energy source in living zone 5–1 in Sejong smart city. For this, the renewable energy penetration rate of the city through PV and ST systems and the penetration limit were analyzed as shown in Figure 2. As it is difficult to secure detailed architectural information on the smart city, the roof area was inferred based on the building area and total floor area in the district unit plan for living zone 5–1 in the city, and the renewable energy generation was analyzed. The latitude of the Sejong smart city is 36.482° and its longitude is 127.287°. Its altitude was set to 16 m. As shown in Figure 3, the data from the NASA surface meteorology and solar energy database provided by the HomerPro software were used for the climate of the Sejong smart city. These outdoor air temperature and global solar horizontal radiation data are monthly averaged values over a 22-year period (July 1983–June 2005).

3.2. Load Profile

As mentioned above, the electricity and thermal energy loads of the residential and nonresidential buildings in the Sejong smart city were derived. The total floor areas of the residential and nonresidential buildings were 884,648 and 1,214,300 m2, respectively, showing that the latter occupied a larger area [42]. As shown in Figure 4, the electricity, hot water supply, and heating loads of the residential and nonresidential buildings were calculated. The daily average electric load and peak electric load of the buildings are shown in Table 1.
It was found that there were significant differences in the electric and thermal load profiles between the residential and nonresidential buildings. In particular, it was confirmed that the electricity consumption of the residential buildings was four times higher than that of the nonresidential buildings in the current urban planning. In the Sejong smart city, the residential buildings occupy approximately half of the total floor area of the nonresidential buildings, but their electricity consumption was found to be higher than that of the nonresidential buildings due to a large number of households. However, in the case of heating and hot water supply loads, the nonresidential buildings exhibited twice the loads of the residential buildings. This appears to be because the thermal energy load based on the total floor area had a larger effect than the energy consumption of each household. In the case of heating and hot water supply loads, the nonresidential buildings showed almost no load in summer, but the residential buildings exhibited relatively similar hot water supply loads throughout the year.

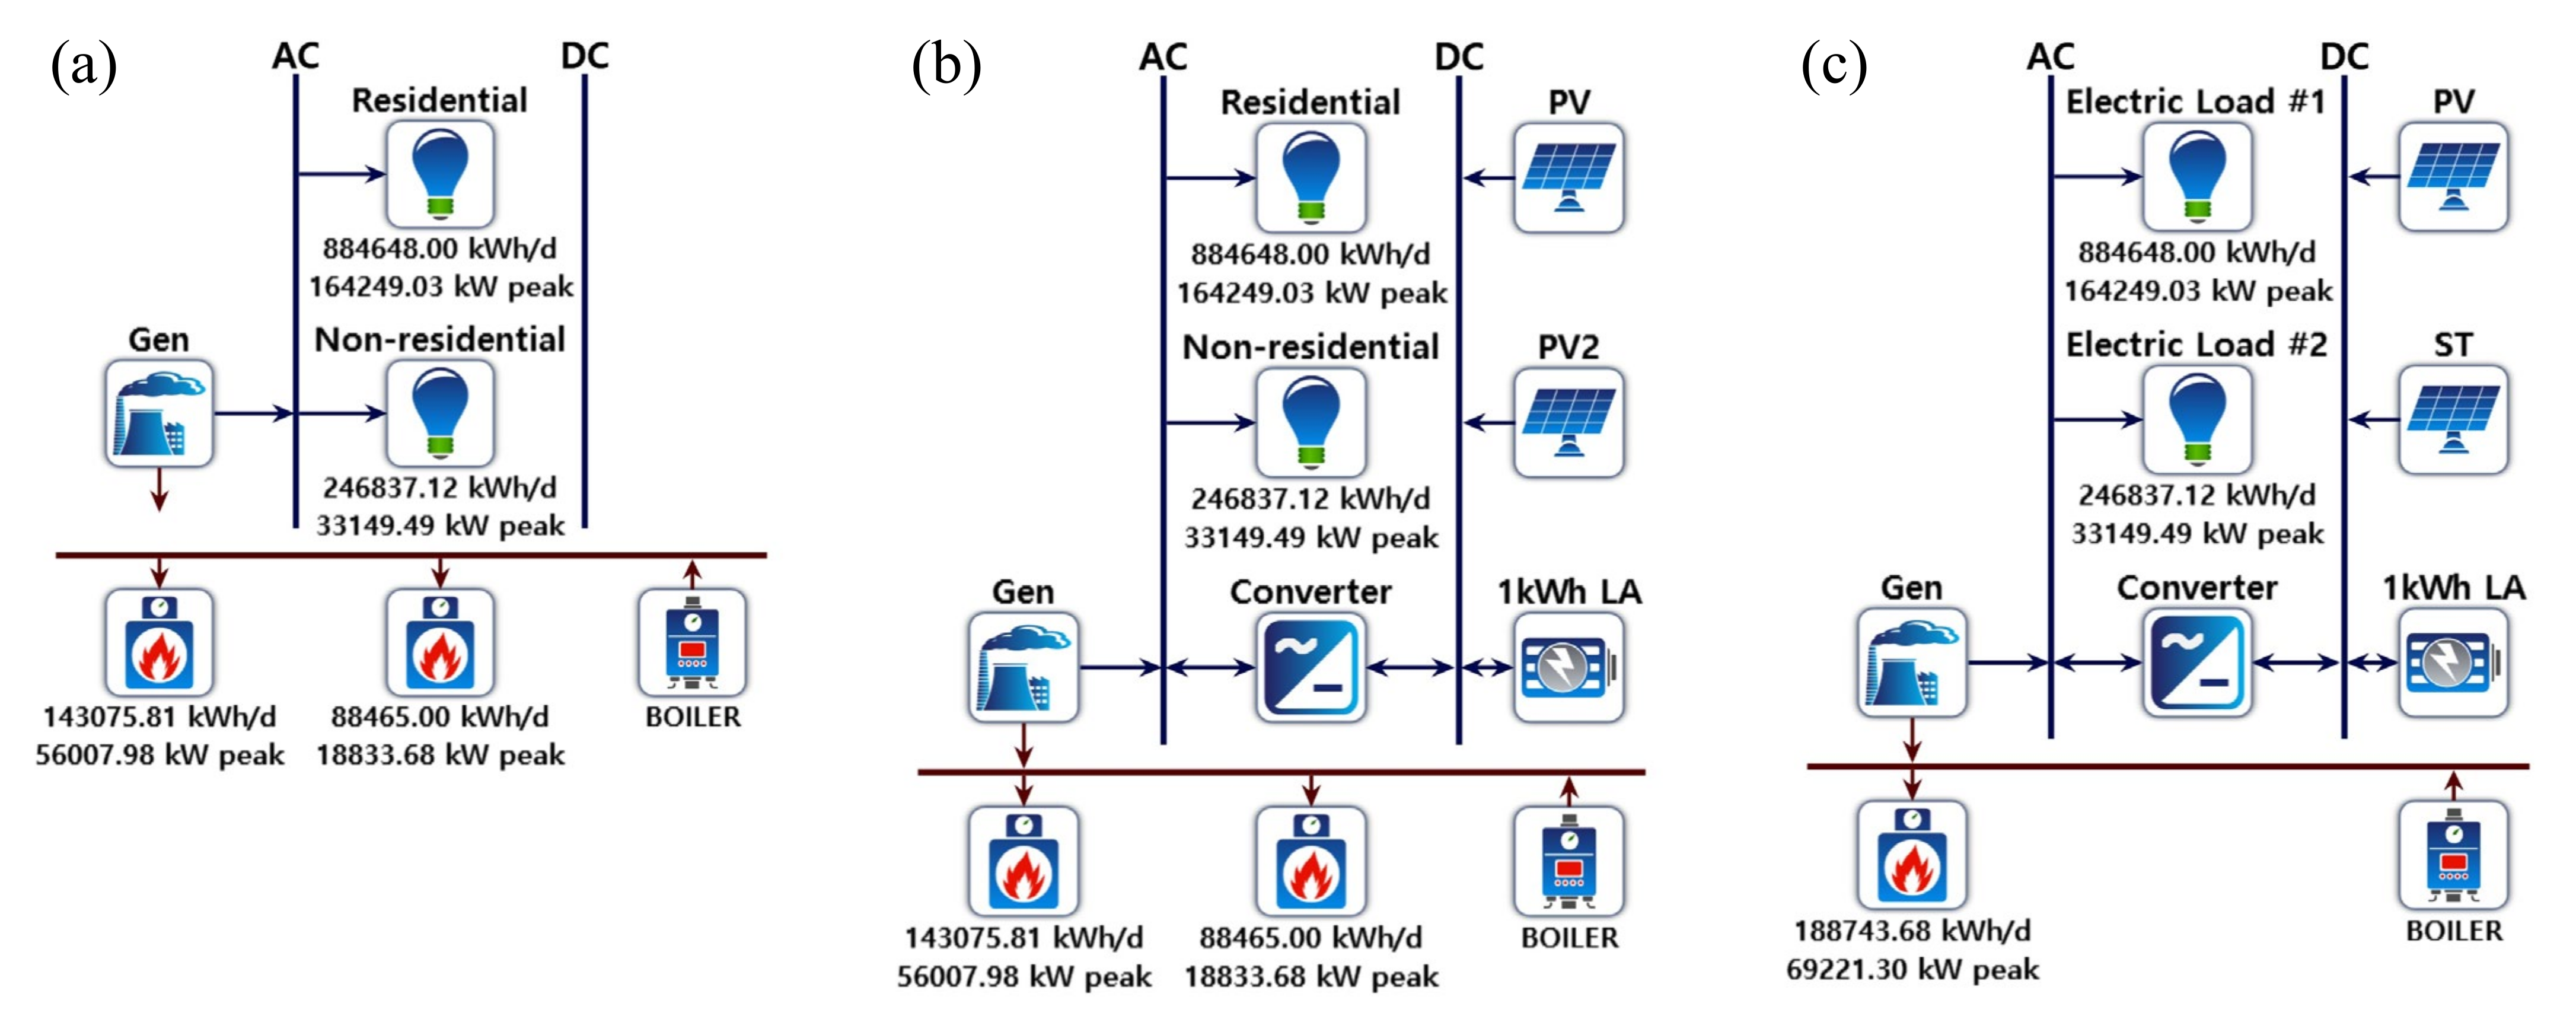
3.3. Simulation Cases

The renewable energy penetration rate and economic efficiency were analyzed based on the installation of renewable energy systems on the roofs of buildings and in empty spaces in the Sejong national pilot smart city. Through the current urban planning, it is possible to calculate the total floor area of a building and its area (i.e., roof area). In a recent study on the evaluation of the PV module layout plan considering shaded conditions, such as the roof structures of apartments and buildings, the shaded conditions created by the stair case, elevator core, and parapets located on the roof floor were analyzed and it was found that the effective roof area that could quantitatively determine the zero-energy rate was approximately 60% of the roof area [43]. Therefore, assuming that PV systems can occupy 60% of the total building area based on the planned building area, an area of 248,097 m2 was estimated, which included residential and nonresidential buildings, and it was expected that PV panels with a capacity of approximately 104,201 kW (420 W/m2) could be installed. In addition, the urban planning of the Sejong national pilot smart city includes 20,000 m2 as empty space for installing PV or ST systems. In this empty space, 3.98 MW of PV systems or 20,000 m2 of ST systems can be installed. Hence, in this study, the amount of renewable energy supply and the economic efficiency were analyzed for the case in which PV or ST systems were installed in the empty space planned in the Sejong national pilot smart city.
To this end, as shown in Figure 5, the method of supplying electricity and heat with an NG generator without renewable sources of energy such as PV systems was selected in the base case. In Case 1, PV systems were installed in the empty spaces. In Case 2, ST systems were installed in the empty spaces.

4. Results and Discussion

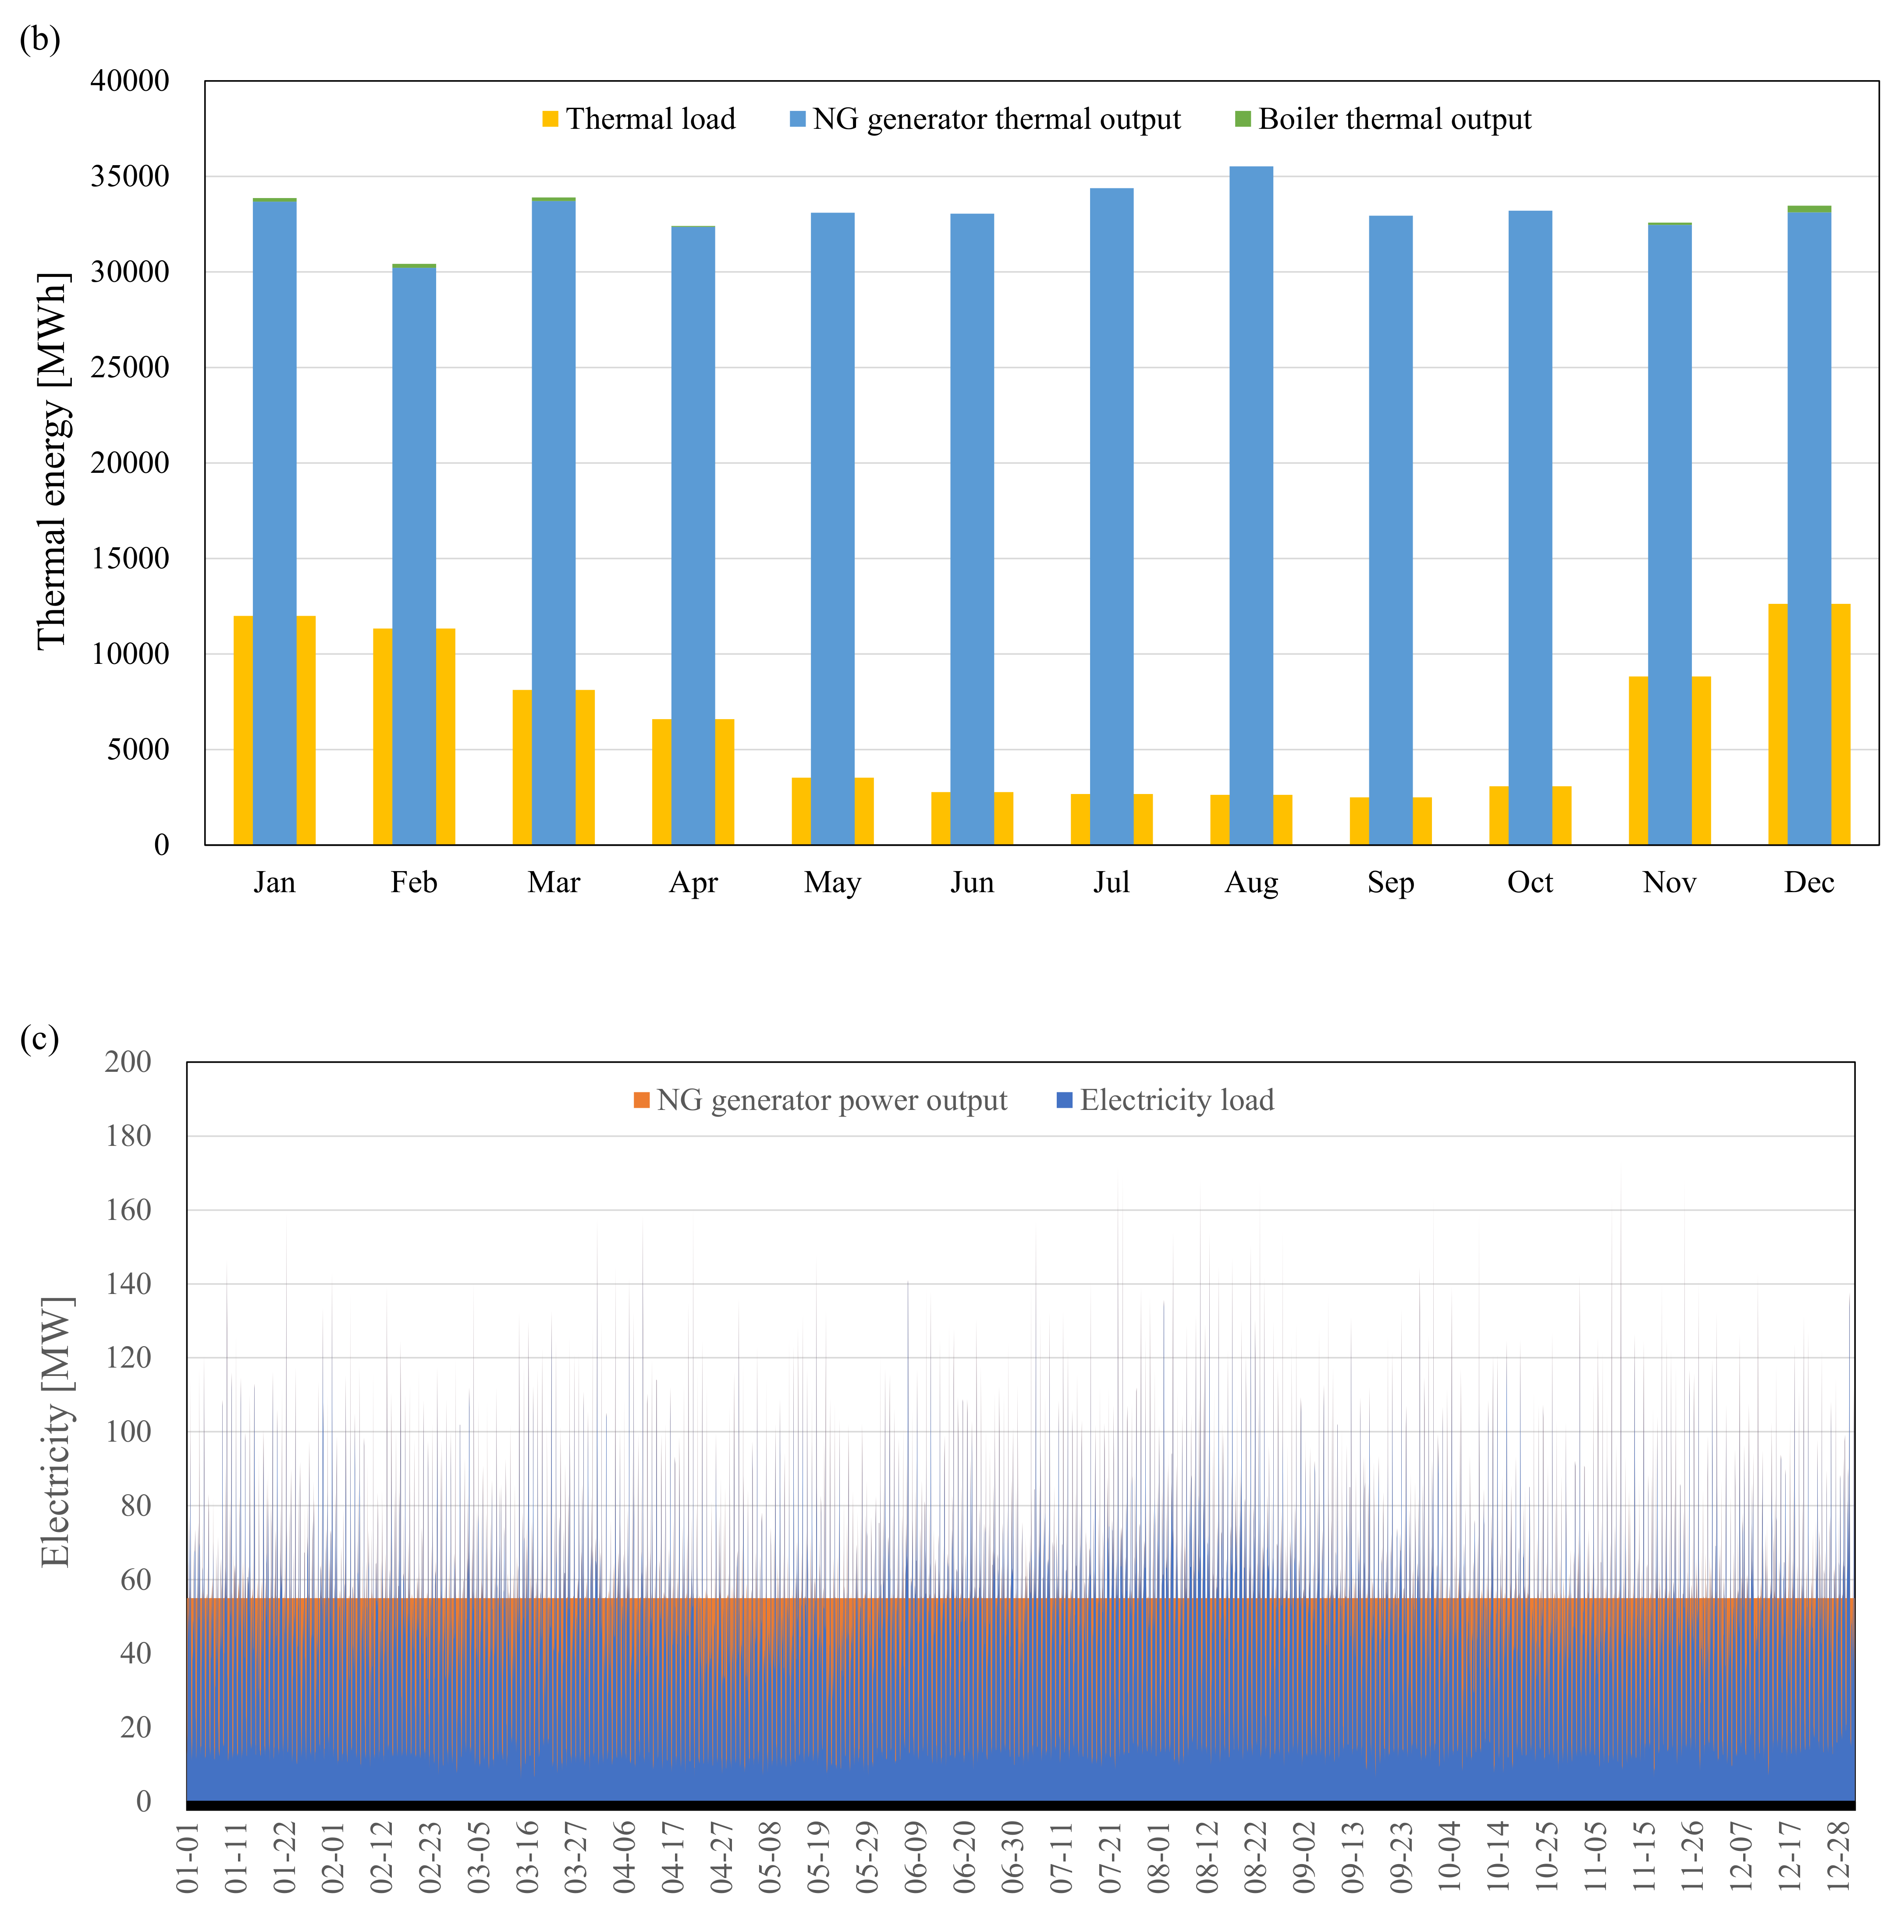
4.1. Base Case: NG Generator

In the base case, an NG generator supplied electricity and thermal energy in the Sejong smart city (Figure 6). The simulation results showed that a capacity of 220 MW was required for NG to supply 100% electricity and heat in the city. In this instance, the NG generator provided 412 GWh, which is the annual electric load of the entire city, and it had to produce 23.3% additional electricity to meet the minimum operation rate of 40%. This required a total electricity production of 539 GWh.
During this electricity generation, thermal energy was also produced, and the total thermal energy produced by the NG generator and boiler was found to be 398 GWh. This corresponded to 517% of 77 GWh, which is the total heating and hot water supply load. However, most of the surplus heat was generated in summer. Despite this heat production, it was found that 1 GWh, which is 0.3% of the total thermal load, must be supplied through the gas boiler due to the imbalance in heat supply in the absence of electricity consumption.

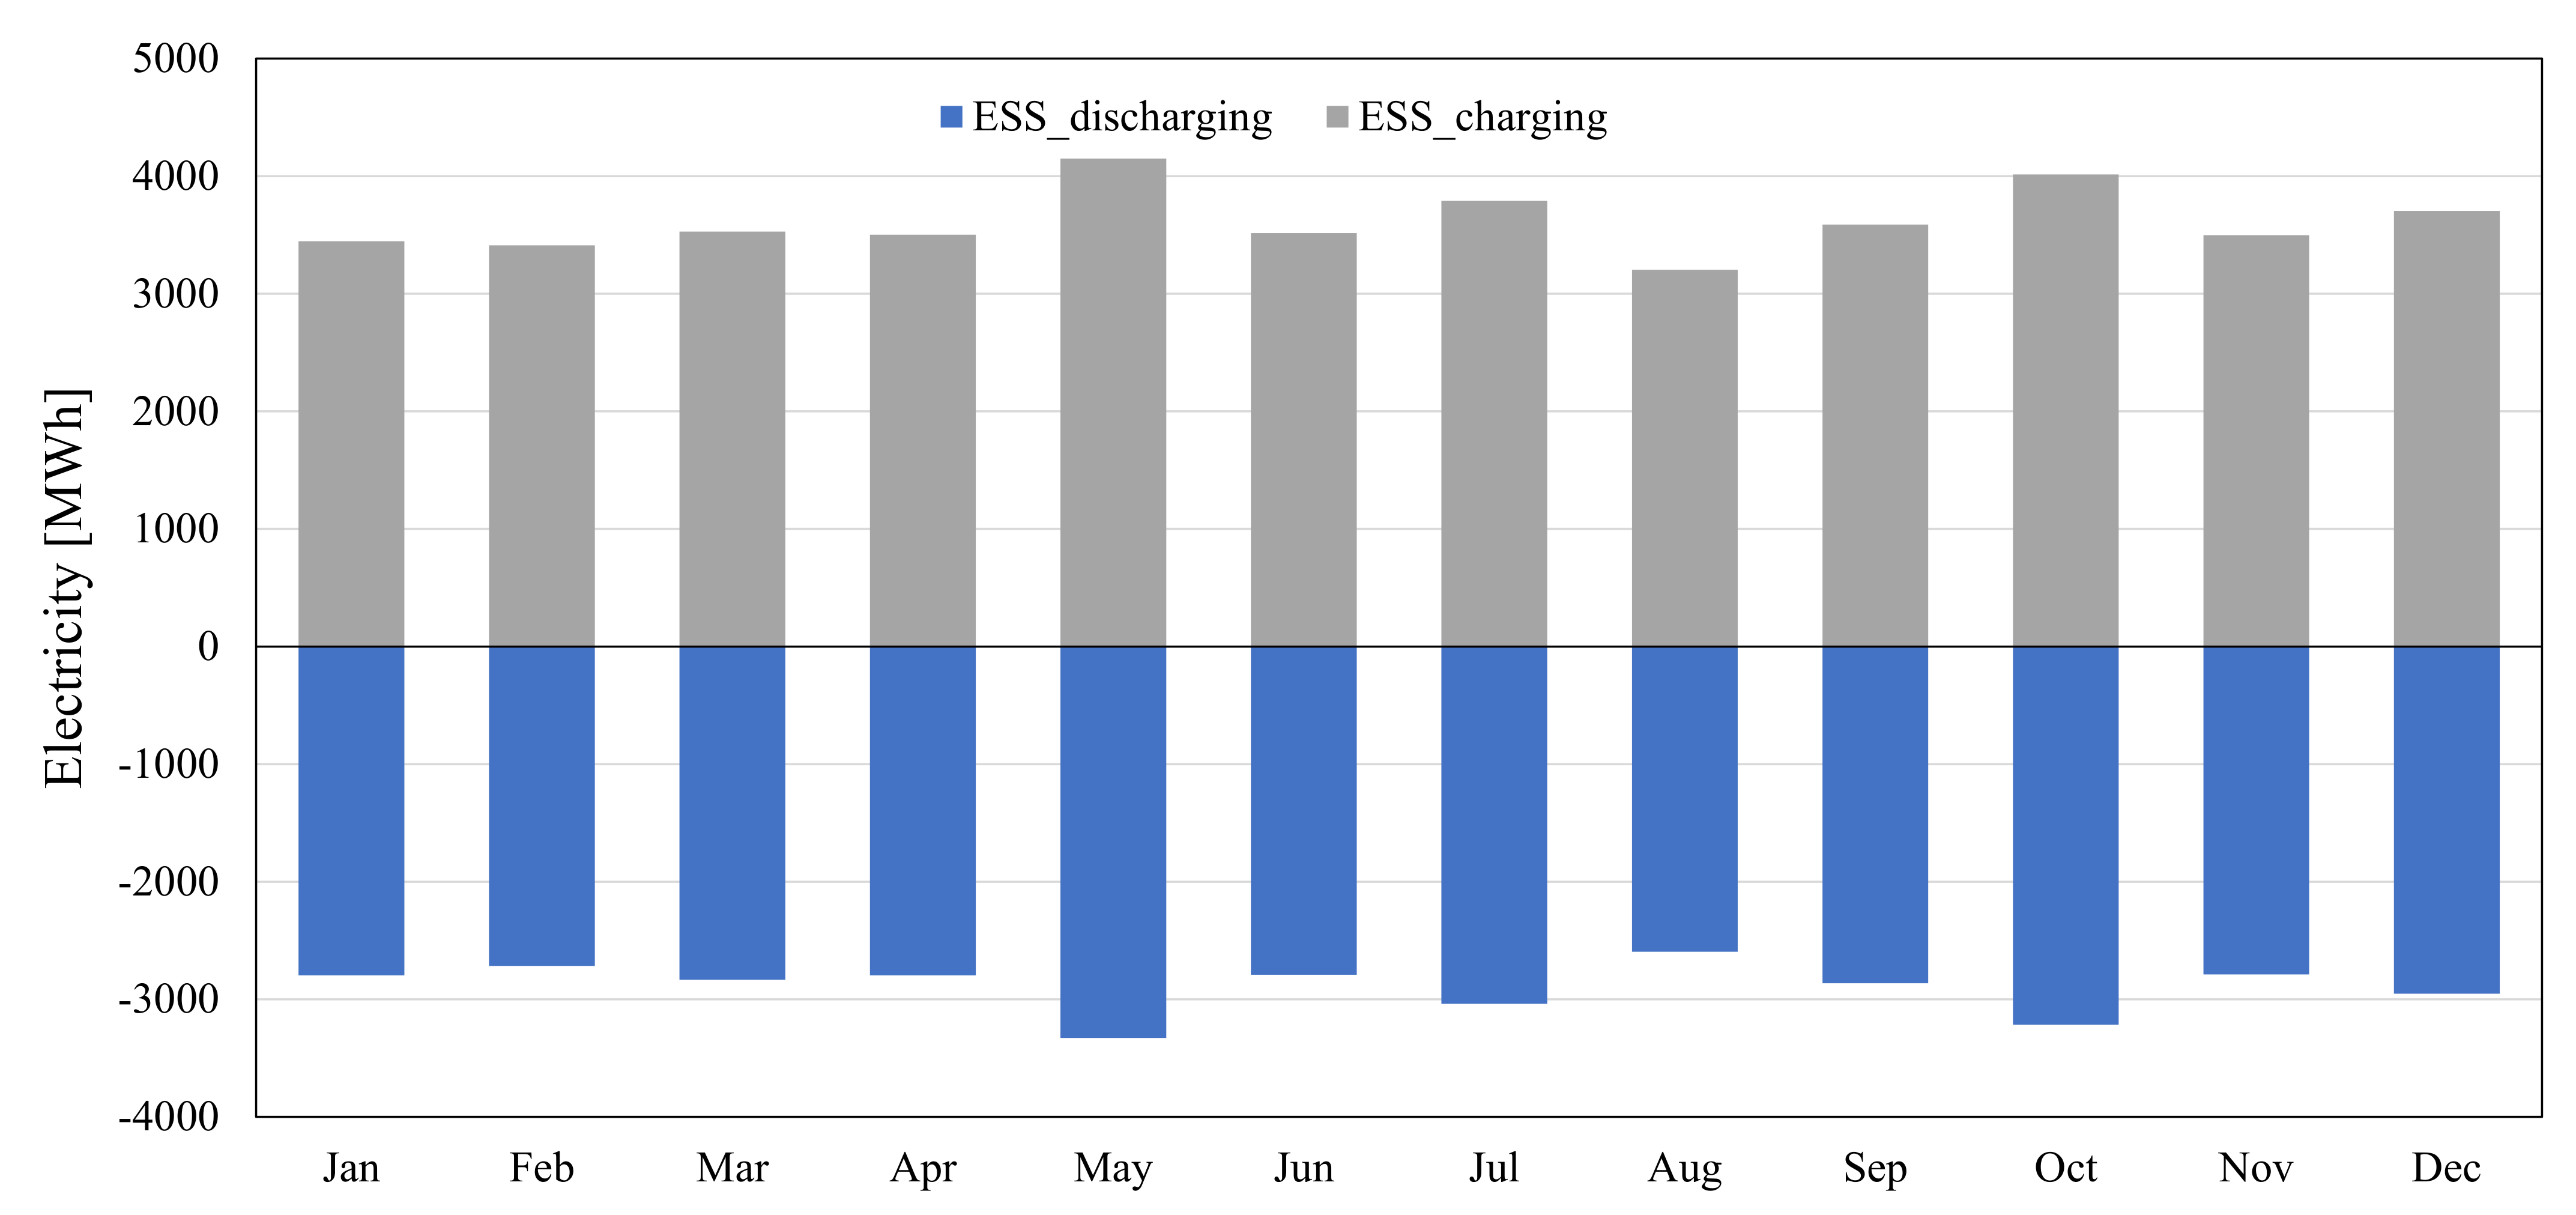
4.2. Case 1: Hybrid NG Generator, PV and ESS System

As shown in Figure 7, in Case 1, analysis was conducted for the case in which an NG generator supplied electricity and thermal energy in the Sejong smart city, and PV and ESS systems were installed on building roofs and in empty spaces. The simulation results showed that the NG generator required a capacity of 220 MW as in the base case. This is because there are many periods in which the PV systems cannot perform power generation under the significant influence of weather, and electricity must be supplied in winter, when solar radiation is low. To meet the electric load of the entire city (i.e., 412 GWh), a total of 481 GWh was produced and a surplus electricity of 69 GWh was generated. Of the total power generation, the NG generator provided 333 GWh (69.1%), the PV systems installed on the building roofs provided 143 GWh (29.7%), and the PV systems installed in the empty spaces provided 6 GWh (1.2%). Of the total surplus electricity of 69 GWh, 17 GWh was stored in the ESS and then used to meet the electric load of the city, and the remaining 52 GWh was retained as surplus electricity. In Case 1, the optimized ESS capacity was calculated to be 239 MWh, and the surplus electricity from the NG generator or PV systems was stored in the ESS and then supplied to the city as shown in Figure 8. The electricity stored per year was 42 GWh and 34 GWh was used. Thus, the loss was calculated to be 8 GWh.
In Case 1, the total thermal energy produced through the NG generator and boiler was found to be 245 GWh, which corresponded to 318% of the thermal load of the entire city (i.e., 77 GWh). It was found that the NG generator supplied 89.4% (i.e., 245 GWh) and the boiler 10.6% (i.e., 29 GWh) of the total thermal load. The NG generator produced 38.5% less heat when compared with the base case, and the surplus heat was 38.8% lower than that of the base case. Owing to PV power generation, the operating time of the NG generator was significantly reduced. This caused an increase in the operating time of the gas boiler to meet the excess thermal load.

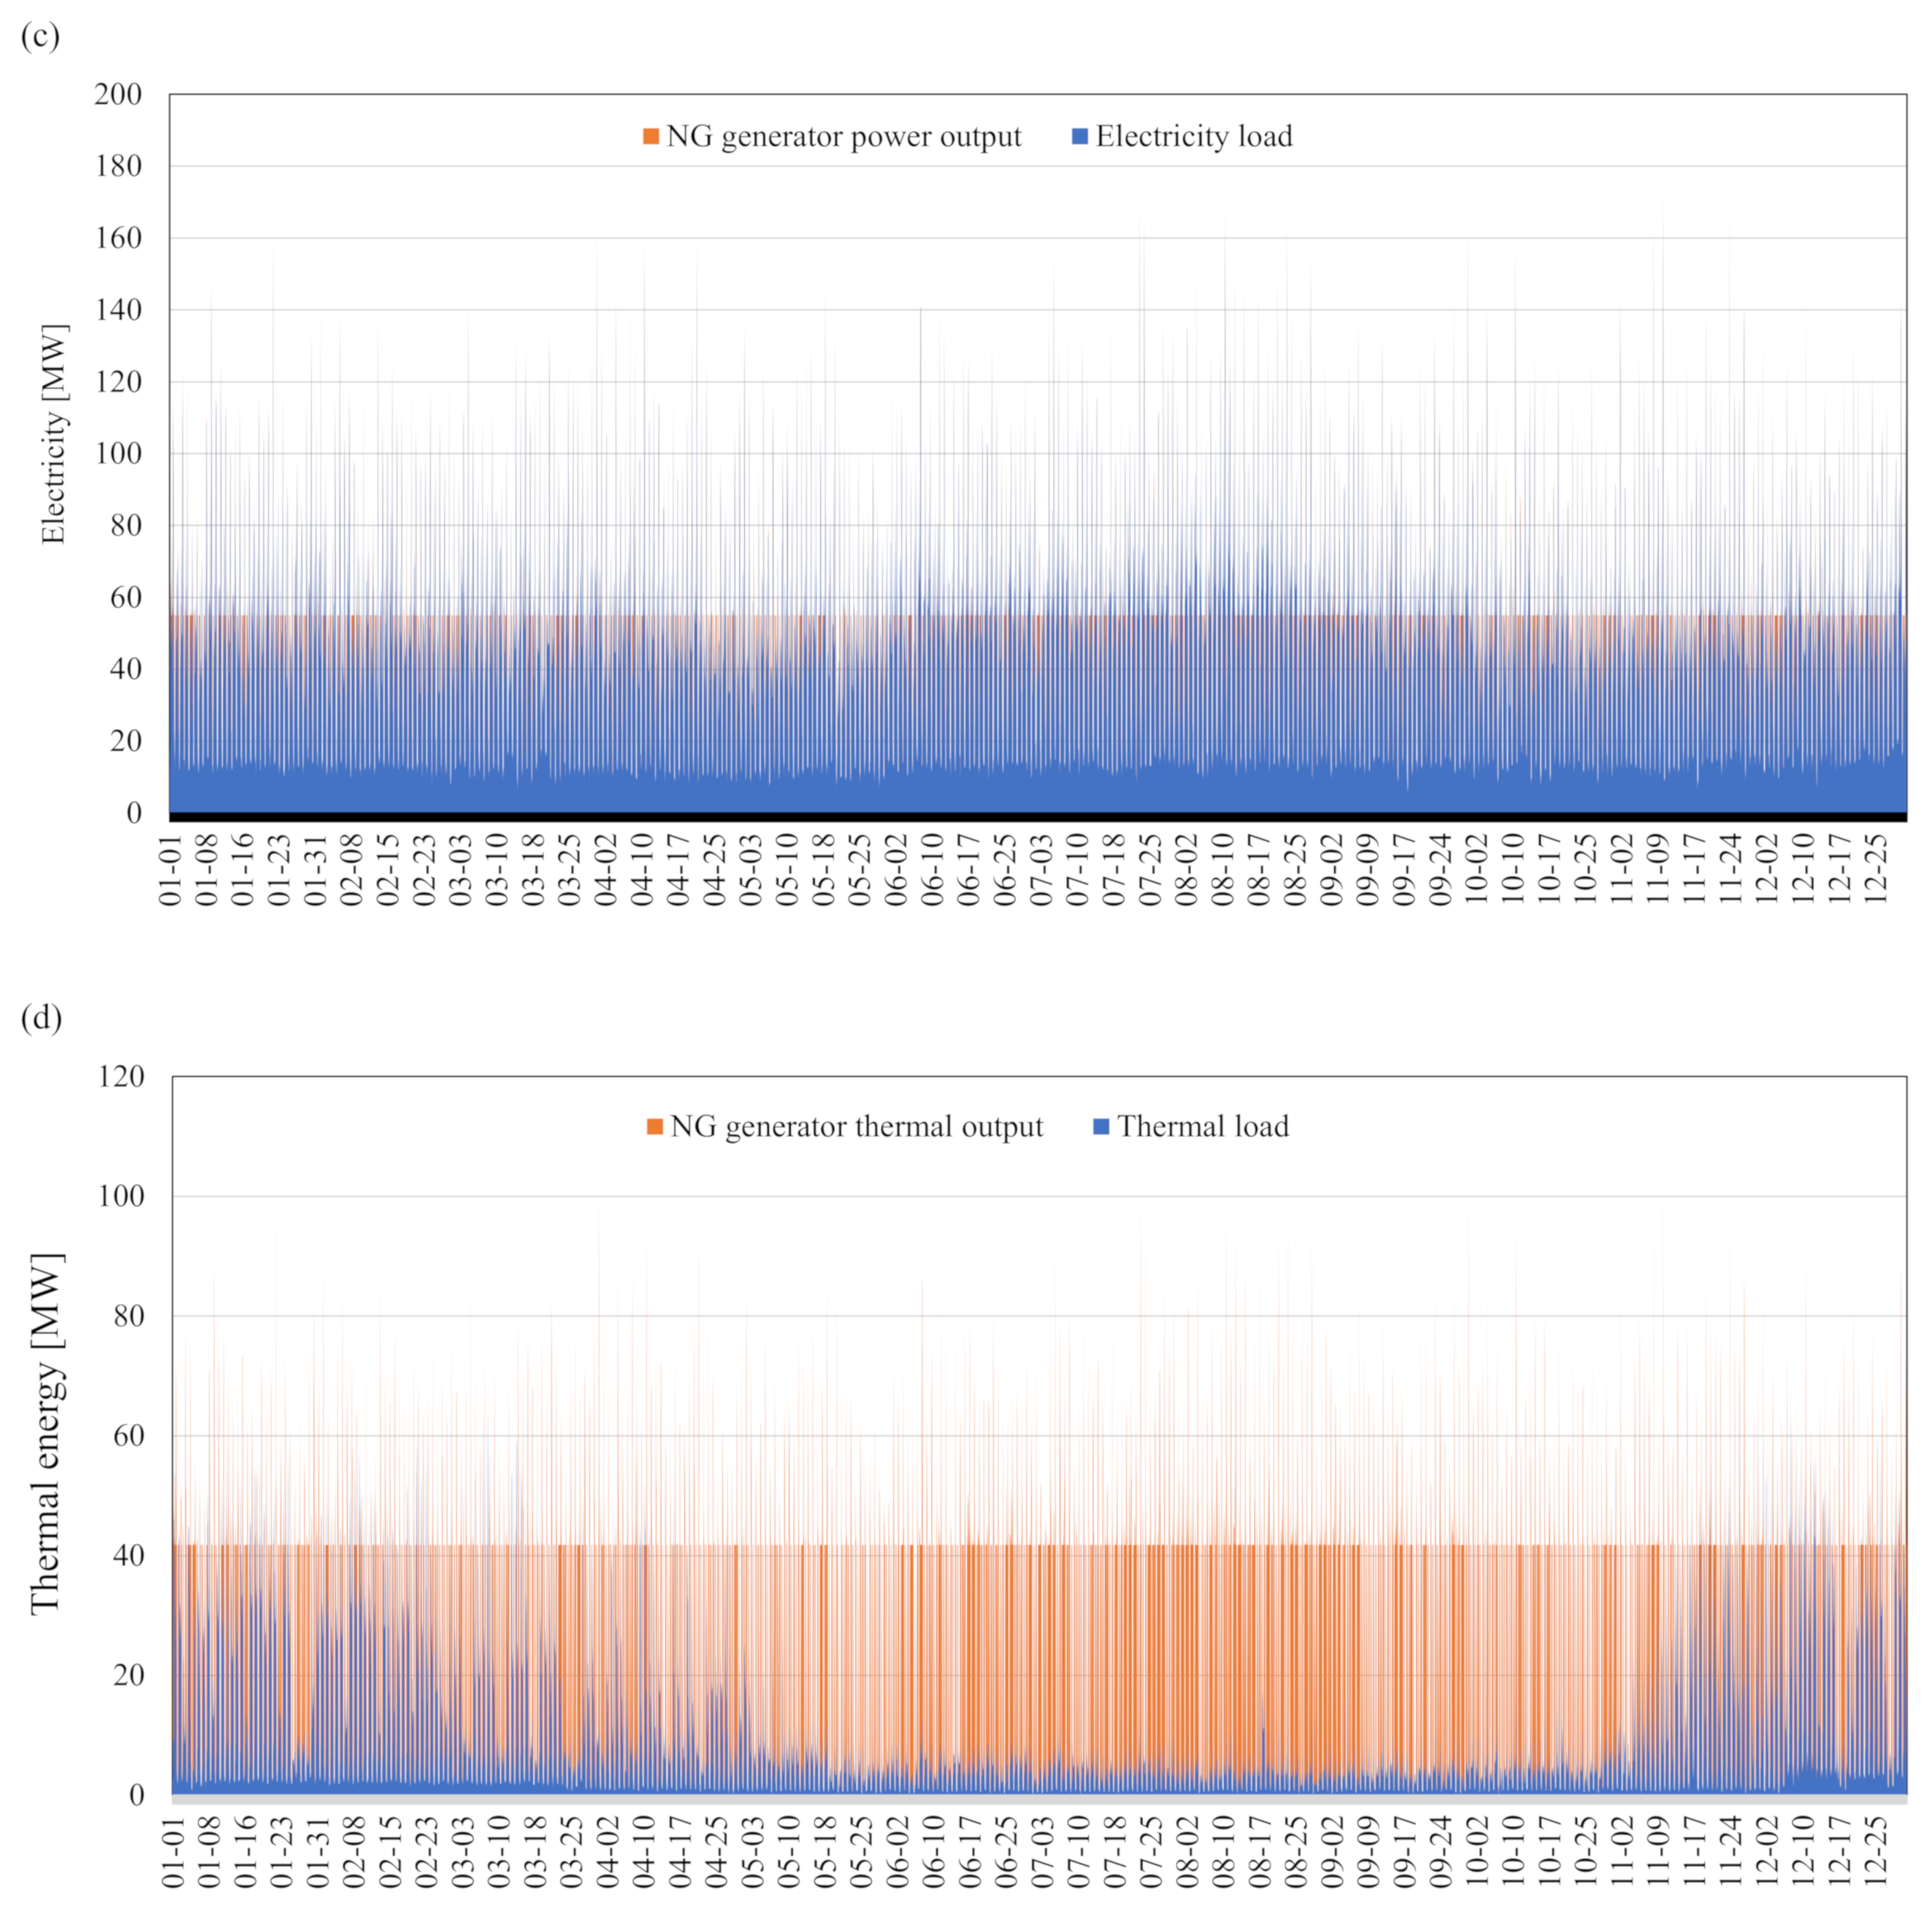
4.3. Case 2: Hybrid NG Generator, PV, ESS, and Solar Thermal System

As shown in Figure 9, in Case 2, the NG generator supplied electricity and thermal energy in the Sejong smart city, and PV and ESS systems were installed on the building roofs, and ST and TES systems in empty spaces. The simulation results showed that the NG generator required a capacity of 220 MW as in the base case and Case 1. In total, 470 GWh was produced to meet the electric load of the entire city (i.e., 412 GWh) and the surplus electricity was 58 GWh. Regarding total power generation, the NG generator provided 327 GWh (69.5%) and the PV systems installed on the building roofs provided 143 GWh (30.5%). From the total surplus electricity of 58 GWh, 18 GWh was stored in the ESS and then used for the electric load of the city, and the remaining 40 GWh was retained as surplus electricity. In Case 2, the optimized ESS capacity was calculated to be 262 MWh, and the surplus electricity from the NG generator or PV systems was stored in the ESS and then supplied to the city as shown in Figure 10. The electricity stored per year was 45 GWh, and 36 GWh was used. The loss was analyzed to be 9 GWh.
In Case 2, ST systems were installed in empty spaces, and the heat produced by the ST systems was stored in the TES and then supplied through the thermal network. As shown in Figure 11, the total thermal energy produced through the ST systems was 15 GWh. The efficiency of the TES was approximately 95%, and the amount of heat released by it was 14 GWh. In Figure 11b, the internal temperature of the TES was divided into 30 nodes from the top (i.e., Node 1) to the bottom (i.e., Node 30). The operation status can be identified through the temperature of each node. When the internal temperature of the TES was increased to 60 °C through solar heat collection, heat was supplied through the thermal network.
Consequently, in Case 2, the total thermal energy produced through the NG generator, boiler, and ST systems was found to be 278 GWh, which corresponded to 361% of the thermal load of the entire city (i.e., 77 GWh). The NG generator supplied 85.9% (i.e., 239 GWh) of the total thermal load, the boiler 9.0% (i.e., 25 GWh), and the ST systems 5.1% (i.e., 14 GWh). The NG generator produced 40.0% less heat when compared with the base case, and the surplus heat was 37.6% lower than that of the base case. Compared with Case 1, the thermal energy produced by the NG generator was 2.4% lower, and the heat produced by the boiler was reduced by 14.3%.

4.4. Comparison of Carbon Emission and Economic Performance

In this study, the capacities in the base case, Case 1, and Case 2 were calculated as shown in Table 2, and the environmental impact and economic efficiency in each case were evaluated as shown in Table 3. In the base case, 155,434,607 m3 of gas was consumed per year due to the operation of the NG generator and gas boiler, and gas consumption of 428,848 m3/day could be observed. In terms of economic efficiency, the required initial cost for construction of the power plant was found to be 565 M$. In addition, the annual operating cost considering the replacement cost was found to be 328 M$, and the gas consumption cost was 62 M$. In Case 1, the annual gas consumption of 99,030,236 m3 and daily average consumption of 271,630 m3 were noted. In terms of cost, the required initial cost for the construction of the power plant, PV systems, and ESS was 1.23 B$. The annual operating cost of the power plant and PV systems was found to be 251 M$, which was 24% lower than that of the base case. This was because the replacement cost was reduced due to the reduction in the operating time of the power plant. The annual gas consumption cost was found to be 40 M$, which was 36% lower than that of the base case. In Case 2, the annual gas consumption of 96,530,684 m3 and daily average consumption of 264,468 m3/day were observed. The required initial cost of construction of the power plant and PV and ST systems was 1.27 B$. The annual operating cost was found to be 249 M$, which was the lowest operating cost. The annual gas consumption cost (39 M$) was also found to be the lowest. This affected CO2 and CO emissions. Cases 1 and 2 exhibited 36% and 38% less CO2 emissions when compared with the base case. Consequently, Case 2 showed the lowest carbon emissions.
As shown in Table 2, the analysis results in terms of economic efficiency revealed that the levelized cost of Energy (LCOE) and NPC were 7% lower in Case 1 and 6% lower in Case 2 when compared with the base case. In this instance, Cases 1 and 2 showed payback periods of 6.87 and 6.99 years, respectively, when compared with the base case, and exhibited internal rates of return (IRR) of 11.1 and 10.4%, respectively, confirming that Case 1 had higher economic efficiency.

4.5. Discussion and Future Works

In order to supply electricity to match the electric load of the city in cases including the base case, it was assumed that oversupply electricity can be supplied to the grid. However, in order to control the national grid frequency, the power plant was disconnected from the national grid and still operated to match the electric load after few hours. A normal NG generator capacity is 100 MW; it can be operated to match the electric load with individual shut down operation. However, in this research, we assumed that the one NG generator with 220 MW capacity was operated to match the electric load.
In this study, economic efficiency was also analyzed according to the presence or absence of ESS. In the absence of ESS, it was found that PV power generation affected the grid, and the optimal PV installation capacity was analyzed to be 543 kW. In this case, the economic efficiency was found to be lower than that in the case where only the NG generator was installed. When 543 kW of PV systems was installed, it was found that the annual NG consumption required for the operation of the NG generator could only be reduced by 0.2%.
In this study, the economic efficiency and carbon emission reduction effect were analyzed based on the installation of various renewable energy sources in comparison with the existing power plants. Consequently, it was found that the carbon emission reduction effect was slightly higher in Case 2, but that Case 1 was superior in terms of economic efficiency.
In terms of the carbon emission reduction effect, the application of the ST systems was helpful in reducing the operating time of the boiler for meeting the thermal load that could not be covered by the NG generator, but could not significantly reduce the operating time of the NG generator. In the future, the electrification of buildings will intensify and the electrical load will continue to increase. However, the heating load is expected to decrease in new cities, as passive elements in buildings are gradually reinforced. In addition, energy consumption will be reduced through building remodeling for carbon neutrality and for passive elements to satisfy the current U-value. Therefore, it is expected that a large amount of surplus heat will remain in power plants due to the reduction in the heating load and the imbalance between the supply and demand of electrical and thermal loads in cities. Hence, it is necessary to investigate methods to use the heat produced by the NG generators for cooling in summer through absorption chillers or to store the surplus heat in seasonal thermal energy storage.
In terms of economic efficiency, the method of using PV systems is expected to be widely adopted in the future due to the decrease in the price of PV panels. However, it is necessary to secure the economic efficiency of measures to solve the instability of PV power generation, such as ESS. Fuel cells, which are renewable energy systems, have attracted attention for use in power plants to be constructed in new cities. These also need to be considered in the future.

5. Conclusions

This study aimed to increase the renewable energy penetration based on solar energy in the Sejong smart city, South Korea. To this end, combinations of photovoltaic (PV) and solar thermal (ST) systems, an energy storage system (ESS), thermal energy storage (TES), and a natural gas (NG) generator were considered, and the size of each system was derived through optimization design. The annual operating characteristics of each system were then identified, and carbon emissions as well as economic efficiency were analyzed. It was found that both Cases 1 and 2 showed a 30% higher renewable energy penetration rate when compared with the base case. In terms of carbon emissions, Cases 1 and 2 exhibited 36% and 38% less CO2 emissions when compared with the base case, confirming that Case 2 had the lowest carbon emissions. The analysis results in terms of economic efficiency revealed that the levelized cost of energy (LCOE) and total net present cost (NPC) were 7% lower in Case 1 and 6% lower in Case 2 when compared with the base case. In this instance, Cases 1 and 2 showed payback periods of 6.87 and 6.99 years, respectively, when compared with the base case and exhibited IRR values of 11.1 and 10.4%, respectively, confirming that Case 1 had higher economic efficiency.

Author Contributions

Writing—original draft preparation, M.-H.K.; methodology and software, D.-W.K.; Supervision, D.-W.L. All authors have read and agreed to the published version of the manuscript.

Funding

This research was funded by the Energy Technology Development Program of the Korea Institute of Energy Technology Evaluation and Planning grant number [2019271010015B].

Institutional Review Board Statement

Not applicable.

Informed Consent Statement

Not applicable.

Conflicts of Interest

The authors declare no conflict of interest.

References

  1. Byrne, J.; Taminiau, J.; Kurdgelashvili, L.; Kim, K.N. A Review of the Solar City Concept and Methods to Assess Rooftop Solar Electric Potential, with an Illustrative Application to the City of Seoul. Renew. Sustain. Energy Rev. 2015, 41, 830–844. [Google Scholar] [CrossRef]
  2. Taminiau, J.; Byrne, J.; Kim, J.; Kim, M.; Seo, J.; Korea, S. Infrastructure-Scale Sustainable Energy Planning in the Cityscape: Transforming Urban Energy Metabolism in East Asia. Wiley Interdiscip. Rev. Energy Environ. 2021, 10, e397. [Google Scholar] [CrossRef]
  3. Capellán-Pérez, I.; de Castro, C.; Arto, I. Assessing Vulnerabilities and Limits in the Transition to Renewable Energies: Land Requirements under 100% Solar Energy Scenarios. Renew. Sustain. Energy Rev. 2017, 77, 760–782. [Google Scholar] [CrossRef] [Green Version]
  4. Chen, Y.; Hong, T.; Piette, M.A. Automatic generation and simulation of urban building energy models based on city datasets for city-scale building retrofit analysis. Appl. Energy 2017, 205, 323–335. [Google Scholar] [CrossRef] [Green Version]
  5. Mastrucci, A.; Baume, O.; Stazi, F.; Leopold, U. Estimating energy savings for the residential building stock of an entire city: A GIS-based statistical downscaling approach applied to Rotterdam. Energy Build. 2014, 75, 358–367. [Google Scholar] [CrossRef]
  6. Shahrokni, H.; Levihn, F.; Brandt, N. Big meter data analysis of the energy efficiency potential in Stockholm’s building stock. Energy Build. 2014, 78, 153–164. [Google Scholar] [CrossRef]
  7. Bagheri, M.; Delbari, S.H.; Pakzadmanesh, M.; Kennedy, C.A. City-Integrated Renewable Energy Design for Low-Carbon and Climate-Resilient Communities. Appl. Energy 2019, 239, 1212–1225. [Google Scholar] [CrossRef]
  8. De Oliveira e Silva, G.; Hendrick, P. Lead–Acid Batteries Coupled with Photovoltaics for Increased Electricity Self-Sufficiency in Households. Appl. Energy 2016, 178, 856–867. [Google Scholar] [CrossRef]
  9. Lund, H.; Werner, S.; Wiltshire, R.; Svendsen, S.; Thorsen, J.E.; Hvelplund, F.; Mathiesen, B.V. 4th Generation District Heating (4GDH). Integrating Smart Thermal Grids into Future Sustainable Energy Systems. Energy 2014, 68, 1–11. [Google Scholar] [CrossRef]
  10. Sommer, T.; Sulzer, M.; Wetter, M.; Sotnikov, A.; Mennel, S.; Stettler, C. The Reservoir Network: A New Network Topology for District Heating and Cooling. Energy 2020, 199, 117418. [Google Scholar] [CrossRef]
  11. Schmidt, T.; Pauschinger, T.; Sørensen, P.A.; Snijders, A.; Djebbar, R.; Boulter, R.; Thornton, J. Design Aspects for Large-Scale Pit and Aquifer Thermal Energy Storage for District Heating and Cooling. Energy Procedia 2018, 149, 585–594. [Google Scholar] [CrossRef]
  12. Connolly, D.; Lund, H.; Mathiesen, B.V.; Werner, S.; Möller, B.; Persson, U.; Boermans, T.; Trier, D.; Østergaard, P.A.; Nielsen, S. Heat Roadmap Europe: Combining District Heating with Heat Savings to Decarbonise the EU Energy System. Energy Policy 2014, 65, 475–489. [Google Scholar] [CrossRef]
  13. Hast, A.; Syri, S.; Lekavičius, V.; Galinis, A. District Heating in Cities as a Part of Low-Carbon Energy System. Energy 2018, 152, 627–639. [Google Scholar] [CrossRef]
  14. Elkadeem, M.R.; Wang, S.; Sharshir, S.W.; Atia, E.G. Feasibility Analysis and Techno-Economic Design of Grid-Isolated Hybrid Renewable Energy System for Electrification of Agriculture and Irrigation Area: A Case Study in Dongola, Sudan. Energy Convers. Manag. 2019, 196, 1453–1478. [Google Scholar] [CrossRef]
  15. Weinand, J.M.; Scheller, F.; McKenna, R. Reviewing Energy System Modelling of Decentralized Energy Autonomy. Energy 2020, 203, 117817. [Google Scholar] [CrossRef]
  16. Kim, M.-H.; Lee, D.-W.; Kim, D.-W.; An, Y.-S.; Yun, J.-H. Energy Performance Investigation of Bi-Directional Convergence Energy Prosumers for an Energy Sharing Community. Energies 2021, 14, 5544. [Google Scholar] [CrossRef]
  17. Kim, M.H.; An, Y.; Joo, H.J.; Lee, D.W.; Yun, J.H. Self-Sufficiency and Energy Savings of Renewable Thermal Energy Systems for an Energy-Sharing Community. Energies 2021, 14, 4284. [Google Scholar] [CrossRef]
  18. Herrando, M.; Pantaleo, A.M.; Wang, K.; Markides, C.N. Solar Combined Cooling, Heating and Power Systems Based on Hybrid PVT, PV or Solar-Thermal Collectors for Building Applications. Renew. Energy 2019, 143, 637–647. [Google Scholar] [CrossRef]
  19. Pathak, M.J.M.; Sanders, P.G.; Pearce, J.M. Optimizing Limited Solar Roof Access by Exergy Analysis of Solar Thermal, Photovoltaic, and Hybrid Photovoltaic Thermal Systems. Appl. Energy 2014, 120, 115–124. [Google Scholar] [CrossRef] [Green Version]
  20. Wang, K.; Herrando, M.; Pantaleo, A.M.; Markides, C.N. Technoeconomic Assessments of Hybrid Photovoltaic-Thermal vs. Conventional Solar-Energy Systems: Case Studies in Heat and Power Provision to Sports Centres. Appl. Energy 2019, 254, 113657. [Google Scholar] [CrossRef]
  21. Wijeratne, W.M.P.U.; Yang, R.J.; Too, E.; Wakefield, R. Design and Development of Distributed Solar PV Systems: Do the Current Tools Work? Sustain. Cities Soc. 2019, 45, 553–578. [Google Scholar] [CrossRef]
  22. Lozano, L.; Querikiol, E.M.; Abundo, M.L.S.; Bellotindos, L.M. Techno-Economic Analysis of a Cost-Effective Power Generation System for off-Grid Island Communities: A Case Study of Gilutongan Island, Cordova, Cebu, Philippines. Renew. Energy 2019, 140, 905–911. [Google Scholar] [CrossRef]
  23. Lim, J.Y.; How, B.S.; Rhee, G.; Hwangbo, S.; Yoo, C.K. Transitioning of Localized Renewable Energy System towards Sustainable Hydrogen Development Planning: P-Graph Approach. Appl. Energy 2020, 263, 114635. [Google Scholar] [CrossRef]
  24. Zubair, M.; Bilal Awan, A.; Al-Ahmadi, A.; Abo-Khalil, A.G. NPC Based Design Optimization for a Net Zero Office Building in Hot Climates with PV Panels as Shading Device. Energies 2018, 11, 1391. [Google Scholar] [CrossRef] [Green Version]
  25. Nyoni, K.J.; Maronga, A.; Tuohy, P.G.; Shane, A.; Leonowicz, Z. Hydro-Connected Floating PV Renewable Energy System and Onshore Wind Potential in Zambia. Energies 2021, 14, 5330. [Google Scholar] [CrossRef]
  26. Shah, K.K.; Mundada, A.S.; Pearce, J.M. Performance of U.S. Hybrid Distributed Energy Systems: Solar Photovoltaic, Battery and Combined Heat and Power. Energy Convers. Manag. 2015, 105, 71–80. [Google Scholar] [CrossRef] [Green Version]
  27. Luerssen, C.; Gandhi, O.; Reindl, T.; Sekhar, C.; Cheong, D. Life Cycle Cost Analysis (LCCA) of PV-Powered Cooling Systems with Thermal Energy and Battery Storage for off-Grid Applications. Appl. Energy 2020, 273, 115145. [Google Scholar] [CrossRef]
  28. Medved, S.; Domjan, S.; Arkar, C. Contribution of Energy Storage to the Transition from Net Zero to Zero Energy Buildings. Energy Build. 2021, 236, 110751. [Google Scholar] [CrossRef]
  29. Morvaj, B.; Evins, R.; Carmeliet, J. Decarbonizing the Electricity Grid: The Impact on Urban Energy Systems, Distribution Grids and District Heating Potential. Appl. Energy 2017, 191, 125–140. [Google Scholar] [CrossRef]
  30. Le Guen, M.; Mosca, L.; Perera, A.T.D.; Coccolo, S.; Mohajeri, N.; Scartezzini, J.L. Improving the Energy Sustainability of a Swiss Village through Building Renovation and Renewable Energy Integration. Energy Build. 2018, 158, 906–923. [Google Scholar] [CrossRef]
  31. Kim, M.-H.; Kim, D.; Heo, J.; Lee, D.-W. Energy performance investigation of net plus energy town: Energy balance of the Jincheon eco-friendly energy town. Renew. Energy 2020, 147, 1784–1800. [Google Scholar] [CrossRef]
  32. Kim, M.H.; Kim, J.K.; Lee, K.H.; Baek, N.C.; Park, D.Y.; Jeong, J.W. Performance Investigation of an Independent Dedicated Outdoor Air System for Energy-plus Houses. Appl. Therm. Eng. 2019, 146, 306–317. [Google Scholar] [CrossRef]
  33. Duffie, J.A.; Beckman, W.A.; Blair, N. Solar Engineering of Thermal Processes, Photovoltaics and Wind; John Wiley & Sons: Hoboken, NJ, USA, 2020; ISBN 1119540283. [Google Scholar]
  34. Energy, H. HOMER Pro Version 3.14 User Manual; HOMER Energy: Boulder, CO, USA, 2020; p. 7. [Google Scholar]
  35. Vimmerstedt, L.; Akar, S.; Mirletz, B.; Stright, D.; Augustine, C.; Beiter, P.; Cohen, S.; Cole, W.; Duffy, P.; Feldman, D.; et al. Annual Technology Baseline: The 2021 Electricity Update; No. NREL/PR-6A20-80095; National Renewable Energy Lab (NREL): Golden, CO, USA, 2021. [Google Scholar]
  36. Mollenhauer, E.; Christidis, A.; Tsatsaronis, G. Evaluation of an Energy-and Exergy-Based Generic Modeling Approach of Combined Heat and Power Plants. Int. J. Energy Environ. Eng. 2016, 7, 167–176. [Google Scholar] [CrossRef] [Green Version]
  37. Gonzalez-Salazar, M.A.; Kirsten, T.; Prchlik, L. Review of the Operational Flexibility and Emissions of Gas- and Coal-Fired Power Plants in a Future with Growing Renewables. Renew. Sustain. Energy Rev. 2018, 82, 1497–1513. [Google Scholar] [CrossRef]
  38. Korea Gas Corporateion (KOGAS). Available online: https://www.kogas.or.kr:9450/eng/index.do (accessed on 16 October 2021).
  39. Kim, M.-H.; Kim, D.; Heo, J.; Lee, D.-W. Techno-economic analysis of hybrid renewable energy system with solar district heating for net zero energy community. Energy 2019, 187, 115916. [Google Scholar] [CrossRef]
  40. International Renewable Energy Agency. Renewable Power Generation Costs in 2020; IRNA: Teheran, Iran, 2021; ISBN 978-92-9260-348-9. [Google Scholar]
  41. Choi, J.; Kim, H.M. Chapter 4—State-of-the-Art of Korean Smart Cities: A Critical Review of the Sejong Smart City Plan. Smart Cities Technol. Soc. Innov. 2021, 51–72. [Google Scholar] [CrossRef]
  42. The National Pilot Smart City. Available online: https://smartcity.go.kr/en/%ED%94%84%EB%A1%9C%EC%A0%9D%ED%8A%B8/%EA%B5%AD%EA%B0%80%EC%8B%9C%EB%B2%94%EB%8F%84%EC%8B%9C/%EC%84%B8%EC%A2%85-5-1%EC%83%9D%ED%99%9C%EA%B6%8C/ (accessed on 4 October 2021).
  43. Lee, K.-R.; Lee, Y.-S.; Kim, J.-H. Evaluation on the Photovoltaic Module Arrangement Planning Considering Shading Conditions in Apartment Buildings. J. Archit. Inst. Korea Struct. Constr. 2019, 35, 169. [Google Scholar] [CrossRef]
Figure 1. Overview of simulation process.
Energies 14 07342 g001
Figure 2. Location of Sejong national pilot smart city and thermal network.
Energies 14 07342 g002
Figure 3. Monthly outdoor air temperature and solar radiation.
Energies 14 07342 g003
Figure 4. Monthly electric and thermal loads of the Sejong national pilot smart city: (a) electric load of residential buildings, (b) electric load of commercial buildings, (c) thermal load of residential buildings, (d) thermal load of commercial buildings.
Energies 14 07342 g004aEnergies 14 07342 g004b
Figure 5. Schematics of simulation cases: (a) Base case, (b) Case 1, (c) Case 2.
Energies 14 07342 g005
Figure 6. Operating profile of NG generator in the base case: (a) monthly electricity balance, (b) monthly thermal balance, (c) hourly electricity balance, (d) hourly thermal balance.
Energies 14 07342 g006aEnergies 14 07342 g006bEnergies 14 07342 g006c
Figure 7. Operation profile of NG generator in base case: (a) monthly electricity balance, (b) monthly thermal balance, (c) hourly electricity balance, (d) hourly thermal balance.
Energies 14 07342 g007aEnergies 14 07342 g007b
Figure 8. Monthly operating profile of ESS.
Energies 14 07342 g008
Figure 9. Operating profile of NG generator in base case: (a) monthly electricity balance, (b) monthly thermal balance, (c) hourly electricity balance, (d) hourly thermal balance.
Energies 14 07342 g009aEnergies 14 07342 g009b
Figure 10. Monthly operating profile of ESS.
Energies 14 07342 g010
Figure 11. Operating profile of TES: (a) monthly operation of TES, (b) hourly inner operating temperature of TES.
Energies 14 07342 g011aEnergies 14 07342 g011b
Table 1. Daily average and peak electric and thermal loads.
Buildings
Information
Electric LoadThermal Load
Total Floor Area
(m2)
Total Roof Area
(m2)
Daily Average (kWh/Day)Peak (kW)Daily Average (kWh/Day)Peak (kW)
Residential buildings884,648174,27688,465164,24988,46518,833
Nonresidential buildings1,214,300239,218246,83733,149143,16256,007
Table 2. Comparison of system capacity in each case.
Architecture
NG Generator
[kW]
PV-Roof
[kW]
PV-Empty [kW]ST-Empty
[m2]
ESS
[kW]
Inverter
[kW]
Base case220,000-----
Case 1220,000104,2013982-238,51273,894
Case 2220,000104,201-19,912261,64087,899
Table 3. Comparison of carbon emission and cost in each case.
Renewable Penetration RateEmissionCost
Electric [%]Thermal [%]CO2
[ton]
CO
[ton]
NPC
[$]
CAPEX
[$]
O&M
[$/year]
LCOE
[$]
Base case--297,46125634.81B574M328M0.892
Case 130.9-189,76615794.48B1.23B251M0.830
Case 230.55.1184,75215444.50B1.27B249M0.835
Publisher’s Note: MDPI stays neutral with regard to jurisdictional claims in published maps and institutional affiliations.

