Article

Analysis of the Impact of Countdown Signal Timers on Driving Behavior and Road Safety

Faculty of Transport, Warsaw University of Technology, Koszykowa 75, 00-662 Warszawa, Poland
*
Author to whom correspondence should be addressed.
Energies 2021, 14(21), 7081; https://doi.org/10.3390/en14217081
Submission received: 9 October 2021 / Revised: 20 October 2021 / Accepted: 23 October 2021 / Published: 29 October 2021
(This article belongs to the Special Issue Vehicle and Traffic Safety)

Abstract

:
This article describes the safety and effectiveness issues related to signal countdown timers (SCT). These devices are used in many countries around the world. The impact of these devices on road safety and the effectiveness of traffic lights is presented. During a literature review, more than 18 aspects of device use were recognized. The research involved measurements carried out at three intersections in Płock (Poland). The initial and final period of the green signal for vehicles was analyzed. Headways, incidences of vehicles passing through after the end of the green signal, and red-light violations were examined. Additionally, a fuel consumption analysis and a case study of a road crash in Szczecin (Poland) are presented. Problems related to signal countdown timers working during traffic light failure are described. The research shows different influences of signal countdown timers at various intersections. It was observed that SCTs increase the number of red-light violations and during the red-amber signal. On the other hand, the number of entries during the amber signal with SCTs is lower. A literature review also indicated that the use of SCT causes a reduction of start-up time (positive impact) and increases vehicle speed (negative impact). The article concludes that SCTs do not always fulfill their role in improving road safety and control efficiency. Conclusions can address various stakeholders, including drivers, road authorities, and traffic engineers.

Graphical Abstract

1. Introduction

1.1. Problems of Using Signal Countdown Timers

The first traffic light was installed in 1868 at a road junction in London [1]. It was based on a gas lamp. Electric traffic lights started to be used in the second decade of the 20th century. The very first, based solely on light signals, was used in 1914 in Cleveland. Signaling displayed the words “STOP” and “MOVE”. The colors red and green were used for the first time as signals in 1917 in San Francisco. A third color, amber, was introduced in 1920 in Detroit, which improved traffic safety. In the first years of their operation, traffic light solutions were very different but, fortunately, they were unified. The signals used on roads were defined in international agreements such as the Geneva Convention on Road Traffic, signed on 19 September 1949 [2]. The convention allowed two-color signaling (red and green) and specified the meaning of individual signals. Similar provisions were agreed in the Convention on road signs and signals established at Vienna on 8 November 1968 [3], and allowed the use of directional signals. Poland signed both of these conventions. Drivers are obliged by the law to follow the indications of the traffic light. The rules set out in the above-mentioned international regulations indicate that drivers are not informed in advance about the signal change. Only a short period, lasting for one or a maximum of a few seconds during the amber, and red with the amber, signals notify drivers about the signal to be displayed next. Issues related to road safety at intersections are a current problem. Research conducted in Poland has investigated issues of road lighting, in particular pedestrian crossings [4], adaptation of road infrastructure to the needs of autonomous vehicles [5], road interchanges [6], safety at pedestrian crossings [7] and country highways [8]. There are fewer articles regarding traffic signals compared to other elements of traffic infrastructure, e.g., roadways, junctions, and interchanges. At the turn of the first and second decades of the 21st century, devices indicating how long a given signal would be displayed, called Signal Countdown Timers (SCT), began to be used. Their application took place on many continents, but in Poland, they were used was ahead of legislative changes (Figure 1). Regulations adapting their application were only introduced in 2017 [9]. However, there are still many problems with the use of these devices. In this article, the problem is reviewed from the perspective of research conducted around the world. Additional research was also carried out by the Road Traffic Control Team at the Faculty of Transport Warsaw University of Technology. Unexplored and unsolved problems require further research, which are indicated in the conclusions.

1.2. Literature Review

Issues related to drivers’ reactions to changing signals have been the subject of many studies since the middle of the 20th century [10,11]. SCTs can be used both for the red signal (RSCT) and the green signal (GSCT) at crossroads [12]. The purpose of the SCT is to help the driver decide to stop or drive through at the amber signal and to start the vehicle column moving more efficiently at the beginning of the green signal. Research also shows that many drivers cross the traffic lights stopping line while displaying a red signal, which is called a red-light violation (RLV) [13].
The literature review was divided into main threads related to the behavior of drivers and pedestrians. Starting from the background of regulations in Poland (Section 1.2.1), the topic was investigated worldwide. Main problems related to vehicle traffic and SCT were categorized into subjects of capacity determination (Section 1.2.2), red light violation (Section 1.2.3), entering on the amber signal (Section 1.2.4), vehicle speed, braking characteristics, dilemma zone (Section 1.2.5), reaction time (Section 1.2.6), safety statistics (Section 1.2.7), GHG emissions (Section 1.2.8) and cycling (Section 1.2.9).
Some of the articles on SCT consider devices for pedestrians (in a shortcut later described as PSCT). The main problems covered by the research were pedestrians passing on the flashing green (Section 1.2.10), pedestrian red-light violations (Section 1.2.11), pedestrian speed (Section 1.2.12), and vehicle-pedestrian conflicts (Section 1.2.13).

1.2.1. Background of Regulations in Poland

The very first article related to the SCT situation in Poland was published in 2013 [14] before regulations were put in place [9]. Legally, at that time, the RSCT and GSCT were used, although their technical and functional requirements were not specified, and their use was not allowed. The article presented many legal and technical problems. It also presents issues related to road traffic engineering in designing traffic light control algorithms and signaling operation in the event of an SCT failure. Some of the problems described in this article have been resolved, while others are still relevant today.
As an extension to previous research, problems related to SCTs used in Poland have been further investigated [15]. Analyzed issues were divided into technical issues related to the assembly and supervision of signals, problems in road traffic engineering associated with the determination of displayed values and the effectiveness of traffic-actuated control, issues related to road safety, and legal issues. Although the article refers to the period in which the use of SCTs in Poland were prohibited, many problems had not been solved, nor been the subject of published research.
Due to enforcement of regulations [9], the use of SCTs in Poland was allowed from 1 July 2017, but the introduced provisions were criticized. One argument was that regulations omitted devices already installed [16]. However, it should be noted that the solutions used so far had not met safety requirements, so their locations and dimensions were not taken into account in the regulations. The limitation of SCTs to fix time control was criticized, and stricter rules on the location of these devices required.
Another literature review [17] was published after the implementation of regulations in Poland. Thirty-five bibliographic references were analyzed together with a statement of general opinion on selected factors. The methodology used for SCT research was described in another article [18]. The main goal of the research was to determine the impact of countdown timers on traffic conditions and the level of traffic safety.

1.2.2. Capacity Issues (Headway/Saturation Flow/Capacity/Start-Up Lost Time)

A 2005 study in Kuala Lumpur (Malaysia) [19] concerned the SCT for the green signal (GSCT). The research covered the period before and after installing the GSCT. The study indicated that the impact of installing the GSCT was small. Other research carried out in Kuala Lumpur [20] concerned the influence of SCTs on vehicle capacity at six intersections. The time intervals between vehicles moving at the start of the queue were examined (headways). Only passenger vehicles were investigated. Measurements with heavy vehicles were rejected. The study showed that saturation flow for a junction with an SCT is greater than for a junction without an SCT.
Issues related to intersection capacity were also examined in the research at intersections in Bangkok [21]. Start-up delay and headway in the initial period of the green signal (six vehicles) and the later period were examined. In the case of headway, no differences were found for the subsequent period.
Similar studies were conducted in India [22] concerning mixed traffic in conditions of queuing. Two-wheeled vehicles, rickshaws, and buses were distinguished. It was emphasized that the drivers in India showed a lack of discipline. Video recordings were analyzed with the use of Matlab. The study showed reduced time intervals at the beginning and end of the green signal using SCT.
Headway was also analyzed during start-up of a vehicle column at a junction with an RSCT [23]. The research was conducted in Guangzhou (China). The results showed a reduction in headway and increased capacity due to the use of RSCT by approx. 5% at night and approx. 10% during the day, and an even greater reduction in headway standard deviation.
Similarly, different technical solutions were explored in [24]. The comparison applies to standard traffic lights, signals with different types of light rules, and numerical SCTs. The research was conducted in Brazil. The studies showed no statistically significant effect on the headway of different types of SCT in relation to standard signaling.
Study [25] investigated the effect of RSCTs on the headway/saturation flow. The research was conducted with the SCT turned on and off for 24 h and showed that the use of the RSCT reduced start-up time by 22%. The statistically significant impact concerned only the first vehicle in the queue, regardless of the period of the day. In some cases, reduction of start-up delay was even more significant. Use of an RSCT in Bangkok reduced it by 33% [21]. Research was also carried out in New Delhi at three intersections [26] where was no influence of GSCT on saturation flow, whereas RSCT reduced start-up lost time.
Other research [12] was carried out in Kayseri (Turkey) at the approaches of two intersections where an SCT was used for the red signal (RSCT) and green signal (GSCT) at the crossroads. The study determined the start-up time distributions of the first vehicle in the queue after the green signal was displayed. A statistically significant positive effect on the start of the queue of vehicles was demonstrated but, simultaneously, an increase in the number of crossing the intersection before the green signal was noted. In study [27], the psychological aspect was not considered when analyzing drivers’ behavior during vehicle start-up, pointing to the possibility of obtaining a start-up delay of 0 s, which contradicts the conclusions from [12], indicating the random nature of this phenomenon.
Study [28] also concerns starting vehicles at traffic signals. Tests were carried out in Changchun (China) at six intersections with quite long cycles (100–150 s). The research concerned an RSCT and covered the first three vehicles in the queue. In the regression models used for the analysis, nine factors related to the intersection and traffic influencing start-up delay and headway were considered and showed a reduction in both values after using the RSCT.

1.2.3. Red Light Violation (RLV)

One of few studies analyzing the long-term impact of GSCT on traffic was conducted in Singapore [29]. The number of red signal violations was examined before installing the GSCT and after installation for 1.5, 3, and 7.5 months. The research was conducted at different times of the day and on different days of the week. In the first two post-installation periods, RLVs (number of red-light violations) were lower than before the GSCT was installed. However, after 7.5 months, the number of RLVs returned to the number before the GSCT installation.
In Kuala Lumpur (Malaysia) study [19], the number of entries on the red signal was two times smaller when the GSCT was installed. However, the need for further research before using these devices was indicated. In other research conducted in Kuala Lumpur [20], the rate of RLVs was higher in the case of using an SCT.
In Bangkok, a survey was conducted with over 300 drivers constantly moving around the city [30]. An essential factor was that the cycle times used in this city were 120–240 s, twice as high as the typical values used in Poland. The research showed only a slight change in saturation flow, while the start-up lost time decreased significantly. For other vehicles, as in [25], no differences were found. The absence of SCTs increased the number of vehicles entering during the red signal. The questions in the survey related to reductions of driver frustration, turning off the engine when parked, and using the waiting time for the green signal.
A study in Chennai, India [31] examines the effects of the RSCT and GSCT across four vehicle types. An increase in red signal violations was noticed in the final period, especially among rickshaw drivers and two-track vehicle drivers. On the other hand, the number of entries at the beginning of the green signal decreased among all road users. Concerning headway, the entry time of the first vehicle was significantly reduced, and the differences were small for subsequent vehicles.
Article [32] presents research carried out at three junctions in New Delhi (India). Signal programs with cycle lengths of 165–180 s were in place at the intersections. The number of red-light violations in the final period of a red signal increased. In article [33], 44 bibliographic items regarding SCT research and other solutions influencing red signal violations are presented. Conclusions concerning the use of SCT are both positive and negative. The main difference is in the use of GSCT and RSCT. Research carried out in New Delhi at three intersections indicated that both types of SCT (GSCT and RSCT) affected red-light violations [26].
Article [34] concerns a study carried out in Hyderabad, India, at two intersections. The research included start-up loss time and capacity. Turning off the SCT increased the number of red-light violations by about 5%. The research revealed higher speeds at intersection approaches with a working SCT.
The research in [35] was carried out following the methodology described in [18] and [36] concerning a GSCT. Crossing at the beginning of the red signal at three intersections was analyzed. A significant effect of GSCT in reducing the number of red-light violations by buses and trucks was also observed.
Research in Europe conditions is presented in article [37] including SCTs installed at two intersections in Cotonou, Greece and involved vehicle column start-up and drivers’ behavior at the end of the green signal. The results showed that there were practically no early starts at intersections without an SCT. When an RSCT was used, the number increases by approx. 24%. The use of a GSCT also increased the number of vehicles stopping at the end of the green signal. At the same time, the proportion of vehicles passing on the red signal decreased, but the proportion accelerating during the amber signal increased.
A study from Ljubljana (Slovenia) [38] covered one intersection. The article presents the verification of three hypotheses concerning start-up lost time, amber violations, and red-light violations. A survey among drivers was also conducted. Concerning signal violations, a greater number of entries during the amber signal occurred with the GSCT turned off, as did red-light violations. However, with respect to violation of the red-amber signal (before the green signal), a greater number of cases occurred with the RSCT turned on. The results showed positive feedback from drivers about the SCT. However, about 30% of people indicated that SCTs can be distracting.
In Poland, the first research on driving behavior at an SCT was carried out in 2014, although SCTs were used before 2014 at intersections. Research carried out by the Municipal Roads Authority in Grudziądz [39] used a speed camera and a red-light violation camera and found that the launch of the SCT increased the number of entries on the red signal, although these offenses were registered and the drivers were punished for them. Similarly, with the inclusion of an SCT, the proportion of vehicles driving over the speed limit increased.

1.2.4. Entering on Amber Signal

In a study carried out in Zabrze (Poland) it was observed that disabling the GSCT increases the number of vehicles entering the intersection during the amber signal and at the beginning of the red signal [40]. Research in [41] concerned the influence of a pedestrian SCT (PSCT) on driver’s behavior. It was observed that SCTs increased the number of vehicles passing through on an amber signal and reduced the number of passages on a red signal shortly following the amber.
A study in Kayseri (Turkey) [12] observed a reduction in the number of vehicles entering during the amber signal with a working SCT, except during congestion and with significant delays at the approach. The authors concluded it was important to consider the behavior of drivers at the end of the green signal when assessing appropriate times for each signal phase. The conclusion that the RSCT did not affect traffic safety is contradictory to the findings of other authors.
A different study dealt with the termination of the green signal [42]. The research was conducted in Changsha (Hunan Province, China) at four intersections. The signaling programs had cycles of 100–128 s. Three drivers’ reactions were studied: stopping before the stop line, passing through on the amber signal, and passing on the red signal. Binary logistical regression analysis was used. The study showed a greater number of vehicles passing on the amber and red signals after applying the GSCT.
The research methodology in [43] is similar to that in [42] and the same research grounds were used. Logistic regression was used to analyze the data. The probability of stopping as a function of speed and distance from the stop line was examined. The study was extended to the analysis of the method of crossing the intersection on the red signal. It was confirmed that the use of a GSCT increased the number of entries on the amber signal.
As well as GSCTs and RSCTs, there are also displays showing the duration of the amber signal. A study of these in Harbin, China, is presented in [44]. Such displays reduced the number of vehicles entering during the second, third, and fourth seconds of the amber signal. A display with the function of showing the duration of the amber signal did not change the speed of vehicles, unlike the GSCT, which caused an increase.

1.2.5. Vehicle Speed, Braking Characteristics, and the Dilemma Zone

The issue of traffic safety from the point of view of the mechanics of vehicle movement when an SCT is turned off is described in [27]. Analyzing mathematical relations, it was found that the GSCT did not increase the vehicle speed above the minimum. A psychological factor was not included in the article. Research in [45] showed a reduction in the speed of vehicles reaching a crossing during the yellow signal. A negative impact on the speed of vehicles at the approach was found in Kayseri (Turkey) [12]. Vehicle speed at intersections with a GSCT was also analyzed in New Delhi [46]. The proportion of vehicles exceeding the speed limit at the intersection entrance was higher (approx. 4% compared to approx. 13%). On the other hand, the speed of vehicles crossing the intersection with a GSCT during the amber signal was almost twice as high.
An analysis of an SCT functioning in the Philippines is presented in [47]. As part of the study, drivers were surveyed in Manila and at intersections in Quezon and Pasig. It was observed that the use of countdown timers caused no low-speed vehicle passages in the final period of the amber and green signals, while there were soft brakings and stops of cars on the amber signal and starts from the stopping line before the green signal. Research also shows that drivers’ declared and real behavior during the amber and green signals differed significantly. For example, drivers declared that they decelerated during an amber signal when they were accelerating or moving at a constant speed.
An analysis covering decisions made by drivers while driving through an intersection with and without an SCT was conducted in China [48]. A logistic model was used for the research, taking into account the probabilities of such behaviors as acceleration, braking, and speed maintenance. Determined from the time displayed on the GSCT, the distance from the stop line and the vehicle’s speed was assessed. The study showed that at intersections with an SCT, the proportion of stopping or slowing vehicles was greater than at intersections without an SCT, while the percentage of accelerating vehicles decreased.
Differences in drivers’ behavior at traffic lights with an SCT and a CCTV system in summer and winter were examined in [49]. The research was conducted in Changchun, China, at eight intersections where traffic violation cameras were installed. The tests covered 90 m long sections of intersection approaches. Based on video observations, braking speeds and decelerations were determined. It was observed that in winter, drivers braked at a greater distance from an intersection equipped with a GSCT, while at intersections not equipped with a GSCT, drivers braked when an amber signal was displayed.
GSCT tests were also carried out with the use of a vehicle simulator [50]. The study included an analysis of drivers’ behavior in the dilemma zone and braking deceleration. With a GSCT in place, drivers who were in the dilemma zone decided to stop more often, and at the same time, braking was performed with less deceleration. Research in [25] also showed a shortening of the dilemma zone. The influence of GSCT on vehicle traffic parameters used in car-following models (the method used to determine how vehicles follow one another on a roadway) was also investigated [51]. Numerical simulation showed that GSCT significantly affected drivers’ behavior before traffic lights and should be considered during simulations.
The technique used for measurements has also developed over the years. Article [36] describes SCT tests performed with the use of UAVs. Video recording from the air has proven successful and, as a result of the study, a solution was obtained to reduce the start-up lost time (by 16–39%) and increase the speed of crossing the intersection (by 10–28%).

1.2.6. Reaction Time

Another influence of the SCT is a shortening of the brake perception-reaction time. This is indicated by research in [52] carried out in Harbin, China, at six intersections with an amber signal duration of 3 or 4 s and a cycle length of 107–170 s. The presence of a GSCT significantly reduced the driver’s reaction time to changing signals. The article analyzed reaction time distribution, and the median reaction time was reduced by 30%.
A broader issue was described in the article [53] concerning various solutions about the end of the green signal such as a green blinking signal and an RSCT. The article presents five models concerning the driver’s decision to drive or stop. The analysis concluded that the driver’s reaction with the application of GSCT was faster than that resulting from the use of a flashing green signal, and the slowest response occurred in the case of the standard sequence of signals (green/amber/red).

1.2.7. Safety (Number of Crashes, Vehicle-Vehicle Conflicts)

Safety characteristics of SCTs were investigated in [54] for not only a GSCT and an RSCT but also CCT a (continuous countdown timer—displaying all signals) The literature was researched using the PRISMA method and 79 references were analyzed, of which 14 were thoroughly investigated. It was found that the effect of countdown timers is dependent on the type of device, and different parameters in different studies indicated improvement or lack thereof. In particular, the impact of SCTs on road safety was not unequivocal.
Article [55] describes the advantages and disadvantages of SCTs and presents survey results. The opinions of the Ministry of Infrastructure are also presented, and the cities using these devices are listed (albeit, in a manner inconsistent with applicable law). Article [56] covers an analysis of SCTs installed in Toruń (Poland) at four intersections. The number of crashes on intersections was used as a measure of safety. The test results did not show any improvement or deterioration in traffic safety.
In other research, standard traffic lights, signals with different types of light rules, and numerical SCTs were compared. Traffic safety studies were carried out using the pre and post analysis method. The results show a reduction in the number of crashes by approximately 35% [24].
Research in Słupsk (Poland) [57] included only questionnaire studies on the opinions of road users in terms of safety, driving comfort, and driving behavior. However, as noted in [47], there were significant discrepancies between the survey results, and the article did not contain a verification.
The values displayed on the SCT impact the driver and can be analyzed in conjunction with road crashes. This issue is described in article [58], which includes a case study for a selected intersection in Krakow. However, the article’s conclusions indicate that further research is needed related to traffic safety with the use of an SCT. Study [59] considers the time display when modeling traffic with a cellular automaton. The model was implemented for a two-lane road section.
A detailed analysis of the causes of GSCT-related road incidents is presented in [60]. The research was carried out for five intersections in Delhi (India). The intersections were characterized by a cycle length of 220–240 s, and characteristics related to red light violations and conflicts between road users were determined as part of the research. The use of a GSCT reduced the number of red-light violations and the number of conflicts by almost half.
The influence of RCST and GCST on road safety in China was also analyzed [61]. In 2000–2007 such devices were installed at 1036 intersections in China. The tests were conducted in Taipei in four periods: preinstallation, 1.5 months after installation, and 3 and 4.5 months after installation. The research showed a negative impact of the GCST on the dilemma zone and traffic safety.
The psychological aspect of using SCT is critical, and can be studied based on statistics gathered by surveys. One such survey took into account the gender, age, and driving experience of drivers. It included 32 questions regarding opinions on various SCT solutions, driver’s behavior, such as engine shutdowns when stopped at traffic lights, and the scope of the displayed information [62].
Innovative technical solutions in the field of RSCT are presented in [63]. Various graphic SCT solutions were presented in which the passage of time was displayed as an LED ruler, a circle segment, and a change in the diameter of the signal. The proposed solutions were tested on a group of 12 road users and assessed in terms of the perception of the information provided and assessment of the impression of the device. Doubts as to the practical application of the solutions were raised, because of difficulties regarding meeting the requirements of the norm [64].

1.2.8. GHG Emissions

The impact of SCT on greenhouse gas (GHG) emissions was investigated in [65]. The study was conducted in Haeundae-gu, Korea. As part of the study, a driver behavior model was developed and 340 trips were made to test the effect of SCT on such behavior. Then, a model of the Haeundae-gu road network was made in the Vissim program, and based on the simulation results, the GHG emission from idling vehicles was determined. It was shown that with the use of an SCT it is possible to significantly reduce greenhouse gas emissions resulting from a reduction in the number of stops and the possibility of turning off the engine.

1.2.9. Cycling

A study of the impact of an RSCT on cycle traffic was analyzed in [66]. The study was conducted in Groningen, the Netherlands. Research showed that cyclists observe the SCT and adjust their riding style to the displayed value. After using an SCT, a small number of cyclists approached the intersection during the amber signal, and eye-tracking studies indicate that they observed the SCT from a distance of about 60–70 m. However, when standing in front of a signal head, eyesight is more focused on the SCT than on the signal head.

1.2.10. Pedestrian Passing on Flashing Green

Research [67] conducted in China was also related to pedestrian decision-making before crossing an intersection. The study was carried out at crossings equipped with PSCTs. Pedestrians were divided into groups according to their behavior. While the study did not directly address the impact of PSCTs on road traffic, the methodology could be used for this purpose.
A study done in Korea concerning numerical and graphical SCTs monitored the number of pedestrians entering the road during a flashing green signal. A reduction in the number of pedestrians passing during a flashing green signal was indicated, which is not allowed in Korea [68].
Extensive PSCT studies have been conducted in Sydney, which concluded that the use of PSCT did not reduce the number of entries during the “Flashing Don’t Walk” (blinking) signal and reduced the proportion of late finishers (pedestrians entering the crossing in the last seconds of the green signal) [69]. Other research based in Sydney [70], indicated an increase in the proportion of pedestrians entering the crossing during the “Flashing Don’t Walk” signal after the launch of a PSCT. Similar results were obtained in a study [71], also carried out in Australia. An increase in the number of entries to the pedestrian crossing was observed during the “Flashing Don’t Walk” signal.
A study conducted in the USA [72], indicated that PSCTs increased the number of pedestrians entering during a “Flashing Don’t Walk” signal. Similar results were described in research carried out in India [73], indicating an increase in the number of pedestrians entering the crossing in the final period of the green signal and during the yellow signal. Research [45] showed a reduction in the proportion of pedestrians reaching a pedestrian crossing during the “Flashing Don’t Walk” signal and shortening of the dilemma zone.
Research conducted in the United Arab Emirates [74] showed that after using a PSCT, the number of people crossing according to regulations increased, i.e., crossing at the end of the “Flashing Don’t Walk” signal. The research also included a survey in which the majority of respondents supported the use of the PSCT.
In other research, PSCTs were analyzed concerning the time counted down during green and red signals [75]. The study was conducted at five intersections in Shanghai. Signal cycle lengths ranged from 128 to 200 s. The use of a PSCT reduced the number of pedestrians over 50 years old crossing during a flashing green signal. In all age groups, the number of pedestrians finishing the crossing during the flashing green signal increased. The reaction time of pedestrians at the beginning of the green signal also decreased, especially for people aged 50+.
A study in China researching children’s’ behavior showed no influence on the ratio of entries during the green blinking signal. Still, slightly more children finished crossing during the blinking green signal. The use of a PSCT did not affect crossings started during the blinking green signal [76].
A team from the Silesian University of Technology in Poland researched PSCTs [40]. The research was carried out in Zabrze. With the PSCT turned off, the proportion of pedestrians entering the crossing was greater during the flashing green signal (allowed in Poland) and at the beginning of the red signal.

1.2.11. Pedestrian Red-Light Violations

Research held in China [77], investigated the behavior of pedestrians, dividing them into four groups. The results showed a statistically significant increase in the proportion of pedestrians obeying signaling when a PSCT was used. Children’s behavior related to PSCT is described in article [76]. The PSCT counts down the duration of the green flashing signal and the duration of the red signal. The research was conducted in Jinan (China) at two intersections. During the study, it was found that at an intersection equipped with a PSCT, the proportion of children entering during the red signal was greater.
Other studies conducted in Europe (Greece, Thessaloniki) [78] indicate numerous incorrect crossings of pedestrians regardless of various factors. The proportion of pedestrians crossing during the red signal in this study are greater than those presented in other articles.
PSCT research was also conducted on two intersections in New Delhi [79]. The use of a PSCT significantly increased the number of pedestrians crossing during the red signal. At crossings without a PSCT, the proportion of people crossing during the green signal was higher, while after installing a PSCT, the percentage of people crossing during the amber signal also increased. The use of a PSCT did not affect the waiting time of pedestrians before the crossing or times of arrival at the pedestrian crossing.
In Poland, the inclusion of a PSCT reduced the number of entrances at the beginning of the red signal but resulted in pedestrians to intrude on the crossing at the end of the red signal [40].

1.2.12. Pedestrian Speed

A study prepared in Sydney indicates that the speed of pedestrians passing through the crossing increases with a PSCT in place [69]. During the “Flashing Don’t Walk” signal, pedestrians move at a higher speed than when the PSCT is off. Nevertheless, pedestrians positively assessed the use of PSCT in the survey [70]. Similar results were obtained in a study [71], also carried out in Australia. An increase in the speed of pedestrians at the crossing in the final period of the green signal was observed [71]. In Shanghai, the speed of pedestrians who started crossing on the green signal after 5 s increased [75]. An increase was also observed in the research described in [45]. In research conducted in New Delhi [79], no influence of PSCT on the speed of pedestrians crossing the road was found.

1.2.13. Pedestrian Safety (Vehicle-Pedestrian Conflicts)

A study in Sydney indicated that it is not possible to unequivocally assess the impact of a PSCT on the number of pedestrian-vehicle conflicts [69]. Studies conducted in Canada do not show a statistically significant influence of PSCT on the number of pedestrian-vehicle collisions [80].
The safety aspects of PSCTs studied at 106 intersections with traffic lights in North Carolina, USA [81]. There was a statistically insignificant reduction in the number of road incidents with pedestrians after installing PSCTs. In contrast, the total number of road incidents decreased in a statistically significant manner.
PSCTs were also researched in a study related to road traffic accidents of older people [82]. The research was conducted at 190 intersections, and included the analysis of road incidents before and after installing a PSCT. A radius of 250 ft from the intersection was assumed as the intersection area. The study showed a reduction in the total number of incidents injuries after installing the PSCT.
However, when PSCTs were used in India [73] and China [76], the number of pedestrian-to-vehicle conflicts was more significant. Canadian studies [83] showed that PSCTs increased the number of all crashes with pedestrians by 7.5%. There was no significant influence on the number of crashes with injuries or fatalities.
Research was also conducted in the USA on the use of pedestrian buttons at intersections with a PSCT [84], which showed the use of pedestrian buttons reduced the number of traffic incidents with pedestrians. The use of a PSCT alone, without buttons for pedestrians, did not bring about any effect on improved safety.
The behavior of pedestrians using crossings with pedestrian islands in Belgrade (Serbia) has been investigated [85]. A PSCT had a positive effect on reducing the number of pedestrians entering the first pedestrian crossing, but did not affect pedestrians leaving the second crossing.
Study [86] shows that the use of a PSCT had a statistically significant effect on the number of rear collisions and the number of incidents involving pedestrians. The analysis of PSCT assembly costs and road incident costs shows that the use of PSCT is economically justified.

1.2.14. Literature Review Summary

The above literature analysis shows that there are significantly different results concerning the effects of STCs. Table 1 presents the essential information about each of the studies.
A ‘+’ sign indicates a positive impact on road traffic (understood as improvement of safety, improvement of indicators related to safety, or improvement of measures of effectiveness). For example, this symbol denotes a decrease in headway or an increase in saturation flow. The symbol ‘−’ indicates a negative impact on road traffic, while symbol 0 shows no significant effect. In the “others” column, L stands for literature analysis and research methodology development, S survey research, T theoretical analysis, M modeling or data collection for modeling, C comparison SCT with similar devices.
Based on the number of articles, a rating was calculated considering publications with a positive impact of an SCT on a given factor with a weight of ‘+1’ and a negative impact with a weight of ‘−1’. On this basis, it can be concluded that in terms of positive effects (rating 4–11) of the use of SCT, the most frequently mentioned are:
  • reduction of start-up lost time,
  • reduced red light violations at the onset of the red signal,
  • decreased headway/increase saturation flow or capacity.
The factors assessed negatively (score from −3 to −9) in order of the most frequently mentioned:
  • increased red light violations before the onset of the green signal,
  • increased vehicle speed,
  • increased incidences of pedestrians crossing on a flashing green (or amber or Flashing Don’t Walk) signal,
  • increased pedestrian red-light violations.
The remaining factors were examined in individual studies. The results were inconsistent, or no significant influence of SCT was demonstrated.
Due to the often-divergent results, research gaps remain. Most of the research was conducted in large urban centers. It is therefore important to conduct research in smaller cities and outside the cities. There are visible differences in drivers’ behavior between individual countries, related to, for example, cultural norms. Research carried out in Poland is sparse, so it is advisable to conduct research to a greater extent. It is interesting to consider whether the results obtained mainly in Asia, America, and Australia will be similar in Poland. There are no studies related to traffic safety during failures in the use of SCTs or the traffic light system.

1.3. Article Content
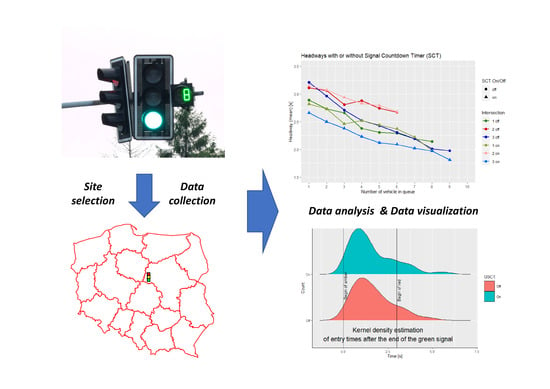
The article is structured as follows. Section 1 presents an in-depth literature review and analysis of the research carried out so far. Section 2 presents the research methodology of the conducted research. Section 3 presents the results of the field research. The latter part of the article (Section 4) discusses the results in relation to the literature analysis and previous research. Unexplored issues related to the functioning of SCTs are indicated. Selected case studies associated with SCTs are also presented. The aim of the paper is to conduct a comprehensive analysis of the literature, to conduct field research carried out covering many criteria, and to identify previously unexplored issues related to SCTs that have not been described in previous publications. The article is summarized in the conclusions presented in Section 5.

2. Methods

2.1. Place and Method of Conducting Research

Field measurements were carried out to experimentally evaluate the impact of countdown timers on the movement of vehicles. The research aimed to assess the validity of the use of countdown timers and their impact on the driver’s decision to brake and start the vehicle. The research included making direct observations of traffic at the approaches of selected intersections. The study was conducted in Płock, Poland (Masovian Voivodeship). Płock is a county city with a population of approximately 120,000. Traffic lights are installed at 57 intersections; 32 are equipped with SCTs and 11 with PSCTs. An SCT for vehicles performs the functions of an RSCT and GSCT.
The following factors were taken into account when selecting the study site:
  • the presence of queues of vehicles at the approaches,
  • fixed-time control,
  • presence of an SCT for vehicles,
  • the possibility of installing the camera in a way that allows observation of the approach and indications of signaling devices and SCT.
Because of the above requirements, three intersections were selected:
  • The intersection of F. Kobylińskiego Avenue with I. Łukasiewicza Street;
  • The intersection of I. Łukasiewicza Street with Miodowa and Tysiąclecia Streets;
  • The intersection of F. Kobylińskiego Avenue with Bielska and Jachowicza Streets.
Later in the study, intersections were marked with the numbers mentioned above. The location of intersections on the Płock map is shown in Figure 2.
All intersections have four approaches, with traffic lights operating in a fixed-time mode. There are pedestrian crossings at each of the intersections at all legs. Moreover, during the morning and afternoon rush hours, queues of vehicles of an appropriate length form at intersections.
At each of the intersections equipped with an SCT, measurement points were selected to observe the approach. The measurements were made using an image recording method. Vehicles crossing the stop line at the selected approach were recorded [88,89]. A Sony camera was used, which was placed on a tripod at a convenient observation point. The camera was set in a place that did not attract the attention of drivers, and as little visible to the drivers as possible. The field of view for the camera used for the measurements was 155 degrees and included the stop line, a distance of about 10 m in front of the stop line, and signals. The focal length of the camera was f = 29.8–298.0 mm (16:9). Films were recorded in HD quality. Time was superimposed on the image with an accuracy of 0.1 s. Vehicles on all lanes were visible.
Based on previous measurements of vehicle traffic, the duration of the morning and afternoon peaks was determined: morning peak hours 6:45 a.m. to 8:45 a.m. and afternoon peak hours 2:45 p.m. to 4:45 p.m. The research was carried out in both rush-hour peaks and the off-peak period (11:30–13:30). Traffic at junction No. 1 was monitored in the morning rush hour, in the off-peak period at junction No. 2, and in the afternoon rush-hour at junction No. 3. A total of 12 h of recordings were made and were used in full to compile the results.
During the measurements, the weather conditions were very good (sunny, rainless). Due to administrative procedures related to obtaining appropriate approvals, measurements were taken on 19 July and 20 July 2017. This is the period of the summer holidays. The test results were analyzed manually using a method of observation and analysis of the obtained video material.
Unfortunately, the traffic volumes and lengths of queues during the holiday season (the Road Administration agreed to such date of the study) were not high. Therefore, only six vehicles from the queue were registered for intersection No. 2, data for eight vehicles were recorded for intersection No. 1, and for intersection No. 3 observations only nine vehicles were included.
Courtesy of the Płock City Hall, the research was conducted in the same conditions with the SCT turned on and off. This made it possible to compare the behavior of drivers in the following days. Both drivers’ behavior at the green timer (GSCT) and the red timer (RSCT) were tested. The research focused on the following three issues:
  • respect for the red signal by drivers,
  • headway during vehicle column start-up,
  • time of entering the intersection after the end of the green signal.
Apart from speed, which could not be measured by the adopted method, these are the most frequently studied factors related to the functioning of a GSCT.

2.2. Characteristics of Intersections

At intersection No. 1, measurements were made at the eastern approach. There is one 3.25 m wide lane for straight ahead, a left-turn lane, and a right-turn lane. The traffic organization at intersection No. 1 is shown in Figure 3.
During measurements at the intersection, signaling programs with a cycle duration of 100 s (06:30–08:00) and 95 s (08:00–08:30) operated. The green signals had a time of 36 s and 32 s, respectively.
At intersection No. 2, measurements were also carried out at the eastern approach. There are no marked lanes at the approach, and its width is 5.8 m. The traffic organization at intersection No. 2 during the measurements is shown in Figure 4. Currently, the traffic organization has been changed.
A signaling program with a cycle duration of 90 s was in operation during measurements at the intersection. The green signal duration was 30 s.
At intersection No. 3, measurements were made at the western approach. There are two 3 m wide lanes for straight-ahead driving. Besides, there is a left-turn and right-turn lane. The traffic organization at intersection No. 3 is shown in Figure 5.
During the measurements at the intersection, signaling programs with a cycle duration of 100 s (06:30–08:00) and 95 s (08:00–08:30) operated. The green signals had a duration of 35 s and 26 s, respectively.
Table 2 shows the results of traffic measurements at the intersections. The number of vehicles other than passenger cars was minimum. During the research, the influence of the type of vehicles on the results was not considered. Vehicles other than passenger cars were not analyzed.

2.3. Data Analysis

After the recordings were made, the material was divided according to the SCT function (on or off). Then, the recordings were prepared for analysis. The analysis was performed separately for each of the recorded parameters:
  • respect for the red signal by drivers,
  • headway during vehicle column start-up,
  • times of entering the intersection after the end of the green signal.
Statistical data analysis was performed using the R system [90,91]. The charts were prepared using the ggplot2 package [92,93]. The methodological steps of data analysis are shown in Figure 6.

2.4. Other Methods Used for SCT Research

The following simplified formula is used in traffic modeling computer programs such as Synchro [94] and Transyt to analyze fuel consumption:
F = T o t a l T r a v e l · k 1 + T o t a l D e l a y · k 2 + S t o p s · k 3
where: k 1 = 0.075283 0.0015892 · S p e e d + 0.000015066 · S p e e d 2 , k2 = 0.7329, k 3 = 0.0000061411 · S p e e d 2 , F = fuel consumed in gallons, Speed = cruise speed in mph, TotalTravel = vehicle miles traveled, TotalDelay = total signal delay in hours, Stops = total stops in vehicles per hour. Measurements in metric units were converted to imperial units. Based on fuel consumption, it was also possible to estimate the emission of pollutants CO, NOx, and VOC.
Parameters such as Delay and Stops are strictly related to the way traffic lights function [95]. An analysis of the SCT literature showed that they may have a potential impact on factors influencing fuel consumption (Table 1):
  • headway/saturation flow,
  • vehicle speed,
  • start-up lost time.
An analysis of the research subject matter showed that many of the problems related to SCTs have not yet been investigated. Many road authorities are not aware of the risks associated with the use of SCTs.
The use of SCT in traffic-actuated control reduces the effectiveness of traffic control. The use of long countdown times makes it impossible to shorten this time at any time and speed up the passage a road user. However, it could be possible for traffic reasons, for example, when the vehicle stream has ended at one of the approaches. A display of the phase duration is only possible with fixed-time control. This solution was adopted in [9]. However, there are known cases of disabling traffic-actuated control and working in the fixed-time control mode because of an SCT installation. Such a situation should be assessed unfavorably due to control efficiency in off-peak hours. Although some studies indicate a slight improvement in control efficiency locally by reduction of headway [20,22,23,28], and globally [65], there are no comparative studies between fixed-time control with SCT vs. actuated control. It is particularly interesting how the change of control would affect efficiency in a period of lower traffic and using algorithms with priority for public transport. The use of such algorithms allows shorter travel times, but also benefits in terms of energy consumption [96]. Problems with displayed time values may also occur with fixed-time signaling due to offsets changing during the exchange of signaling plans on coordinated arterial roads. The use of SCT requires developing special control programs and extension of the time of offsets. It is also impossible to display the values on the SCT in the case of control algorithms allowing for the extension of a certain phase without time limits (until a notification occurs). An example of such signaling is the all-red algorithm and the “return of green signal to the main road”.
Efficiency of control, depending on the SCT solution used, can be tested using simulation methods. It is possible to analyze the countdown of all signals, only selected ones, or to limit the countdown period. Such methods make it possible to determine the number of implementations of a given phase and its duration depending on road conditions. This allows assessing the impact of additional control limits on measures of effectiveness.
Additionally, ref. [3] specified in Art. 23, that “Subject to the provisions of paragraph 12 of this Article, the only lights which may be used as light signals for regulating vehicle traffic, other than those intended solely for public transport vehicles, are the following (…)”. Use of an SCT is, therefore, contrary to the provisions laid down by the signatories of this Convention.
The behavior of road users in an SCT failure mode situation is completely unexplored. Such situations include the shortening of the signal (red or green) in relation to the displayed time, as well as lengthening of these signals with respect to the time displayed on the SCT. A failure mode may also occur in the event of bulb burnout or other failures of the traffic control system. In this case, the signaling is switched to a flashing amber signal. This seems to be the most dangerous situation when using a GSCT. The driver assumes they will pass the intersection on a green signal, while due to a signal failure, they must give way to pedestrians or vehicles. The behavior of other road users must also be considered, such as braking, or an attempt to drive through the intersection during a signal failure. Traffic lights are derived from the signals used on railways, where the priority is traffic safety in the event of a failure [97]. Similarly, in the case of road traffic, the introduction of a new solution in traffic control should be preceded by detailed tests of traffic lights in failure mode situations.
The behavior of drivers causing crashes, or forcing other road users to avoid collisions, is very rare, since this is possible only through monitoring systems. It is necessary to record SCT indications, signals of traffic lights, and vehicle traffic. Such recordings can be analyzed as a case study. The number of crashes on a single intersection is usually low, which does not allow for statistical analysis. A case study of a road incident is presented in this article.
Scientists must consider that the benefits of an SCT can be assessed in different ways, e.g., by extending the red and amber signal to 2 s. Such a signal was used in Poland in the years 1990–1994 [98]. Similarly, the amber signal could also be extended. In the years 1990–2003, the amber signal in Poland had a duration depending on road speed. In the case of the green signal for trams, this can be extended if there is a tram in the dilemma zone. Such a solution is used in Warsaw, e.g., at the intersection of Marymoncka and Zabłocińska streets.

3. Results

3.1. Respect for the Red Signal by Drivers

During the measurements, the number of vehicles crossing the intersection was determined. Then, the number of vehicles passing during individual signals was monitored and broken down into:
  • green signal—correct behavior,
  • amber signal—the passage is allowed, if the vehicle is close to the stop line, it is beneficial to reduce the number of crossings on this signal,
  • red signal (entries after the amber signal)—incorrect behavior,
  • red signal with amber (entries before the green signal)—wrong behavior.
The proportion of particular behaviors were determined in relation to the number of all crossings through the intersection. The results are presented in Figure 7. The results are divided into individual intersections and the SCT status (On/Off). It should be noted that for the turned-off SCTs, not a single red-amber signal entry was recorded. For intersections No. 1 and No. 2, the proportion of entries on the green signal decreased after switching on the SCT, while for intersection No. 3, it increased. However, the proportion of entries both on red and red with amber signals increased for this intersection. At all intersections, the percentage of entries during the amber signal decreased.

3.2. Headway

Based on video recordings, the times of entry of subsequent vehicles from the queue were marked. The time of entry of the first vehicle was determined from the time of displaying the green signal to crossing the stop line. The mean values of the headway are presented in Figure 8.
In the chart, the number of the intersection is highlighted by color, and the RSCT status is marked with a symbol. The vehicle number in the queue is shown on the horizontal axis. Additionally, the following ranges are presented using background color:
  • red background—minimum and maximum values from the measurements presented in the literature with the RSCT disabled;
  • blue background—minimum and maximum values from the measurements presented in the literature with the RSCT enabled;
  • yellow background—80% confidence interval (0.1 quantile–0.9 quantile) from the studies for intersections in Poland presented in [99].

3.3. Amber Light Running

For vehicles entering the intersection after the end of the green signal, the time from the end of the green signal was recorded. The results were broken down into intersections and GSCT status. The distribution of entry times is presented in Figure 9.
Additionally, for the entire population of registered entries after the end of the red signal, a histogram of the entry time measured from the end of the green signal was developed, as shown in Figure 10. Both graphs show the moment of the signal change to red. The red color refers to the situation with the GSCT turned off, and blue color with the GSCT turned on.

3.4. Fuel Consumption Analysis

For fuel consumption analysis, a simplified model of intersection No. 3 in the Synchro 7 program was prepared [94] (Figure 11).
With the use of this model, calculations of the efficiency indicators related to fuel consumption were made:
  • headway/saturation flow;
  • total delay;
  • stops;
  • average speed;
  • consumed fuel;
Results of the analysis are presented in Section 4.5 (Discussion section).

3.5. Case Study of a Road Crash on an Intersection with SCT

Some of the SCTs installed at intersections in Poland work independently of other devices of this type and are not connected to the signal controller. The SCT analyzes the displayed signals from the signal cable, calculates the signals’ duration, and then displays the values in the next cycle on this basis. This device is only intended for fixed-time control. The principle of operation of such a device results in displaying erroneous indications in the event of a change in the duration of signals. Such changes take place, for example, when the signaling program is changed. A case study of a road crash with such a mechanism in Szczecin (Poland) is presented below. The event took place in 2016 at the intersection of Niepodległości Avenue and Żołnierza Polskiego Square. SCTs with an RSCT function and a GSCT were installed on both intersection approaches, located on mast arms to the right of the signals.
Before the event, approach A SCT had counted green, and approach B SCT had counted red (Figure 12a). After reaching the duration of the green signal, as in the previous cycle, the GSCT at approach A was off, while the green signal continued, most likely due to a change in the signaling program. At approach B, there was a countdown for the RSCT. There was little traffic at approach A (Figure 12b).
After counting down the RSCT time at approach B, the vehicles started to move even though the signal heads were showing a red signal (Figure 12c). This could be caused by too early a start, when the RSCT was displaying, for example, 1 s to display a green signal, or the situation described in [66], indicating that more drivers, before starting, were watching the RSCT than the actual signal head. As a consequence of such driver behavior and the way the SCT functioned at the intersection, a road accident occurred between the vehicle marked with a red arrow and the vehicle marked with a green arrow (Figure 12d).

4. Discussion

4.1. Influence of SCT on Driver’s Behavior

If the SCT is installed and working at the intersection, the driver has more information about the working of traffic lights. The hypothesis is that SCTs influence the behavior of drivers. Devices have been installed in Płock since 2011 (six years before conducting the study). This means that the drivers moving around the city already had learned the daily rules by which these devices operate. The SCT in Płock turned off 5 s before the beginning of the red signal. The day-to-day tests increased the value of the obtained data under similar road conditions.

4.2. Red Light Violation

The first issue examined was the proportion of vehicles crossing during a signal other than green (Figure 6). After switching on the SCT at intersections 1 and 2, the number of vehicles crossing on other signals than green increased. On the other hand, at junction 3, the opposite situation was observed. When analyzing this situation in more detail, it was noticed that in all cases, after switching on the GSCT, the number of vehicles entering an intersection on the amber signal decreased. This is consistent with other research [12,38,44,47]. The results of the research on the red and amber signal are similarly confirmed by previous studies [26,30,31,37,38,39,40,47]. An increase in the number of entries during the red and amber signals was also observed in Płock. No such cases were observed with the RSCT turned off, but they occurred at each intersection with the RSCT turned on. The increased proportion of crossing on the green signal at intersection No. 3 can be explained by the large proportion of entries on the amber signal with the GSCT turned off. The improvement of the results at intersection No. 3 is mainly due to the reduction of a large number of entries during the amber signal.

4.3. Headways

In the case of headways measurements (Figure 8), the following phenomena were observed:
  • The recorded headways were quite high in comparison to other studies. For all intersections, they were around the maximum values recorded in other studies for RSCT off, and above the values recorded in other studies for RSCT turned on [12,14,68].
  • The headway values were exceptionally high for intersection No. 2. In other studies, conducted at Polish intersections, they did not fall within the 80% confidence interval (0.1 quantile–0.9 quantile) [99].
  • At intersections No. 1 and No. 2, no significant changes in headway were observed whether the RSCT was turned on or off.
  • A reduction in headway and, consequently, an increase in saturation flow and capacity was observed only at intersection No. 2.
Exceptionally high headway values for junction No. 2 were most likely because there were no marked lanes at the 5.8 m wide approach, which increases the headway and significantly impacts capacity; this was taken into account in the capacity calculation methods [95]. Headways for subsequent vehicles decreased according to a similar pattern at other intersections, but these were much higher values than those recorded at different intersections. Intersection No. 2 is also located outside of the network of national and provincial roads.
The headway values at intersections No. 1 and No. 3 were also high compared to foreign surveys [12,14,68], and higher than the values recorded during other surveys carried out in Warsaw (the capital of Poland). They are above the median for studies conducted in Polish cities, similar to the results obtained at rural intersections [99]. A possible reason is the size of the city of Płock and the length of the trip related to it. Studies conducted outside Poland were often conducted in metropolises with a population of millions, such as Bangkok [30], Shanghai [21], Kuala Lumpur [19,20], Kayseri [12], Sydney [69], and New Dehli [46], but Płock has only 120,000 inhabitants and is a county city.
Improvement of traffic conditions after the use of RSCT was observed only at intersection No. 3. This is consistent with the results of studies presented in the literature (11 cases of no effect [19,21,24,25,26,30,31,32,34,38,61] and four cases of improvement [20,22,23,28]). Improvement was observed only at the largest of the examined intersections.

4.4. Entering after the Green Signal

The boxplot analysis (Figure 9) with the green signal entry times indicates that the median time decreased after the application of a GSCT (intersection No. 1 and No. 2) or remained the same (intersection No. 3). For intersections No. 1 and No. 3, the maximum values of these times increased, which is an unfavorable situation. The speed of the vehicles was not recorded in our study, but this situation may be related to an increase in speed at the inlets equipped with GSCTs, which was observed in previous research: [12,37,44,46,48]. For intersection No. 2, the number of registered entries after the green signal was only two, which does not allow statistical analysis. At that intersection, there was the lowest traffic volume among the examined intersections.
The chi-square (Pearson) test for compliance with a normal distribution was performed for the data. The test results for individual populations are presented in Table 3.
p-Value < 0.05 indicates that the population is likely not normally distributed. For this reason, the comparison of the distribution of entry times was carried out using the nonparametric Wilcoxon-Mann-Whitney test. The results are presented in Table 4.
The test results show no indication of a shift between the distributions of entry with GSCT on and GSCT off. However, there is a noticeable shift in the modal value of the distribution to the right for the situation with the SCT off (Figure 10).

4.5. Change in Fuel Consumption during Use of SCT

The effect of saturation flow on the road capacity, and consequent fuel consumption, was direct. Studies in 11 cases indicated that the use of SCT does not affect saturation flow. Research made by the Faculty of Transport at Warsaw University of Technology indicated that such an impact only occurs in Płock at one intersection out of three. Only four studies [20,22,23,28] showed an improvement in capacity. Typical initial saturation flow values, depending on the capacity calculation method, were 1700–1900 veh./h. In the research, the speed of vehicles was measured at intersections or directly before them. However, the average speed over a longer distance and maintaining a constant speed significantly impacts fuel consumption. Therefore, it is not possible to conclude the effect of the SCT on fuel consumption based on these measurements.
On the other hand, start-up lost time applies only to the first vehicle in the queue. The effect on increasing the capacity and, consequently, on fuel consumption is smaller the longer the time of the green signal. For intersection No. 3, an analysis of the impact of the headway change on indicators related to fuel consumption was carried out. The analysis included vehicles in the 4th–9th position in the queue due to the large variation in the headway in the initial period of the green signal. Stabilization of saturation flow during start-up of the vehicle column is a typical phenomenon. For the situation with SCT turned off, the mean headway was 2.24 s, and with the SCT turned on was 2.04 s. This corresponds to a saturation flow 1607 veh./h and 1764 veh./h (for one lane), respectively. However, these are the actual values of saturation flow, considering inter alia, lane width, heavy vehicle occurrence, approach inclination and lane position. For analytical needs, the change of the starting saturation flow in the range of 1600–2000 veh./h was modeled. For such data, selected measures of effectiveness were calculated using the Synchro program. The results are presented in Table 5.
The results presented in the table refer to the fuel consumption of all vehicles in the model within the intersection with inflow sections. The results are the sum of all four approaches, not only for the SCT test approach. They show that reducing the headway (and consequently increasing the saturation flow) has a beneficial effect on fuel consumption. However, this effect was observed only at one of the three examined intersections. Similarly, headway variability occurs between different surveys, as shown in Figure 8.

4.6. Threats Resulting from Improper Operation of the SCT: A Case Study

A published regulation [9] introduced safety requirements for SCT use including device operation supervision and switching off signaling in a failure mode. Switching off the SCT should take place within 0.3 s from the occurrence of a failure mode situation. However, the lack of a displayed value on the SCT, also in a failure mode, may contribute to the occurrence of a road accident. It should be considered whether it is not justified to switch the signaling to the warning operation mode (amber flashing signal) in the case of SCT failure and then start the signaling with the SCT turned off.
Since the introduction of the regulations stated in [9], the number of SCTs installed in Poland has decreased, as the offered products did not meet the new requirements. SCT supervision within standards [100,101] compliant with national requirements is quite complex. This requires designing the device and communication with the controller from scratch.

5. Conclusions

Based on the conducted research, it is impossible to state unequivocally that the use of SCTs is beneficial for road traffic safety and efficiency. It has been observed that SCTs increase the number of red-light violations (crossing after the end of the amber signal) and on the red-amber signal. This is a negative situation and is confirmed by other studies. On the other hand, the number of crossings on the amber signal with SCTs is lower, which is also consistent with the conclusions of other studies. The modal value of the distribution of vehicle entry times after the end of the green signal with the GSCT turned on is shifted to the left, but the tests performed do not indicate that the shift of the entire distribution is statistically significant. The study results show that the impact of SCTs on the effectiveness of traffic control depends on the geometry of the intersection. The literature review also indicates that the use of SCTs results in reduction of start-up lost time (positive impact) and increases vehicle speed (negative impact). Just as the effect of using an SCT on efficiency varies, the effect on fuel consumption can vary. If the MOEs improve in a given situation, it is also possible to observe a reduction in fuel consumption. It should be noted that assistive steering devices are positively assessed, but confidence in them varies from country to country [102]. In the event of their use, particular attention should be paid to the intelligibility of the messages conveyed.
The limitations of the study are the short measurement period and the date of research (during holidays), due to the consent of the road administration to turn off the SCT. Other limitations include conducting the study in a medium-sized city on roads with an urban traffic and a small number of heavy goods vehicles. Further tests on approaches with long queues are advisable to ensure more significant measurements. Research should also be carried out in larger cities and on rural roads, especially national roads.
The conclusions of the article can be addressed to various stakeholders. It is important for drivers to be aware that they should always follow the indications of the signal heads, not the SCT. There are known situations where the indications of these two devices are divergent, which can cause road crashes. Road authorities and local authorities need to point out that the use of SCTs does not always bring the expected effect. For road traffic engineers, it is important to know the impact of SCT on traffic safety and control effectiveness. This allows assessment of the SCT impact on traffic and making a rational decision whether or not to use an SCT. Research shows that an SCT does not always fulfill its role in improving road safety and control efficiency.
Other unexplored problems are associated with SCT use related to drivers’ behavior on intersections with traffic lights functioning in a failure mode. The case study shows that such a situation may be an indirect cause or a factor contributing to a road accident. For ethical reasons, these issues must be investigated safely. This is not possible in regular road traffic. Such situations can only be tested with a vehicle simulator.

Author Contributions

Conceptualization, T.K. and J.S.; data curation, T.K. and K.F.; methodology, T.K. and J.S.; visualization, T.K.; writing—original draft, T.K. and K.F.; writing—review & editing, T.K., K.F., M.C. and J.S. All authors have read and agreed to the published version of the manuscript.

Funding

This research was funded by Warsaw University of Technology.

Institutional Review Board Statement

Not applicable.

Informed Consent Statement

Not applicable.

Data Availability Statement

The data presented in this study are available on request from the corresponding author. The data are not publicly available due to privacy issues.

Acknowledgments

The authors would like to thank Agata Krezyman and Kamil Gąska for making video recordings and for work put into their analysis. The authors would like to thank the initiator of this research Marek Buda, who passed away in 2017. Thanks also to the Office of the City of Plock for agreeing to conduct the research.

Conflicts of Interest

The authors declare no conflict of interest.

References

  1. The History and Meaning of Colored Traffic Lights. Available online: https://www.idrivesafely.com/defensive-driving/trending/history-and-meaning-colored-traffic-lights (accessed on 24 June 2021).
  2. Convention on Road Traffic Geneva, 19 September 1949. In Proceedings of the United Nations Conference on Road and Motor Transport; Geneva, Switzerland, Geneva, Switzerland, 28 August–19 September 1949; Available online: https://treaties.un.org/doc/Treaties/1952/03/19520326%2003-36%20PM/Ch_XI_B_1_2_3.pdf (accessed on 15 June 2021).
  3. Convention on Road Signs and Signals Done at Vienna on 8 November 1968. In In Proceedings of the United Nations Economic and Social Council Conference on Road Traffic, Austria, Vienna, 7 October–8 November 1968; Available online: https://treaties.un.org/doc/Treaties/1978/06/19780606%2000-35%20AM/CTC-xi-b-20-searchable.pdf (accessed on 15 June 2021).
  4. Tomczuk, P.; Chrzanowicz, M.; Mackun, T.; Budzyński, M. Analysis of the Results of the Audit of Lighting Parameters at Pedestrian Crossings in Warsaw. Arch. Transp. 2021, 59, 21–39. [Google Scholar] [CrossRef]
  5. Magyari, Z.; Koren, C.; Kieć, M.; Borsos, A. Sight Discances at Unsignalized Intersections: A Comparison of Guidelines and Requirements for Human Drivers and Autonomous Vehicle. Arch. Transp. 2021, 59, 7–19. [Google Scholar] [CrossRef]
  6. Budzynski, M.; Tubis, A.; Rydlewski, M. Preliminary Safety Assesment of Polish Interchanges. Arch. Transp. 2021, 58, 99–113. [Google Scholar] [CrossRef]
  7. Budzynski, M.; Gobis, A.; Guminska, L.; Jelinski, L.; Kiec, M.; Tomczuk, P. Assessment of the Influence of Road Infrastructure Parameters on the Behaviour of Drivers and Pedestrians in Pedestrian Crossing Areas. Energies 2021, 14, 3559. [Google Scholar] [CrossRef]
  8. Ostrowski, K.; Budzynski, M. Measures of Functional Reliability of Two-Lane Highways. Energies 2021, 14, 4577. [Google Scholar] [CrossRef]
  9. Ordinance of the Minister of Infrastructure and Construction of May 24, 2017 Amending the Ordinance on Detailed Technical Conditions for Road Signs and Signals and Road Safety Devices and the Conditions for Their Placement on Roads; Journal Of Laws 2017; Item 1062; Ministry of Infrastructure and Construction: Warsaw, Poland, 2017. Available online: http://isap.sejm.gov.pl/isap.nsf/download.xsp/WDU20170001062/O/D20171062.pdf (accessed on 15 June 2021). (In Polish)
  10. Gazis, D.; Herman, R.; Maradudin, A. The Problem of Amber Signal Light in Traffic Flow. Oper. Res. 1960, 8, 112–132. [Google Scholar] [CrossRef]
  11. Bąk, R. Ocena Wpływu Strefy Dylematu Na Bezpieczeństwo Ruchu Na Skrzyżowaniach z Sygnalizacją Świetlną Za Pomocą Miar Pośrednich; Politechnika Krakowska, Wydział Inżynierii Lądowej: Kraków, Poland, 2017. [Google Scholar]
  12. Fujita, M.; Suzuki, K.; Yilmaz, C. Behavior and Consciousness Analyses on Effect of Traffic Signals Including Countdown Device for Vehicles. J. East. Asia Soc. Transp. Stud. 2007, 7, 2289–2304. [Google Scholar] [CrossRef]
  13. Retting, R.; Williams, A.; Greene, M. Red-Light Running and Sensible Countermeasures: Summary of Research Findings. Transp. Res. Rec. 1998, 1640, 23–26. [Google Scholar] [CrossRef]
  14. Krukowicz, T. Liczniki czasu w sygnalizacji drogowej—za i przeciw ich stosowaniu. TTS Tech. Transp. Szyn. 2013, 20, 1337–1343. [Google Scholar]
  15. Buda, M.; Folwarski, T.; Krukowicz, T. Problemy stosowania liczników czasu w drogowej sygnalizacji świetlnej. Transp. Miej. I Reg. 2016, 9, 3–10. [Google Scholar]
  16. Wengel, M. Countdown Timers at Intersections with Traffic Lights—Evaluation of the Regulation Journal of Laws of 31.5.2017 Item 1062. Arch. Motoryz. 2018, 80, 115–126. [Google Scholar] [CrossRef]
  17. Miłaszewicz, B. The Issue of Using Countdown Timers at Intersections with Traffic Lights: A Literature Review; IEEE: Casta, Slovakia, 2018. [Google Scholar]
  18. Sobota, A.; Karoń, G.; Żochowska, R.; Kłos, M. Methodology for Research on Traffic Safety at Signalized Intersections with Countdown Timers. Sci. J. Sil. Univ. Technol. Ser. Transp. 2018, 100, 191–201. [Google Scholar] [CrossRef]
  19. Kidwai, F.A.; Ibrahim, M.R.; Karim, M. Traffic Flow Analysis of Digital Count down Signalized Urban Intersection. Proc. East. Asia Soc. Transp. Stud. 2005, 5, 1301–1308. [Google Scholar]
  20. Ibrahim, M.R.; Karim, M.; Kidwai, F. The Effect of Digital Count-Down Display on Signalized Junction Performance. Am. J. Appl. Sci. 2008, 5, 479–482. [Google Scholar] [CrossRef]
  21. Raksuntorn, W. The Effects of Countdown Signals on Intersection Capacity. Int. Trans. J. Eng. Manag. Appl. Sci. Technol. 2012, 3, 159–165. [Google Scholar]
  22. Sharma, A.; Vanajakshi, L.; Rao, N. Effect of Phase Countdown Timers on Queue Discharge Characteristics under Heterogeneous Traffic Conditions. Transp. Res. Rec. 2009, 2130, 93–100. [Google Scholar] [CrossRef] [Green Version]
  23. Wenbo, S.; Zhaocheng, H.; Xi, X.; Feifei, X. Exploring Impacts of Countdown Timers on Queue Discharge Characteristics of Through Movement at Signalized Intersections. Procedia-Soc. Behav. Sci. 2013, 96, 255–264. [Google Scholar] [CrossRef] [Green Version]
  24. Spigolon, L.; Bezerra, B.; Bastos, J.T.; Ferraz, A.; Battistelle, R. Comparison between Common Traffic Lights and Three Types of Traffic Lights with Visual Cycle—A Safety and Capacity Analysis. J. Transp. Lit. 2015, 9, 5–9. [Google Scholar] [CrossRef] [Green Version]
  25. Limanond, T.; Chookerd, S.; Roubtonglang, N. Effects of Countdown Timers on Queue Discharge Characteristics of through Movement at a Signalized Intersection. Transp. Res. Part C Emerg. Technol. 2009, 17, 662–671. [Google Scholar] [CrossRef]
  26. Biswas, S.; Ghosh, I.; Chandra, S. Influence of Signal Countdown Timer on Efficiency and Safety at Signalized Intersections. Can. J. Civ. Eng. 2017, 44, 308–318. [Google Scholar] [CrossRef] [Green Version]
  27. Li, K.; Dong, S.; Sun, J.; Yu, X. Study on the Influence of Signal Countdown Device on Traffic Safety of Intersections. In Proceedings of the 2009 International Conference on Measuring Technology and Mechatronics Automation, Zhangjiajie, China, 11–12 April 2009. [Google Scholar] [CrossRef]
  28. Yu, K.; Fujita, M.; Suzuki, K. Behavior Analysis of Vehicle Starts under Countdown-Type Traffic Signal through Survey in China. World Acad. Sci. Eng. Technol. 2011, 58, 250–255. [Google Scholar]
  29. Lum, K.M.; Halim, H. A Before-and-after Study on Green Signal Countdown Device Installation. Transp. Res. Part F Traffic Psychol. Behav. 2006, 9, 29–41. [Google Scholar] [CrossRef]
  30. Limanond, T.; Prabjabok, P.; Tippayawong, K. Exploring Impacts of Countdown Timers on Traffic Operations and Driver Behavior at a Signalized Intersection in Bangkok. Transp. Policy 2010, 17, 420–427. [Google Scholar] [CrossRef]
  31. Sharma, A.; Vanajakshi, L.; Girish, V.; Harshitha, M.S. Impact of Signal Timing Information on Safety and Efficiency of Signalized Intersections. J. Transp. Eng. 2012, 138, 467–478. [Google Scholar] [CrossRef] [Green Version]
  32. Biswas, S.; Ghosh, I.; Chandra, S. Effect of Countdown Timers on Traffic Characteristics and Driver Behaviors at Signalized Intersections. In Proceedings of the Conference Transportation Research Board 95th Annual, Washington, DC, USA, 10–14 January 2016. [Google Scholar]
  33. Elias, S.; Ghafurian, M.; Samuel, S. Effectiveness of Red-Light Running Countermeasures: A Systematic Review. In Proceedings of the 11th International Conference on Automotive User Interfaces and Interactive Vehicular Applications, New York, NY, USA, 21–25 September 2019; pp. 91–100. [Google Scholar]
  34. Jatoth, J.; Singh, N.; Mehar, A. Evaluating the Performance of Signalized Intersection with Signal Countdown Timer. Int. J. Intell. Transp. Syst. Res. 2020, 19, 180–190. [Google Scholar] [CrossRef]
  35. Kłos, M.J.; Sobota, A.; Żochowska, R.; Karoń, G. Effects of Countdown Timers on Traffic Safety at Signalized Intersections. Trans. Transp. Sci. 2020, 11, 19–27. [Google Scholar] [CrossRef]
  36. Pamuła, W.; Kłos, M.J. Evaluation of Changes in Drivers Behaviour Due to Introduction of Countdown Timers at Signalized Intersections Using UAV Data. In Nodes in Transport Networks—Research, Data Analysis and Modelling, Proceedings of 16th Scientific and Technical Conference “Transport Systems. Theory and Practice 2019”, Katowice, Poland, 16–18 September 2019; Springer: Cham, Switzerland, 2019; pp. 115–124. [Google Scholar]
  37. Papaioannou, P.; Politis, I. Preliminary Impact Analysis of Countdown Signal Timer Installations at Two Intersections in Greece. Procedia Eng. 2014, 84, 634–647. [Google Scholar] [CrossRef]
  38. Rijavec, R.; Zakovšek, J.; Maher, T. Acceptability of Countdown Signals at an Urban Signalized Intersection and Their Influence on Drivers Behaviour. Promet-Traffic Transp. 2013, 25, 63–71. [Google Scholar] [CrossRef]
  39. Rządkowski, Ł.; Lazarczyk, S. Report Signal Heads Countdown Timers Research into the Impact of Time Counters Remaining Until the Change of the Green Signal Displayed on the Traffic Light on Road Safety; Zarząd Dróg Miejskich: Grudziądz, Poland, 2014. (In Polish) [Google Scholar]
  40. Sobota, A.; Klos, M.J.; Karoń, G. The Influence of Countdown Timers on the Traffic Safety of Pedestrians and Vehicles at the Signalized Intersection. In Intelligent Transport Systems and Travel Behaviour, Proceedings of 13th Scientific and Technical Conference “Transport Systems. Theory and Practice 2016”, Katowice, Poland, 19–21 September 2016; Sierpiński, G., Ed.; Springer International Publishing: Cham, Switzerland, 2017; pp. 13–21. [Google Scholar]
  41. Huey, S.; Ragland, D. Changes in Driver Behavior Resulting from Pedestrian Countdown Signals; University of California: Berkeley, CA, USA, 2007. [Google Scholar]
  42. Long, K.; Han, L.D.; Yang, Q. Effects of Countdown Timers on Driver Behavior after the Yellow Onset at Chinese Intersections. Traffic Inj. Prev. 2011, 12, 538–544. [Google Scholar] [CrossRef] [PubMed]
  43. Long, K.; Liu, Y.; Han, L.D. Impact of Countdown Timer on Driving Maneuvers after the Yellow Onset at Signalized Intersections: An Empirical Study in Changsha, China. Saf. Sci. 2013, 54, 8–16. [Google Scholar] [CrossRef]
  44. Fu, C.; Zhang, Y.; Peng, T. Effects of Countdown Timer on Yellow Light Running: An Empirical Study. J. Traffic Logist. Eng. 2015, 3. [Google Scholar] [CrossRef]
  45. Abioye, O. Evaluation of the Usage of Pedestrian Countdown Signals at Intersections; FAMU-FSU College of Engineering, Department of Civil Engineering: Tallahassee, FL, USA, 2016. [Google Scholar]
  46. Devalla, J.; Biswas, S.; Ghosh, I. The Effect of Countdown Timer on the Approach Speed at Signalised Intersections. Procedia Comput. Sci. 2015, 52, 920–925. [Google Scholar] [CrossRef] [Green Version]
  47. Felicio, G.P.; Grepo, L.C.; Reyes, V.F.; Yupingkun, L.C. Traffic Light Displays and Driver Behaviors: A Case Study. Procedia Manuf. 2015, 3, 3266–3273. [Google Scholar] [CrossRef]
  48. Wu, W.; Juan, Z.; Jia, H. Drivers’ Behavioral Decision-Making at Signalized Intersection with Countdown Display Unit. Syst. Eng. Theory Pract. 2009, 29, 160–165. [Google Scholar] [CrossRef]
  49. Huang, M.; Fujita, M.; Wisetjindawat, W. Countdown Timers, Video Surveillance and Drivers’ Stop/Go Behavior: Winter versus Summer. Accid. Anal. Prev. 2017, 98, 185–197. [Google Scholar] [CrossRef]
  50. Islam, M.R.; Wyman, A.A.; Hurwitz, D.S. Safer Driver Responses at Intersections with Green Signal Countdown Timers. Transp. Res. Part F Traffic Psychol. Behav. 2017, 51, 1–13. [Google Scholar] [CrossRef]
  51. Yu, S.; Shi, Z. Analysis of Car-Following Behaviors Considering the Green Signal Countdown Device. Nonlinear Dyn. 2015, 82, 731–740. [Google Scholar] [CrossRef]
  52. Fu, C.; Zhang, Y.; Bie, Y.; Hu, L. Comparative Analysis of Driver’s Brake Perception-Reaction Time at Signalized Intersections with and without Countdown Timer Using Parametric Duration Models. Accid. Anal. Prev. 2016, 95, 448–460. [Google Scholar] [CrossRef] [PubMed]
  53. Huang, H.; Wang, D.; Zheng, L.; Li, X. Evaluating Time-Reminder Strategies before Amber: Common Signal, Green Flashing and Green Countdown. Accid. Anal. Prev. 2014, 71C, 248–260. [Google Scholar] [CrossRef]
  54. Fu, C.; Zhang, Y.; Qi, W.; Cheng, S. Effects of Digital Countdown Timer on Intersection Safety and Efficiency: A Systematic Review. Traffic Inj. Prev. 2016, 17, 98–103. [Google Scholar] [CrossRef] [PubMed]
  55. Kempa, J.; Bebyn, G. Wyświetlacze czasu na sygnalizatorach sygnalizacji świetlnej. Logistyka 2014, 6, 5364–5370. [Google Scholar]
  56. Kempa, J.; Bebyn, G. Doświadczenia z funkcjonowania wyświetlaczy czasu na sygnalizatorach w Toruniu. Logistyka 2014, 6, 5351–5355. [Google Scholar]
  57. Zielińska, L. Analysis of the Validity of Uing Time Counters at road Intersections with Traffic Lights on the Example of Słupsk. Transp. Miej. I Reg. 2017, 2, 23–26. (In Polish) [Google Scholar]
  58. Metelski, A. Analysis of Selected Methodological Problems Regarding the Examination of Traffic Events at Road Intersections. Arch. Automot. Eng.–Arch. Motoryz. 2018, 82, 75–85. [Google Scholar] [CrossRef]
  59. Małecki, K.; Iwan, S. Modeling Traffic Flow on Two-Lane Roads with Traffic Lights and Countdown Timer. Transp. Res. Procedia 2019, 39, 300–308. [Google Scholar] [CrossRef]
  60. Paul, M.; Ghosh, I. Influence of Green Signal Countdown Timer on Severe Crash Types at Signalized Intersections Due to Red Light Violations. Transp. Lett. 2020, 12, 528–539. [Google Scholar] [CrossRef]
  61. Chiou, Y.-C.; Chang, C.-H. Driver Responses to Green and Red Vehicular Signal Countdown Displays: Safety and Efficiency Aspects. Accid. Anal. Prev. 2010, 42, 1057–1065. [Google Scholar] [CrossRef] [PubMed]
  62. Pan, F.; Zhang, L.; Ma, C.; Li, H.; Yang, J.; Liu, T.; Wang, F.; Chai, S. Impact of Vehicular Countdown Signals on Driving Psychologies and Behaviors: Taking China as an Example. J. Adv. Transp. 2017, 2017, 5838520. [Google Scholar] [CrossRef] [Green Version]
  63. Frank, A.; Schneider, F.; Meschtscherjakov, A.; Stadon, J. Advanced Traffic Light Interface: Countdown Timers to Increase User Experience. In Proceedings of the Adjunct Proceedings of the 7th International Conference on Automotive User Interfaces and Interactive Vehicular Applications, Nottingham, UK, 1–3 September 2015; pp. 56–61. [Google Scholar]
  64. PN-EN 12368:2015-07 Traffic Control Equipment—Signal Heads; Polish Committee for Standardization: Warsaw, Poland, 2015.
  65. Kim, M.; Kim, H.K. Investigation of Environmental Benefits of Traffic Signal Countdown Timers. Transp. Res. Part D Transp. Environ. 2020, 85, 102464. [Google Scholar] [CrossRef]
  66. Nygårdhs, S. Cyclists’ Adaptation to a Countdown Timer to Green Traffic Light: A before-after Field Study. Appl. Ergon. 2021, 90, 103278. [Google Scholar] [CrossRef] [PubMed]
  67. Long, X.; Zhou, M.; Zhao, H.; Song, Y. Pedestrian Crossing Decision during Flashing Green-Countdown Signal for Urban Signalized Intersection. J. Transp. Saf. Secur. 2021, 1–21. [Google Scholar] [CrossRef]
  68. Kim, K.W.; Kim, Y.; Seo, H.Y. An Evaluation of Pedestrian Countdown Signals. KSCE J. Civ. Eng. 2002, 6, 533–537. [Google Scholar] [CrossRef]
  69. Levasseur, M.; Brisbane, G. Trial of Pedestrian Countdown Timers—RTA—NSW Government; ARRB Group: Sydney, Australia, 2011. [Google Scholar]
  70. Cleaver, M.; Hislop, J.; Roos, M.; Fernandes, R.; Prendergast, M.; Brisbane, G.; McTiernan, D.; Levasseur, M. An Evaluation of Pedestrian Countdown Timers in the Sydney CBD. In Proceedings of the Australasian Road Safety Research, Policing and Education Conference 2011, Perth, WA, Australia, 6–9 November 2011. [Google Scholar]
  71. McTiernan, D.; Levasseur, M.; Brisbane, D. Pedestrian Countdown Timers—Two Australian Trial Methods and Results. In Proceedings of the 25th ARRB Conference, 2012, Perth, WA, Australia, 23 September 2012. [Google Scholar]
  72. Supernak, J.; Verma, V.; Supernak, I. Pedestrian Countdown Signals: What Impact on Safe Crossing? Open J. Civ. Eng. 2013, 3, 39–45. [Google Scholar] [CrossRef] [Green Version]
  73. Biswas, S.; Ghosh, I.; Chandra, S. Effect of Traffic Signal Countdown Timers on Pedestrian Crossings at Signalized Intersection. In Proceedings of the 3rd Conference of Transportation Research Group of India (3rd CTRG), Kolkata, West Bengal, India, 17–20 December 2015; Available online: https://www.researchgate.net/publication/311355751_Effect_of_traffic_signal_countdown_timers_on_pedestrian_crossings_at_signalized_intersection (accessed on 15 June 2021).
  74. Balwan, M.; Jaison, J.; Fellendorf, M. Impacts of Countdown Timers on Pedestrian Behavior—Case Study in UAE. J. Traffic Logist. Eng. 2017, 5, 2. [Google Scholar] [CrossRef]
  75. Ma, W.; Liao, D.; Bai, Y. Empirical Analysis of Countdown Signals on Pedestrian Behaviour. Proc. ICE-Transp. 2015, 168, 15–22. [Google Scholar] [CrossRef]
  76. Fu, L.; Zou, N. The Influence of Pedestrian Countdown Signals on Children’s Crossing Behavior at School Intersections. Accid. Anal. Prev. 2016, 94, 73–79. [Google Scholar] [CrossRef]
  77. Xiong, H.; Xiong, L.; Deng, X.; Wang, W. Evaluation of the Impact of Pedestrian Countdown Signals on Crossing Behavior. Adv. Mech. Eng. 2014, 6, 518295. [Google Scholar] [CrossRef]
  78. Anapali, I.; Basbas, S.; Nikiforiadis, A. Pedestrians’ Crossing Dilemma during the First Seconds of the Red-Light Phase. Soc. Sci. 2021, 10, 213. [Google Scholar] [CrossRef]
  79. Biswas, S.; Ghosh, I.; Chandra, S. Effect of Traffic Signal Countdown Timers on Pedestrian Crossings at Signalized Intersection. Transp. Dev. Econ. 2017, 3, 2. [Google Scholar] [CrossRef]
  80. Richmond, S.; Willan, A.; Rothman, L.; Camden, A.; Buliung, R.; Macarthur, C.; Howard, A. The Impact of Pedestrian Countdown Signals on Pedestrianemotor Vehicle Collisions: A Quasi-Experimental Study. Inj. Prev. 2014, 18, 155–158. [Google Scholar] [CrossRef] [PubMed] [Green Version]
  81. Pulugurtha, S.S.; Desai, A.; Pulugurtha, N.M. Are Pedestrian Countdown Signals Effective in Reducing Crashes? Traffic Inj. Prev. 2010, 11, 632–641. [Google Scholar] [CrossRef] [PubMed]
  82. Boateng, R.A.; Kwigizile, V.; Miller, J.S.; Oh, J.-S. A Justification for Pedestrian Countdown Signals at Signalized Intersections: The Safety Impact on Senior Motorists. J. Transp. Health 2019, 14, 100617. [Google Scholar] [CrossRef]
  83. Escott, B.G.; Richmond, S.A.; Willan, A.R.; Ravi, B.; Howard, A.W. The Impact of Pedestrian Countdown Signals on Single and Two Vehicle Motor Vehicle Collisions: A Quasi-Experimental Study. Int. J. Inj. Control Saf. Promot. 2017, 24, 429–434. [Google Scholar] [CrossRef] [PubMed]
  84. Boateng, R.A.; Kwigizile, V.; Oh, J.-S. A Comparison of Safety Benefits of Pedestrian Countdown Signals with and without Pushbuttons in Michigan. Traffic Inj. Prev. 2018, 19, 588–593. [Google Scholar] [CrossRef] [PubMed]
  85. Maric, B.; Lipovac, K.; Nešić, M.; Đerić, M. The Influence of a Countdown Display On Pedestrian Behavior at a Signalized Pedestrian Crossing Equipped with a Pedestrian Refuge Island. Transp. Res. Procedia 2021, 55, 1720–1728. [Google Scholar] [CrossRef]
  86. Amjadi, R. Safety Evaluation of Pedestrian Countdown Signals; FHWA: McLean, MA, USA, 2019. [Google Scholar]
  87. Königbauer, M. OSM Geofabrik Universal QML Style. Available online: https://github.com/mkoenigb/OSM-Geofabrik_Universal-QML-Style (accessed on 15 June 2021).
  88. Gąska, K. Wpływ Wyświetlaczy Czasu Na Podjęcie Decyzji o Hamowaniu Pojazdu; Politechnika Warszawska, Wydział Transportu: Warszawa, Poland, 2017. [Google Scholar]
  89. Krezyman, A. Wpływ Wyświetlaczy Czasu Na Rozruch Kolumny Pojazdów; Politechnika Warszawska, Wydział Transportu: Warszawa, Poland, 2017. [Google Scholar]
  90. R Core Team. R: A Language and Environment for Statistical Computing; R Foundation for Statistical Computing: Vienna, Austria, 2021; Available online: https://www.R-project.org/ (accessed on 15 June 2021).
  91. Long, J.; Teetor, P. R Cookbook, 2nd ed.; O’Reilly: Sebastopol, CA, USA, 2019; ISBN 978-0-596-80915-7. [Google Scholar]
  92. Wickham, H. Ggplot2: Elegant Graphics for Data Analysis; Springer: New York, NY, USA, 2016; ISBN 978-3-319-24277-4. [Google Scholar]
  93. Chang, W. R Graphics Cookbook, 2nd ed.; O’Reilly: Sebastopol, CA, USA, 2021; ISBN 978-1-4493-1695-2. [Google Scholar]
  94. Husch, D.; Albeck, J. Synchro Studio 7 Traffic Signal Software-User Guide; Trafficware: Sugar Land, TX, USA, 2006; ISBN 0-9742903-3-5. [Google Scholar]
  95. Highway Capacity Manual 2010; Transportation Research Board: Washington, DC, USA, 2010; Volumes 1–4, ISBN 978-0-309-16077-3.
  96. Czerepicki, A.; Krukowicz, T.; Górka, A.; Szustek, J. Traffic Light Priority for Trams in Warsaw as a Tool for Transport Policy and Reduction of Energy Consumption. Sustainability 2021, 13, 4180. [Google Scholar] [CrossRef]
  97. Szmel, D.; Zabłocki, W.; Ilczuk, P.; Kochan, A. Method for Selecting the Safety Integrity Level for the Control-Command and Signaling Functions. Sustainability 2019, 11, 7062. [Google Scholar] [CrossRef] [Green Version]
  98. Traffic Light Instruction, Annex 2 to the Ordinance of the Ministers of Transport and Maritime Economy and Internal Affairs of June 6, 1990; (M. P. 24 Poz. 184 z 1990 r.); Official Gazette of the Government of the Republic of Poland: Warsaw, Poland, 1990. (In Polish)
  99. Ostrowski, K.; Chodur, J. Charakterystyka Strumienia Ruchu w Początkowym Okresie Sygnału Zielonego Na Skrzyżowaniu z Sygnalizacją. Transp. Miej. I Reg. 2012, 5, 3–9. [Google Scholar]
  100. PN-EN 12675:2002 Traffic Signal Controllers—Functional Safety Requirements; Polish Committee for Standardization: Warsaw, Poland, 2002.
  101. PN-EN 50556:2011 Road Traffic Signal Systems; Polish Committee for Standardization: Warsaw, Poland, 2011.
  102. Alonso, F.; Faus, M.; Esteban, C.; Useche, S.A. Is There a Predisposition towards the Use of New Technologies within the Traffic Field of Emerging Countries? The Case of the Dominican Republic. Electronics 2021, 10, 1208. [Google Scholar] [CrossRef]
Figure 1. Signal Countdown Timer in Nowy Sącz, Poland (2016).
Energies 14 07081 g001
Figure 2. Location of measurement objects in the city of Płock. (Background map © OpenStreetMap contributors, [87]).
Energies 14 07081 g002
Figure 3. Traffic organization at intersection No. 1. (Background map Head Office of Geodesy and Cartography).
Energies 14 07081 g003
Figure 4. Traffic organization at intersection No. 2. (Background map Head Office of Geodesy and Cartography).
Energies 14 07081 g004
Figure 5. Traffic organization at intersection No. 3. (Background map Head Office of Geodesy and Cartography).
Energies 14 07081 g005
Figure 6. Flowchart of data analysis.
Energies 14 07081 g006
Figure 7. Percentage of vehicle entries on each signal.
Energies 14 07081 g007
Figure 8. Headways between vehicles during queue start (description of filled areas given in text).
Energies 14 07081 g008
Figure 9. Boxplots of the time of entry after the end of the green signal.
Energies 14 07081 g009
Figure 10. Histogram of entry times after the end of the green signal (data from all intersections).
Energies 14 07081 g010
Figure 11. Model of intersection No. 3 in Synchro 7 and SimTraffic.
Energies 14 07081 g011
Figure 12. Sequence of events related to the crash: (a) GSCT and RSCT at intersection approaches; (b) extinction of GSCT at approach A; (c) extinction of RSCT at approach B, early start of vehicles at approach B; (d) road accident. (Background map Main Office of Geodesy and Cartography).
Energies 14 07081 g012
Table 1. Summary of research results on SCT (set chronologically and divided into SCT for drivers and pedestrians).
BibliographyHeadway/Saturation Flow/CapacityStart-up Lost TimeRed light Violation before the Onset of Green SignalRed Light Violation at the Beginning of the Red SignalRLV at the Start of a Red -Long Time after Installing the GSCTEntering on Amber SignalVehicle SpeedBraking CharacteristicsDilemma ZoneNumber of CrashesPedestrian Reaction timePedestrians Passing on Flashing Green (or Amber or Flashing Don’t Walk) SignalPedestrian’s Red Light ViolationPedestrian SpeedNumber of Conflicts Vehicle-Pedestrian or Vehicle-VehicleDriver Reaction TimeGHG EmissionsAdjusting the Technique of Cycling to the SCT IndicationsOthers
[68] +
[41]
[69] 0 +0
[81] +
[70] +
[71] +
[75] ++ +
[72] 0
[80] 0 0
[77]
[73]
[76] 00+
[45] + +
[40] +0
[79] 0
[74] S
[83]
[84] 0
[86] +
[82] +
[85]
[67] L
[19]0 +
[29] +0
[12] + +
[20]+
[27] T
[48] +
[25]0+
[22]+
[61]0+0
[30]0+ S
[28]++
[42] +
[21]0+
[31]0++
[14] L
[38]0 + + S
[43]
[23]+
[55] S
[56] 0
[37] +
[53] C
[46] +
[47] + S
[44] +0
[63] C
[24]0 + C
[51] M
[15] L
[54] L
[32]0+ +
[52] +
[39]
[57] S
[49] +
[62] S
[26]0++
[50] ++
[16] L
[17] L
[18] L
[58] 0 L
[59] M
[36] +
[33] L
[65] +
[35] +
[60] +
[34]0+ +
[66]
No. of ‘+’411010041234130521100
No. of ‘0′11010101004021230000
No. of ‘− ‘0093036011073010010
Rating411−9701−52231−4−35111−10
Table 2. The volume of vehicles on intersections during the measurement period (2 h).
IntersectionVehicleVolume (per 2 h)
GSCT OffGSCT On
1Passenger cars707507
Trucks126
Buses105
Two-wheelers54
PCE753531
2Passenger cars272366
Trucks24
Buses911
Two-wheelers32
PCE297399
3Passenger cars564507
Trucks98
Buses53
Two-wheelers48
PCE593532
Table 3. Pearson test of compliance of travel times after the green signal.
Intersectionp-Value
GSCT OnGSCT Off
10.00066660.0316
2<2.2 × 10−160.9098
30.0025060.00177
Table 4. Pearson test of compliance of the travel times after the green signal with the GSCT on (ton) and off (toff).
Intersectionp-Value/Alternative Hypothesis
ton ≠ toffton < toffton > toff
10.35670.82890.1784
20.52970.77120.2648
30.80240.40120.6013
All data0.40130.80030.2006
Table 5. Fuel consumption at the intersection depending on the output saturation flow.
Saturation Flow
veh./h
Headway
s
Total Delay/vehicle
s/veh.
StopsAverage Speed
km/h
Fuel Consumed
L
16002.2540253622299
16502.1838252323294
17002.1237250523290
17502.0636248924286
18002.0035247024283
18501.9533245724280
19001.8933244225278
19501.8532243025275
20001.8031241625273
Publisher’s Note: MDPI stays neutral with regard to jurisdictional claims in published maps and institutional affiliations.

