Article

Design of a Pendulum Prototype for Dynamic Testing of Material Removal Using Picks

by
María-Belén Prendes-Gero
1,*,
Celestino González-Nicieza
1,
Covadonga Betegón-Biempica
2 and
Martina-Inmaculada Álvarez-Fernández
1
1
DinRock Group, University of Oviedo, 33003 Oviedo, Spain
2
Construction and Manufacturing Engineering Department, University of Oviedo, 33203 Gijón, Spain
*
Author to whom correspondence should be addressed.
Energies 2021, 14(20), 6831; https://doi.org/10.3390/en14206831
Submission received: 9 September 2021 / Revised: 11 October 2021 / Accepted: 13 October 2021 / Published: 19 October 2021
(This article belongs to the Special Issue Innovative Techniques in Underground Excavation)

Abstract

:
The need for large and fast excavations, together with noise and vibration limitations, means that mechanical removal is increasingly used rather than blasting. In mechanical removal, the cutting tools hit the rock and penetrate it, and then move in the direction of cutting, dragging and detaching a portion of rock called chip. Most research on mechanical removal approaches it as a static process without taking into account the speed at which the cutting element impacts the rock. This work presents the design of a pendulum equipment capable of simulating the impact of a cutting element, specifically a pick, against a rock, reproducing the removal in a similar way to how it is carried out in real excavations. Cutting tests are carried out with concrete samples with a cement/sand ratio of 1:1 and 3:1, the volume of material that is removed is calculated using a 3D scanner and images of the tests are collected with a high-speed video camera to facilitate the interpretation of the results. The results confirm the direct relationship between impact energy, chip size and cutting depth, prove the formation of an affected zone that allows to reduce the cutting energy, and empirically obtain the optimum cutting energy with which the maximum performance in mechanical removal would be achieved.

1. Introduction

In the removal of materials, situations such as limitations due to vibrations and noise, the cost of special blasting, or the management of explosives, mean that mechanical removal methods are increasingly used instead of the use of explosives [1]. In this case, the material removal process is similar for all machines and consists of applying mechanical energy to the rock by means of a cutting tool that causes the formation of chips that are subsequently removed.
Although there are different mechanical cutting tools, most of them are made up of picks [2] and it can even be said that the diamond particles contained in the segments of a cutting disc or diamond wire are picks on a microscopic scale. The picks, unlike other cutting tools, break rock by moving parallel to the face surface, applying less force and energy to remove the same volume than other cutting tools.
Among all the variables used to analyse the productivity and performance of cutting operations with picks, two stand out: the cutting force that determines the good operating conditions of the cutting tool and the specific energy or work required to extract a unit volume of rock.
The cutting force depends on the mechanical characteristics of the rock as demonstrated by the works of Evans [3,4], Gotkan [5] and Nishimatsu [6] considered as the basis of cutting theory. But it also depends on other factors such as the cutting depth or the interaction between consecutive grooves [7,8,9].
The specific energy is a function of the mechanical properties of the rock [10], the cutting depth [11,12] or the spacing between picks [13,14,15].
Numerous studies have been carried out to predict the cutting performance as a function of some of these parameters [16]. These works are based on laboratory tests [17], empirical models [18], theoretical models and numerical modelling [19,20,21]. However, although cutting rock tests are the most reliable methods for determining the cutting force [22], acceptable conditions of representativeness are not always available to carry them out correctly, which, together with their cost and problems of scale, mean that theoretical and empirical methods are widely used.
In any case, despite the progress made over several decades, cutting very resistant rocks requires excessive specific energy and has very high pick wear rates. In this sense, several investigations have been carried out to improve performance through actions on the face to be excavated, such as the use of water jets in cutting [23,24,25], the application of chemical agents on the rock to reduce its resistance [26,27,28] or the pre-stressing of the rocks before the action of the picks [29].
Most of these investigations focus on the friction of a rock against a pick without taking into account the movement of this pick, neglecting the dynamic aspect of the cutting, i.e., the speed with which the pick impacts on the rock.
This work presents an equipment, designed and built by the Dinrock research group, capable of simulating the impact of a pick against a rock, using a pendulum system. In this way, it is possible to reproduce the cutting process at the most indivisible scale (the removal of a chip), facilitating the observation, measurement and search for phenomena that improve the efficiency of the removal of material.
In the methodology section, the cutting process is described, indicating the different phases that take place in the starting process, as well as the different forces that are generated in the picks. Next, the two prototypes designed to simulate the dynamic process of the picks hitting the element to be removed are described: an initial small-scale prototype and a final prototype developed from the first and on a larger scale. The tests carried out on the initial prototype on cylindrical samples of limestone with simple compressive strength of 65 MPa and on cylindrical samples of concrete with a cement/sand ratio of 3:1 demonstrate the relationship between variables involved in cutting, such as the minimum energy required to remove a chip, the cutting depth and the angle of impact of the pick. The tests carried out with the final prototype are performed with mortars with cement/sand (c/s) ratios of 1:1 and 3:1 in order to avoid the heterogeneity of the rocks that hinder the understanding of the process. These results confirm the aforementioned relationship, the existence of an affected zone and an optimum impact energy.
Next, the existence of such and optimum impact energy is discusses by means of tests on concrete samples with a c/s ratio of 1:1 are documented with a high-speed camera. Finally, the conclusions of the work are collected.

2. Methodology

2.1. Cutting Process

The cutting process consists of different phases, which result in the formation of chips and in the formation of crushed elements of very fine granulometry:
  • Phase 1. Crushed zone formation. When the indenter hits the rock, this deforms beyond its elasticity limit. As the load increases, a zone of crushed rock is formed between the contact surface of the rock and the indenter [30,31].
  • Phase 2. Chipping formation. After the formation of the crushed zone, the load continues to increase and one or more chips are formed due to the propagation of lateral cracks under the tip of the indenter to the surface [32,33].
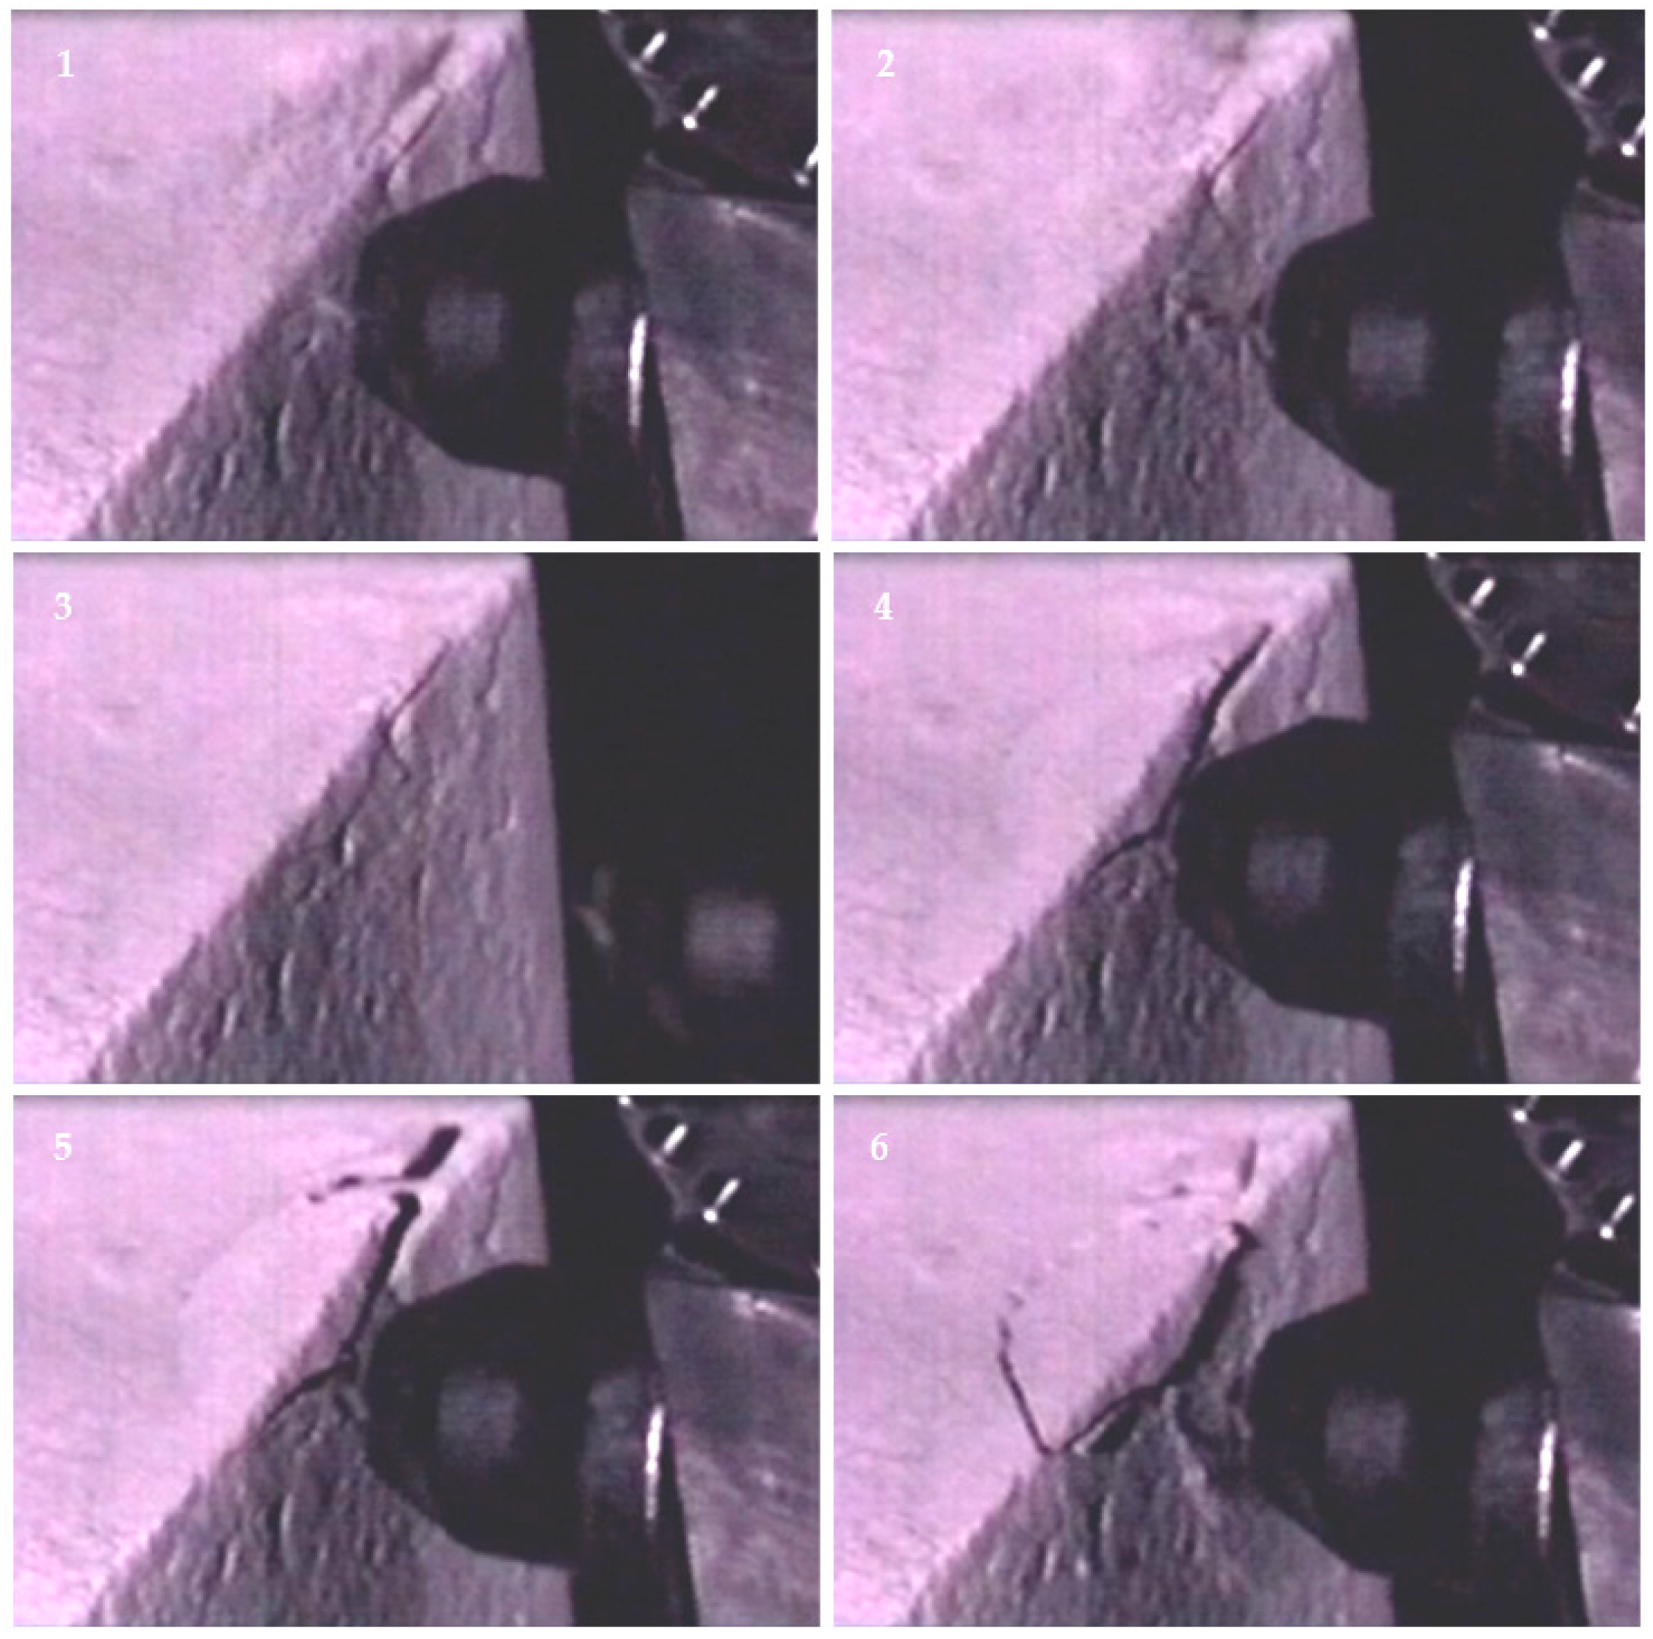
  • Phase 3. Second chipping formation. Once the chipping has occurred and the load has been removed, the rock expands. An elastic reversion of the rock occurs, reaching a brittle fracture mechanism, with almost no plastic deformation, creating new micro-cracks that propagate rapidly causing breakage and detachment of new rock chips [34].
These phases produce three distinct zones under the tip of the pick (Figure 1):
  • A base zone of crushed material or crushed zone.
  • A damaged or plastic zone where the micro-cracks generated in the crushed zone begin to propagate.
  • An elastic zone of intact material.
In addition, when the pick penetrates the rock, three orthogonal forces appear at the tip of the pick (Figure 2):
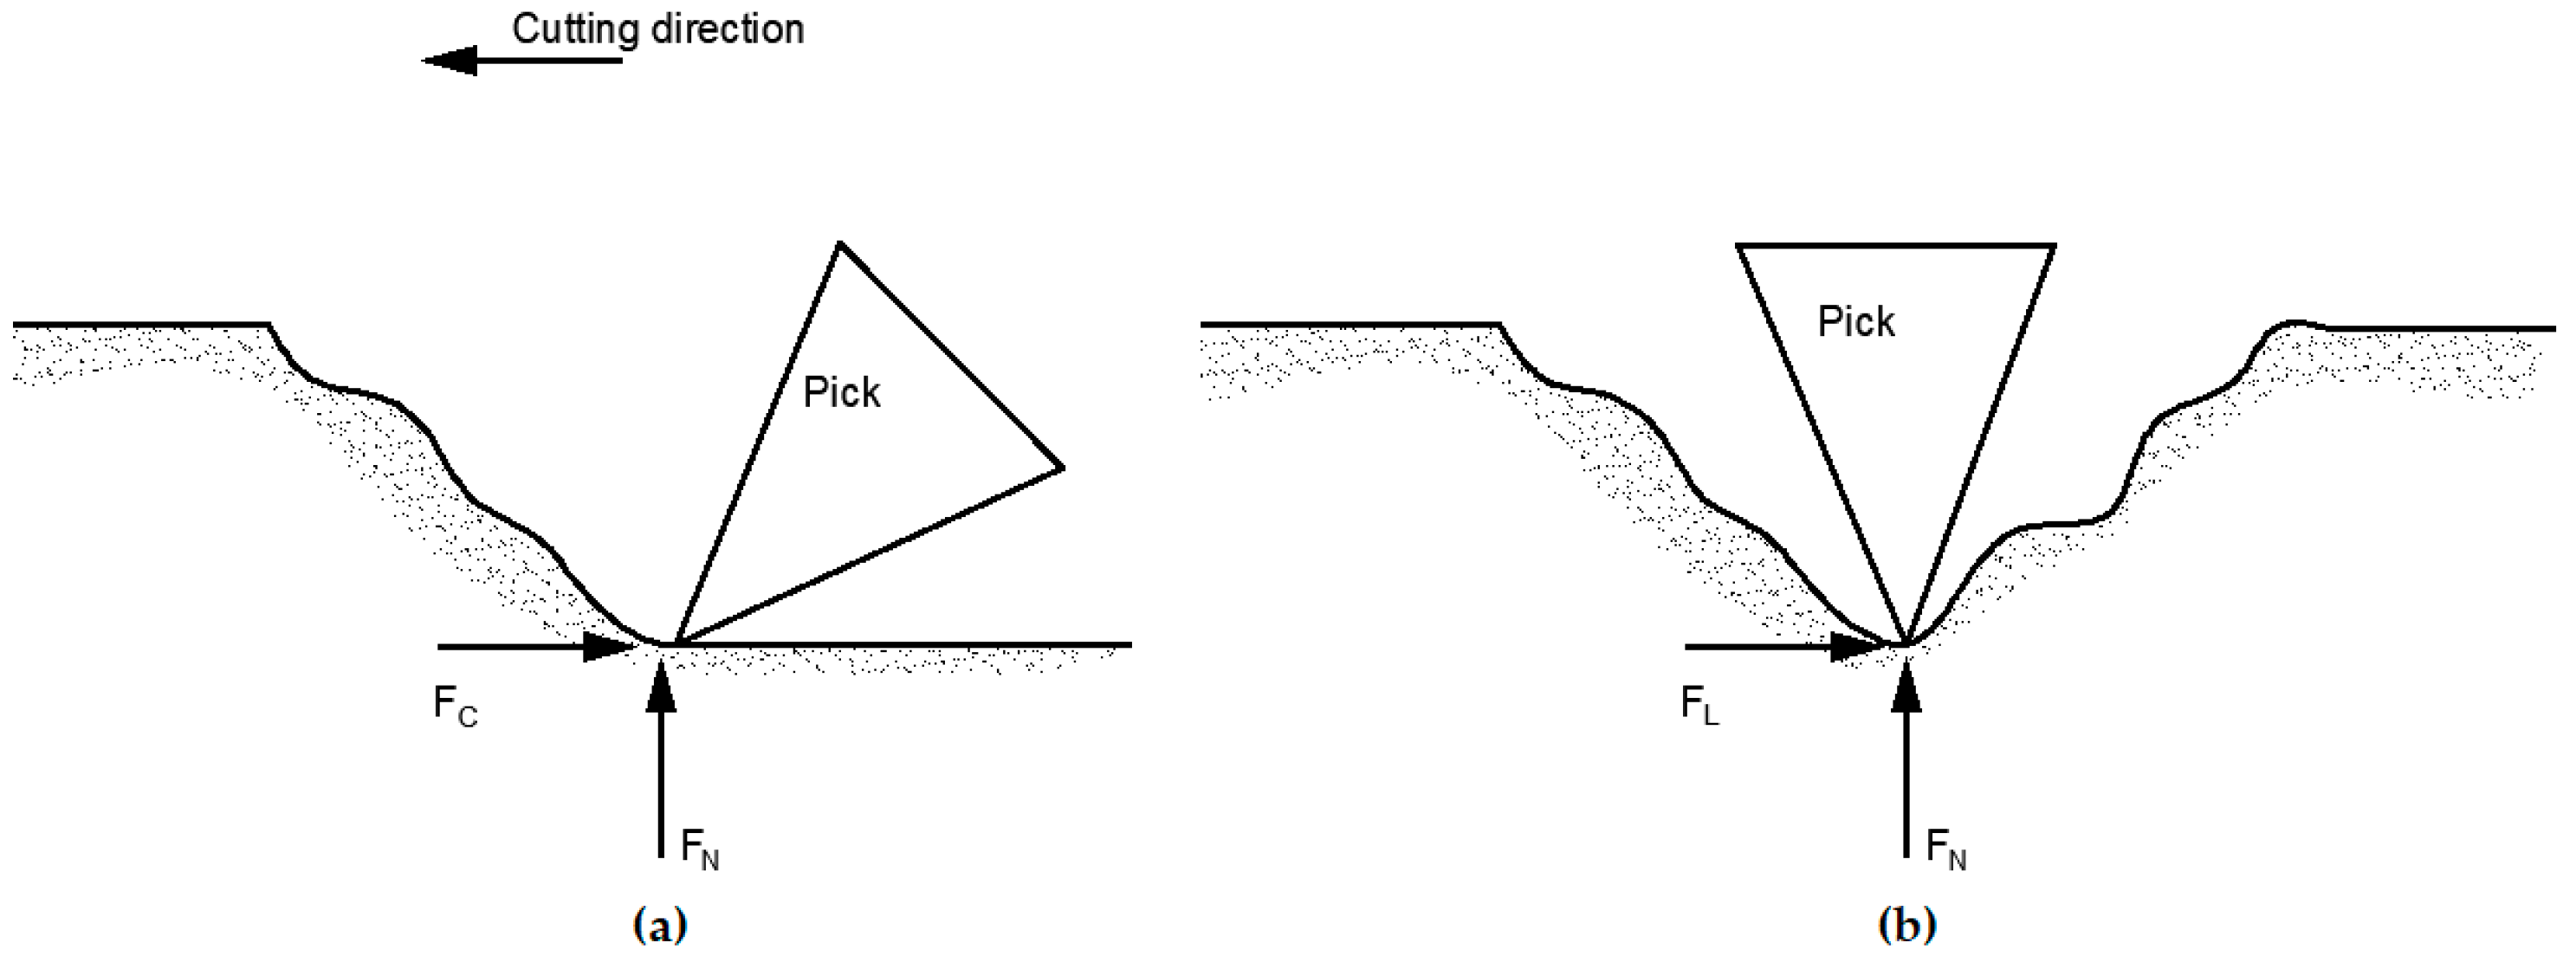
  • A cutting force FC or main force, which generates the breakage and formation of the chips and acts in a parallel direction to the excavation face.
  • A normal force FN or force that maintains the pick at the desired cutting depth and acts in a perpendicular direction to the excavation face.
  • A lateral force FL or perpendicular force to the plane of the normal and cutting forces and which, due to its small magnitude compared to the rest of the forces, is considered to be depreciable.
As a general rule, it is known that the forces applied by the tool on the ground start to increase gradually as the pick penetrates the rock and moves through the direction of breakout. At the beginning of the cut, the normal force plays an important role, as it is applied to make the pick penetrate the rock; however, the cutting force becomes more important once the pick has already penetrated and the fragmentation process begins. The first phase is a dynamic process, whereas when the cutting force starts to act, it can be considered as a static process.

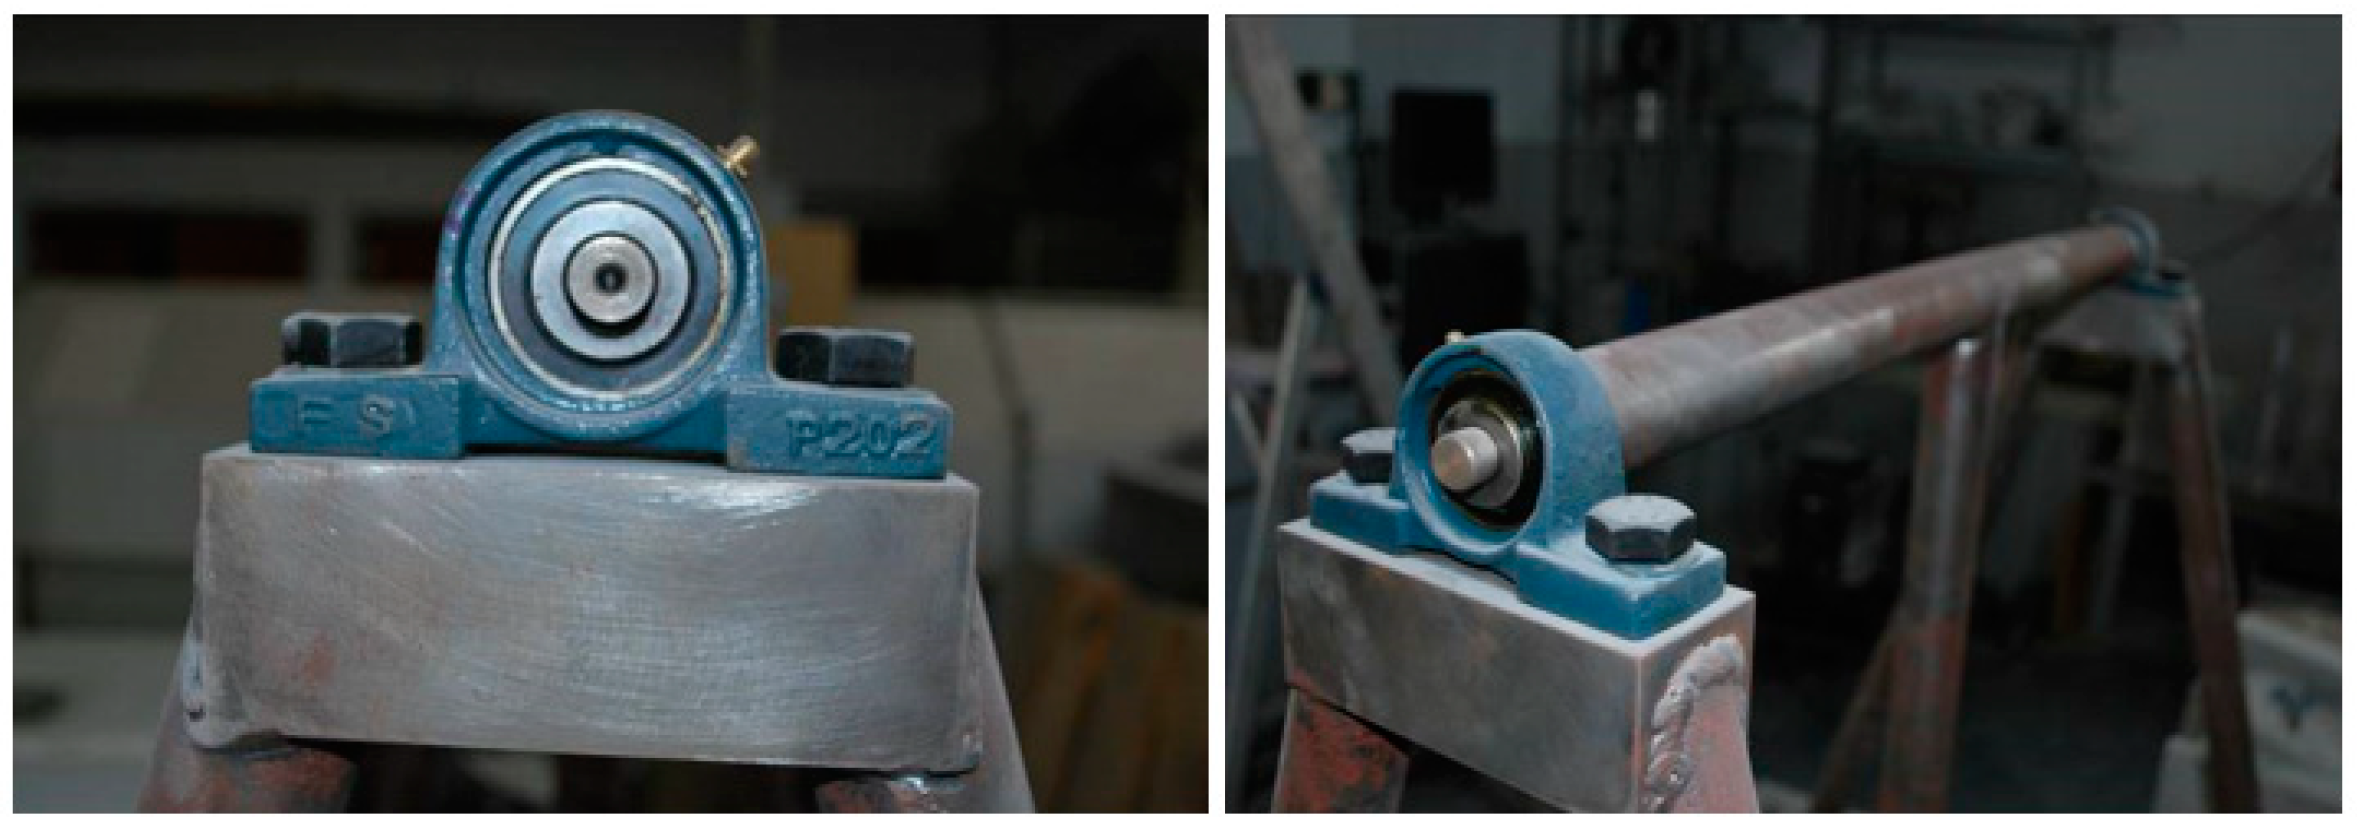
2.2. Initital Prototype

Most works dealing with the removal of rock by mechanical elements, in particular by picks, focus on the static phase of the process without taking into account the speed at which the cutting element impacts on the rock, which directly affects the formation of the crushed zone and the cutting depth, defined as the height between the point of impact of the pick and the upper face of the block (Figure 3).
With the aim of simulating the dynamic process, a first small-scale prototype is designed. It simulates the impact of a pick against a rock, using a pendulum system. In this way, it is possible to reproduce the cutting process at the most indivisible scale (the removal of a chip), facilitating the observation, measurement and search for phenomena that improve the efficiency of the process (Figure 4).
This prototype is used to carry out tests on cylindrical samples of limestone with simple compressive strength of 65 MPa and on cylindrical samples of concrete with a cement/sand ratio of 3:1 with a behaviour similar to that of rock, but without discontinuities that could falsify the results. The tests are carried out with cutting depths ranging from 0.5 to 2 cm and hitting angles of 45 and 90°.
The results of this campaign (Table 1) indicate that:
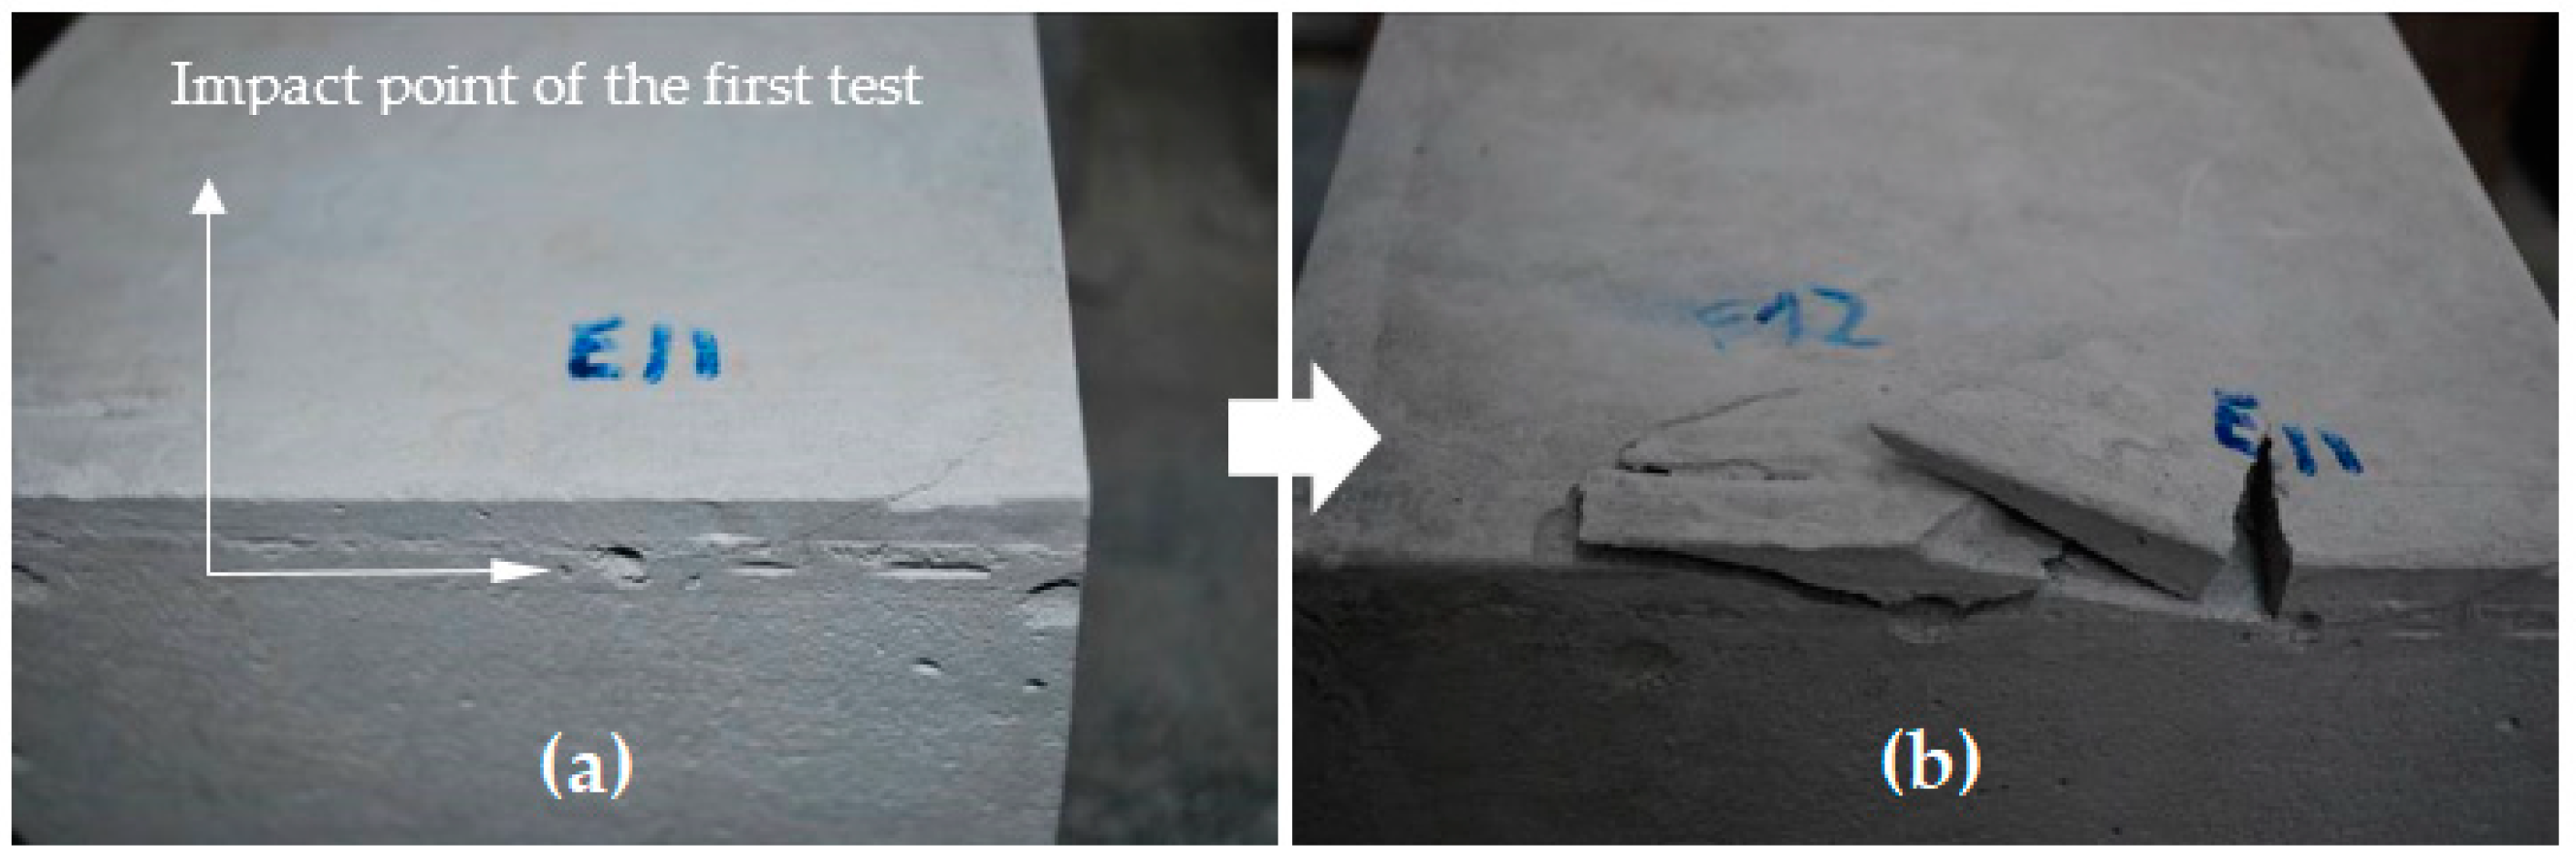
  • For each angle of fall, there is a limiting cutting depth above which no chips are obtained.
  • At the same angle of fall, the surface of the chip or the surface that the removed chip leaves on the tested sample, increases with the cutting depth.
  • In general, for the same cutting depth, the size of the surface of the removed chip increases with increasing energy. However, there is an optimum value above which energy is wasted, as an increase in energy does not imply an increase in chip size.
In other words, the minimum energy required to remove a chip depends only on the cutting depth and the angle of impact of the pick for the same homogeneous material.
In addition, in the samples tested, it is observed that, even if the chip is not removed, the impact zone is affected as a function of the impact energy, decreasing the energy required to remove it when the test is repeated at the same point.
These tests allow to identify those points that improve the performance of the prototype, such as:
  • Having a rigid structure to prevent oscillations of the arm during the pendulum movement.
  • Minimising frictional energy losses in order to correctly calculate the energy required to remove a chip.
  • Provide a sample holder to prevent movement and tipping of the sample on impact.
  • Measure the possible rebound of the pick to estimate the excess energy and thus accurately obtain the energy required to remove a chip.
  • Work with samples of decimetric size for the correct development of the chips and thus guarantee that the tests carried out on the same block are not affected by the adjacent tests (radius of affection of the damaged area).
  • Include a system of weights to increase the energy in those tests where the energy produced for the equipment is not enough to generate chips.

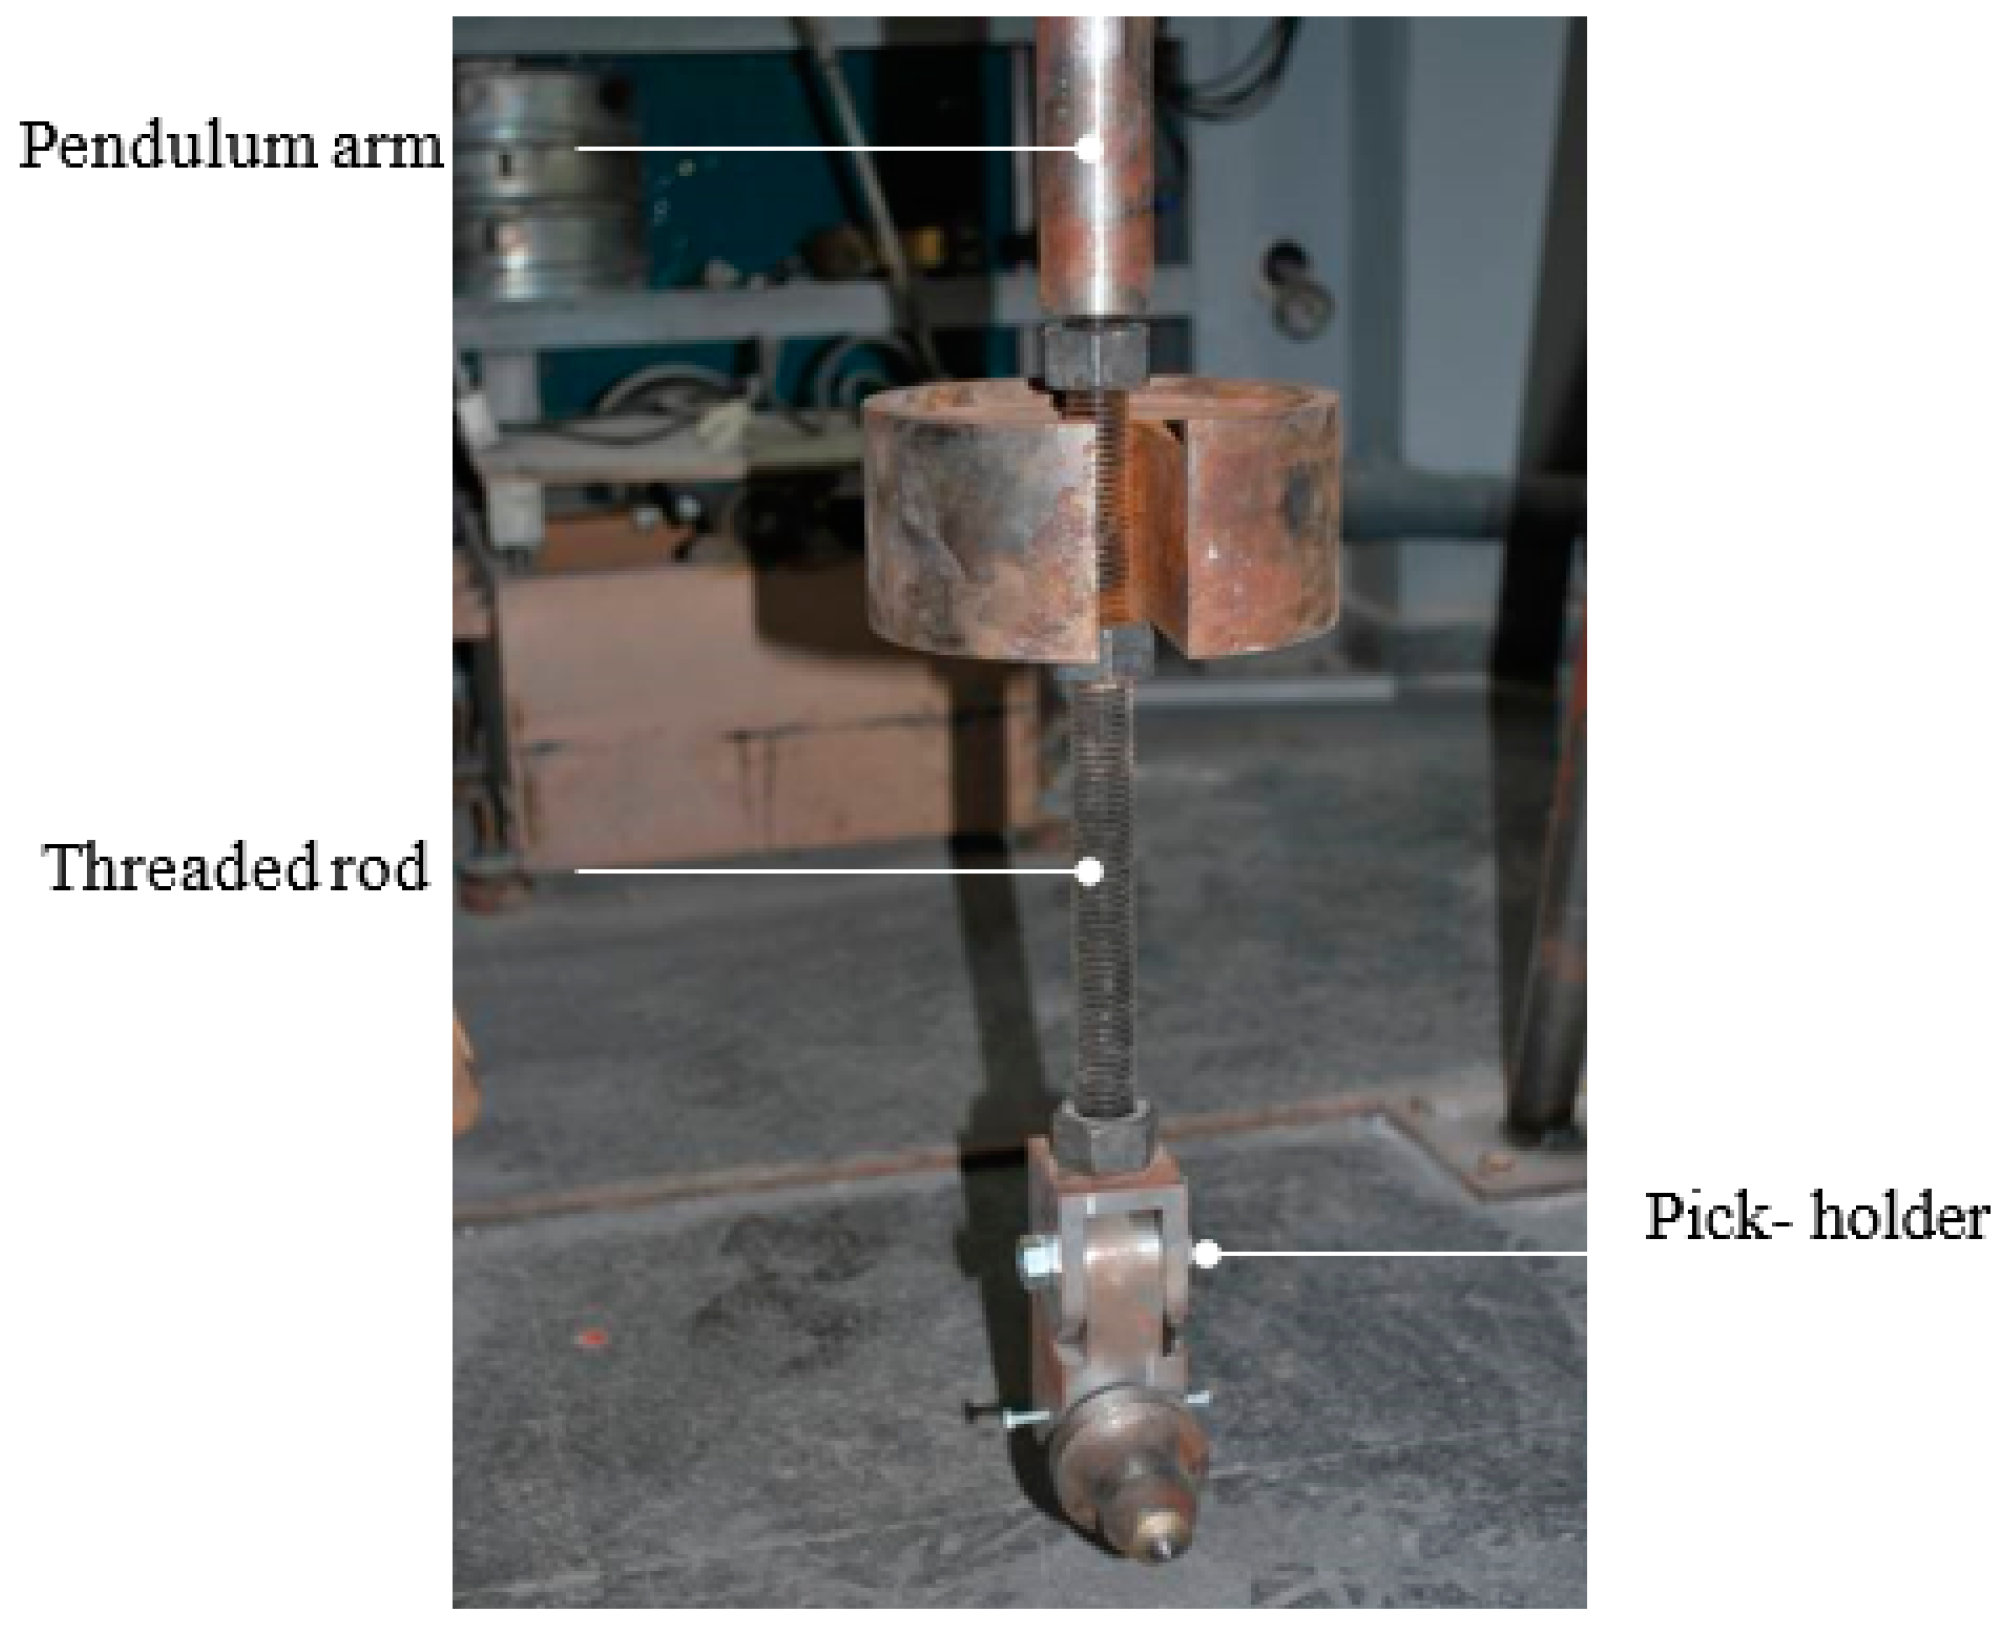
2.3. Final Prototype

Taking all these considerations into account, a new, larger-scale equipment is designed and built in steel, by the Dinrock research group in its laboratories located at the School of Mining, Energy and Materials Engineering of the University of Oviedo. With a width of 0.75 m and a height of 1.60 m, the equipment guarantees its stability during impact with a structure with four support points anchored to the ground and braced to each other (Figure 5).
Possible oscillations of the pendulum are eliminated by fixing its arm to the shaft of rotation. In addition, this shaft has bearings that facilitate movement and minimize friction (Figure 6).
A pick-holder is designed, which allows the pick to be easily exchanged for a new one or one with different characteristics. The pick is formed by a point of tungsten carbide inserted in a matrix of hardened steel. The pick-holder of hardened steel has a rotation system that allows the angle of impact to be varied from 0 to 90° with an interval of 10°, facilitating the performance of tests with different inclinations of the pick (Figure 7).
The pick holder is attached to the pendulum arm with a threaded rod that performs a triple function. On the one hand, it allows the rotation of the pick holder enabling oblique hittings on the rock. On the other hand, it supports by means of a simple system of nuts, the additional weights. Finally, the threaded rod allows to change the cutting depth. In this regard, it should be mentioned that the threaded rod has a thread pitch of 0.5 cm, so the cutting depth can be modified from 0.5 cm to 0.5 cm. Figure 8 shows the pick-holder, the threaded rod and the pendulum arm.
An electronic encoder, of the REV series and of the Italian brand Elap, is installed on the pendulum axis to correctly measure the starting angle of the pendulum movement and to determine the impact energy given by the Equation (1).
E = m g b ( 1 cos θ )
where E is the impact energy, m the hitting mass, g the acceleration of gravity, b the distance between the rotation axis and the center of the pick, and θ the starting angle.
A KS813 triaxial accelerometer from the German manufacturer METRA is also fitted to analyse the deceleration experienced at the moment of impact and the negative acceleration resulting from the backward rebound of the pick, and thus quantify the excess energy.
Both the encoder and accelerometer data are recorded in a DEWTRON data acquisition unit connected to a computer. A Motion Corder Analyzer Series SR high-speed video camera from Kodak is synchronised with the accelerometer and connected to the data acquisition unit to facilitate data interpretation. Finally, a Picza PIX-30 3D scanner from the Roland DG Corporation from Hamamatsu (Japan), is available to recreate in digital format the shape of the chips removed and to determine areas and volumes, and to calculate the specific energy or energy required to remove a given volume of rock.
With this prototype, material removal occurs in a similar way to how it is carried out in real excavations as opposed to most laboratory tests which are static, allowing:
  • Test samples of appropriate size, with dimensions that approximate the real working scale.
  • Modify the impact energy by varying the amplitude of the pendulum movement and the impacting mass.
  • Modify, in a simple way, the type of cutting tool to be used and its angle of attack, allowing the most appropriate ones to be defined for each type of rock.
  • Modify parameters such as impact speed and cutting depth in order to optimise the removal.
Once the construction of the new prototype is finished, concrete blocks of 21 L of volume are built and tested with different c/s ratios, 1:1 and 3:1.
Initially, 30 tests are carried out on samples with a c/s ratio of 1:1. In each test, the cutting depth (Hc), the impact energy (E), as well as the formation or non-formation of a chip are collected. In addition, if a chip is formed, the area of the footprint left in the block after the chip is removed (A), the energy required to remove a unit area (EA), the volume of the removed chip (V) and the specific energy or energy required to remove a unit volume (ES) are calculated.
The results (Table 2) show that, as in the tests carried out with the initial prototype, there is a direct relationship between impact energy, chip size and cutting depth. For the same cutting depth an increase in the impact energy produces an increase in the size of the chip. On the same way, for the same impact energy an increase in the cutting depth produces and increase in the size of the chip. In this case, as the cutting depth increases, the formation of chips requires more impact energy until a cutting depth is reached where there is not formation of chips regardless of the impact energy used. In other words, for each impact energy there is a range of cutting depths where no chips are obtained. Therefore, the maximum efficiency will be achieved by cutting at the upper limit of the range or, that is to say, for each cutting depth there is an optimum impact energy.
Figure 9 shows the specific energy versus the volume of material removed for each cutting depth. It is noticed that for each combination cutting depth/impact energy, the chips have similar volumes. Moreover, this volume increases when one of these values (cutting depth/impact energy) increases. Besides, the asymptotic distribution shown in the graph confirms the existence of an optimum specific energy for this material, from which it would be possible to know the cutting depth and the impact energy that should be used to obtain maximum performance.
Next, in order to analyse the influence that the strength of the material has on the removal of chips, 19 tests were carried out on mortar samples with a c/s ratio of 3:1. The results of these new tests are shown in Table 3, which clearly shows how an increase in the strength of the material causes a decrease in the limit cutting depth.
In this case, with small cutting depths (0.5 cm), the volumes removed are lower than those obtained in the first tests, while for cutting depths of 1 cm the volumes removed are similar to those obtained in the first tests (Figure 10). Furthermore, there is no material removal for cutting depths greater than 1 cm.
Finally, the influence that tests close in space can have on each other is analysed. For this purpose, hitting tests are carried out in an area close to first tests where no chips have been obtained. The Table 4 and the Figure 11, show two of the tests. They show that the test only a few centimetres away from other causes the two test areas to break. Therefore, there is an affected zone in the block after the impact of the pick even though no material has been removed, which has to be taken into account when optimising the cut in an excavation.

3. Discussion

The asymptotic distribution of the specific energy versus the volume removed for different cutting depths proves the existence of an optimum removal energy where the surplus of energy once the material is removed is minimal because all the energy is used to remove the chip, with no rebound of the pick and without the material removed being displaced from the site. For its empirical calculation, several tests were recorded with a high-speed camera. The tests were carried out on 21 l samples with a c/s ratio of 1:1, a cutting depth of 1 cm. The Table 5 shows two of the tests carried out.
In the first test, with an impact energy of 30 J, a deformation of the material occurs but no cutting occurs, not even in the rebound of the pick (Figure 12). However, the chip is sufficiently formed that it can be removed by hand after the test. Therefore, it can be said that this is a situation very close to the ideal one.
In the second test, with an impact energy of 34.1 J, it is the rebound of the pick after the first impact that cuts the chip (Figure 13). Therefore, one small surplus of energy produces the removal of the chip.
If the average value of the volume removed and the specific energy resulting from these tests is represented in the volume-specific energy graph, obtained with the first tests carried out with the same c/s ratio of 1:1 and similar cutting depth of 1 cm (Figure 14), it can be seen that the value obtained is lower than the previous tests, so the first tests were carried out with more energy than necessary.
On the other hand, the fact that this value is above the asymptotic part of the curve which, theoretically, marks the optimum energy value, seems to corroborate Barker’s hypothesis [14]: the specific energy required to remove a given volume of chip decreases with increasing the cutting depth. This is because the increase of cutting depth causes the volume affected by the impact energy to be greater, leading to increased energy efficiency. However, there are other factors such as the dynamic effect or speed of load application, or the way the energy is applied.

4. Conclusions

The DinRock research group at the University of Oviedo has designed and built an equipment that simulates the dynamic effect of material removal hitting a pick against a rock. The equipment uses a pendulum system that allows to change the impact energy with the objective of testing different energies and dynamicities.
From the tests carried out, it is possible to say that:
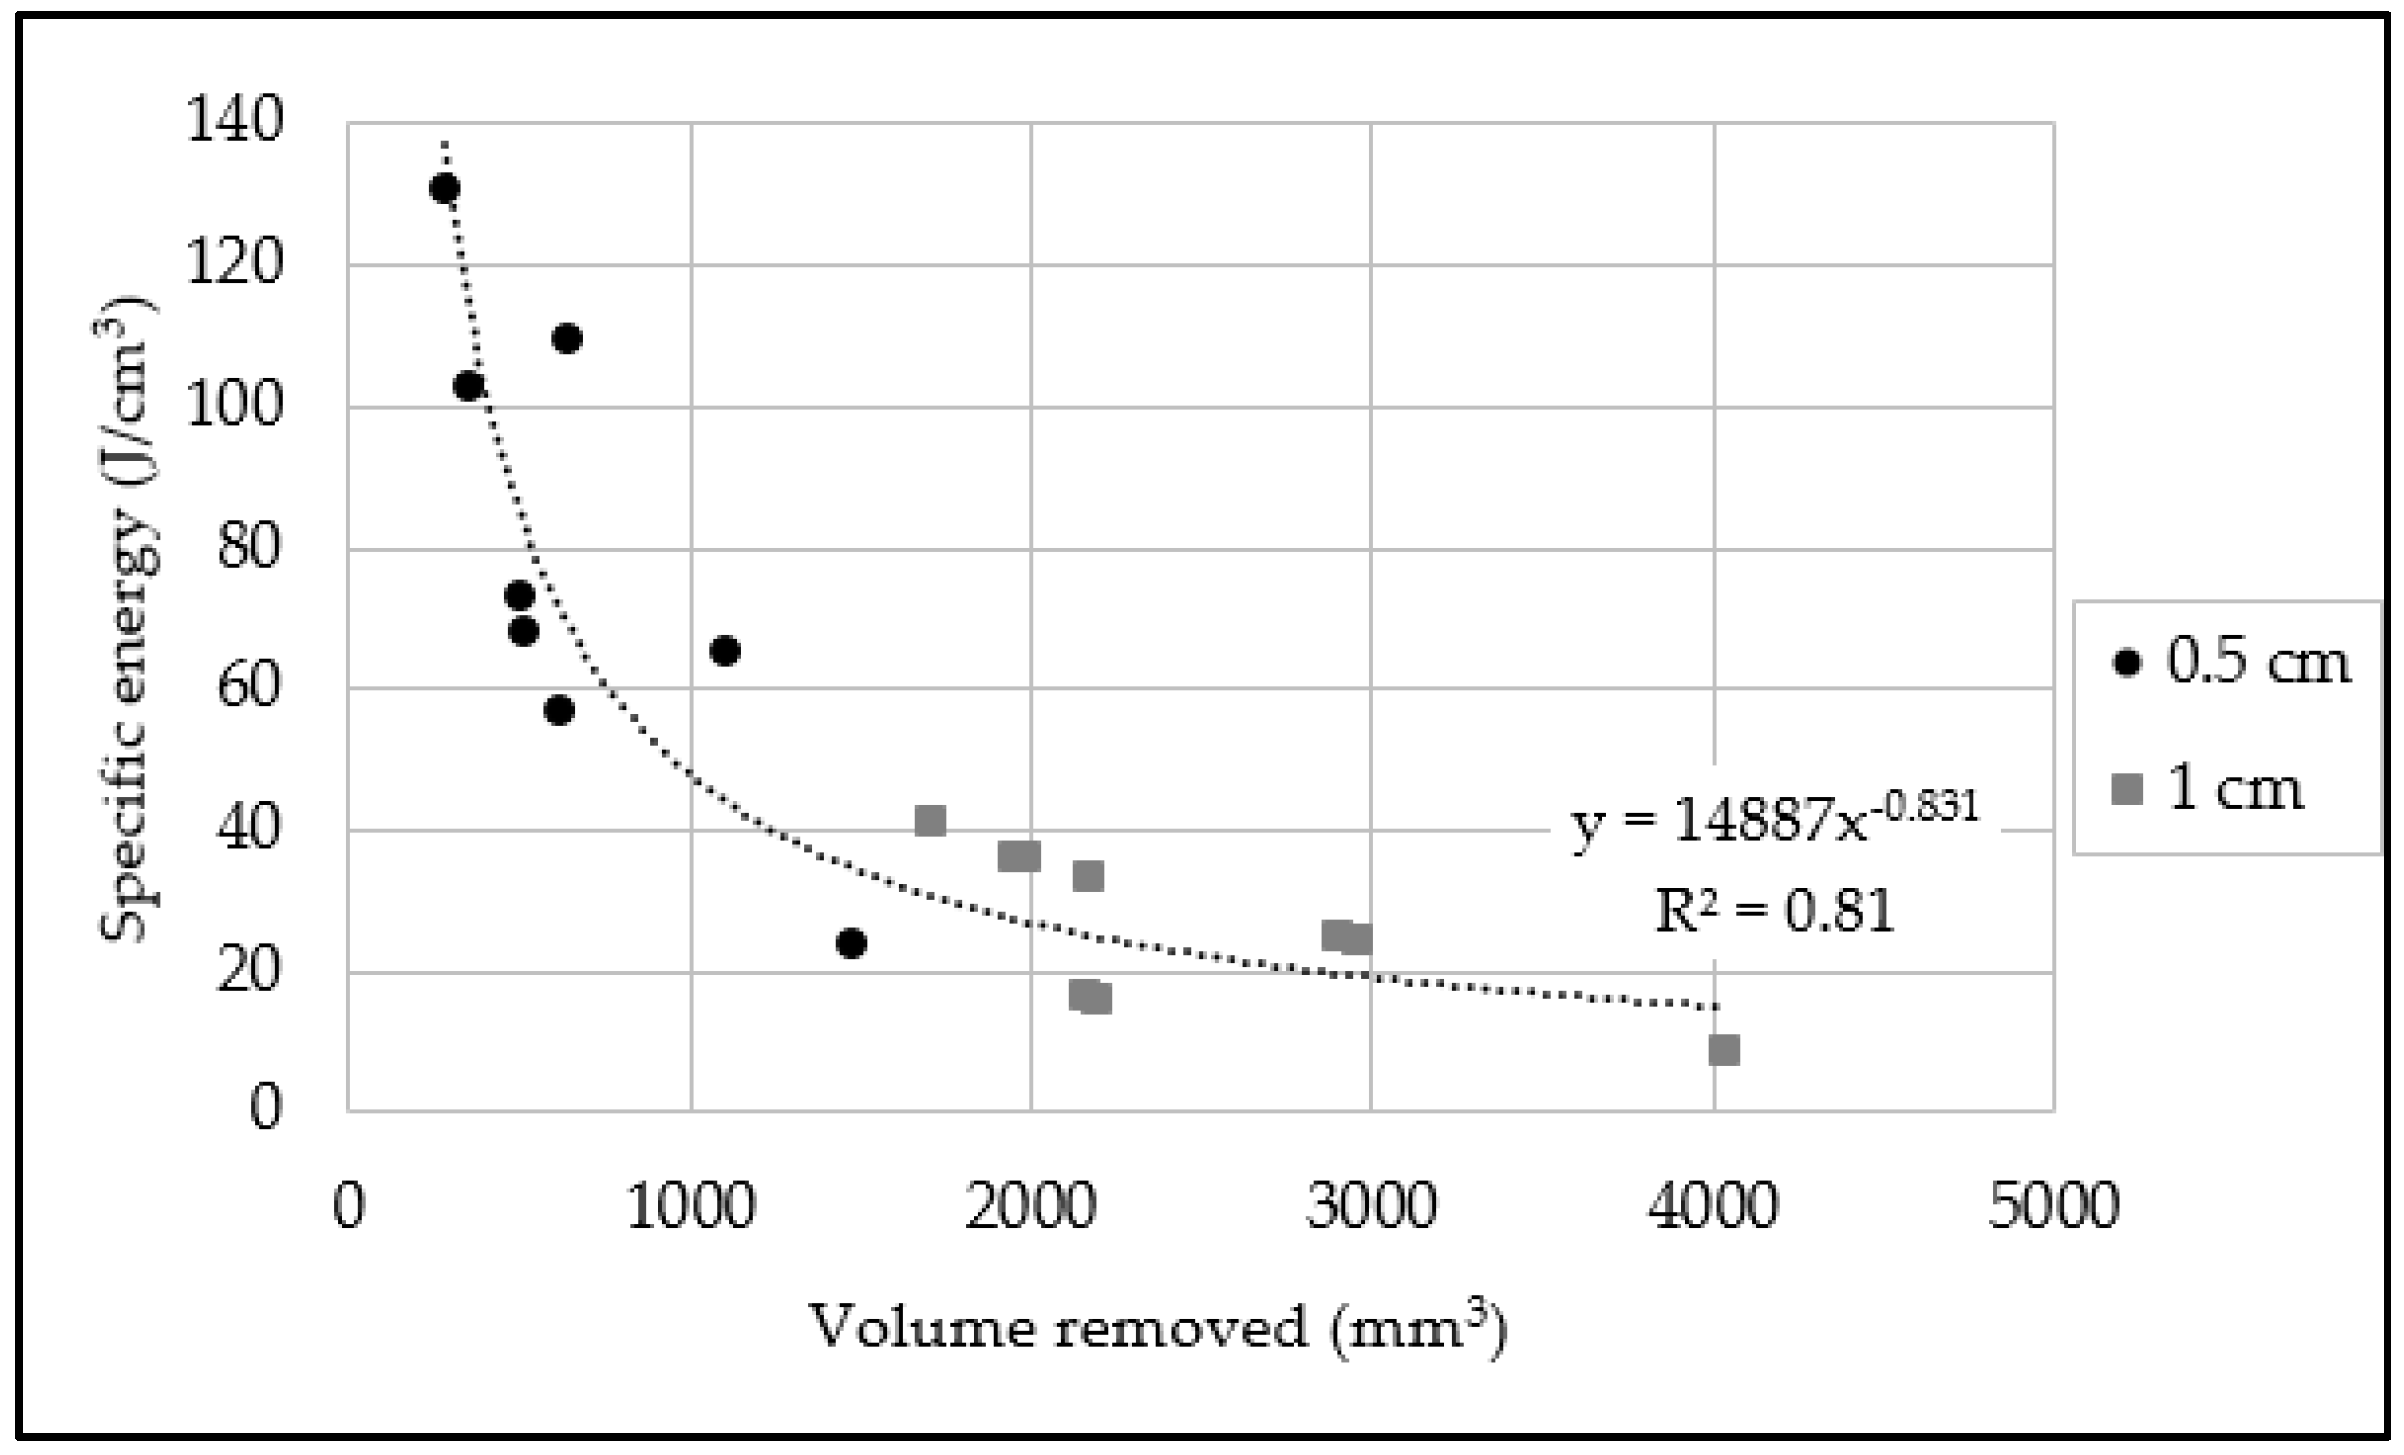
  • For each cutting depth there is an impact energy, above which energy is wasted.
  • For each material tested, there is an optimum energy that defines the cutting depth and the impact energy for maximum cutting performance.
  • The presence of discontinuities in the material to be removed influences the cutting process depending on their orientation with respect to the direction of impact.
  • It is necessary analyse other parameters as the angle of impact of the pick or the influence of the properties of the material to be removed, but also the influence of the speed of the pick in the size of the chip removed.

Author Contributions

Conceptualization, C.B.-B. and M.-I.Á.-F.; methodology, C.G.-N.; formal analysis, C.B.-B. and C.G.-N.; lab tests, M.-I.Á.-F. and M.-B.P.-G.; writing—original draft preparation, M.-B.P.-G.; writing—review and editing, M.-B.P.-G. and M.-I.Á.-F.; supervision, C.G.-N. All authors have read and agreed to the published version of the manuscript.

Funding

This research was funded by the Ministry of Science and Innovation of Spain through Grant MCIU-19-PGC2018-099695-B-I00.

Institutional Review Board Statement

Not applicable.

Informed Consent Statement

Informed consent was obtained from all subjects involved in the study.

Data Availability Statement

The data presented in this study are available on request from the corresponding author. The data are not publicly available due to confidentiality.

Acknowledgments

The authors gratefully acknowledge the support from the Ministry of Science and Innovation of Spain.

Conflicts of Interest

The authors declare no conflict of interest.

References

  1. Vogt, D. A review of rock cutting for underground mining: Past, present, and future. J. S. Afr. Inst. Min. Metall. 2016, 116, 1011–1026. [Google Scholar] [CrossRef] [Green Version]
  2. Bilgin, N.; Copur, H.; Balci, C. Mechanical Excavation in Mining and Civil Industries; CRC Press, Taylor & Francis Group: Boca Ratón, FL, USA, 2013; 388p. [Google Scholar] [CrossRef]
  3. Evans, I. A theory of the cutting force for point attack picks. Int. J. Min. Eng. 1984, 2, 63–71. [Google Scholar] [CrossRef]
  4. Evans, I. Basic Mechanics of the point attack pick. Colliery Guard. 1984, 232, 189–193. [Google Scholar]
  5. Goktan, R.M. A suggested improvement on Evans cutting theory for conical bits. In Proceedings of the Fourth International Symposium on Mine Mechanization and Automation, Brisbane, QLD, Australia, 6–9 July 1997. [Google Scholar]
  6. Nishimatsu, Y. The mechanics of the rock cutting. Int. J. Rock Mech. Min. Sci. 1972, 9, 261–271. [Google Scholar] [CrossRef]
  7. Roxborough, F.F.; Pedroncelli, E.J. A practical evaluation of some coal cutting theories using a continuous miner. Min. Eng. 1982, 142, 145–156. [Google Scholar]
  8. Fowell, R.J. The mechanics of rock cutting. Compr. Rock Eng. 1993, 4, 155–175. [Google Scholar]
  9. Mishnaevsky, L. Rock fragmentation and optimization of drilling tools. In Fracture of Rock; WIT Press: Southampton, UK, 1998; pp. 167–203. [Google Scholar]
  10. Hughes, H. Some aspects of rock machining. Int. J. Rock Mech. Min. Sci. 1972, 9, 205–211. [Google Scholar] [CrossRef]
  11. Roxborough, F.F.; Rispin, A. The mechanical cutting characteristics of the lower chalk. Tunn. Tunn. 1973, 5, 45–67. [Google Scholar]
  12. Roxborough, F.F.; Phillips, H.R. Rock excavation by disc cutter. Int. J. Rock Mech. Min. Sci. 1975, 12, 361–366. [Google Scholar] [CrossRef]
  13. Roxborough, F.F. Cutting rocks with picks. Min. Eng. 1973, 132, 445–452. [Google Scholar]
  14. Barker, J.S. A laboratory investigation of rock cutting using large picks. Int. Rock Mech. Min. Sci. 1964, 1, 519–534. [Google Scholar] [CrossRef]
  15. Evans, I. Optimum line spacing for cutting picks. Min. Eng. 1982, 1, 433–434. [Google Scholar]
  16. He, B.; Shao, W.; Tang, J.Y.; Zong, X.M.; Kang, K.X. The Effect of Pick Profile on the Cutting Performance of Point Attack Picks. Key Eng. Mater. 2018, 789, 31–36. [Google Scholar] [CrossRef]
  17. Yasar, A.; Yilmaz, A.O. Drag pick cutting tests: A comparison between experimental and theoretical results. J. Rock Mech. Geotech. Eng. 2018, 10, 893–906. [Google Scholar] [CrossRef]
  18. Tiryaki, B.; Boland, J.N.; Li, X.S. Empirical models to predict mean cutting forces on point-attack pick cutters. Int. J. Rock Mech. Min. Sci. 2010, 47, 858–864. [Google Scholar] [CrossRef]
  19. Mohammadnejad, M.; Dehkhoda, S.; Fukuda, D.; Liu, H.; Chan, A. Numerical simulation of the rock cutting. In Proceedings of the A Specialized Conference of ISRM 2019 Rock Dynamics Summit, Okinawa, Japan, 7–11 May 2019. [Google Scholar]
  20. Mohammadnejad, M.; Dehkhoda, S.; Fukuda, D.; Liu, H.; Chan, A. GPGPU-parallelised hybrid finite-discrete element modelling of rock chipping and fragmentation process in mechanical cutting. J. Rock Mech. Geotech. Eng. 2020, 12, 310–325. [Google Scholar] [CrossRef]
  21. Kalogeropoulos, A.; Michalakopoulos, T. Numerical simulation of rock cutting using Yade. In MATEC Web of Conferences; EDP Sciences: Les Ulis, France, 2021; Volume 342, p. 02011. [Google Scholar] [CrossRef]
  22. Copur, H.; Bilgin, N.; Tuncdemir, H.; Balci, C. A set of indices based on indentation tests for assessment of rock cutting performance and rock properties. J. S. Afr. Inst. Min. Metall. 2003, 103, 589–600. [Google Scholar]
  23. Liu, K.; Liu, S.; Li, L.; Cui, X. Experiment on Conical Pick Cutting Rock Material Assisted with Front and Rear Water Jet. Adv. Mater. Sci. Eng. 2015, 2015, 506579. [Google Scholar] [CrossRef] [Green Version]
  24. Ciccu, R.; Grosso, B. Improvement of disc cutter performance by water jet assistance. Rock Mech. Rock Eng. 2014, 47, 733–744. [Google Scholar] [CrossRef]
  25. Liu, S.Y.; Liu, X.H.; Chen, J.F.; Lin, M.X. Rock breaking performance of a pick assisted by high-pressure water jet under different configuration modes. Chin. J. Mech. Eng. 2015, 28, 607–617. [Google Scholar] [CrossRef]
  26. Appl, F.C.; Rao, B.N.; Walker, B.H. Effects of AlCl3 additive while cutting granite with a single diamond. Ind. Diam. Rev. 1981, 41, 318–321. [Google Scholar] [CrossRef]
  27. Engelmann, W.H.; Watson, P.J.; Tuzinski, P.A.; Pahlman, J.E. Zeta Potential Control for Simultaneous Enhancement of Penetration Rates and Bit Life in Rock Drilling; U.S. Bureau of Mines Report of Investigations: Pittsburgh, PA, USA, 1987. [Google Scholar]
  28. Westwood, A.R.C. Environmental enhanced disintegration of hard rocks. In Proceedings of the Conference on Research in Excavation Technology, Vail, CO, USA, 21–24 October 1975. [Google Scholar]
  29. Brunsing, T.; Goodman, R.E. Hard rock excavating by prestressed rock cutting. In Proceedings of the 20th Symposium on Rock Mechanics, Austin, TX, USA, 4–6 June 1979. [Google Scholar]
  30. Liu, H.Y.; Kou, S.Q.; Lindquist, P.A.; Tang, C.A. Numerical simulation of the rock fragmentation process induced by indenters. Int. J. Rock Mech. Min. Sci. 2002, 39, 491–505. [Google Scholar] [CrossRef]
  31. Mishnaevsky, L.L. Physical mechanisms of hard rock fragmentation under mechanical loading: A review. Int. J. Rock Mech. Min. Sci. 1995, 6, 763–766. [Google Scholar] [CrossRef]
  32. Fang, Z.; Harrison, J.P. Development of a local degradation approach to the modeling of brittle fracture in heterogeneous rocks. Int. J. Rock Mech. Min. Sci. 2002, 39, 443–457. [Google Scholar] [CrossRef]
  33. Chen, L.H.; Labuz, J.F. Indentation of rock by wedge-shaped tools. Int. J. Rock Mech. Min. Sci. 2006, 43, 1023–1033. [Google Scholar] [CrossRef]
  34. Ersoy, A.; Atici, U. Performance Characteristics of circular diamond saws in cutting different types of rock. Diam. Relat. Mater. 2004, 13, 22–37. [Google Scholar] [CrossRef]
Figure 1. Zones formed by the impact of a pick on the rock.
Energies 14 06831 g001
Figure 2. Forces acting on a pick. (a) Side view. (b) Front view.
Energies 14 06831 g002
Figure 3. Calculation of the cutting depth as a function of the impact point of the pick on the material.
Energies 14 06831 g003
Figure 4. Initial prototype and pick employed.
Energies 14 06831 g004
Figure 5. Final prototype.
Energies 14 06831 g005
Figure 6. Shaft of rotation.
Energies 14 06831 g006
Figure 7. Pick-holder.
Energies 14 06831 g007
Figure 8. Pick-holder, threaded rod and pendulum arm.
Energies 14 06831 g008
Figure 9. Specific energy as a function of volume removed in samples with c/s ratio 1:1.
Energies 14 06831 g009
Figure 10. Specific energy as a function of volume removed in samples with a c/s ratio of 3:1.
Energies 14 06831 g010
Figure 11. Influence of the affected zone. (a) Impact point of the first test. (b) Material removed after the second test.
Energies 14 06831 g011
Figure 12. Test 1: Impact energy of 30 J. 1. Approximation of the pick to the test sample. 2. Hitting of the pick on the test sample. 3. Distance of the pick from the test sample. 4. Deformation of the test sample.
Energies 14 06831 g012
Figure 13. Test 2. Impact energy of 34.1 J. 1. First impact of the pick on the test sample. 2. Distance of the pick from the test sample. 3. Approximation of the pick to the test sample in the rebound. 4. Second impact of the pick on the test sample. 5. Deformation of the test sample and creation of the chip. 6. Distance of the pick from the test sample after the second impact.
Energies 14 06831 g013
Figure 14. Calculation of optimum energy in concretes with a c/s ratio of 1:1.
Energies 14 06831 g014
Table 1. Summary of the tests carried out with the initial prototype. (The precision of the measures is of the order of 0.1 cm for the cutting depth, 0.5° for the angle, and 25 mm2 for the chip surface).
TestCutting Depth (cm)Angle (°)ChipChip Surface (mm2)
10.545Yes252.8
20.545Yes560.7
30.545Yes384.7
40.590Yes835.1
50.590Yes913.3
60.590Yes615.4
7145No
8145No
9145No
10190Yes1449.6
11190Yes1166.9
12190Yes1069.9
131.545No
141.545No
151.545No
161.590Yes2307.9
171.590Yes2330.5
181.590Yes2419.1
19245No
20245No
21245No
22290No
23290No
24290No
Table 2. Summary of tests on samples with a c/s ratio of 1:1. (The precision of the measures is of the order of 0.5° for θ and 0.1 cm for HC. Besides, the precision of the scanner 3D is 5 mm).
Testθ
(°)
Hc
(cm)
E
(J)
ChipA
(mm2)
EA
(J/cm2)
V
(mm3)
ES
(J/cm3)
1200.535.5Yes383.39.3423.683.8
2200.535.5Yes319.111.1440.880.7
3200.535.5Yes349.110.2457.977.5
4400.571Yes729.49.71437.349.4
5400.571Yes724.89.81434.249.5
6400.571Yes753.19.41448.849
720135.5Yes741.64.81407.825.2
820135.5Yes730.34.9145024.5
920135.5Yes705.65.01536.423.1
1040171Yes9927.21119.963.4
1140171Yes964.47.41162.861.1
1240171Yes952.47.51143.962.1
13201.535.5No
14201.535.5No
15201.535.5No
16351.564.2Yes1789.53.65446.311.8
17351.564.2Yes1899.43.45765.911.1
18351.564.2Yes2104.834906.713.1
19401.571No
20401.571Yes3199.62.212,610.75.6
21401.571No
2220235.5No
2320235.5No
2420235.5No
2535264.2Yes3600.51.816,7503.8
2635264.2Yes35001.816,550.33.9
2735264.2Yes35501.816,650.73.9
2840271No
2940271No
3040271No
Table 3. Summary of tests on samples with a c/s ratio of 3:1. (The precision of the measures is of the order of 0.5° for θ and 0.1 cm for HC. Besides, the precision of the scanner 3D is 5 mm).
Testθ
(°)
Hc
(cm)
E
(J)
ChipA
(mm2)
EA
(J/cm2)
V
(mm3)
ES
(J/cm3)
1200.535.5Yes464.97.6623.157.0
2200.535.5Yes397.28.9519.368.3
3200.535.5No
4200.535.5Yes1051.83.41479.524.0
5200.535.5No
6250.536.9Yes275.413.4282.1130.7
7250.536.9Yes298.412.4358.5102.8
8250.536.9Yes441.08.4502.873.3
9400.571.0Yes559.012.7649.0109.4
10450.572.4Yes702.910.31104.465.5
1120135.5Yes1276.42.82161.016.4
1220135.5Yes1027.03.52202.116.1
1320135.5Yes1700.52.14035.78.8
1440171.0Yes1172.36.11960.236.2
1540171.0Yes1184.56.01715.341.4
1645172.4Yes1546.94.62901.524.7
1745172.4Yes1372.05.22967.724.2
1845172.4Yes1189.76.12176.333.2
1945172.4Yes1183.46.11994.036.3
Table 4. Summary of the results of the test of the affected zone. (The precision of the measures is of the order of 0.5° for θ and 0.1 cm for HC. Besides, the precision of the scanner 3D is 5 mm).
Testθ
(°)
Hc
(cm)
E
(J)
ChipA
(mm2)
EA
(J/cm2)
140171No
240171Yes4674.31.5
Table 5. Summary of optimum energy calculation tests. (The precision of the measures is of 0.5° for θ, and 5 mm for the scanner).
Testθ
(°)
E
(J)
ChipA
(mm2)
EA
(J/cm2)
V
(mm3)
ES
(J/cm3)
Observations
11030Yes1098.12.92606.512.0Nearly formed- Hand raised
21534.1Yes1108.03.02223.714.7Remained in place
Publisher’s Note: MDPI stays neutral with regard to jurisdictional claims in published maps and institutional affiliations.

