Article

The Impact of Fleet Electrification on Carbon Emissions: A Case Study from Poland

by
Krzysztof Zamasz
1,2,
Jakub Stęchły
1,3,
Aleksandra Komorowska
4 and
Przemysław Kaszyński
4,*
1
Department of Management, WSB University, Cieplaka 1c, 41-300 Dąbrowa Górnicza, Poland
2
Veolia Energia Warszawa S.A., S. Batorego 2, 02-591 Warsaw, Poland
3
Energy Contracting Poland Sp. z o.o., Puławska 2, 02-566 Warsaw, Poland
4
Mineral and Energy Economy Research Institute of the Polish Academy of Sciences, 31-261 Kraków, Poland
*
Author to whom correspondence should be addressed.
Energies 2021, 14(20), 6595; https://doi.org/10.3390/en14206595
Submission received: 14 September 2021 / Revised: 27 September 2021 / Accepted: 11 October 2021 / Published: 13 October 2021

Abstract

:
Fleet electrification is one of the measures proposed for achieving climate neutrality in the coming years. The replacement of internal combustion engine vehicles with electric vehicles has a positive impact on carbon emission reduction in some countries. However, in countries highly dependent on fossil fuels, such a possibility requires examination with respect to the means of electricity generation and fuel mix used in their power systems. One such country is Poland, selected as an example of an economy strongly dependent on fossil fuels. The main objective of this paper is to investigate the impact of fleet electrification of an individual company located in Poland on the reduction of carbon emissions. The concept and calculations are based on historical data on the single-year mileage and fuel consumption of 619 cars used by this company. Even though the Polish power system is based on fossil fuels, fleet electrification could contribute to a reduction in carbon emissions of 24%. The decrease in operational costs by EUR 370 thousand/year is also significant. Apart from environmental and economic impacts, this paper provides valuable findings on the difference between catalogue and real-driving data application in the various analyses. With respect to Polish fuel mix in 2019, the application of data published by car producers shows that fleet electrification would increase carbon emissions by 14% in this company. This means that depending on the initial assumptions, different conclusions can be drawn by policymakers, regulatory bodies, academics, or other groups of interest.

1. Introduction

Electrification of transport is one of the key pathways towards energy transition [1]. Electromobility is also indicated as one of the solutions to achieving carbon neutrality in the European Union by 2050 [2]. However, the real impact of the electrification of transport on carbon emissions reduction is strongly dependent on the fuel mix of a given power system. Consequently, in countries where electricity is still mainly produced in coal-fired power plants, the impact of electrification is difficult to assess.
In the year 2019 in Poland, the total installed capacity in the power system was 46.8 GW, out of which, coal or gas-fired generation units stood for 74.3% (23.2 GW of hard coal-fired power plants, 8.4 GW of lignite-fired power plants, and 2.8 GW of natural gas-fired units). Electricity produced in these power plants amounted to 131.8 TWh (83.0% of total electricity production in 2019), of which 78.2 TWh was produced in hard coal-fired power plants, 41.5 TWh in lignite-fired power plants, and 12.1 TWh in natural gas-fired units [3]. The structure of electricity production in 2019 is shown in Figure 1. Additionally, because of the introduction of the capacity market, changes in electricity production structure are not expected to happen in the coming years [4,5,6].

1.1. Literature Review

Ref. [7] indicates that growth in electric vehicles leads to increased carbon emissions if electricity comes from hard coal-fired power plants. Studies conducted on the Chinese power system show that the indirect carbon emissions from BEVs are higher than from ICEVs (internal combustion engine vehicles) [8,9]. This issue is also presented in Ref. [10], where authors pointed out that indirect emissions from BEVs can be higher by 2.55–5.64 kg CO2/day when compared to ICEVs in Poland. Ref. [11] provides the results of carbon emission reduction at the national scale as a function of fuel and electricity consumption under various scenarios of carbon emission factors in Poland.
The existing literature refers to large-scale issues and presents calculations for catalogue data only. The literature review indicates no studies based on actual data on fuel consumption and carbon emissions conducted for an individual company undergoing decarbonisation. Ref. [12] presents a fleet electrification example of a Brazilian taxi company, but is irrelevant for countries with a high share of fossil fuels in power systems.
Electromobility in Poland is a subject analysed in several papers and reports, and the number of studies is growing. None of these papers provides findings on carbon emissions reduction from the perspective of an individual company. Ref. [13] presents multiple aspects of electromobility introduction for one company located in Poland. Ref. [14] provides a general framework for the electrification of public transport and its environmental impact; they mainly focus on the current status of ICEV replacement instead of the quantitative reduction of carbon emissions. Ref. [15] presents only the economic consequences of public fleet electrification.

1.2. Study Contributions

This paper was inspired by the study conducted in Ref. [10], which presents an analysis of the replacement of nine ICEVs—the findings indicating that BEVs can provide even higher carbon emissions than petrol and diesel vehicles in countries with a high share of electricity produced in coal-fired power plants. The main objective of this study is to develop a method that could be applied to a company located in Poland and simulate the replacement of 619 ICEVs; it compares direct emissions from ICEVs and indirect emissions from BEVs. Emissions calculations for BEVs reflect the fuel mix of the Polish power system. We believe that this subject requires attention because company fleets are a substantial part of each country’s vehicle base. Currently, companies often make decisions to try to improve their image as being environmentally friendly. We also believe that these findings will support decision makers in similar companies in their ICEV replacement process. If a positive net impact of fleet electrification on emissions is confirmed, the question of fleet conversion to BEVs (battery electric vehicles) comes down to the total cost of ownership only.
This paper also contributes to the existing literature by depicting the differences between fuel consumption and carbon emissions under real-world conditions, compared to the information provided by car producers.
Section 1 of this paper introduces the subject and explains how this paper contributes to the field. In Section 2 the methods and formulas for calculations are described. Section 3 of this paper presents the input data and numerical simulations; it also involves a discussion of the results of the study. Conclusions are presented in Section 4.

2. Materials and Methods

This paper aims to investigate the impact of fleet electrification on carbon emissions reduction in one company running its business in Poland. This company has 19 subsidiaries, and it operates mainly in the service and utility industry with diverse business profiles (among others, waste management, electricity, and heat production). To investigate the impact of fleet electrification, data from these subsidiaries (that altogether operated 619 cars fuelled by petrol or diesel) were collected and analysed.
The vehicles, which are used by the company, have been divided into six main categories (Table 1) representing the entire fleet, taking into consideration the variety of their applications. These categories include small (class A), medium (class B), and large (class C) passenger cars and SUVs. The remaining categories are cargo vans and commercial medium vehicles. The vehicles from the cargo vans category are intended for service activities, mostly within urban areas. The commercial medium vehicles are also intended for use predominantly in urban areas. Type of fuel is also provided as another distinguishing factor, namely petrol or diesel. The most numerous categories are the cargo vans—197 vehicles (of which 163 are diesel and 34 petrol), commercial medium cars—139 vehicles (all diesel), and B class passenger cars—98 vehicles (of which 35 are diesel and 63 petrol).
Table 1 shows the summary of specifications of ICE vehicles used in the company. Three hundred and twenty-one cars are chosen as representative cars, for which complete data on the total volume of fuel purchased were available over the analysed period. Based on the catalogue data of these vehicles, fuel consumption and carbon emissions per km were calculated. The ranges of results are also presented in this table.

2.1. Internal Combustion Engine Vehicles

In order to calculate the carbon emissions of each category of cars g with internal combustion engines, the average fuel consumption for each representative car per 100 km is required. Fuel consumption F C g ,   r g , f of representative car r g of group g and fuel f   per 100 km in a period analysed is determined by Equation (1):
g G r g R G f F F C g ,   r g , f = F u e l P u r c h a s e g , r g , f C M g , r g , f · 100
where F u e l P u r c h a s e g , r g , f means the total volume of fuel f purchased for representative car r g of group g , and C M g , r g , f is the total mileage of each representative vehicle considered.
Fuel consumption of a representative car of a group g is applied to Equation (2) to calculate the weighted average fuel consumption of each group A F C g , f . To this end, the sum of the products of fuel consumption F C g ,   r g , f for representative car r g of a group g and fuel f per 100 km and weight factors w g , r g , f , are divided by the total number of vehicles in the group g and fuel f of the same type as the representatives T R G N g , f = r g w g , r g , f :
g G f F A F C g , f = r g ( F C g , r g , f · w g , r g , f ) T R G N g , f
where w g , r g , f , means the number of vehicles in a group g with fuel f of the same type as the representative car model selected for each group g and fuel f .
Carbon emissions for representative car rg of a group g with fuel f over an analysed period is given in Equation (3). The average carbon emission factor in a group g with fuel f is calculated as given in Equation (4). The sum of the products of carbon emission factor C O 2 I C E g , r g , f for a representative car r g of a group g with fuel f   and weight factors   w g , r g , f , is divided by the total number of vehicles in the group g with fuel f of the same type as the representatives T R G N g , f = r g w g , r g , f :
g G r g R G f F C O 2 I C E g ,   r g , f = F C g ,   r g , f ·   C O 2 E F f · 10
g G f F A C O 2 I C E g , f = r g ( C O 2 I C E g , r g , f · w g , r g , f ) T R G N g , f
where C O 2 E F f means carbon emission factor of fuel f .
Total average mileage A C M T o t g , f for each group of cars g and fuel f is calculated as is shown in Equation (5):
g G f F A C M T o t g , f = F u e l P u r c h a s e T o t g , f · 100 A F C g , f
where F u e l P u r c h a s e T o t g , f is the total volume of fuel f purchased by all cars in a group g over an analysed period.
Total carbon emission for a group g with fuel f over an analysed period is given in Equation (6). It is a product of the total average mileage for a group of cars g with fuel f and average carbon emissions in a group of cars g with fuel f [18]. Consequently, the total emissions C O 2 I C E T o t   in the entire fleet with internal combustion engines are determined by Equation (7):
g G f F C O 2 I C E T o t g , f = A C M T o t g , f · A C O 2 I C E g , f · 10 6
C O 2 I C E T o t = g , f C O 2 I C E T o t g , f

2.2. Battery Electric Vehicles

In this paper, the authors assume that each car with an internal combustion engine is replaced with a battery electric vehicle. As a result, to calculate the carbon emission factor of the assigned electric vehicle to each group of cars g with fuel f , the electricity consumption and CO2 emission intensity of electricity generation at the national level are considered. The formula is presented in Equation (8):
g G f F C O 2 B E V g , f = C O 2 E m I n t e n s i t y · E C g , f 100
where C O 2 E m I n t e n s i t y means carbon emission intensity of electricity generation, and E C g , f is the electricity consumption of the assigned battery electric vehicle of a group of cars g with fuel f per 100 km.
Total carbon emissions for a group g with fuel f in an analysed period is given in Equation (9). The carbon emission factor of the assigned battery electric vehicle of each group of cars and the total average mileage for a group of cars g with fuel f in the analysed period are taken into account. Consequently, the total emissions in BEVs are determined by Equation (10):
g G f F T o t C O 2 B E V g , f = C O 2 B E V g , f · A C M T o t g , f · 10 6
T o t C O 2 B E V = g , f T o t C O 2 B E V g , f
Electricity consumption in BEVs corresponding to each group of cars g with fuel f is also used to calculate total electricity consumption depending on the average mileage for each group g and fuel f , as is given in Equation (11). The study assumes fleet electrification at the level of 100%:
g G f F   T o t E C g , f = A C M T o t g , f · E C g , f 100
The total electricity consumption is used to calculate the total charging cost of electric vehicles corresponding to each group of cars g and fuel f , as is given in Equation (12):
T o t a l C h a r g i n g C o s t g , f =   0.8 · T o t E C g , f · ( 1 + A C L o s s 100 ) · A C C o s t + 0.2 · T o t E C g , f · D C C o s t
where A C L o s s is the losses from AC charging, A C C o s t means the cost of electricity (for the AC charging), and D C C o s t is the charging service cost (for the DC charging).
Total cost of ownership (TCO) analysis has been conducted and compared between ICE vehicles and BEVs for two categories of cars (SUVs and B class). To this end, the following cost components were used in the analysis: cost of fuel or electricity, financial rate, and service rate.

2.3. Case Study Assumptions

The formulas presented in Section 2.2 were applied to the case study of a fleet of 619 ICE vehicles that were considered for replacement with battery electric cars in the coming years. Apart from economic reasons, the companies intended to reduce the carbon footprint of their business. That is why the impact of mobility on the group’s carbon footprint and its potential reduction was of the utmost importance.
For the sake of representativeness of the results, a pre-covid period of one year between March 2019 and February 2020 was chosen. The analysis was conducted based on data on fuel consumption gathered from petrol retailers (fuel cards are the only form of fuel payments in the company). Additionally, since each employee is obliged to provide data on current mileage to the company’s system with every fuel purchase, these data were also used in the study. The whole database constitutes fifty-nine thousand entries.
Due to the heterogeneity of the input data and their poor quality in some cases, concerning the number of kilometres travelled for business purposes, the data set was cleansed from obvious errors in the mileage reported by employees, non-fuel-related purchases at petrol stations, and empty entries. As previously mentioned, representative vehicles were chosen for each category, based on the number of vehicles of a given model in the category, the mileage, and continuity of usage over the analysed period. As a result, the analysis includes 22 vehicle models (two for each category), represented by 321 individual vehicles.
For each representative vehicle, average fuel consumption was calculated. The calculation was based on all available data for each representative car (not limited to the analysis period only). In order to estimate the real carbon emissions (g/km) for the representative cars, the tailpipe carbon emission factor for combustion of 1 dm3 petrol and diesel was used, at the level of 2.3 and 2.6, respectively [19]. In order to compare real carbon emissions, adequate for Polish weather conditions, an average of combined real data for cold weather (worst case based on −10 °C and use of heating) and mild weather (23 °C and no use of air conditioning) was considered.
The analysis assumed that each vehicle from the categories listed in Table 1 could be replaced with a specific electric car model. The parameters of these BEVs, primarily in terms of size and possible applications, were similar to ICE vehicles from the corresponding categories. Data for these electric vehicles, including their engine power, electricity consumption per 100 km, and driving range with a fully charged battery, are presented in Table 2.
One of the main assumptions regarding the impact analysis of fleet electrification on carbon emissions was the CO2 emission factor per unit of electricity production. Poland is an example of a country heavily dependent on fossil fuels—mainly hard coal and lignite. As a result, the CO2 emission factor for electricity available for the end-user (i.e., produced in thermal power plants, including electricity supplied by RES units and including transmission losses and balance differences) amounted to 719 kg CO2 per MWh in 2019 [26]. It was also one of the highest rates in the entire EU (Figure 2), which significantly influenced the final calculations of the possible fleet conversion effect.
However, Poland is undergoing a transition process towards a low-emission economy and decarbonisation of the power system [27]. According to the new Energy Policy of Poland until 2040 (EPP2040), in 2040, the assumed fuel mix of electricity generation (i.e., 27.9% coal, 17.0% gas, 13.6% nuclear, 39.5% renewables, and 2.0% others [28]) might result in a reduction in the carbon intensity of electricity generation, to the level of 378 kg CO2/MWh (own estimations).
Another key assumption was that the entire fleet of ICE cars would be replaced with battery electric vehicles at the same time (100% conversion). Although the replacement of vehicles would be phased and spread over time, such an assumption allows one to calculate the maximum effects of fleet electrification. These findings are valuable from the perspective of company management because they provide the information needed to define or verify strategic goals.
As previously mentioned, in addition to investigating the impact of fleet electrification on CO2 emissions, the work also provides the results of potential savings related to the purchase of petrol or diesel (for ICE cars) and battery-charging costs (for BEVs). Information on fuel consumption costs for each ICE category was assumed based on historical data from petrol retailers and fuel cards of the company’s employees. In the case of BEVs, a model for charging electric vehicles was defined as follows: 80% of total electricity consumption is covered from AC chargers and 20% from high-power DC chargers [30,31]. Electricity costs for AC chargers and total fees related to charging the vehicle at stations equipped with DC chargers are given in Table 3. It is also worth noting that the process of charging electric vehicle batteries is not without losses. Therefore, based on the data presented in Ref. [31], charging losses were assumed at the level of 10% to reflect losses between electric vehicle supply equipment (EVSE) and transformers. Taking into account the current policy of car dealers in Poland of providing mobile AC chargers (usually 3.7 kW or 11 kW) free of charge or for a symbolic fee, the focus was on carbon emissions rather than TCO, and considering the negligible cost of such a charger compared to the TCO of a vehicle, authors decided to exclude AC charger capital expenditure from the analysis.

3. Results and Discussion

This section presents and discusses the results obtained from the employment of the mathematical formulas to the case study of an individual company. The average total monthly fuel consumption is shown in Figure 3. The analysis indicates that the fleet consumes more than 52 thous. dm3 of fuel (18 thous. dm3 of petrol and 34 thous. dm3 of diesel) per month, corresponding to 135.7 Mg of CO2. What is also noticeable, is that the largest share in the total monthly fuel consumption (and consequently in the carbon emission) was from the diesel-fuelled cars: cargo vans (20.7%), commercial medium vehicles (18.2%), and passenger C class vehicles (13.2%). These categories were the most significant in the electrification of the company’s fleet. Replacing these ICEV groups with BEVs would give the best results for decreasing emissions from fuel combustion (NOx, SOx, VOC, CO, and PM), which are responsible for the phenomenon of low-stack emissions.

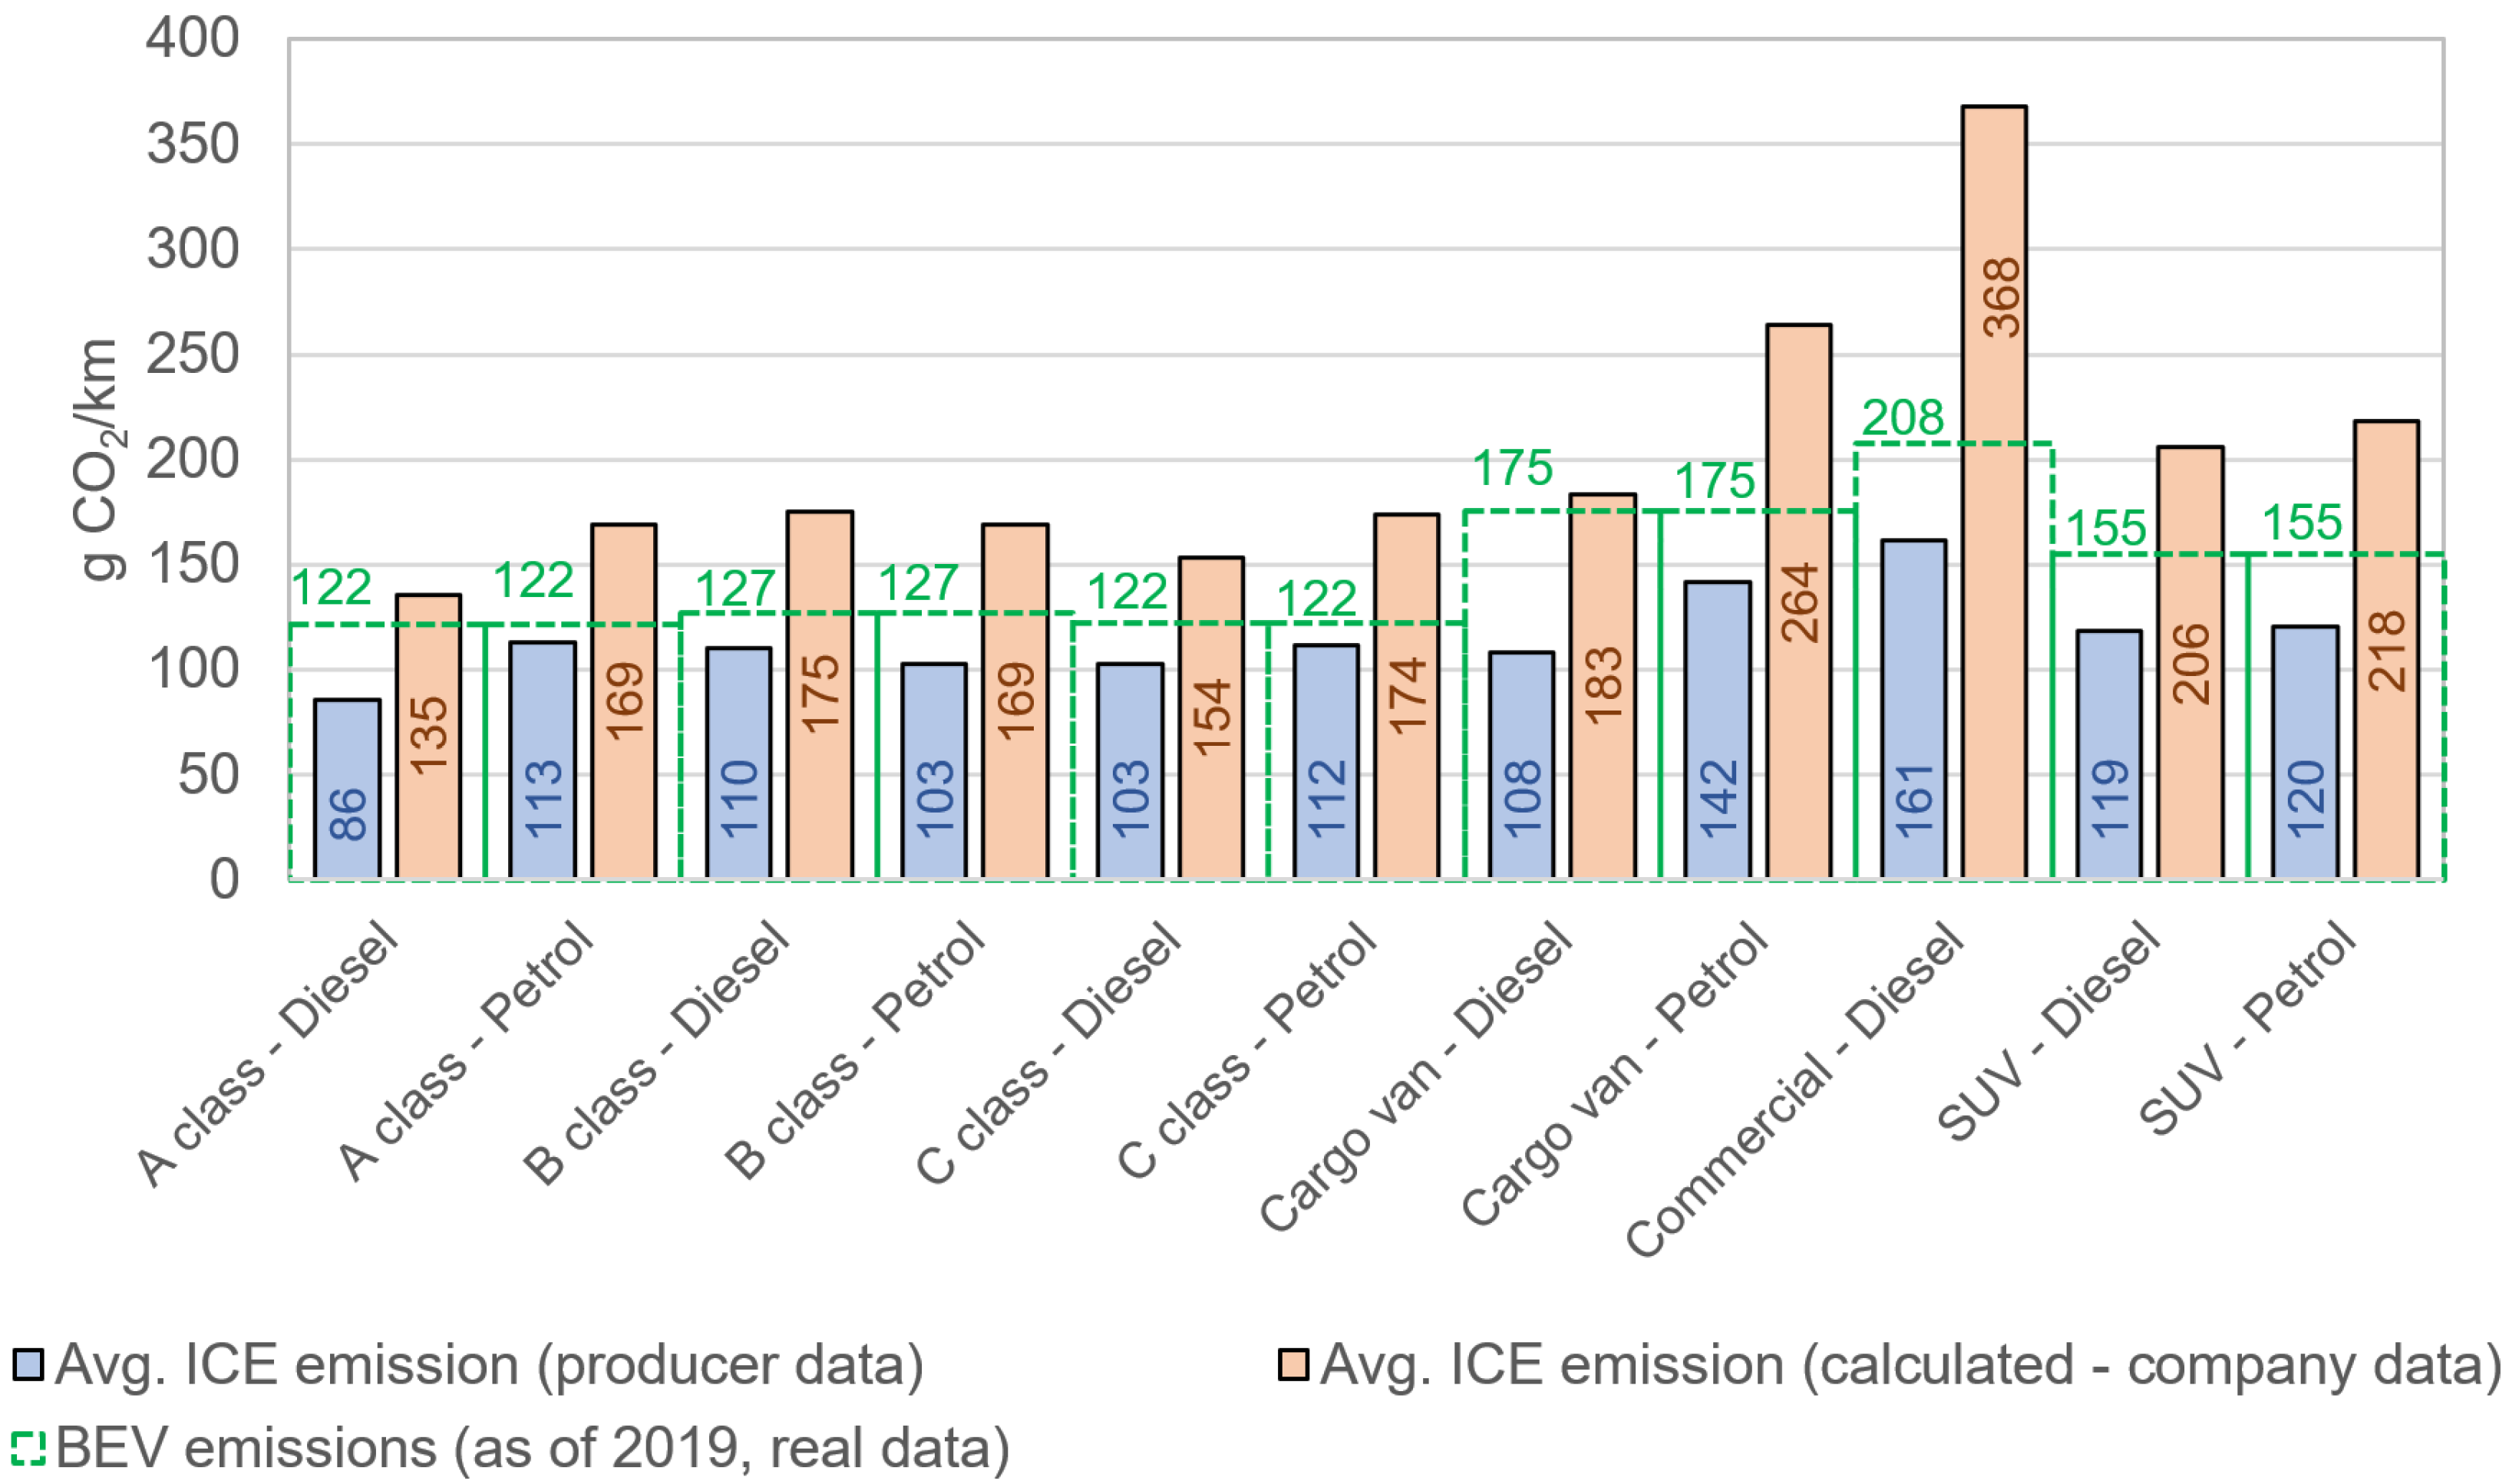
3.1. Fuel Consumption and Carbon Emissions

As previously mentioned, two representative vehicles were chosen for each category (Table 1), taking into account the number of a given car model in each category. Then, vehicles were reviewed based on their mileage and continuity of mileage to find the most representative vehicles for a given category. Consequently, the fuel consumption of each group and level of carbon emissions was calculated and compared with the catalogue data published by the producers of the representatives considered. The results are presented in Figure 4 and Figure 5, respectively.
It can be noticed that real fuel consumption and carbon emission levels were higher across all categories in the case of ICE cars. Particularly:
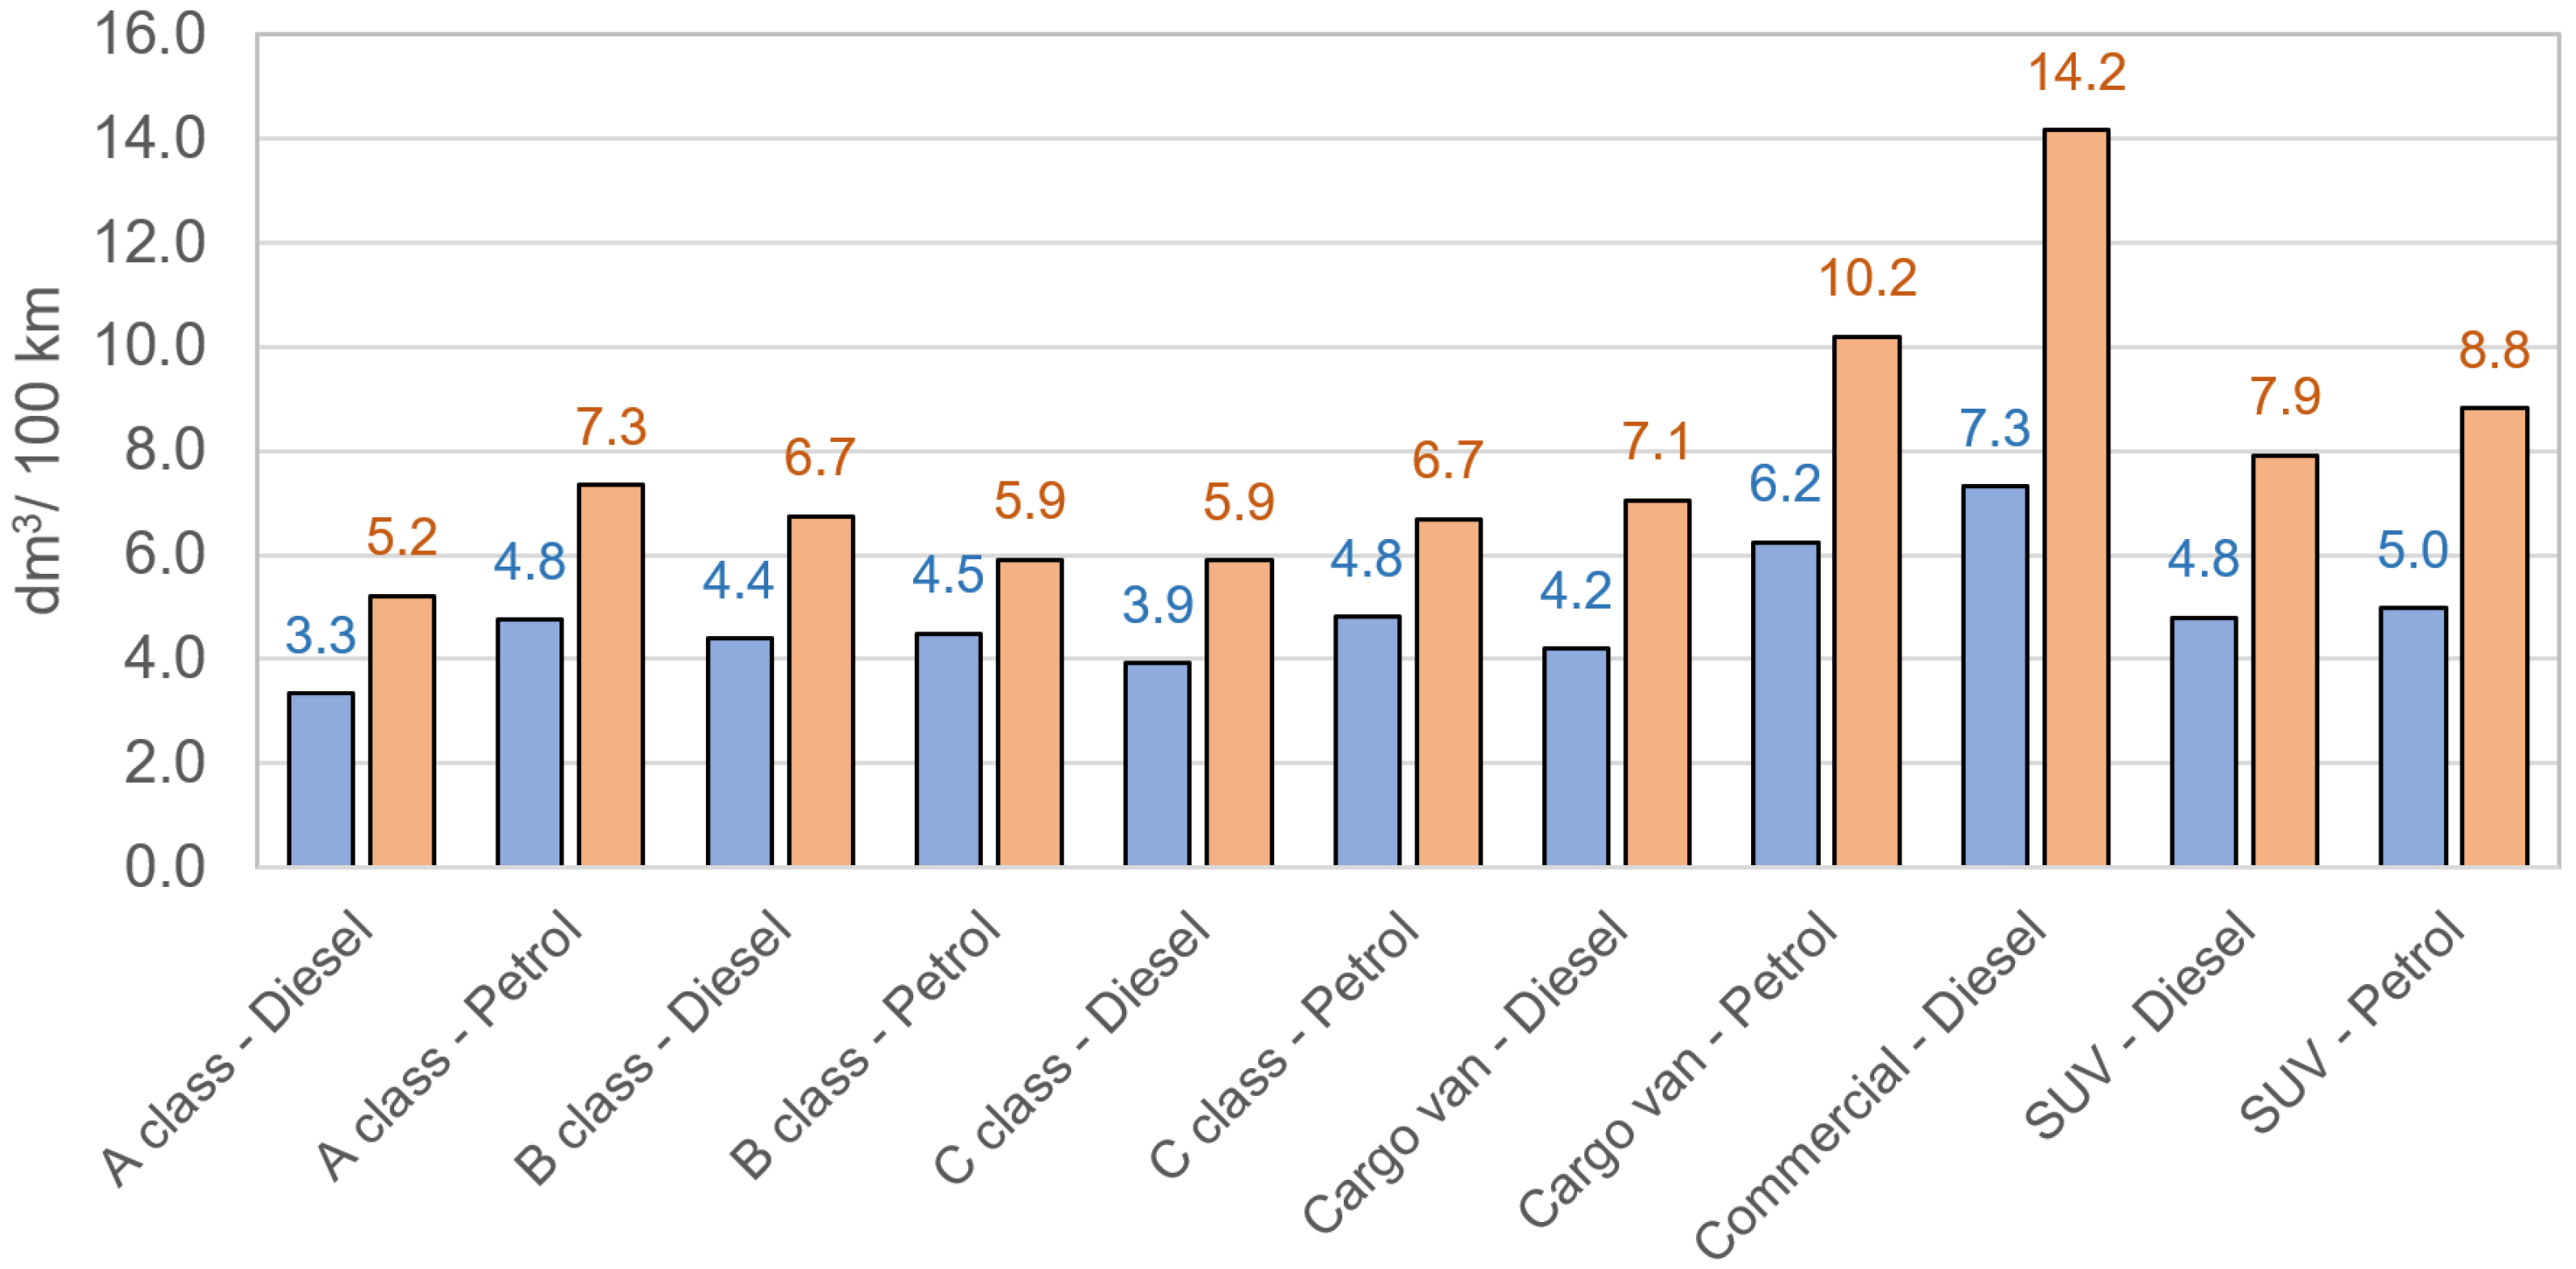
  • For commercial medium vehicles, fuel consumption increased by 94%, which can be attributed to prevalently urban usage (the Worldwide Harmonised Light Vehicles Test Procedure (WLTP) and similar fuel consumption tests assume mixed usage).
  • For SUVs, the fuel consumption increase was observed at the level of 77%, making this category particularly interesting for further considerations in the context of a confidence level of the data on fuel consumption published by producers, conversion to BEVs and for introducing eco-driving training dedicated for SUV users.

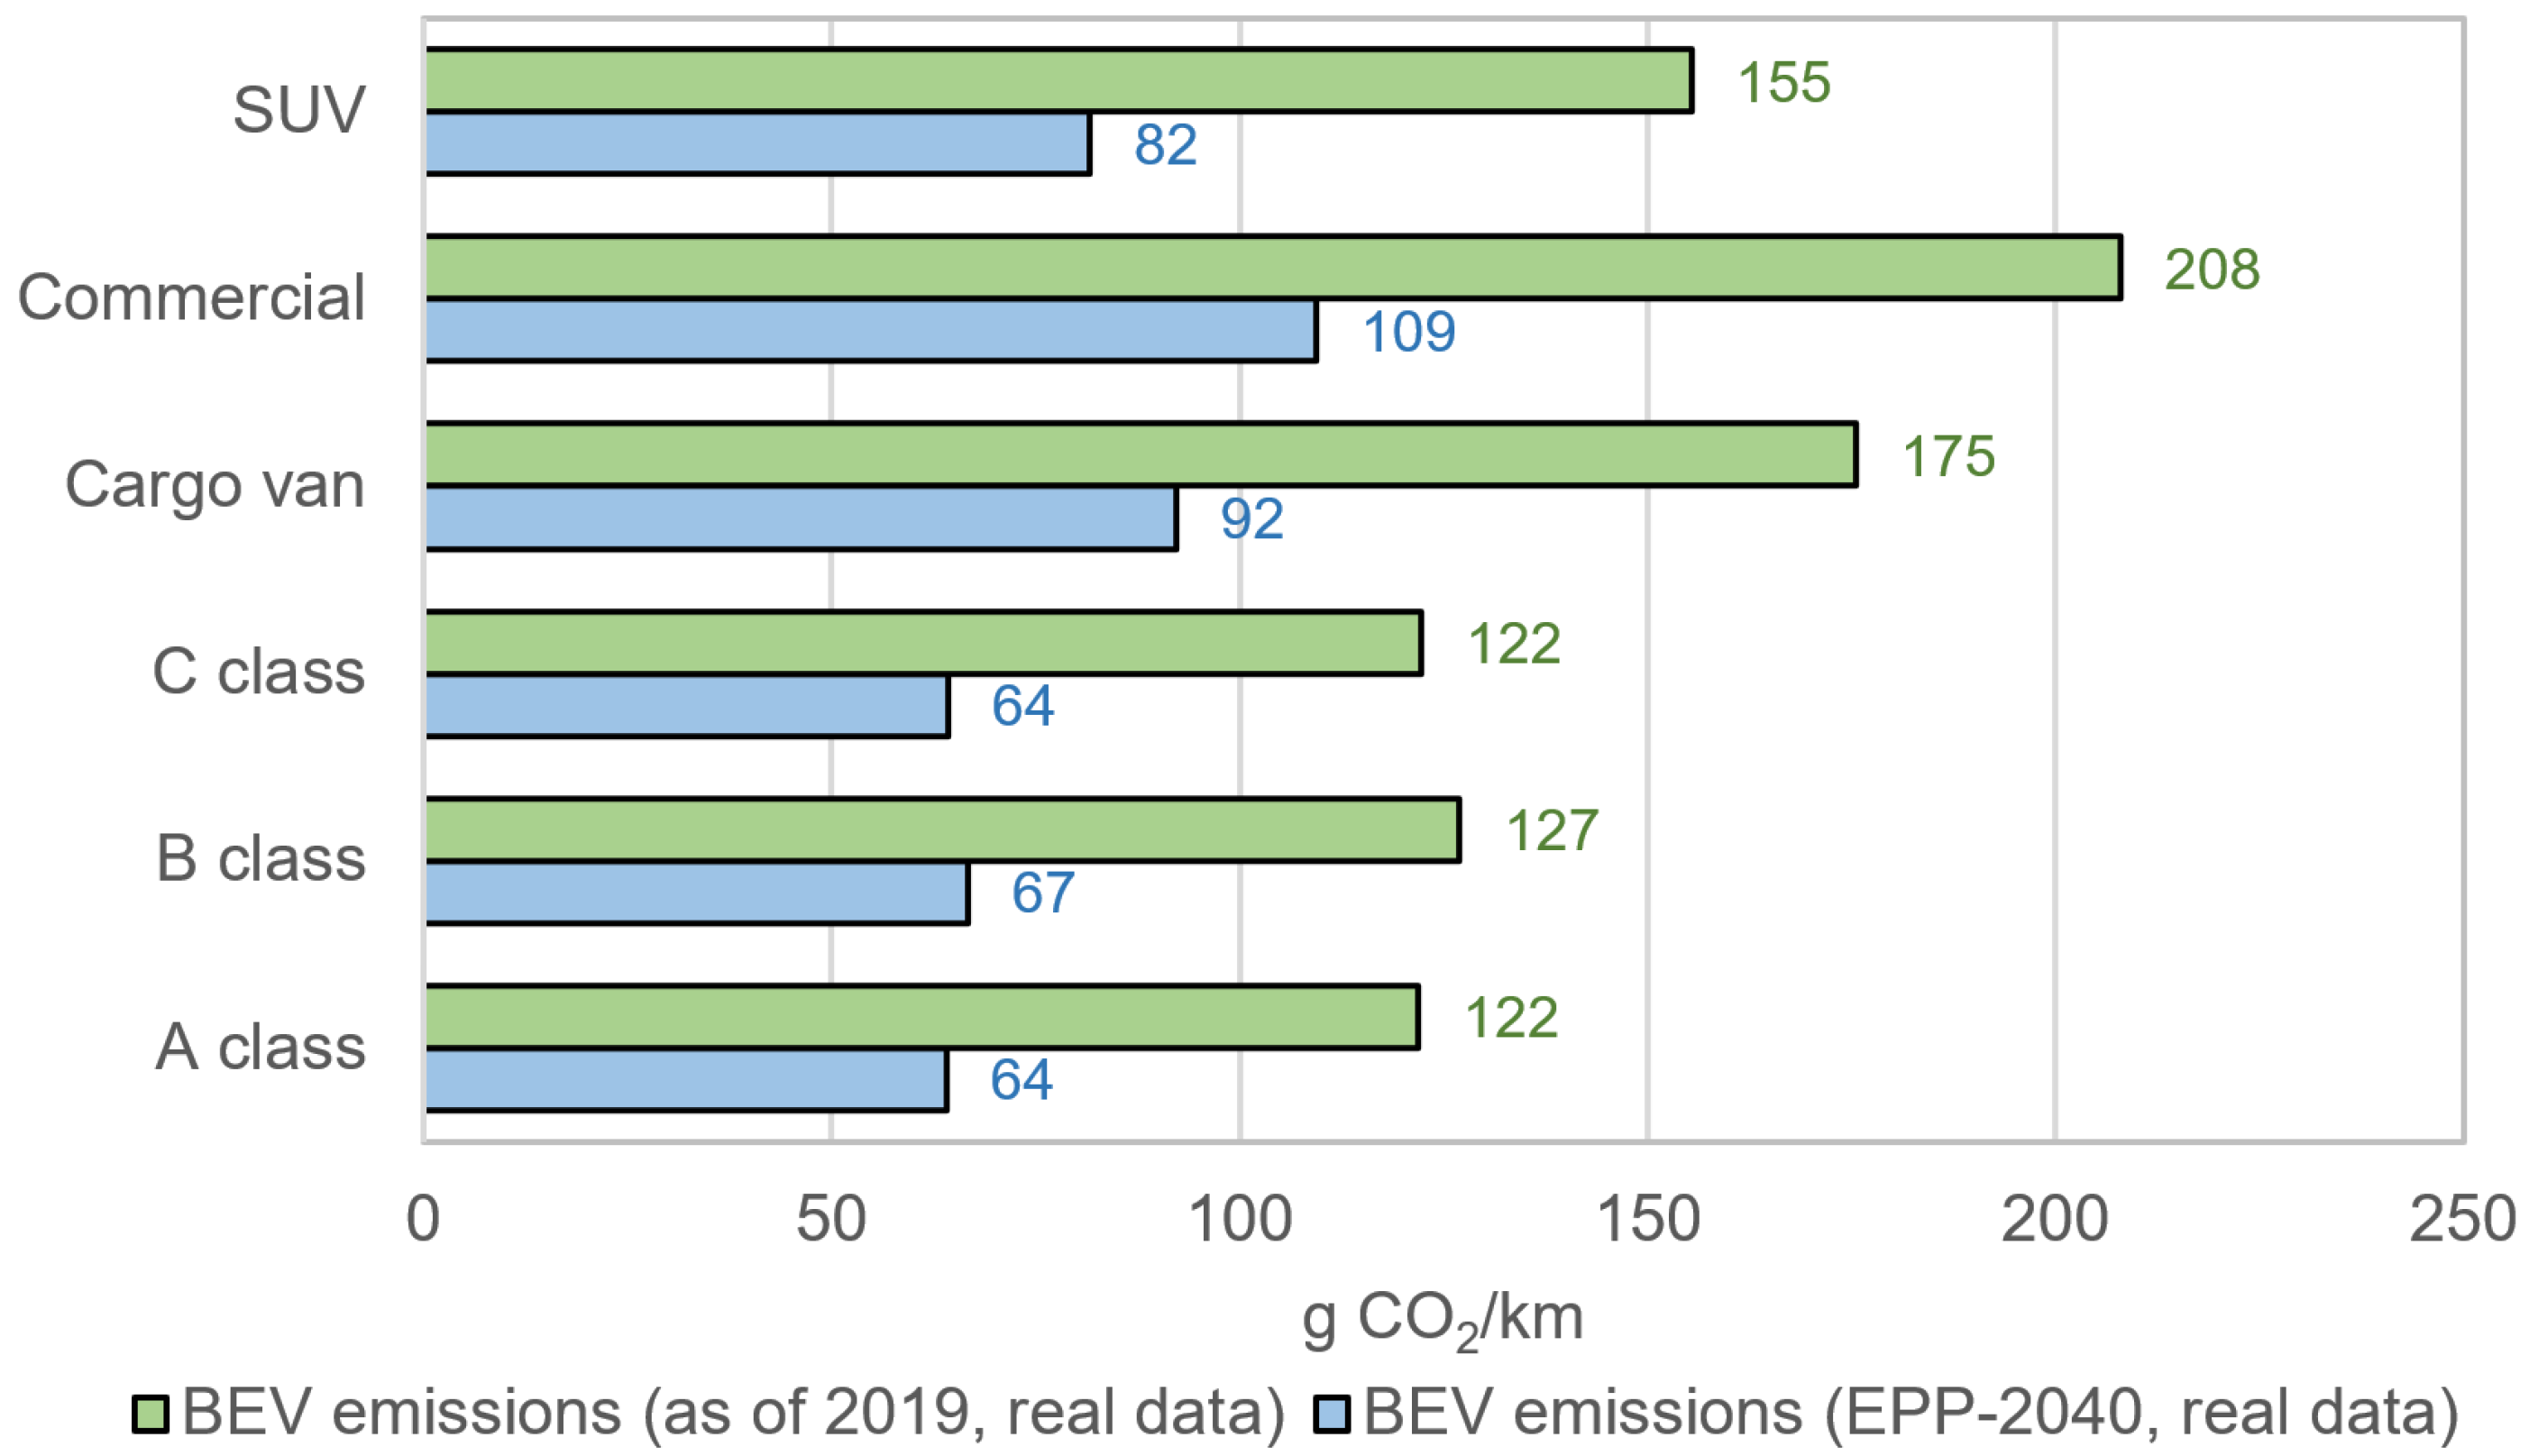
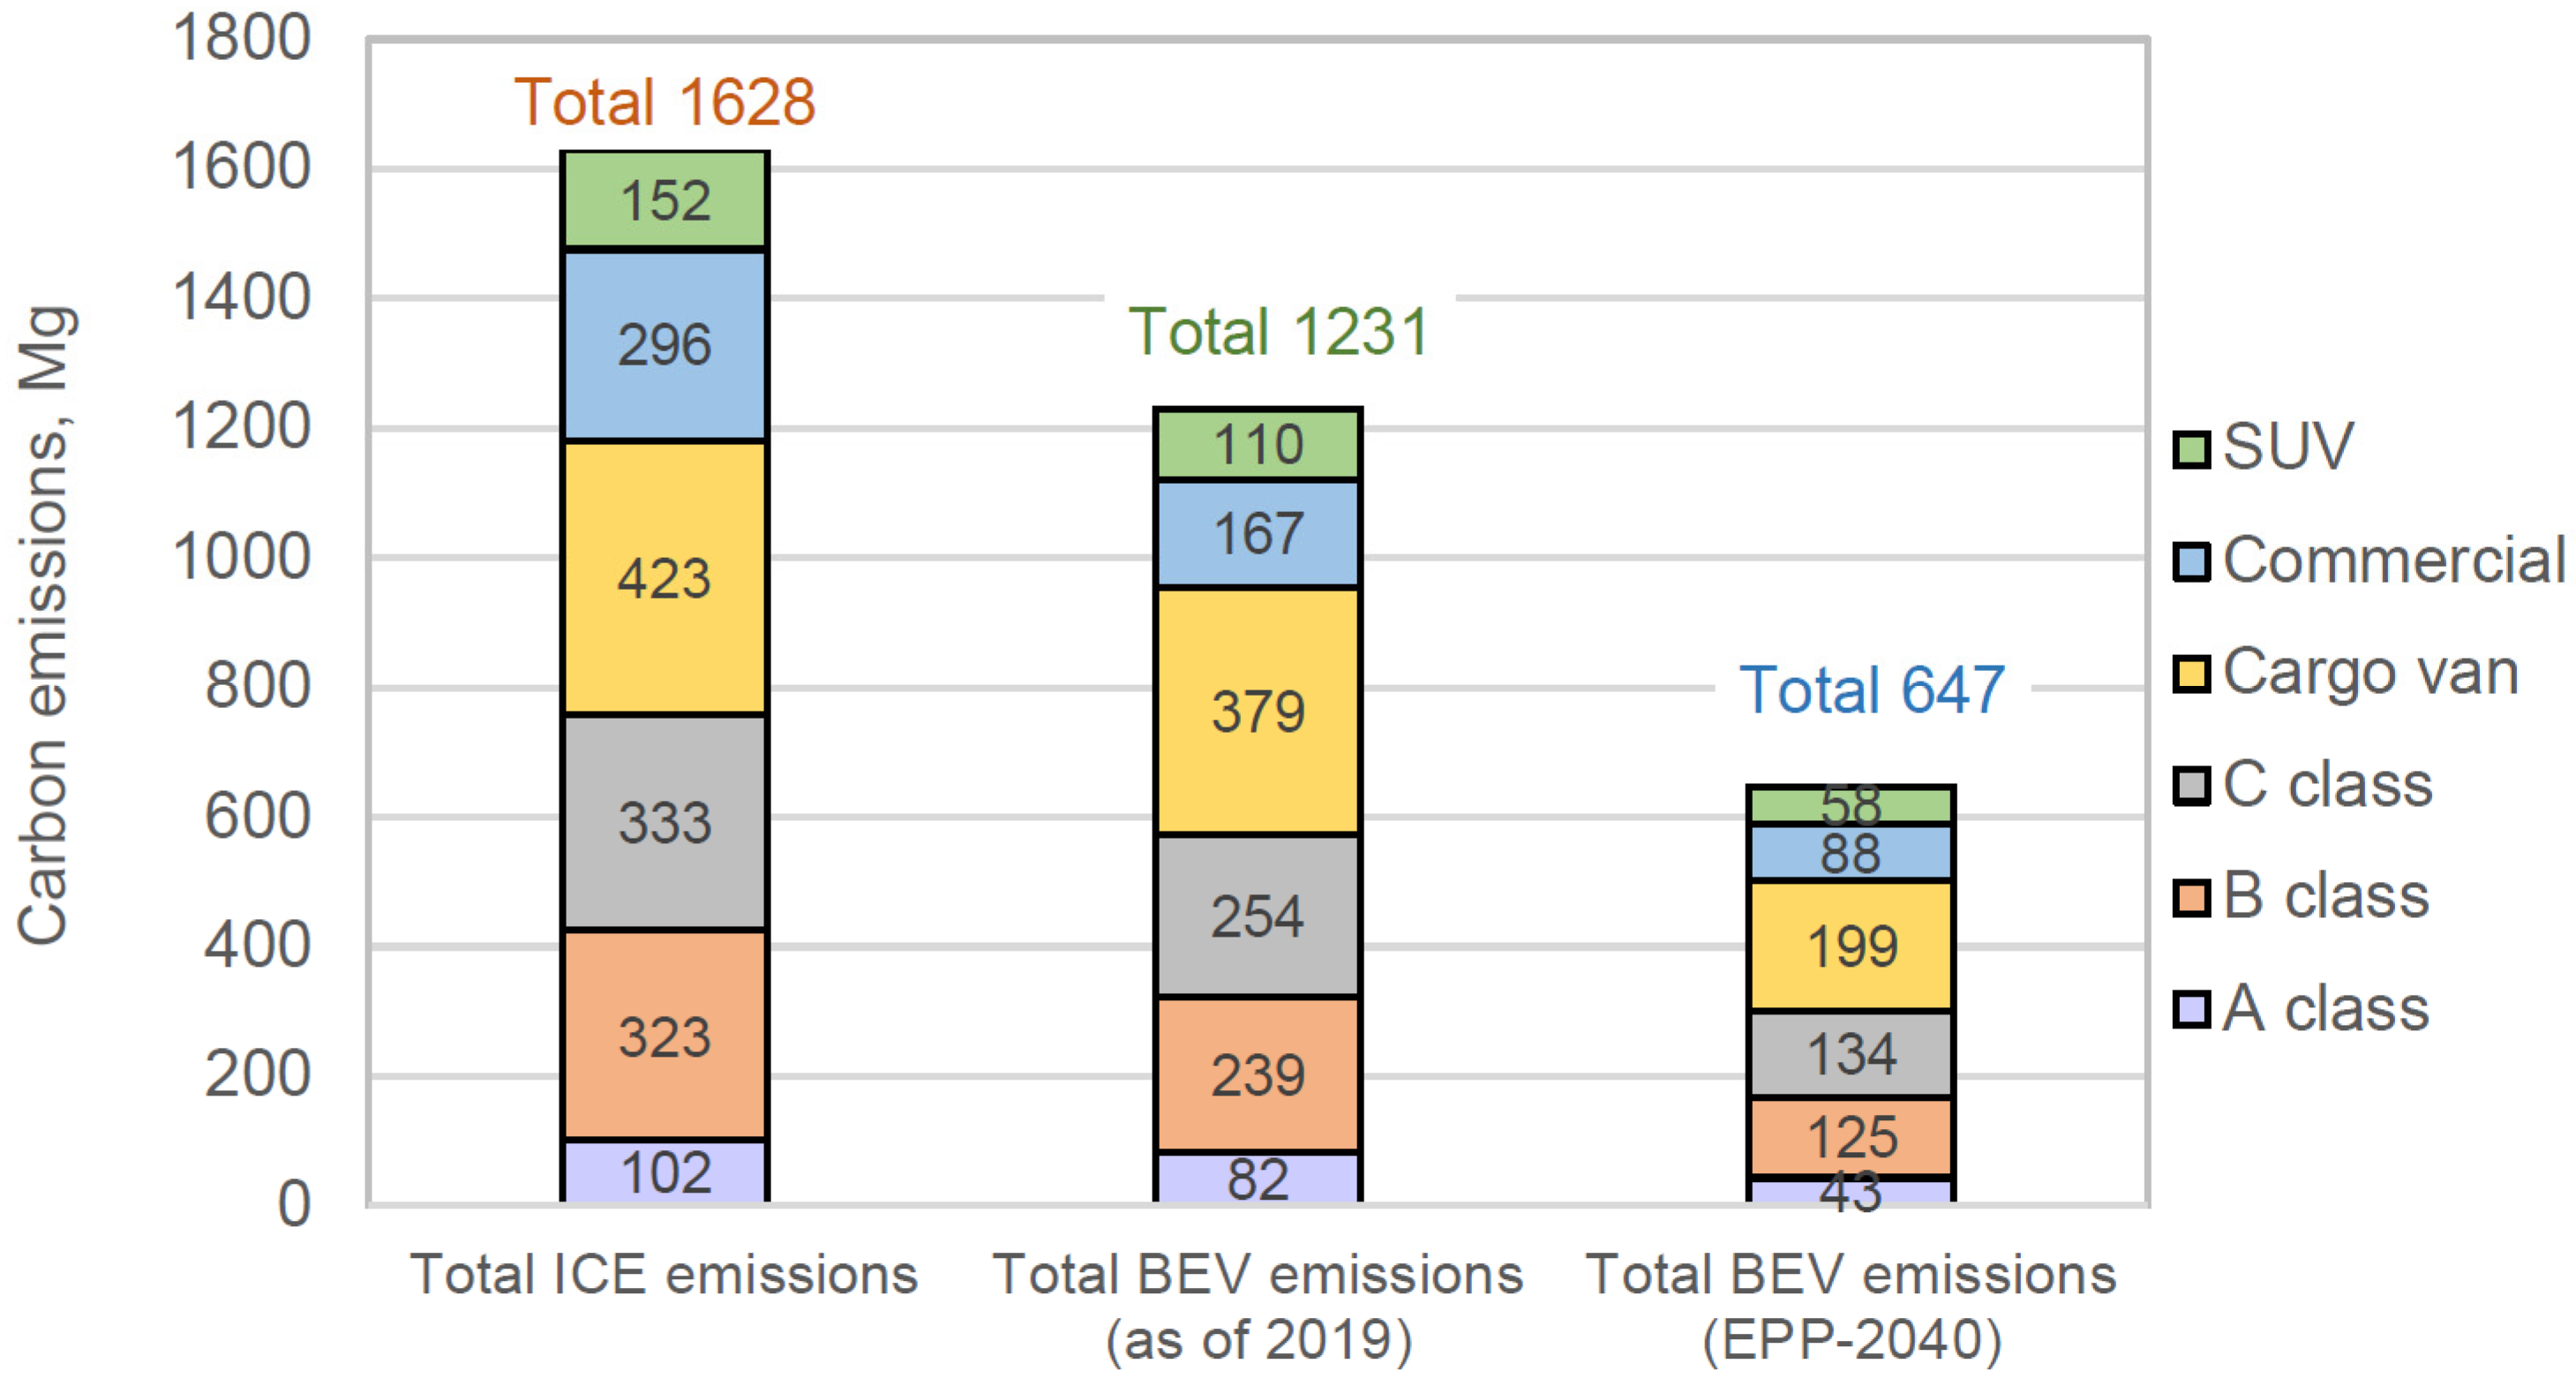
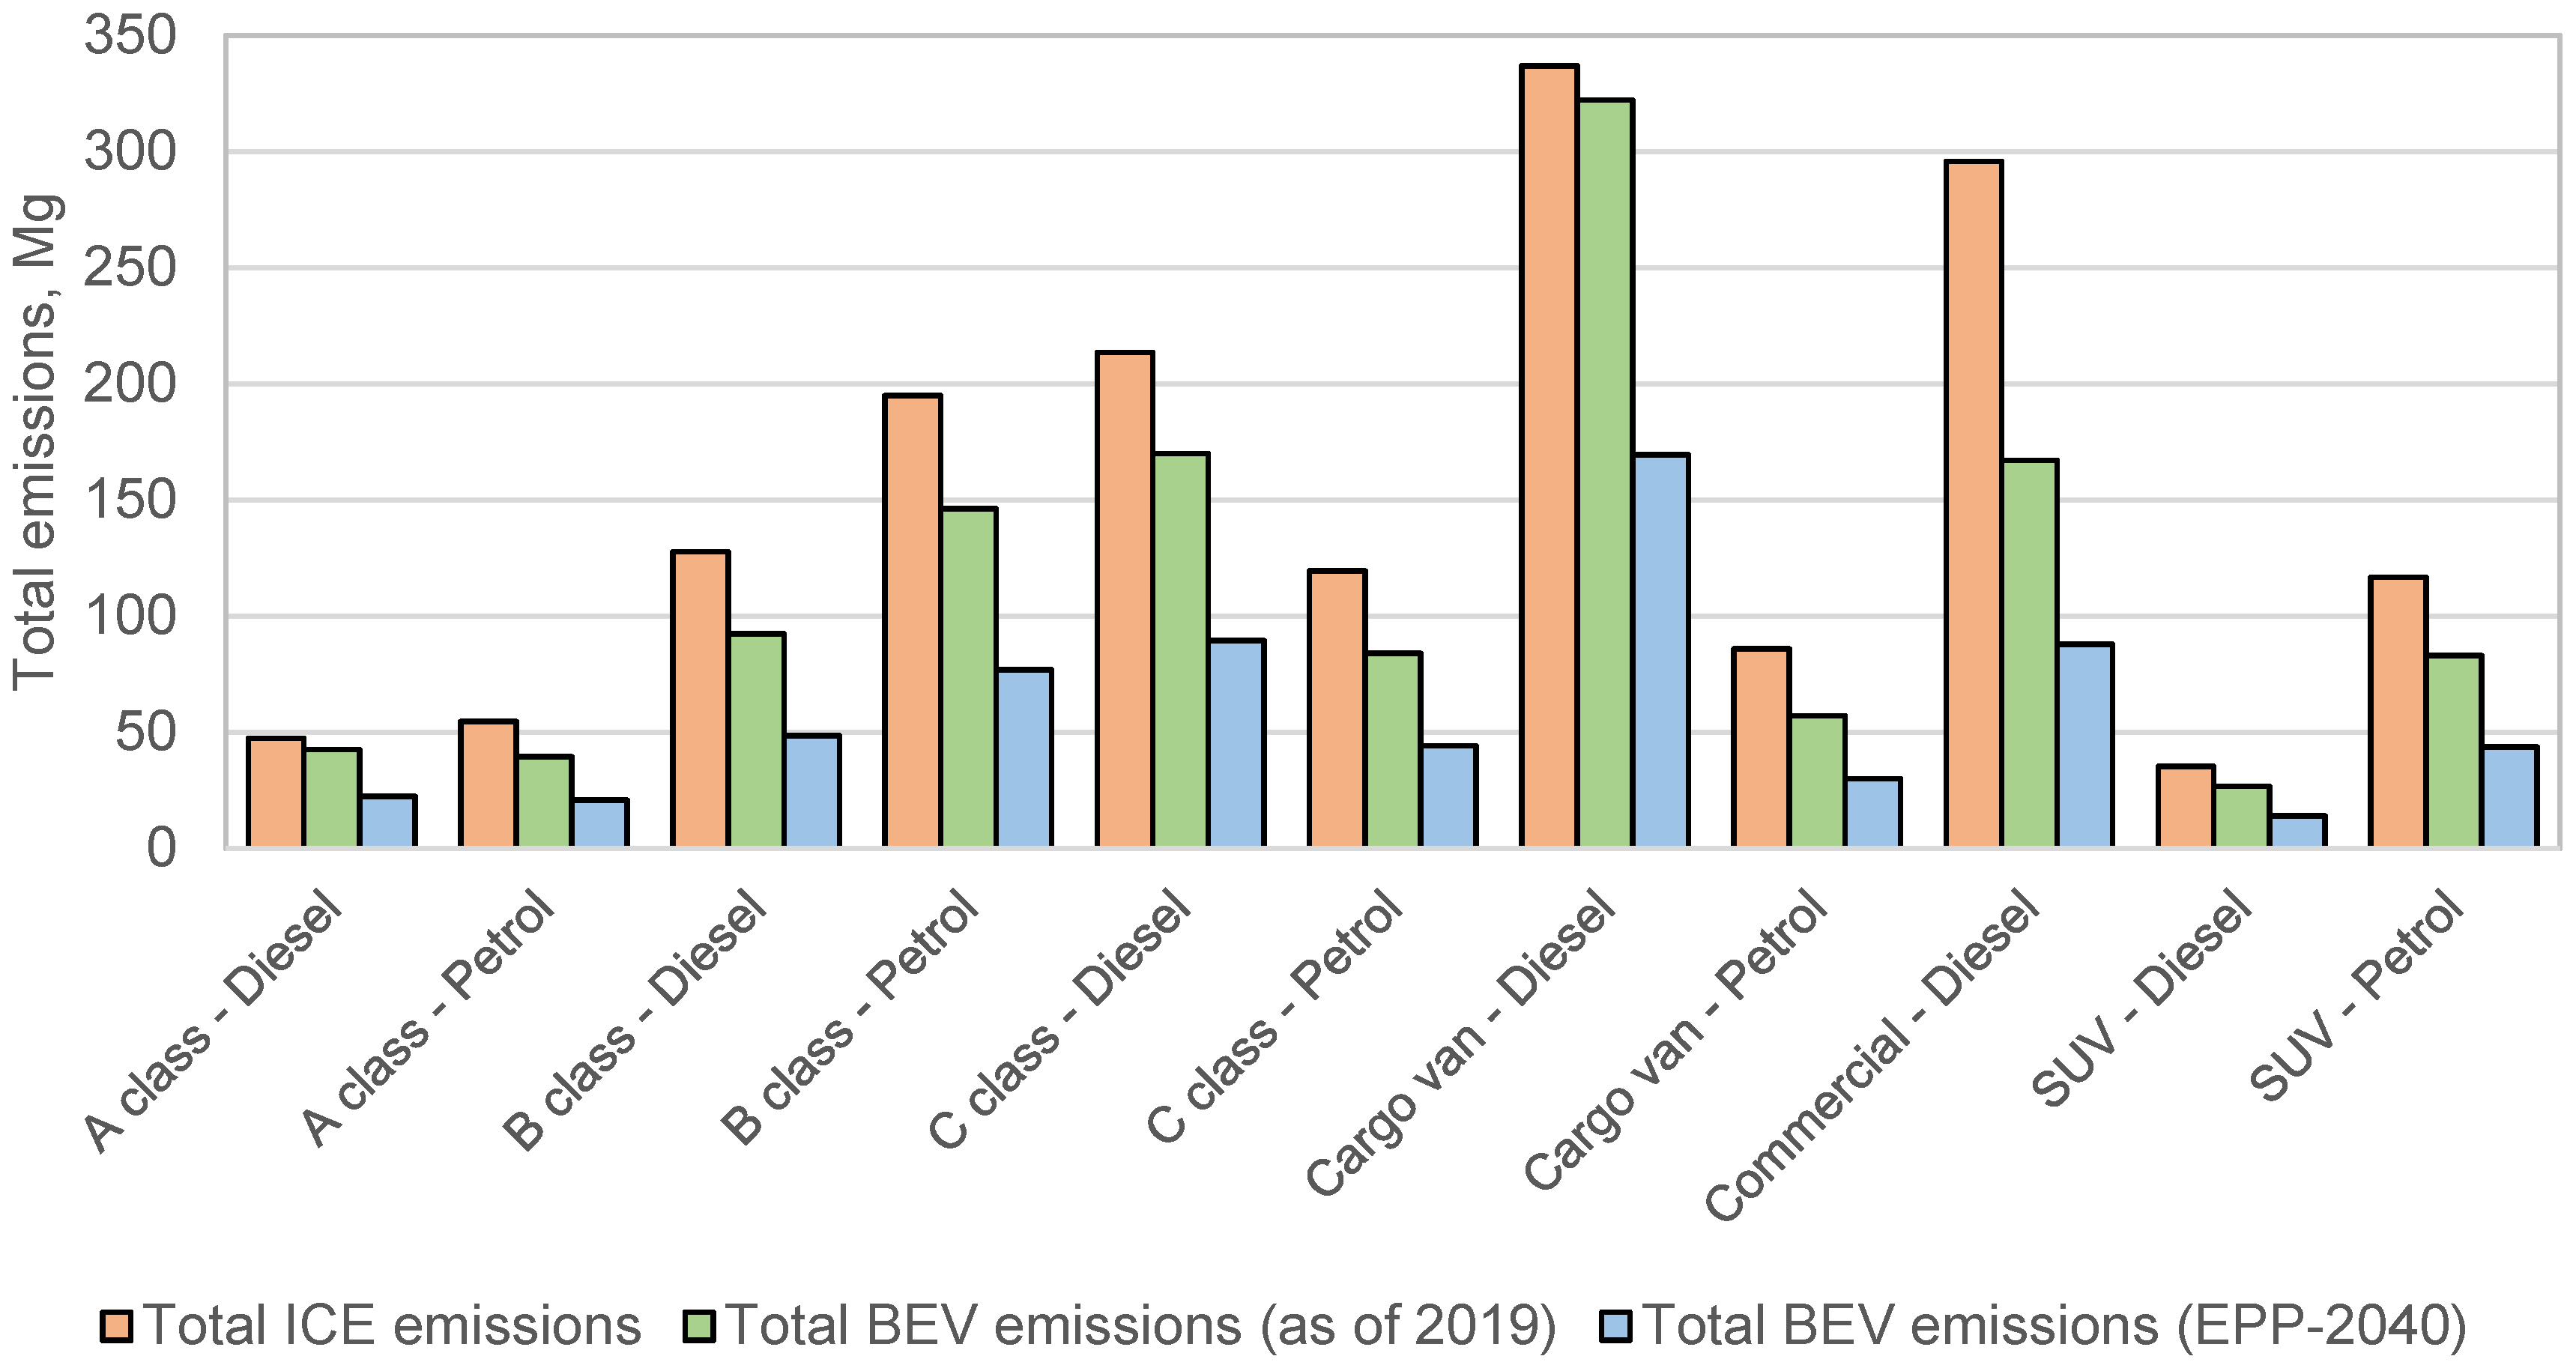
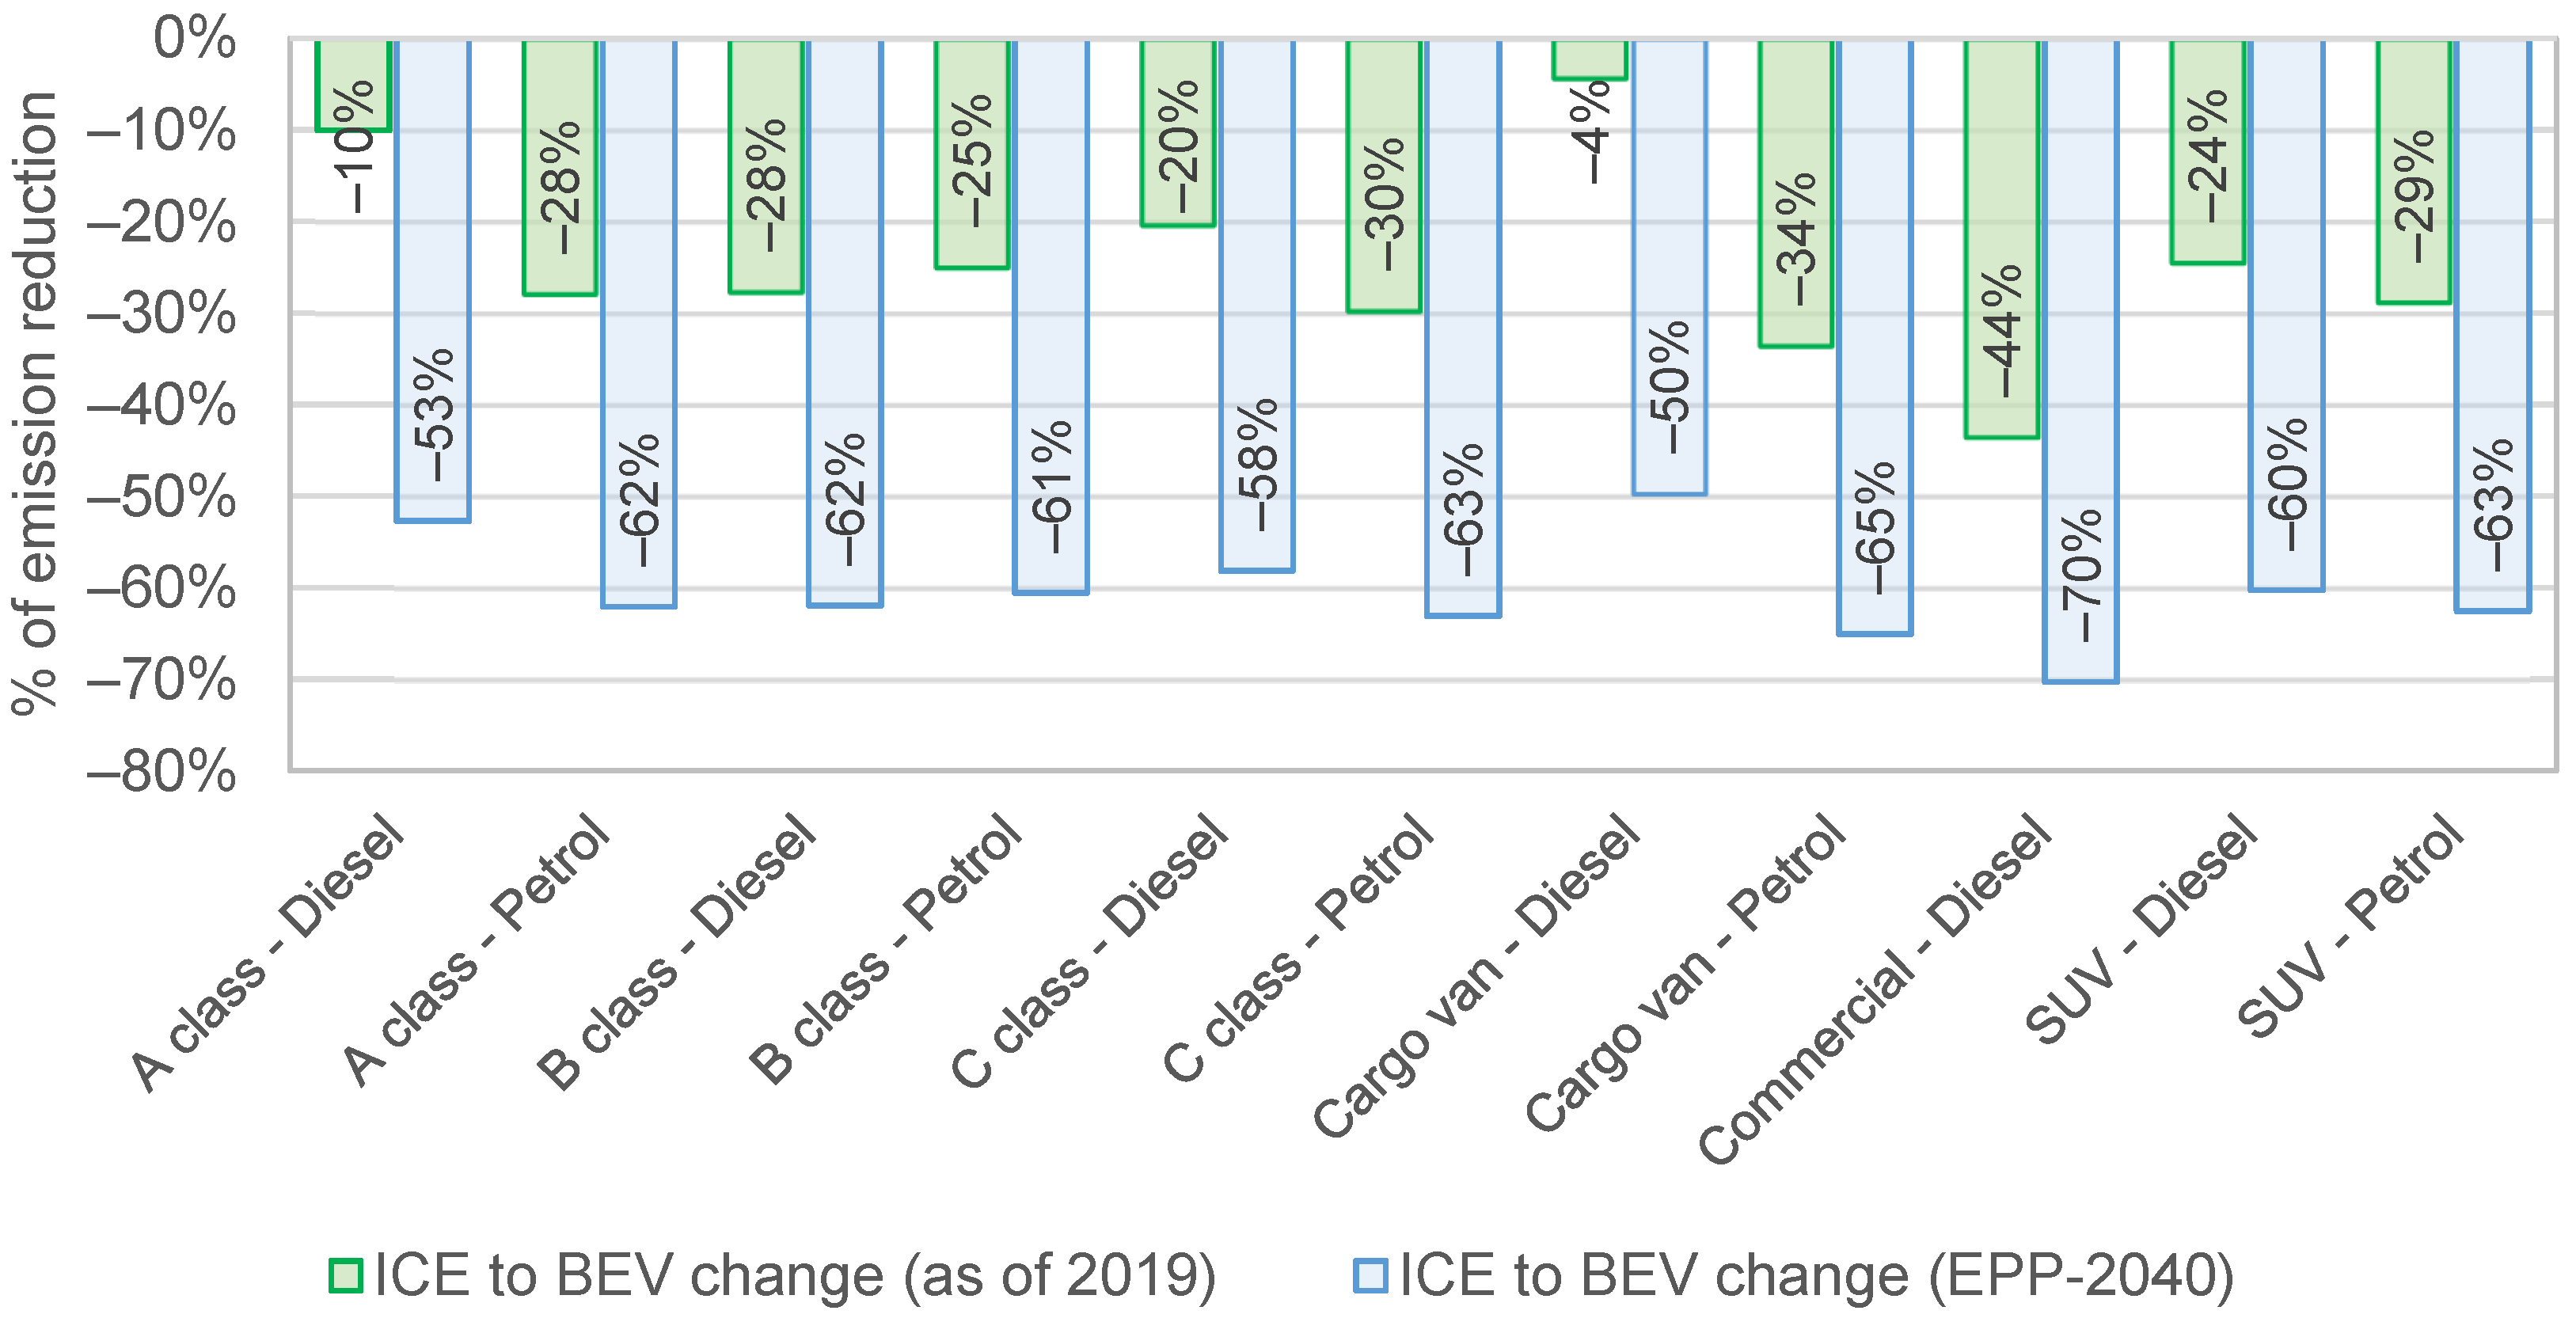
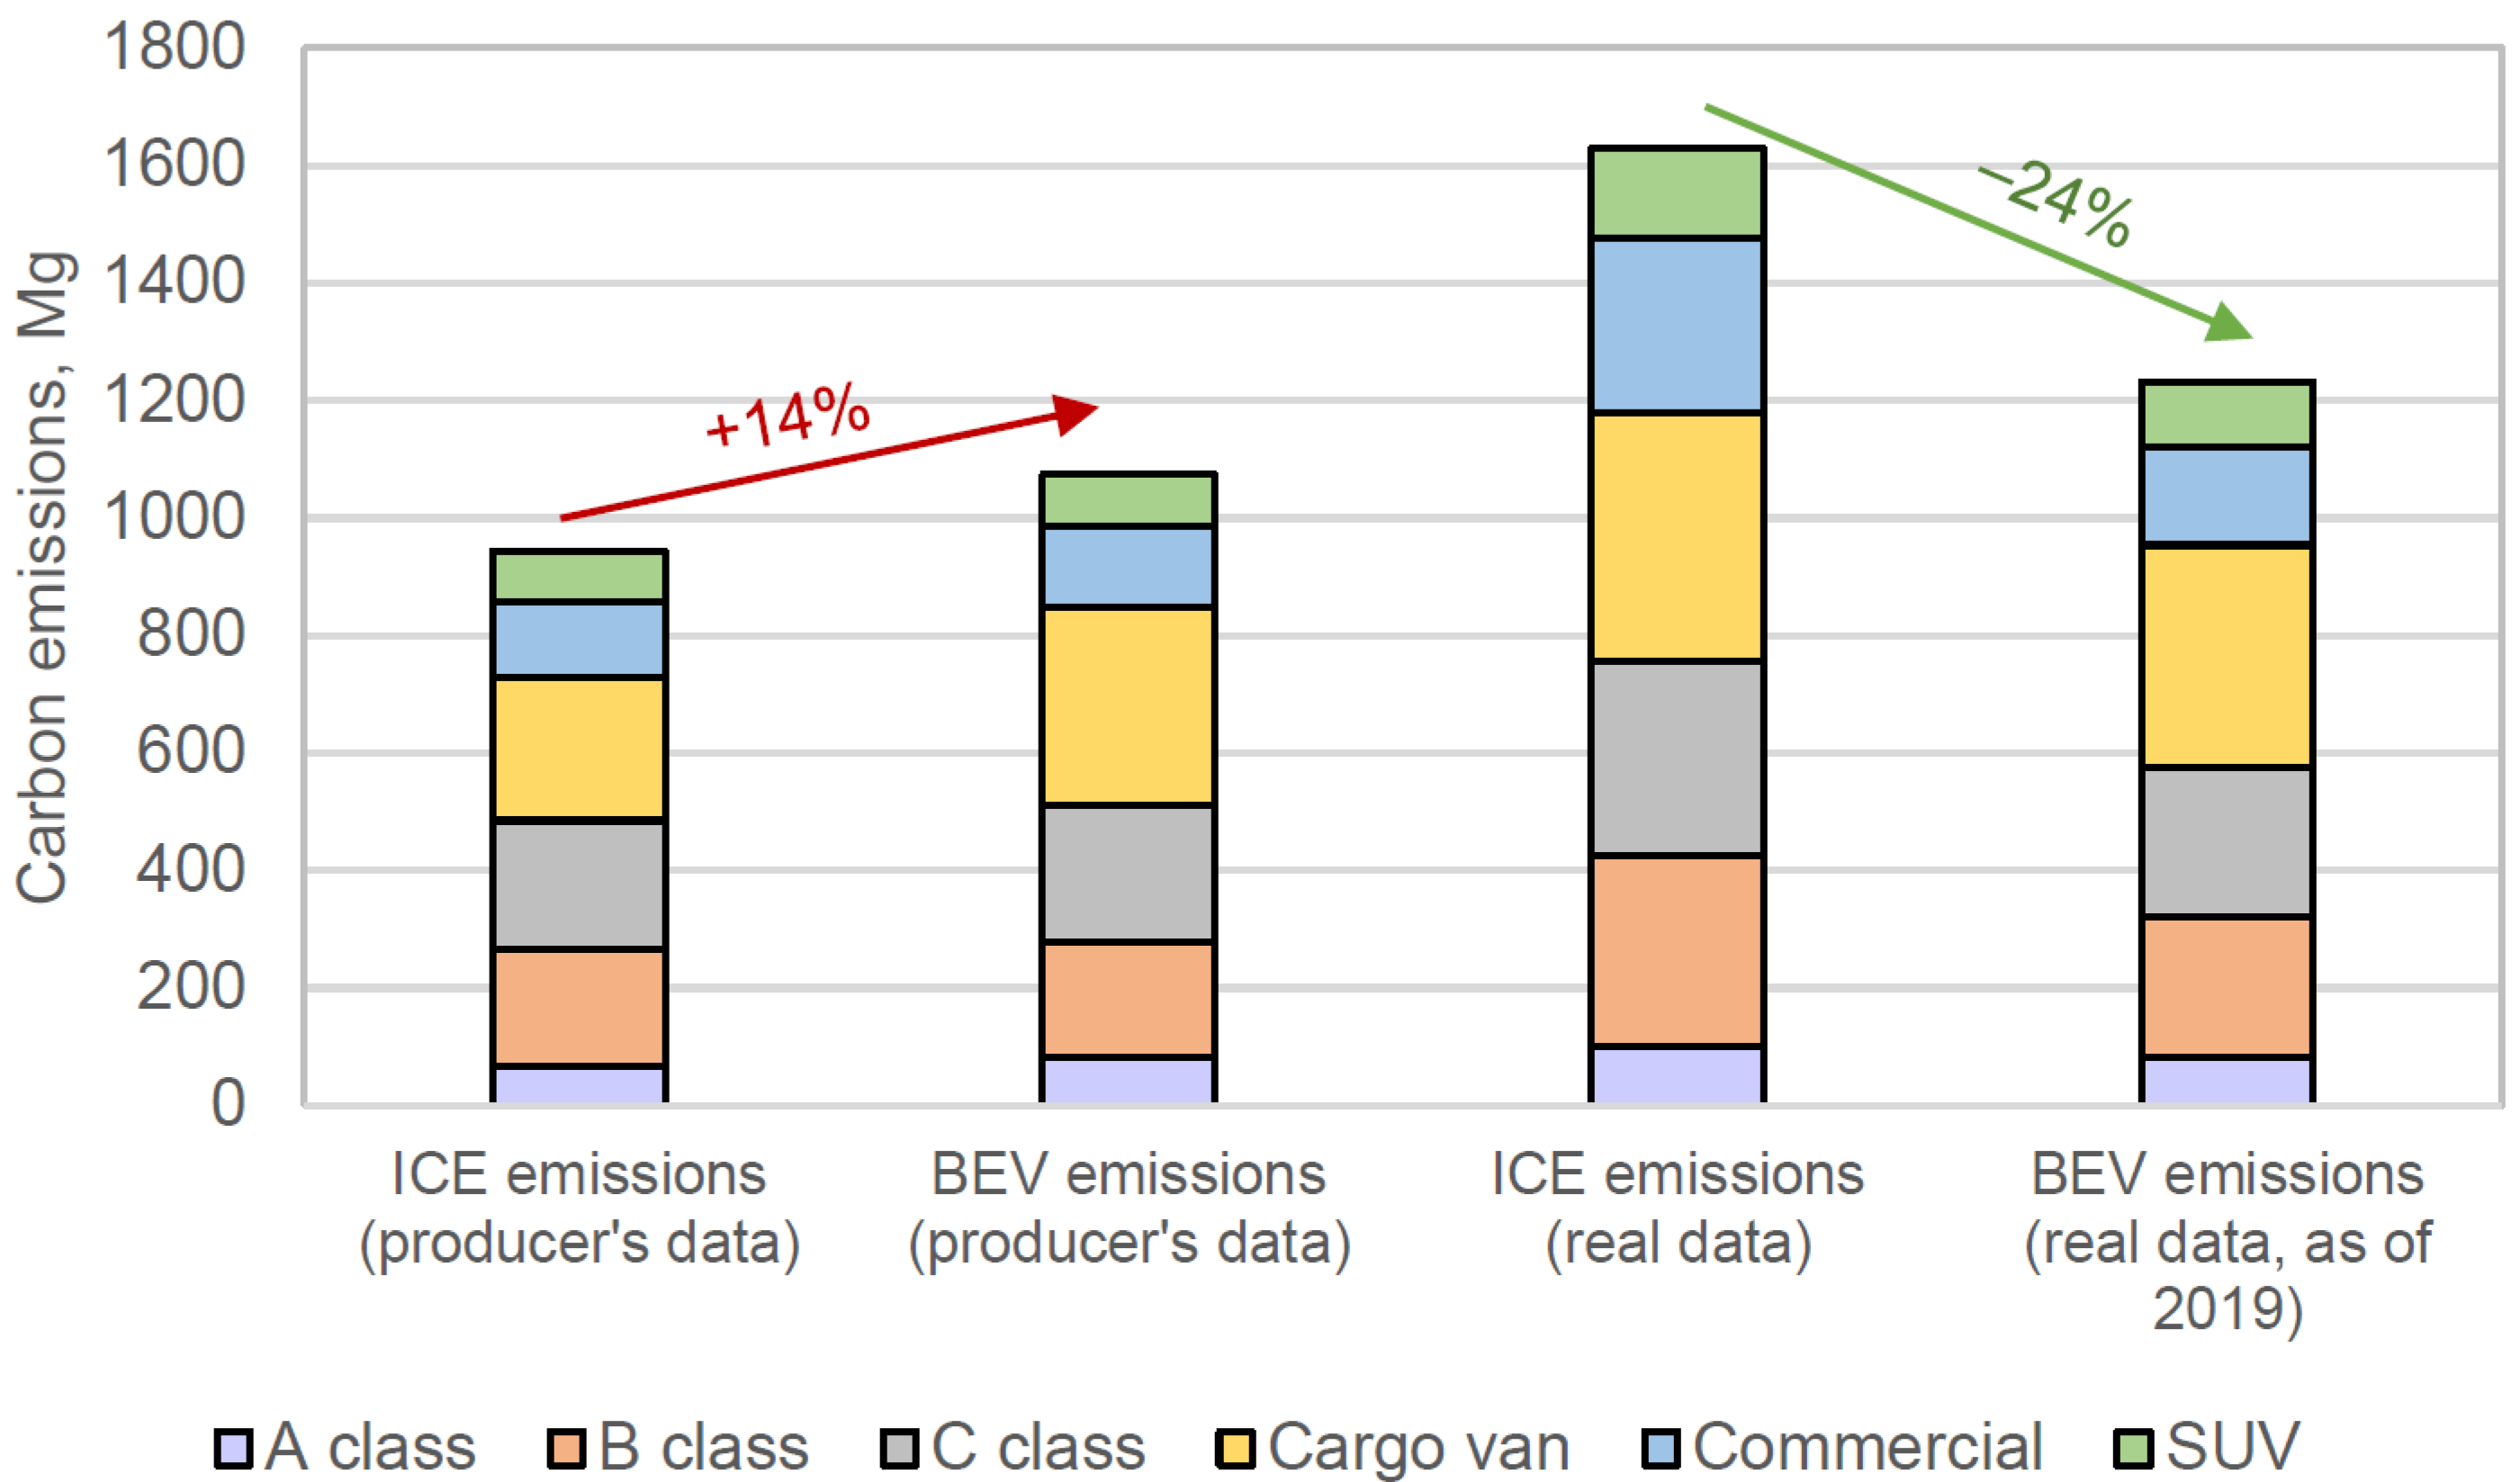
3.2. Carbon Emissions from BEVs in 2019 and 2040

For each category (regardless of fuel type), a BEV analogue was assigned, chosen from car models currently available on the market. Due to the lack of reliable true usage data for commercial medium category emissions declared by producers, an increase of 20% was assumed.
As presented in Figure 5, for all categories, indirect BEV emission levels for the Polish energy mix of 2019 were higher than those declared by car producers and lower than actual emissions calculated for the category representatives. This is a significant finding, showing that for a power system which largely depends on fossil fuels, such as the Polish one, operational carbon emission levels for this particular fleet were in favour of BEVs back in 2019. A much greater effect could be obtained if the carbon intensity of the Polish power generation system was at the projected level for 2040 (47% reduction from 719 kg CO2/MWh as in 2019 to 378 kg CO2/MWh). Comparison of real data on carbon emission levels (in g CO2 per one kilometre) for BEV cars between the energy mixes in 2019 and 2040 is presented in Figure 6.
For each category, total carbon emission levels were calculated for the current ICE and the purely BEV fleet under two scenarios: First, the structure of electricity generation in 2019 was considered (Figure 1). Second, the assumptions published in the Energy Policy of Poland (EPP2040) regarding the energy mix for the year 2040 were taken into account [28].
The carbon intensity of each group of ICE vehicles and BEVs is presented in Figure 7. The total emissions from ICE vehicles amounted to 1628 Mg. Their replacement with battery electric vehicles caused a reduction by 24% (to the level of 1231 Mg). The results also indicated that the carbon emissions calculated for the energy mix of 2040 were lower by as much as 47.4% in comparison to 2019. Therefore, charging cars with electricity using a structure similar to 2040 would cause a carbon emission reduction of 60% (even with a 44.9% share of fossil fuels).
In Figure 8 and Figure 9, a reduction in carbon emissions across categories is presented, along with emission reductions under the 2019 and 2040 Polish energy mix scenarios. It is perfectly justified to rely on a country’s energy mix while looking at fleet electrification at the national scale. However, in the case of a given company or single BEV user, the individual structure of electricity consumption should be considered. Supposing that the company considers using solely renewable electricity to charge its cars at their premises, offsetting carbon emissions for home charging by employees and purchasing electricity and charging services from companies using renewable sources. In this case, the mobility decarbonisation goals could be achieved much earlier than presented in national commitments.

3.3. Operational Costs and Savings

Apart from the comparison of carbon emissions in ICE vehicles and BEVs, a simplified analysis of fuel/charging costs was conducted. The main findings for all vehicle groups are presented in Table 4. The results indicate that total fleet electrification would result in reduction of fuel costs by 50%, allowing the company to generate monthly savings, which could contribute to an increase in lease fees.
In addition to analysis of the savings from the perspective of groups, a rudimentary total cost of ownership (TCO) analysis was conducted. The TCO for two pairs of car categories (SUV and B class) were calculated in two scenarios: an average monthly mileage of 2000 km and the mileage for which break-even is reached. The cost of vehicle insurance was excluded from the analysis due to a lack of complete data. Therefore, it should be noted that due to the higher BEV value, insurance premiums are higher, and, consequently, the presented values are slightly biased in favour of BEVs. The same assumptions regarding charging structure and cost were made for emission level calculations. It is clearly visible that the higher the monthly mileage is, the greater the use of the public charging infrastructure. Consequently, the generated savings will not be linear. For shorter ranges, almost all trips can be made using solely AC charging, limiting the cost. For the SUV category with a monthly mileage of 2000 km, electric vehicles were an economically viable solution, as presented in Table 5. Only below 600 km per month was the combustion model more profitable. In the case of B class vehicles, the situation was opposite—with a monthly mileage of 2000 km, the diesel representative was more economical, and the breakpoint occurred at a mileage of 3770 km per month, which is difficult to achieve in the majority of cases; this is depicted in Table 6.
It can be noticed that TCO is highly dependent on average monthly mileage. Taking into account that the scope of this article is on CO2 emissions, it can be concluded that while planning a fleet transformation, a priority should be given to high-mileage cases within each category, which should provide benefits of both an environmental and economic nature.

3.4. Catalogue Data vs. Real-World Driving Data

The results of this study point out that there is a divergence in fuel consumption between (a) the catalogue data and (b) data collected from real-world driving (see Figure 10). The analysis conducted using producers’ data indicated an increase in carbon emissions by 14% for the current fuel structure of the Polish power system. However, considering the data describing the historical mileage and fuel consumption of 619 cars, the results presented a reduction in carbon emission at the level of 24% for the same energy mix in the power system. Consequently, this paper confirms the existence of the fuel consumption gap that is discussed in detail in Ref. [33].
In the context of fuel/charging costs, as previously mentioned, fleet conversion resulted in a 50% reduction in fuel costs when real consumptions were compared to reference ICEVs and their BEV counterparts. As far as catalogue data are concerned, the difference was still in favour of BEVs, but it decreased to 30%. In case of no conversion of the fleet, the calculated savings achieved if ICE cars had consumed as producers had declared, reached 38% across all categories.
As a result, apart from the outcomes concerning carbon emission reduction and operational costs stemming from fleet electrification in an individual company, this work provides valuable findings on the divergence of the results depending on the method adopted. The selection of the different input data assumptions can cause different conclusions to be drawn. For instance, interest groups or lobbyists of ICE cars may use catalogue data in their analyses and provide completely different outcomes and findings than those presented here. Based on such analyses, fleet electrification in the company would cause an increase in carbon emissions. Therefore, the replacement of ICE vehicles with electric vehicles would be considered in the future with respect to forecasts of the fuel mix of the power system.
This is why decision-makers, and even policymakers or regulatory bodies, should rely on analysis based on real-driving data instead of catalogue data published on producers’ websites.

4. Conclusions

The main aim of this paper was to investigate the potential of CO2 emission reduction related to company fleet electrification in Poland, a European Union country, which is heavily dependent on fossil fuels for electricity generation. This paper also presents the results of the study of ICEV replacement with BEVs in a large international company. It provides valuable insights into the effects of this replacement on researchers, managers, and policymakers. These insights are valid not only in Poland but also in other countries with similar structures of power systems.
This paper also fills a research gap in the context of fleet electrification on a small scale using real-world data from a fleet of 619 vehicles operated across 19 subsidiaries of a resource management company located in Poland. The main conclusion is that even for a highly fossil fuel-dependant energy mix, indirect emissions for BEVs are lower than tailpipe emissions from ICE vehicles. The case study analysis shows that fleet electrification in the current fuel mix of the Polish power system (75% of electricity is still produced in coal-fired generation units, and 8% in natural gas-fired units) would decrease carbon emissions by 24%. These findings may support decision-making processes in companies when considering the replacement of ICE cars with electric vehicles due to environmental policies.
Case study analysis shows that fleet electrification also results in a decrease in operational costs; the annual expenditure on the purchase of electricity was EUR 370 thousand lower than on conventional fuel. Therefore, the replacement of combustion cars with electric ones may also generate financial savings. However, if the total cost of ownership (TCO) is analysed, the economic viability of electric vehicles is dependent on mileage. The TCO of SUVs is significantly lower for 2000 km per month but higher for mileage below 600 km. This is a consequence of the higher fraction of fixed costs. In the case of B class cars, the results are the opposite; the TCO of BEVs is lower at mileages over 3700 km when compared to ICEVs.
This study also provides a valuable insight into the implications of the methodological approaches used for similar analyses. Using the producers’ data instead of real-world data produces entirely different results and different conclusions. The results indicate that using data published by producers gives an increase in carbon emissions of 14% instead of a decrease of 24%. This is why an appropriate method and input data assumptions are of the utmost importance in obtaining reliable outcomes.
Global companies perceive either moral obligation or economic value in becoming independent of energy utilities and their carbon footprint. Technological progress and increasing adoption of renewable sources, battery storage solutions and BEVs are constantly fuelling this trend towards economic break-even and resulting mass adoption.
The transition from ICE vehicles to BEVs is subject to heated public debate, misinformation and contradictory research results. In this context, this study provides valuable insight into the national and global debate as to whether fleet electrification in countries heavily dependent on fossil fuels is justified.
Although this article focuses on emissions reduction and associated fuel/charging costs, a transition towards BEV-based fleets constitutes a significant organisational, managerial and cultural challenge as habits and preferences are strong across all societies [34]. The authors plan to extend the concept and methods adopted here for future research. Firstly, the authors plan to prepare new business models for BEV fleet management as a tool for further reduction of emissions [35]. Secondly, the authors’ aim is to expand the analysis of the total cost of ownership components [36], such as maintenance and failure costs [37]. Thirdly, the authors plan to compare the energy consumption of BEVs gradually introduced into company fleets with results published by OEMs and other BEV users. Finally, further research is needed to provide policy recommendations to assure a consistent regulatory framework. Current regulations in Poland tend to concentrate on individual users and public transport, with a relatively lower focus on company car fleets, which constituted more than 70% of new cars purchased in Poland in 2020 [38].

Author Contributions

Conceptualisation, K.Z., J.S., A.K. and P.K.; methodology, K.Z., J.S., A.K. and P.K.; software, J.S.; validation, K.Z., A.K. and P.K.; formal analysis, J.S., A.K. and P.K.; investigation, K.Z., J.S., A.K. and P.K.; resources, K.Z., J.S., A.K. and P.K.; data curation, K.Z. and J.S.; writing—original draft preparation, J.S., A.K. and P.K.; writing—review and editing, K.Z., J.S., A.K. and P.K.; visualisation, J.S., A.K. and P.K.; supervision, K.Z. All authors have read and agreed to the published version of the manuscript.

Funding

The project is funded under the program of the Minister of Science and Higher Education titled “Regional Initiative of Excellence” in 2019–2022, project number 018/RID/2018/19, the amount of funding PLN10788423.16.

Institutional Review Board Statement

Not applicable.

Informed Consent Statement

Not applicable.

Acknowledgments

The author would like to thank Adrian Sienicki for his insightful comments and suggestions.

Conflicts of Interest

The authors declare no conflict of interest.

Nomenclature

NameUnitExplanation
Sets
g - Group   of   cars ,   g G = {passenger cars: A, B, C class, SUV, cargo van, commercial medium}
r g -Representative car of each group g ,   r g R G
f - Fuel ,   f     F   = {petrol, diesel}
Parameters
F u e l P u r c h a s e g , r g . f dm3Volume of fuel f purchased for representative car r g of a group of cars g
C M g . r g . f km Total   mileage   of   representative   car   r g of a group of cars g with fuel f
T R G N g . f - Total   number   of   vehicles   in   the   group   g   with   fuel   f   of   the   same   type   as   the   representatives ;   T R G N g , f = r g w g , r g , f
w g , r g , f -Number of vehicles in the group g with fuel f of the same type as the representative car model selected for each group g and fuel f
C O 2 E F f kg/dm3Tailpipe carbon emission factor of fuel f
F u e l P u r c h a s e T o t g , f dm3Total volume of fuel f purchased by all cars in a group g
C O 2 E m I n t e n s i t y g/kWhCarbon emission intensity of electricity generation
E C g , f kWh/100 kmElectricity consumption of assigned battery electric vehicle of a group of cars g with fuel f per 100 km
A C L o s s %Losses of AC charger
A C C o s t EURCost of electricity (for the AC charging)
D C C o s t EURCharging service fees (for the DC charging)
Variables
F C g .   r g . f dm3/100 kmFuel consumption by representative car r g of a group of cars g with fuel f
A F C g . f dm3/100 kmAverage fuel consumption in a group of cars g with fuel f
C O 2 I C E g . r g . f g/kmCarbon emissions in representative car r g   of a group g with fuel f
A C O 2 I C E g . f g/kmAverage carbon emissions in a group of cars g with fuel f
A C M T o t g . f kmTotal average mileage for a group of cars g with fuel f
C O 2 I C E T o t g . f MgTotal carbon emissions from ICE cars for a group of cars g with fuel f
C O 2 I C E T o t MgTotal carbon emissions from all ICE cars
C O 2 B E V g , f g/kmCarbon emission factor of the assigned battery electric vehicle of each group of cars g
T o t C O 2 B E V g . f MgTotal carbon emission from BEVs corresponding to a group of cars g with fuel f
T o t C O 2 B E V MgTotal carbon emissions from all BEVs
T o t E C g . f kWhTotal electricity consumption in BEVs corresponding to each group of cars g with fuel f , assuming fleet electrification at the level of 100%
T o t a l C h a r g i n g C o s t g . f   EURTotal charging cost of battery electric vehicles corresponding to each group of a cars g and fuel f

Abbreviations

NameExplanation
ACAlternating Current
BEVBattery Electric Vehicle
CO2Carbon Dioxide
DCDirect Current
EPP2040Energy Policy of Poland until 2040
EVElectric Vehicle
EVSEElectric Vehicle Supply Equipment
GHGGreenhouse Gas
ICEVInternal Combustion Engine Vehicle
OEMOriginal Equipment Manufacturer
WLTPWorldwide Harmonised Light Vehicles Test Procedure

References

  1. Wójcik-Jurkiewicz, M.; Czarnecka, M.; Kinelski, G.; Sadowska, B.; Bilińska-Reformat, K. Determinants of Decarbonisation in the Transformation of the Energy Sector: The Case of Poland. Energies 2021, 14, 1217. [Google Scholar] [CrossRef]
  2. European Commission. The European Green Deal. 2019. Available online: https://eur-lex.europa.eu/legal-content/EN/TXT/?qid=1588580774040&uri=CELEX%3A52019DC0640 (accessed on 7 July 2021).
  3. Polish Power Grid Company. Summary of Quantitative Data on the Functioning of the National Power System in 2018. 2019. Available online: https://www.pse.pl/dane-systemowe/funkcjonowanie-kse/raporty-roczne-z-funkcjonowania-kse-za-rok/raporty-za-rok-2019 (accessed on 5 June 2020).
  4. Komorowska, A.; Benalcazar, P.; Kaszyński, P.; Kamiński, J. Economic consequences of a capacity market implementation: The case of Poland. Energy Policy 2020, 144, 111683. [Google Scholar] [CrossRef]
  5. Zamasz, K.; Kapłan, R.; Kaszyński, P.; Saługa, P.W. An Analysis of Support Mechanisms for New CHPs: The Case of Poland. Energies 2020, 13, 5635. [Google Scholar] [CrossRef]
  6. Komorowska, A. Can Decarbonisation and Capacity Market Go Together? The Case Study of Poland. Energies 2021, 14, 5151. [Google Scholar] [CrossRef]
  7. Kasten, J.P.; Bracker, M.H.; Purwanto, J. Electric mobility in Europe—Future Impact on the Emissions and the Energy Systems. Final Report of Task 2. 2016. Available online: https://www.electrive.com/study-guide/electric-mobility-in-europe-future-impact-on-the-emissions-and-the-energy-systems/ (accessed on 19 June 2021).
  8. Xiong, S.; Ji, J.; Ma, X. Comparative Life Cycle Energy and GHG Emission Analysis for BEVs and PhEVs: A Case Study in China. Energies 2019, 12, 834. [Google Scholar] [CrossRef] [Green Version]
  9. Yu, A.; Wei, Y.; Chen, W.; Peng, N.; Peng, L. Life cycle environmental impacts and carbon emissions: A case study of electric and gasoline vehicles in China. Transp. Res. Part D Transp. Environ. 2018, 65, 409–420. [Google Scholar] [CrossRef]
  10. Sobol, Ł.; Dyjakon, A. The Influence of Power Sources for Charging the Batteries of Electric Cars on CO2 Emissions During Daily Driving: A Case Study from Poland. Energies 2020, 13, 4267. [Google Scholar] [CrossRef]
  11. Majchrzak, K.; Olczak, P.; Matuszewska, D.; Wdowin, M. Economic and environmental assessment of the use of electric cars in Poland. Polityka Energetyczna Energy Policy J. 2021, 24, 153–168. [Google Scholar] [CrossRef]
  12. Teixeira, A.C.R.; Sodré, J.R. Impacts of replacement of engine powered vehicles by electric vehicles on energy consumption and CO 2 emissions. Transp. Res. Part D Transp. Environ. 2018, 59, 375–384. [Google Scholar] [CrossRef]
  13. Drożdż, W.; Szczerba, P.; Kruszyński, D. Issues related to the development of electromobility from the point of view of Polish utilities. Polityka Energetyczna Energy Policy J. 2020, 23, 49–64. [Google Scholar] [CrossRef]
  14. Połom, M.; Wiśniewski, P. Implementing Electromobility in Public Transport in Poland in 1990–2020. A Review of Experiences and Evaluation of the Current Development Directions. Sustainability 2021, 13, 4009. [Google Scholar] [CrossRef]
  15. Pietrzak, O.; Pietrzak, K. The Economic Effects of Electromobility in Sustainable Urban Public Transport. Energies 2021, 14, 878. [Google Scholar] [CrossRef]
  16. Motoreu.com. 2021. Available online: https://motoreu.com/ (accessed on 19 June 2021).
  17. Wiki Automotive Catalogue. 2021. Available online: https://www.auto-data.net/en/ (accessed on 19 June 2021).
  18. EIA. How Much Carbon Dioxide Is Produced from U.S. Gasoline and Diesel Fuel Consumption? 2021. Available online: https://www.eia.gov/tools/faqs/faq.php?id=307&t=11 (accessed on 19 June 2021).
  19. Natural Resources Canada. Auto Smart. Learn the Facts: Fuel Consumption and CO2. 2014. Available online: https://www.nrcan.gc.ca/sites/www.nrcan.gc.ca/files/oee/pdf/transportation/fuel-efficient-technologies/autosmart_factsheet_6_e.pdf (accessed on 19 June 2021).
  20. Electric Vehicle Database: Operl Corsa-e. 2021. Available online: https://ev-database.org/car/1192/Opel-Corsa-e (accessed on 19 June 2020).
  21. Electric Vehicle Database: Nissan Leaf e+. 2021. Available online: https://ev-database.org/car/1144/Nissan-Leaf-eplus (accessed on 19 June 2021).
  22. Electric Vehicle Database: Volkswagen, ID.3 Pro. 2021. Available online: https://ev-database.org/car/1202/Volkswagen-ID3-Pro (accessed on 19 June 2021).
  23. Electric Vehicle Database: Skoda Enyaq iV 80. 2021. Available online: https://ev-database.org/car/1280/Skoda-Enyaq-iV-80 (accessed on 19 June 2021).
  24. UltimateSPECS: Citroen Jumpy 2016 e-Jumpy. 2021. Available online: https://www.ultimatespecs.com/car-specs/Citroen/122274/Citroen-Jumpy-2016-e-Jumpy-XL-75kWh.html (accessed on 19 June 2021).
  25. E-Ducato broshuere. 2021. Available online: https://www.abz-nutzfahrzeuge.de/fileadmin/inhalte/Modelle_Fiat/Ducato/e-Ducato/E-Ducato-broschuere-englisch.pdf (accessed on 19 June 2021).
  26. KOBiZE. CO2, SO2, NOx, CO and Total Dust Emission Indicators for Electricity Based on the Information Contained in the National Base on Emissions of Greenhouse Gases and Other Substances for 2019 (In Polish). 2020. Available online: https://www.kobize.pl/uploads/materialy/materialy_do_pobrania/wskazniki_emisyjnosci/Wskazniki_emisyjnosci_grudzien_2019.pdf (accessed on 19 June 2021).
  27. Mucha-Kuś, K.; Sołtysik, M.; Zamasz, K.; Szczepańska-Woszczyna, K. Coopetitive Nature of Energy Communities—The Energy Transition Context. Energies 2021, 14, 931. [Google Scholar] [CrossRef]
  28. Ministry of Climate and Environment. Energy Policy of Poland until 2040. 2021. Available online: http://isap.sejm.gov.pl/isap.nsf/download.xsp/WMP20210000264/O/M20210264.pdf (accessed on 8 August 2021).
  29. European Environment Agency (EEA). Greenhouse Gas Emission Intensity of Electricity Generation; European Environment Agency: Copenhagen, Demark, 2020. [Google Scholar]
  30. Funke, S.Á.; Sprei, F.; Gnann, T.; Plötz, P. How much charging infrastructure do electric vehicles need? A review of the evidence and international comparison. Transp. Res. Part D Transp. Environ. 2019, 77, 224–242. [Google Scholar] [CrossRef]
  31. Apostolaki-Iosifidou, E.; Codani, P.; Kempton, W. Measurement of power loss during electric vehicle charging and discharging. Energy 2017, 127, 730–742. [Google Scholar] [CrossRef]
  32. GreenWay Poland. Pricelist of Charging. 2021. Available online: https://greenwaypolska.pl/en/evdrivers/ (accessed on 20 June 2021).
  33. Pavlovic, J.; Fontaras, G.; Ktistakis, M.; Anagnostopoulos, K.; Komnos, D.; Ciuffo, B.; Clairotte, M.; Valverde, V. Understanding the origins and variability of the fuel consumption gap: Lessons learned from laboratory tests and a real-driving campaign. Environ. Sci. Eur. 2020, 32, 53. [Google Scholar] [CrossRef] [Green Version]
  34. Stęchły, J.; Stęchły, M.; Shahan, Z. European and US Electric Vehicle Owner’s Needs and Expectations Analysis. Conclusions for Poland (In Polish: Analiza Potrzeb i Oczekiwań Właścicieli Samochodów Elektrycznych w Europie i Stanach Zjednoczonych); Drożdż, W., Ed.; Electrobomility in the Development of Cities (In Polish: Elektromobilność w rozwoju miast): Warsaw, Poland, 2018; pp. 58–81. [Google Scholar]
  35. Mucha-Kuś, K.; Stęchły, J.; Zamasz, K. The role of coopetition in development of electromobility. Zesz. Nauk. Politech. Śląskiej Organ. Zarządzanie 2018, 21, 357–369. [Google Scholar] [CrossRef]
  36. Burnham, A.; Gohlke, D.; Rush, L.; Stephens, T.; Zhou, Y.; Delucchi, M.A.; Birky, A.; Hunter, C.; Lin, Z.; Ou, S.; et al. Comprehensive Total Cost of Ownership Quantification for Vehicles with Different Size Classes and Powertrains; U.S. Department of Commerce: Alexandria, VA, USA, 2021.
  37. Wróblewski, P.; Drożdż, W.; Lewicki, W.; Miązek, P. Methodology for Assessing the Impact of Aperiodic Phenomena on the Energy Balance of Propulsion Engines in Vehicle Electromobility Systems for Given Areas. Energies 2021, 14, 2314. [Google Scholar] [CrossRef]
  38. IBRM SABAR. IBRM SAMAR Report—Registrations of Passenger Cars and Vans in July 2020 (In Polish: Raport IBRM SAMAR—Rejestracje Samochodów Osobowych i Dostawczych w Lipcu 2020). 2020. Available online: https://doi.org/10.1016/j.trd.2019.10.024 (accessed on 19 June 2021).
Figure 1. Electricity production in Poland in 2019.
Energies 14 06595 g001
Figure 2. Greenhouse gas emission intensity of electricity generation (as a CO2 equivalent) in EU countries in 2019. Source: own elaboration based on [29].
Energies 14 06595 g002
Figure 3. Average monthly fuel consumption for each category of ICE fleet, thous. dm3.
Energies 14 06595 g003
Figure 4. Comparison of fuel consumption (dm3 per 100 km) of ICE cars—producers’ data and fleet-specific measurements.
Energies 14 06595 g004
Figure 5. Comparison of carbon emissions (g CO2/km) of ICE and BEV cars—producers’ data, fleet-specific measurements and real usage data.
Energies 14 06595 g005
Figure 6. Emission levels for BEVs for each category—comparison based on the carbon intensity of the Polish power sector: fuel mix in 2019 vs. fuel mix in 2040 (EPP2040).
Energies 14 06595 g006
Figure 7. Comparison of total emission levels for ICE and BEV vehicle categories (Mg).
Energies 14 06595 g007
Figure 8. Breakdown of total carbon emissions (Mg) across vehicle categories of the Polish carbon intensity of electricity generation as of 2019 and in 2040 (EPP2040).
Energies 14 06595 g008
Figure 9. Breakdown of emission reductions (%) for the Polish carbon intensity of electricity generation as of 2019 and in 2040 (EPP2040).
Energies 14 06595 g009
Figure 10. Differences between the impact of fleet electrification on carbon emissions using producers’ data and case study results.
Energies 14 06595 g010
Table 1. Specification of ICE vehicles.
CategoryFuelCategory SizeNumber of Representative Cars per CategoryTotal Volume of Fuel Purchased in the Analysed Period,
thous. dm3
Engine Power,
kW
Fuel Consumption,
dm3/km 1
Carbon Emission,
g/km 1
Passenger car—A classPetrol342423.860–924.5–5.2104–130
Diesel121118.266–663.3–4.685–104
Passenger car—B classPetrol632068.163–1104.0–7.599–160
Diesel35849.170–963.5–5.490–150
Passenger car—C classPetrol341046.081–1324.4–6.6106–153
Diesel421382.181–1353.8–6.1100–149
SUVPetrol554647.196–1654.4–7.6107–177
Diesel8213.688–1333.8–9.2103–215
Cargo vanPetrol342433.272–884.5–7.2111–180
Diesel163107129.655–964.2–8.8108–195
Commercial mediumDiesel13956113.866–1206.4–10.1143–226
Total-619 321624.6---
1 According to information published by producers. Based on: [16,17].
Table 2. Specification of battery electric vehicles.
CategoryModelEngine Power,
kW
Electricity Consumption,
kWh/km
Battery Capacity,
kWh
Range,
km
Passenger car—A classOpel Corsa-e10016.750330
Passenger car—B classNissan Leaf11014.540270
Passenger car—C classVolkswagen ID.3 Pro10715.662420
SUVSkoda ENYAQ iV 8015017.482536
Cargo vanCitroën ë-Jumpy M10024.475330
Commercial mediumFiat E-Ducato9024.179194
According to real-world data—except for cargo van and commercial medium categories for which no reliable real-world data was available, for which information published by the producer was used in this study. Based on: [20,21,22,23,24,25].
Table 3. Charging cost of electric vehicles.
TypeUnitValue
AC chargerEUR/kWh0.14
DC charger 1EUR/kWh0.47
1 For DC chargers, total unit cost includes costs and margin of the charging station owner. Based on: [31,32].
Table 4. Operational costs and savings analysis for ICE to BEV conversion.
CategoryFuelConsumptionFuel/Charging Cost, €Savings, €
Fuel, dm3Electricity, MWhICEBEVTotalMonthly per Vehicle
Passenger car—A classPetrol23,75654.828,039.7511,830.5716,209.1939.73
Diesel18,19659.221,758.8512,778.348980.5162.36
Passenger car—B classPetrol68,090203.380,356.1843,897.5536,458.6348.23
Diesel49,119128.558,653.1027,737.5730,915.5373.61
Passenger car—C classPetrol45,967116.754,277.4125,205.7229,071.6871.25
Diesel82,145236.598,230.1951,063.9647,166.2393.58
SUVPetrol47,139115.555,109.8824,943.9130,165.9745.71
Diesel13,57737.116,103.938005.298098.6584.36
Cargo vanPetrol33,19779.438,667.6617,144.4821,523.1852.75
Diesel129,586448.3153,807.3896,790.9757,016.4229.15
Commercial mediumDiesel113,780232.3134,804.7150,160.0084,644.7150.75
Total-624,5521711.6739,809.05369,558.36370,250.6949.85
Table 5. TCO comparison for the SUV category.
Kodiaq 2.0TDI 150 Style ATEnyaq iV 80Kodiaq 2.0TDI 150 Style ATEnyaq iV 80
Financial rate€338.17€400.88€338.17€400.88
Service rate€77.32€59.86€77.32€59.86
Fuel/Electricity cost€73.15€93.28€73.15€27.89
Total€659.34€554.01€488.65€488.72
Monthly mileage2000 km2000 km600 km600 km
Table 6. TCO comparison for the B segment category.
Focus KB 1.5 TDCi 120KMLeaf 62kWh
N-Connecta AT
Focus KB 1.5 TDCi 120KMLeaf 62kWh
N-Connecta AT
Financial rate€152.64€333.29€152.64€333.29
Service rate€76.76€55.55€76.76€55.55
Fuel/Electricity cost€160.81€76.22€302.12€143.67
Total€390.20€465.06€532.52€532.51
Monthly mileage2000 km2000 km3770 km3770 km
Publisher’s Note: MDPI stays neutral with regard to jurisdictional claims in published maps and institutional affiliations.

