Article

Wake Shape and Height Profile Measurements in a Concave Open Channel Flow regarding the Target in DONES

1
Institute for Neutron Physics and Reactor Technology, Karlsruhe Institute of Technology, 76344 Eggenstein-Leopoldshafen, Germany
2
Institute for Thermal Energy Technology and Safety, Karlsruhe Institute of Technology, 76344 Eggenstein-Leopoldshafen, Germany
*
Author to whom correspondence should be addressed.
Energies 2021, 14(20), 6506; https://doi.org/10.3390/en14206506
Submission received: 3 August 2021 / Revised: 6 October 2021 / Accepted: 6 October 2021 / Published: 11 October 2021
(This article belongs to the Special Issue Thermal-Hydraulics in Nuclear Fusion Technology: R&D and Applications)

Abstract

:
Wakes appearing downstream of disturbances on the surface of a water flow in a concave open channel were examined experimentally. The investigated channel geometry was similar to the liquid lithium target in DONES (Demonstration fusion power plant Oriented NEutron Source). The objective of the measurements was to analyze the effect of a disturbance on the downstream layer thickness. For measuring the height profiles in the channel, an optical measurement system based on laser triangulation was developed. It was shown that the wake of the undisturbed flow emerged from the nozzle corner, which was in accordance with analytical solutions. For sufficiently large disturbances at the nozzle edge, the height profiles located downstream showed symmetrical minima and maxima on both sides of the disturbance. The wake depth strongly depended on the diameter and penetration depth of the disturbance, as well as the circumferential position in the channel, which yields to a critical wake depth of one millimeter for the lithium target in DONES.

Graphical Abstract

1. Introduction

For fusion power plant technology, specific materials withstanding the harsh environment of high-energy neutron fluxes are necessary [1]. The neutron irradiation facility for fusion materials, DONES, is intended to be built for this purpose. In DONES, a deuteron beam (125 mA, 40 MeV) hitting the lithium target produces a high-energy neutron flux. The target is a liquid lithium free surface flow on a concave backplate, as depicted in Figure 1. In order to contain the heat released by the beam within the liquid lithium (Bragg peak at 19 mm [2]) and to avoid an introduction of the heat in the backplate, a stable configuration of the free surface flow with a setpoint layer thickness of 25 ± 1 mm is crucial. Stable wave structures, so-called wakes, which occur from accumulated impurities at the nozzle edge [3], can cause a local decrease in the layer thickness of more than one millimeter.
The free surface of the lithium flow without wakes is sufficiently stable [4]. Wakes occuring next to the side walls do not reach the beam footprint (Figure 1) and are therefore not critical [5]. Wake structures caused by stationary lithium droplets sticking at the nozzle were observed by Kondo et al. [3]. Their experimental setup was a horizontal 70 mm wide open channel flow at 15 m/s. The wake structures were temporally and spatially stable and could be described by analytical Kelvin wake equations presented in Section 2, neglecting the gravitational force. The observed area was up to 50 mm downstream of the nozzle.
In a subsequent work by Kondo et al. [6], they used pattern projection to measure the height profile of the liquid lithium flow. The measurements were limited to an area of 5 × 3 mm. They observed a relatively smooth surface up to a velocity of 6 m/s. At higher flow velocities, the amplitude of the wake increased.
Originally, wakes were examined in the context of ship waves, due to their impact on the wave drag [7]. Kelvin wake equations [8] describe the shape of wakes analytically. The wake shape is defined by the angle of the wave front with maximum amplitude. Measurements showed that the wake angle depends on the Froude number [7,9,10,11]. Moisy and Rabaud [10] systematically examined wakes behind partially immersed cylinders moving through water at different velocities. The wake angle depended on the Froude number, Bond number and minimal phase velocity. Pethiyagoda et al. [11] showed a dependency of the wake angle on small Froude numbers. Therefore, the originally constant Kelvin angle is limited to Froude numbers around one. Another explanation for these phenomena of smaller wake angles is given by Noblesse et al. [12] considering an interference of multiple wakes.
The deformation of the water surface directly at the cylinder due to run-up upstream and depression downstream was analyzed by Ageorges et al. [13] and Chaplin and Teigen [14]. Koo et al. [15] analyzed the flow past a surface piercing cylinder numerically. They also evaluated the height profile downstream near the disturbance.
An integrated approach was applied to examine the development of wakes downstream of a disturbance in a concave open channel flow. Wake shape and profile measurements were conducted in the test facility FIDES (“Facility for experimental Investigation of a 3D FreE Surface flow”) presented in Section 3. The operating point was selected using the analytical equations of Kelvin wakes (Section 2). Therefore, the measured wake shapes (Section 4.3) can be transferred quantitatively to the lithium flow and compared to other published wake shape results. The observed wake profiles in water (Section 4.2) provide a qualitative insight in the development of the wake amplitude along the channel in lithium.

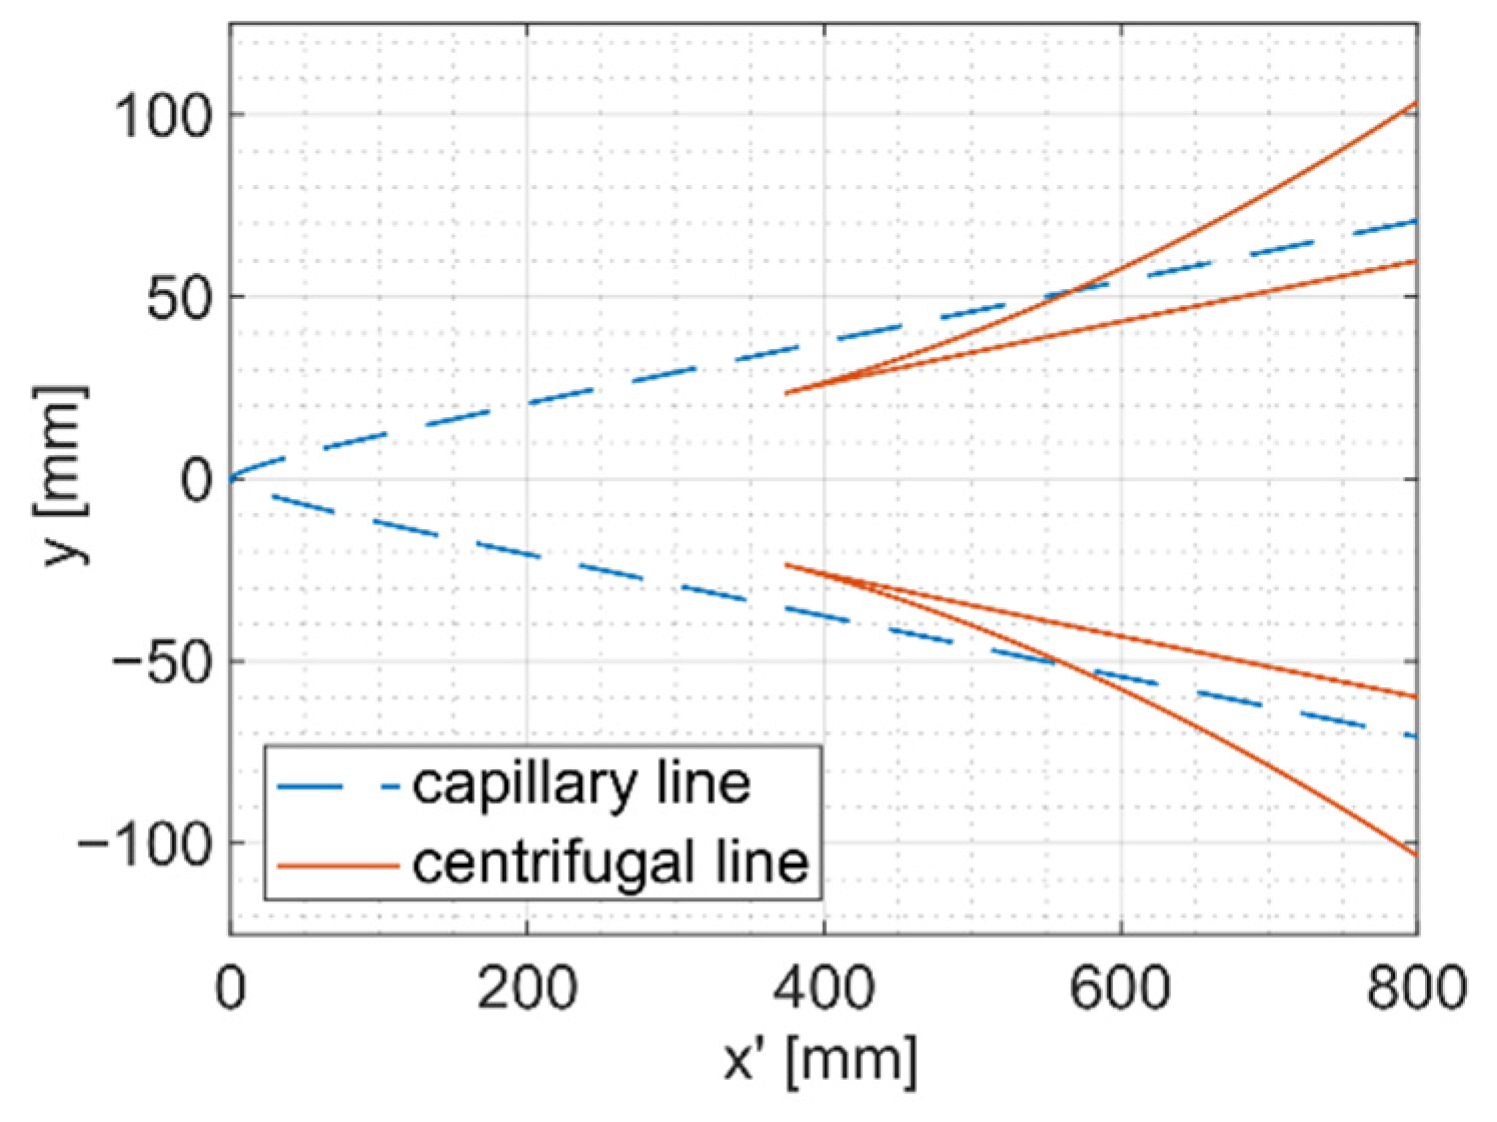
2. Analytical Wake Equations

Waves behind a moving disturbance in calm water or behind a stationary disturbance in a steady flow can be described by the following equations [8]:
x = p cos ( θ ) d p d θ sin ( θ ) y = p sin ( θ ) + d p d θ cos ( θ ) .
The disturbance moves along the negative x′-axis or water streams around the stationary disturbance in the positive x′ direction with the velocity, u. A line of length p connects the disturbance with points on the constant phase line with the angle θ in between p and x′. The points with a constant phase are at the position (x′,y). The phase velocity c = u cos ( θ ) is defined by the dispersion relation [16]:
c = ( λ g 2 π + 2 π σ λ ρ ) tanh ( 2 π h / λ ) .
The wavelength is defined as λ = p / n . The variable n can be chosen as a multiple of 0.5. Wave troughs are given by a positive integer value of n = 1 ,   2 ,   3 ; otherwise, wave crests are described. In addition, the density ρ and surface tension σ of the fluid have an influence.
With regard to the flow in DONES (FIDES), it is assumed that the wavelength is much smaller than the layer thickness of h = 25 mm (10 mm). Therefore tanh ( h / λ ) 1 , which causes an error smaller than 3% for λ < 3.6 h [17]. Additionally, gravity, g, is substituted by the centrifugal acceleration, u2/R [3]. This is justified, because gravity is mostly in the streamwise direction and, therefore, the centrifugal acceleration is more than one order of magnitude bigger considering the perpendicular acceleration on the free surface. Without any assumptions about the dominant forces (surface tension, σ , and centrifugal forces) the equations have two solutions, which depend on the curvature radius, R, the Weber number, We = u ρ L / σ , and the Froude number, Fr = R / L . The characteristic length, L, is either the nozzle height, h, or for the flow with the cylindrical disturbance, the diameter, D, of the cylinder. For different flow facilities with the same curvature radius, the equations have the same wake curves as long as the product We · Fr is constant, which is equivalent to 2·U2, where U = u / c m i n is the velocity ratio and c m i n = ( 4 u 2 σ / ( R ρ ) ) 1 / 4 is the minimal phase velocity. The flow velocity for the reference lithium flow was u = 15–20 m/s (velocity range in DONES) with a constant curvature radius of R = 250 mm for the vertical concave channel, which results in the velocity range u = 4.7–6.2 m/s in water (20 °C).
The solution of Equations (1) and (2) for n = 1, u = 15 m/s in lithium without the assumption of a dominant force is shown in Figure 2. The blue dashed line in the diagram represents the capillary wake line dominated by the surface tension and the red lines are the centrifugal wake dominated by centrifugal forces. Considering the analytical solutions, it was concluded that wakes from the nozzle corners do not reach the beam footprint [3] and, thus, the accumulation of impurities at the nozzle edge are the main source for a film thickness decrease. For the prediction of the wake shape, the solution for n = 0.5 was used, which describes the position of a wave crest and was compared to the experimental results.

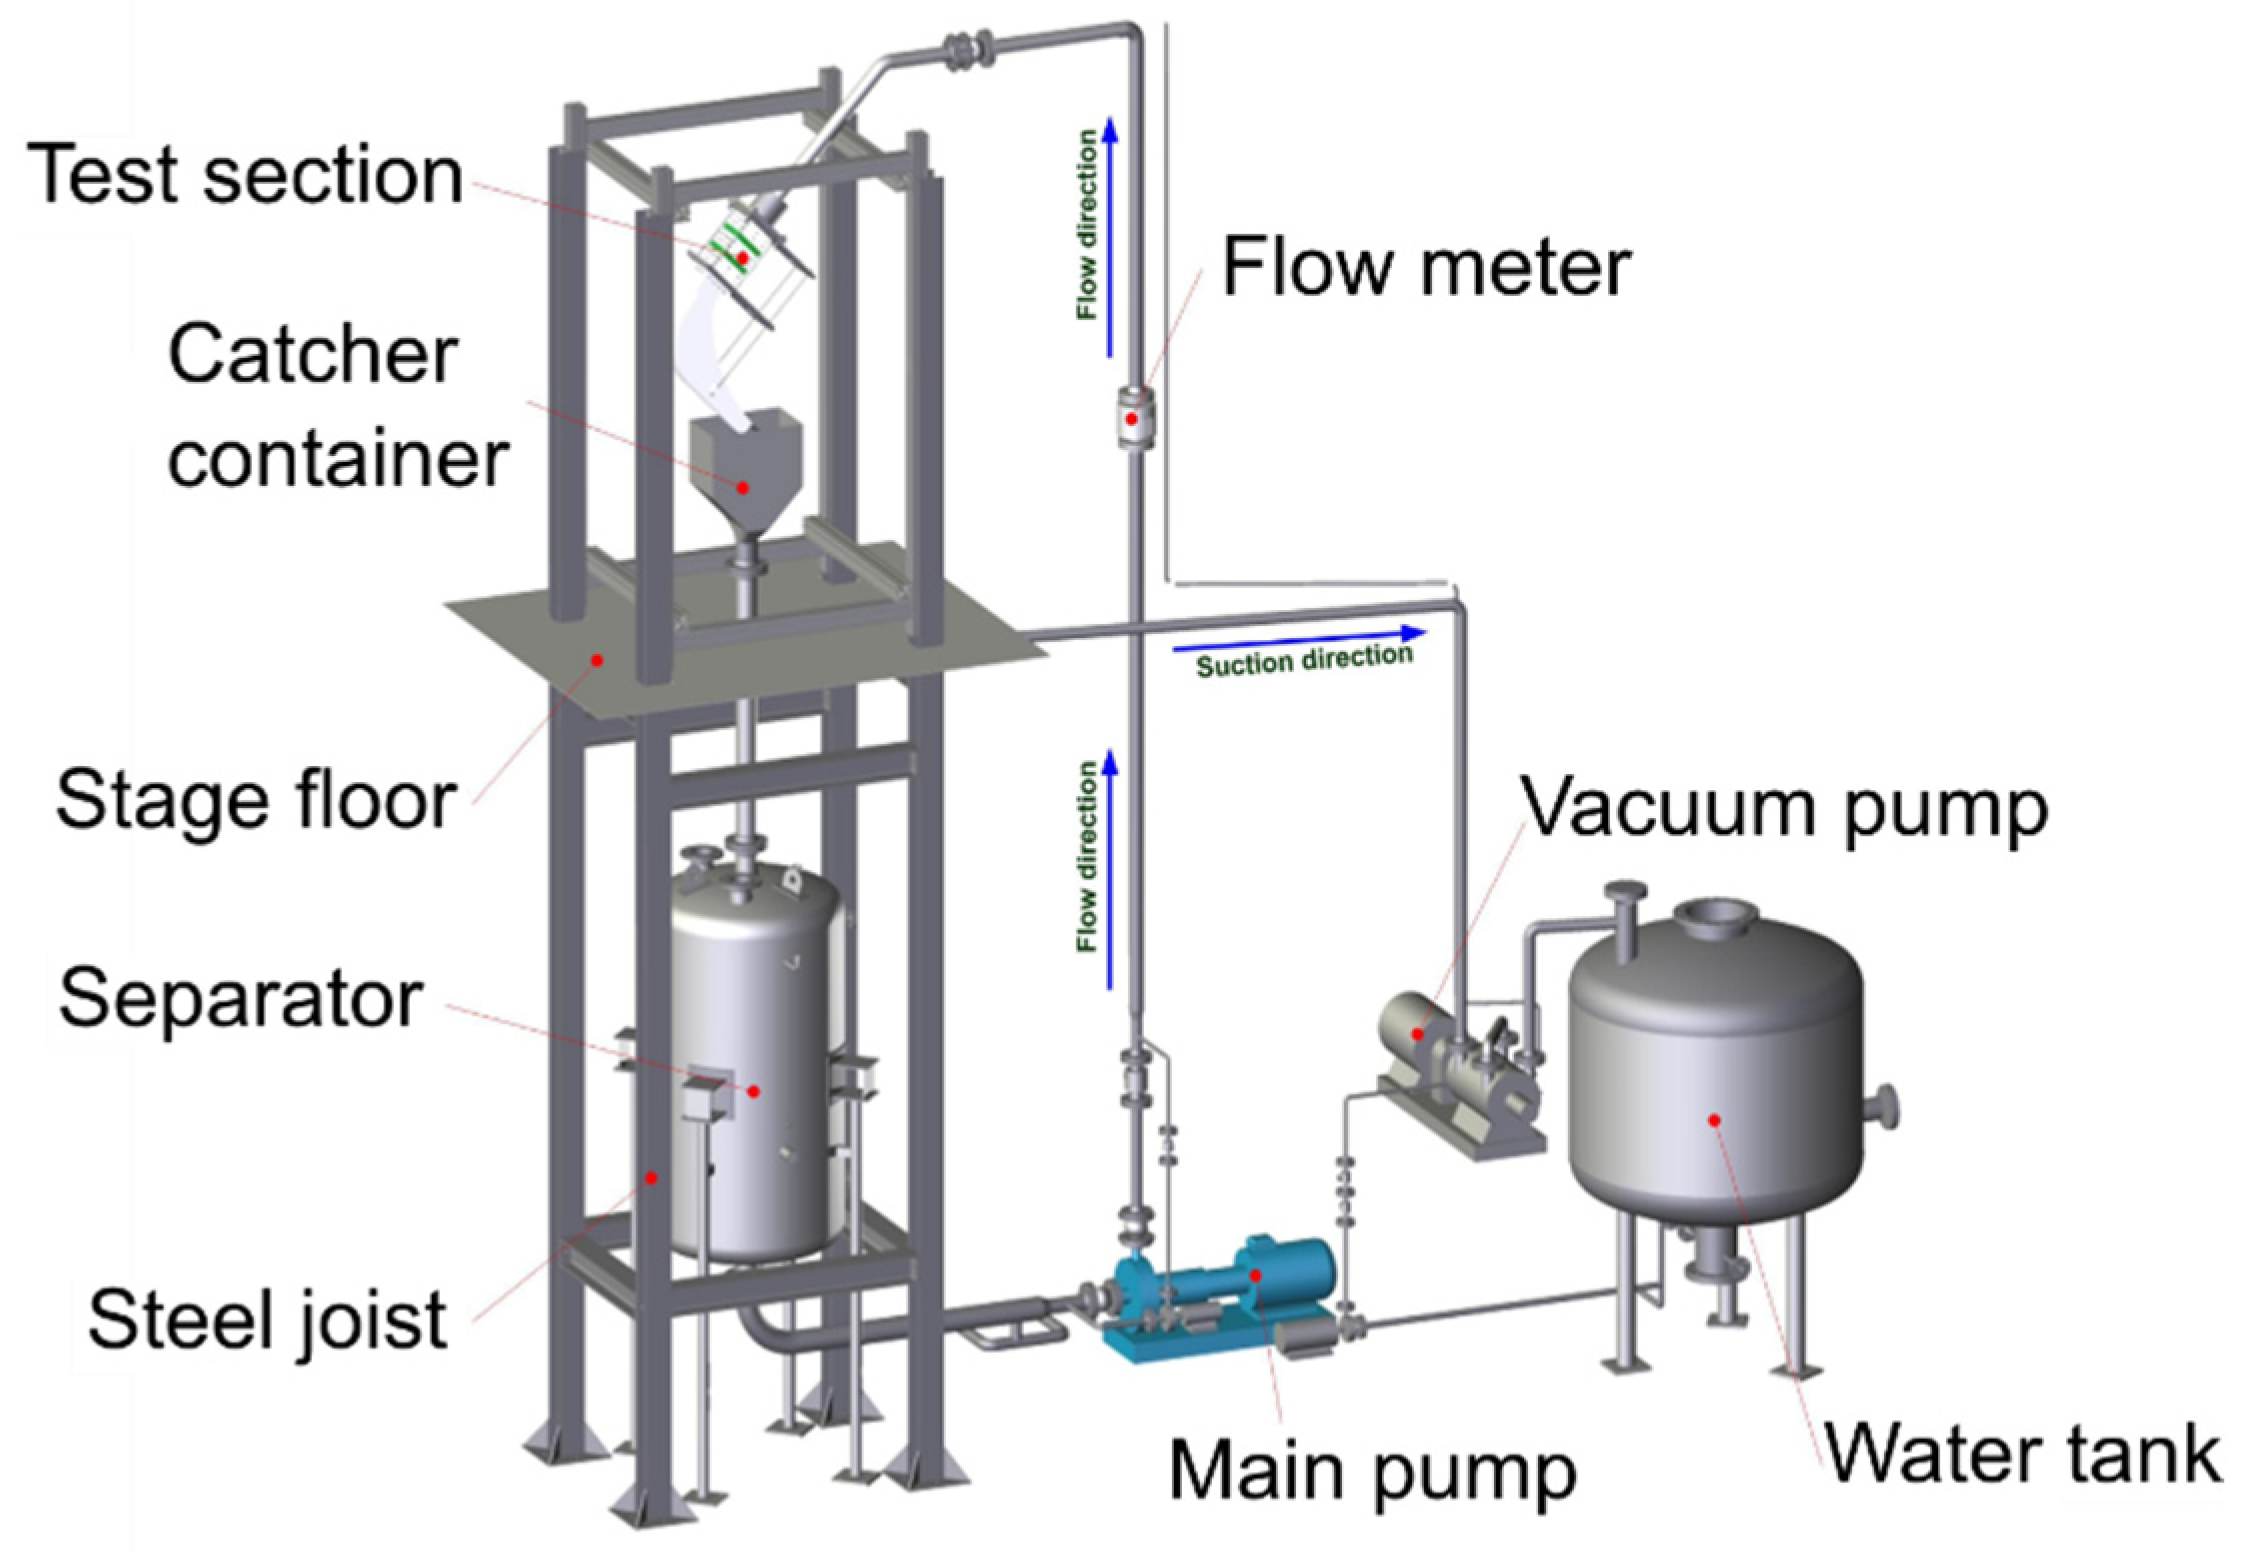
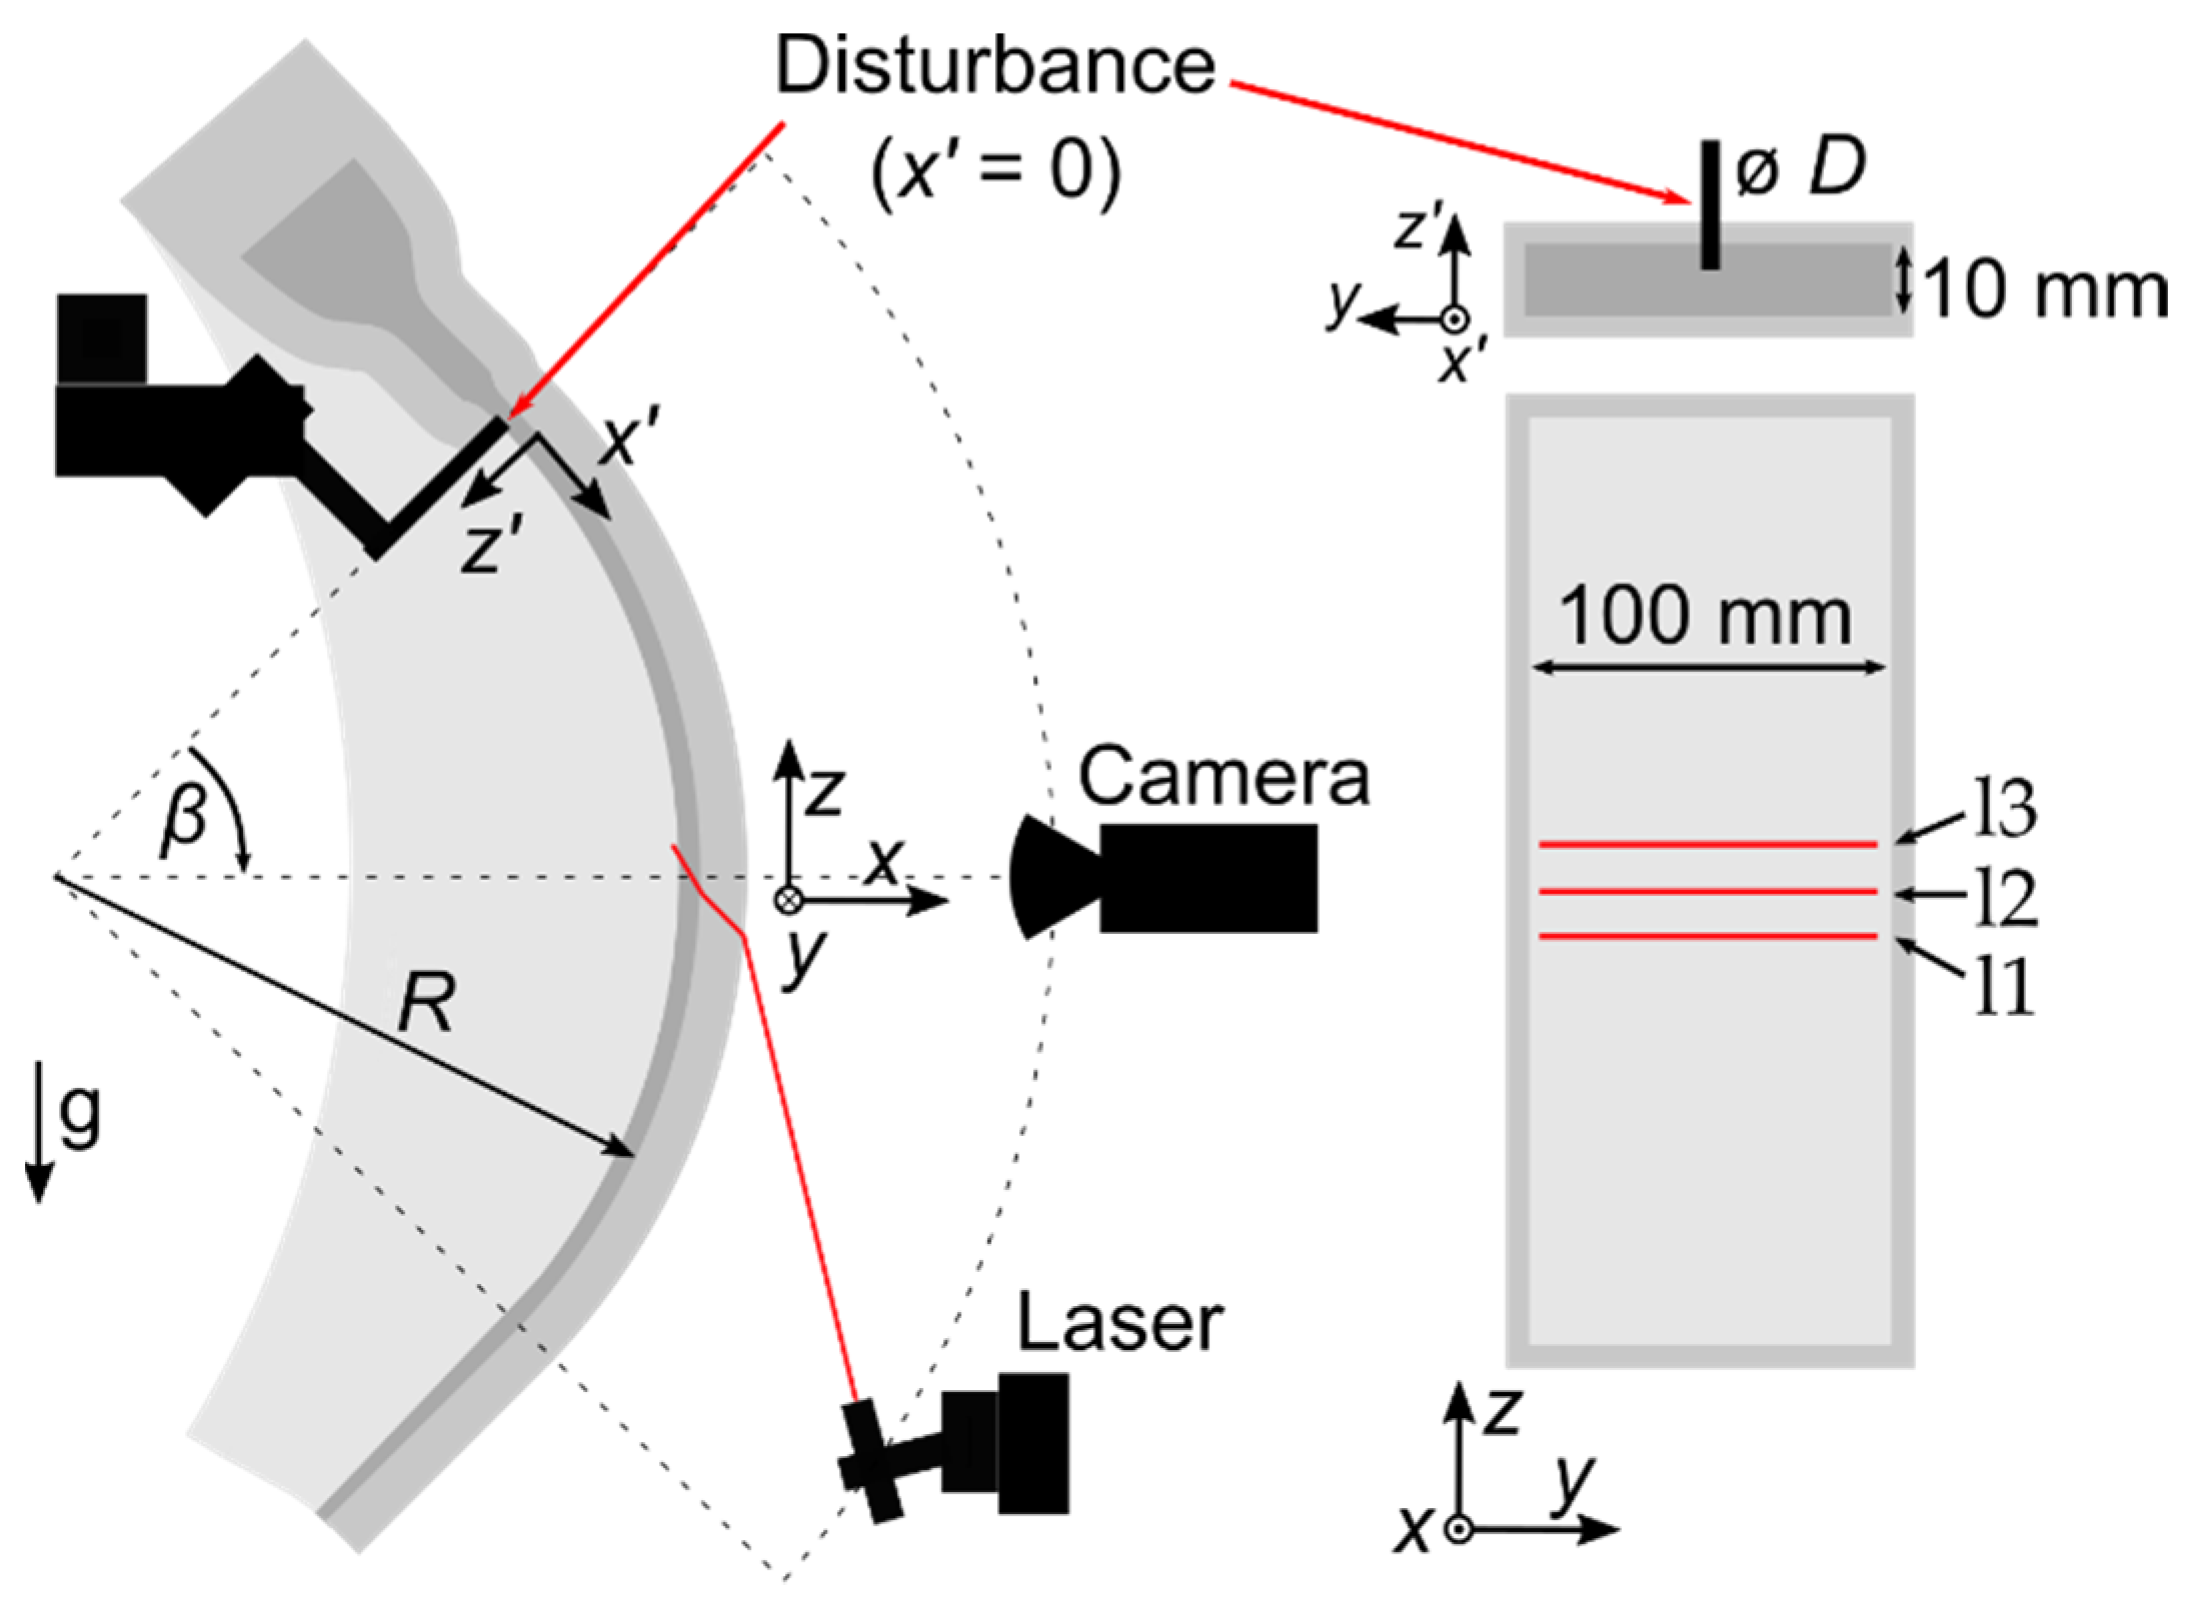
3. Experimental Setup

The experiments were conducted at the water flow test facility FIDES at KIT (Karlsruhe Institute of Technology). The general layout of the facility is shown in Figure 3. A pump provided a constant water mass flow to the top end of the test section, which was measured using a magnetic inductive flow meter. The test section made of plexiglass was geometrically similar to the layout of the liquid lithium target in DONES, as depicted in Figure 4. The water in the test section flowed through a flow straightener into a two-stage nozzle with an outlet cross-section of 100 × 10 mm. A maximum flow velocity at the nozzle outlet of u = 20 m/s could be reached. Downstream of the nozzle, water flowed through the concave open channel with a curvature radius of R = 250 mm before it returned to the separator.
Stable wave structures were generated by an artificial disturbance at the nozzle outlet. This disturbance was a metal cylinder with different diameters D (1.2, 2, 3 mm). The penetration depth of the cylinder into the water could be varied by a linear stage. A camera (“Basler ac2040-55uc” camera [18] and “KOWA LM16JC3M2” objective [19]), placed as depicted in Figure 4 with a back wall distance of 213 mm, was used to observe the wake structures with an exposure time of 1 s. To measure the layer thickness, a laser line was projected in the camera’s field of view. The camera observed three reflected lines from the channel outside wall (l1), the channel floor (l2) and the water surface (l3). Figure 4 shows the arrangement of the disturbance, the camera and the laser, as well as the view on the channel back wall with the three reflected lines. To measure the height profile at different positions, the camera and laser could be moved by keeping a constant distance to the back wall. The relative position of the laser and camera remained constant. The measured circumferential positions were β = 35°, 40°, 45° and 50° downstream of the nozzle. The vertical channel position corresponded to β = 45°.
MATLAB [20] was used for the image evaluation. Three horizontal areas were defined where the laser lines were expected to be. Those were further subdivided into vertical segments. In every segment, the laser lines were detected by defining threshold values for the pixel intensity. Therefore, the pixel positions of the three lines in the image were known. By using pictures of measuring tapes at the channel outside wall (R0 = 270 mm), the pixel position could be assigned to a circumferential position at the outside wall (the nozzle outlet was zero). The layer thickness was calculated via triangulation with the known circumferential position, the camera position, the refractive indices and the back wall thickness of 20 mm. Laser line l1 was the reflection from the back wall. With the camera position, l2 had to be corrected via refraction through the 20 mm back wall to obtain the position of the laser line on the channel floor. Using the known position of l1 on the back wall, l2 on the channel floor and the laser line through the back wall, the incidence angle on the channel floor and the ray further through the water could be calculated. With the observed reflection on the water surface (l3), the viewing line of the camera to the water surface was calculated. The intersection point of the viewing line and the laser line resulted in the point on the water surface. The difference between the channel floor curvature radius and the distance of the point on the water surface to the center point of the curvature was the output of the algorithm (the thickness of the water flow at this location).
To validate the measurement system, the layer thickness in the area 0–2 mm downstream of the nozzle was measured. The expected thickness was the nozzle height of 10 mm. The average layer thickness along the channel width was 9.99 mm, with a standard deviation of <0.09 mm. In addition, undisturbed profiles were measured with a chromatic confocal sensor (KEYENCE CL-3000 with CL-LP070 optical head [21]). The mean deviation of the undisturbed absolute height profile in between the side wall wakes measured by the two sensors for β = 45° (u = 5 m/s) was smaller than 0.1 mm.

4. Experimental Results

The presented analytical solutions of Kelvin wakes in Section 2 were used to set the boundary conditions for the tests in water and to be able to transfer the results to DONES. Under the assumption of a constant product FrWe, the velocity range of u = 15–20 m/s in lithium (250 °C) is similar to the velocity range of u = 4.7–6.2 m/s in water (20 °C). In this range, the wake shape in water is similar to the shape in a lithium flow with the same curvature radius of R = 250 mm.

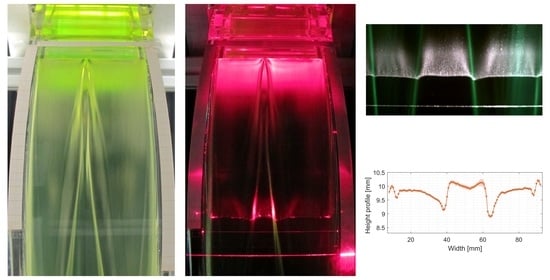
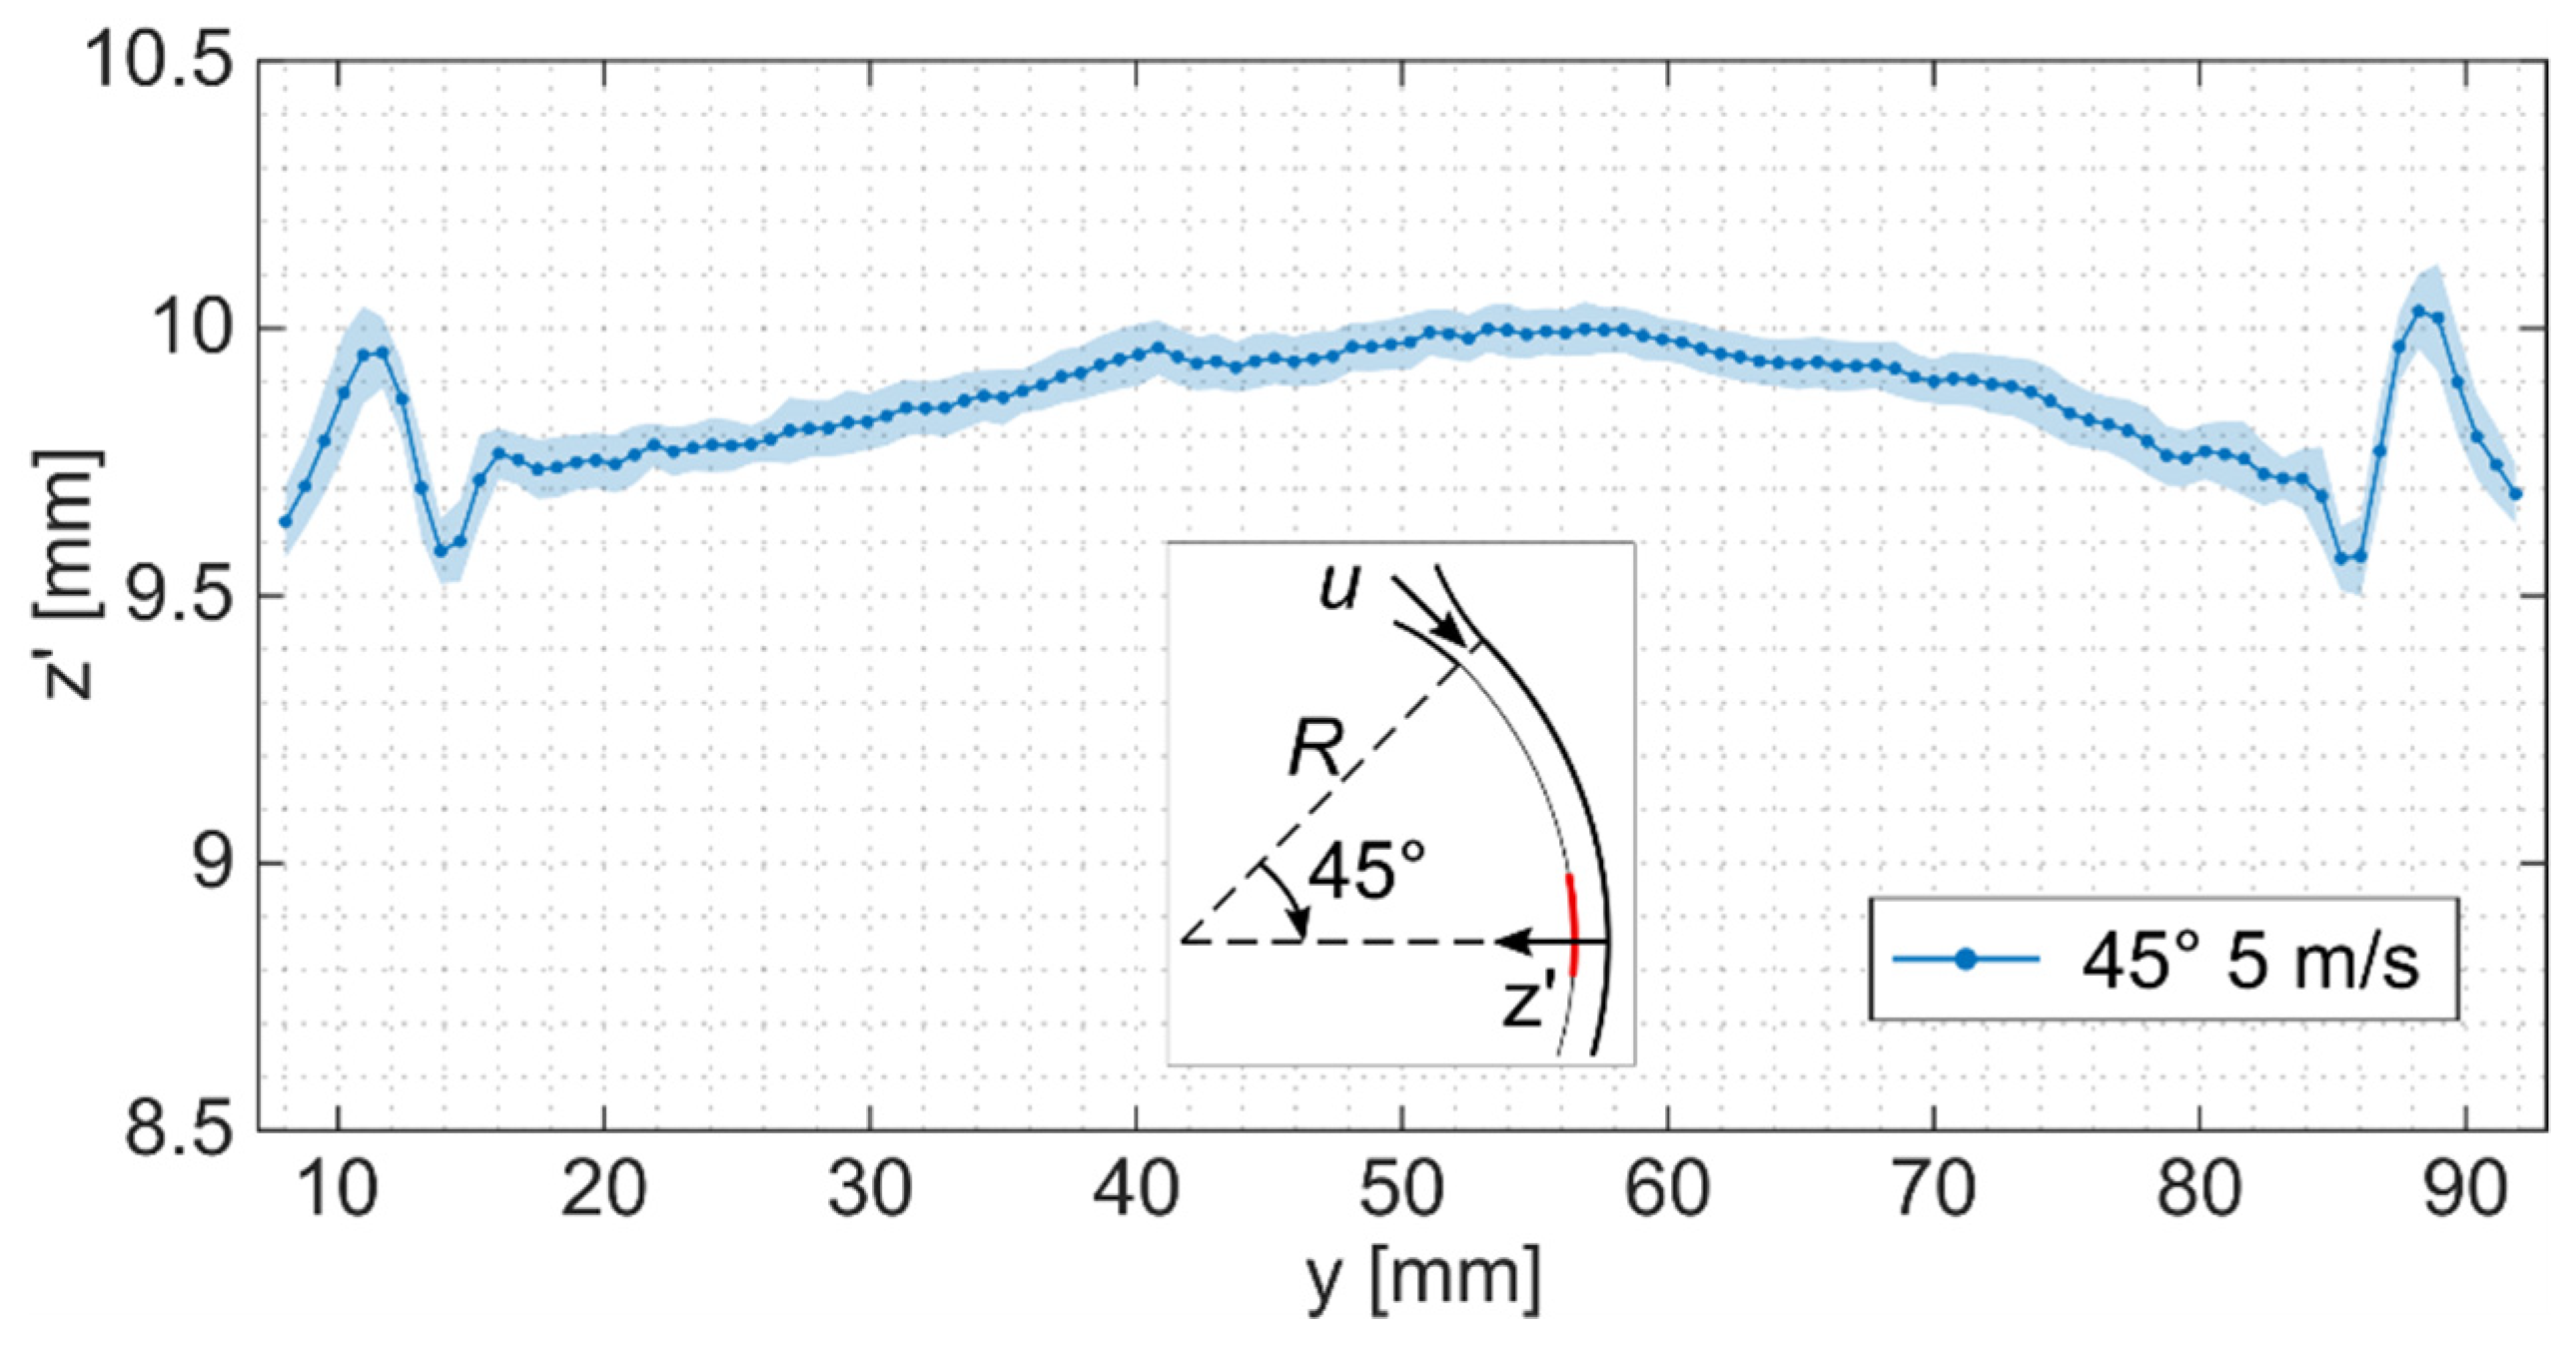
4.1. Undisturbed Height Profile Measurements

In the first step, the layer thickness of the undisturbed water flow in FIDES was analyzed. Figure 5 shows the averaged measured height profile at u = 5 m/s, β = 45° downstream of the nozzle. In the images of the reflected laser lines, 1 px in the height was equivalent to a height change of 0.043 mm. The standard deviation of the measured undisturbed profile was <0.11 mm. In addition, the calculated systematic error of the absolute height measurements was 0.13 mm. The considered errors were the uncertainty of the camera distance, the measuring tape position and the uncertainty of the threshold value in the laser line detection algorithm. In y-direction, the point to point distance was 0.729 mm, across which the measured heights were averaged.
The profile of the undisturbed flow in Figure 5 showed a slight bulge in the center of the channel. Near both side walls, the wakes that occurred from the nozzle corners were visible as a maximum and minimum. The measured maximum had a side wall distance of 11.82 mm, which corresponds to the first maximum (n = 0.5) of the centrifugal Kelvin wake line (Section 2). The first 8 mm from both side walls could not be measured. Laser light scattered by the side wall prevented the measurements. Directly at the wall, the film thickness reached another maximum due to wetting. Between the wake maximum and the wall, another minimum was indicated. The average layer thickness of the measured profile shown in Figure 5 was 9.88 mm.
In case of the undisturbed flow, measurements were performed at different flow velocities and circumferential positions. The averaged layer thickness at 45° showed a positive correlation to the flow velocity (Figure 6a). The position of the wake maximum stayed constant. Due to the increasing layer thickness at higher flow velocities, the measured minimum moved slightly in the direction of the nearest side wall. For an increasing nozzle distance and constant flow velocity, the mean layer thickness decreased slightly (Figure 6b). The distance of the side wall wakes to the nearest wall increased with increasing nozzle distances. The variation of the wakes’ side wall distance, as well as the constant position of the maximum at different flow velocities, is described by the analytic Kelvin wake equations in Section 2.

4.2. Disturbance Induced Wake Profile Measurements

Side wall wakes do not extend into the area of the beam footprint in DONES; therefore, the wake structures behind impurities accumulating at the nozzle edge were of particular interest. To study the effect of a disturbance at the nozzle edge, a defined disturbance was placed at the nozzle outlet. The disturbances were realized using metal cylinders of different diameters D (1.2, 2, and 3 mm), which could be moved into the flow by a linear stage. The investigated penetration depths were 0.75, 1.25, 1.5, and 2 mm. Penetration depths were measured from the point when the cylinder first touched the water surface. Besides the parameter variation of the disturbance, the flow velocity and circumferential position of the measurements were varied, as in the undisturbed measurements. The height profiles behind the disturbance were evaluated using their height change in comparison to their corresponding undisturbed profile, which was defined as the relative height profile (Δz’).
At first, the penetration depth for the diameter D = 1.2 mm, which caused a wake minimum larger than 1 mm, β = 45° downstream of the nozzle at u = 5 m/s, was analyzed. Up to a penetration depth of 0.75 mm, no significant height change was observed. For increasing penetration depths, a clearly visible wave crest and trough were measured on both sides behind the disturbance. The critical wake depth of 1 mm was exceeded with a 2 mm penetration depth. The other way to increase the disturbance size was to use a larger diameter. By increasing the diameter, the penetration depth which caused a critical wake depth decreased. For the disturbance diameter of D = 2 mm, the critical penetration depth was reached at 1.25 mm. Further increasing the diameter to D = 3 mm had a much smaller impact on the wake amplitude than the change from D = 1.2 to 2 mm.
Varying the circumferential position of the measurements showed a decreasing wake depth in the streamwise direction (Figure 7). The last parameter tested for its effect on the wake depth was the flow velocity. In the considered velocity range, no significant height change variation due to the flow velocity could be detected.

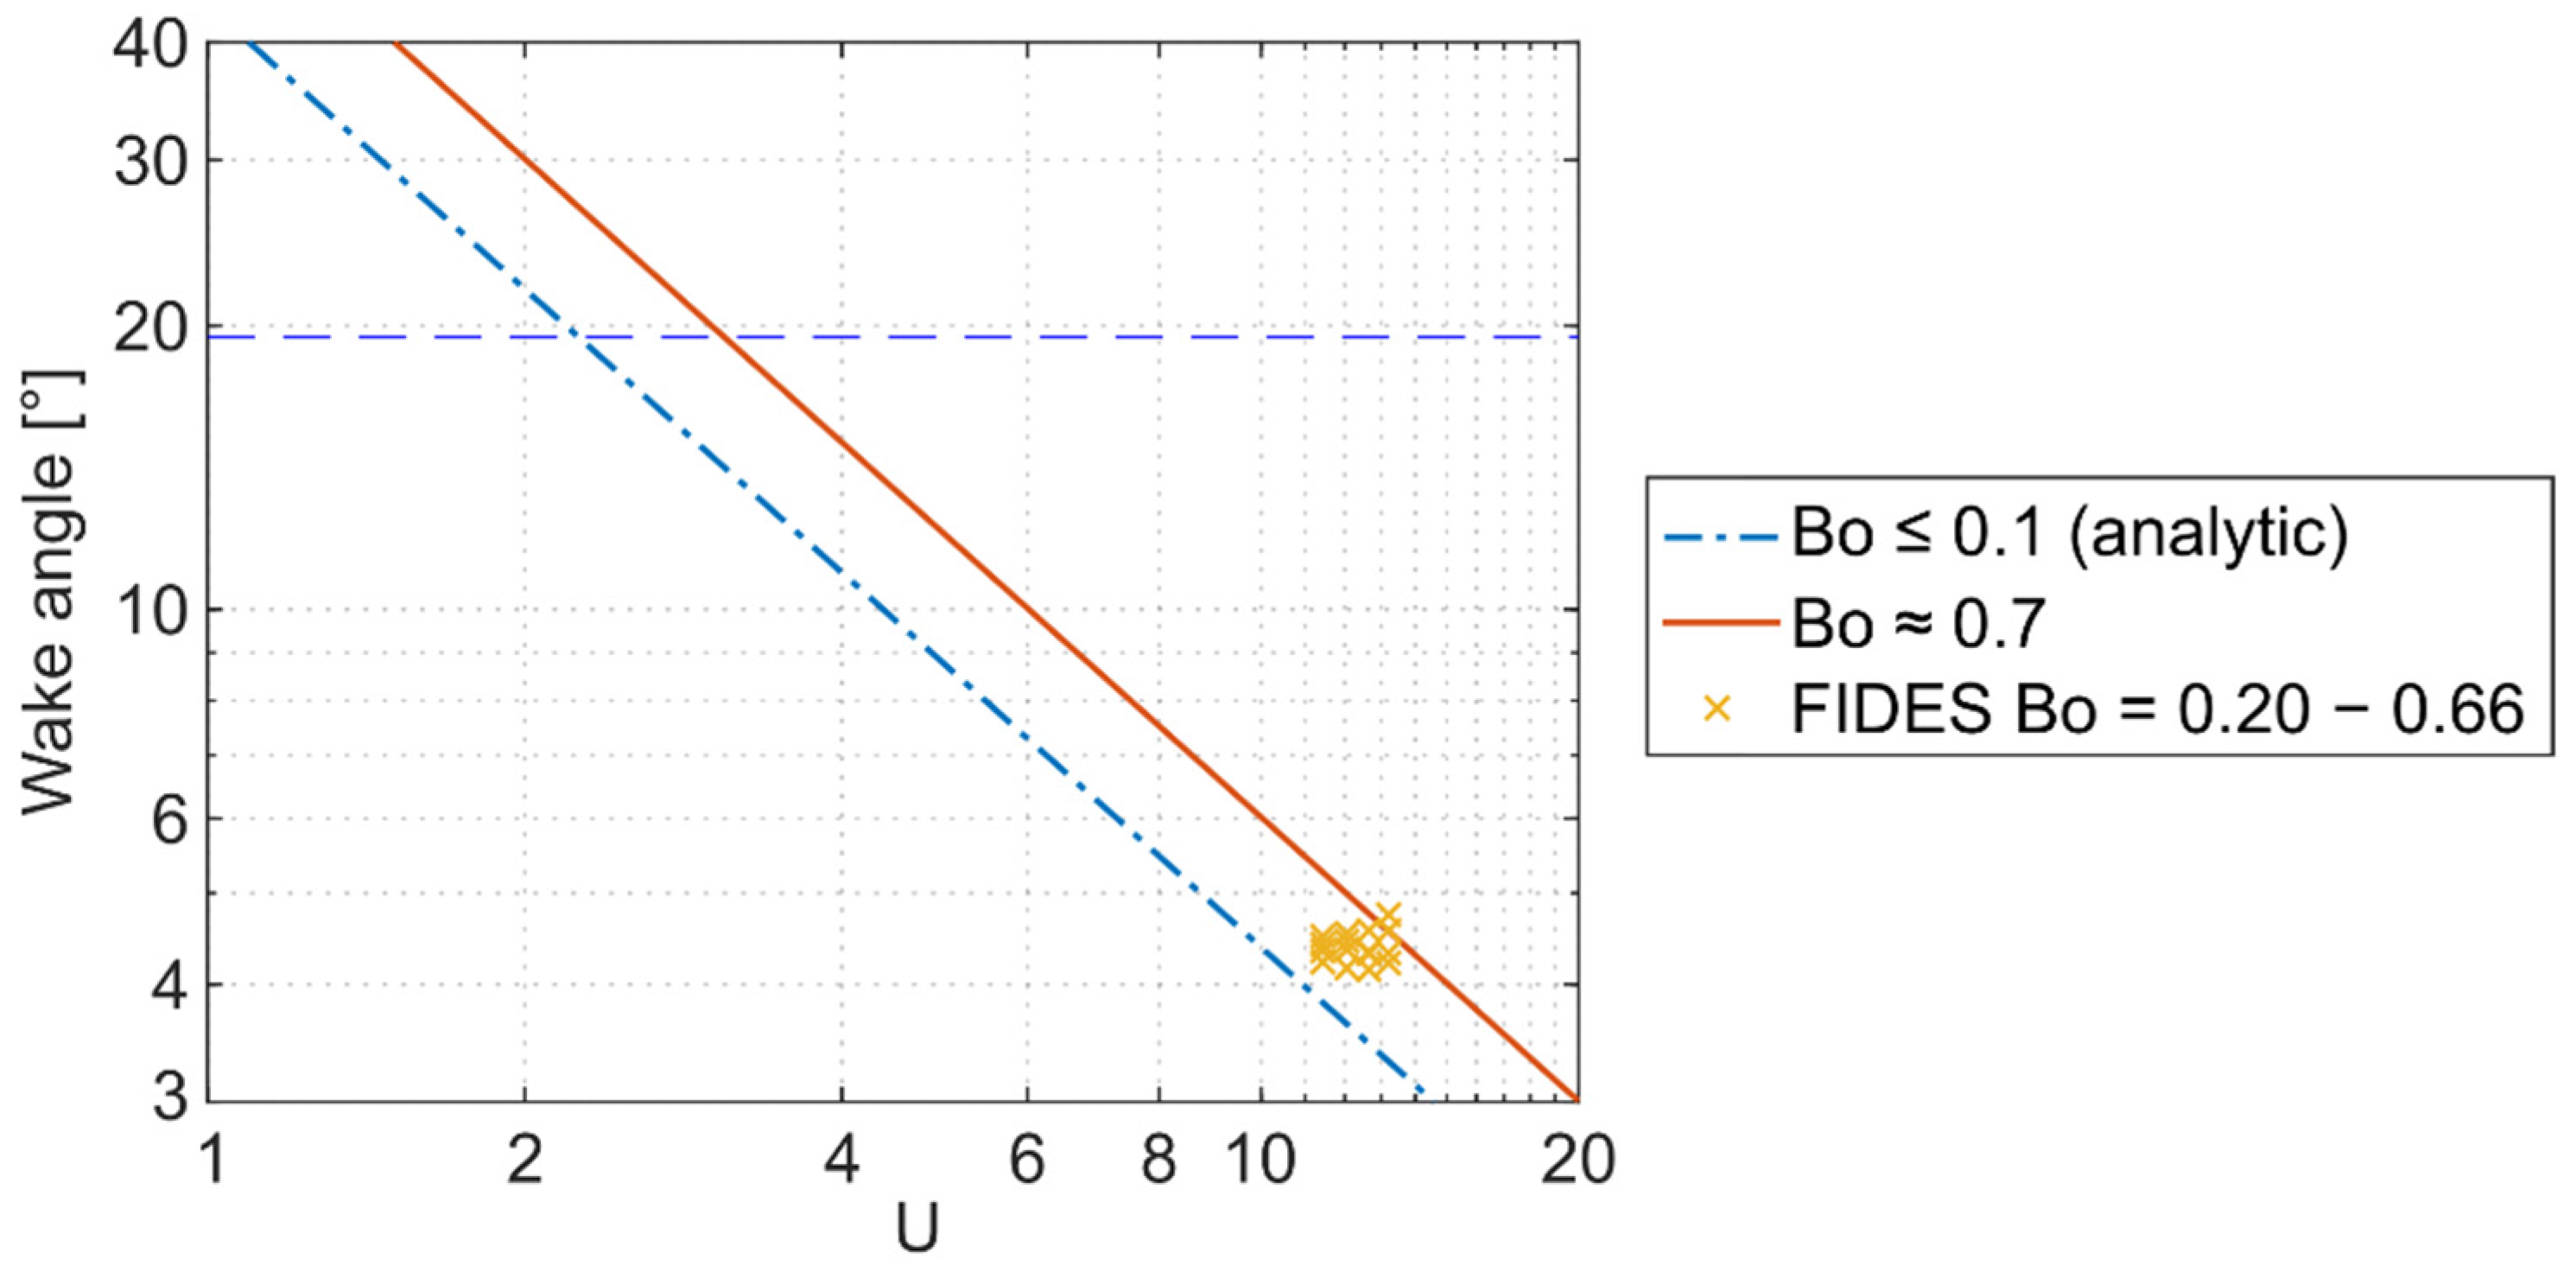
4.3. Wake Angle Evaluation

In addition to the wake depth, the wake shape could be evaluated using the profile measurements. The wake shape is defined by the position of the maximum wave amplitude. In the profile measurements, the maximum wake amplitude was the dominant minimum downstream and on each side of the disturbance. The wake shape is of particular interest to compare the measured wakes with the analytical results in Section 2 and other published wake angles. For the comparisons, the measurement position, β, was converted to a circumferential position at the water surface with an assumed curvature radius of 240 mm.
Only the circumferential position had an impact on the position of the wake minimum (Figure 7). This was consistent with the analytical results. The position of the dominant wake minimum was between the innermost capillary and outermost centrifugal line. The solution for n = 0.5 represents the position of the first maximum. Figure 8 shows the position of the analytical results β = 35° downstream of the nozzle in comparison to the measured profile. From the definition of the analytical solution, there are no further solutions defined for n < 0.5. Nevertheless, the experimentally measured position of the minimum was described by the centrifugal solution with n = 0.25 (vertical dashed line in Figure 8).
Following Moisy and Rabaud [10], the Froude number, the Bond number, B o = L / λ c and the velocity ratio, U, were used to describe the wake angle. The capillary length was λ c = 2 π ( σ R / ( ρ u 2 ) ) 1 / 2 . Similar to the Froude number, the gravity was substituted by the centrifugal acceleration.
Figure 9 shows the wake angle plotted against the velocity ratio. The horizontal dashed line is the Kelvin angle, which is present at small velocity ratios. A velocity ratio larger than one is needed to create a stable wave pattern. The lower diagonal line is the angle of the inner cusp of the analytical curves (Figure 2). Compared to the experimental results of Moisy and Rabaud [10], this line corresponds to small Bond numbers (Bo ≤ 0.1). The upper diagonal line fits their measured values for Bo ≈ 0.7. In the case of the measurements in FIDES, the velocity ratio was U = 11.5 to 13.27 and only depended on the flow velocity. The Bond number ranged from Bo = 0.2 to 0.66 and depended both on the flow velocity and on the diameter of the disturbance. The measured wake angles in the FIDES facility tended to be in the expected area.
In the experiments, the flow velocity and the diameter of the disturbance were varied. Increasing the flow velocity caused a larger Bond number and velocity ratio. Due to the diagram, larger Bond numbers at a constant velocity ratio cause a bigger wake angle. An increasing velocity ratio caused smaller angles with constant Bo. The experiments did not show any dependency of the flow velocity on the wake angle, which could be caused by the given channel geometry. The increasing flow velocity caused an increase in the centrifugal acceleration.

5. Summary and Conclusions

Measurements on a water flow similar to DONES were performed in order to study the effect of disturbances at the nozzle outlet on the downstream layer thickness of the free surface flow. The height profile in the concave channel was examined by a self-developed optical measurement system based on laser triangulation. The undisturbed flow showed that the wake emerged from the nozzle corners, which was in accordance with analytical solutions.
Symmetrical minima and maxima of the height profile on both sides downstream of a sufficiently large disturbance at the nozzle edge were found. The diameter and penetration depth of the disturbance defined the disturbance size. Both correlated positively with the wake depth and, therefore, the critical wake depth depends strongly on those two parameters. Up to a specific size of the disturbance, changes in the height profile were within the measurement uncertainty. In addition to the disturbance size, the circumferential position affected the wake depth. For an increasing nozzle distance, the wake depth decreased. The critical wake depth at the vertical position was reached for a disturbance with a diameter of D = 1.2 mm and a penetration depth of 1.5–2 mm. Concerning the prediction of the wake angle or position of the stable minimum, the constant phase lines of the first wave crests for n = 0.5 of the analytical Kelvin wake solutions were the best reference. The curves framed the measured minimum and considered the increasing angle in flow direction and the measured independence of the disturbance size and flow velocity. Nevertheless, there was no direct representation of the wake minimum in the Kelvin wake equations.
The performed height profile measurements of wakes in water provide a first insight into wake structures dominated by centrifugal acceleration at channel positions relevant for DONES. In contrast to gravity-dominated wakes, no impact of the varying flow velocity on the wake angle was measured. The wake shape can be transferred quantitatively to lithium due to WeFr similarity. The actual height profiles provide a qualitative insight into wake structures on lithium flowing in a concave open channel. It is assumed that impurities at the nozzle in DONES accumulate over time. Therefore, a critical wake is indicated through an increasing wake amplitude. The dependency of the height profile on the circumferential position needs to be considered if the film thickness in the channel is predicted from one measured profile.

Author Contributions

Investigation, B.B. and S.G.; methodology, L.S.; supervision, S.R. and W.H.; writing—original draft, B.B.; writing—review and editing, S.R. and W.H. All authors have read and agreed to the published version of the manuscript.

Funding

This work has been carried out within the framework of the EUROfusion Consortium and has received funding from the Euratom research and training program 2014–2018 and 2019–2020 under grant agreement No 633053. The views and opinions expressed herein do not necessarily reflect those of the European Commission, Fusion for Energy, or of the authors’ home institutions or research funders.

Acknowledgments

We acknowledge support by the KIT-Publication Fund of the Karlsruhe Institute of Technology.

Conflicts of Interest

The authors declare no conflict of interest.

References

  1. Knaster, J.; Moeslang, A.; Muroga, T. Materials research for fusion. Nat. Phys. 2016, 12, 424–434. [Google Scholar] [CrossRef]
  2. Ida, M.; Nakamura, H.; Nakamura, H.; Nakamura, H.; Ezato, K.; Takeuchi, H. Thermal-hydraulic characteristics of IFMIF liquid lithium target. Fusion Eng. Des. 2002, 63–64, 333–342. [Google Scholar] [CrossRef]
  3. Kondo, H.; Fujisato, A.; Yamaoka, N.; Inoue, S.; Miyamoto, S.; Sato, F.; Iida, T.; Horiike, H.; Matushita, I.; Ida, M.; et al. High speed lithium flow experiments for IFMIF target. J. Nucl. Mater. A 2004, 329–333, 208–212. [Google Scholar] [CrossRef]
  4. Kondo, H.; Kanemura, T.; Furukawa, T.; Hirakawa, Y.; Wakai, E.; Knaster, J. Validation of liquid lithium target stability for an intense neutron source. Nucl. Fusion 2017, 57, 066008. [Google Scholar] [CrossRef]
  5. Kanemura, T.; Kondo, H.; Furukawa, T.; Hirakawa, Y.; Hoashi, E.; Yoshihashi, S.; Horiike, H.; Wakai, E. Measurement of lithium target surface velocity in the IFMIF/EVEDA lithium test loop. Fusion Eng. Des. 2016, 109–111, 1682–1686. [Google Scholar] [CrossRef]
  6. Kondo, H.; Kanemura, T.; Yamaoka, N.; Miyamoto, S.; Ida, M.; Nakamura, H.; Matushita, I.; Muroga, T.; Horiike, H. Measurement of free surface of liquid metal lithium jet for IFMIF target. Fusion Eng. Des. 2007, 82, 2483–2489. [Google Scholar] [CrossRef]
  7. Rabaud, M.; Moisy, F. Ship Wakes: Kelvin or Mach Angle? Phys. Rev. Lett. 2013, 110, 214503. [Google Scholar] [CrossRef] [PubMed]
  8. Lamb, H. Hydrodynamics; Cambridge University Press: Cambridge, UK, 1916. [Google Scholar]
  9. Darmon, A.; Benzaquen, M.; Raphaël, E. Kelvin wake pattern at large Froude numbers. J. Fluid Mech. 2013, 738, R3. [Google Scholar] [CrossRef] [Green Version]
  10. Moisy, F.; Rabaud, M. Mach-like capillary-gravity wakes. Phys. Rev. 2014, E90, 023009. [Google Scholar] [CrossRef] [PubMed] [Green Version]
  11. Pethiyagoda, R.; Moroney, T.; Lustri, C.; McCue, S. Kelvin wake pattern at small Froude numbers. J. Fluid Mech. 2021, 915, A126. [Google Scholar] [CrossRef]
  12. Noblesse, F.; He, J.; Zhu, Y.; Hong, L.; Zhang, C.; Zhu, R.; Yang, C. Why can ship wakes appear narrower than Kelvin’s angle? Eur. J. Mech. B/Fluids 2014, 46, 164–171. [Google Scholar] [CrossRef]
  13. Ageorges, V.; Peixinho, J.; Perret, G. Flow and air entrainment around partially submerged vertical cylinders. Phys. Rev. Fluids 2019, 4, 064801. [Google Scholar] [CrossRef] [Green Version]
  14. Chaplin, J.R.; Teigen, P. Steady flow past a vertical surface-piercing circular cylinder. J. Fluids Struct. 2003, 18, 271–285. [Google Scholar] [CrossRef]
  15. Koo, B.; Yang, J.; Yeon, S.M.; Stern, F. Reynolds and froude number effect on the flow past an interface-piercing circular cylinder. Int. J. Nav. Archit. Ocean Eng. 2014, 6, 529–561. [Google Scholar] [CrossRef] [Green Version]
  16. Bestehorn, M. Hydrodynamik und Strukturbildung; Springer: Berlin/Heidelberg, Germany, 2006. [Google Scholar]
  17. Lighthill, J. Waves in Fluids; Cambridge University Press: Cambridge, UK, 1978. [Google Scholar]
  18. acA2040-55uc—Basler Ace. Basler AG, 22926 Ahrensburg, Germany. Available online: https://www.baslerweb.com/de/produkte/kameras/flaechenkameras/ace/aca2040-55uc/ (accessed on 20 September 2021).
  19. KOWA LM16JC3M2. Kowa Optimed Deutschland GmbH, 40233 Düsseldorf, Germany. Available online: https://www.kowa-lenses.com/lm16jc3m2-3mp-industrieobjektiv-c-mount (accessed on 20 September 2021).
  20. MATLAB R. The MathWorks Inc., Natick, Massachusetts 01760, USA. 2019. Available online: https://www.mathworks.com/products/matlab.html (accessed on 20 September 2021).
  21. Confocal Displacement Sensor CL-3000. KEYENCE DEUTSCHLAND GmbH, 63263 Neu-Isenburg, Germany. Available online: https://www.keyence.de/products/measure/laser-1d/cl-3000/models/cl-3000/ (accessed on 22 September 2021).
Figure 1. Sketch of the liquid lithium target in DONES. (a) Side view on the cross-section through the channel center. (b) Front view. (c) Cross-section perpendicular to the flow direction at the nozzle outlet. The coordinate axes are y for the channel width, x′ parallel to the channel floor in streamwise direction and z’ perpendicular to the channel floor. The origin is at the nozzle outlet.
Energies 14 06506 g001
Figure 2. Solution of the Kelvin wake Equations (1) and (2) for n = 1 and u = 15 m/s in lithium. The blue dashed line (capillary line) represents the wake line dominated by surface tension. The red solid line (centrifugal line) is the wake line dominated by the centrifugal acceleration.
Energies 14 06506 g002
Figure 3. Scheme of the FIDES test facility.
Energies 14 06506 g003
Figure 4. Sketch of the FIDES test section showing the position of the measurement system (camera and laser) and the position of the disturbance with the diameter, D. The test section is a concave open channel with a curvature radius of R = 250 mm. The measuring position is described by the angle β . On the right side, the view on the back wall of the test section with the three reflected lines l1, l2 and l3 is shown.
Energies 14 06506 g004
Figure 5. Height profile of the undisturbed flow at u = 5 m/s, β = 45° downstream of the nozzle. The standard deviation is represented as the area behind the line.
Energies 14 06506 g005
Figure 6. (a) Height profiles at the vertical channel position β = 45° at different flow velocities u. (b) Height profiles at u = 5 m/s at different circumferential positions (β).
Energies 14 06506 g006
Figure 7. Relative height profile at u = 4.5 m/s for four different circumferential positions (β). The disturbance had a diameter of D = 1.2 mm and a penetration depth of 1.5 mm.
Energies 14 06506 g007
Figure 8. Comparison of the measured wake position with the predicted position of the analytical solutions β = 35° downstream of the nozzle. The profiles at the other positions of β from Figure 7 are still indicated in the background as reference (red, yellow and purple).
Energies 14 06506 g008
Figure 9. Wake angle plotted against velocity ratio U following Moisy and Rabaud [10]. The horizontal dashed line is the Kelvin angle 19.47°. The lower diagonal line is the wake angle curve corresponding to small Bond numbers (Bo ≤ 0.1). The upper diagonal is a fit for Bo ≈ 0.7. Measured wake angles in FIDES are represented by the yellow crosses.
Energies 14 06506 g009
Publisher’s Note: MDPI stays neutral with regard to jurisdictional claims in published maps and institutional affiliations.

