
Study on the Relationship between Combustion Parameters and Cylinder Head Vibration Signal in Time Domain

 ,
,
Abstract
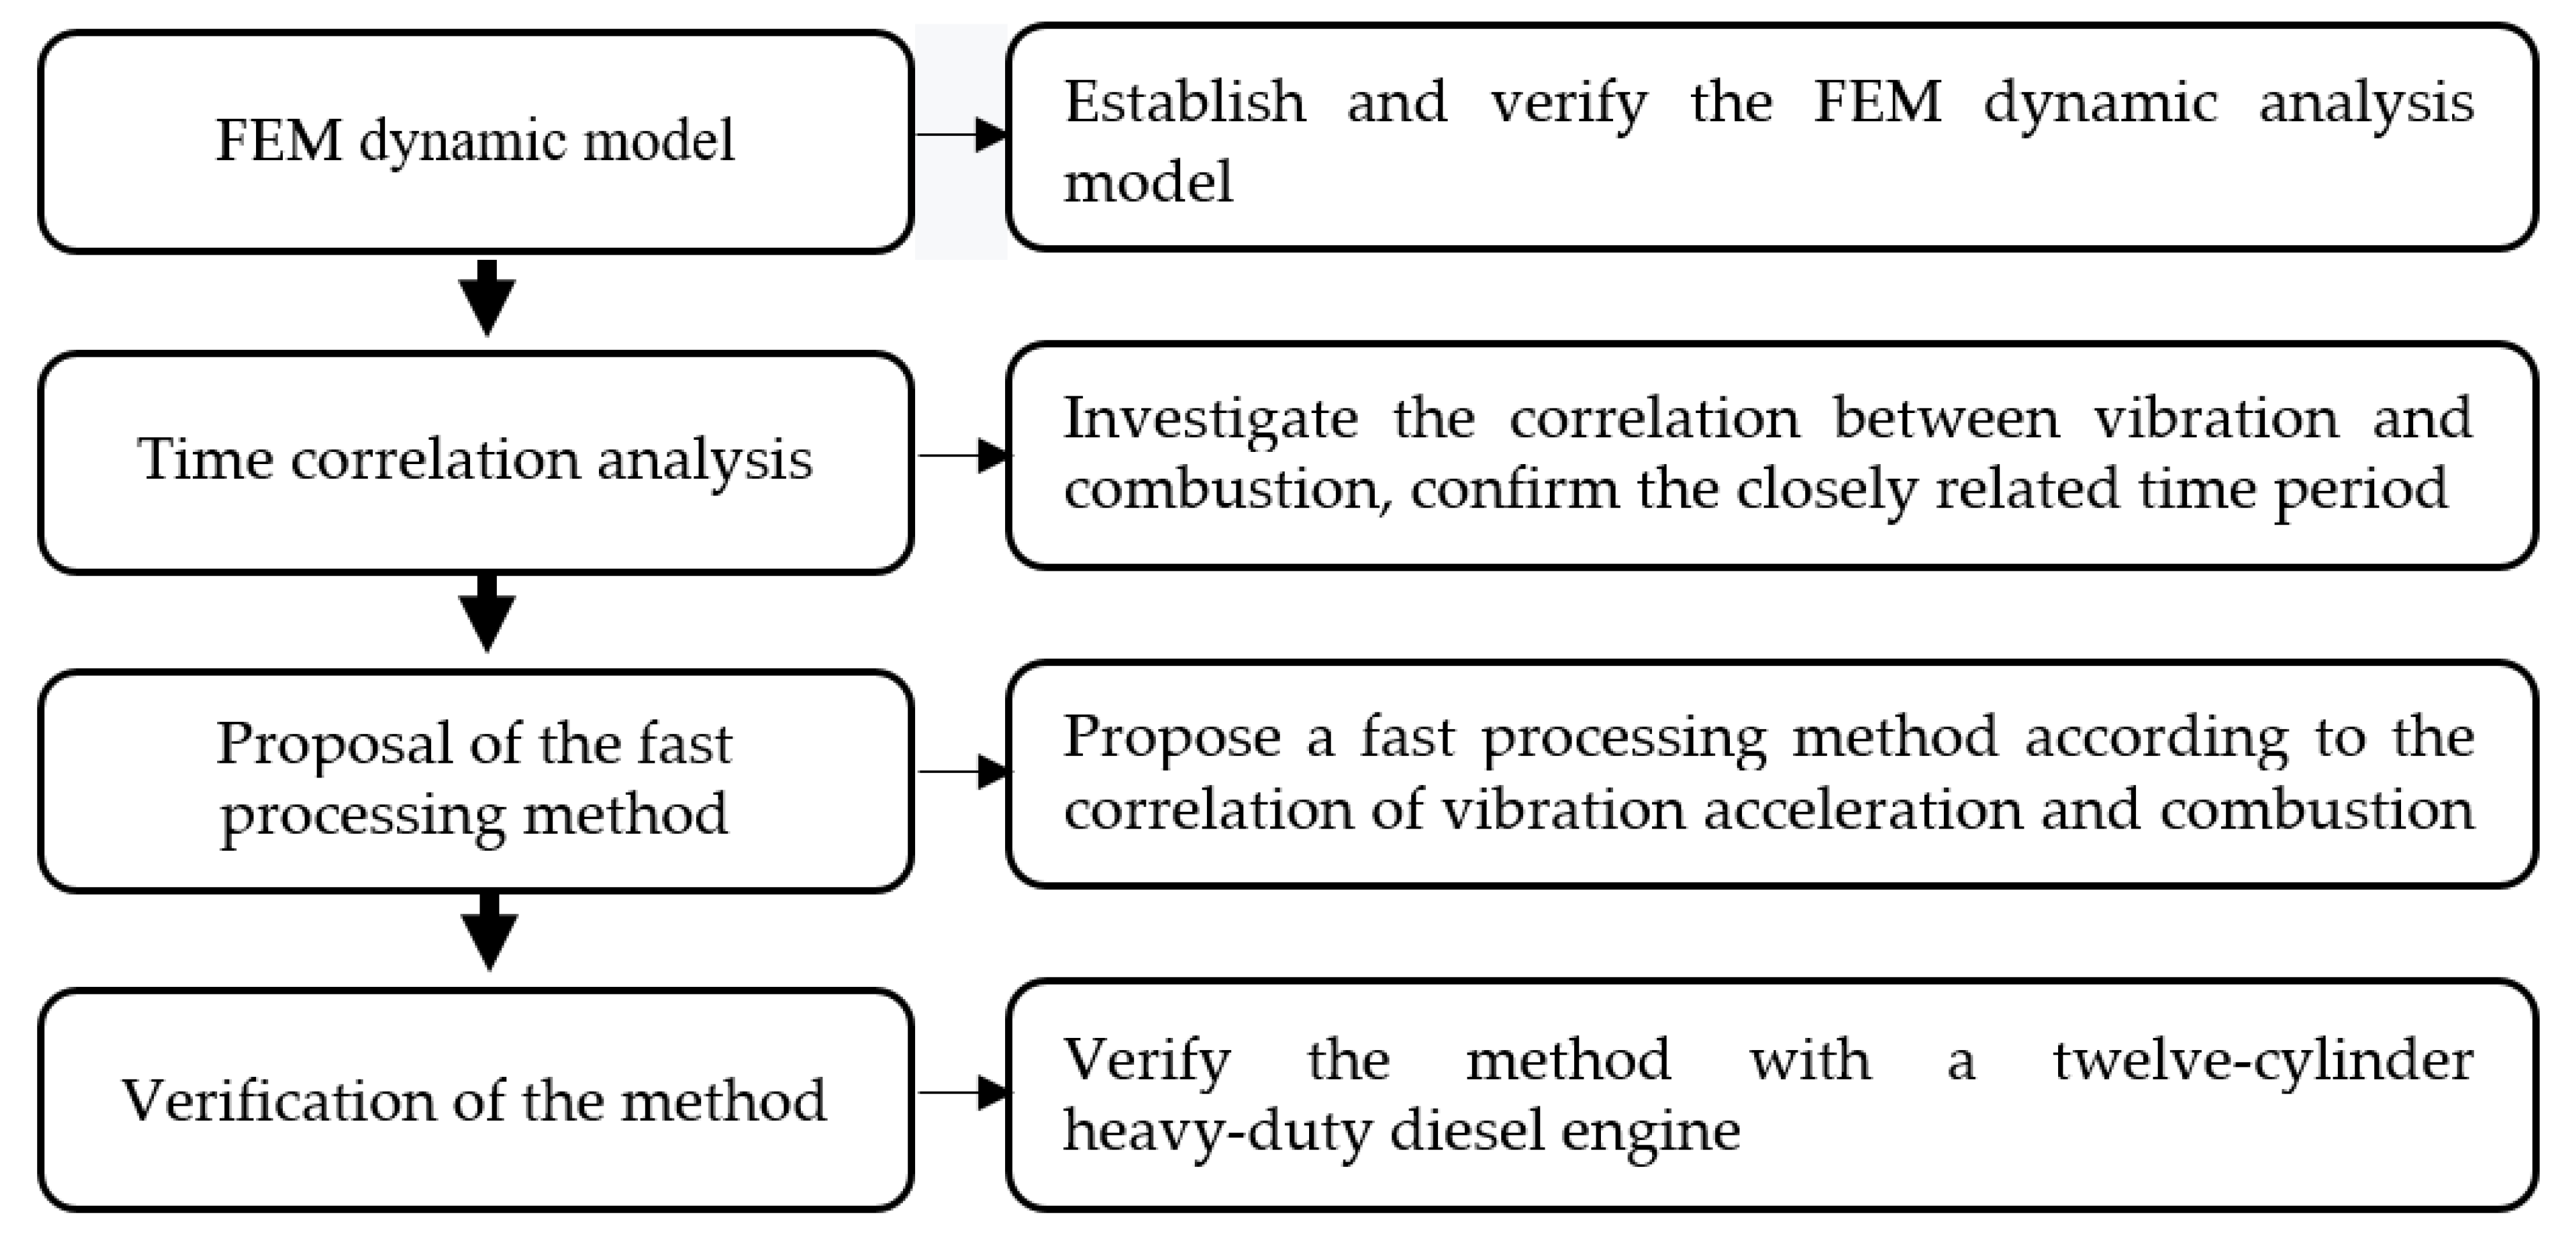
:1. Introduction
2. Experimental Setup and Finite Element Analysis Model
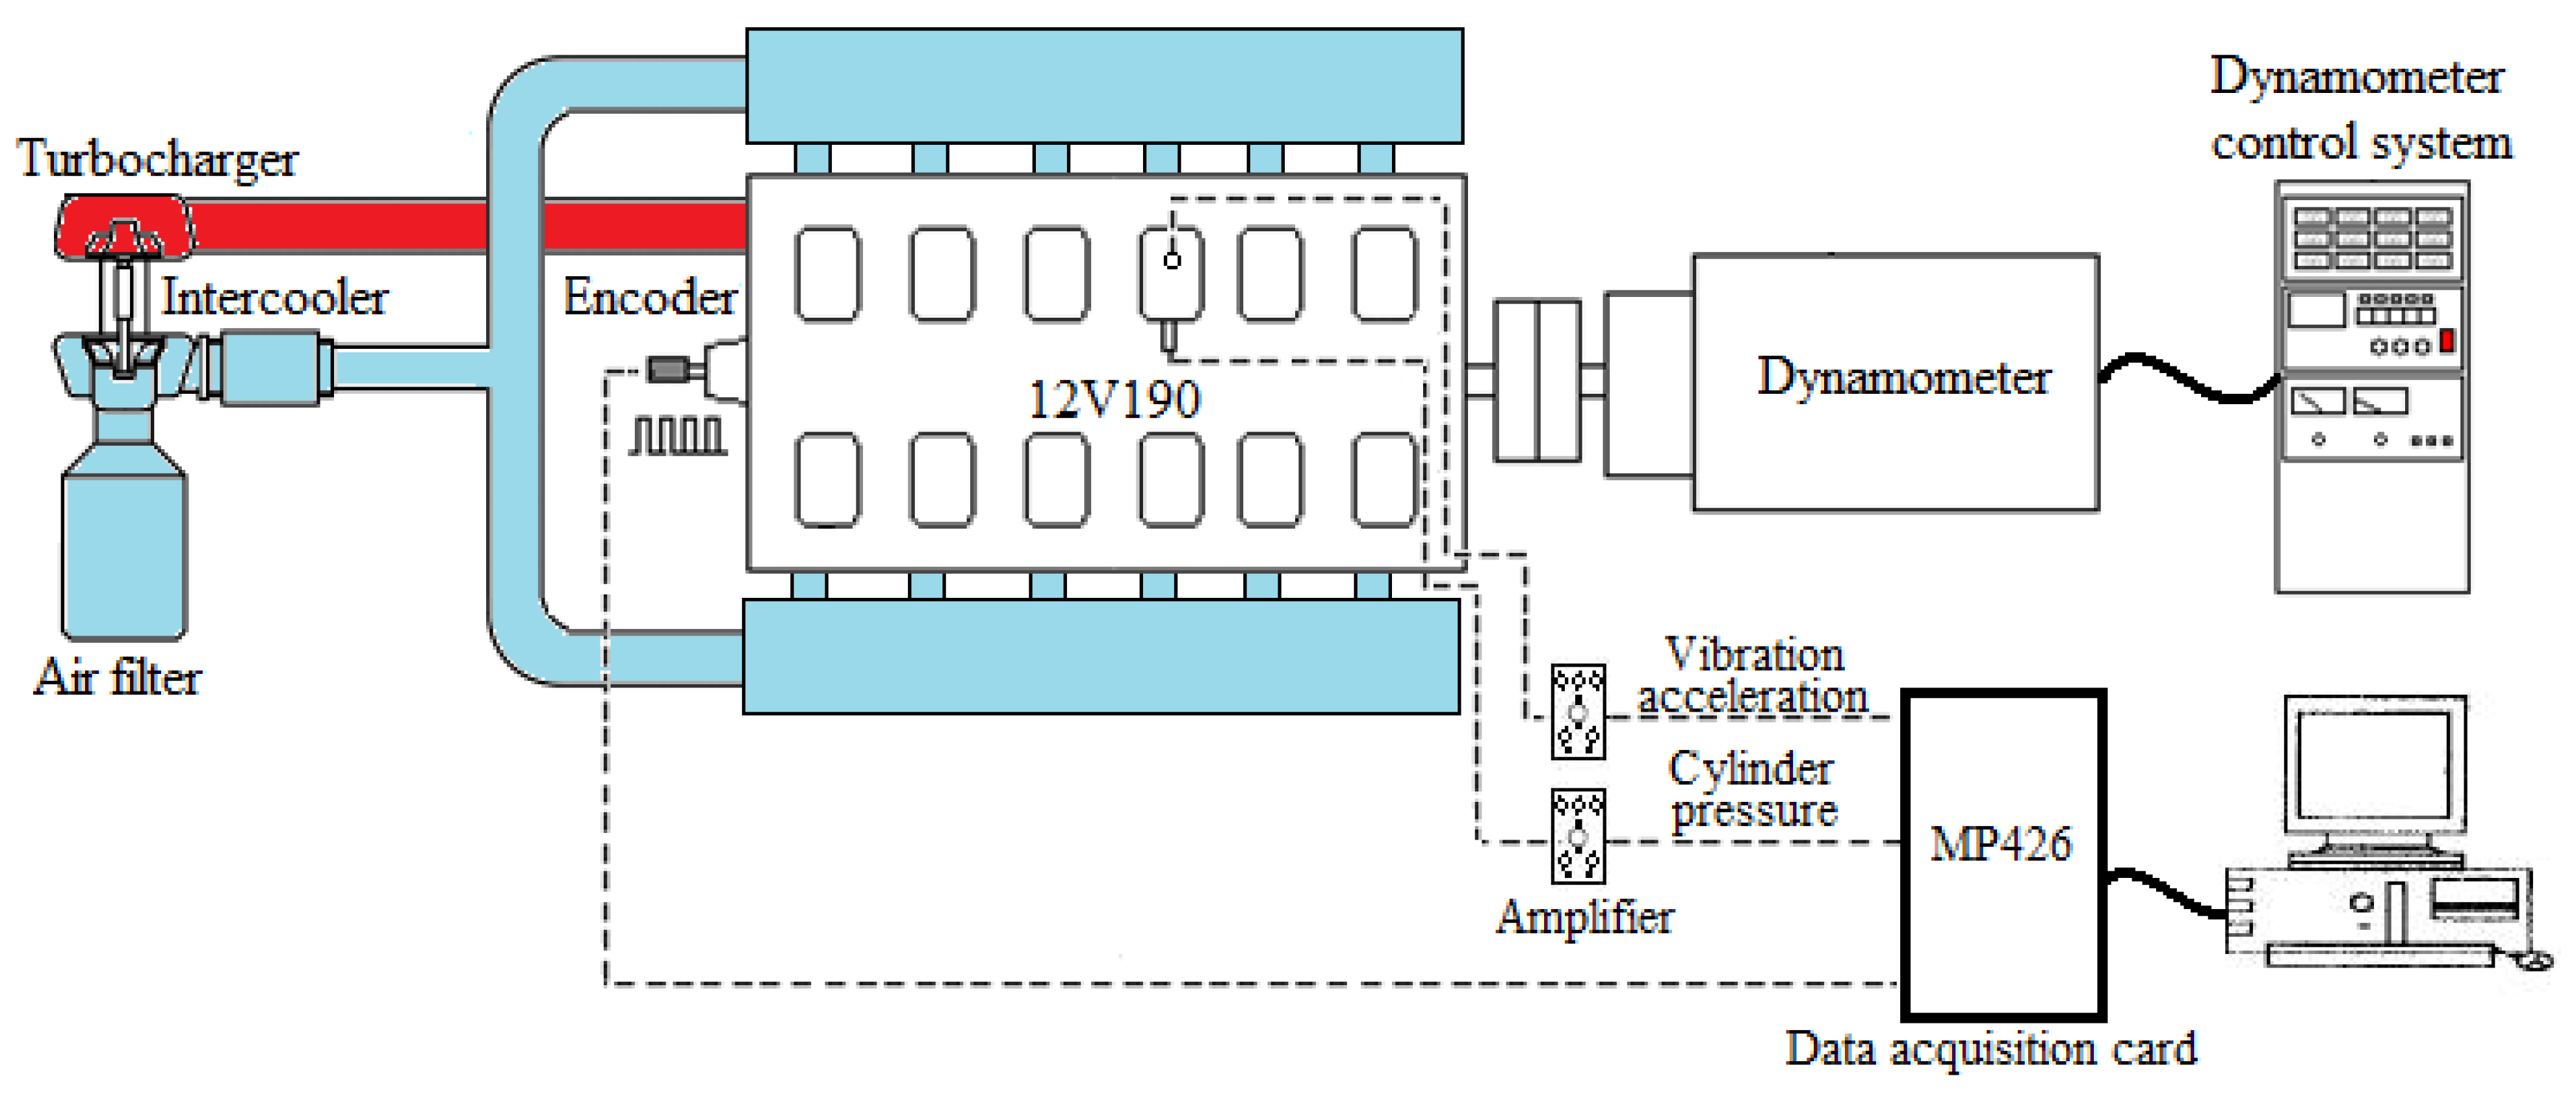
2.1. Experimental Setup
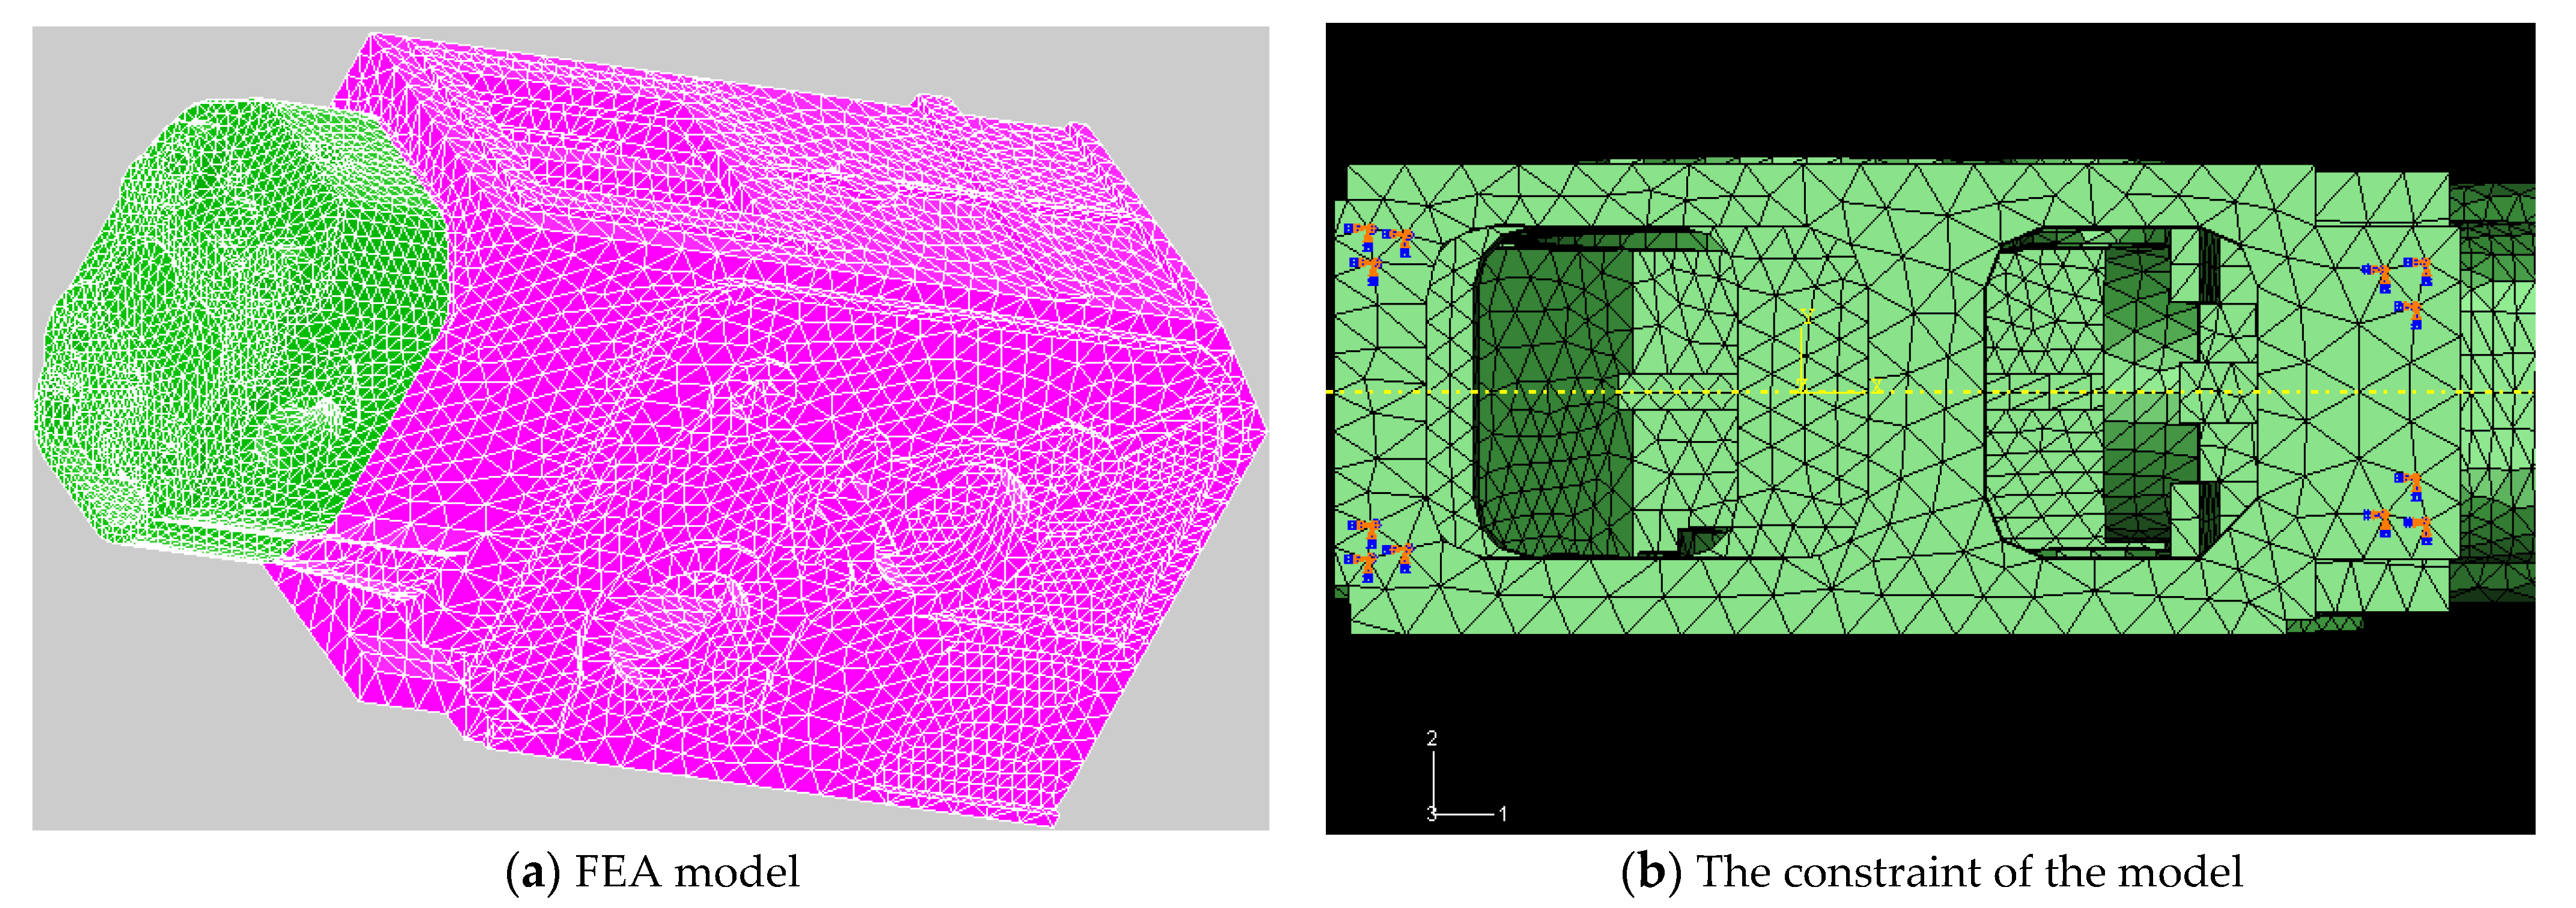
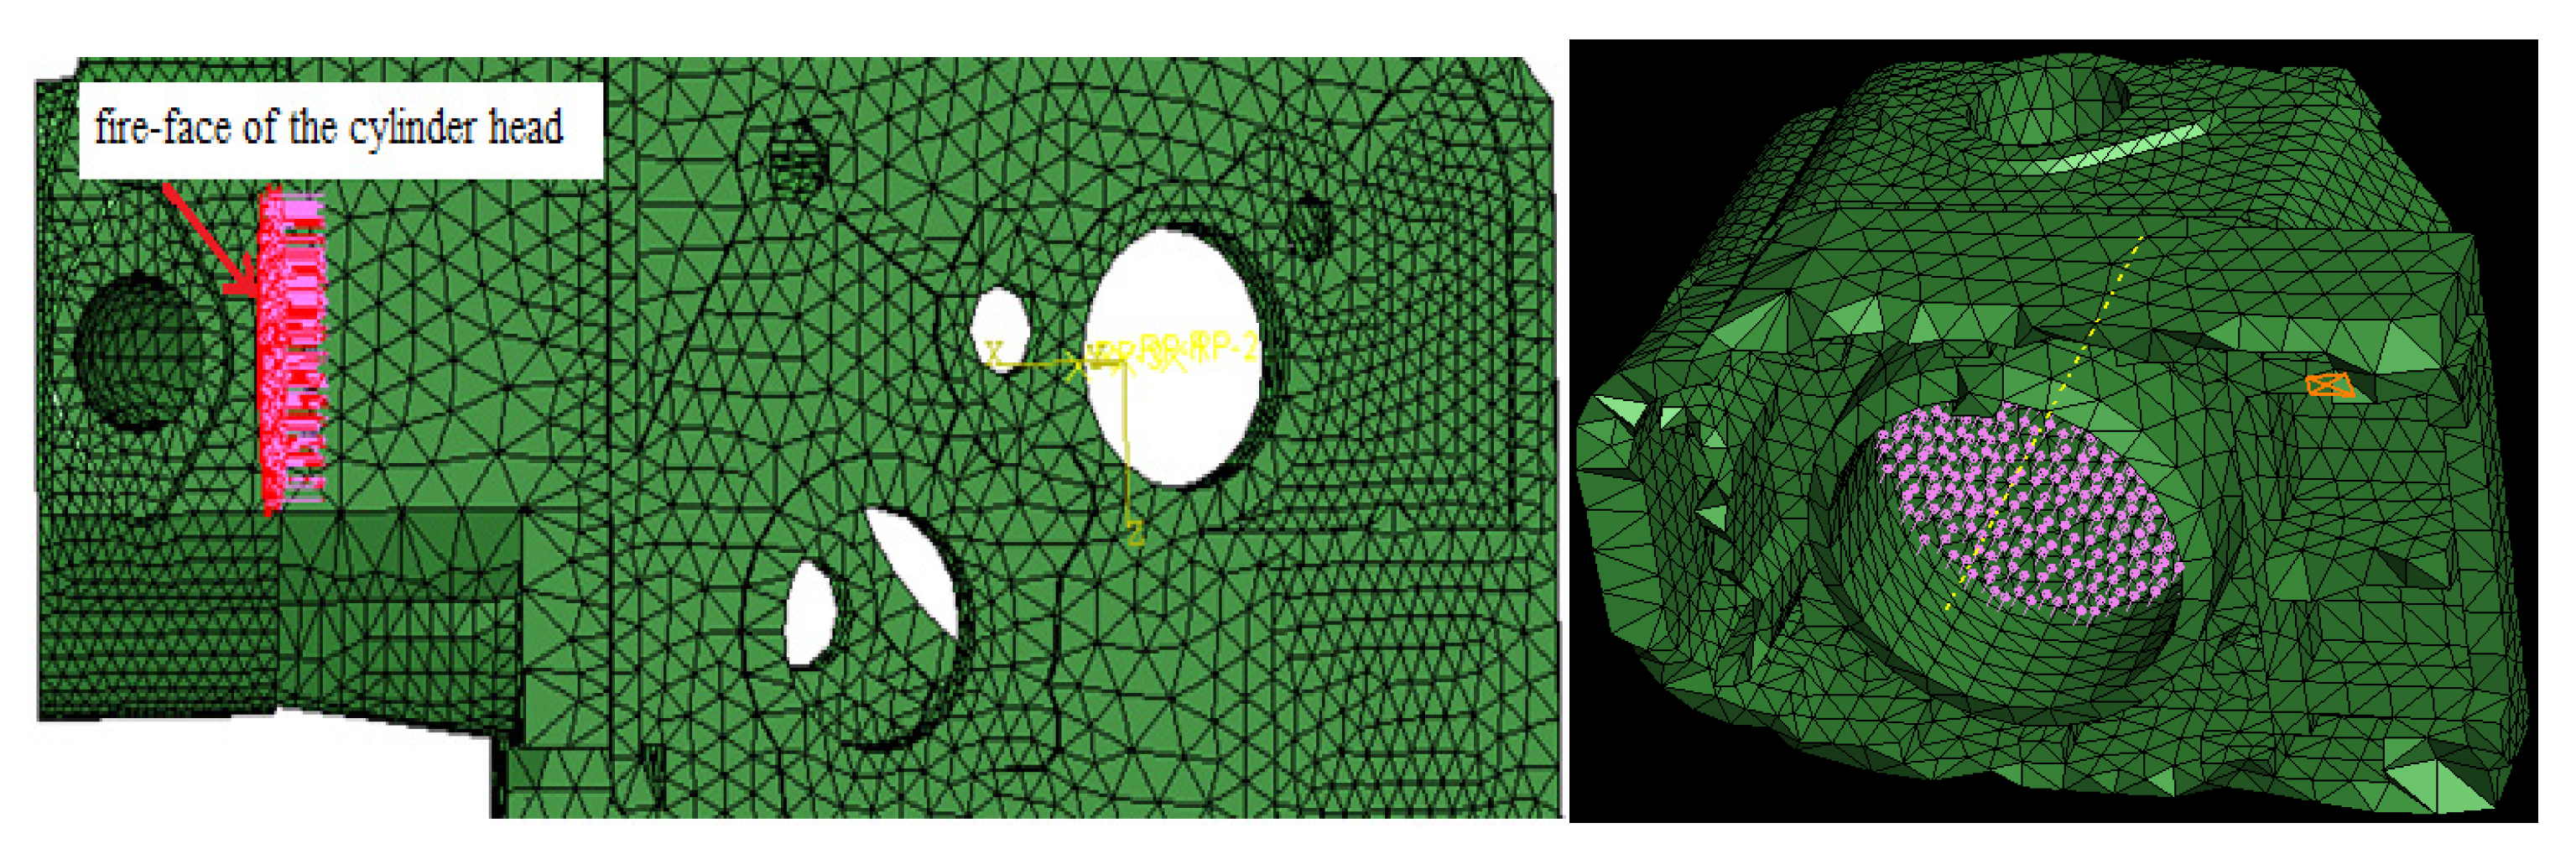
2.2. Finite Element Analysis Model
3. Results and Discussion
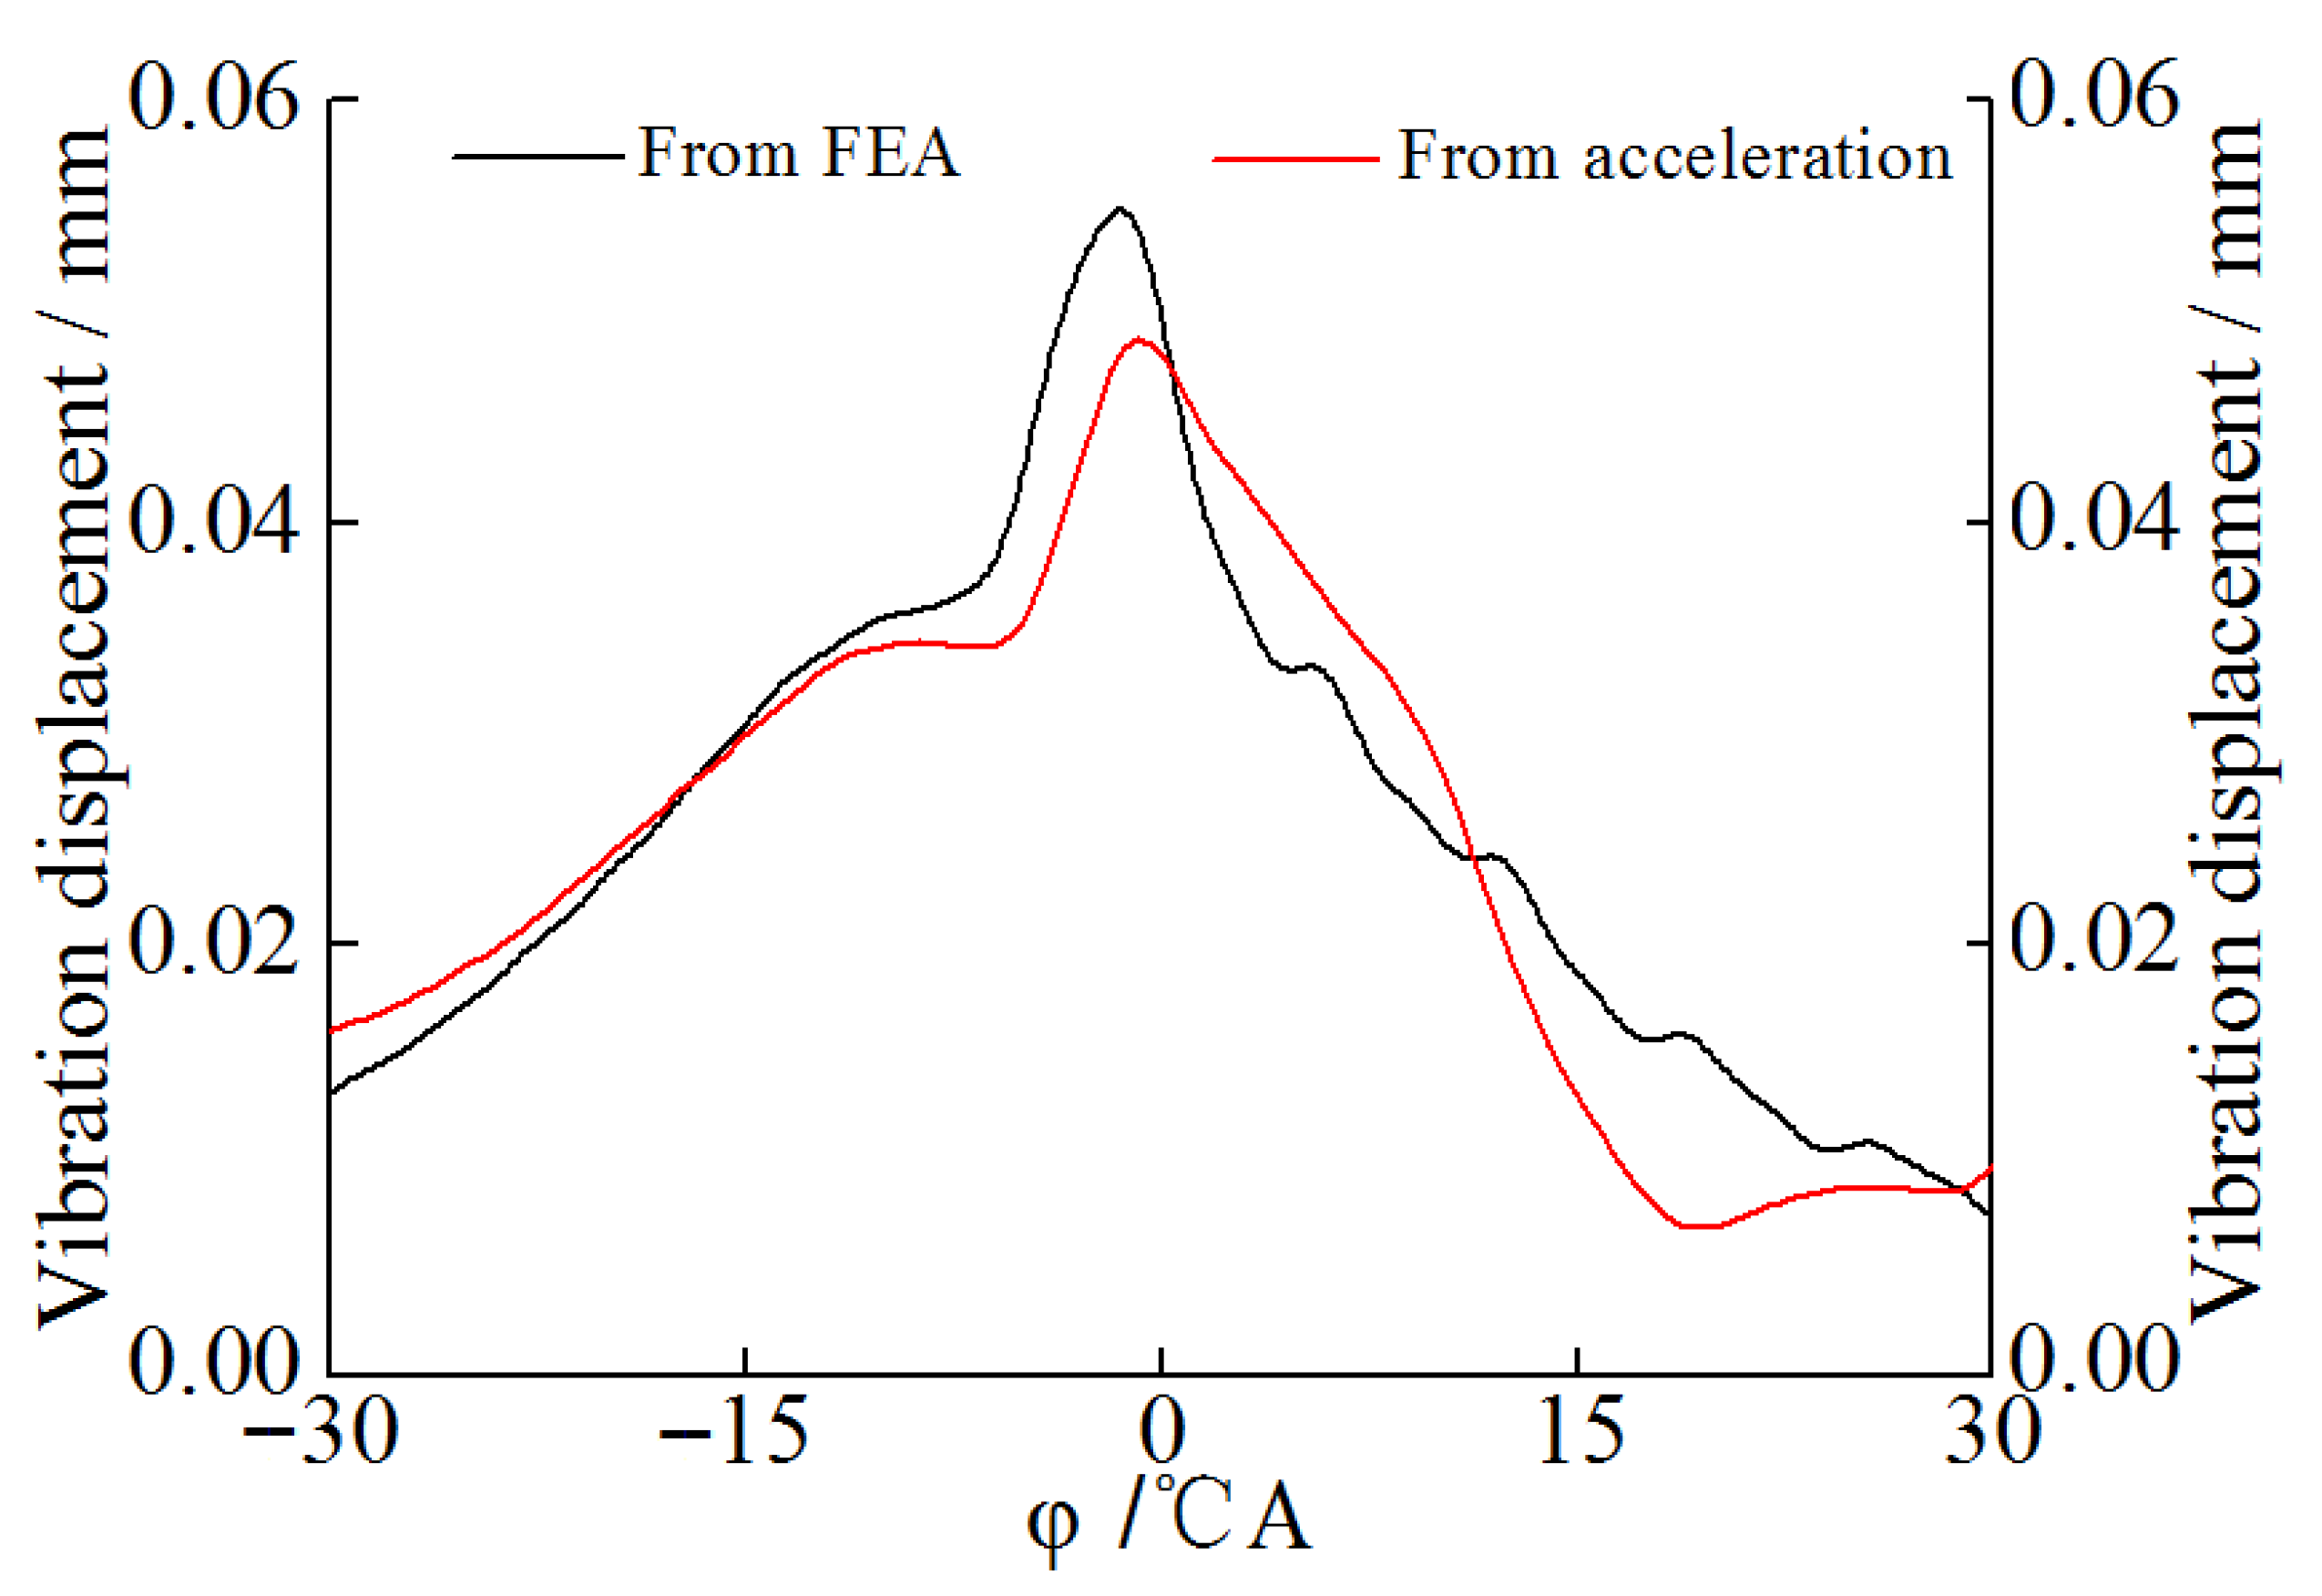
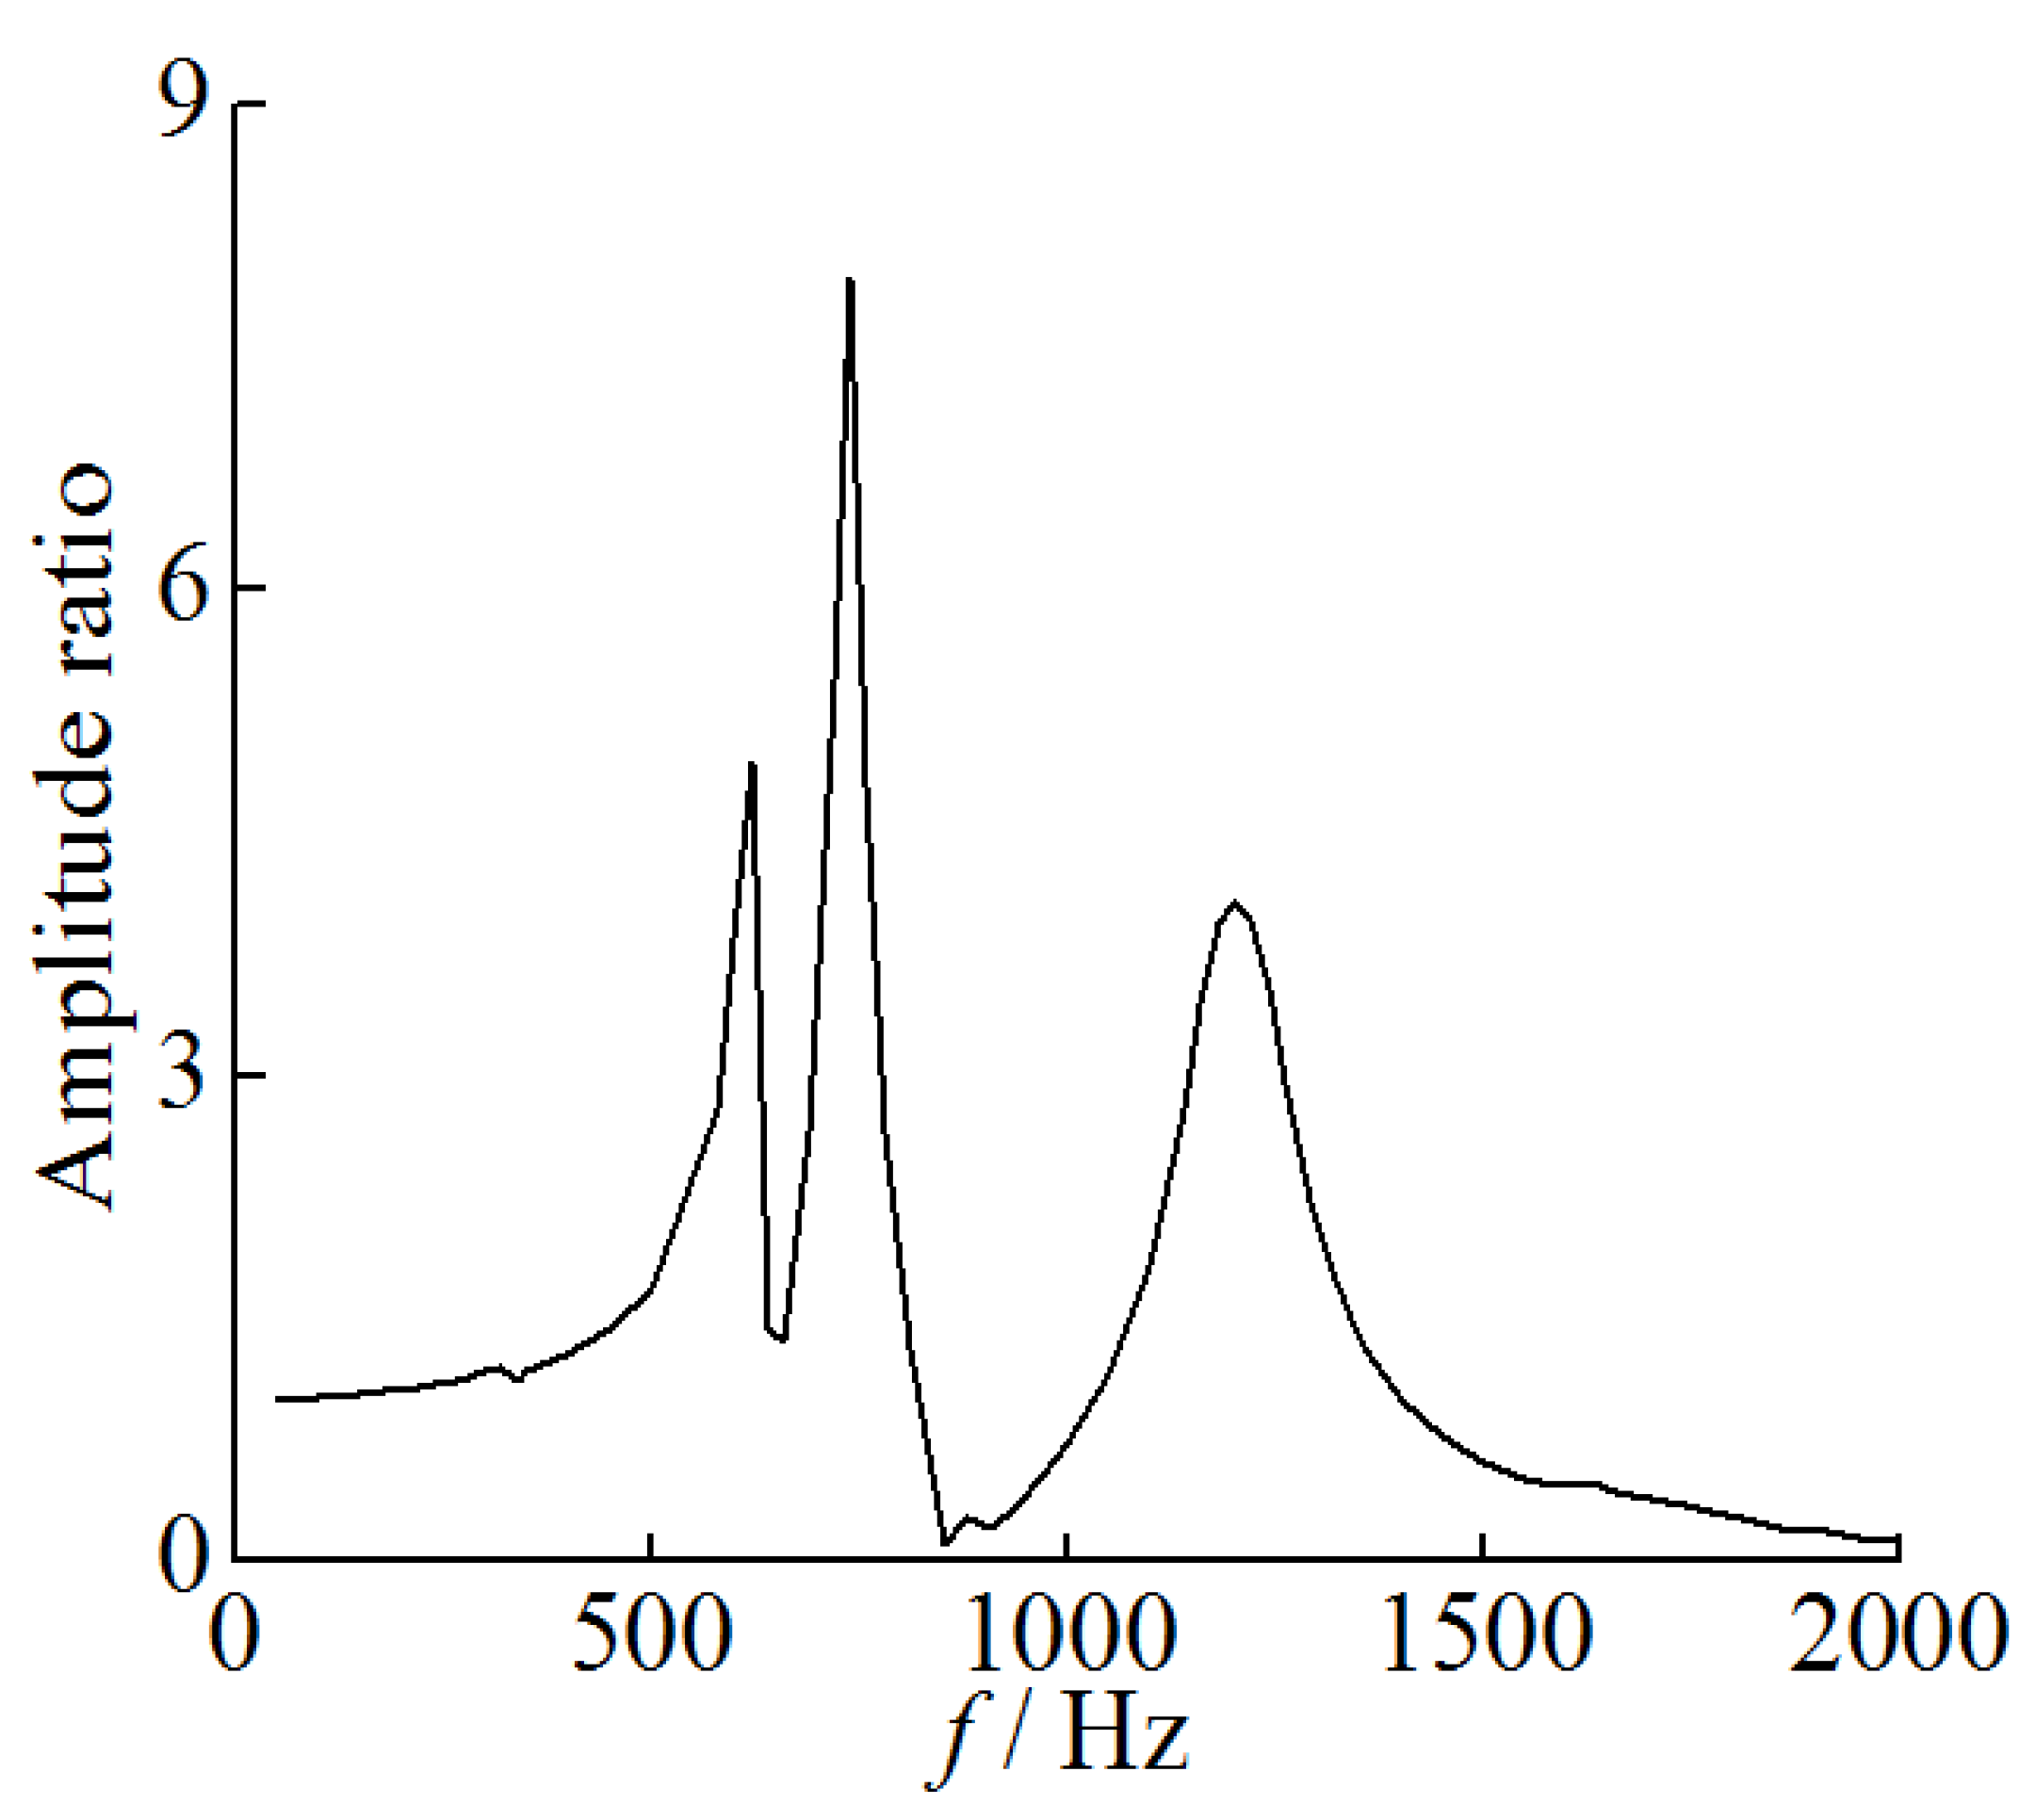
3.1. FEA Analysis
3.2. Experimental Results
4. Conclusions
- (1)
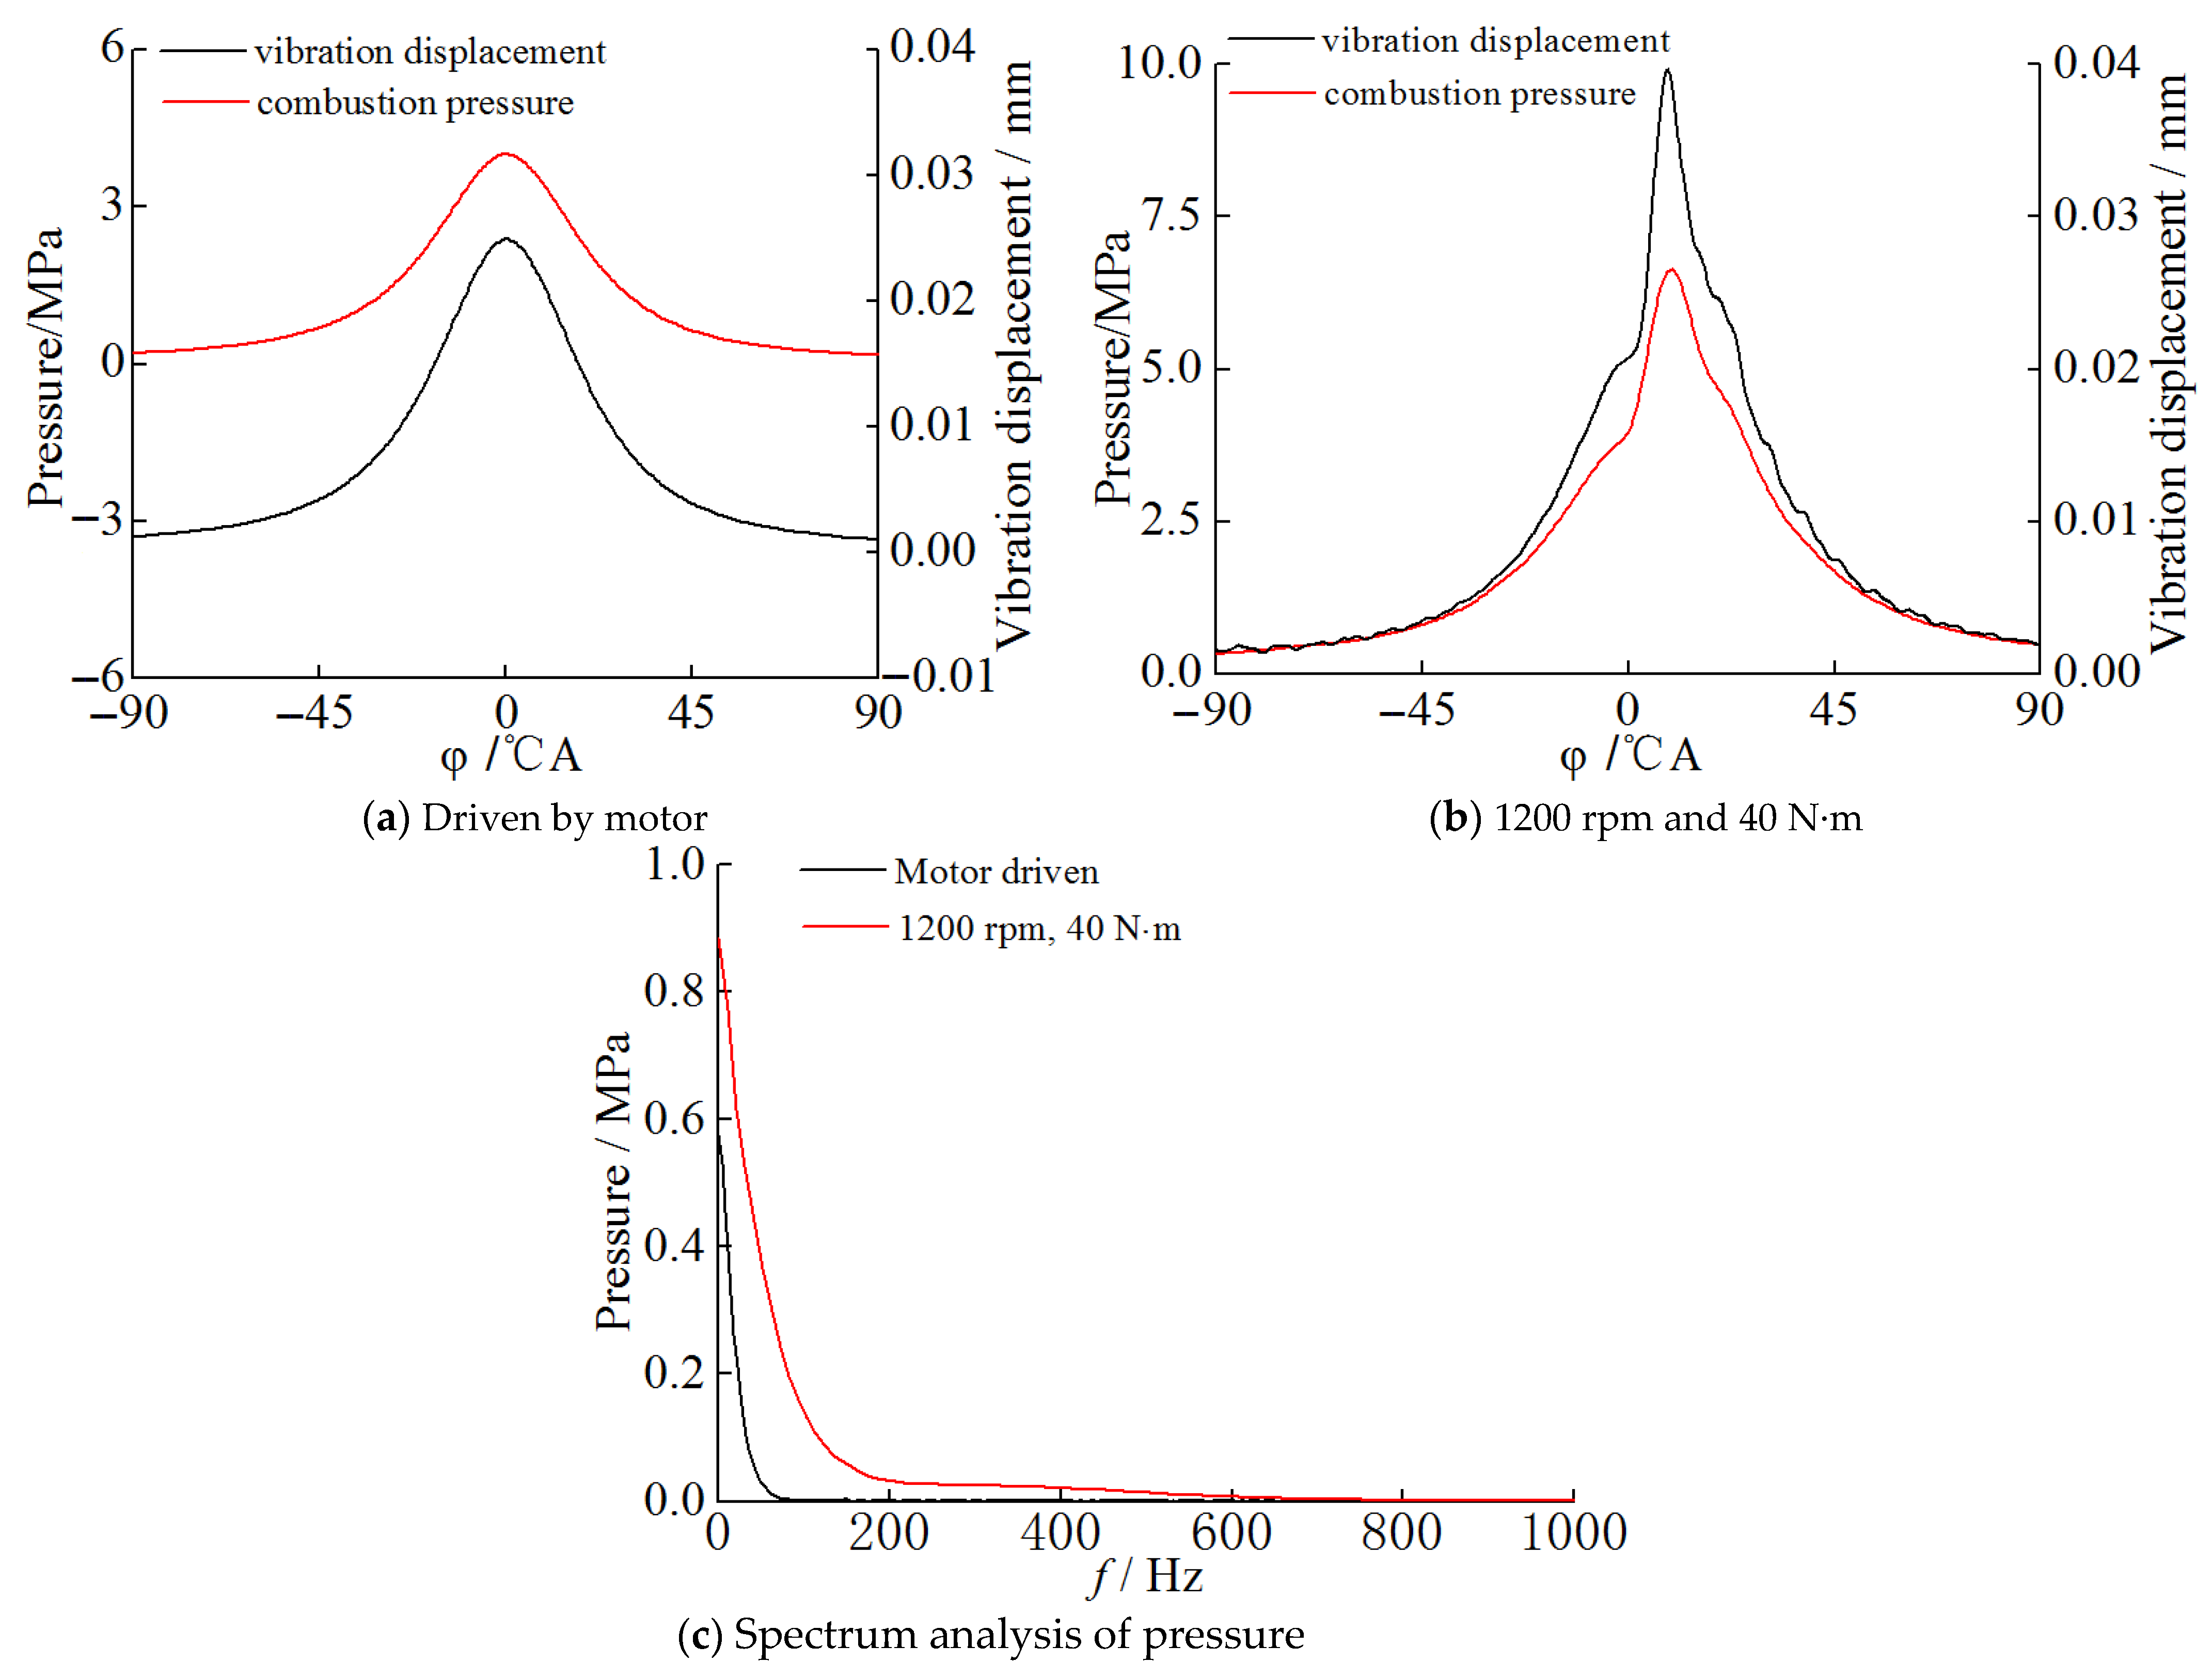
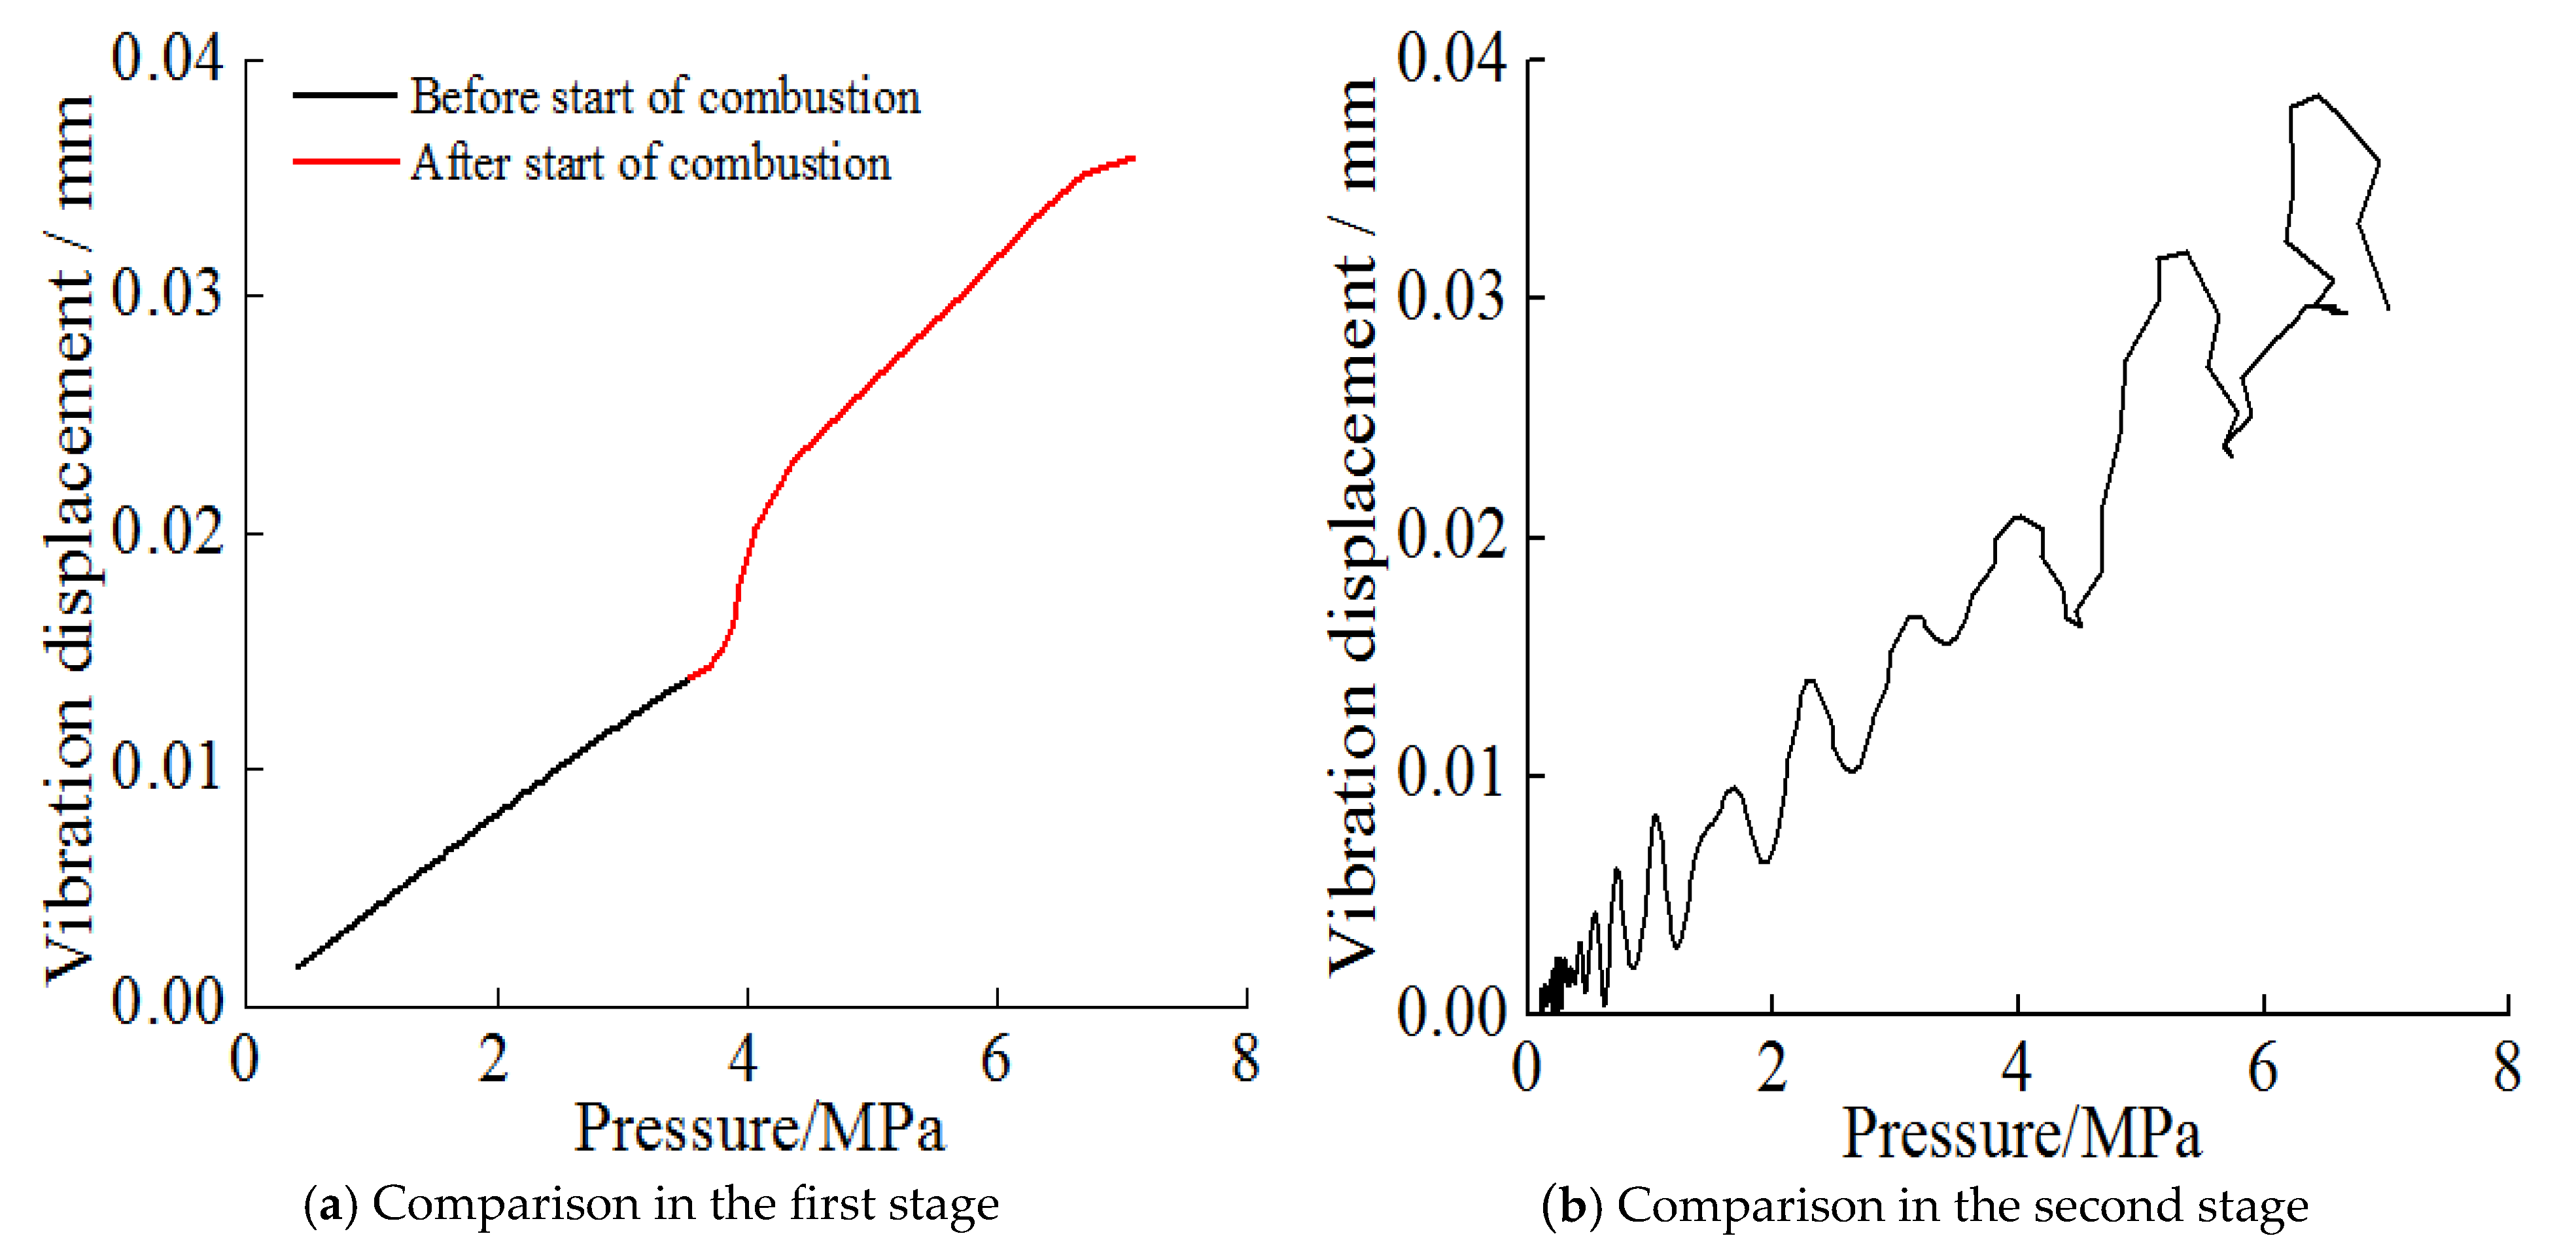
- The relationship between the vibration displacement and the combustion pressure can be divided into two stages. The two signals had a similar trend before the timing of peak pressure. There existed an approximate linear relationship between the two signals before the timing of the peak pressure due to the major spectrum energy of pressure that was lower than the first-order natural frequency.
- (2)
- The vibration displacement fluctuated notably after the peak pressure due to the gradually decreasing combustion pressure and the transfer characteristic of the engine. The vibration signal in this period can hardly be used to estimate the combustion parameters owing to the small amount of useful information.
- (3)
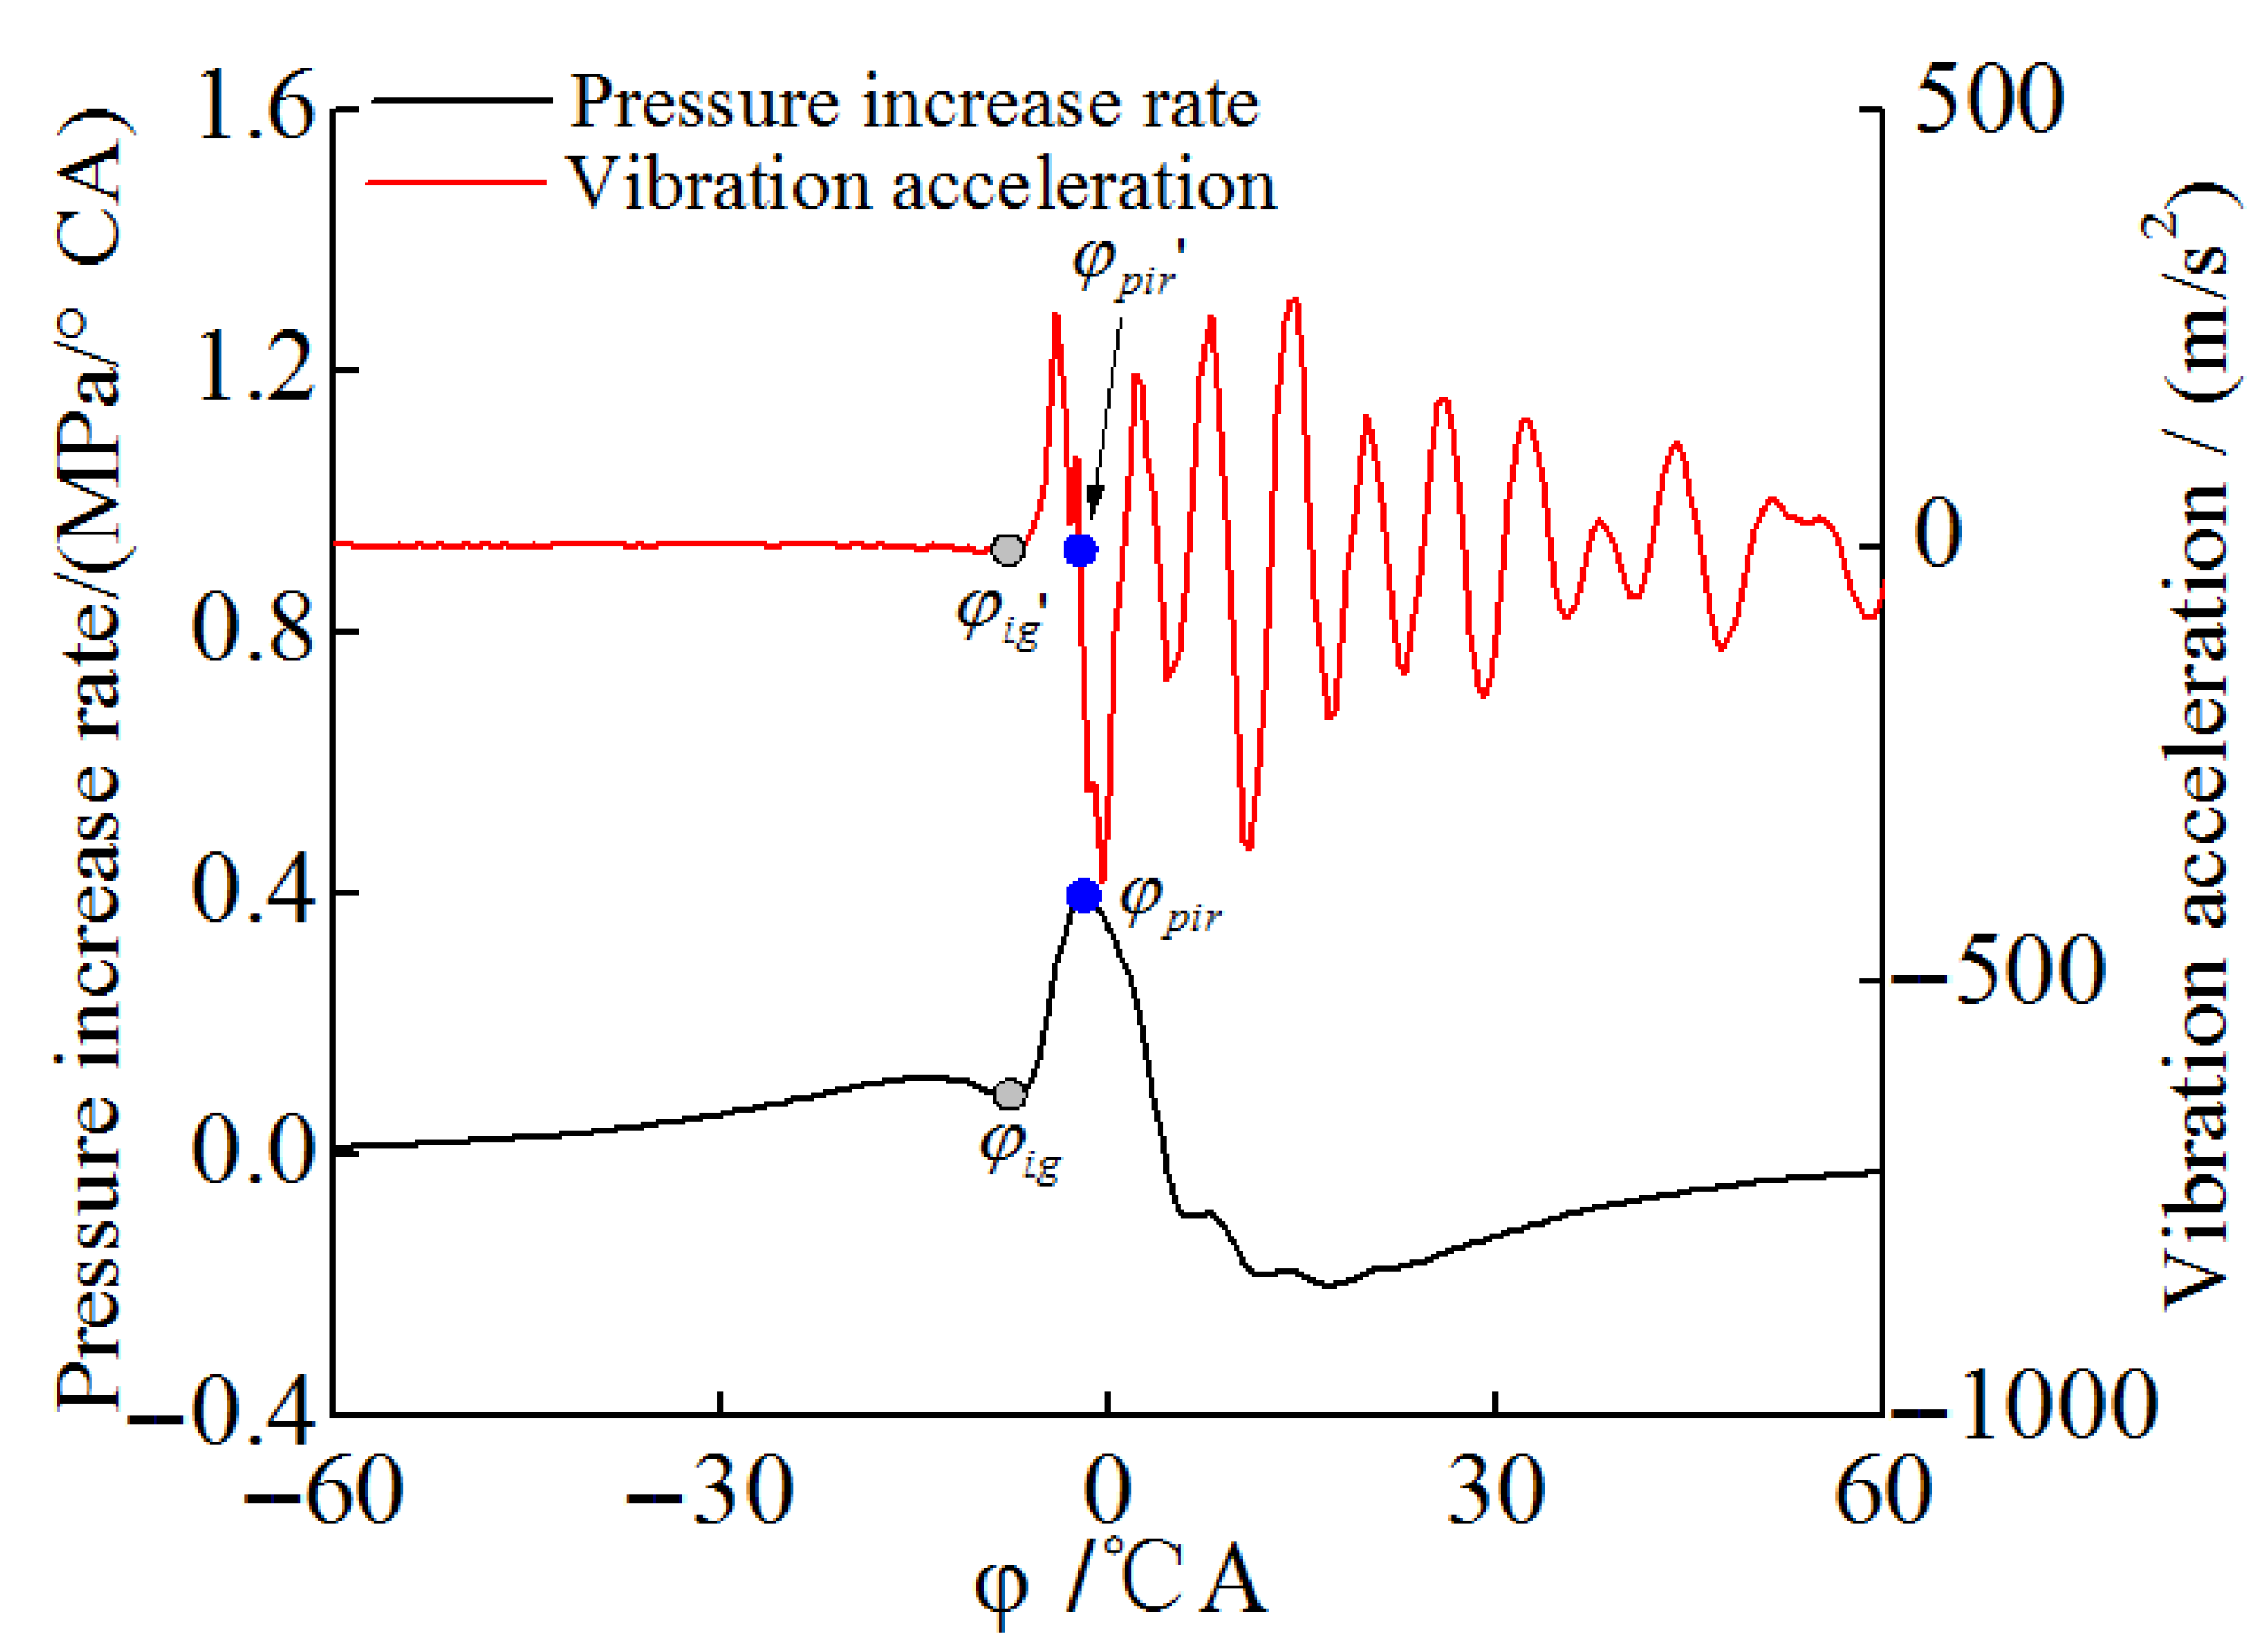
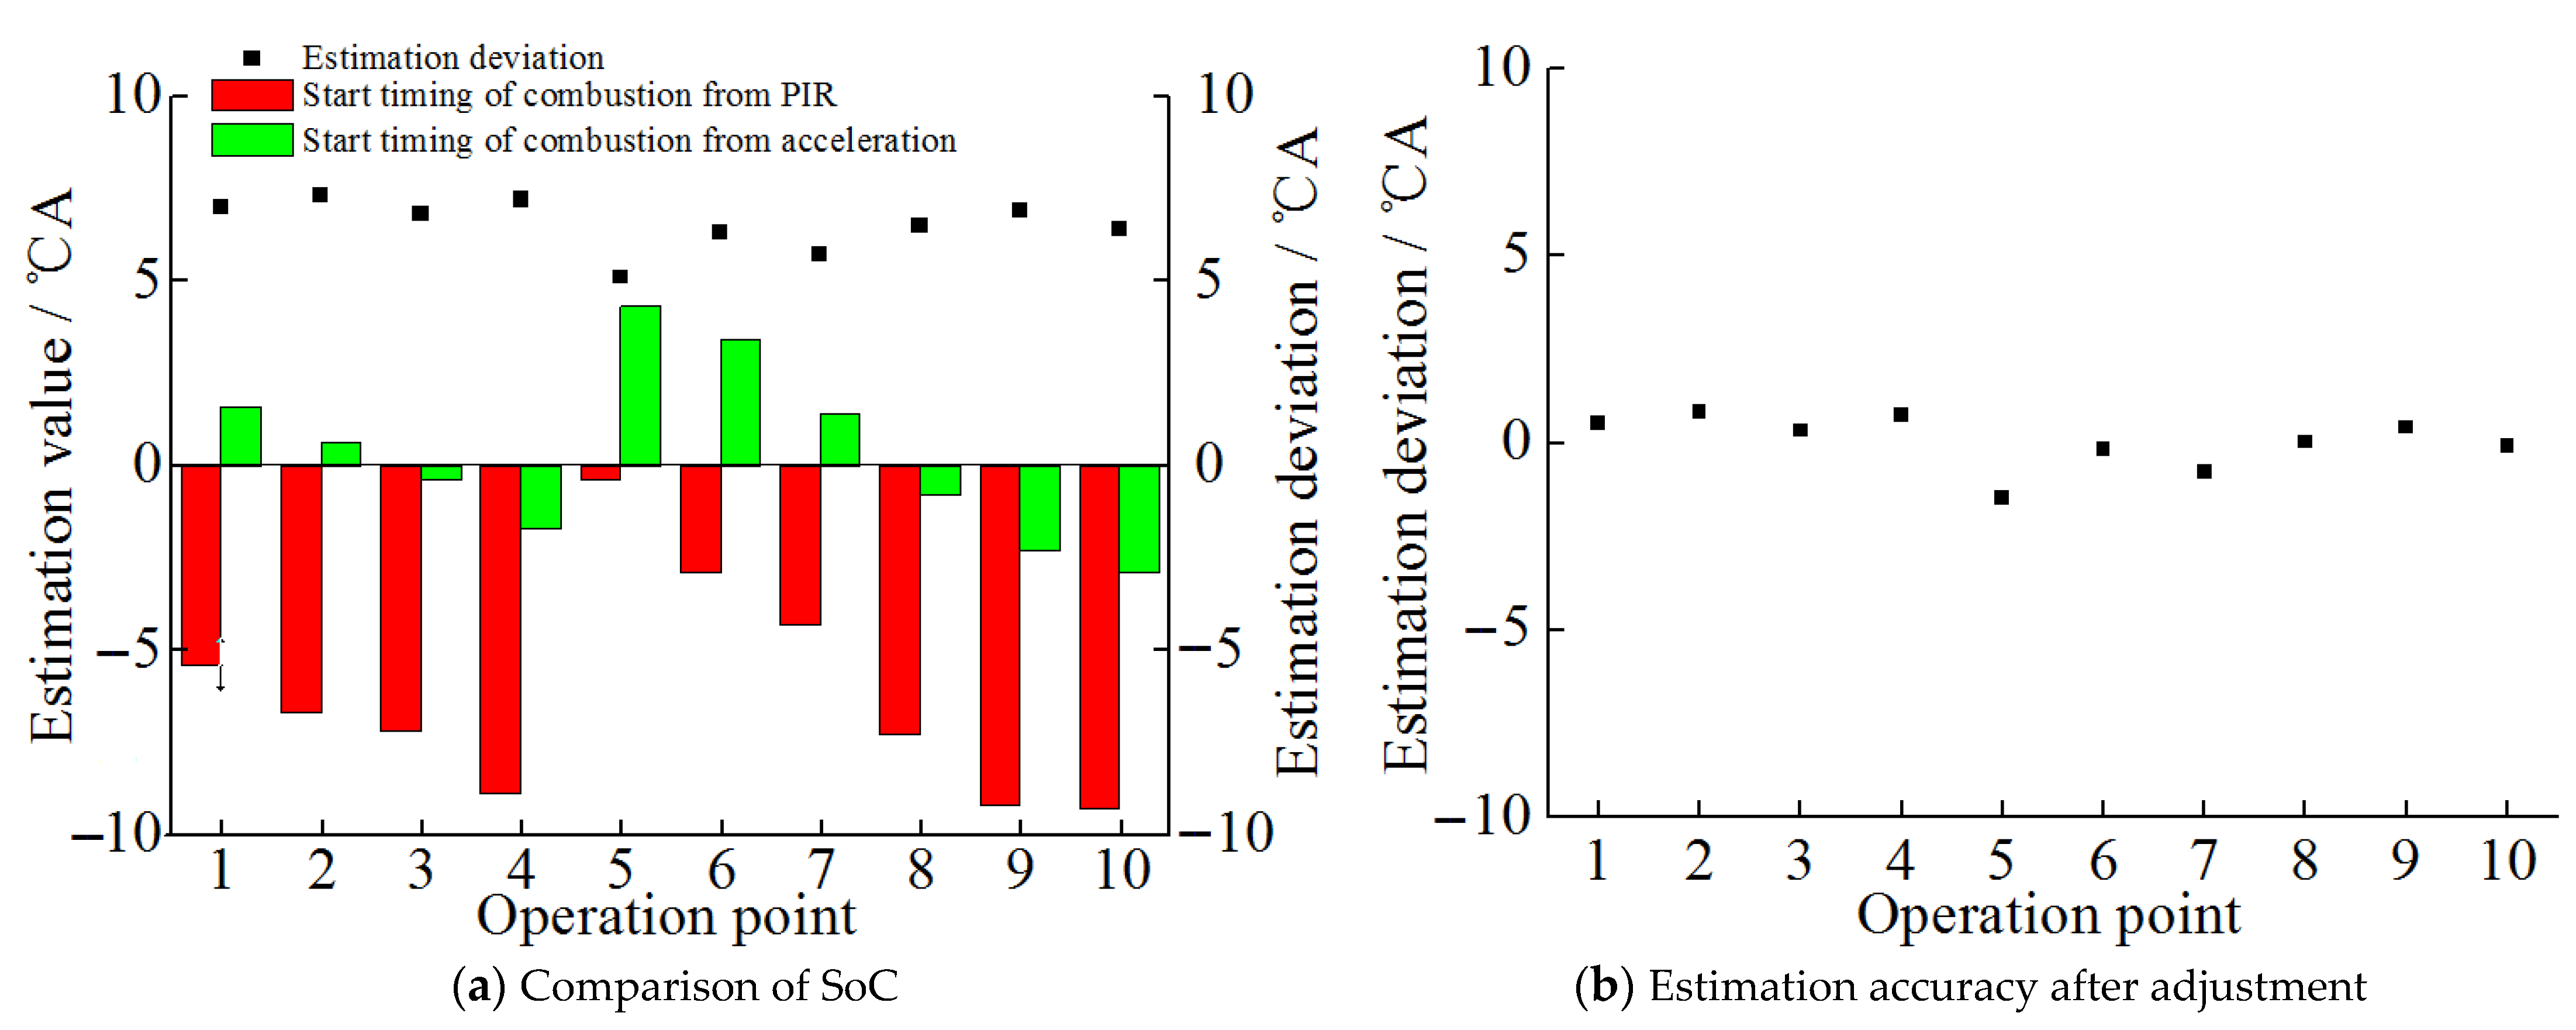
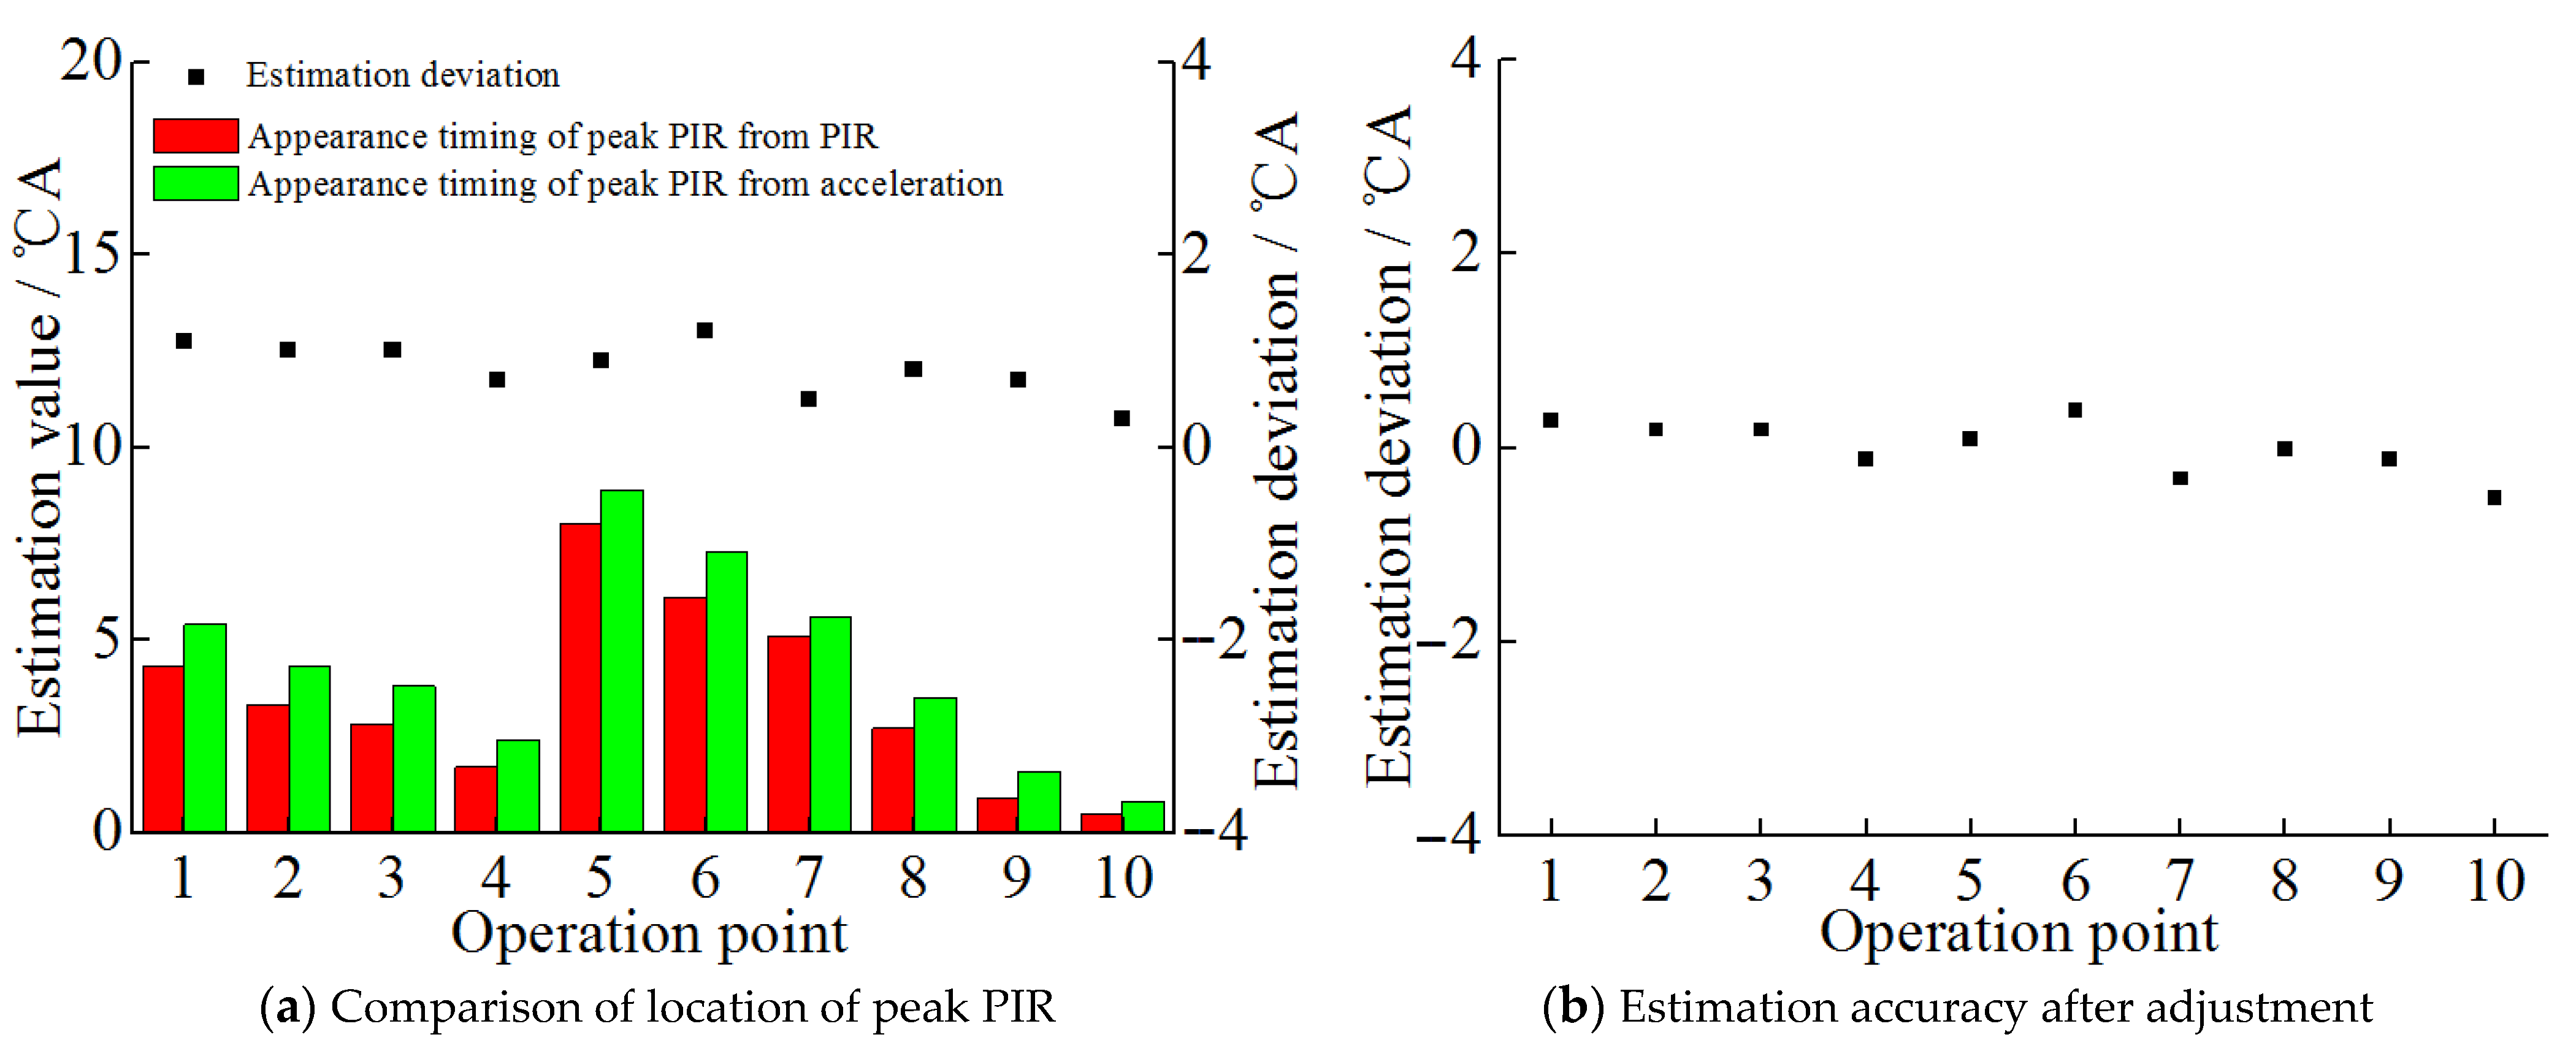
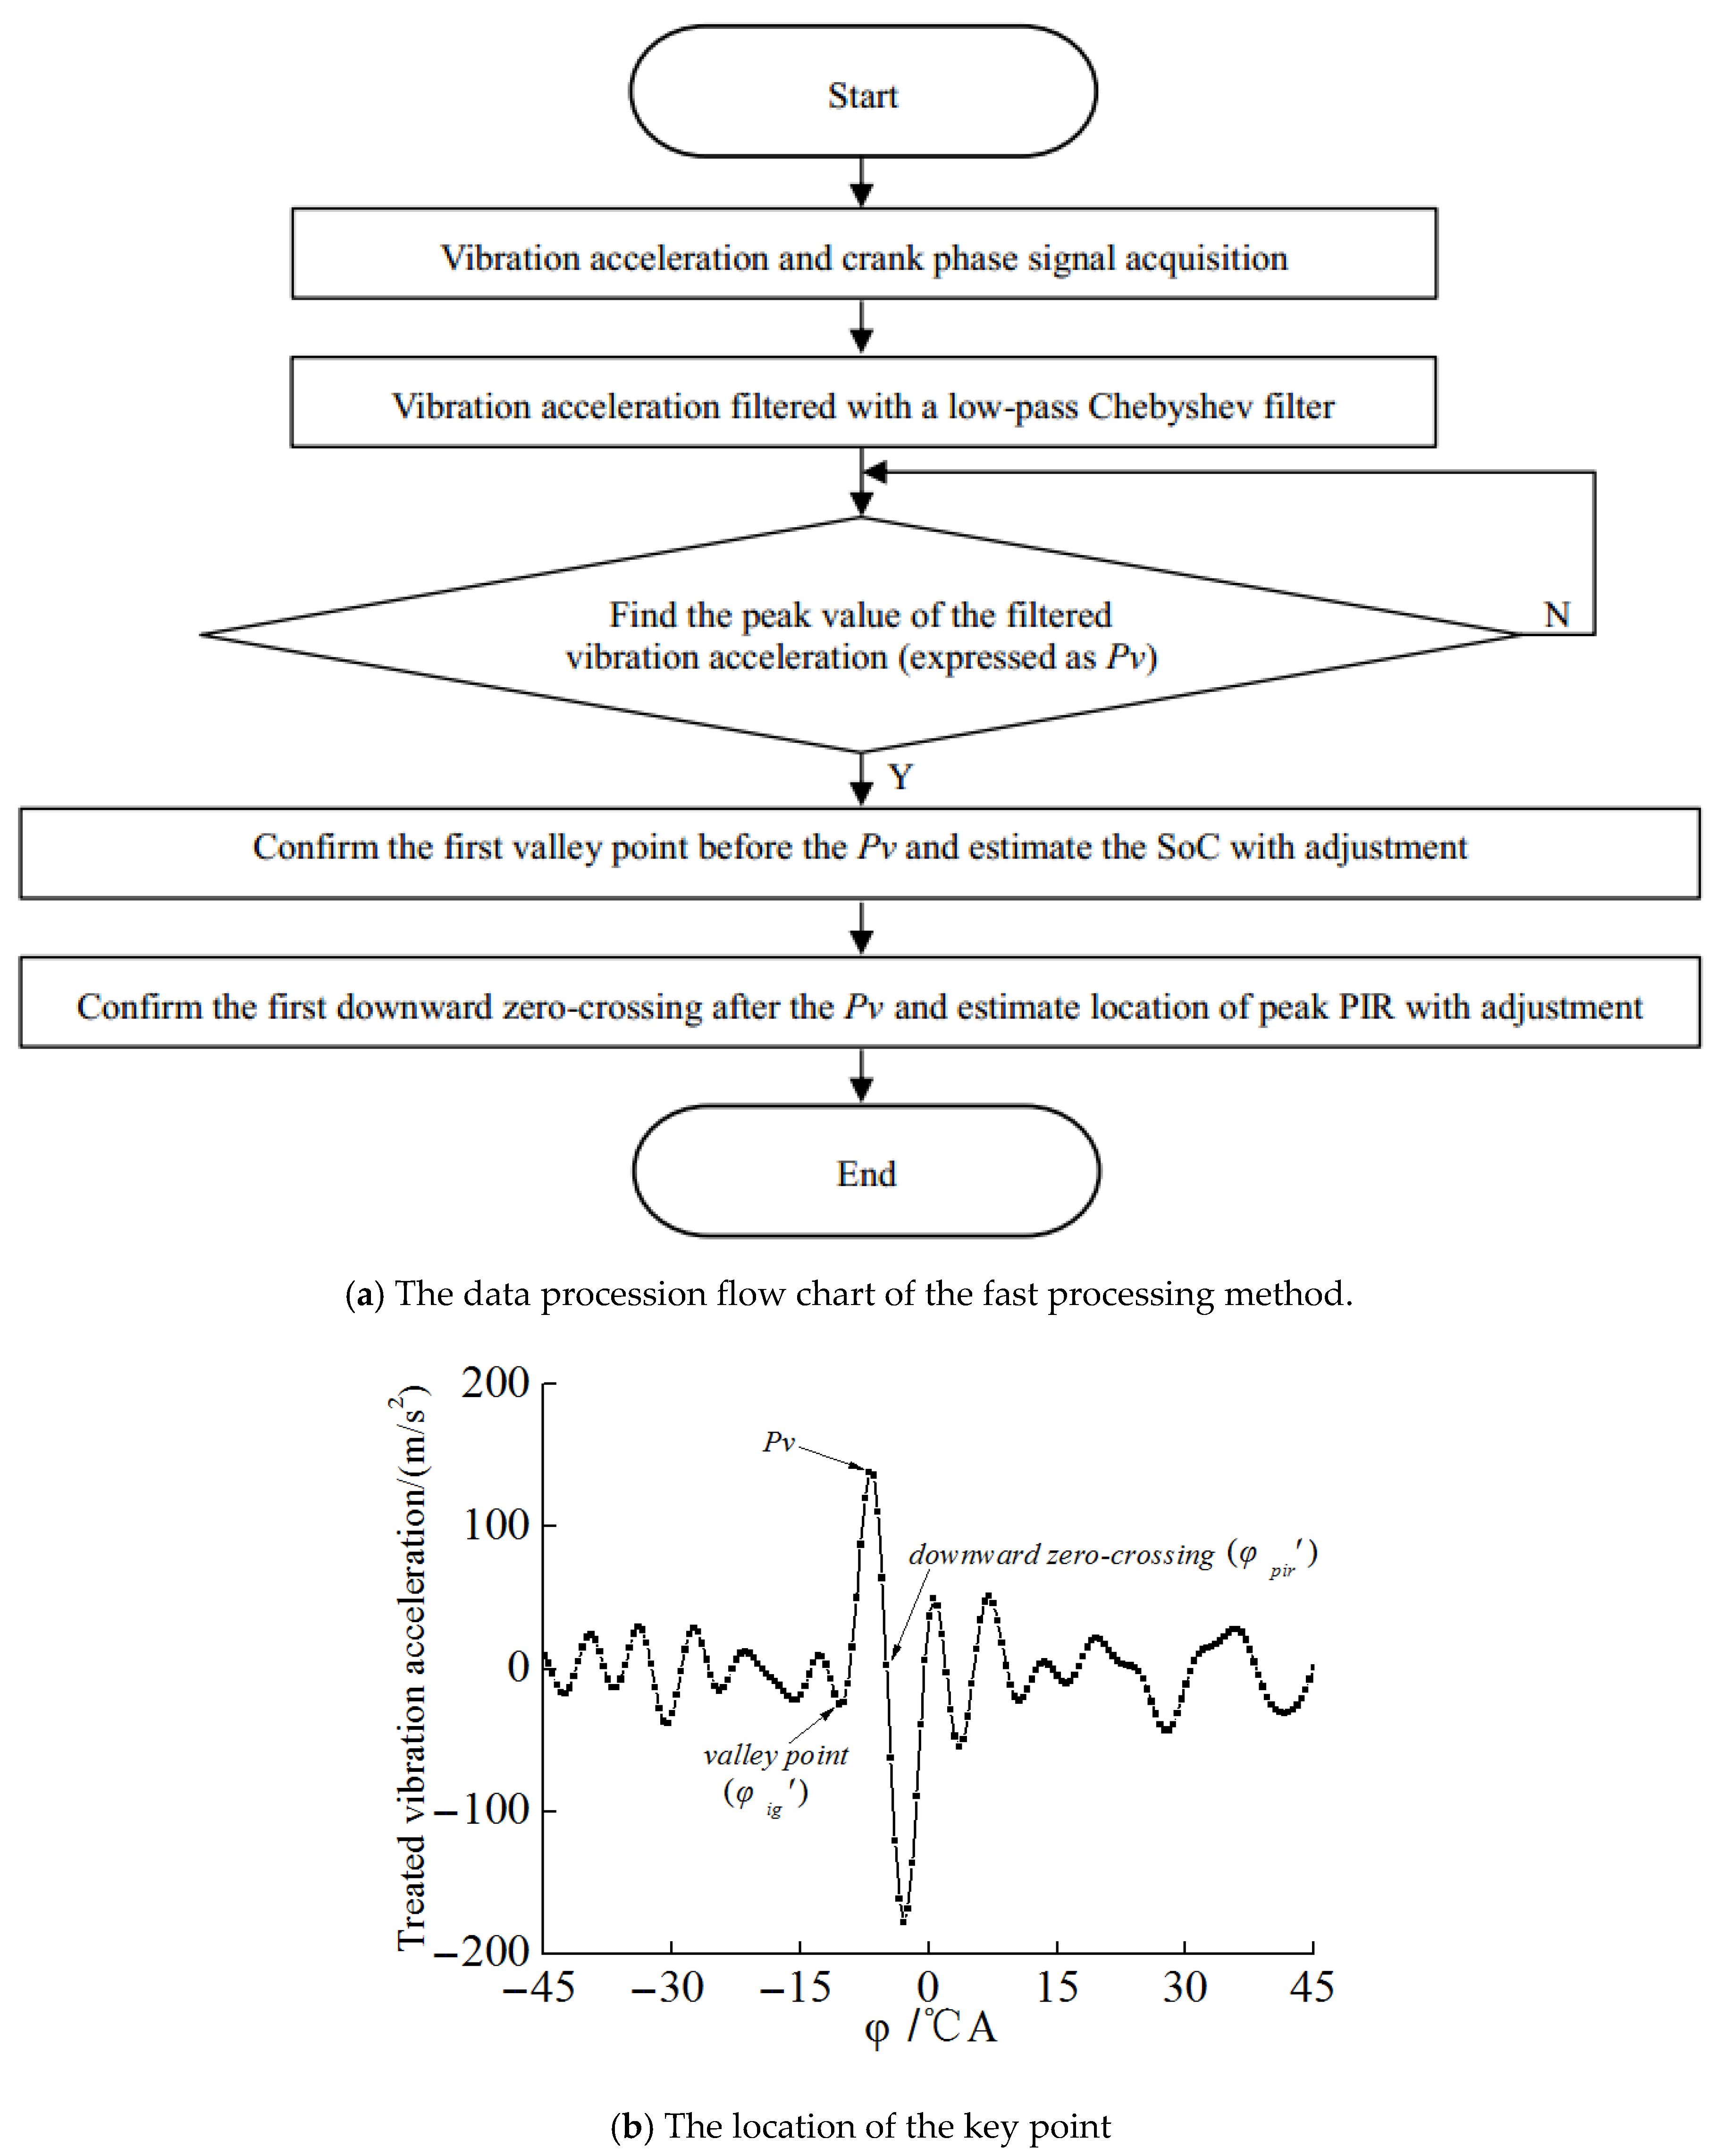
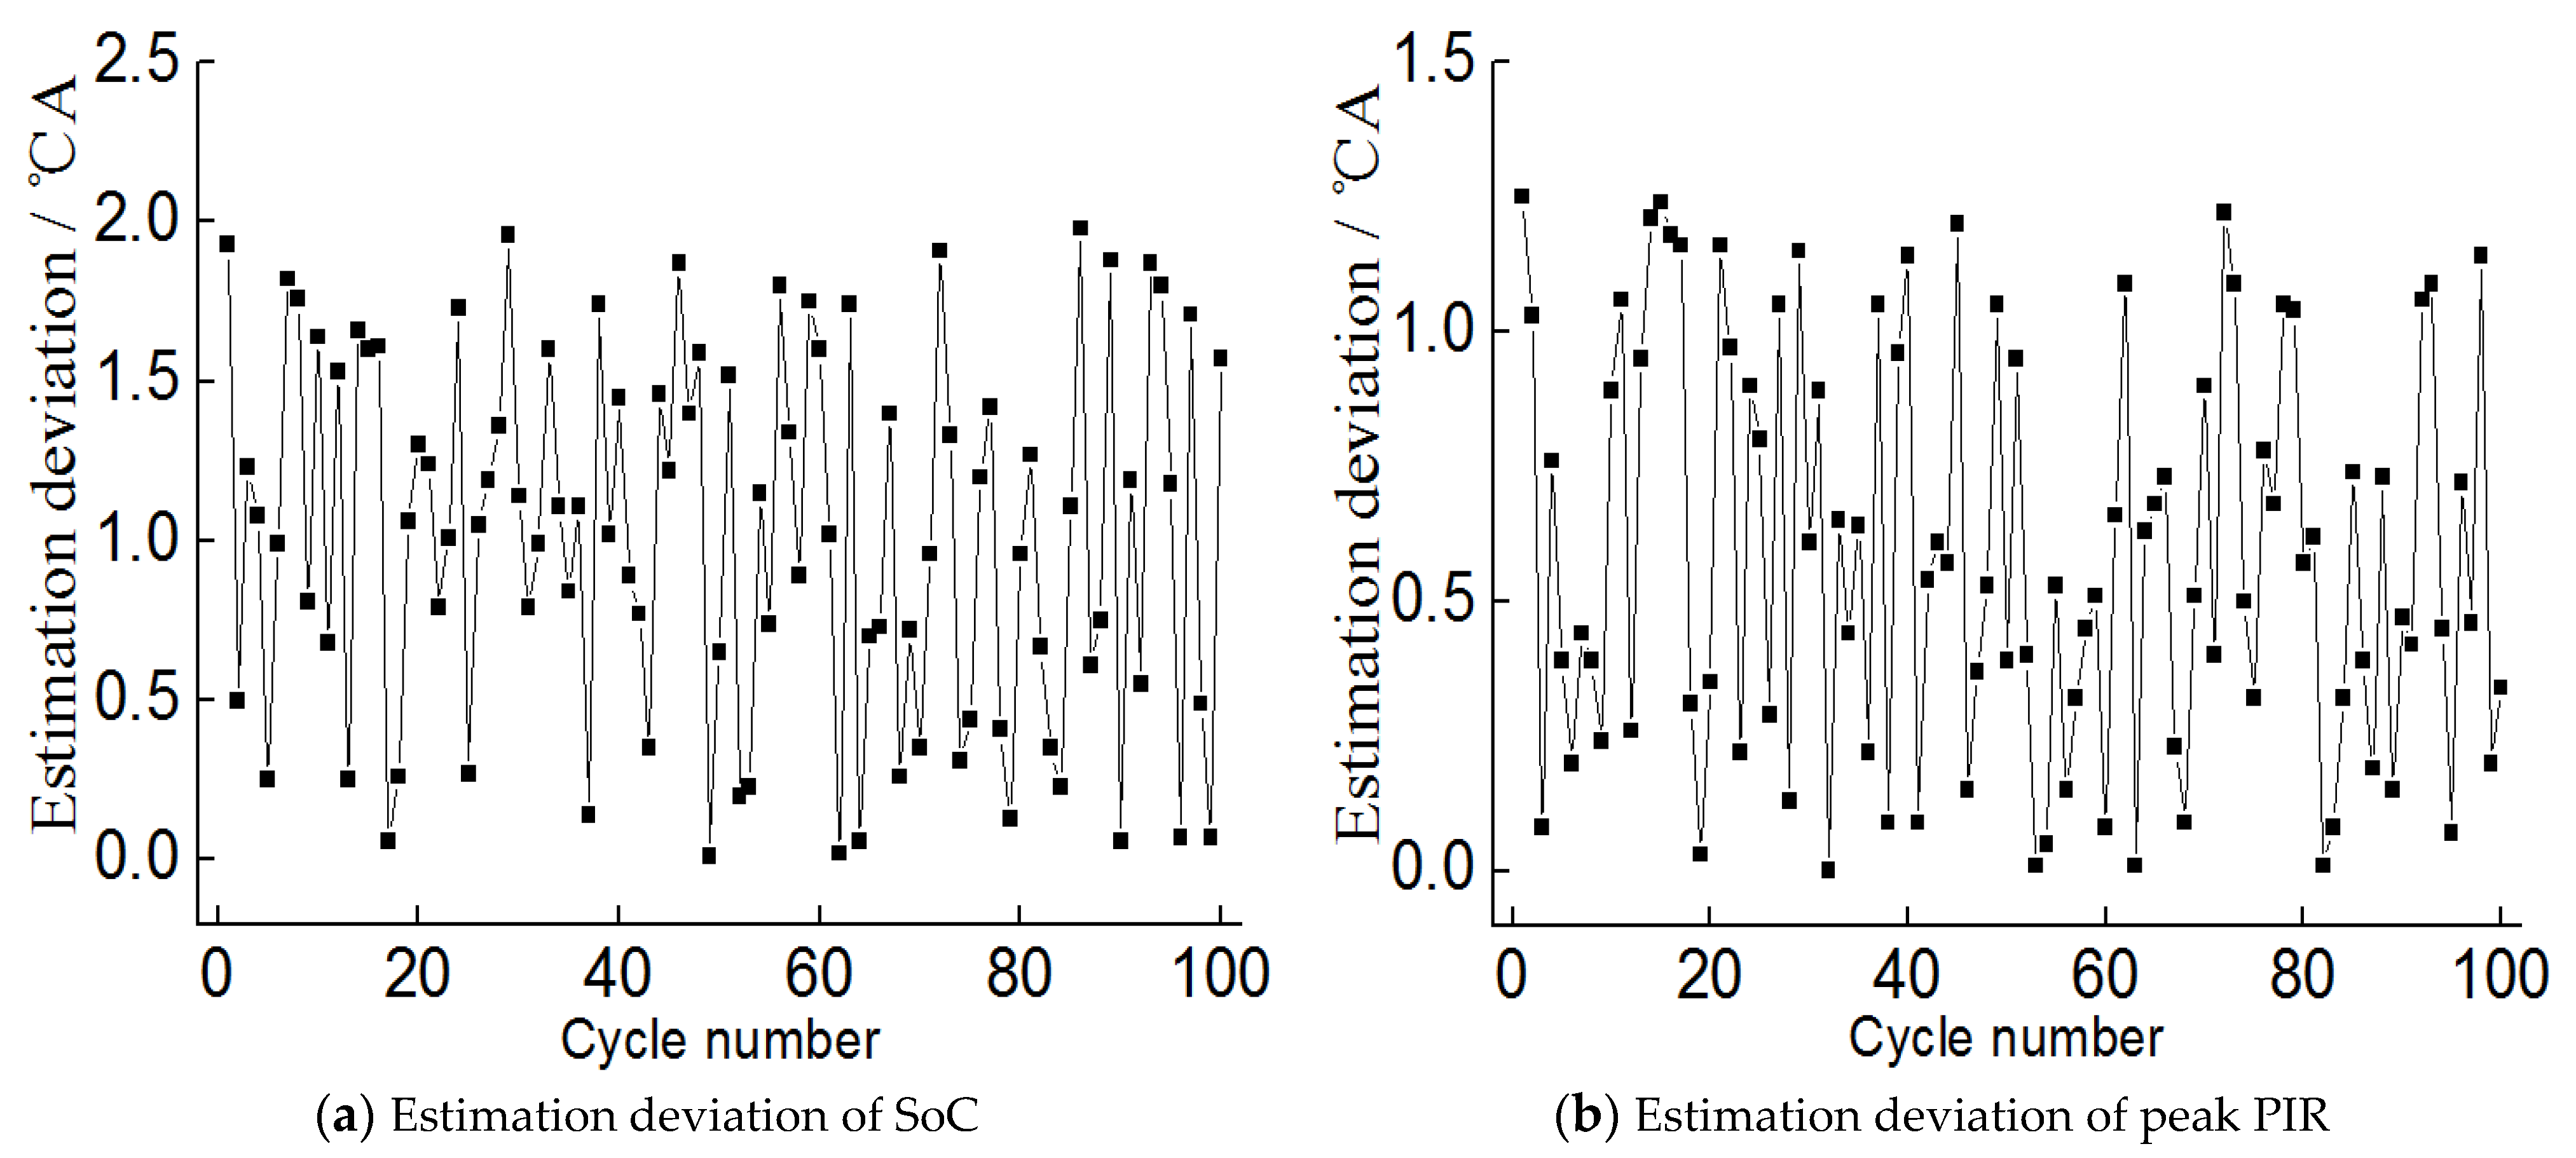
- A fast processing method was developed to estimate the timing of SoC and peak PIR based on the low-pass filtered vibration acceleration. The two parameters were estimated from the sudden increase point and the first downward zero-crossing point, respectively. For the studied twelve-cylinder diesel engine, the maximum estimation deviation of the two combustion parameters were 2 and 1.5 °CA for the analysis of continuous cycles. The proposed method will be used to provide feedback signal for the closed-loop control of the combustion in the future research.
Author Contributions
Funding
Institutional Review Board Statement
Informed Consent Statement
Conflicts of Interest
Abbreviations
References
- Cheng, Y.; Tang, J.; Ji, S.; Huang, M. Combustion timing determination based on vibration velocity in HCCI engines. Mech. Mach. Theory 2012, 58, 20–28. [Google Scholar] [CrossRef]
- Ji, S.; Lan, X.; Lian, J.; Wang, H.; Li, M.; Cheng, Y.; Yin, W. Combustion parameter estimation for ICE from surface vibration using frequency spectrum analysis. Meas. J. Int. Meas. Confed. 2018, 128, 485–494. [Google Scholar] [CrossRef]
- Yang, W.; Yong, C. Vibration Measurement for Combustion Phase Evaluation in a CI Engine. IFAC-Papers OnLine 2018, 51, 821–826. [Google Scholar] [CrossRef]
- Hashim, M.A.; Nasef, M.H.; Kabeel, A.E.; Ghazaly, N.M. Combustion fault detection technique of spark ignition engine based on wavelet packet transform and artificial neural network. Alex. Eng. J. 2020, 59, 3687–3697. [Google Scholar] [CrossRef]
- Ji, S.; Cheng, Y.; Huang, W.; Huang, M. Comparison of the vibration sensors used in the estimation of the combustion process in a diesel engine. Proc. IMechE Part D J. Automob. Eng. 2014, 228, 863–872. [Google Scholar]
- Delvecchio, S.; Bonfiglio, P.; Pompoli, F. Vibro-acoustic condition monitoring of Internal Combustion Engines: A critical review of existing techniques. Mech. Syst. Signal Process. 2018, 99, 661–683. [Google Scholar] [CrossRef]
- Bi, F.; Ma, T.; Wang, X. Development of a novel knock characteristic detection method for gasoline engines based on wavelet-denoising and EMD decomposition. Mech. Syst. Signal Process. 2019, 117, 517–536. [Google Scholar] [CrossRef]
- Siano, D.; D’Agostino, D. Knock detection in SI engines by using the Discrete Wavelet Transform of the engine block vibrational signals. Energy Procedia 2015, 81, 673–688. [Google Scholar] [CrossRef] [Green Version]
- Taghizadeh-Alisaraei, A.; Ghobadian, B.; Tavakoli-Hashjin, T.; Mohtasebi, S.S.; Rezaei-asl, A.; Azadbakht, M. Characterization of engine’s combustion-vibration using diesel and biodiesel fuel blends by time-frequency methods: A case study. Renew. Energy 2016, 95, 422–432. [Google Scholar] [CrossRef]
- Sharma, A.; Sugumaran, V.; Devasenapati, S.B. Misfire detection in an IC engine using vibration signal and decision tree algorithms. Meas. J. Int. Meas. Confed. 2014, 50, 370–380. [Google Scholar] [CrossRef]
- Porteiro, J.; Collazo, J.; Patiño, D.; Míguez, J.L. Diesel engine condition monitoring using a multi-net neural network system with nonintrusive sensors. Appl. Therm. Eng. 2011, 31, 4097–4105. [Google Scholar] [CrossRef]
- Bizon, K.; Continillo, G.; Mancaruso, E.; Vaglieco, B.M. Towards on-line prediction of the in-cylinder pressure in diesel engines from engine vibration using artificial neural networks. SAE Tech. Pap. 2013. [Google Scholar] [CrossRef]
- Johnsson, R. Cylinder pressure reconstruction based on complex radial basis function networks from vibration and speed signals. Mech. Syst. Signal Process. 2006, 20, 1923–1940. [Google Scholar] [CrossRef]
- Bizon, K.; Continillo, G.; Mancaruso, E.; Vaglieco, B.M. Reconstruction of in-cylinder pressure in a diesel engine from vibration signal using a RBF neural network model. SAE Tech. Pap. 2011. [Google Scholar] [CrossRef]
- Ghamry, M.E.; Steel, J.A.; Reuben, R.L.; Fog, T.L. Indirect measurement of cylinder pressure from diesel engines using acoustic emission. Mech. Syst. Signal Process. 2005, 19, 751–765. [Google Scholar] [CrossRef]
- Omar, F.K.; Selim, M.Y.E.; Emam, S.A. Time and frequency analyses of dual-fuel engine block vibration. Fuel 2017, 203, 884–893. [Google Scholar] [CrossRef]
- Scafati, F.T.; Lavorgna, M.; Mancaruso, E. Use of vibration signal for diagnosis and control of a four-cylinder diesel engine. SAE Tech. Pap. 2011. [Google Scholar] [CrossRef]
- Chiatti, G.; Chiavola, O.; Recco, E. Diesel combustion analysis via block vibration during engine transient operation. SAE Tech. Pap. 2013. [Google Scholar] [CrossRef]
- Carlucci, A.P.; Chiara, F.F.; Laforgia, D. Analysis of the relation between injection parameter variation and block vibration of an internal combustion diesel engine. J. Sound Vib. 2006, 295, 141–164. [Google Scholar] [CrossRef]
- Morello, A.J.; Blough, J.R.; Naber, J.; Jia, L. Signal Processing Parameters for Estimation of the Diesel Engine Combustion Signature. SAE Int. J. Passeng. Cars Mech. Syst. 2011, 4, 1201–1215. [Google Scholar] [CrossRef]
- Lee, S.; Lee, Y.; Lee, S.; Song, H.H.; Min, K.; Choi, H. Study on the Correlation between the Heat Release Rate and Vibrations from a Diesel Engine Block. SAE Tech. Pap. 2015. [Google Scholar] [CrossRef]
- Zhao, X.; Cheng, Y.; Ji, S. Combustion parameters identification and correction in diesel engine via vibration acceleration signal. Appl. Acoust. 2017, 116, 205–215. [Google Scholar] [CrossRef]
- Zhao, X.; Cheng, Y.; Wang, L.; Ji, S. Real time identification of the internal combustion engine combustion parameters based on the vibration velocity signal. J. Sound Vib. 2017, 390, 205–217. [Google Scholar] [CrossRef]
- Mao, J.; Hao, Z.Y.; Jing, G.X.; Zheng, X.; Liu, C. Sound quality improvement for a four-cylinder diesel engine by the block structure optimization. Appl. Acoust. 2013, 74, 150–159. [Google Scholar] [CrossRef]
- Witek, L.; Zelek, P. Stress and failure analysis of the connecting rod of diesel engine. Eng. Fail. Anal. 2019, 97, 374–382. [Google Scholar] [CrossRef]
- Metkar, R.M.; Sunnapwar, V.K.; Hiwase, S.D.; Anki, V.S.; Dumpa, M. Evaluation of FEM based fracture mechanics technique to estimate life of an automotive forged steel crankshaft of a single cylinder diesel engine. Procedia Eng. 2013, 51, 567–572. [Google Scholar] [CrossRef] [Green Version]
- Ji, S.; Cheng, Y.; Huang, W.; Huang, M.; Huang, W.; Tang, J. Study on Relationship between cylinder head vibration displacement and cylinder pressure. Chin. Intern. Combust. Engine Eng. 2013, 34, 48–51. [Google Scholar]
- Ji, S. On Description of Combustion Process Based on Vibration Acceleration Signal Measured from Cylinder Head. Ph.D. Thesis, University of Shandong, Jinan, China, 2008. [Google Scholar]
- Arnone, L.; Boni, M.; Manelli, S.; Chiavola, O.; Conforto, S.; Recco, E. Diesel engine combustion monitoring through block vibration signal analysis. SAE Tech. Pap. 2009. [Google Scholar] [CrossRef]
- Chiavola, O.; Chiatti, G.; Arnone, L.; Manelli, S. Combustion characterization in diesel engine via block vibration analysis. SAE Tech. Pap. 2010. [Google Scholar] [CrossRef]
- Taglialatela-Scafati, F.; Cesario, N.; Lavorgna, M.; Mancaruso, E.; Vaglieco, B.M. Diagnosis and control of advanced diesel combustions using engine vibration signal. SAE Tech. Pap. 2011. [Google Scholar] [CrossRef]


| Engine Type | Twelve Cylinders Engine |
|---|---|
| Description | V-type, four valves, turbocharged, Electronic unit pump |
| Cylinder bore×stroke (mm × mm) | 190 × 210 |
| Displacement (L) | 71.4 |
| Compression ratio | 14:1 |
| Rated speed (rpm) | 1300 |
| Max. power (kW) | 1000@1300 rpm |
| IVO / IVC (° CA) | 24° CA BTDC / 28° CA ABDC |
| EVO / EVC (° CA) | 28° CA BBDC / 24° CA ATDC |
| Sensor | 12QP250 | CA-YD-102 |
|---|---|---|
| Range | 0–15 MPa | 0–5000 g |
| Resonant frequency | 75 kHz | 40 kHz |
| Sensitivity | 200 pC/MPa | 0.7 pC/g |
| Engine Speed (rpm) | Engine Power (kW) |
|---|---|
| 1200 | 100, 200, 300, 400 |
| 1500 | 150, 300, 450, 675, 880, 1000 |
Publisher’s Note: MDPI stays neutral with regard to jurisdictional claims in published maps and institutional affiliations. |
© 2021 by the authors. Licensee MDPI, Basel, Switzerland. This article is an open access article distributed under the terms and conditions of the Creative Commons Attribution (CC BY) license (https://creativecommons.org/licenses/by/4.0/).
Share and Cite
Ji, S.; Li, Y.; Tian, G.; Ma, R.; Shu, M.; Zhang, S.; Yu, W.; Lan, X.; Cheng, Y. Study on the Relationship between Combustion Parameters and Cylinder Head Vibration Signal in Time Domain. Energies 2021, 14, 6421. https://doi.org/10.3390/en14196421
Ji S, Li Y, Tian G, Ma R, Shu M, Zhang S, Yu W, Lan X, Cheng Y. Study on the Relationship between Combustion Parameters and Cylinder Head Vibration Signal in Time Domain. Energies. 2021; 14(19):6421. https://doi.org/10.3390/en14196421
Chicago/Turabian StyleJi, Shaobo, Yang Li, Guohong Tian, Rongze Ma, Minglei Shu, Shiqiang Zhang, Wenbin Yu, Xin Lan, and Yong Cheng. 2021. "Study on the Relationship between Combustion Parameters and Cylinder Head Vibration Signal in Time Domain" Energies 14, no. 19: 6421. https://doi.org/10.3390/en14196421