Article

Water and Energy Efficiency Assessment in Urban Green Spaces

CERIS–Civil Engineering Research and Innovation for Sustainability, Instituto Superior Técnico, Universidade de Lisboa, 1049-001 Lisboa, Portugal
*
Author to whom correspondence should be addressed.
Energies 2021, 14(17), 5490; https://doi.org/10.3390/en14175490
Submission received: 26 July 2021 / Revised: 19 August 2021 / Accepted: 30 August 2021 / Published: 2 September 2021
(This article belongs to the Collection Women in Energy and Environment)

Abstract

:
Urban green spaces can be intensive water and energy consumers in the cities, particularly in water scarce regions. Though a very efficient use of such resources is necessary, tools for assessing both water and energy consumption and efficiency are not available. In this paper, a new methodology based on water and energy balances is developed for assessing the water-use and energy efficiency in urban green spaces. The proposed balances, adapted from those developed for water supply systems, are specifically tailored for accounting for urban green spaces specificities, namely, landscape water requirements, other uses besides irrigation and over irrigation water losses. The methodology is demonstrated in two case studies of different nature and characteristics: a modern garden with a smart irrigation system and an urban park with traditional irrigation system. The results show that the developed water balances allow to estimate and assess the irrigation efficiency over the years and to assess the effectiveness of implemented water saving measures. The application of the water–energy balance demonstrates the impact of water efficiency measures on the energy efficiency of the irrigation systems. The proposed methodology can be used to assess water and water–energy efficiency in urban green spaces and to identify the most adequate improvement measures, contributing for a better management of the two resources in the cities.

1. Introduction

The current environmental agenda in Europe reflects concerns with the conflicting economic and industrial growth and the environment and natural resources protection [1] In this context, the concept of Green Infrastructure has gained popularity in the last decades, despite its origin dating the XIX century in the United Kingdom with the greenbelts and the creation of public parks in urban areas [2,3]. Green Infrastructure is defined as a network of natural and semi-natural areas strategically designed and managed to deliver a wide range of ecosystem services and to enhance human wellbeing [4]. The fact is that green infrastructures, such as gardens and parks, provide multiple benefits to the inhabitants of urban areas and to the environment, both by mitigating the effects of pollution and of extreme weather events (e.g., floods, heat waves) and by providing recreational areas contributing for public health and wellbeing [5].
However, urban green spaces can be intensive water consumers, particularly in arid and semi-arid regions [6]. In areas of low rainfall, additional watering in dry months is required in order to maintain the health and the appearance of plants [7]. Consequently, urban gardens and parks have been identified as large water consumers in the cities, contributing for the water footprint [8,9], included in the cities’ water efficiency action plans [10,11], where targeted efficiency measures are often considered.
Water consumption for the irrigation of urban green spaces depends on the water requirements of the vegetation, which in turn depends on the planted species and on local climatic conditions. Autochthones species are generally those that require less irrigation, as they are adapted to local climatic conditions. However, turfgrass is often the chosen vegetation for greening extensive areas in many urban parks, due to both aesthetic reasons and practical purposes, despite its high water demand [12]. Additionally, green spaces in the cities usually include trees and shrubs, both requiring less water than the turfgrass [12,13]. The shades provided by the trees also contribute for lowering the water requirements of the green space, by reducing the evapotranspiration of the vegetation around them [14]. The simultaneous presence of vegetation of different types introduces more complexity and uncertainty in determining the exact amount of water needed for irrigation [15]. On the other hand, the type and condition of the installed equipment greatly affects the amount of water consumed for irrigation. In general, micro irrigation systems are much more efficient than sprinkler irrigation, which are mostly used for irrigating extensive turfgrass areas.
Water-use efficiency in urban green spaces is attained when the supplied water matches the real water needs. However, the water consumption for irrigation is often higher than the estimated demand of the green space, meaning that there is a saving potential [16]. In order to optimize irrigation efficiency in green spaces, smart irrigation technologies have been developed and adopted in recent years. These technologies aim at optimizing irrigation by an accurate estimation of plant water requirements and an optimal efficiency of the irrigation systems, in order to minimize excessive watering [17,18].
While most urban gardens are irrigated with drinking water from the supply network and make use of the network pressure for their own functioning, others rely on local groundwater abstraction or rainwater harvesting. These alternative water sources can have enough quality for irrigation and allow for drinking water savings, which is particularly needed in regions suffering from water scarcity [19]. However, supplying the irrigation systems with such waters requires the use of pumps, which increases energy consumption. In addition, the components of the smart irrigation systems require electrical energy too [20]. Hence, the urban green spaces are also energy consumers. Even though renewable sources of energy can be used to supply the irrigation systems [21], the energetic aspect of the green spaces must also be taken into account when assessing their sustainability
For the sustainable use of resources in the cities [22], both water and energy must be wisely used and the effectiveness of efficiency measures needs to be monitored and evaluated. The latter is a common practice in the water supply sector, in which annual water balances and performance indicators are calculated, in order to estimate water losses and to identify the most adequate improvement measures [23]. Similar water–energy balances for the water supply systems have been developed and tested [24]. Water and the associated energy use in urban green spaces must also be accounted for in the overall city balance and tools for assessing the efficiency of water and energy in the green spaces are needed [25].
In this paper, a new methodology for assessing water and energy efficiency in urban green spaces is proposed, adapted from existing practices for water supply systems. The methodology is based on the water and energy balances widely used for assessing the performance of water supply systems. New components of the water balance are introduced to account for the landscape water requirements, for water consumption due to other uses besides irrigation and for water losses due to over irrigation. In accordance, new components for the water–energy balance are also proposed. The application of the methodology is demonstrated in two case studies: an urban green space equipped with a smart irrigation system and an urban park with a traditional irrigation system and additional water uses.

2. Materials and Methods
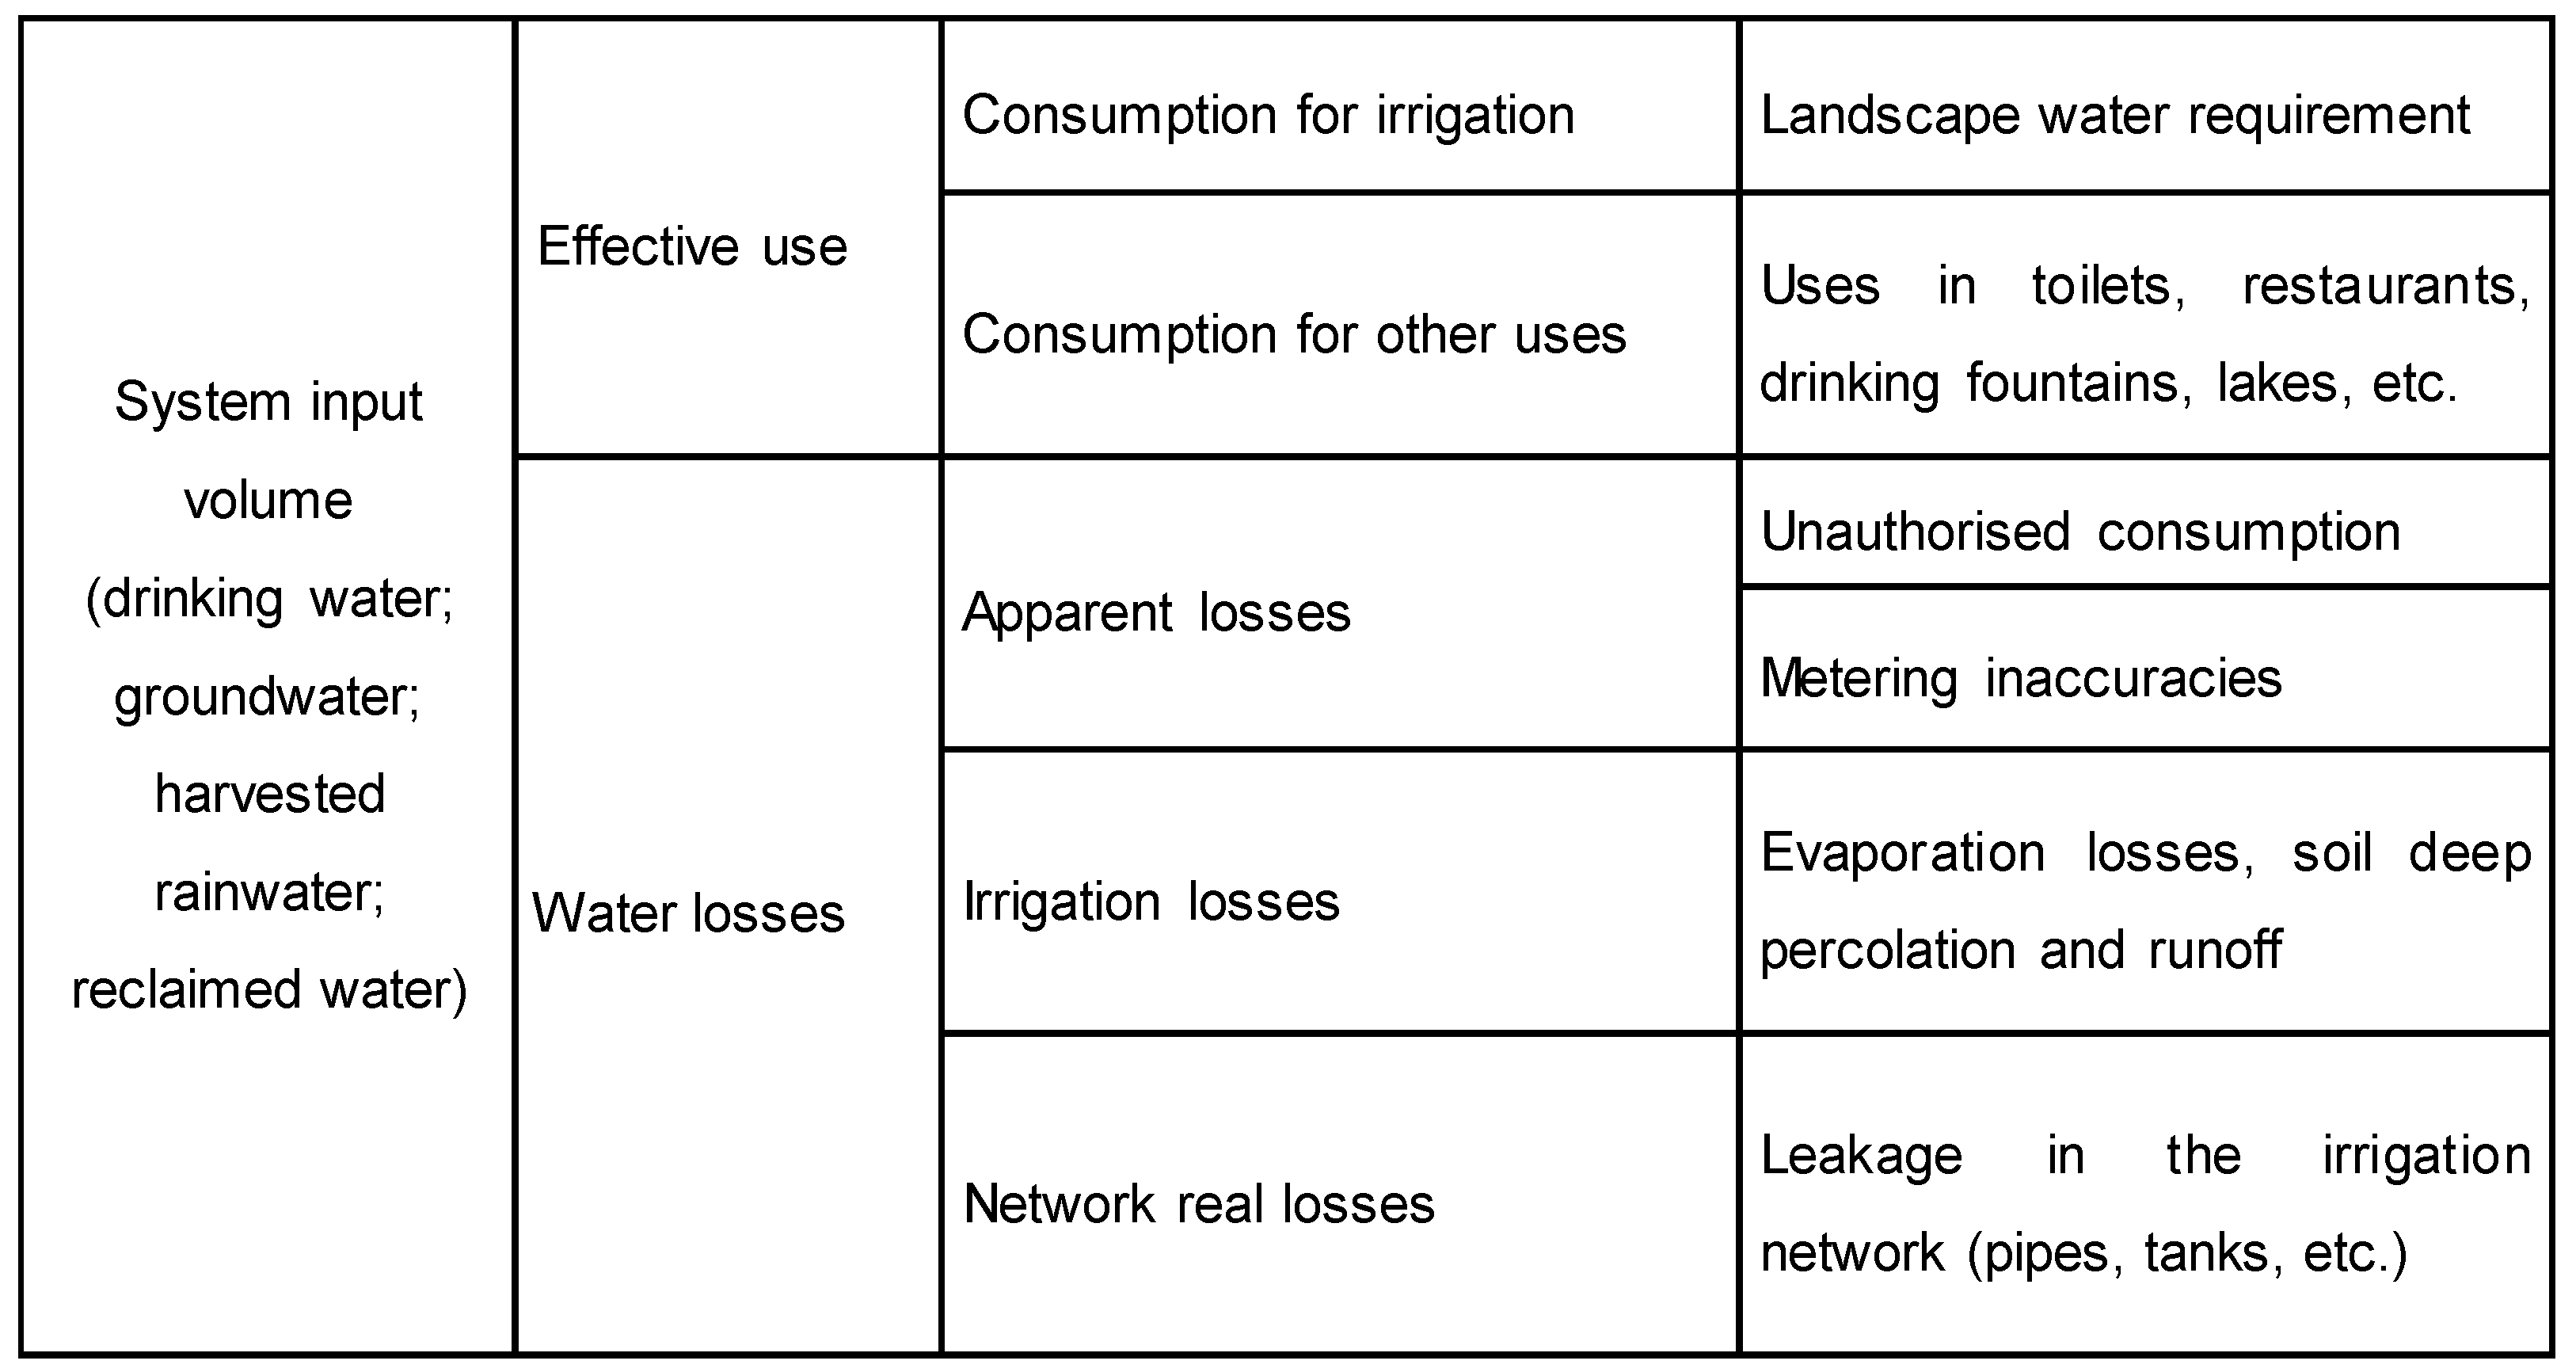
2.1. Water Balance

A novel water balance for assessing water-use efficiency in gardens and urban green spaces is proposed (Figure 1), based on the water balances developed for water supply systems [23] and for agricultural irrigation systems [26]. The water balance concept is based on the identification and quantification of all possible water volumes that go in and out of a system over a certain period. It is frequently calculated for a one-year period to minimize the different uncertainties on measurements and estimations of water volumes.
The system input volume in an urban green space (e.g., parks, gardens) is the total amount of water that is supplied to that space by a man-made system. Urban green spaces are frequently supplied and irrigated with drinking water from the supply network [12,16], though other sources might exist, particularly in larger spaces, such as abstracted groundwater, reclaimed water or harvested rainwater. Supplied water volumes should be preferentially metered, or estimated as accurately as possible.
For determining the effective water consumption in the green space, all water uses must be identified. Though irrigation is often the largest water consumer in a green space, other uses can also exist, particularly in parks where leisure activities take place (e.g., restaurants, public toilets, drinking water fountains). The effective use for irrigation is, in fact, the landscape water requirement (LWR), which can be calculated by:
LWR   = 1 DU LQ × [ ( ET 0 × K L ) R a ] × A
where LWR is the landscape water requirement (m3/year), DULQ is the lower quarter distribution uniformity of the associated type of irrigation equipment (dimensionless), ET0 is the reference evapotranspiration (mm/month), KL is the landscape coefficient (dimensionless), Ra is the allowable rainfall (mm/month) and A is the irrigated area (m2) [9,27,28]. Calculating LWR for green spaces with a variety of types of vegetation and local microclimates can be challenging and the result may lack in accuracy [29]. However, dividing the irrigation area by hydro zones and estimating monthly LWR for each zone allows closer estimates of real LWR. Calculated LWR for each month must then be summed up for estimating the annual water requirements. Water consumption for other uses in the green space, if any, must ideally be measured by specific water meters, or alternatively, estimated using the best available methods.
All the water that goes into the green space but that is not effectively consumed, either for irrigation or other uses, is lost in some way. Water losses in urban green spaces comprise the irrigation losses (e.g., evaporation, percolation, runoff), the apparent losses (unauthorised consumption and metering inaccuracies) and the piped network real losses (e.g., due to leaks in pipes). Irrigation losses include all the water that is consumed for irrigation but that is more than needed to fulfil the plants’ requirements. Such water is loss through evaporation, percolation through soil and surface runoff, but due to the complexity required for estimating each of these losses, this component is estimated as a whole. Unauthorised consumption regards to water thefts and illegal connections to the irrigation system. If detected by the garden workers, it can be estimated by multiplying the duration of the event by the probable flowrate. Metering inaccuracies can be estimated based on the characteristics of the metering devices installed. Network real losses include all the losses in the water network of the green space, such as leaks in pipes or in storage tanks. Leakage in the irrigation network can be estimated by Minimum Night Flow Analysis (MNF) when there is no irrigation or consumption for other uses [30].
Several performance indicators can also be calculated based on the water balance for urban green spaces allowing the diagnosis of green areas for identifying the inefficiencies and the comparison between several improvement measures. The simplest and most helpful indicator is the irrigation efficiency (IE) [27], herein defined as:
IE   = LWR V INP V OU × 100
where LWR is the landscape water requirement (m3/year); VINP is the system input volume (m3/year); VOU is the volume of water consumed for other uses (m3/year). The IE is classified in: good irrigation efficiency for IE ≥ 80%; reasonable irrigation efficiency when IE is between 60% and 80%; and inadequate irrigation efficiency for IE ≤ 60%.

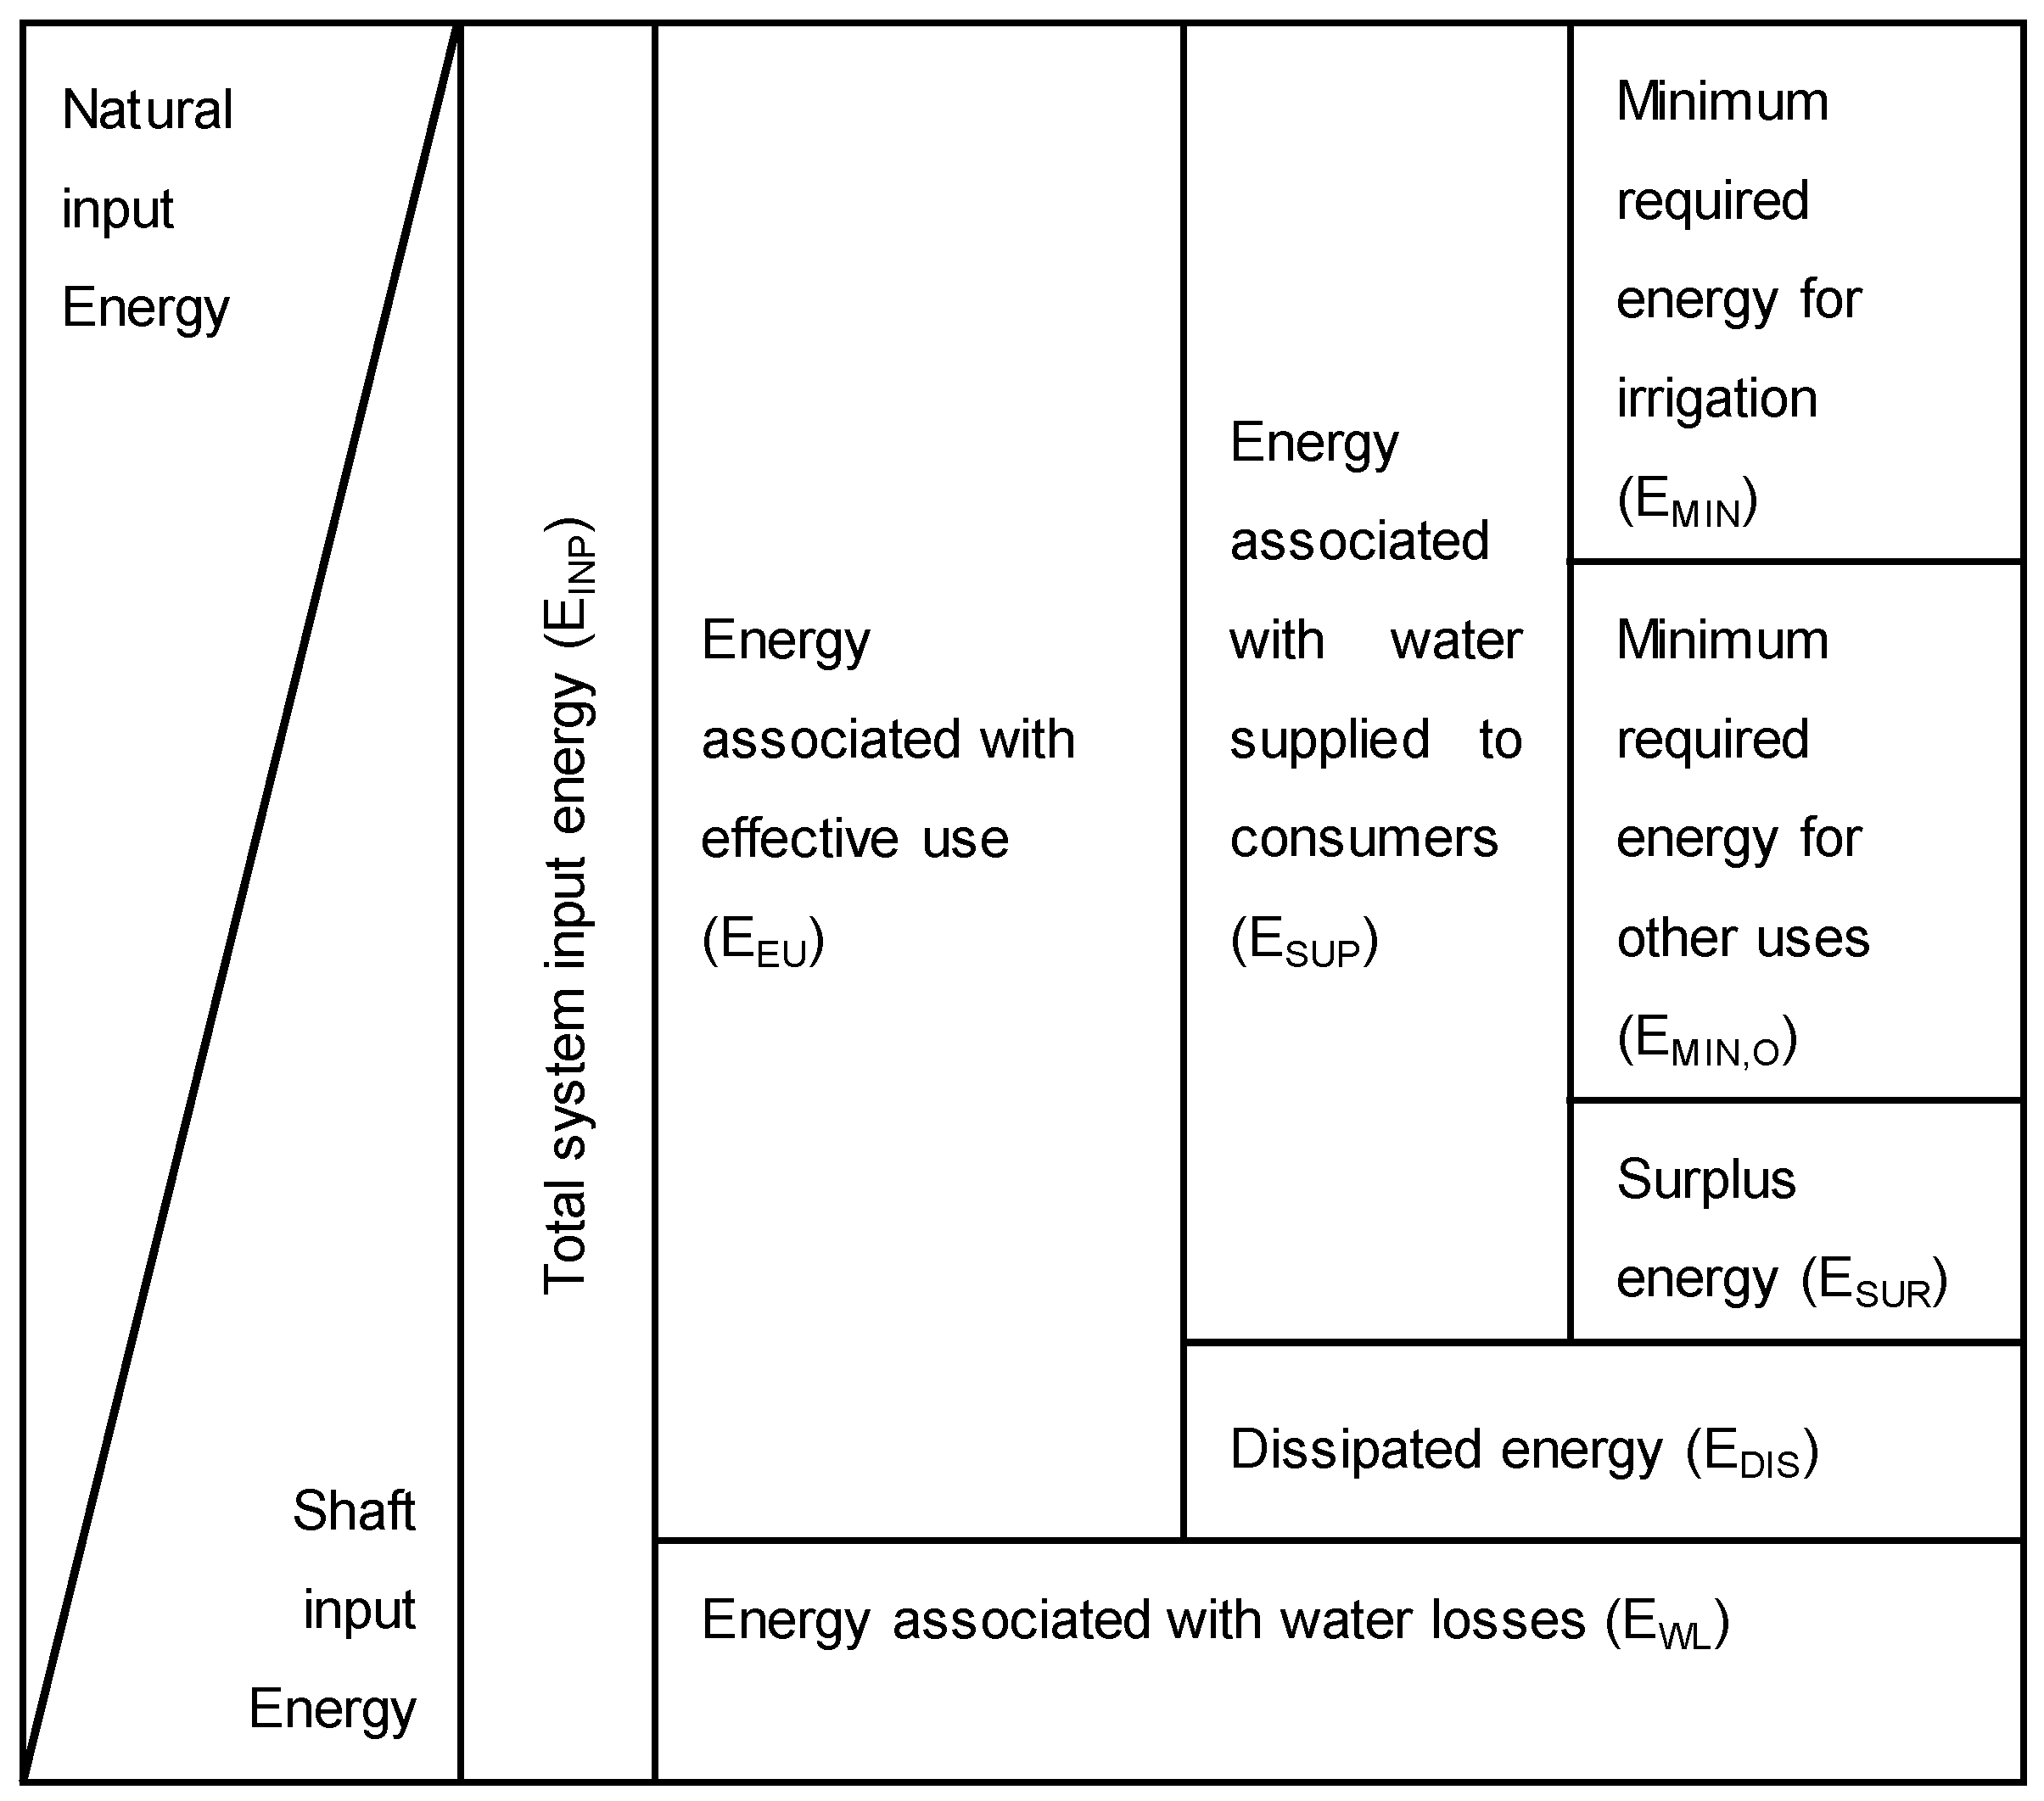
2.2. Water–Energy Balance

The proposed water–energy balance for urban green spaces (Figure 2) is based on the top-down energy balance for water supply systems [24]. Additional components and simplifications are introduced in order to better tailor the balance for urban green spaces and their water-uses. It is also calculated for a one-year period.
The water–energy balance approach is very similar to that of the water balance, as it accounts all the energy that is supplied to the green space along with the water, as well as the energy that is lost with water losses.
The total system input energy is the sum of the energy that is supplied to the urban green space by its various water sources. Natural input energy, EN, refers to the potential energy supplied by pressurised delivery points or storage tanks at the inlet of the water system that supplies the urban green space. In most green spaces, supplied by the drinking water network, natural input energy refers only to the pressure energy. Shaft input energy, ES, is associated with energy supplied by the pumping stations of the irrigation system. The sum of these two energy sources, natural and shaft, is the total system input energy, EINP. In case there are no pumping stations in the system, the total input energy can be calculated as follows:
E INP =   γ V INP   H 3600 × 1000
in which EINP is the total energy input (kWh), γ is the specific weight of water (9800 N/m3), VINP is the system input volume (m3) and H is the pressure head supplied to the irrigation system (m), assuming that the kinetic head is negligible. The pressure head can be obtained as follows:
H   =   z e + p inlet γ z 0
in which ze is the elevation of the node at the inlet of the water supply system of the green space (m), pinlet is the pressure at the inlet of the system (Pa) and z0 is the reference elevation, typically the node with the minimum elevation in the irrigation system (m).
The input energy is subdivided into energy associated with effective use, EEU, and energy associated with water losses, EWL.
The energy associated with water losses (EWL) can be obtained by associating the water losses percentage from the water balance as proportion to the energy associated with water losses, as follows:
E WL   =   E INP × WL / 100
where EWL is the energy associated with water losses (kWh), EINP is the total system input energy (kWh) and WL corresponds to the percentage of water losses obtained from the water balance (%).
Energy associated with effective use includes the energy that is effectively supplied to the consumers, ESUP, and the energy that is dissipated in the system, EDIS. The energy associated with the water supplied to consumers includes the minimum required energy for irrigation, EMIN, the minimum required energy for other uses, E’MIN, and the surplus energy, ESUR. The first can be obtained from the theoretical minimum operating pressure, given by the manufacturer of the irrigation equipment. It depends on the type of sprinkler or dripper/micro-sprinkler. The second one is related with the minimum pressure requirements at the consumption point for the other water uses. The minimum required energy, both for irrigation and for other uses, can be calculated as follows:
E min = i = 0 n   γ   V needs , i   H min , i 3600 × 1000
in which Emin is the minimum required energy (kWh), Vneeds,i is the water needs at node i (m3) and Hmin,i is the minimum pressure head in each consumption node i (m), given by:
H min , i =   z i + p min γ z 0
in which Hmin,i is the minimum pressure head at each node i (m), zi is the elevation of node i (m), pmin is the minimum required operating pressure (Pa), z0 is the reference elevation or the node of minimum elevation in the system (m).
The surplus energy, ESUP, corresponds to the energy above the minimum required that is supplied at the node level. Dissipated energy, EDIS, in the water supply systems of the green spaces is due to pipe friction, valve head losses and the pumping stations’ inefficiency, if wells or boreholes exist. These two components (dissipated and surplus energy) can be computed together as the difference between the energy associated with effective use and the sum of the minimum required energies for irrigation and other uses.
Three energy performance indicators, E1, E2 and E3, can also be calculated from the water–energy balance. Performance indicator E1 represents the energy in excess per volume of input water (kWh/m3):
E 1 = E INP E MIN V INP
This ratio allows the evaluation of the potential of energy reduction per unit of the water volume that enters into the system. It is always positive and should be as low as possible.
Performance indicator E2 represents the energy in excess per volume of water effectively used, i.e., the water needs ( V needs ) (kWh/m3):
E 2 = E INP E MIN V needs
This indicator is very similar to the previous one; however, E2 allows the assessment of the effect of water losses on the energy efficiency of the system.
Performance indicator E3 is the ratio of the system input energy over the minimum required energy.
E 3 = E INP E MIN
This indicator provides a very simple metric for assessing how much energy is being supplied in excess. It should be as low as possible and, in an ideal situation, equal to 1.

3. Case Studies Description

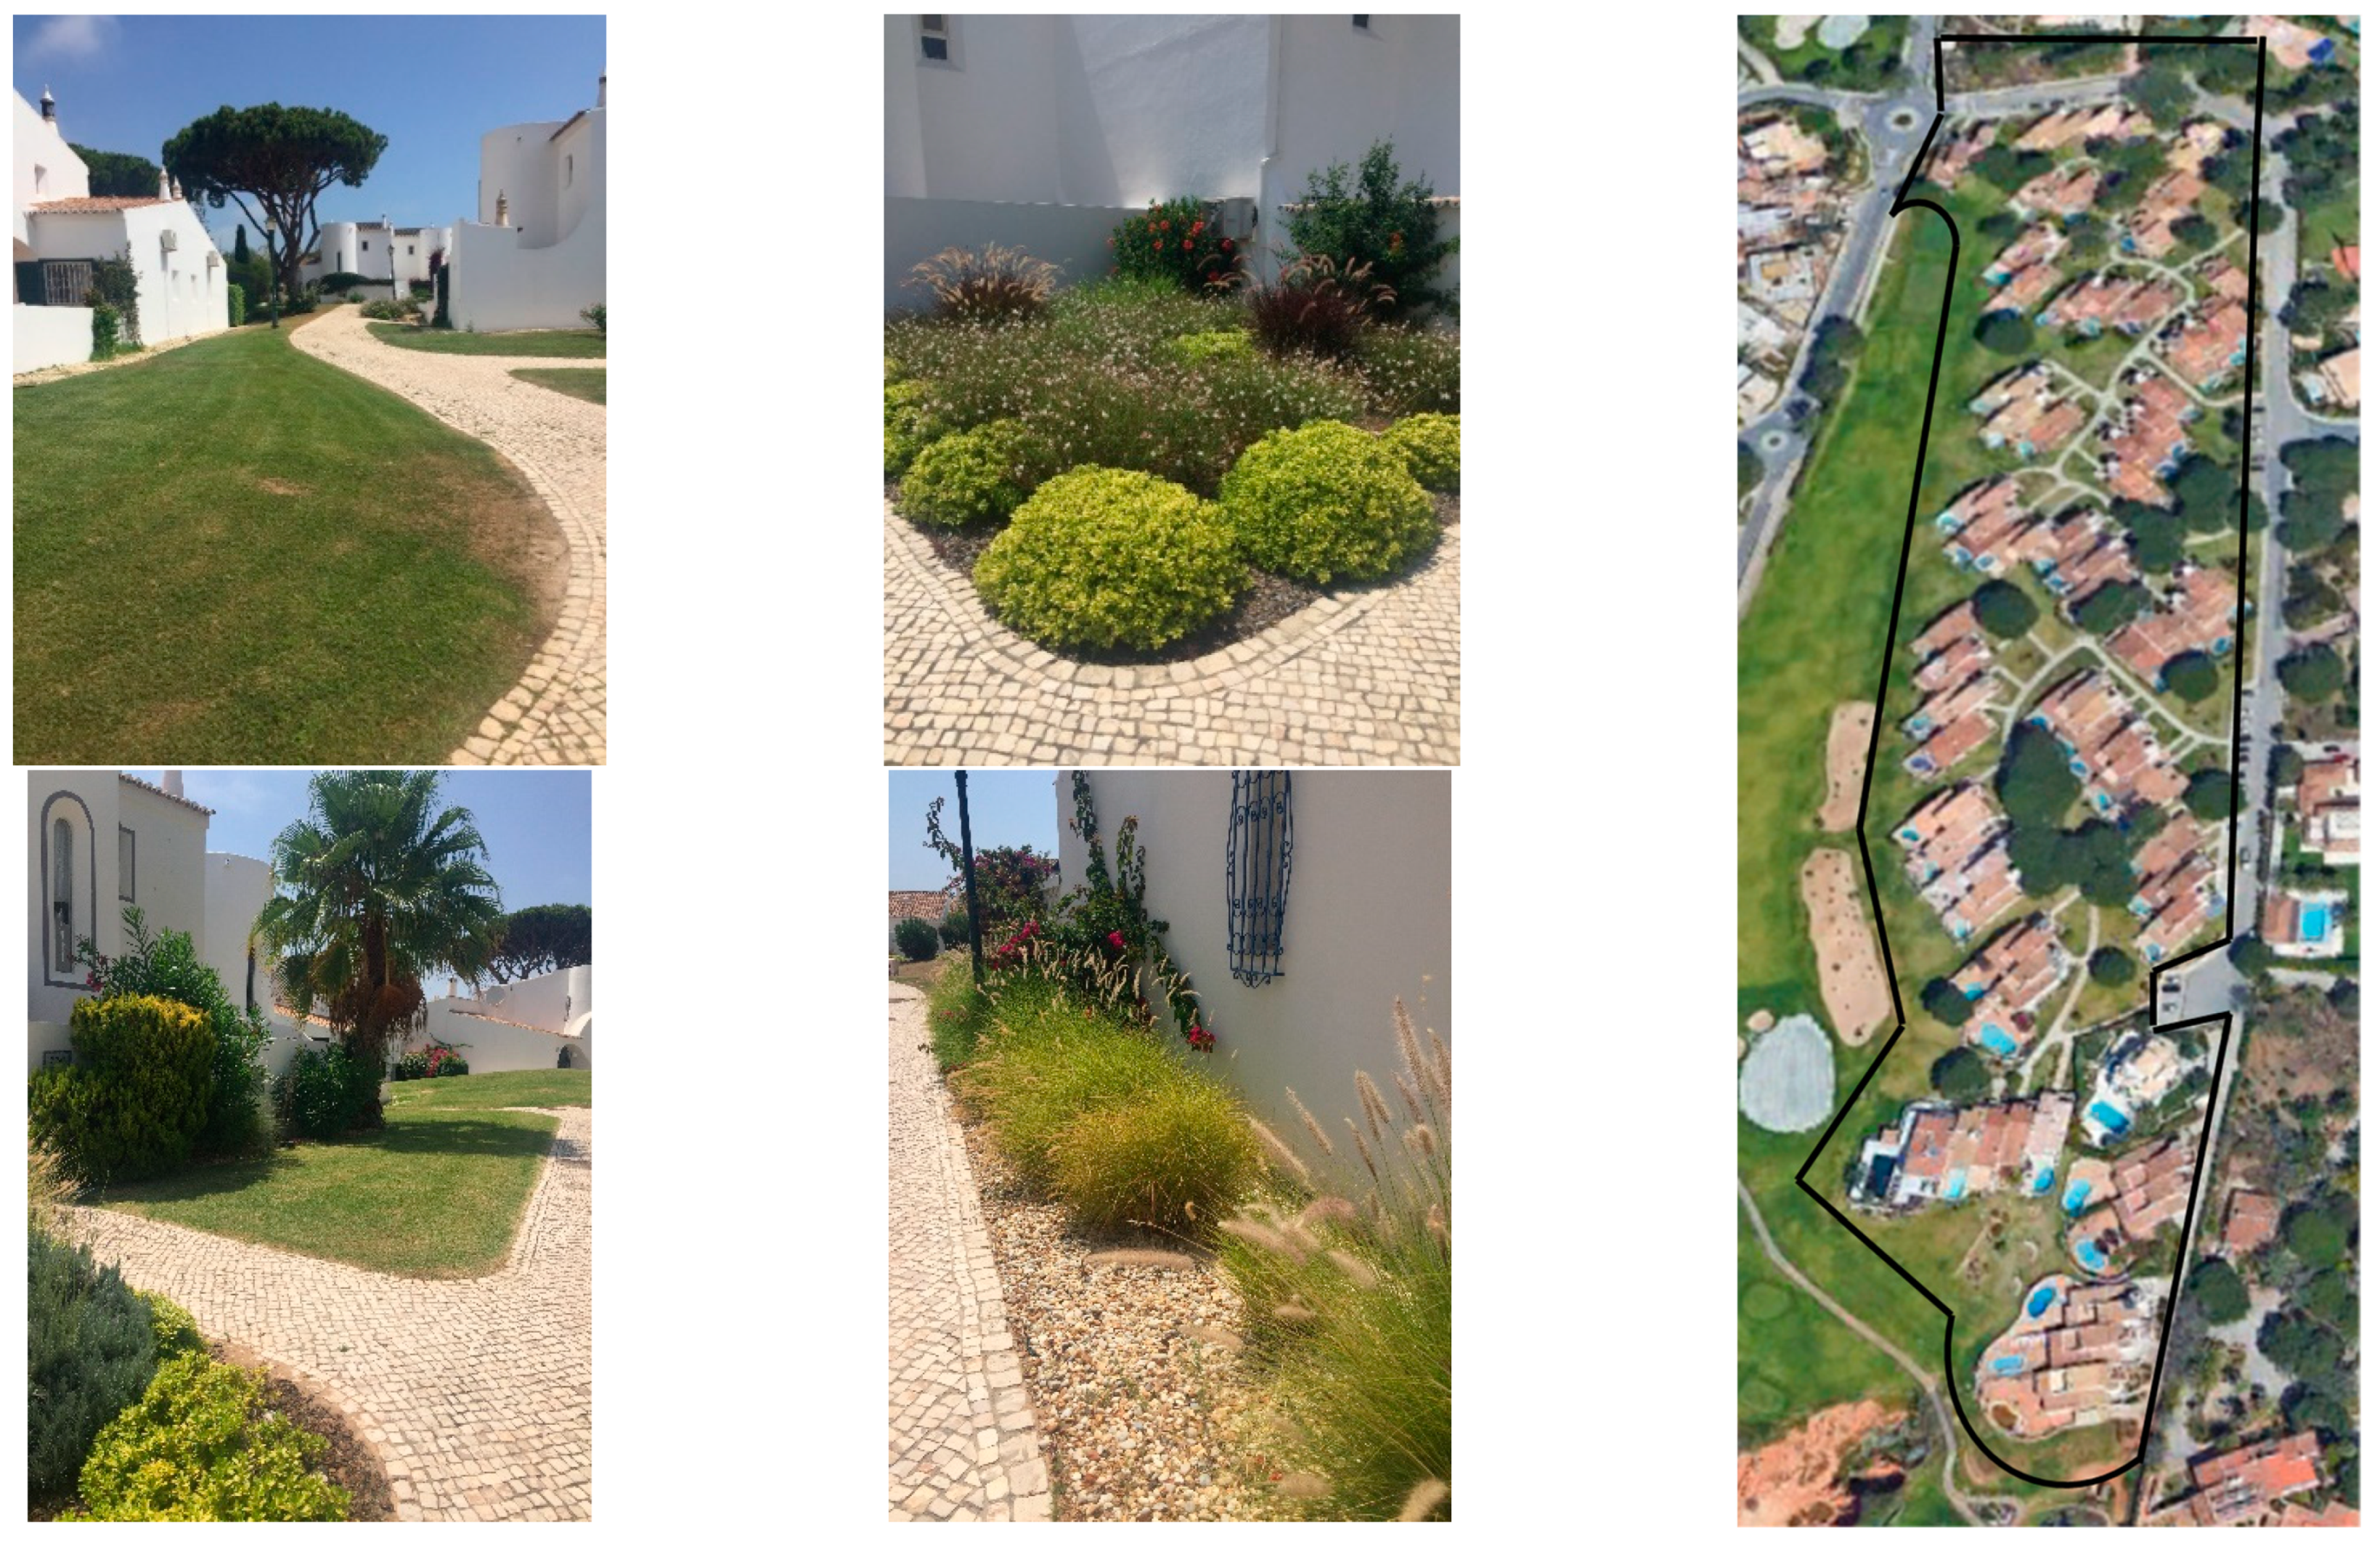
3.1. Case Study 1: Green Space with Smart Irrigation System

Case study 1 is an urban green space with 19,200 m2, located in a touristic resort in Vale do Lobo, in the Algarve region, Portugal (Figure 3). The green space includes 154 small gardens with 20 installed irrigation meters. The green space surrounds a neighbourhood of villas with turf grass and flowerbeds. A smart irrigation system was installed in the beginning of 2019. The system includes a connection with a meteorological station located in Faro and a platform that determines the irrigation needs, according to local weather conditions and that, automatically, controls, at every hour, the amount of water that is supplied by the irrigation system, shutting off the system, if no irrigation is needed. The turf grass area is irrigated with sprinklers and the flowerbeds with drip-irrigation. The sprinklers (Rain Bird, series 5000) have a minimum working pressure head of 17 m.
Water supplied by the irrigation system of this green space is exclusively consumed for irrigation purposes; thus, there is no consumption for other uses. The estimation of the landscape water requirements considered the two types of vegetation and the irrigation systems of each area. The distribution uniformity, DULQ, of both sprinkler and drip irrigation systems is assumed to be 0.7, while the landscape coefficient, KL, is considered to be 0.7 for the turfgrass areas and 0.5 for the flowerbeds. The elevation of the node that connects the inlet of the irrigation system of the green space, ze, to the municipal water distribution system is 32 m, while the minimum elevation in the irrigation system, z0, is 22 m. The pressure head at the inlet of the system, pinlet/γ, is of 35 m.
The proposed water and water–energy balances are applied to case study 1 for three consecutive years—2017, 2018 (before the installation of the smart water meters) and 2019 (after the installation)—and results are presented and discussed in Section 4.

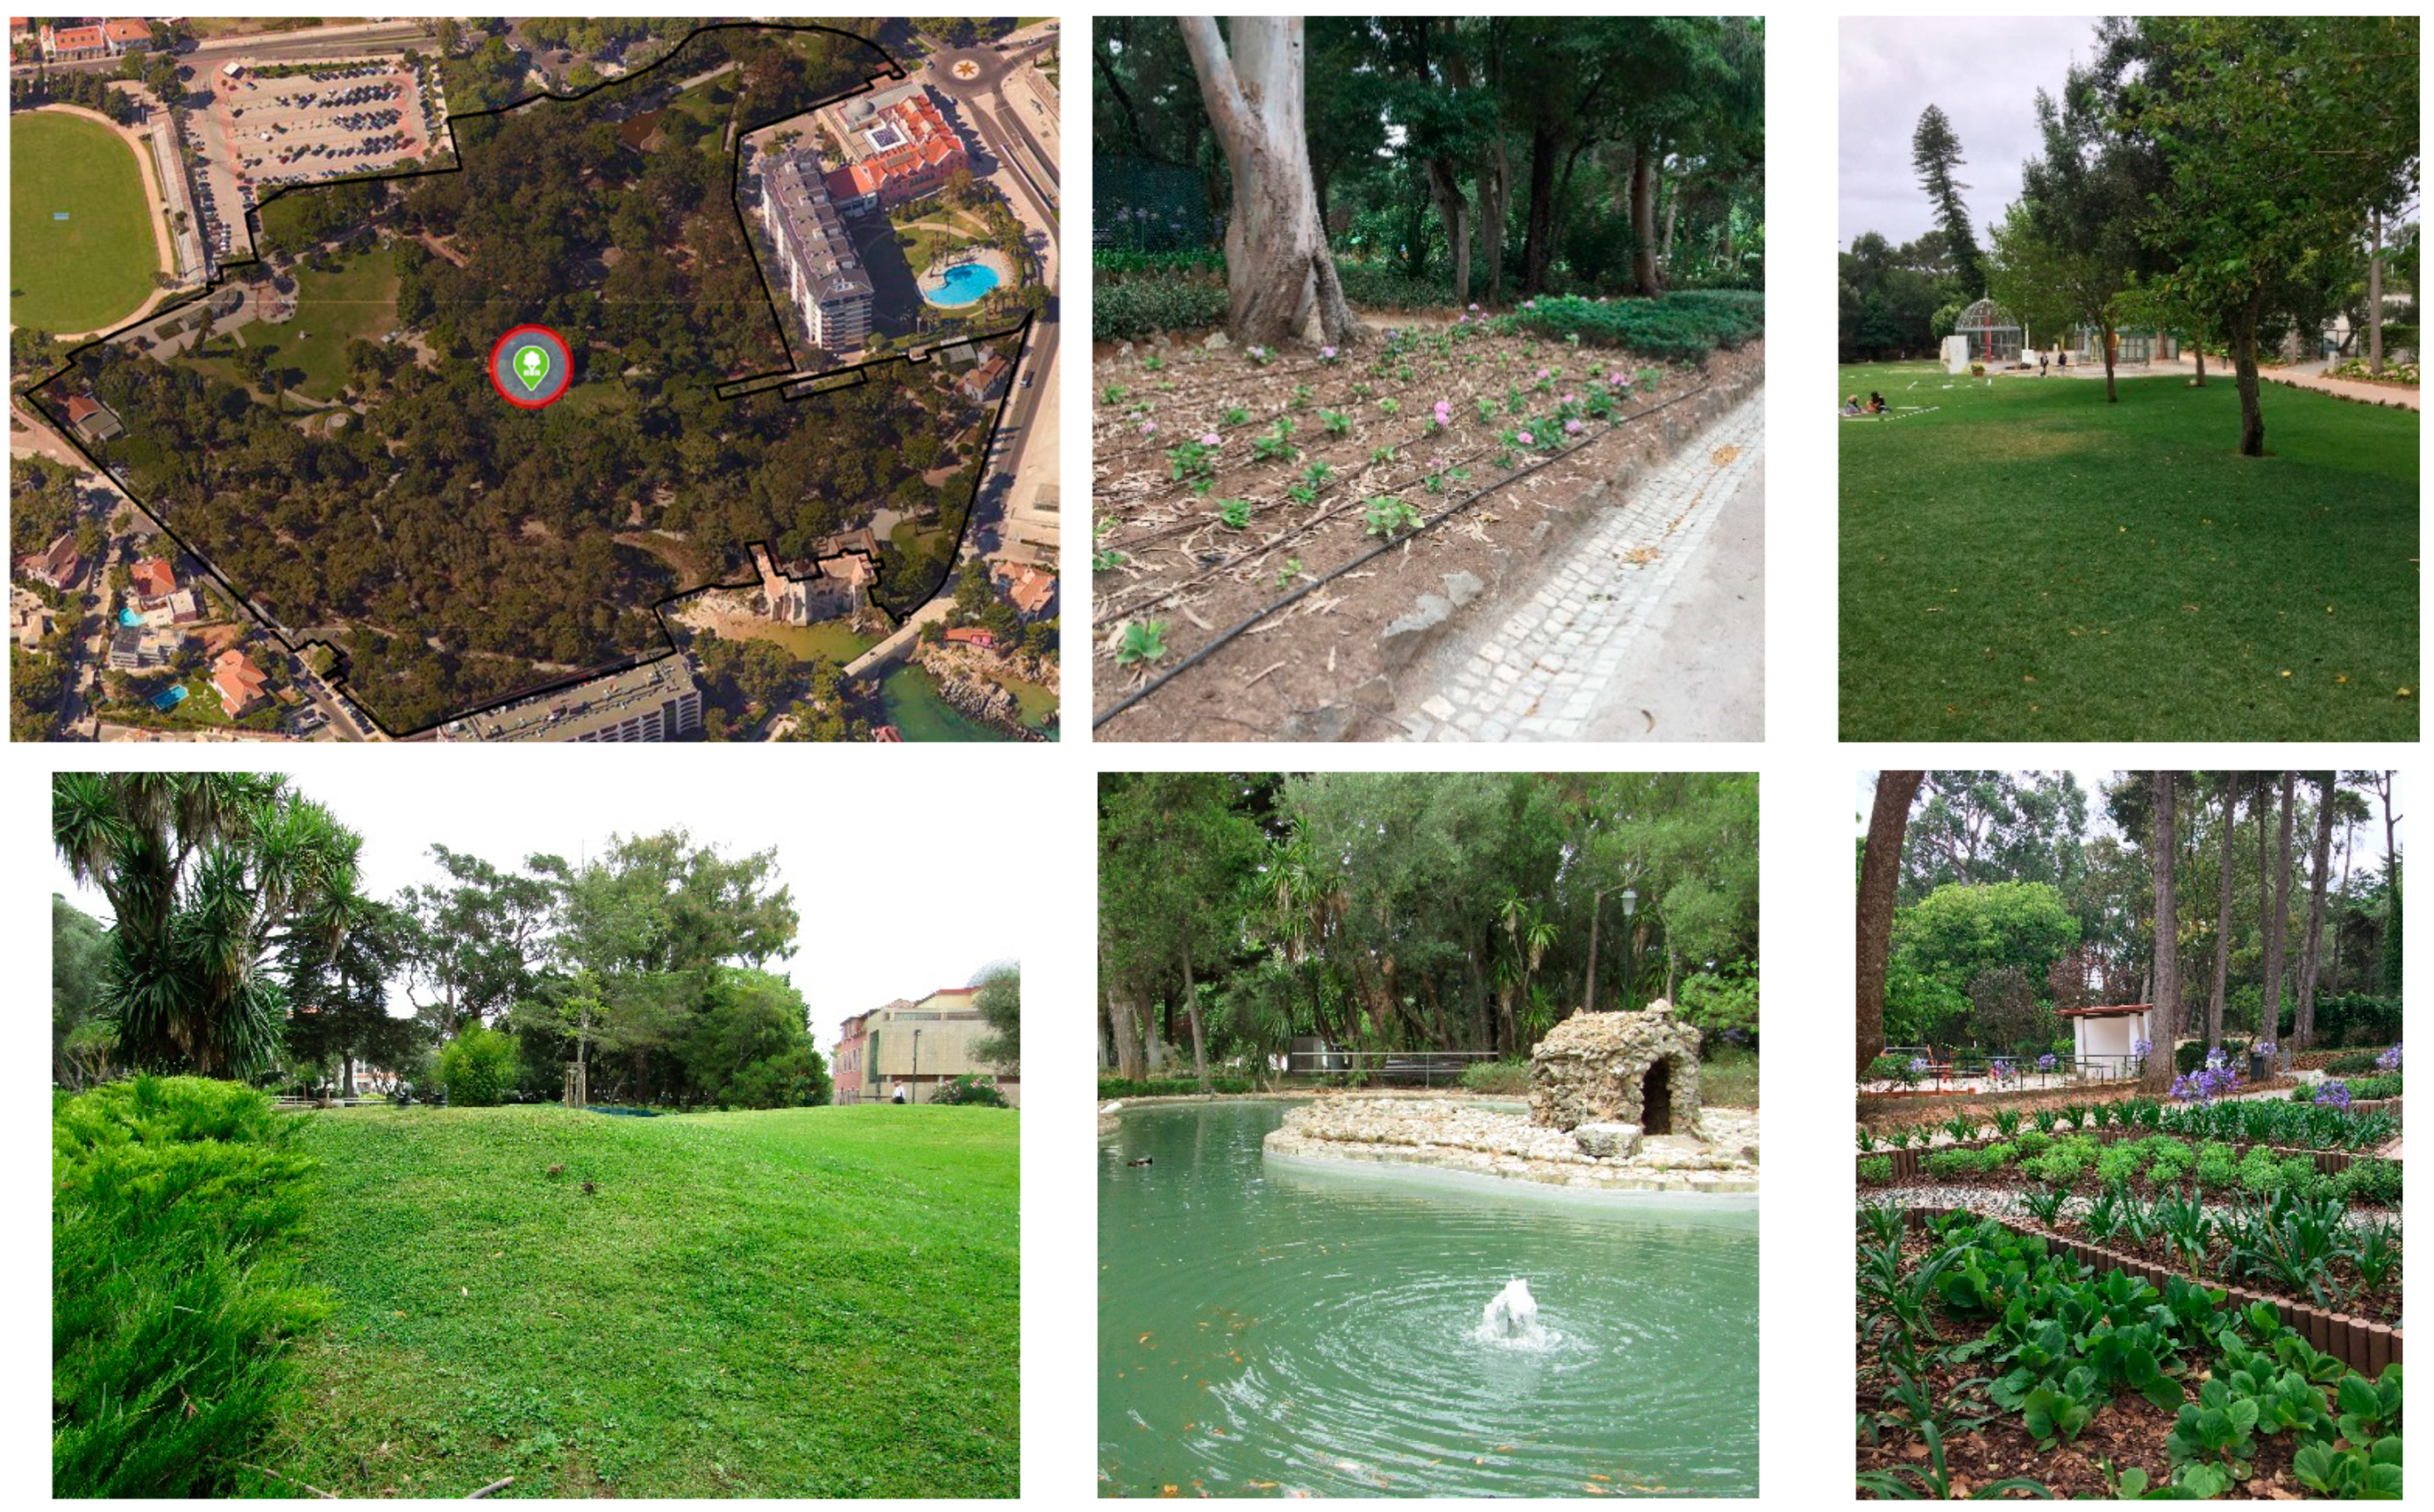
3.2. Case Study 2: Urban Park

Marechal Carmona is a public urban park located in the centre of Cascais (Figure 4). This park has approximately 14,343 m2 of irrigated area, of which about 11,100 m2 correspond to turfgrass area with sprinkler irrigation, and the remaining 3243 m2 are covered with shrubs, herbaceous and flowers and are irrigated via micro irrigation. In the park, there are also trees, a small lake, several picnic areas, a field to play traditional games, cafes, toilets, a museum, a building for small conferences, a municipal library for children and youth and a playground. All water users, including the irrigation system, are supplied by the drinking water network of the park, which includes five water meters: three of them connected to the other uses in the park (e.g., café, toilets, library) and two connected to the irrigation system. The water meters are not connected to any telemetry system and the readings are carried out once per month or every two months. The irrigation systems are manually turned on or off by the irrigation workers, who empirically adjust the irrigation time to the weather and soil conditions. The lake is filled with abstracted groundwater from a borehole.
The coefficients DULQ and KL used for estimating the water requirement of the park are the same as in case study 1. The water balance is calculated for 2015, 2016 and 2017.

4. Results and Discussion

The water balances are calculated for both case studies, although the water–energy balance is only carried out for case study 1. This is because there were no records in the municipal services of the physical characteristics and the topology of the irrigation system of case study 2, essential to compute the energy balance components.

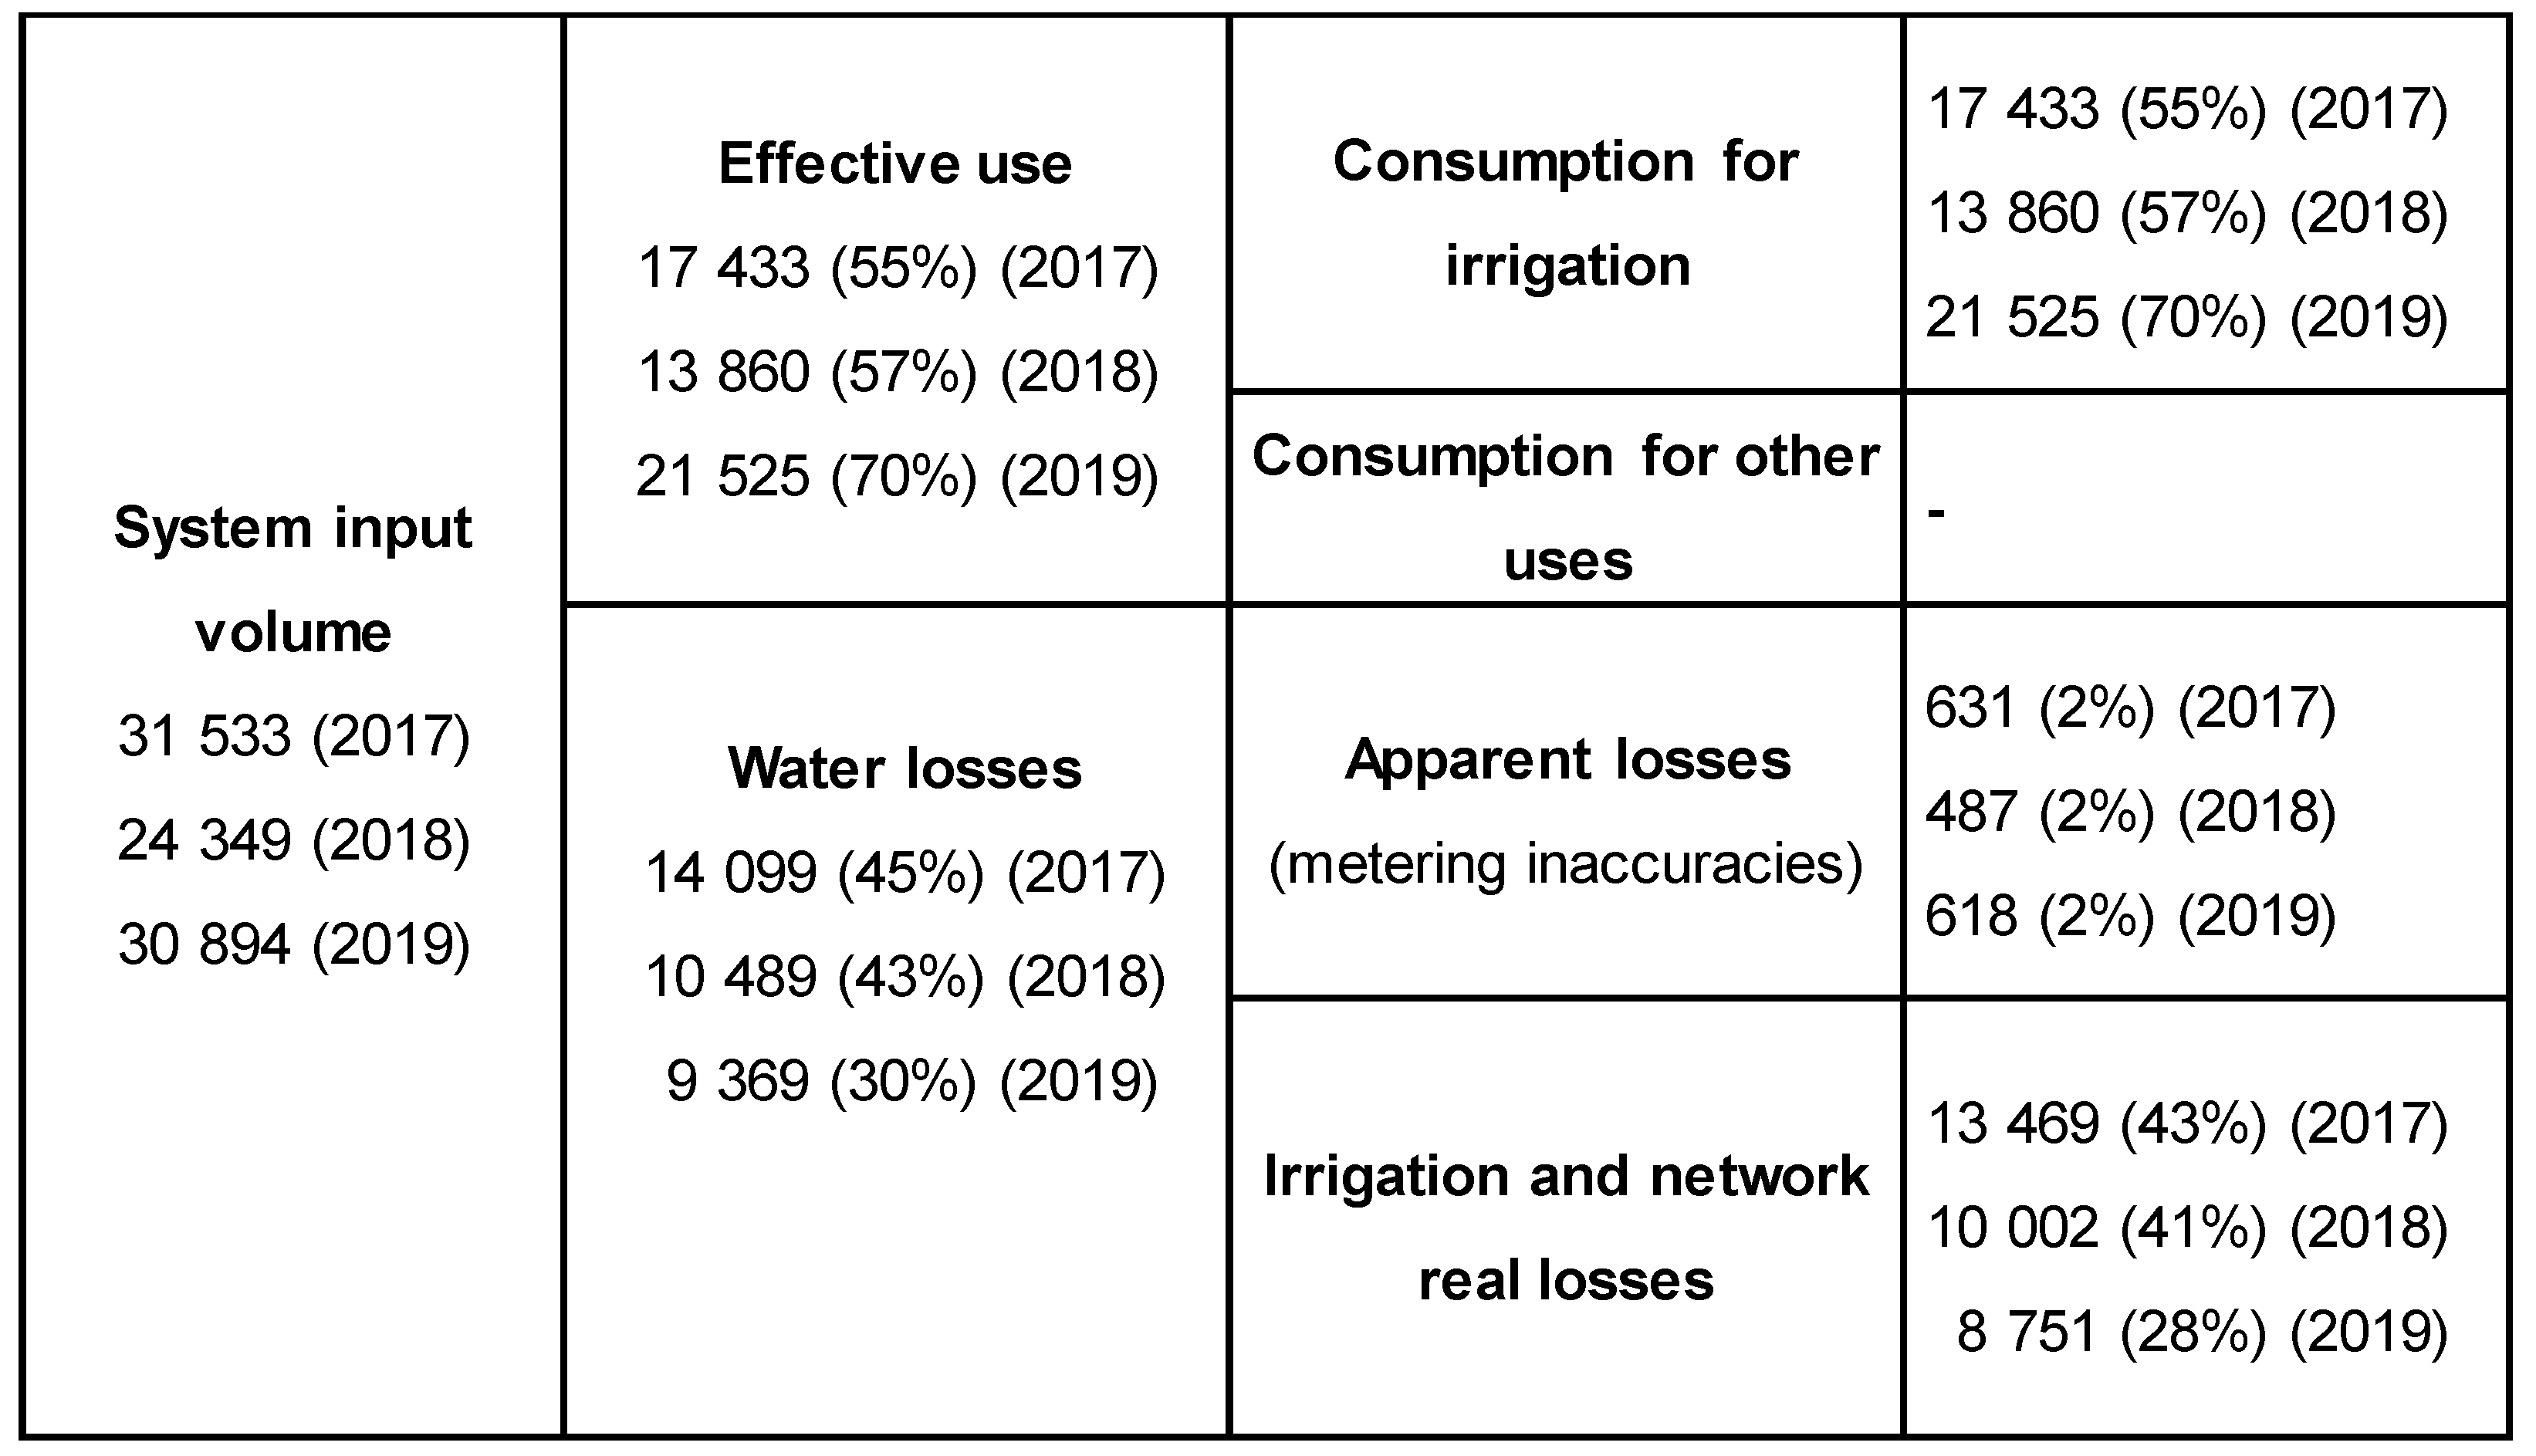
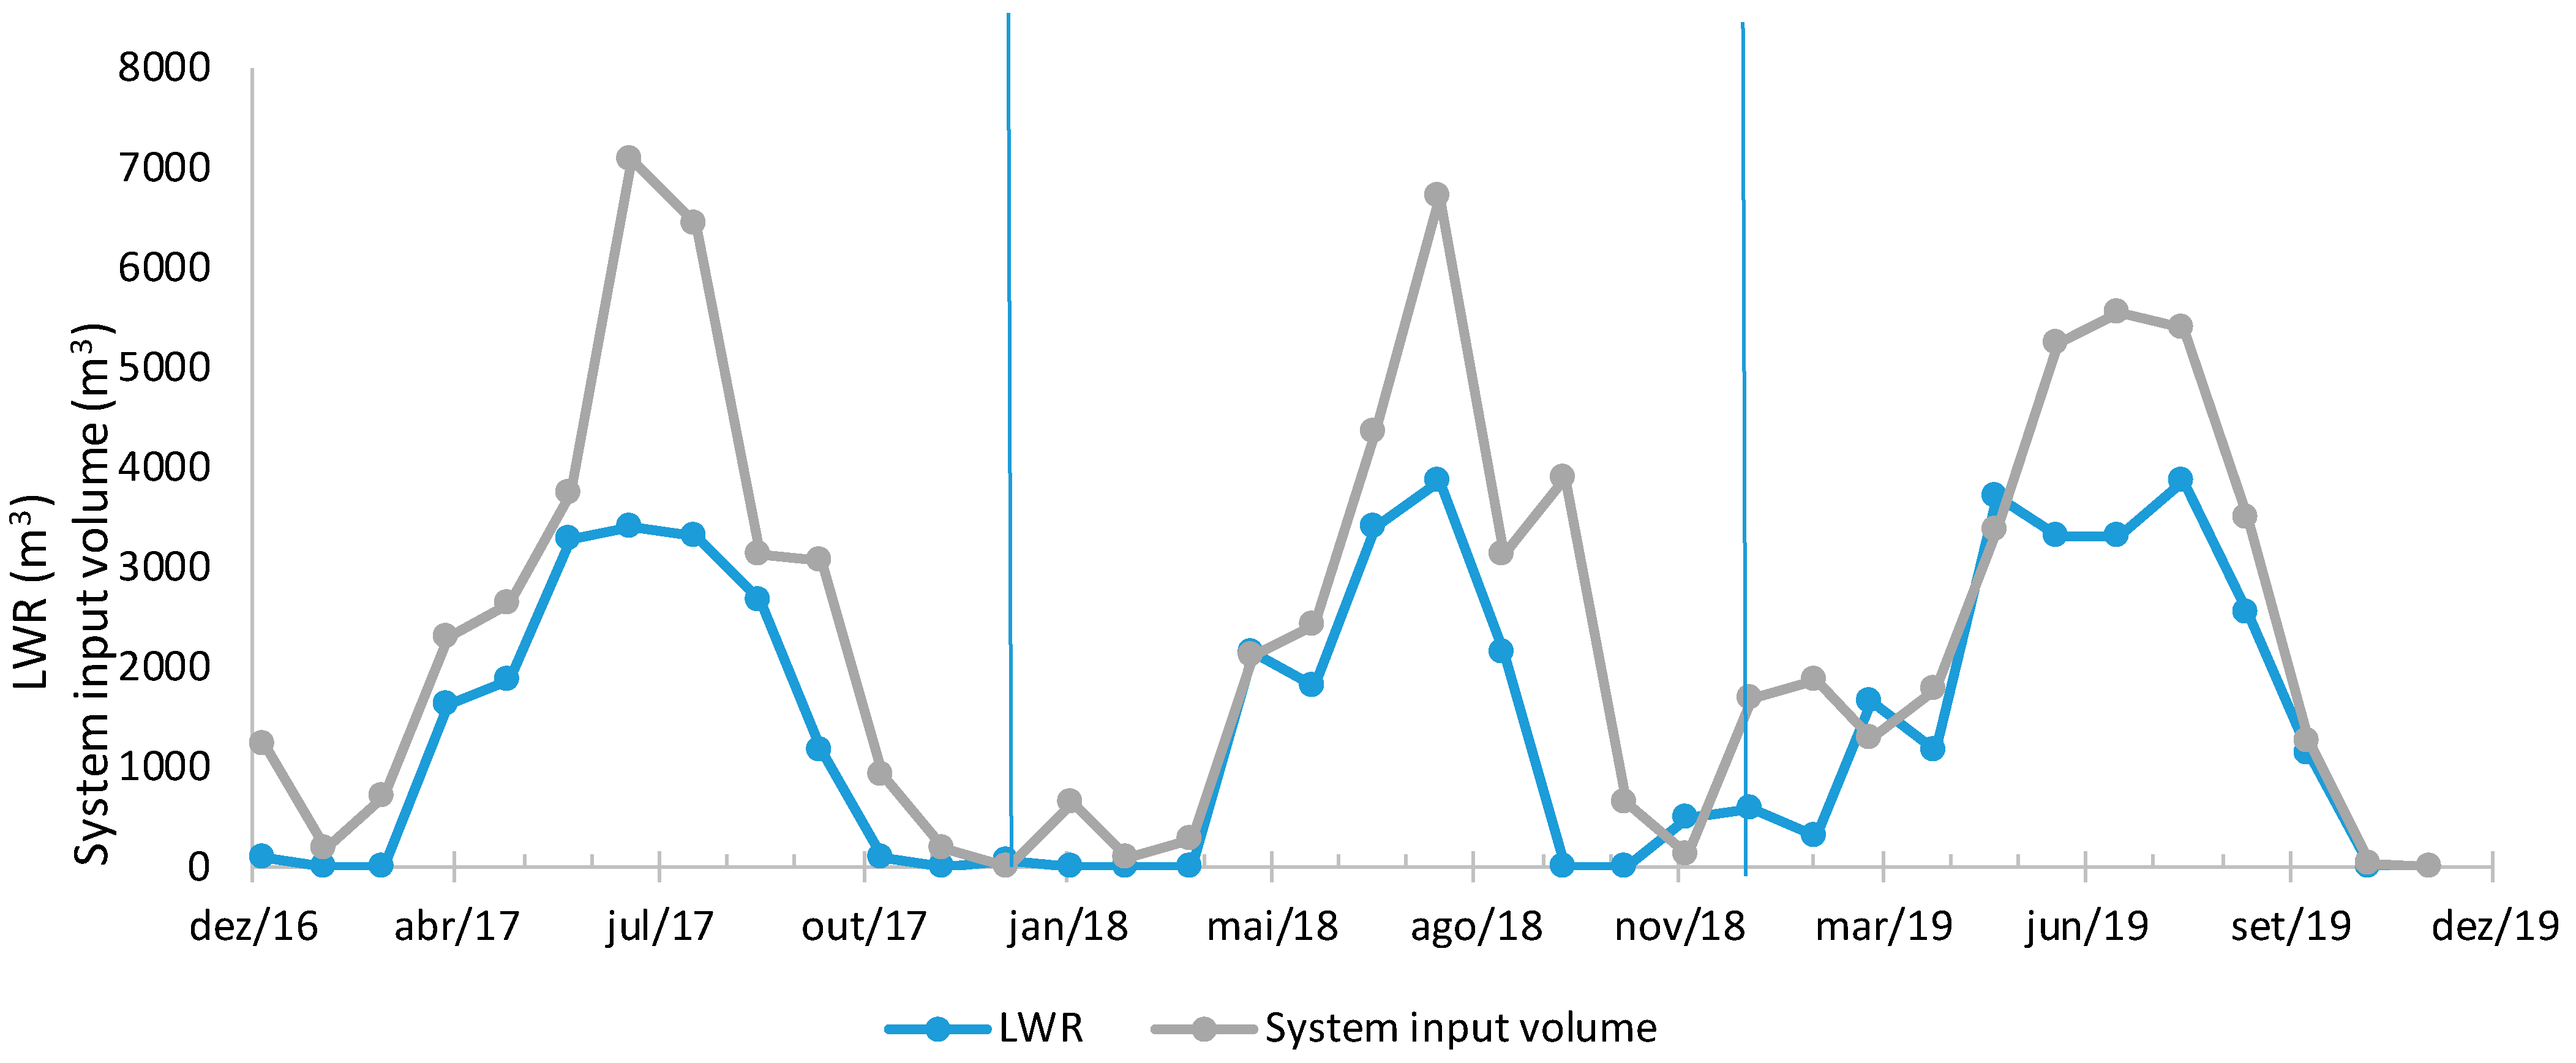
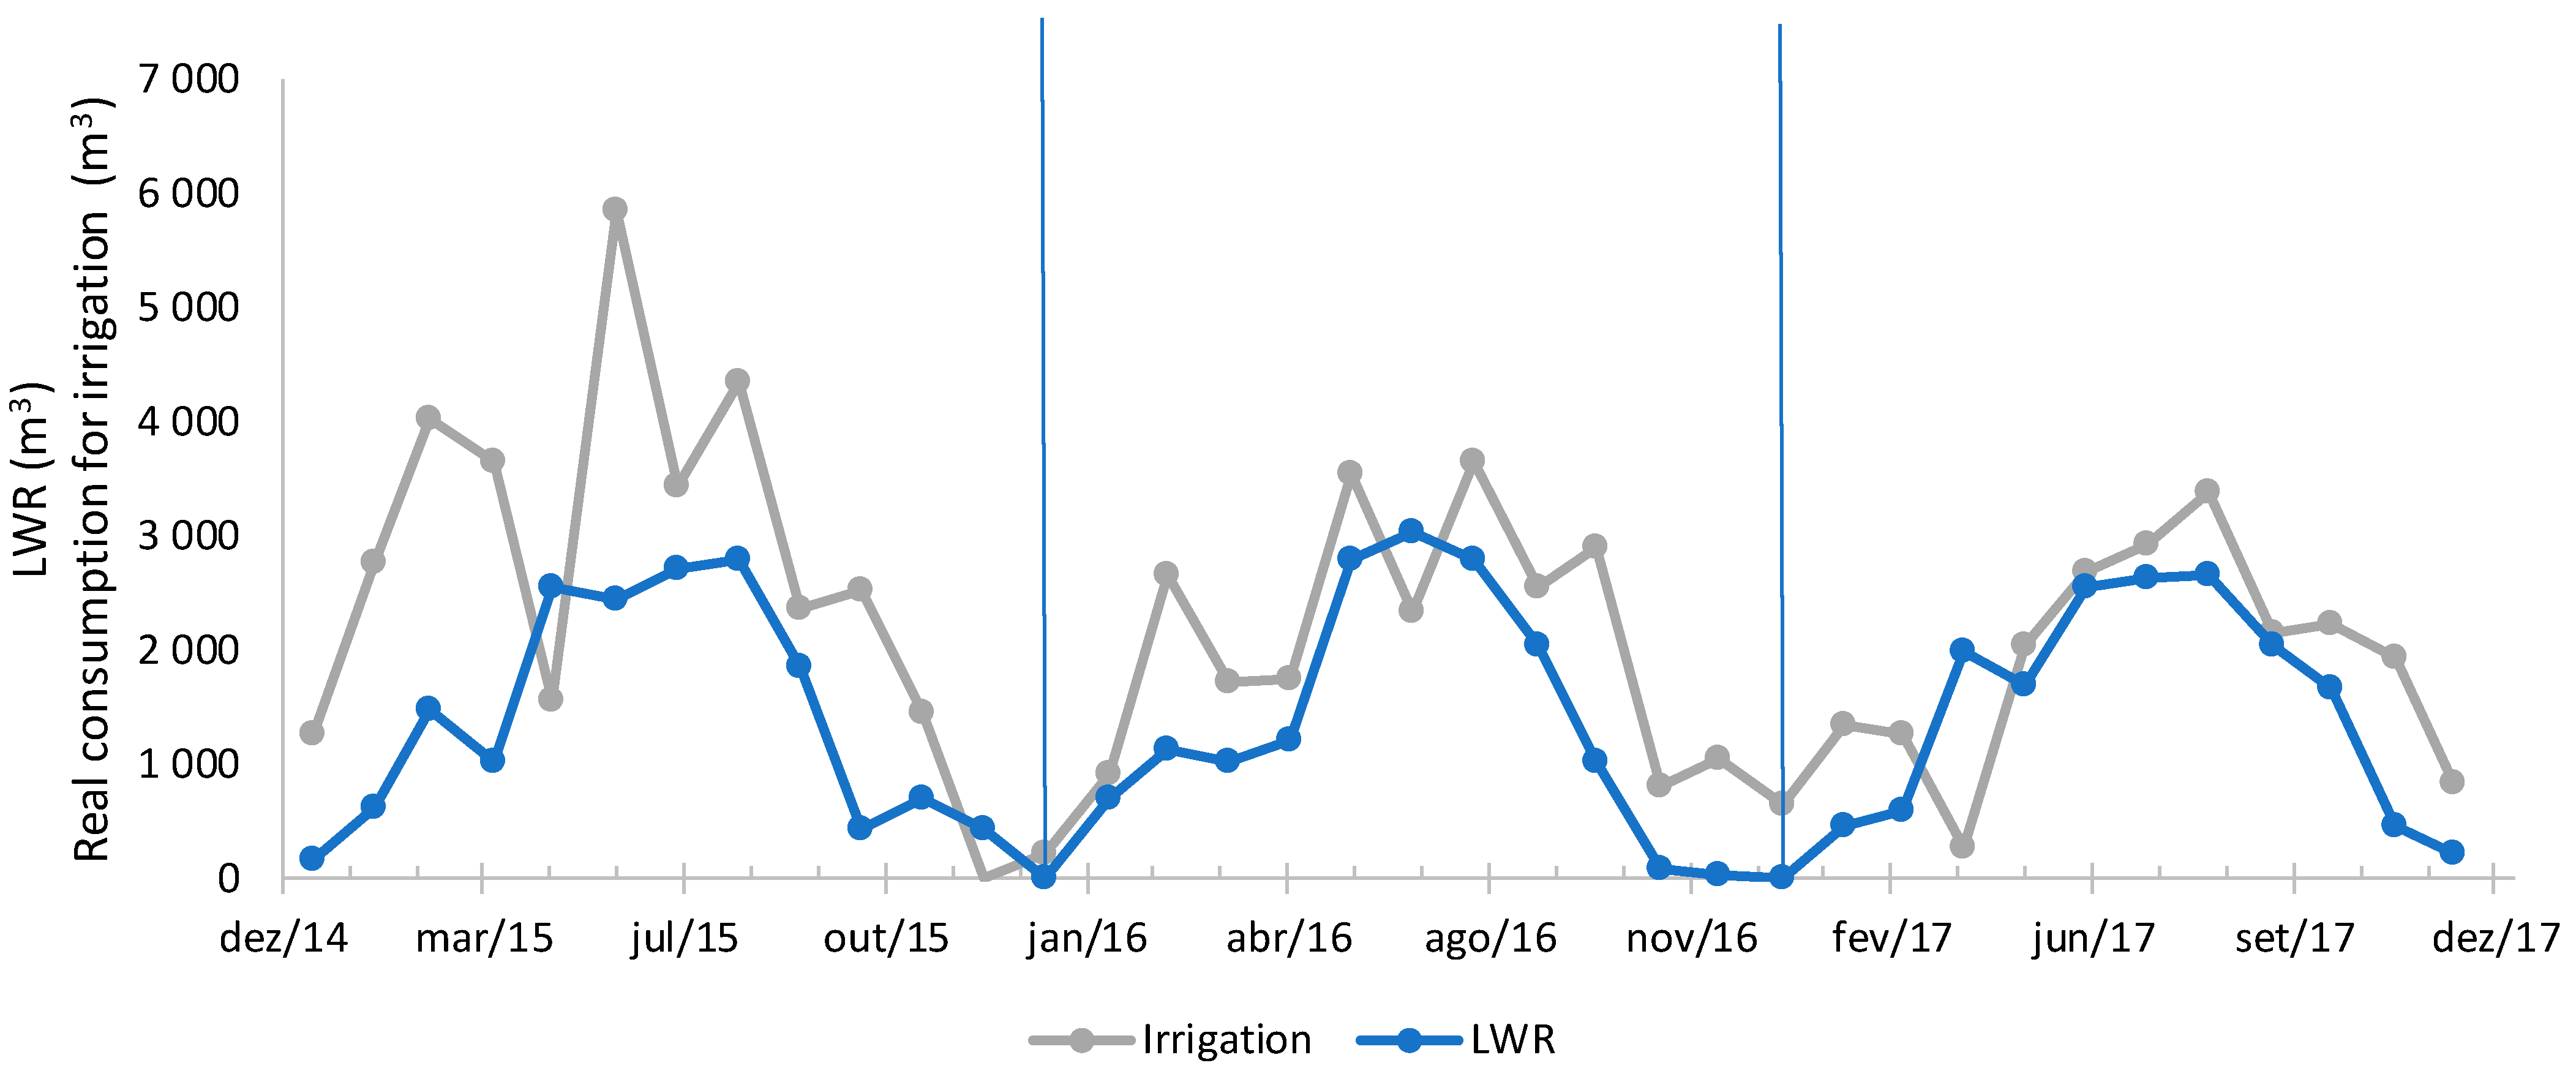
4.1. Water Balance Application to Case Study 1

The proposed yearly water balance is applied to case study 1 for 2017, 2018 and 2019. Landscape water requirements are computed for each month, making use of available reference evapotranspiration data for the region and summed for annual estimation.
Some assumptions regarding the calculation of the water balance components have been considered. The unauthorized consumption is considered null due to the extremely low probability of existing illegal connections given the existing high security in the area. The metering inaccuracies are considered equal to 2% of the system input volume for the three years, which corresponds to typical average values used for these type of meters. Due to the lack of information regarding the water losses in the pressurized irrigation system, these losses are estimated together with the irrigation losses. The system input volume is the sum of all metered water volumes by the 20 irrigation meters.
The results of the water balance for the three years (Figure 5) show that the water losses have decreased over the years from 45% to 30% of the system input volume. Accordingly, the irrigation efficiency described by Equation (2) has increased from 55% in 2017 and 57% in 2018 to 70% in 2019, gradually approaching to the irrigation needs. This improvement, particularly evident from 2018 to 2019, is due to the installation of the smart irrigation system in the beginning of 2019 that manages the irrigation according to the plant needs and to the weather conditions. However, a higher efficiency was not achieved since it used a reference meteorological station located in Faro (not a local one) and it did not have any measurement of the existing humidity in the soil; thus, it could not accurately estimate the vegetation needs. Additionally, the system estimated a single vegetation need and not adjusted it to the type of plant (i.e., turf grass and flowerbeds).
Annual variations in the system input volume and in the effective water used for the irrigation (i.e., LWR) are in agreement with observed variations of the precipitation and evapotranspiration. LWR in 2018 is the lowest within the analysed three-year period due to the highest precipitation (529 mm) in this year compared to 2017 (317 mm) and 2019 (229 mm). In 2019, due to lower precipitation, LWR increases but the system input volume does not increase proportionally, due to a more efficient water use and less water losses. This corresponds to the year 2019, when the smart irrigation system began to operate, and demonstrates that this smart system effectively reduces water losses.
The calculation of the water balance allows for a more systematic analysis of the water consumption and efficiency of its use in the green spaces. Overall, the results show that almost half of the water consumed in 2017 is lost due to over-irrigation, which was halved in 2019 thanks to the smart irrigation system. Over the studied period, the water consumed for irrigation approaches the water requirements of the green space, particularly in the drier months, from June to September, although there is still potential for more water savings (Figure 6).
Further investigations should focus on a detailed analysis of the irrigation efficiency in the areas associated with each irrigation meter, in order to identify possible local inefficiencies, as well as on the development of an irrigation algorithm that both integrates the meteorological and the soil humidity conditions.

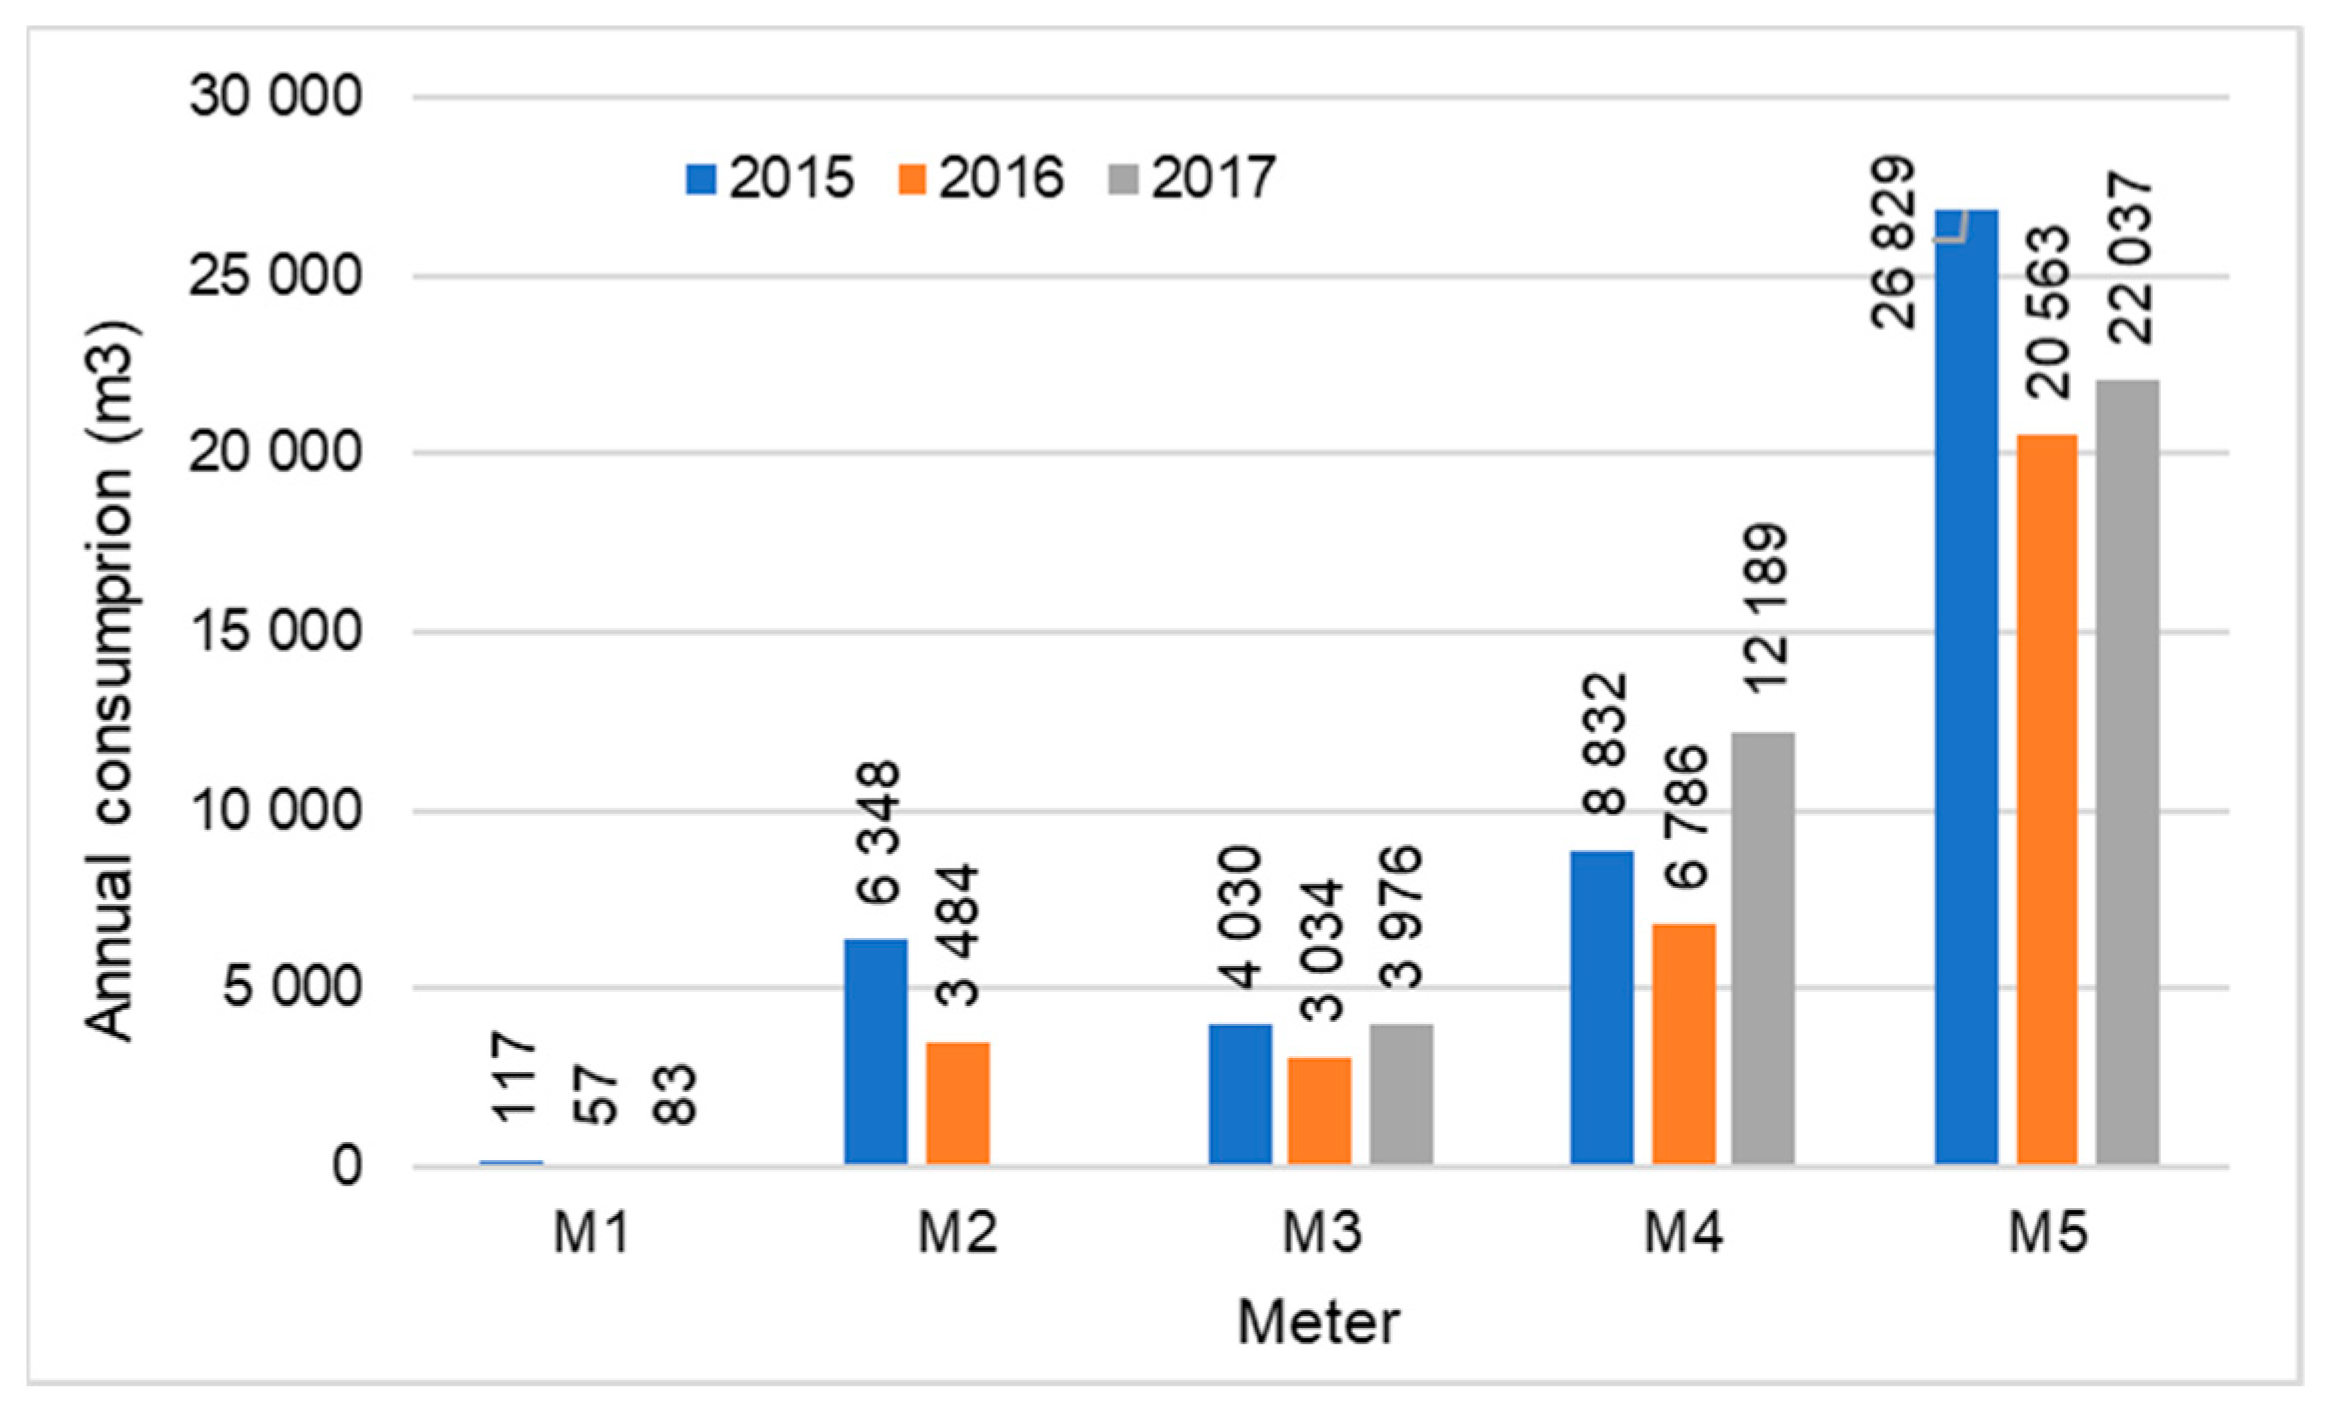
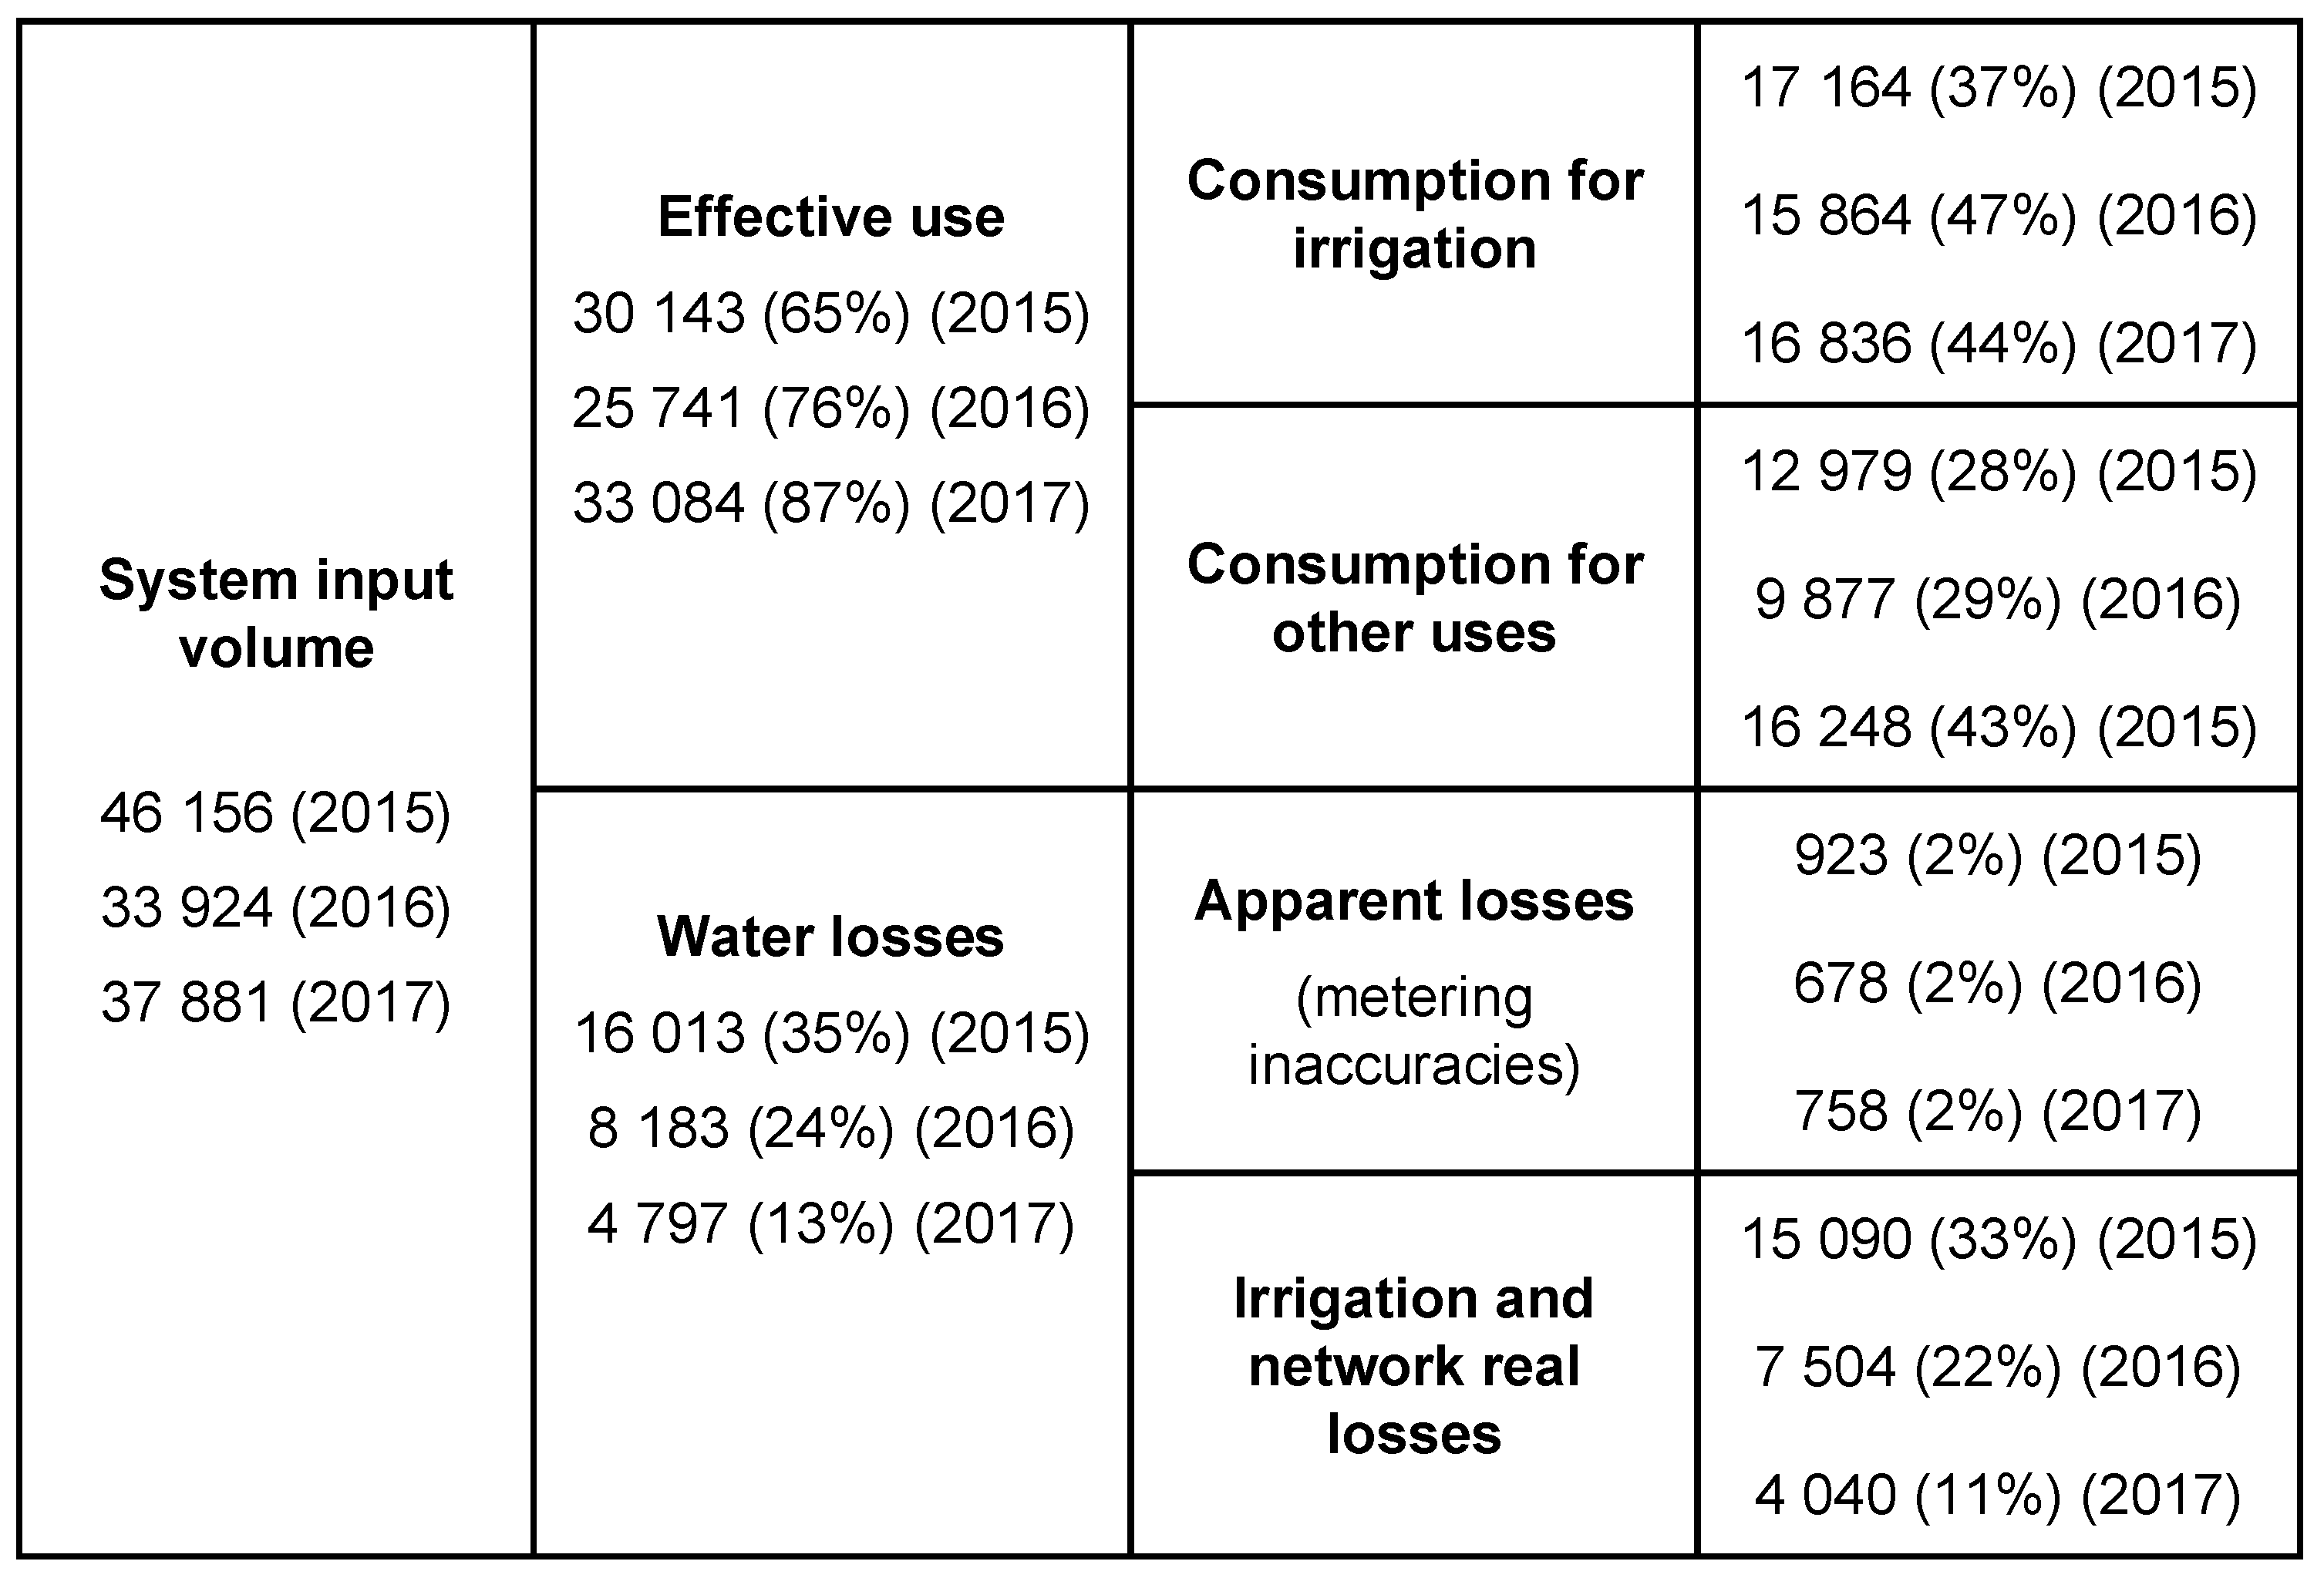
4.2. Water Balance Application to Case Study 2

The proposed water balance is applied to case study 2 for 2015, 2016 and 2017 (Figure 7). LWR is computed for each month, using local data for climatic parameters. The unauthorized consumption is considered null due to the inexistence of illegal connections within the fenced park. The metering inaccuracies are also considered equal to 2% of the system input volume for the three years. The water losses in the irrigation pipe system due to leaks and ruptures are estimated together with the irrigation losses.
Consumption in the park is measured in five flow meters, M1 to M5, in a monthly or bimonthly basis. According to the water utility knowledge, three of the meters measure only the consumption for other uses (M1, M3 and M4), whereas the remaining two measure the input water volume for irrigation (M2 and M5). The measured annual water volumes are presented in Figure 7, in which irrigation represents, on average, 67% of water consumption in the park.
The annual water balances are calculated for each of the three years (Figure 8). Results show that the water losses have decreased from 36% in 2015 to 13% of the system input volume, even though irrigation practices are not based on smart systems. There are two main reasons for the decrease of water losses. The primary reason is that irrigation is dictated by the empirical knowledge of garden workers that have become increasingly more aware of the need for water savings in a context of scarcity and that have taken more efficient irrigation practices, manually adjusting the time and duration of the irrigation process. The second reason is the uncertainty associated with the consumption for other uses that was estimated based on the measurement of three meters that are believed to uniquely supply the existing infrastructures; though civil works have taken place in the park in the last 5 years and some parts of the irrigation network might have be connected to these meters.
The water balance also shows that the percentage of water consumed for other uses than irrigation is quite high (varying between 27% and 43% of the system input volume) and increases over the years in an inverse trend to that of the consumption for irrigation. It must be noticed that this consumption was calculated based on metered water volumes; hence, all the inefficiencies associated with the many water uses (e.g., a dripping tap in a museum toilet) are included in this component.
For a more comprehensive analysis of the irrigation efficiency, the monthly water volumes consumed for irrigation, metered by the dedicated meters of the irrigation system, are also compared with the estimated overall LWR of the park (Figure 9). The results show that the water consumed for irrigation is much more than that needed in 2015 but approaches LWR in 2017. The irrigation efficiency, defined as the ratio between LWR and the real water consumption for irrigation, increases from 52% in 2015 to 56% in 2016 and then, to 78% in 2017, which is similar to that observed in case study 1.
The application of the water balance to the park allows concluding that the irrigation efficiency is good, even though there are no smart irrigation system and that further analysis on water efficiency in the park should focus on the analysis of the effective use of water in other water uses.

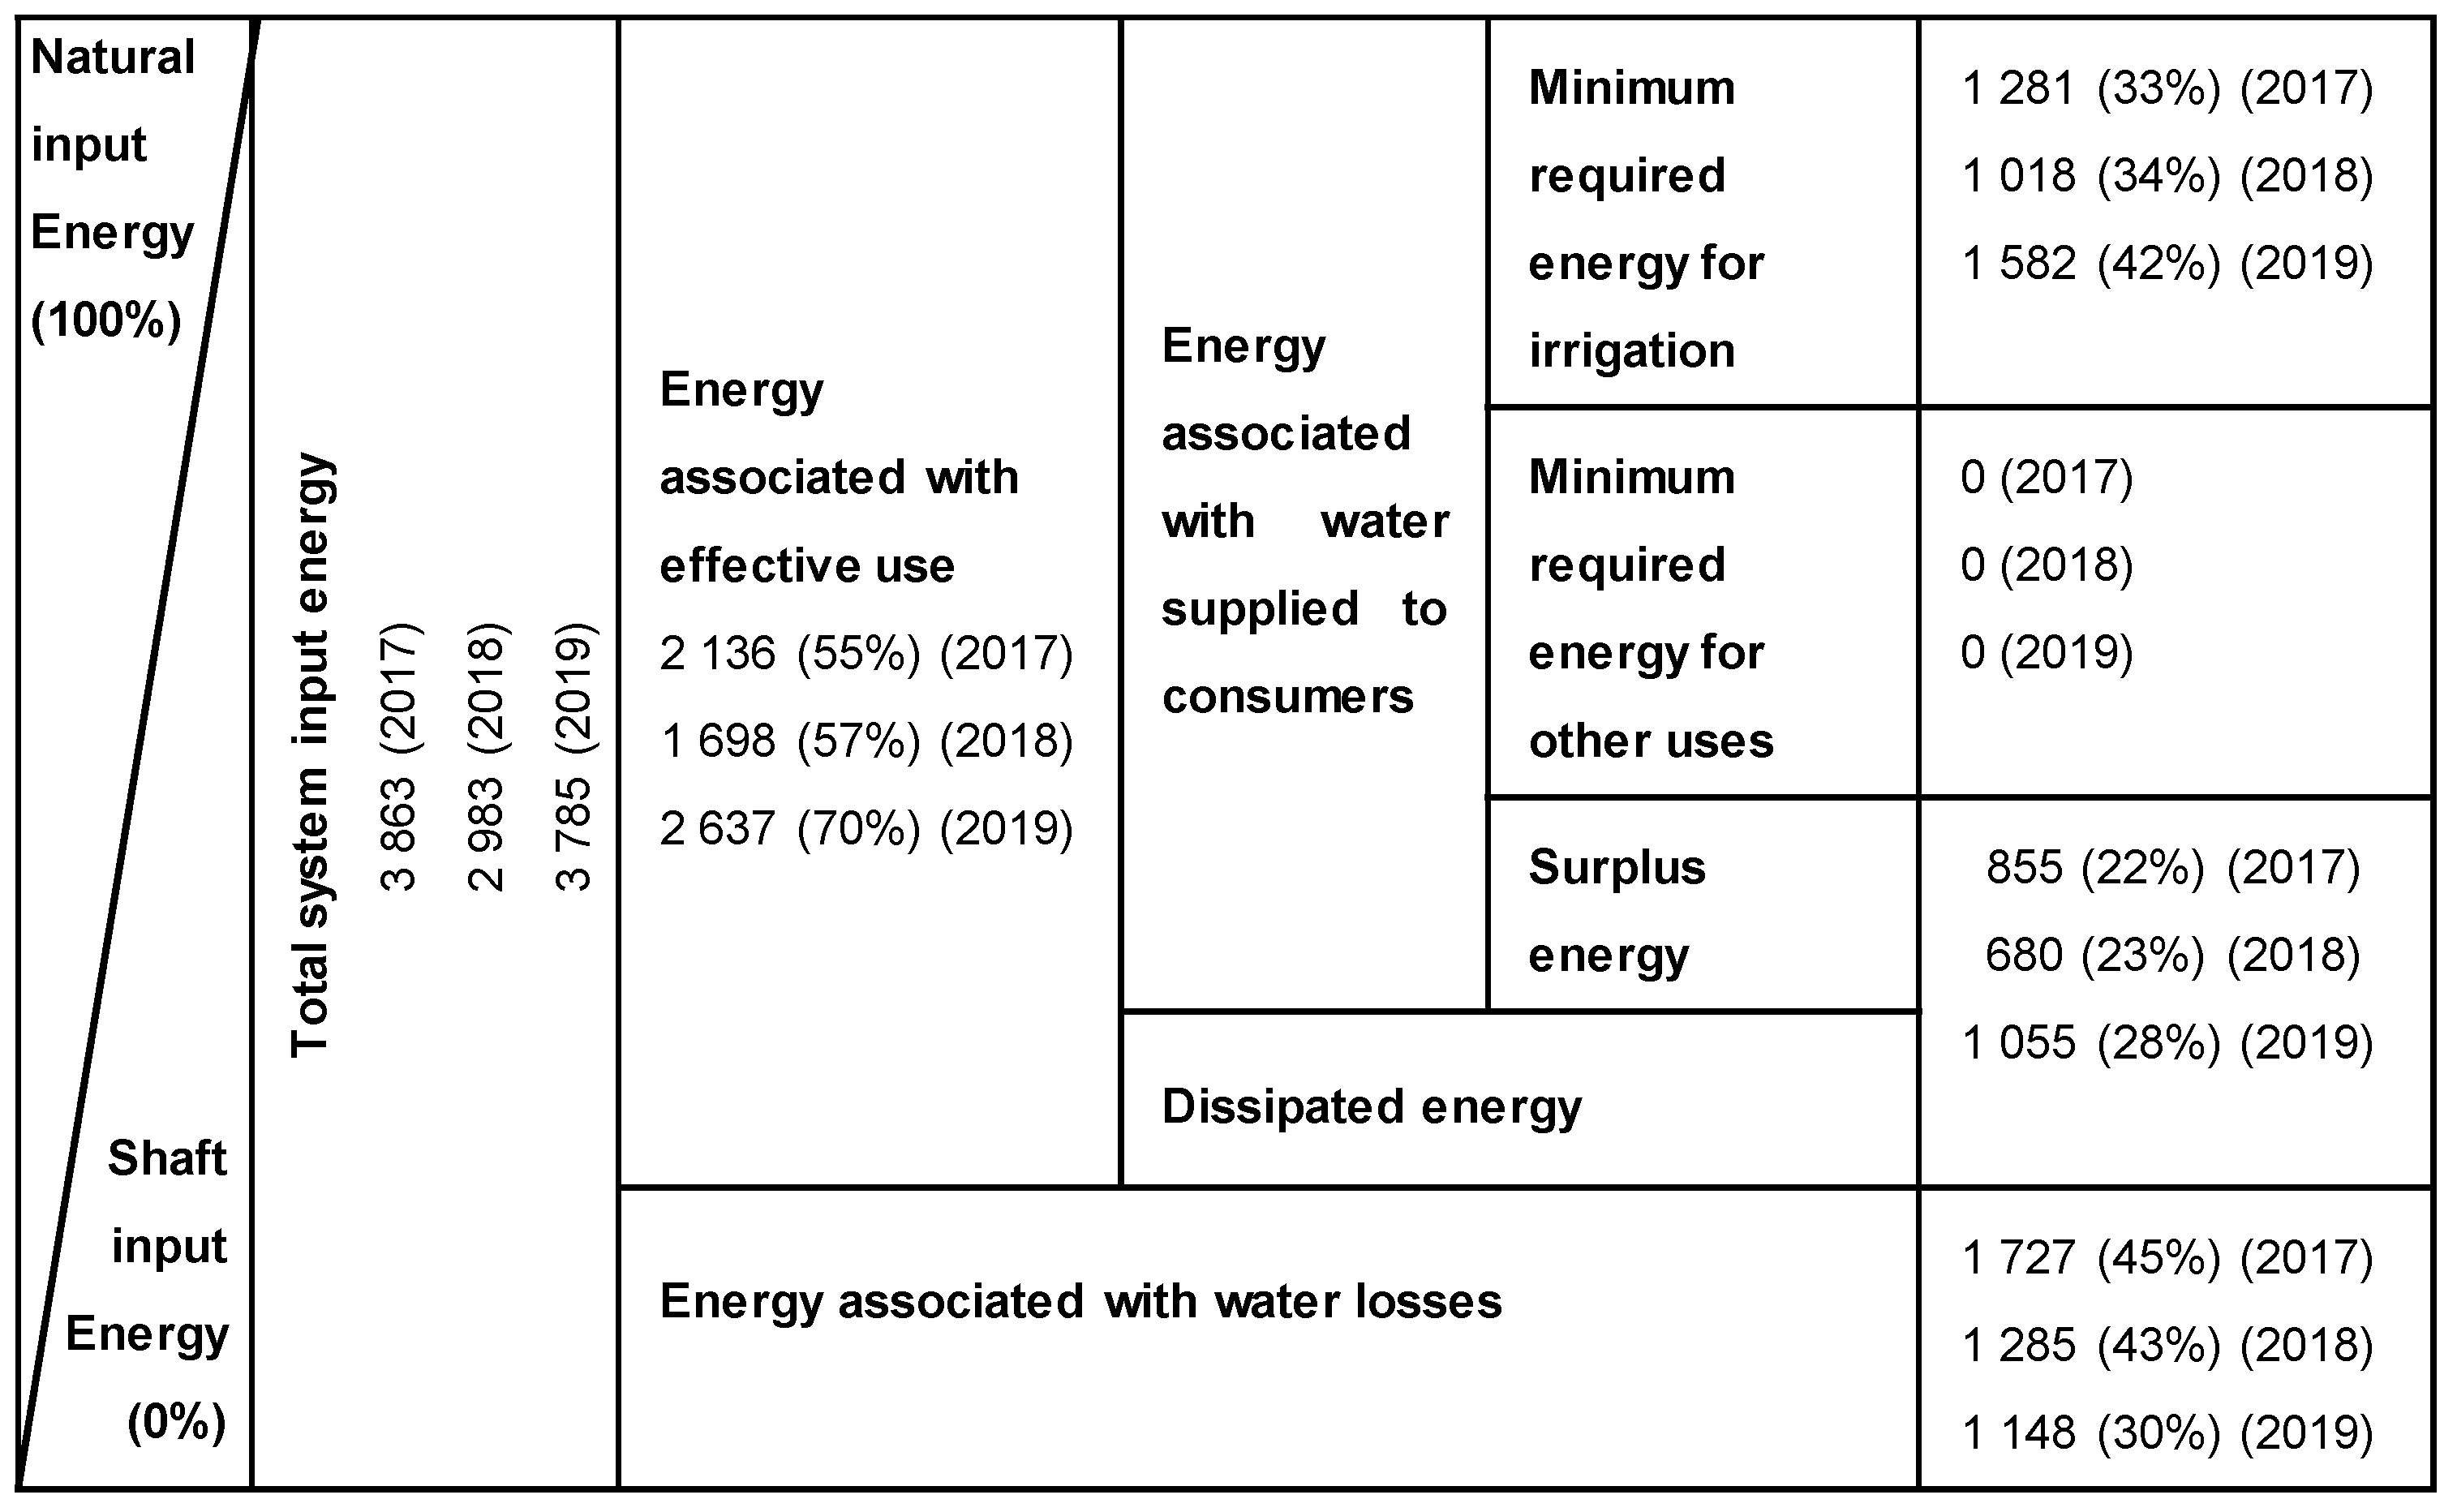
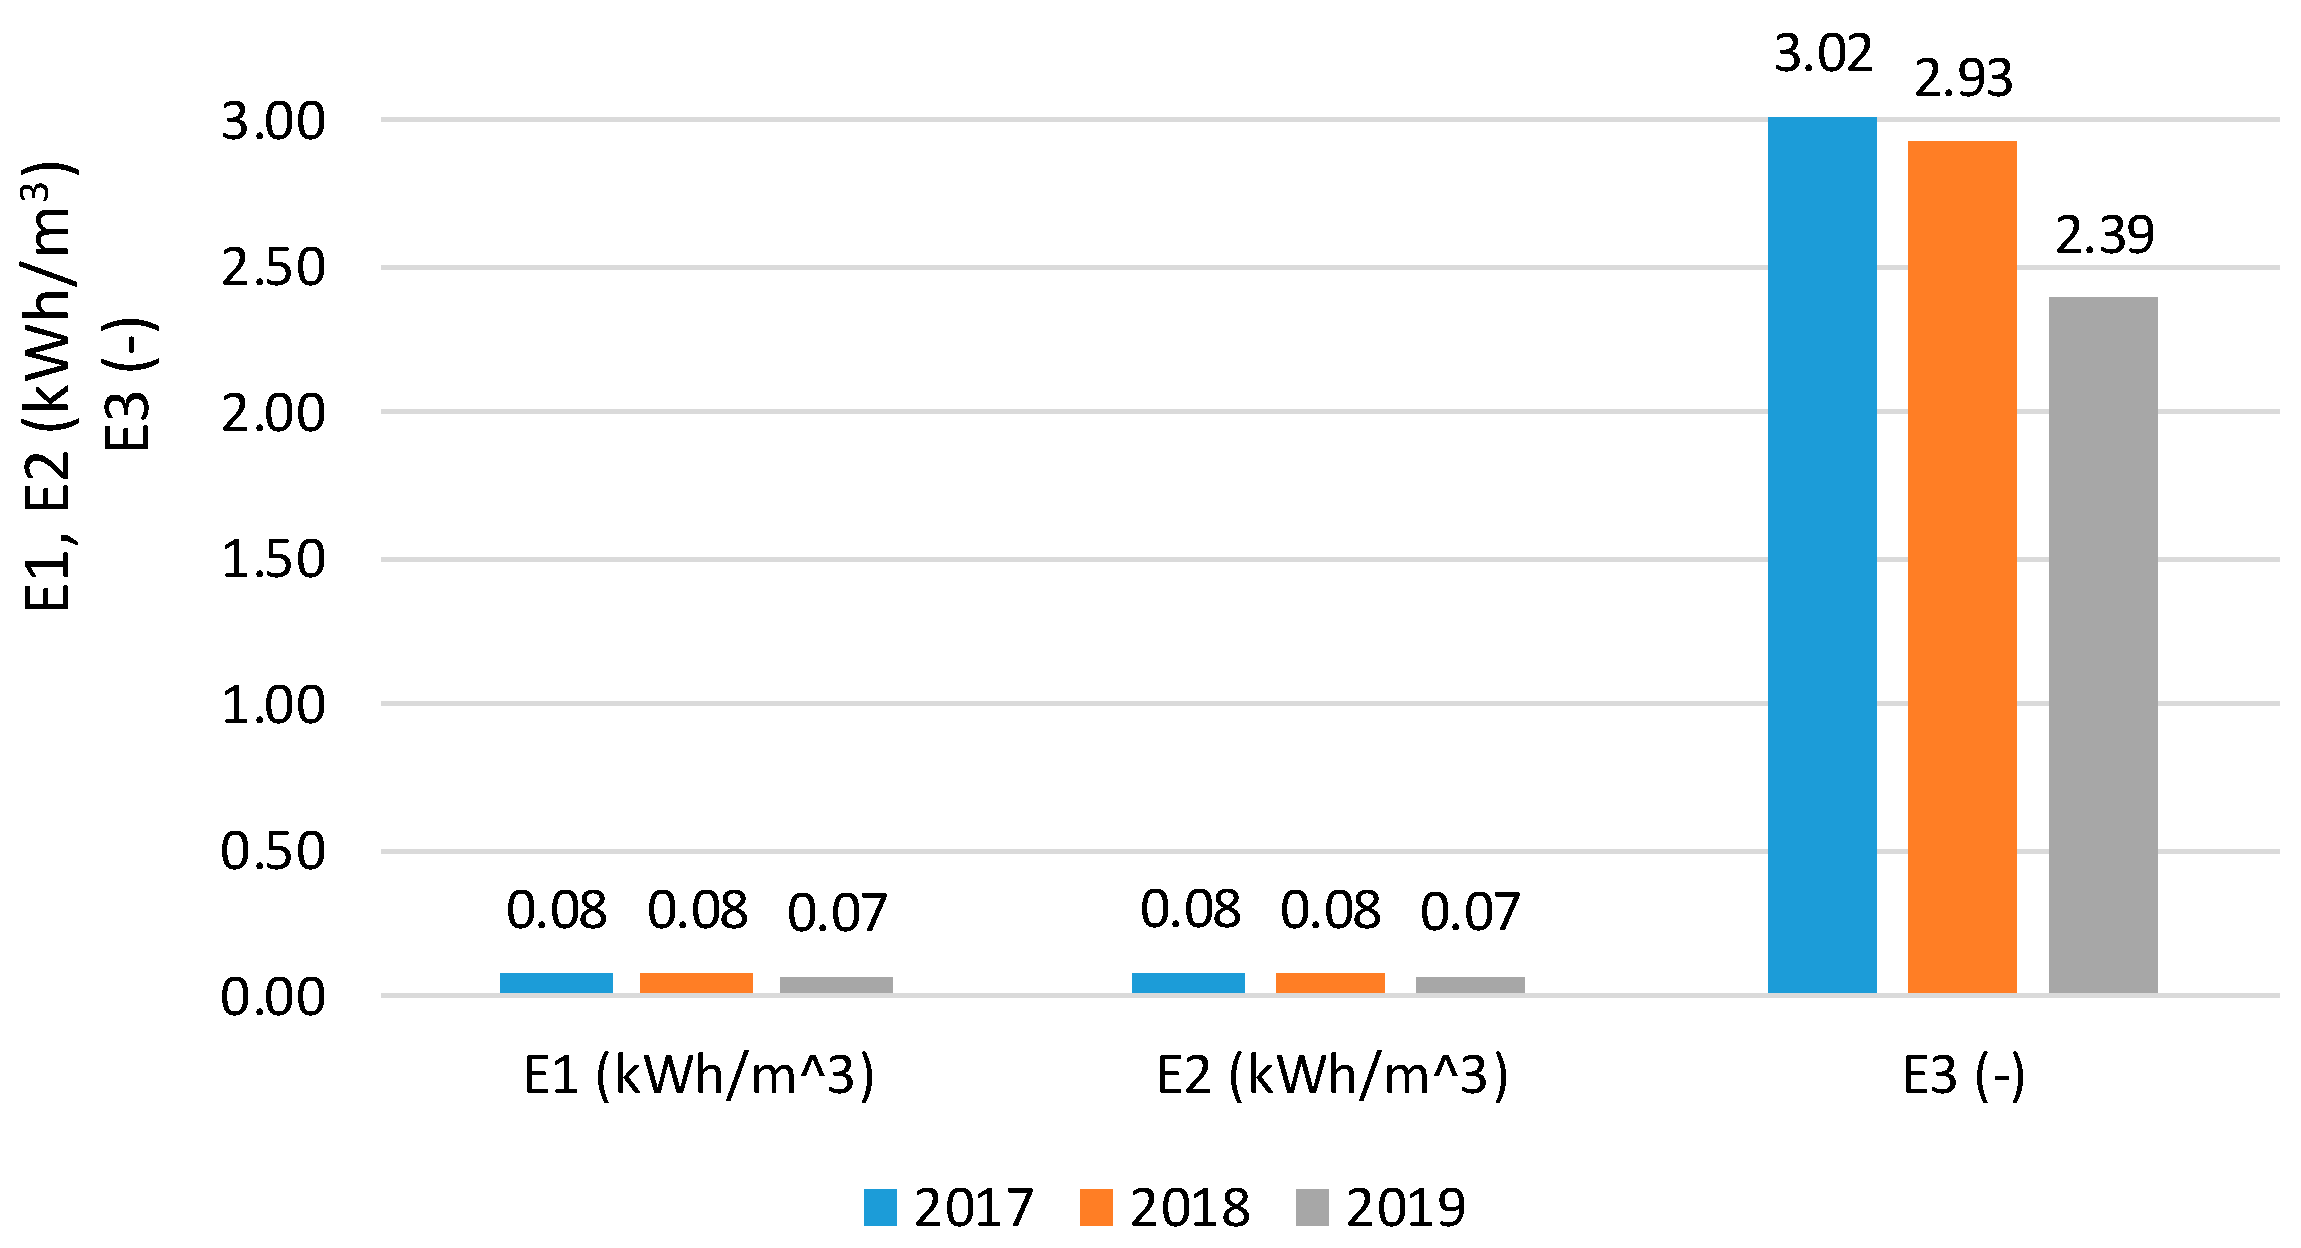
4.3. Water–Energy Balance Application to Case Study 1

The methodology proposed for the water–energy balance in urban green spaces is applied to case study 1 for the years 2017, 2018 and 2019. Because the irrigation system is supplied by the drinking water distribution network, all the input energy of the irrigation system is pressurized energy (natural input energy) and there is no shaft input energy. The water–energy balance components are calculated by Equations (3)–(7) for the three analysed years (Figure 10).
The energy losses associated with the water losses, either due to irrigation inefficiencies or due to leaks in the irrigation system pipes, vary between 30% and 45% of the system input energy. Hence, a significant part of the energy that is supplied to the urban green space by the drinking water network is lost due to water losses. The water–energy balance also shows that the increase in the irrigation efficiency from 2017 to 2019 is accompanied by an increase in energy efficiency, as less water and its embedded energy is wasted.
The water–energy balance also shows that the irrigation system is supplied with much more energy than that needed, as the minimum required energy for irrigation is of only 33% to 42% of the input energy. Concomitantly, 22% to 28% of the input energy is supplied in excess or dissipated at the sprinklers. These results suggest that part of the energy consumed upstream for assuring high pressures in the drinking water network is, then, lost in the urban green space. For that reason, the pressure at the inlet node of the irrigation system should be lower, only slightly exceeding the necessary pressure at the sprinklers. Alternatively, the green spaces could benefit from recovering part of the excess hydro energy in the irrigation systems [31] that could then be locally consumed (e.g., for supplying the smart irrigation systems’ equipment).
In order to better assess the energy efficiency of the irrigation system, performance indicators E1, E2 and E3 given by Equations (8)–(10), often computed to assess energy efficiency of water supply systems, are also calculated (Figure 11). The results show that the performance indicators E1 and E2, which represent the energy in excess per volume of input water (E1) or per effectively used water (E2), are very low and very similar. Only a slight decrease is noticed in 2019, as a result of the water efficiency measures. The lack of benchmarking values for comparing the obtained indicators hampers the evaluation of the energy efficiency of the irrigation system based on such indicators. Overall, E1 and E2 are very small when compared with those of water supply systems [32], which is likely due to the much smaller length and diameters of the irrigation networks. Regarding the performance indicator E3, which allows assessing how much energy is being supplied in comparison with the minimum required energy, a significant decrease from 3.02 to 2.39 is observed. This is in agreement with the previous observations of energy efficiency improvement from 2017 to 2019 due to the decrease in water losses. For water supply systems, the E3 value should be in the range of 1 to 2 (ideally, equal to 1), which shows that, despite the reduction in water losses, energy efficiency of the irrigation systems requires further measures, in particular, those that address the reduction or the recovery of the excess of supplied water–energy.

5. Conclusions

A methodology to calculate water and water–energy balances for urban green spaces is proposed. The methodology is demonstrated with two urban green spaces of different nature: a modern green space with a smart irrigation system and a typical urban green park. The proposed balances are based on the existing balances for water supply systems and for collective irrigation systems to which several changes have been introduced to specifically tailor them to the water uses in the green spaces.
The proposed water balance to the green spaces allows assessing the irrigation efficiency in the green spaces over the years, the effectiveness of water saving measures (e.g., smart irrigation systems or empirically–based irrigation practices) and the importance of other water uses (e.g., toilets, cafes) in the overall water consumption of green areas. The water balance helps in identifying the most adequate measures for a more efficient water use in the urban green spaces. The application of the two case studies has demonstrated that smart irrigation systems can significantly increase irrigation efficiency from inadequate (IE < 60%) to reasonable or good (IE > 60%); however, good efficiencies (IE > 80%) require the installation a meteorological station in situ and monitoring of the soil humidity in order to more accurately estimate the plant irrigation needs. On the other hand, reasonable or good irrigation efficiencies (IE > 60%) can also be attained with empirical knowledge of gardeners that can manually adjust the time and duration of the irrigation process.
The application of the proposed water–energy balance demonstrates that water efficiency measures have a direct and positive impact in the energy efficiency of the irrigation systems. Additionally, the water–energy performance indicator E3 shows that the irrigation systems are supplied with more than twice the energy needed, even after reducing water losses, thus suggesting additional measures for energy efficiency improvement other than those targeting water savings, such as the reduction of the supplied pressure or the water–energy harvesting by the installation of pico-energy recovery devices.
The proposed water and water–energy balances are valuable tools for assessing water use and energy efficiency in urban green spaces, highlighting the water inefficiencies and allowing the identification of the most adequate measures, thus contributing to a better water and energy management in urban green spaces.
This study has been applied to two green infrastructures in Portugal: one green area located in Algarve region composed of turf grass area irrigated with sprinklers and flowerbeds with drip-irrigation; and a second park covered with shrubs, herbaceous and flowers irrigated via micro-irrigation, though with other uses within the park (toilets, cafes). The water and water–energy balances should be further applied to other different case studies, with different types of vegetation and with other infrastructures, so that lessons learnt could be used for establishing a set of best practice recommendation for saving both water and energy, namely, the selection of low-water demand species and the use of more efficient irrigation systems. Another very relevant inefficiency in green infrastructures, often forgotten, is the water loss in undetected leaks and bursts in the pipe irrigation system; thus, efforts should be done to assess the importance of this component in irrigated areas by measuring the minimum night flows as well as to control it by reducing operating pressures or closing inlet valves when irrigation is not necessary.

Author Contributions

Conceptualization, D.C. and L.M.; methodology, D.C. and L.M.; formal analysis, R.C.; data curation, R.C.; writing—original draft preparation, L.M. and D.C.; writing—review and editing, L.M. and D.C.; project administration, D.C.; funding acquisition, D.C. All authors have read and agreed to the published version of the manuscript.

Funding

This research and the APC were funded by the Fundação para a Ciência e a Tecnologia, grant number PTDC/HAR-HIS/28627/2017.

Data Availability Statement

Data can be provided on-demand to the corresponding author.

Acknowledgments

The authors acknowledge the Fundação para a Ciência e Tecnologia (FCT) for funding the research project Horto Aquam Salutarem: Water Wise Management in Gardens in the Early Modern Period, grant number PTDC/HAR-HIS/28627/2017. The authors also acknowledge the Câmara Municipal de Cascais and Infralobo-Empresa de Infraestruturas de Vale do Lobo, E.M. for providing the case studies for this research.

Conflicts of Interest

The authors declare no conflict of interest.

References

  1. Barbesgaard, M. Blue growth: Savior or ocean grabbing? J. Peasant Stud. 2018, 45, 130–149. [Google Scholar] [CrossRef]
  2. Walters, G.; Janzen, C.; Maginnis, S. Nature-Based Solutions to Address Global SOCIETAL Challenges; ICUN: Gland, Switzerland, 2016; ISBN 9782831718125. [Google Scholar]
  3. Geneletti, D.; Zardo, L. Ecosystem-based adaptation in cities: An analysis of European urban climate adaptation plans. Land Use Policy 2016, 50, 38–47. [Google Scholar] [CrossRef] [Green Version]
  4. Chatzimentor, A.; Apostolopoulou, E.; Mazaris, A.D. A review of green infrastructure research in Europe: Challenges and opportunities. Landsc. Urban Plan. 2020, 198, 103775. [Google Scholar] [CrossRef]
  5. WHO. Urban Green Spaces: A Brief for Action; WHO: Geneva, Switzerland, 2017. [Google Scholar]
  6. Vicuña, S.; Gil, M.; Melo, O.; Donoso, G.; Merino, P. Water option contracts for climate change adaptation in Santiago, Chile. Water Int. 2018, 43, 237–256. [Google Scholar] [CrossRef] [Green Version]
  7. USEPA. Water Efficiency Management Guide. Landscaping and Irrigation; USEPA: Washington, DC, USA, 2017. [Google Scholar]
  8. Nouri, H.; Chavoshi Borujeni, S.; Hoekstra, A.Y. The blue water footprint of urban green spaces: An example for Adelaide, Australia. Landsc. Urban Plan. 2019, 190, 103613. [Google Scholar] [CrossRef]
  9. Ruíz-Pérez, M.R.; Alba-Rodríguez, M.D.; Marrero, M. The water footprint of city naturalisation. Evaluation of the water balance of city gardens. Ecol. Model. 2020, 424, 109031. [Google Scholar] [CrossRef]
  10. Lisboa E-Nova. Matriz da Agua de Lisboa; Lisboa E-Nova: Lisboa, Portugal, 2015. [Google Scholar]
  11. Ayuntamiento de Madrid. Plan Municipal de Gestion de la Demanda de Agua en la Ciudad de Madrid; Ayuntamiento de Madrid: Madrid, Spain, 2012. [Google Scholar]
  12. Parés-Franzi, M.; Saurí-Pujol, D.; Domene, E. Evaluating the environmental performance of urban parks in Mediterranean cities: An example from the Barcelona Metropolitan Region. Environ. Manag. 2006, 38, 750–759. [Google Scholar] [CrossRef]
  13. Shi, Y.; Yang, G.; Du, Y.; Ren, Y.; Lu, Y.; Fan, L.; Chang, J.; Ge, Y.; Bao, Z. Estimating irrigation water demand for green spaces in humid areas: Seeking a sustainable water management strategy. Urban Water J. 2018, 15, 16–22. [Google Scholar] [CrossRef]
  14. Litvak, E.; Bijoor, N.S.; Pataki, D.E. Adding trees to irrigated turfgrass lawns may be a water-saving measure in semi-arid environments. Ecohydrology 2014, 7, 1314–1330. [Google Scholar] [CrossRef]
  15. Nouri, H.; Beecham, S.; Kazemi, F.; Hassanli, A.M. A review of ET measurement techniques for estimating the water requirements of urban landscape vegetation. Urban Water J. 2013, 10, 247–259. [Google Scholar] [CrossRef]
  16. Reyes-Paecke, S.; Gironás, J.; Melo, O.; Vicuña, S.; Herrera, J. Irrigation of green spaces and residential gardens in a Mediterranean metropolis: Gaps and opportunities for climate change adaptation. Landsc. Urban Plan. 2019, 182, 34–43. [Google Scholar] [CrossRef]
  17. Canales-Ide, F.; Zubelzu, S.; Rodríguez-Sinobas, L. Irrigation systems in smart cities coping with water scarcity: The case of valdebebas, Madrid (Spain). J. Environ. Manag. 2019, 247, 187–195. [Google Scholar] [CrossRef]
  18. Gupta, A.D.; Pandey, P.; Feijóo, A.; Yaseen, Z.M.; Bokde, N.D. Smart water technology for efficient water resource management: A review. Energies 2020, 13, 6268. [Google Scholar] [CrossRef]
  19. Crosson, C.; Tong, D.; Zhang, Y.; Zhong, Q. Rainwater as a renewable resource to achieve net zero urban water in water stressed cities. Resour. Conserv. Recycl. 2021, 164, 105203. [Google Scholar] [CrossRef]
  20. Caetano, F.; Pitarma, R.; Reis, P. Intelligent management of urban garden irrigation. In Proceedings of the 9th Iberian Conference on Information Systems and Technologies (CISTI), Barcelona, Spain, 18–21 June 2014; p. 6. [Google Scholar]
  21. Silva, M.D.F.M.E.; Calijuri, M.L.; Sales, F.J.F.; Souza, M.H.B.; Lopes, L.S. Integration of technologies and alternative sources of water and energy to promote the sustainability of urban landscapes. Resour. Conserv. Recycl. 2014, 91, 71–81. [Google Scholar] [CrossRef]
  22. United Nations. New Urban Agenda; United Nations: New York, NY, USA, 2017; ISBN 9789211327311. [Google Scholar]
  23. Lambert, A.; Hirner, W. Losses from Water Supply Systems: Standard Terminology and Recommended Performance Measures; IWA Publishing: London, UK, 2000. [Google Scholar]
  24. Mamade, A.; Loureiro, D.; Alegre, H.; Covas, D. Top-down and bottom-up approaches for water–energy balance in Portuguese supply systems. Water 2018, 10, 577. [Google Scholar] [CrossRef] [Green Version]
  25. Glenn, D.T.; Endter-Wada, J.; Kjelgren, R.; Neale, C.M.U. Tools for evaluating and monitoring effectiveness of urban landscape water conservation interventions and programs. Landsc. Urban Plan. 2015, 139, 82–93. [Google Scholar] [CrossRef] [Green Version]
  26. Cunha, H.; Loureiro, D.; Sousa, G.; Covas, D.; Alegre, H. A comprehensive water balance methodology for collective irrigation systems. Agric. Water Manag. 2019, 223, 105660. [Google Scholar] [CrossRef]
  27. Costello, L.R.; Matheny, N.P.; Clark, J.R. Estimating the irrigation water needs of landscape plantings in California: The landscape coefficient method. In A Guide to Estimating Irrigation Water Needs of Landscape Plantings in California; University of California Press: Berkeley, CA, USA, 2000; p. 52. [Google Scholar]
  28. USEPA. Water Budget Approach; USEPA: Washington, DC, USA, 2014. [Google Scholar]
  29. Shojaei, P.; Gheysari, M.; Myers, B.; Esmaeili, H. Quantifying microclimatic conditions: An attempt to more accurately estimate urban landscape water requirements. Urban For. Urban Green. 2020, 54, 126767. [Google Scholar] [CrossRef]
  30. AL-Washali, T.; Sharma, S.; Lupoja, R.; AL-Nozaily, F.; Haidera, M.; Kennedy, M. Assessment of water losses in distribution networks: Methods, applications, uncertainties, and implications in intermittent supply. Resour. Conserv. Recycl. 2020, 152, 104515. [Google Scholar] [CrossRef]
  31. Pérez-Sánchez, M.; Sánchez-Romero, F.J.; Ramos, H.M.; López-Jiménez, P.A. Energy recovery in existing water networks: Towards greater sustainability. Water 2017, 9, 97. [Google Scholar] [CrossRef] [Green Version]
  32. Mamade, A.; Loureiro, D.; Alegre, H.; Covas, D. A comprehensive and well tested energy balance for water supply systems. Urban Water J. 2017, 14, 853–861. [Google Scholar] [CrossRef]
Figure 1. Proposed water balance for urban green spaces (m3/year).
Energies 14 05490 g001
Figure 2. Proposed water–energy balance for urban green spaces (kWh/year).
Energies 14 05490 g002
Figure 3. Case study 1: landscape and system boundaries.
Energies 14 05490 g003
Figure 4. Case study 2: landscape and system boundaries.
Energies 14 05490 g004
Figure 5. Water Balance for Case study 1 in 2017, 2018 and 2019 (m3/year).
Energies 14 05490 g005
Figure 6. Landscape water requirements and system input volume in case study 1 in 2017, 2018 and 2019.
Energies 14 05490 g006
Figure 7. Measured water volumes in 2015, 2016 and 2017 (m3/year).
Energies 14 05490 g007
Figure 8. Water Balance for Case study 2 in 2015, 2016 and 2017 (m3/year).
Energies 14 05490 g008
Figure 9. Landscape water requirements and system input volume in case study 2 in 2015, 2016 and 2017.
Energies 14 05490 g009
Figure 10. Water–energy Balance for Case study 1 in 2017, 2018 and 2019 (kWh/year).
Energies 14 05490 g010
Figure 11. Performance indicators for energy efficiency (case study 1).
Energies 14 05490 g011
Publisher’s Note: MDPI stays neutral with regard to jurisdictional claims in published maps and institutional affiliations.

