
Can Decarbonisation and Capacity Market Go Together? The Case Study of Poland


Mineral and Energy Economy Research Institute of the Polish Academy of Sciences, 31-261 Kraków, Poland
Energies 2021, 14(16), 5151; https://doi.org/10.3390/en14165151
Submission received: 25 June 2021
/
Revised: 28 July 2021
/
Accepted: 18 August 2021
/
Published: 20 August 2021
(This article belongs to the Special Issue Economic and Policy Challenges of the Energy Transition in CEE Countries)
Abstract
:In recent years, numerous countries have introduced or considered capacity markets as remuneration mechanisms for long-term capacity adequacy. Since adequacy is frequently linked with thermal power generation, there is an ongoing debate as to whether this instrument could impact decarbonisation. In this context, the paper presents a quantitative assessment of the consequences of introducing a capacity market on decarbonisation pathways. The Polish power system is taken as an example due to its heavy dependence on fossil fuels. To this end, a computable model of the Polish power system is developed and applied to the study of two research scenarios. The first scenario presents the power system without introducing a capacity market, while the latter considers the system with a capacity market in place. The analysis shows that the introduction of a capacity market delays the decarbonisation of the power system and has a negative impact on carbon neutrality. Even though coal-fired units are phased out, they are mainly replaced by natural gas. The method and model developed within this study can be applied to countries where a capacity market is being discussed, and fossil fuels continue to play a dominant role.
1. Introduction
Decarbonisation of power systems is one of the solutions to the problem of climate change [1]. The phasing-out of conventional power plants and their replacement with renewable generation sources results in a significant decrease in greenhouse gas (GHG) emissions. Although the environmental impact of decarbonisation is noticeable, the energy transition in systems with high penetration of fossil fuels has to consider other factors. The policymakers, transmission system operators, and regulatory bodies are required to ensure energy security [2]. As a result, the decarbonisation processes are different in different countries [3]. Although in Refs. [4,5] the authors indicate that fulfilling the requirements for zero-carbon electricity is possible by 2050, there is a need to investigate the potential in individual countries.
Another trend that has been observed in recent years is ensuring the adequacy of capacity. Apart from the advantages of energy liberalisation [6], the current electricity market design also has numerous failures. The following causes are indicated in the literature [7,8,9]:
- Specific features of electricity compared with other tradable commodities: As energy storage technologies are still costly, demand must be constantly balanced with supply.
- Low short-run price elasticity of demand: Lack of sufficient response of consumers to hourly price fluctuations.
- Increase in renewable capacity, mainly in wind and solar power generation units: Power in these units is generated at lower operating costs than in the case of conventional power plants. In favourable weather conditions, renewable electricity meets the real-time demand in priority. Consequently, the conventional generation units (coal- or gas-fired) generate losses, and market signals do not offer sufficient incentives to come to investment decisions.
- Price cap regulations: The price increase during periods of peak demand is administratively constrained. Therefore, fewer potential market signals occur in these periods than would be expected.
Global experience indicates that energy liberalisation has not met its major ends, and power companies do not receive sufficient revenues to cover their operational and capital costs. The situation where the electricity market revenues are too low to cover the total costs of power generation units is referred to as the missing money problem [10]. The market signals also do not provide a sufficient incentive for investors to build new power units. The lack of investment signals may result in missing capacity in the power system and, consequently, have serious implications for the entire economy and society.
1.1. Capacity Market
To this end, numerous countries have introduced or considered capacity remuneration mechanisms (CRMs), including the capacity market [11]. CRMs are energy policy instruments designed to ensure long-term capacity adequacy [12]. They provide additional remuneration for power companies in compensation for electricity generation in peak demand. They are also considered as instruments that ensure the stability of the power system during decarbonisation [13]. CRMs stimulate not only generation companies but also encourage consumers to reduce their electricity consumption in periods of peak demand. There are two essential categories of CRMs: (i) based on price: capacity payments and (ii) based on volume: strategic reserve, reliability options, capacity obligations, and capacity auctions. These mechanisms are discussed in detail in Refs. [8,10,12,14,15]. These instruments provide additional remuneration for power companies in compensation for electricity generation in peak demand. However, they may extend the economic lifetime of obsolete, usually carbon-intensive, power units.
Authors of Ref. [16] indicate that capacity mechanisms unintentionally favour peaking technologies like coal, oil and gas over wind, solar, or nuclear technologies. In Ref. [17], the authors investigate the impact of the capacity market design on power system decarbonisation in PJM (Pennsylvania-New Jersey-Maryland). The results show that the existing model of the capacity market does not specially target low-emission technologies but can be modified to fulfil the goals of power system decarbonisation. In Ref. [18], the authors review the support policies for renewable energy. Although they list numerous instruments (auctions, feed-in tariffs, and others), they do not mention any capacity remuneration mechanisms. Authors of Ref. [19] also emphasise that current designs of capacity markets do not provide incentives for intermittent renewable generation sources. The study presents a mathematical model that allows one to consider the specific characteristics of renewables in the design of capacity remuneration mechanisms. In Ref. [20], the authors analyse the consequences of the introduction of a capacity market in Poland but focus solely on the economic results. They present the impact of the mechanism on electricity prices.
The literature review indicates that there have been papers analysing the impact of capacity market design on decarbonisation. However, they mainly focus on the benefits of this mechanism to various technologies, especially carbon and non-carbon ones. Moreover, since previous studies mostly concern the short-term (up to five years) effects of capacity market operation, there is a limited number of studies on the long-term (more than ten years) consequences of the introduction of the capacity market, particularly in countries dependent on fossil fuels.
The Polish power system is an interesting case study to investigate the impact of the capacity market operation on the progress of decarbonisation. The capacity market is a relatively new mechanism in Poland, and its impact on hard coal and lignite consumption has not so far been studied. In 2019 the capacity installed in thermal power plants was 34.3 GW (73.4% of total installed capacity), of which the capacity of coal-fired units accounted for 31.5 GW [21]. As a result, the power system is sensitive to climate policies that emphasise the significance of decarbonisation and increasing renewable generation [22]. On the one hand, the policymakers have made decisions supporting the development of renewables [23], energy storage, electromobility, and other concepts aimed at achieving climate neutrality by 2050 [24]. On the other, the government introduced the capacity market to ensure long-term capacity adequacy. Therefore, there is a question of the long-term impact of the introduction of such an instrument on the efficiency of the energy transition of power systems with a high penetration of fossil fuels.
1.2. Study Contributions
In this context, the main objective of the study is to conduct a quantitative assessment of the introduction of the capacity market on hard coal and lignite consumption for electricity generation in the Polish power system up to 2040. For this purpose, a techno-economic model of the Polish power system was developed. The model was formulated as a linear programming problem and implemented in MATLAB software. The impact is assessed by examining and comparing the outcomes under two scenarios: (i) with and (ii) without the operation of the capacity market. The following results are compared and discussed: (i) coal-fired generation capacity in the power system, (ii) electricity generation from coal-fired power generation units, and (iii) the quantity of coal consumption for electricity generation. The changes in electricity prices over the period 2021–40 are also examined.
With this in mind, the study fulfils the research gap identified as a lack of studies on the long-term consequences of the introduction of a capacity market on the decarbonisation of coal-dependent power systems. The work contributes to the existing literature in the following ways. First, it provides a quantitative analysis on the influence of a capacity remuneration mechanism on the fuel mix of power systems with a high penetration of fossil fuels. Second, it provides the findings of the role of a capacity market in the decarbonisation process in such systems. Third, it extends the current studies on the consequences of the operation of a capacity market with a case study of Poland. Finally, the findings contribute to a discussion on the reasonability under environmental regulations of operating a capacity market in power systems dominated by coal-fired generation.
Poland is taken as an example due to the dominant share of fossil fuels in its electricity generation. However, the concept of the study and mathematical formulae can be applied to other countries where fossil fuels are prevalent and capacity remuneration mechanisms are considered or introduced. The main findings can also support the decision-making process in pursuit of carbon neutrality in such power systems.
The author is aware that the study has some limitations. The most important ones are described in this paragraph. The parameters used in the model were chosen as single points based on current reports and the best knowledge of the author. The model is a deterministic model and does not consider the probability distributions for uncertain input data [25,26]. The next step of the study will be to employ the probability distribution of each input parameter and provide ranges of results and the probability of their occurrence.
The study does not consider the adequacy indices (among others, Load of Load Probability (LOLP), Loss of Load Hours (LOLH), or Expected Energy Not Served). The power demand in the entire period of analysis (2021–2040) is based on the Polish Energy Policy until 2040. The document presents the values that include margins required to ensure power system security. However, these indices have been already studied in the previous paper [20] to investigate the economic consequences of introducing the capacity market in Poland.
The remainder of the paper is organised as follows. In Section 2, the approach and mathematical formulae applied in this study are described. This section also shows the scenarios and the assumptions regarding the input data. Section 3 presents the results of the study and discusses the main findings. Finally, conclusions are drawn in Section 4.
2. Materials and Methods
Linear programming is used in this study to assess the impact of the introduction of a capacity market on the decarbonisation of the power system [27]. Section 2.1 describes the methodology developed and employed. This section also presents the conceptual model of the Polish power system. Section 2.2 describes two formulated scenarios and their key assumptions. Section 2.3 presents the transposition of the conceptual model to the mathematical model: equations and inequalities are presented and described. Finally, in Section 2.4, the key assumptions of the input data are shown.
2.1. Methodology
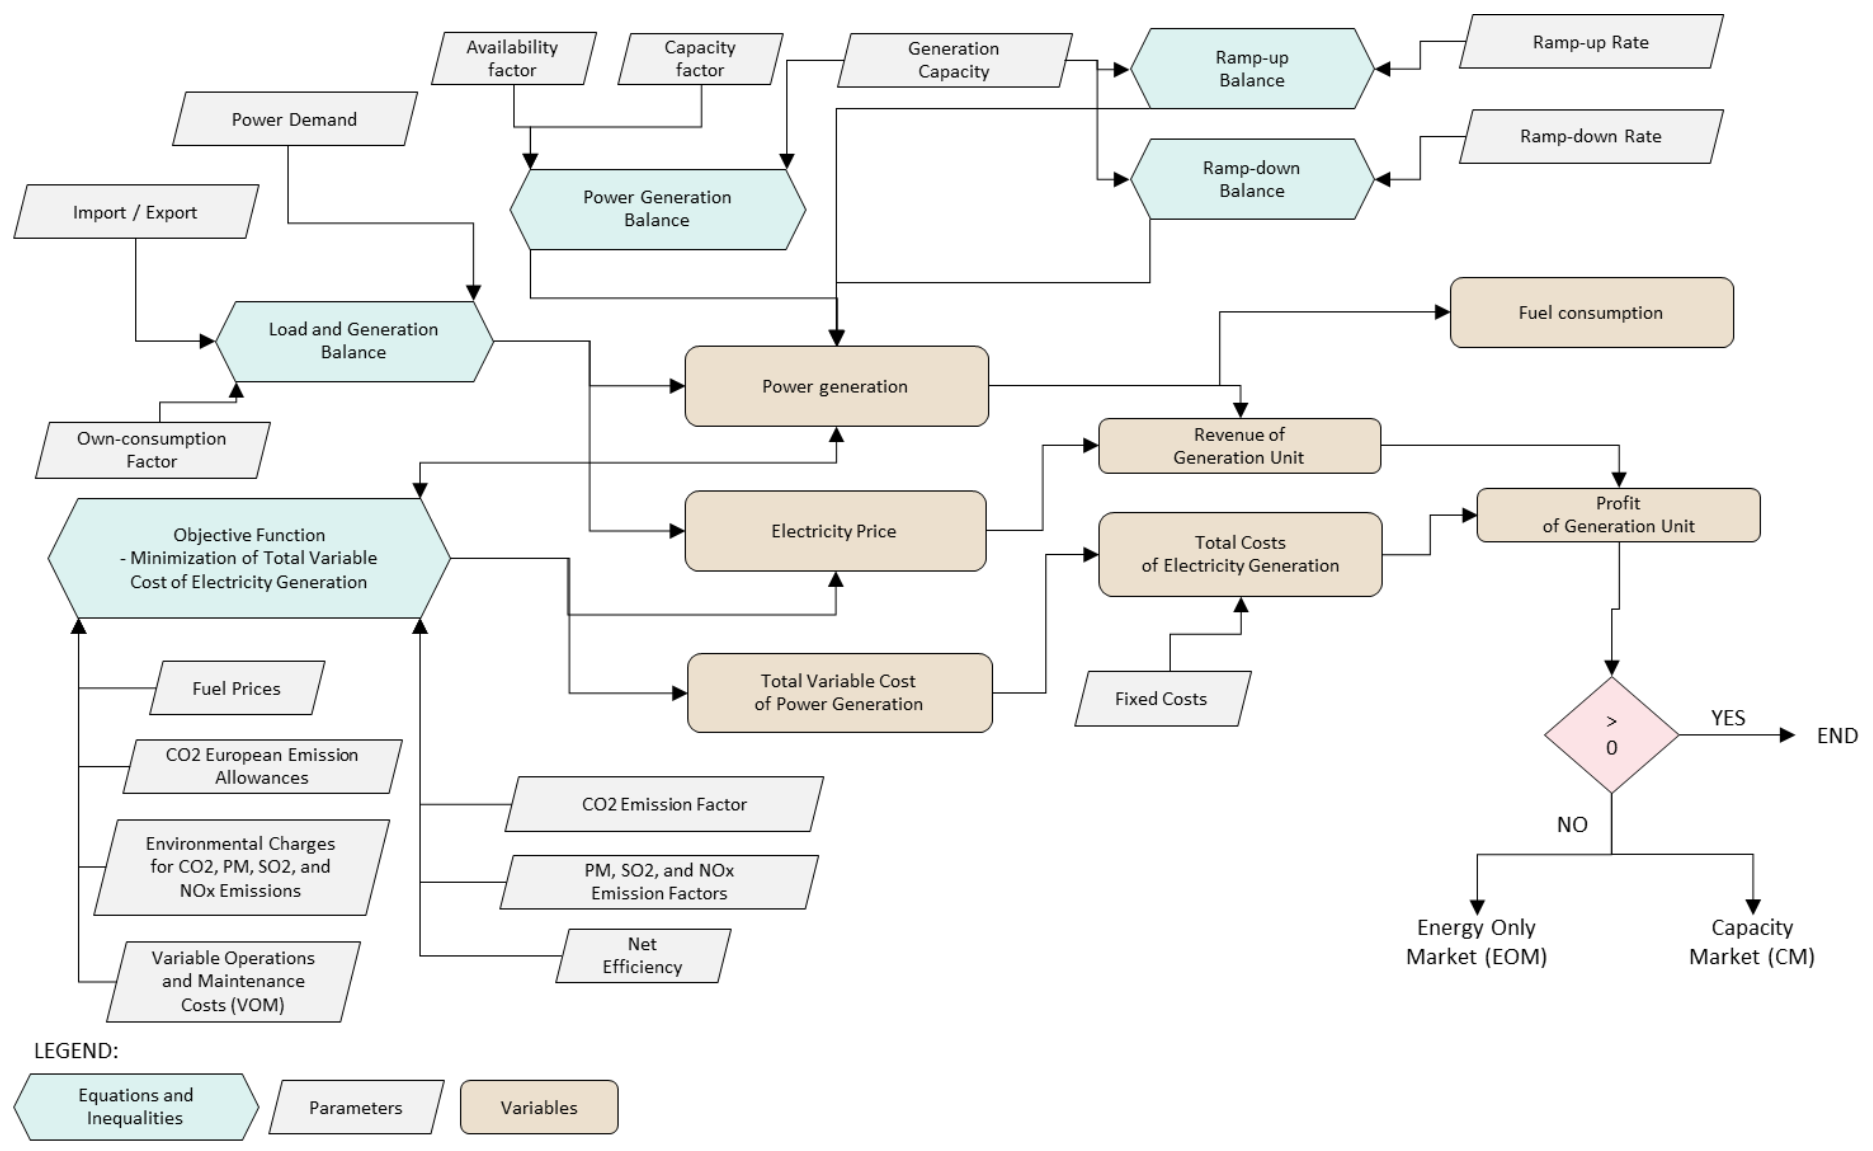
The mathematical model, developed to quantify the influence of the capacity market, reflects the operation of the wholesale energy market. A schematic diagram illustrating the methodology employed is shown in Figure 1. The figure presents the inputs and outputs of the model equations and inequalities (green blocks in the scheme). For example, the objective function is related to the following parameters (grey blocks): fuel prices, CO2 European Emission Allowances, environmental charges, variable operations and maintenance costs, CO2 and pollutants emission factors, and net efficiency. Solving this equation together with all the others presented in the scheme (green blocks) results in the following outputs (brown blocks): power generated by individual units, the total variable cost of power generation, and electricity price. These values are used in the post-optimisation calculations, in line with Figure 1. The calculations are finished if all generation units have a positive profit (the “end” block). The scenarios are described in detail later in the paper.
The model is formulated as a partial equilibrium model of the Polish electricity and capacity markets using the Economic Dispatch Problem (EDP) approach. The EDP approach is widely used to simulate the operation of an electricity market to calculate the optimal generation structure at the lowest total operating cost [8]. Bids submitted by generating units are ranked according to their variable costs (merit order), and the market clearing price is equal to the short-term marginal cost of the system, subject to constraints. It is assumed that the electricity market operates as a competitive market.
The model is a short-term model with a time horizon of one year and hourly intervals. The analysis period is 2021–2040, which is in line with the time horizon assumed in the Polish Energy Policy [28]. The calculation procedures presented in Section 2.2 are executed individually for each year.
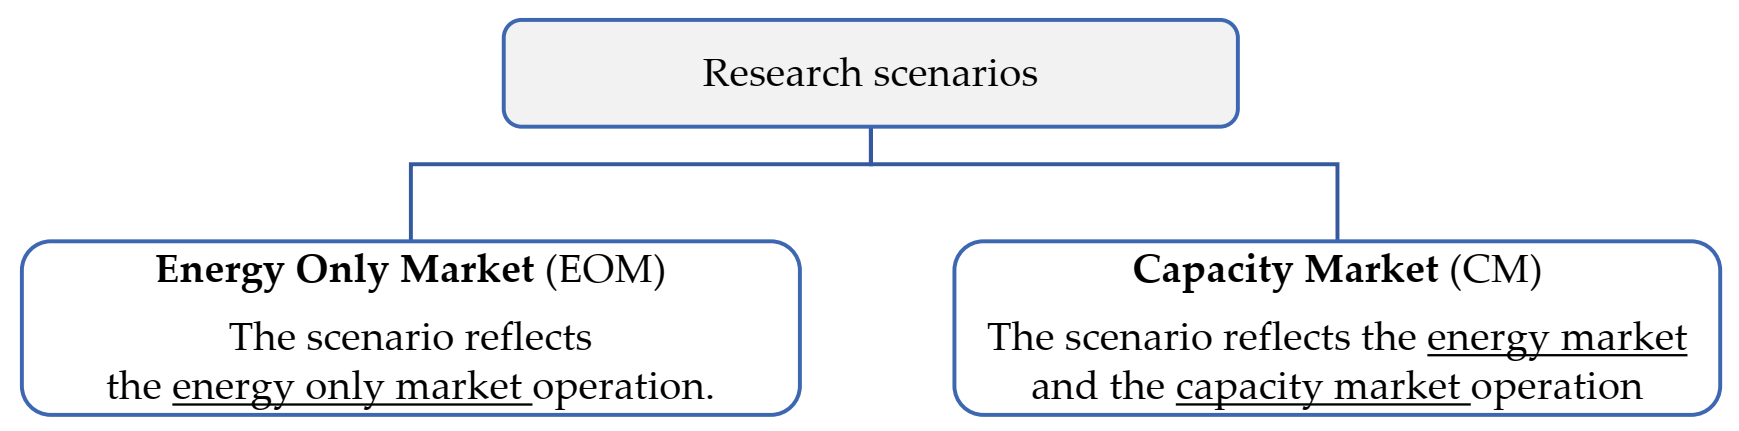
Two research scenarios (described in detail in Section 2.2) are formulated to quantitatively assess the impact of the capacity market on coal consumption:
- An energy only market (EOM) scenario, reflecting the operation of the energy market without a capacity remuneration mechanism.
- A capacity market (CM) scenario, reflecting the operation of a two-commodity market: the capacity market operates in parallel to the energy market.
As previously mentioned, the price elasticity of electricity demand is low because consumers do not make their consumption dependent on hourly prices. Therefore, the study assumed that power demand is a parameter based on the hourly forecast demand in the power system. The values of demand also include network losses.
Power generation units are reflected in the model in the following ways:
- Individual power generation units: (i) centrally dispatched power generation units (coal-fired, gas-fired, hydro pumped storage) and (ii) centrally dispatched combined heat and power (CHP) plants with a generating capacity of more than 99 MW.
- Clustered by fuel type (hard coal-fired, lignite-fired, natural gas-fired, biomass, biogas, and other): (i) centrally dispatched CHPs with a generating capacity of 50–99 MW and below 49 MW, (ii) other public and industrial CHPs.
- Clustered by technology: (i) renewable generation (onshore, offshore, solar, hydro run-of-river), (ii) demand-side response (DSR), (iii) energy storage.
The power generation units (individually or clustered) are described by their technical and economic parameters. The parameters are, e.g., net electrical capacity, net electrical efficiency, own-consumption factor, availability factor, capacity factor, ramp-up and ramp-down rates, fuel, CO2, SO2, NOx, PM emission factors, and variable operations and maintenance (VOM) cost. The input data also includes information on the year of the decommissioning of the power generation units. In the case of refurbished units, the year, the planned increase in the generation capacity, and changes in the techno-economic parameters are included. New power generation units are considered individually in accordance with their investment schedule and techno-economic specification.
The remaining data assumed in this study are as follows:
- Power demand in hourly intervals.
- Fuel prices (hard coal, lignite, natural gas, biomass, biogas, uranium).
- CO2 European Emission Allowances.
- Environmental charges for CO2, PM, SO2, and NOx emissions.
- Hourly generation profiles of CHP plants.
- Hourly generation profiles of the following technologies: onshore, offshore, solar, and hydro run-of-river.
- Value of Lost Load (VoLL).
The model of the Polish power system is formulated as a linear programming problem. The objective function is to minimise the total annual variable cost of electricity generation. The cost consists of the following components: (i) fuel costs, (ii) environmental costs, and (iii) VOM costs. The methodology presented can also be applied to investigate the operation of power systems in other countries and described by different input data.
The main constraints implemented in the model are as follows:
- Load and generation balance: Each hour, the power generation volume (decreased by the own-consumption factor) must be equal to the power demand increased by export and decreased by import.
- Power generation balance: Each hour, power generation units cannot generate more power than the product of their maximum generation capacity and availability factor.
- Ramp-up balance: Each hour, the increase in the power generation volume in the power generation unit (compared to the previous hour) cannot be greater than the product of maximum generation capacity and ramp-up rate.
- Ramp-down balance: Each hour, the decrease in the power generation volume in the power generation unit (compared to the previous hour) cannot be greater than the product of maximum generation capacity and ramp-down rate.
In order to mimic the impact of the reserve margin on electricity prices, the system marginal cost is adjusted proportionally to the level of the reserve margin.
The next step of the methodology presents the calculation of (i) the annual revenues of the individual (or clustered) power generation units, (ii) the estimated total annual costs (variable and fixed) of the individual unit, and consequently, (iii) the annual profit from the sale of electricity on the wholesale market.
2.2. Scenario Assumptions
Since the study aims to quantify the impact of introducing the capacity market on the decarbonisation of the power system, two research scenarios were formulated (Figure 2). The electricity market operation is simulated in the same way for both scenarios, in line with the methodology presented in Section 2.1. The calculation of missing money is also carried out according to the same criteria for both market structures. The differences between the scenarios embrace the operation (or not) of power generation units with insufficient revenues from the sale of electricity (missing money).
2.2.1. Energy Only Market (EOM)
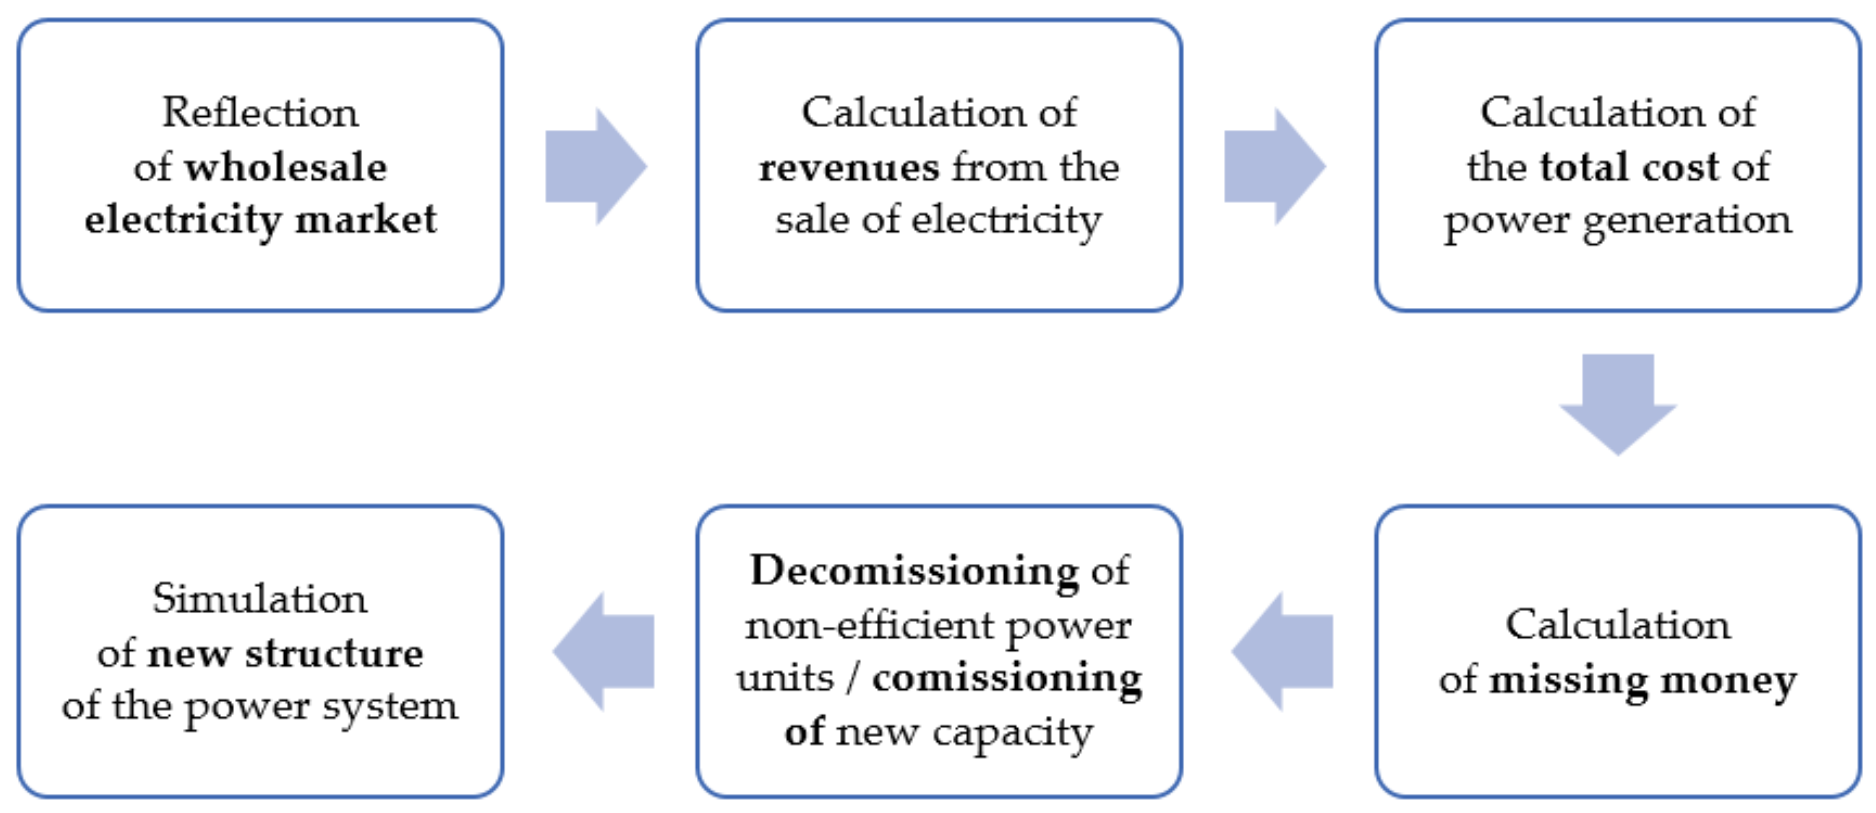
The EOM scenario assumes that the power generation units that do not meet the economic efficiency criterion (missing money problem) are decommissioned. In order to ensure energy safety and sufficient generation capacity in the power system, new power generation units are commissioned. The new units are selected based on economic criteria. As a result, a new structure of the power system is simulated. Then, the entire calculation procedure is repeated for the new structure. Iterations are repeated until each power generation unit in the power system has a positive financial result.
Nonetheless, it is assumed that the number of decommissioned units cannot be greater than five due to the technical and security conditions in each year. Furthermore, it is assumed that units commissioned to the power system from 2018 onwards are not decommissioned in the entire analysis period, regardless of their financial results. The calculation procedure under the EOM scenario is shown in Figure 3.
2.2.2. Capacity Market (CM)
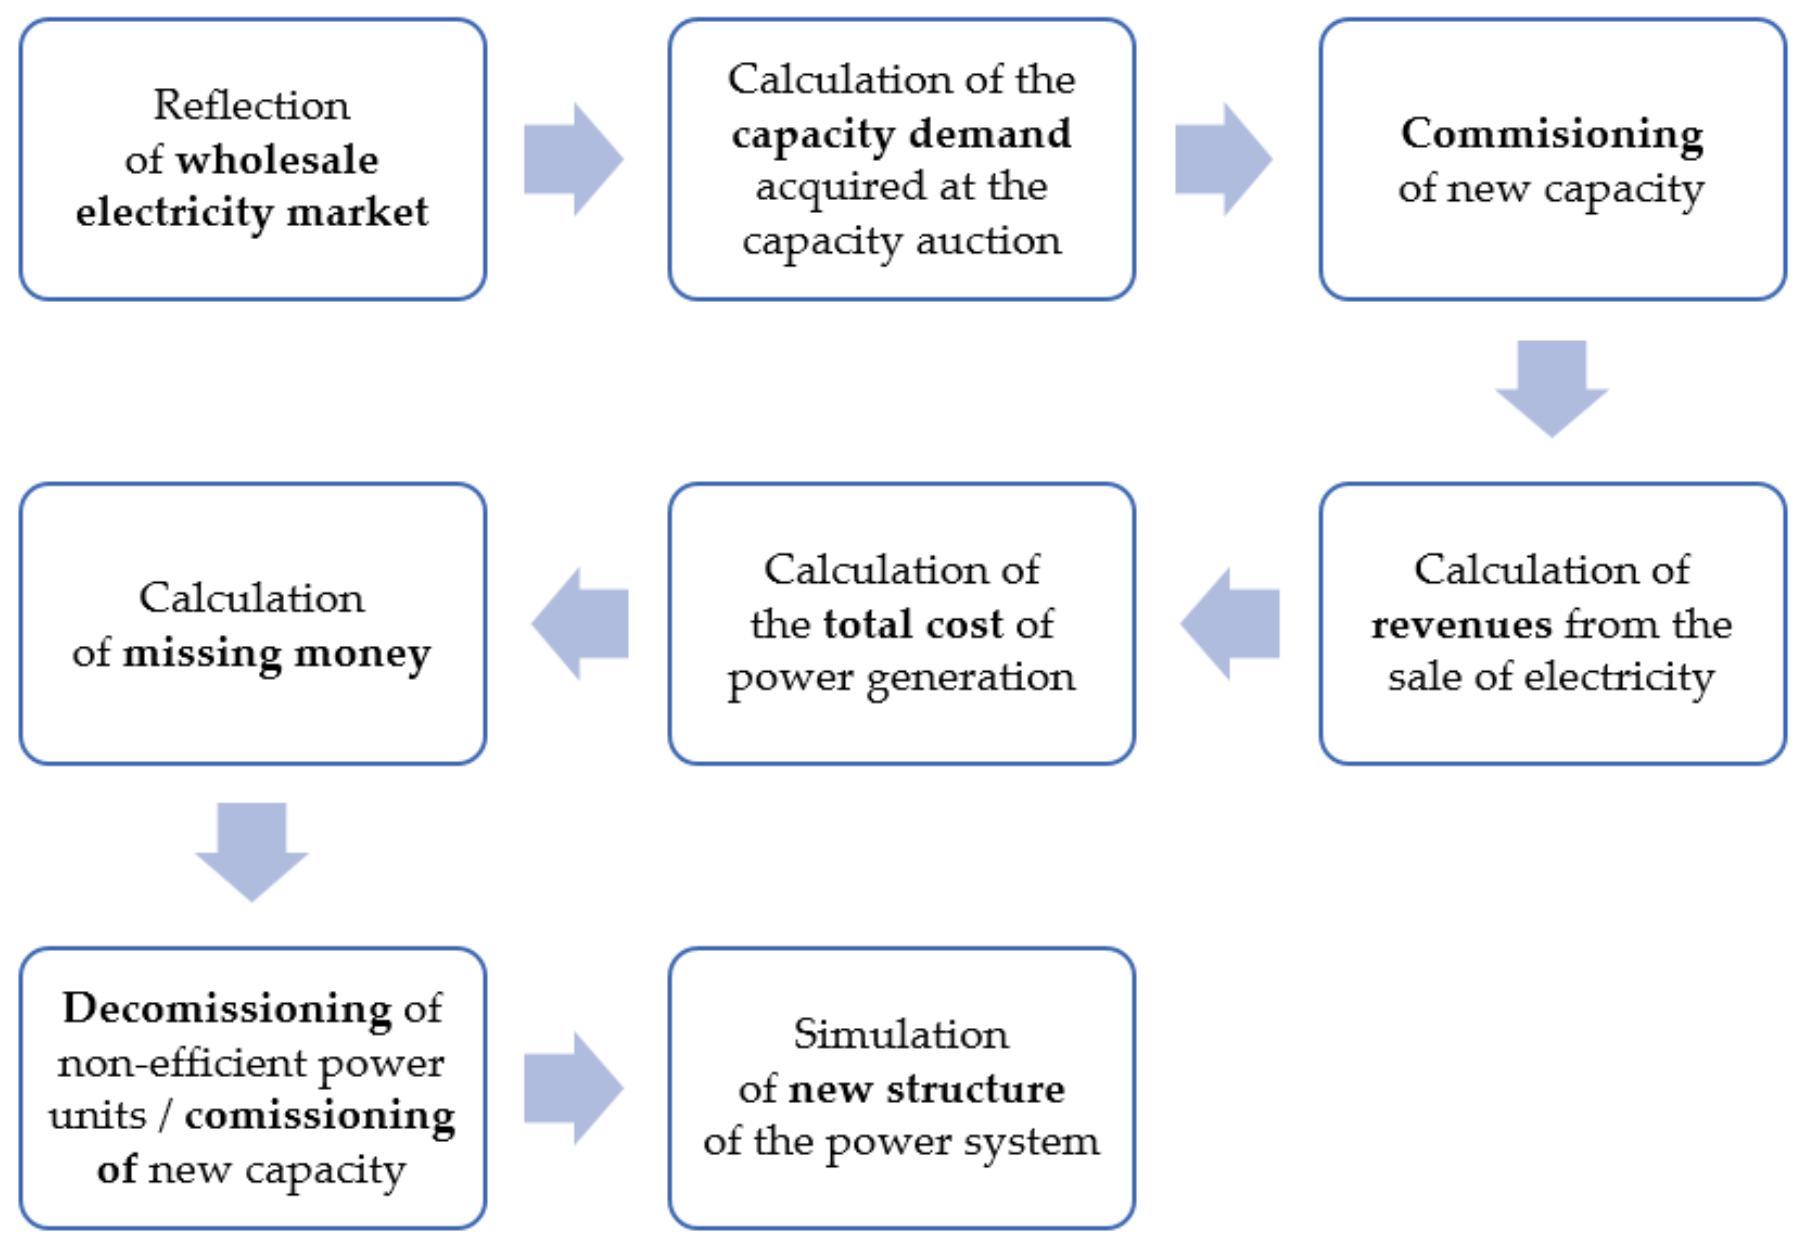
The CM scenario assumes that the power generation units that do not meet the economic efficiency criterion (missing money problem) can participate in the capacity auction. If the units win the auction, they can sign a capacity agreement and remain in the power system. The CM scenario also reflects the real capacity auction results conducted for 2021–2024 [29]. Additionally, according to the Regulation of the European Parliament and Council [30], the study assumes that coal-fired units cannot be the beneficiaries of capacity market support from 2025.
The scenario assumes that renewable generation sources may receive more favourable financial support from the auctions dedicated strictly to renewable technologies. Since double financial support from public funds is not allowed in Poland, the study assumes that an increase in renewable generation capacity is adopted according to the Project of the Polish Energy Policy [28].
The reserve margin in the power system in the CM scenario is assumed to be 30.91%. The level is estimated based on historical capacity auctions for 2021–2024. Therefore, the generation capacity demand is the product of the maximum demand and the coefficient of 1.31. In the case of insufficient generation capacity, new capacity is added.
Finally, a simulation is made of the wholesale electricity market. Units with missing money problems and without capacity agreements are decommissioned. In the case of insufficient generation capacity, new power generation units are commissioned (selected based on economic conditions). As a result, the power system has a new technological structure.
Similar to the EOM scenario, the number of decommissioned units cannot be greater than five each year (due to the technical and security conditions). The exception is 2025, when the decommissioning of a maximum of ten units is allowed. The exception stems from the fact that information about the lack of financial support for the coal-fired units is available several years ahead. The generation companies can implement appropriate procedures and decommission additional units earlier. Moreover, the decommissioning of the greater number of units will not affect energy security because, as a consequence of the results of capacity auctions for 2021–2024, the reserve margin is at the level of 39.1% for that year. The assumption of units commissioned from 2018 onwards is similar to the EOM scenario–regardless of their financial results, they remain in the power system. The calculation procedure under the CM scenario is shown in Figure 4.
2.3. Mathematical Model
This section presents the description of the mathematical model developed. Symbols of sets, parameters, and variables used in the equations and inequalities are presented in Table 1.
The objective function of the model, the total annual operational variable cost of electricity generation (), is given in Equation (1). The is equal to the sum of the following components:
- The variable fuel cost, being the product of (i) the power generation by a unit or group of units at hour , (ii) the fuel price divided by the net electrical efficiency , and (iii) the duration .
- The variable environmental cost, being the product of (i) the power generation by a unit or group of units at hour , (ii) the emissions factor of pollutants or carbon dioxide , (iii) the environmental charges for emission of pollutants and carbon dioxide and the CO2 European Emission Allowances , and (iv) the duration .
- The variable operations and maintenance (VOM) cost, being the product of (i) the electricity generation by a unit or group of units at hour , (ii) the variable operation and maintenance cost , and (iii) the duration .
The load and generation balance is given in Equation (2). The sum of power generation by a unit or group of units at hour (decreased by an own-consumption factor ) must be greater or equal to power demand increased by the export and decreased by the import .
The power generation balance is given in Equation (3). The power generation by a unit or group of units at hour must be lower or equal to the product of the generation capacity and the availability factor .
The ramp-up balance is given in Equation (4). Each hour the increase in the volume of the power generation by a unit or group of units (compared to the previous hour) cannot be greater than the product of generation capacity and the ramp-up rate .
The ramp-down balance is given in Equation (5). Each hour the decrease in the volume of the power generation by a generation unit or group of units (compared to the previous hour) cannot be greater than the product of the generation capacity and the ramp-down rate .
The power generation constraint is given in Equation (6). The sum of the power generation by a unit or group of units at hour divided by the sum of the generation capacity cannot be greater than their capacity factor .
The market clearing price is calculated using Equation (7). The market clearing price at hour is a product of the hourly system marginal price and the hourly margin .
The revenue from the power generation of a unit or group of units is a product of the power generated by them at hour , the market clearing price , and the duration .
The total cost of power generation in a unit or group of units is given in Equation (9). The total cost is equal to the sum of (i) the variable cost of power generation, and (ii) the product of the fixed cost and the generation capacity . The variable cost consists of the following elements: fuel, environmental, and VOM costs. The components are also presented in Equation (1).
The profit from power generation of a generation unit or group of units is calculated as the difference between (i) the sum of the revenues of a unit or group of units at hour , and (ii) the total cost of power generation (Equation (10)).
The missing money of a generation unit or group of units is a quotient of (i) its and (ii) the product of the capacity generation (decreased by an own-consumption factor ) and the availability factor (Equation (11)). The missing money is calculated exclusively for the units or group of units that do not make a profit from electricity generation.
The chemical energy demand that is required for power generation in a unit or group of units is calculated using Equation (12). is equal to a quotient of (i) the product of power generation and the duration , and (ii) the unit conversion rate .
The hard coal consumption in a generation unit or group of units is a product of the chemical energy demand , and the calorific value of the fuel used for power generation (Equation (13)). Therefore, the total hard coal consumption in the power system is equal to the sum of the hard coal consumption in all hard coal-fired generation units or groups of units (Equation (14)).
The lignite consumption in the generation unit or group of units is a product of the chemical energy demand , and the calorific value of the fuel used for power generation (Equation (15)). Therefore, the total lignite consumption in the power system is equal to the sum of the lignite consumption in all lignite-fired generation units or groups of units (Equation (16)).
2.4. Input Data Assumptions
2.4.1. Power Demand
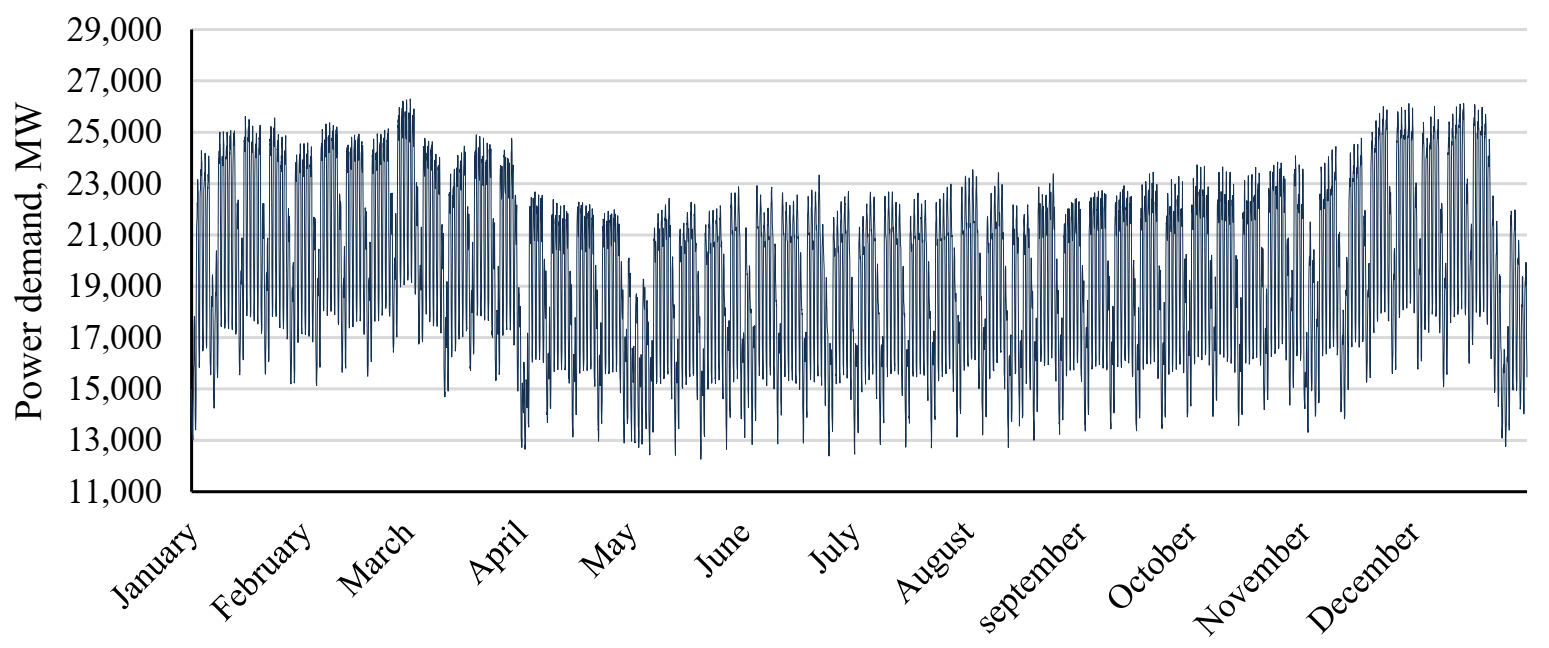
The hourly electricity demand curve of the reference year (2018) is shown in Figure 5. The total electricity demand was 171.2 TWh. The power demand curves for consecutive years of the study (2021–2040) are developed from the shape of the curve in the reference year and the average annual growth rate (1.5%) forecast by the Ministry of Energy [28]. The assumptions for specific years are shown in Table 2. The volume of power demand published in the Polish Energy Policy includes the reserve margin that is required to ensure power system security.
2.4.2. Import and Export
The study considers the volume of imported and exported electricity from neighbouring countries. The Polish power system has (i) synchronous connections with the German, Czech, and Slovak power systems and (ii) non-synchronous connections with the Swedish, Lithuanian, Ukrainian, and Belarusian power systems. The conditions of these connections are discussed in Ref. [32]. The total electricity import and export amounted to 13.8 TWh and 8.1 TWh in the reference year (2018).
Due to the complexity of estimating the electricity prices in European electricity markets, the study assumes that the rate as a percentage of cross-border exchange of electricity between Poland and the neighbouring countries is the same in each year of the analysis. As a result, net import (the difference between import and export) constitutes 3.30% of the total electricity demand each year.
2.4.3. Power Generation Units
The power generation units are characterised by their technical, economic, and environmental parameters. The data is sourced from governmental and international agency databases and reports. The main sources are the Transmission System Operator, the Energy Market Agency, the Energy Regulatory Office, the Central Statistical Office, the ENTSO-E platform, and databases managed by the Mineral and Energy Economy Research Institute of the Polish Academy of Sciences (MEERI PAS).
The public information on commissioning and decommissioning power generation units is also considered in the study. Additionally, the study assumes the commissioning of three nuclear power units of 1.3 GW in 2033, 2035, and 2038 [28]. Since uranium is not mined in Poland, the total volume is imported. Additionally, the study assumes that the nuclear units work as base-load due to their high start costs.
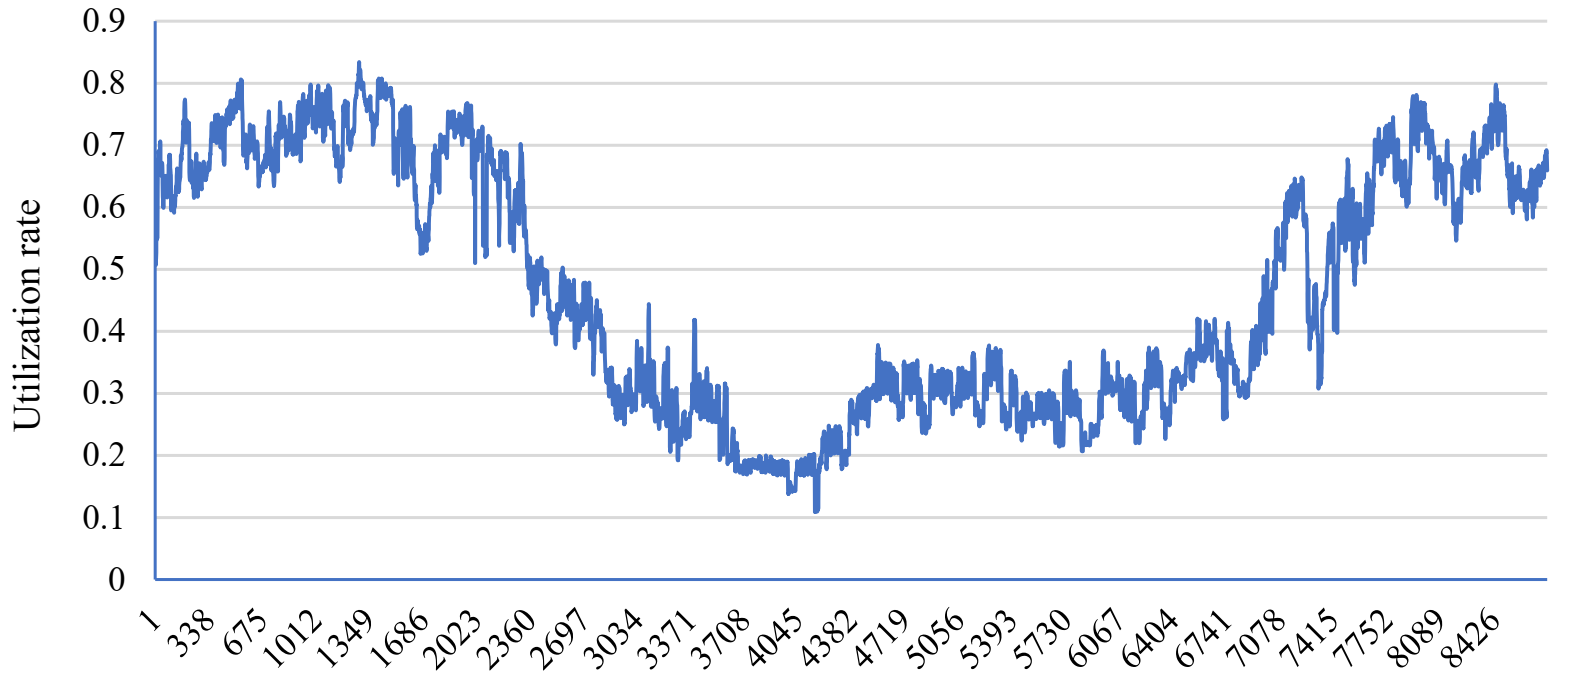
Electricity generation by CHP plants in 2021–2040 is based on the generation profile from the reference year (Figure 6). Industrial CHP plants supply the same volume of electricity to the power system every hour of the year.
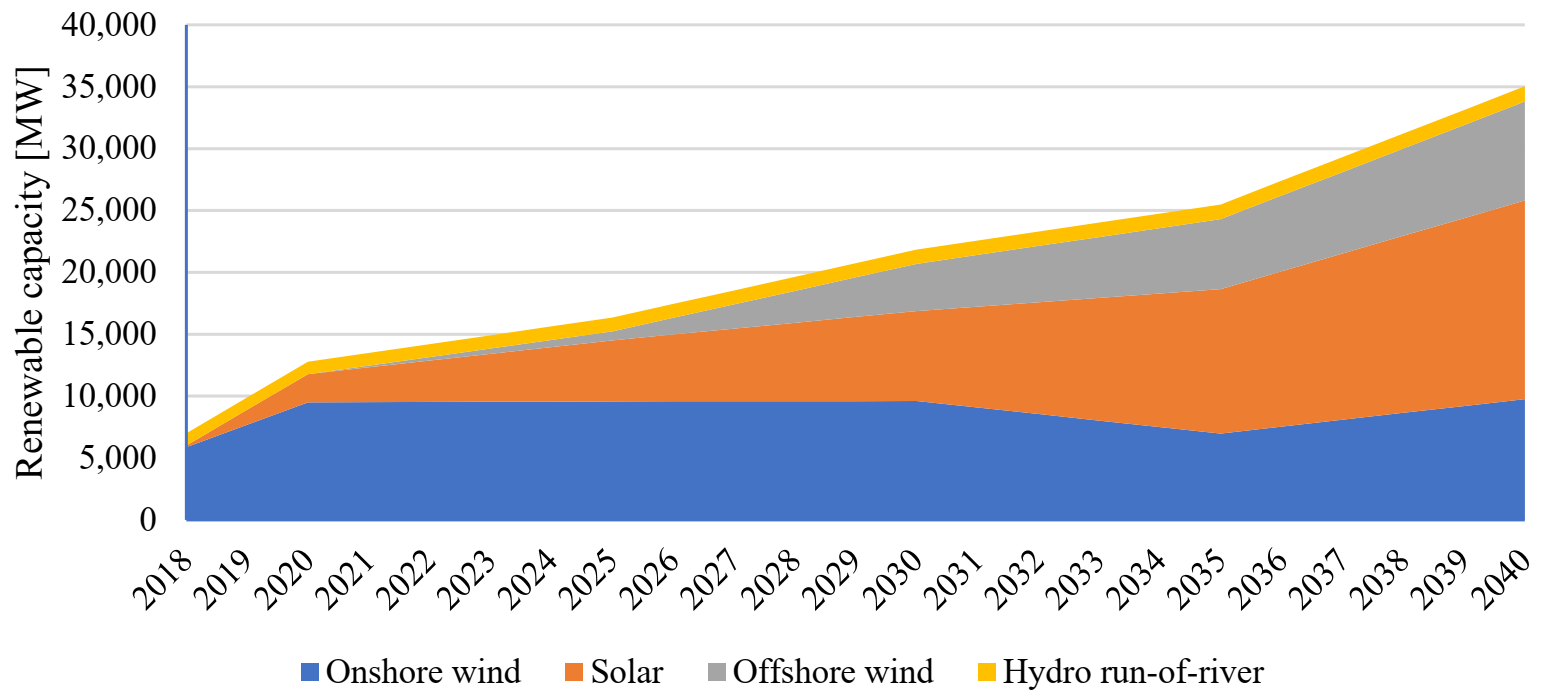
The generation capacity of intermittent renewable units (solar, onshore, offshore, and hydro run-of-river) is assumed based on Ref. [28] (Figure 7). Electricity generation in 2021–2040 considers the generation profile of each technology in the reference year. As no offshore wind farms were operating in Poland in 2018, the generation profile was based on the German units (due to the weather conditions being similar to Poland) [34]. The study assumes that renewable generation sources are price-takers in the electricity market due to the low variable costs of generation.
The share of the demand-side response is assumed at a different level under the scenarios examined. The EOM scenario assumed that the share of DSR is at the level of 0.85% of maximum electricity demand. The capacity numeration mechanism supports these units. Therefore, the share of DSR in the CM scenario is greater and is different in each year of analysis (see subsection: Capacity market).
Finally, the study assumes that CHP plants, industrial power plants, and renewable generation sources sell their electricity generation in the electricity market in priority. Centrally dispatched power generation units cover the remaining demand (based on merit order).
2.4.4. Fuel Prices
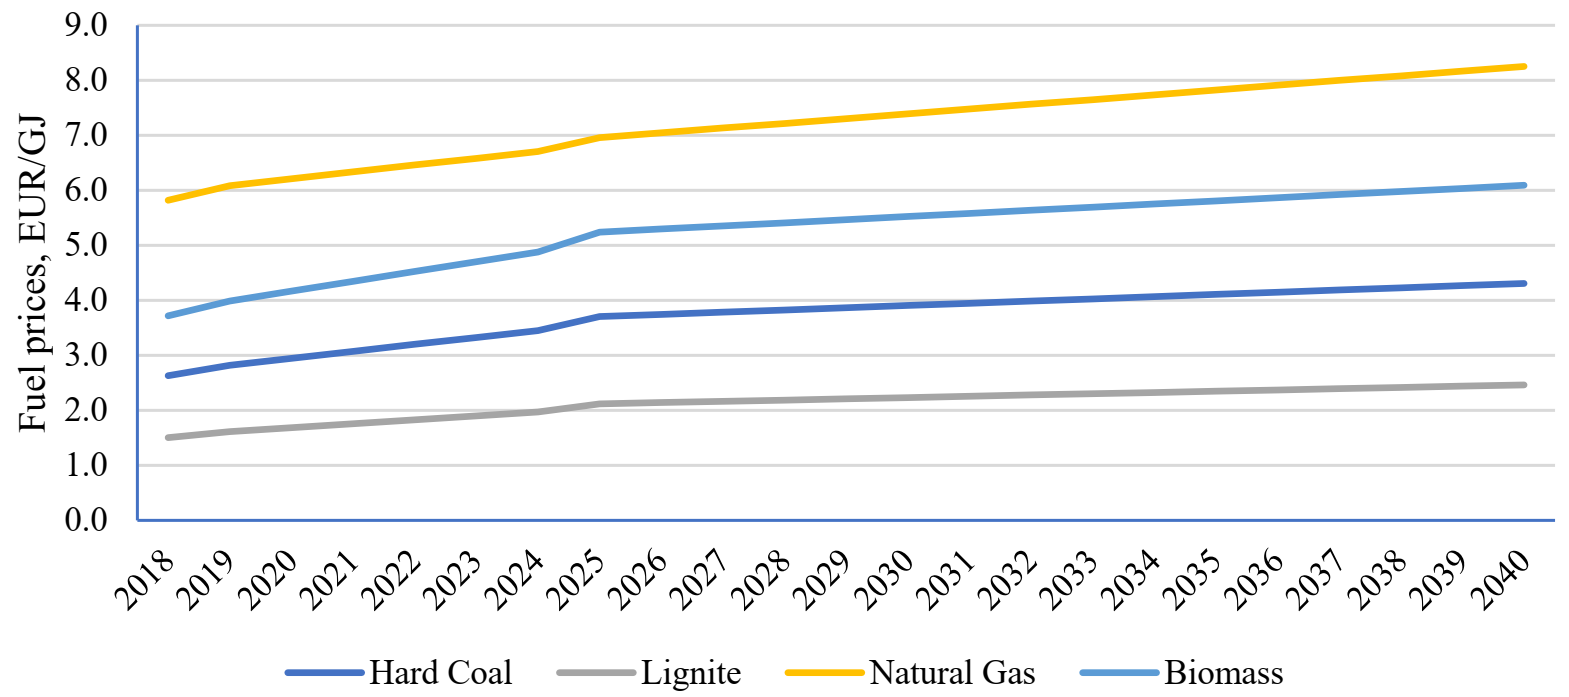
Hard coal and natural gas price forecasts until 2040 are developed according to the Current Policies Scenario (CPS) of the World Energy Outlook Report [35]. As there are no long-term forecasts of lignite and biomass prices, they were calculated based on hard coal prices and the historical price relationship between them and hard coal prices. The fuel price assumptions are shown in Figure 8.
Uranium prices are assumed based on long-term contract prices (73.74 €/kgU in U3O8) and the forecast presented in Ref. [36].

2.4.5. Environmental Charges
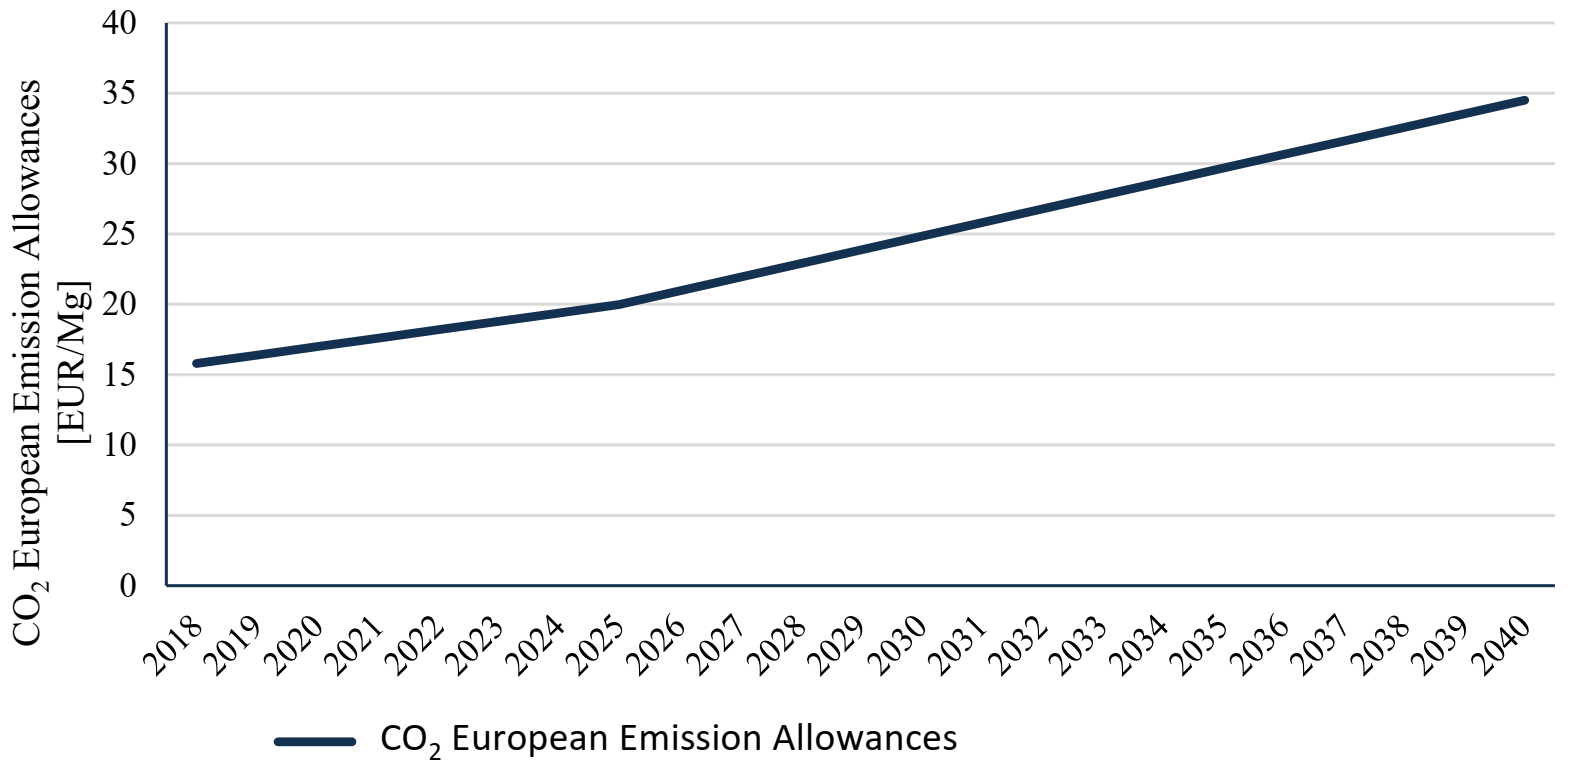
A forecast of CO2 European Emission Allowances has been prepared according to the Current Policies Scenario (CPS) of the World Energy Outlook Report [35]. The results are shown in Figure 9. The calculation also includes environmental charges for the emission of pollutants (NOx, SO2, PM) and carbon dioxide. They are assumed according to national regulations and adjusted by the inflation rate each year of the analysis.
2.4.6. Capacity Market
As previously mentioned, the average annual growth rate of power demand is 1.5% in the EOM scenario (36.36 GW in 2040). In the CM scenario, demand is calculated as a product of the forecast power demand and a coefficient of 1.31 (reserve margin). The assumptions are shown in Table 3. The generation structure is developed individually for each year of analysis based on the outcomes of the previous years.
The study assumes that the TSO acquires the entire required capacity in the main auction (auxiliary auctions are ignored in the analysis). Existing units may sign capacity agreements for one year and new units for fifteen years. In some cases (specified in Ref. [40]), capacity agreements can be signed for a period longer by two years (the green bonus). Moreover, according to the current regulations, coal-fired units cannot participate in the capacity auction from July 1, 2020 [30].
The capacity remuneration mechanism encourages demand-side response to participate in the market. Therefore, the study assumes that the volume of DSR capacity will increase from 0.6 GW in 2018 (2.25% of total power demand) to 3.1 GW in 2040 (6.56%).
Energy storage can also participate in the capacity auction. However, it has exclusively been pumped hydro storage (PHS) that has participated in the auctions conducted so far (for the supply years 2021–2024). Forecasts published by the Polish government do not assume an increase in the generation capacity of PHS technology but assume the growth in other technologies of energy storage systems (EESs) [28]. The study assumes that the capacity in EESs will increase by 20% each year due to decreasing capital expenditure [41,42]. Therefore, the EESs’ capacity will increase from 90.9 MW in 2021 (0.33% of total power demand) to 2.5 GW in 2040 (5.48%). These values exclude generation capacity in PHS (approx. 1.7 GW throughout the period). Power generation units deployed in adjacent power systems did not participate in the capacity auction for 2021–2024. The study assumes that this will continue throughout the analysis period.
2.4.7. Other Assumptions
Value of Lost Load (VoLL) is assumed at EUR 3000/MWh [43]. The assumed prices and costs (e.g., fuel prices, environmental charges, VOM costs, fixed costs, and VoLL) are adjusted for inflation [44].
The study does not assume any constraint on the supply of hard coal. Hard coal can be acquired from domestic producers or be imported. However, in the case of lignite, the demand cannot exceed the maximum current and forecast production of domestic mines [45].
3. Results and Discussion
This section presents and discusses the results of the study. Since the Polish power system is heavily dependent on fossil fuel-based generation from hard coal and lignite, the changes related to these fuels are mainly discussed in the following subsections. Results regarding other energy sources in terms of installed capacity and electricity production are provided in Annex 1.
Key measures are used to analyse and compare results between the EOM and CM scenarios in order to adequately address the research question of this study:
- Coal-fired power generation capacity (Section 3.1).
- Electricity generation from coal-fired units (Section 3.2).
- Coal consumption for electricity generation (Section 3.3).
Additionally, the section presents electricity prices under two research scenarios (3.4. Electricity Prices).
3.1. Coal-Fired Power Generation Capacity
The total generation capacity in the Polish power system was 42.4 GW in the reference year (2018). The share of coal-fired generation capacity was almost 70% of total capacity installed and over 93% of capacity installed in carbon technologies (20.6 GW of hard coal-fired power generation units and 8.7 GW of lignite-fired units).
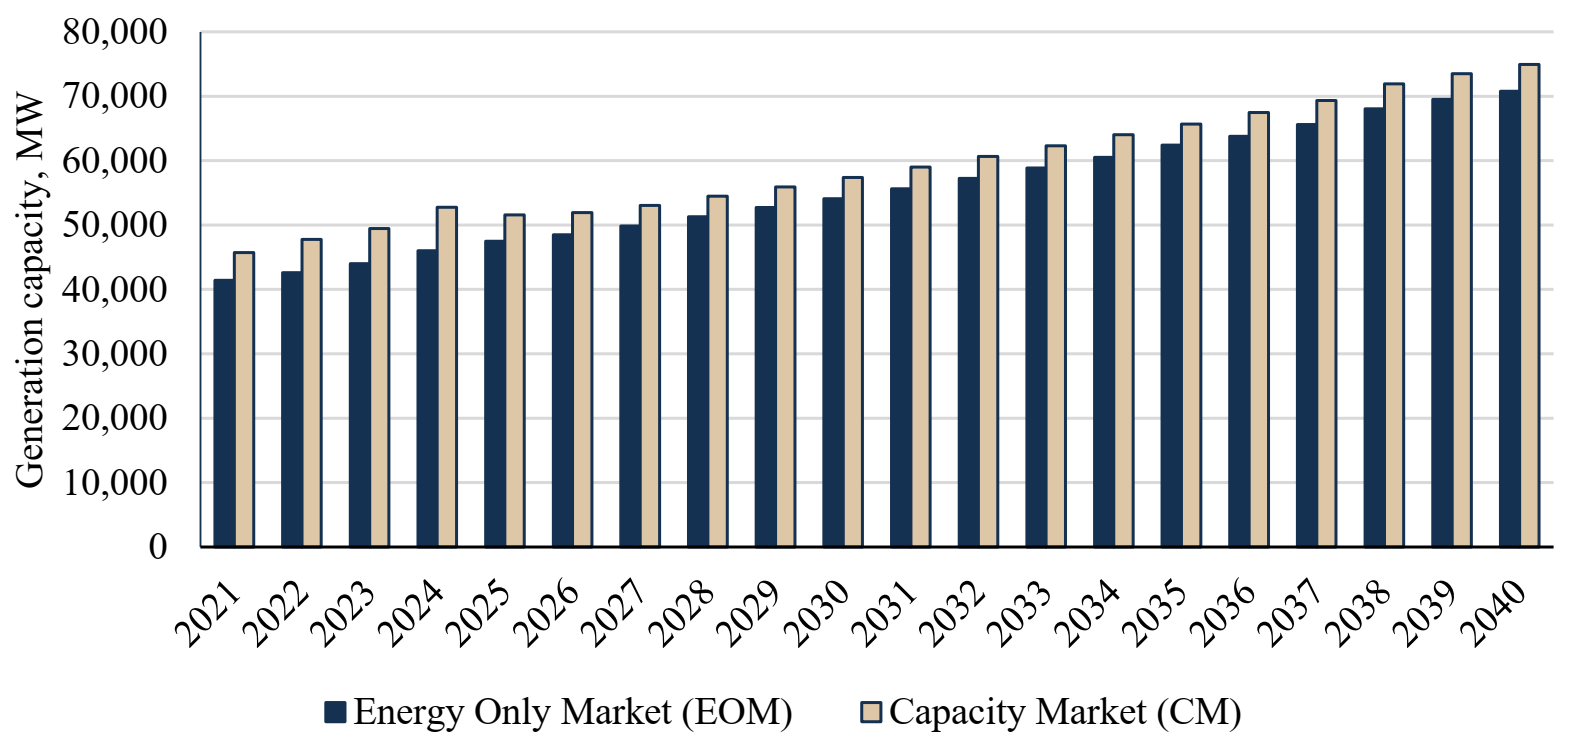
In the following years of the analysis (2021–2040), the total generation capacity in the Polish power system increases regardless of the scenario analysed; however, the volume is higher each year under the CM scenario (Figure 10). This effect is a consequence of guaranteeing a reserve margin in the case of capacity market operation. The greatest difference between scenarios is observed in 2021–2024 (10.4–14.7%). In these years, numerous inefficient, hard coal-fired units that are decommissioned under the EOM scenario are financially supported in the CM scenario. The difference follows a decreasing trend over the next four years, and from 2028 to the end of the analysed period, it remains at the level of 6.0%.
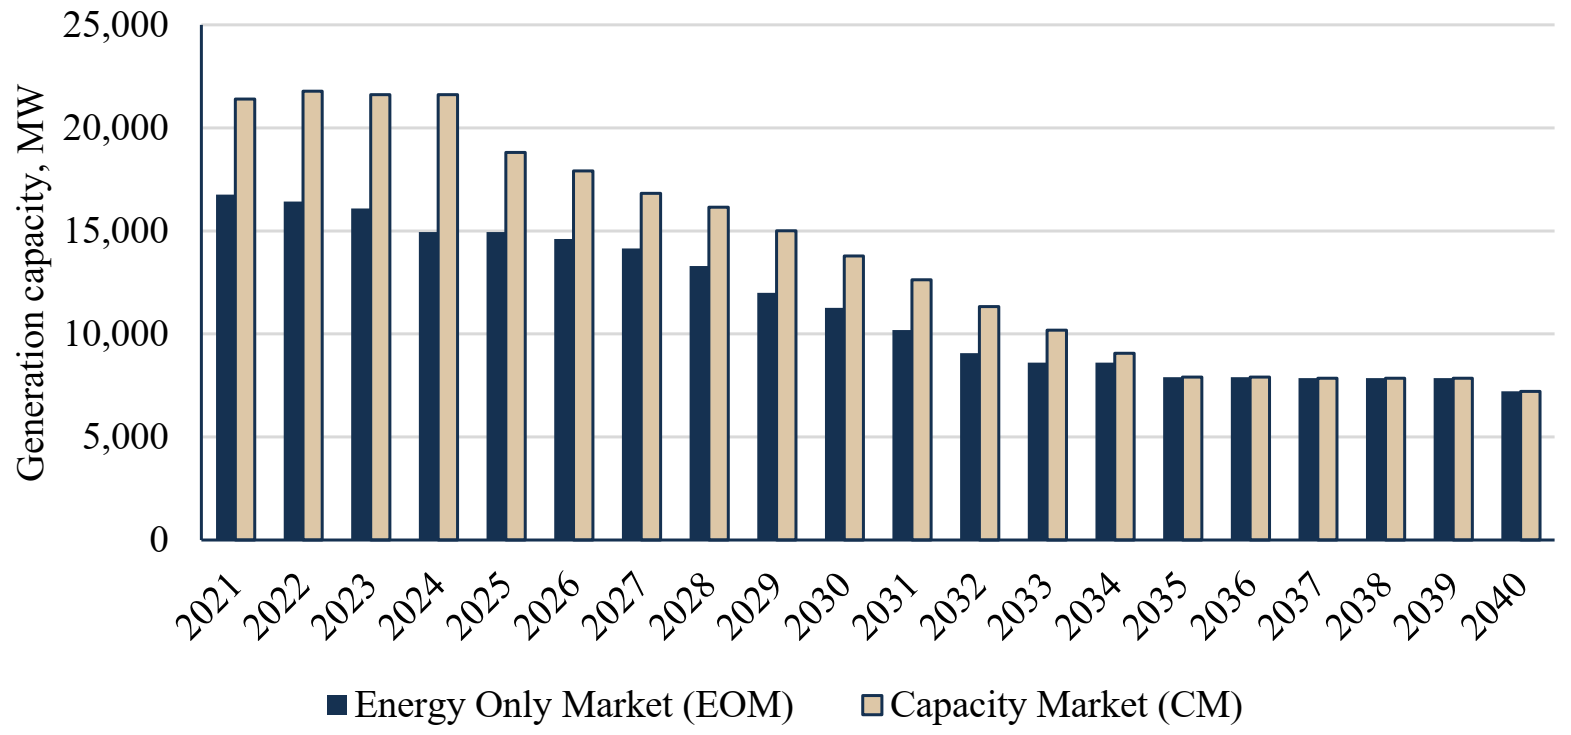
Figure 11 and Figure 12 show the hard coal-fired and lignite-fired generation capacity under the EOM and CM scenarios in 2021–2040. The extensive generation structures of the power system in the reference year (2018) and specific years of analysis (2021, 2025, 2030, 2035, and 2040) are presented in Appendix A (Table A1).
Although hard coal-fired generation capacity decreases over the entire time horizon of analysis regardless of the research scenario, the volume of capacity is different in specific years in the EOM and CM scenarios (Figure 11). The results indicate that the greatest difference between scenarios is in 2021–2024. The difference stems from the fact that a significant number of coal-fired power generation units have insufficient profits from the energy only market, and in consequence, missing money problems occur. In the CM scenario, these units received additional income from the capacity market. Therefore, they are maintained in the system.
As previously mentioned, hard coal-fired units cannot be supported by public funds from 2025. Additionally, environmental charges have an increasing influence on the total generation cost of electricity. Under those circumstances, the difference between the scenarios decreases to 2034. After this year, the generation capacity is almost the same under both scenarios examined by the last year of analysis (units commissioned to the power system after 2018). Therefore, according to the assumptions, they are not decommissioned from the power system regardless of their financial outcomes.
Table 4 presents the generation capacity in hard coal-fired units in specific years. The table also includes information about changes compared to the reference year (2018).
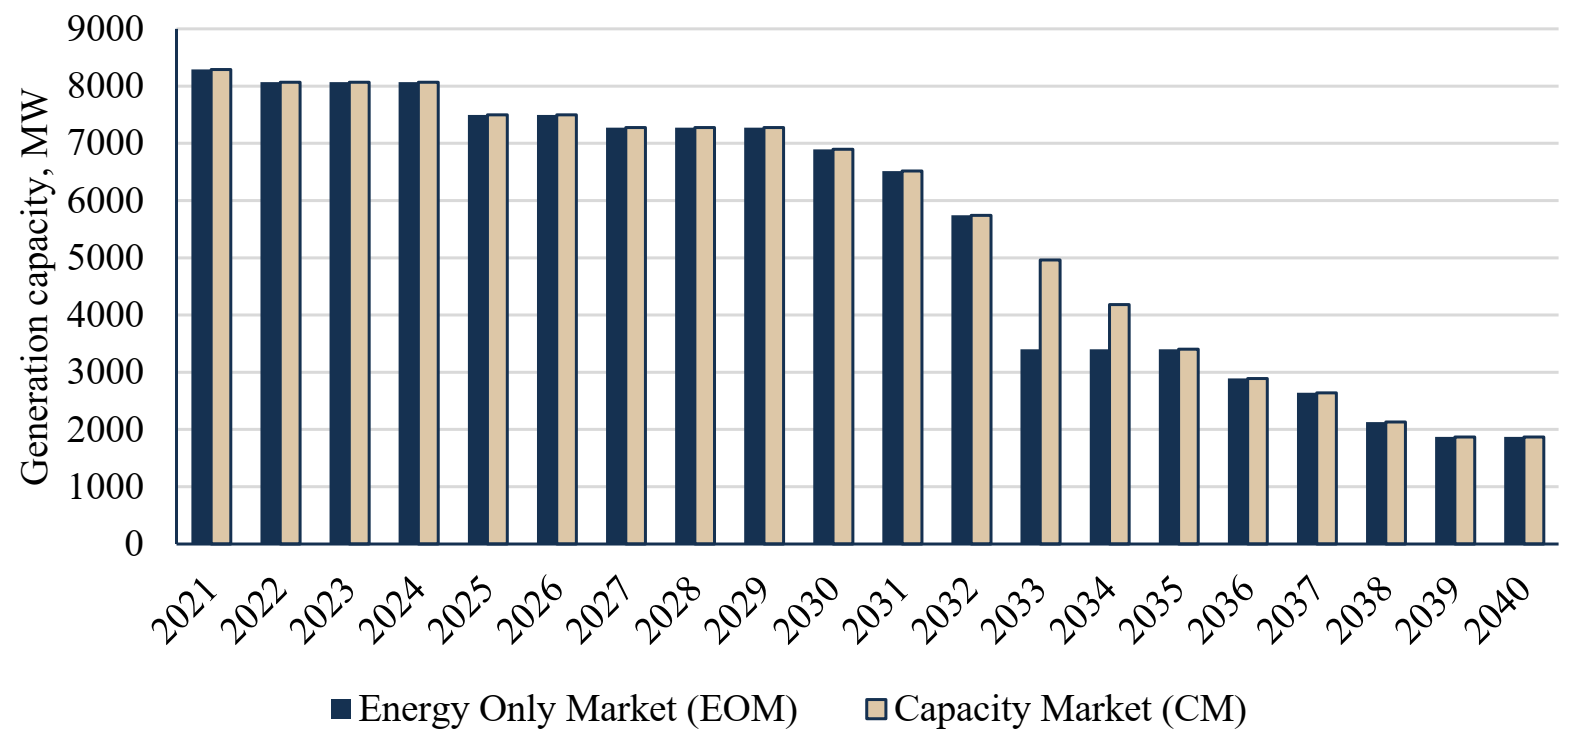
Unlike the generation capacity of hard coal-fired units, the difference in the lignite-fired generation capacity is not that significant (Figure 12). The costs of electricity generation in lignite-fired power units are significantly lower. Consequently, these units are base-load under both scenarios in the first years of the analysis (2021–2032). The decrease in the generation capacity in these years is a consequence of the decommissioning of certain units due to technical, not economic reasons.
The difference between the EOM and CM scenarios is only observed in 2033–2024 because of the long-term capacity agreement of the two units. The increasing environmental charges result in a missing money problem in units that are decommissioned in the EOM scenario.
The decrease in the generation capacity in both scenarios is still observed in 2035–2038. In the two last years of analysis, the generation capacity is at the same level in both scenarios (only units commissioned to the power system after 2018).
Table 5 shows the generation capacity in lignite-fired units in specific years. The table also includes details of the changes compared to the reference year (2018).
As previously mentioned, the general structure of the power system is presented in Table A1, Appendix A. The table shows the study results in 2021, 2025, 2030, 2035, and 2040. It can be observed that the share of coal-fired units decreases. According to the developed research concept, in the case of insufficient capacity in the system, new capacities (with the lowest investments cost) are added, which enable balancing the demand and supply in the power system. Under the EOM scenario, the volume of commissioned power is 700 MW in 2021. On the other hand, under the CM scenario, the total capacity available in the power system is sufficient. Therefore, new generation capacities are not commissioned. In 2021, the capacity in renewable units (biomass, biogas, water, wind, and photovoltaic units) is 11.3 GW, which is a 21.7% increase compared to 2018. Under the EOM scenario, the share of renewable units is 27.2%, while under the CM scenario, it is 24.6%.
In 2025, under both scenarios analysed, the total capacity in the power system is sufficient in each of the analysed years (2022–2025). Therefore, no new units are added. In 2025, the capacity available in renewable units amounts to 18.5 GW, which is a 63.9% increase when compared to 2021. Under the EOM scenario, the share of renewable units is 38.9%, while under the CM scenario, it is 35.8%. In 2025, the first offshore wind farms are commissioned to the power system.
In 2026–2030, due to the lack of sufficient capacity meeting the economic efficiency criterion in the system, new units with a total capacity of 5.3 GW are added under the EOM scenario and 5.2 GW under the CM scenario. In 2030, the capacity available in renewable units amounts to 23.9 GW, which is a 29.7% increase compared to 2025. Under the EOM scenario, the share of renewable units is 44.3%, while under the CM scenario, it is 41.7%.
In line with the adopted assumptions, under both scenarios, two nuclear units are commissioned to the system with a generating capacity of 1,300 MW each. The first unit is put into operation in 2033, and the second in 2035. In 2031–2035, new generating units with a total capacity of 6.2 GW are added due to the lack of sufficient capacity in the system under the EOM scenario. Under the CM scenario, natural gas units with a total generating capacity of 8.0 GW are added. In 2035, the capacity available in renewable units is 30.0 GW, which is a 25.5% increase compared to 2030. Under the EOM scenario, the share of renewable units is 48.1%, while under the CM scenario, it is 45.7%.
In 2038, another 1,300 MW nuclear unit is commissioned to the power system under both scenarios. Under the EOM scenario, the lack of sufficient capacity in the system occurs in 2036–2037 and 2040. In the remaining years, the capacity available in the power system is sufficient to balance the demand. Under the CM scenario, gas capacities are added in the same years. In 2036, 600 MW of new capacity is commissioned, while 400 MW in 2037 and 150 MW in 2040. In 2040, the capacity of renewable units is 36.9 GW, which is a 22.7% increase when compared to 2035. Under the EOM scenario, the share of renewable units is 52.1%, while under the CM scenario, it is 49.2%.
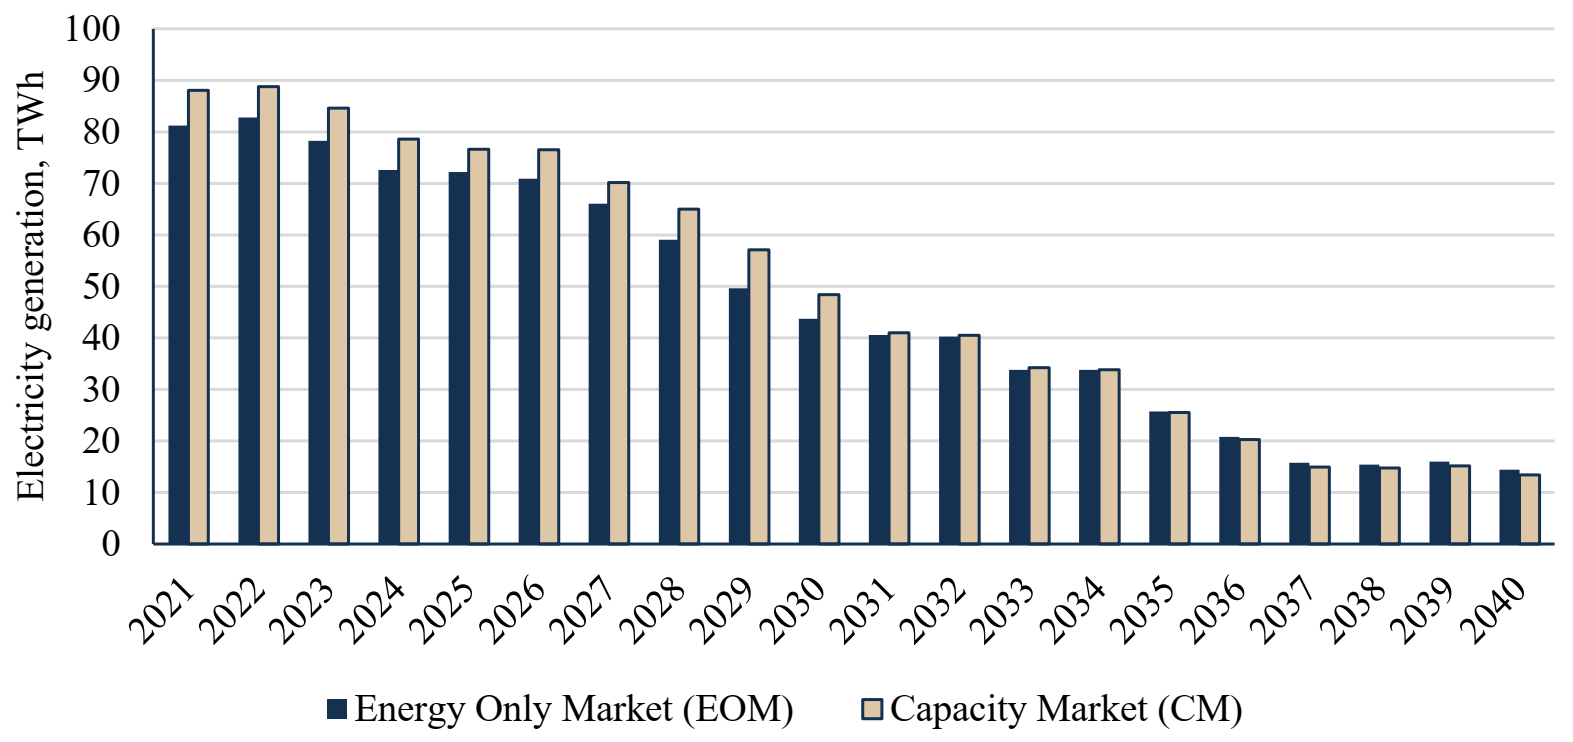
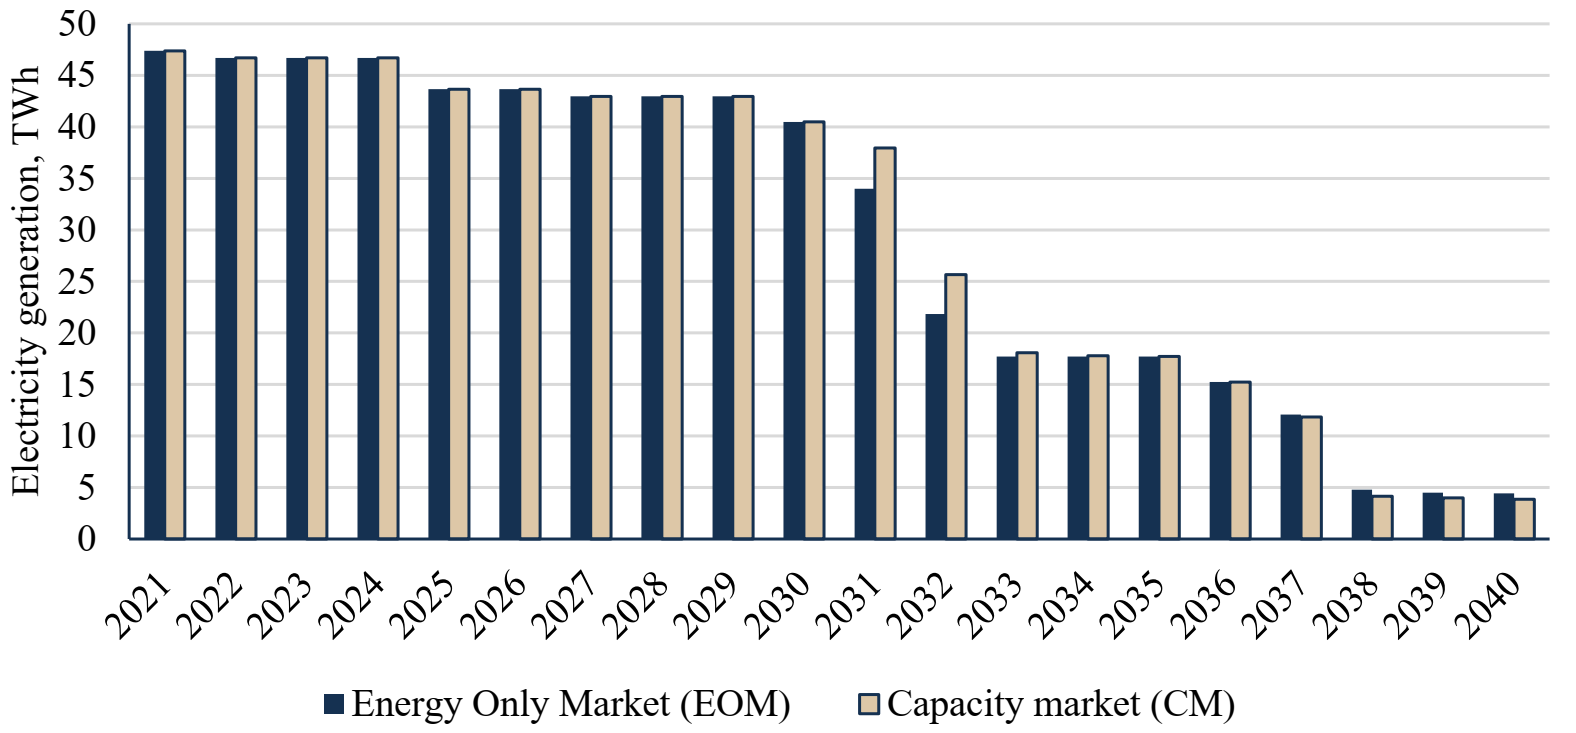
3.2. Electricity Generation from Coal-Fired Units
Figure 13 and Figure 14 present volumes of hard coal-fired and lignite-fired electricity generation under the EOM and CM scenarios in 2021–2040. The extensive structures of electricity production in the reference year (2018) and specific years of analysis (2021, 2025, 2030, 2035, and 2040) are presented in Appendix A (Table A2). The figures present the key changes in the years ahead.
Similar to the results of the generation capacity, electricity production from hard coal-fired power units also decreases throughout the period of analysis, regardless of the scenario and the assumptions adopted (Figure 13).
The greatest difference between the EOM and CM scenarios is observed over the period 2021–2030. The difference stems directly from the technology structure. The share of hard coal-fired units in the EOM scenario is lower. Therefore, a lower volume of electricity is generated by these units.
Between 2031 and 2036, electricity production is at a similar level in both scenarios because hard coal-fired units gradually reduce their share in the total generation of the power system. Additionally, the increasing environmental charges mean that electricity is mostly generated in other units. The renewable, natural gas-fired, and nuclear units are characterised by lower generation costs, and consequently, they have priority to access the transmission grid.
In 2037–2040, the quantity of electricity generated in hard coal-fired units is greater in the EOM scenario. The trend is changing due to the fact that the hard coal-fired units have a greater share in the power system. On the other hand, in the CM scenario (in which the reserve margin is secured), the capacity of natural gas-fired units and demand-side response is greater. These units meet the power demand first.
Table 6 provides detailed information about changes in the electricity generation from hard coal-fired units over the period analysed and scenarios examined.
There is no significant difference in electricity generation from lignite-fired power units up to 2030 under the scenarios examined (Figure 14). These are base-load units due to the low generation cost. The decrease in electricity generation in 2025 and 2030 stems from the decommissioning of certain units due to their technical condition, not due to the missing money problem.
A difference between the EOM and CM scenarios is observed in 2031–2032. Increasing environmental charges result in an increase in generation costs in lignite-fired power units. After this year, the share of natural gas-fired units, commissioning of nuclear units and increasing share of renewables result in decreased electricity production from lignite in both scenarios examined.
From 2038, the quantity of electricity generated in lignite-fired units is greater in the EOM scenario. Similar to the hard coal-fired units, the change in the trend is due to the fact that the lignite coal-fired units have a greater share in the power system under this scenario. On the contrary, in the CM scenario (in which the reserve margin is secured), the capacity of natural gas-fired units and demand-side response is greater, and these units sell electricity before more expensive ones.
Table 7 provides information about changes in the electricity generation from lignite-fired units over the period analysed and scenarios examined.
The fuel-mix of electricity generation in 2021, 2025, 2030, 2035, and 2040 are presented in Table A2, Appendix A.
In 2021, under the EOM scenario, electricity production in hard coal-fired units is 81.2 TWh (2.4% lower when compared to 2018). Under the CM scenario, production in these units amounts to 88.0 TWh (an increase of 5.9% when compared to 2018). The difference between the scenarios is a consequence of maintaining the coal-fired units under the CM scenario, which signed contracts of the capacity obligation, and the commissioning of new natural gas units under the EOM scenario. Natural gas units have lower generation costs than obsolete coal units these years. Therefore, the demand is covered by production from these units in priority.
In 2025, the total volume of electricity is 183.6 TWh, an increase of 6.1% compared to 2021. The results show that hard coal remains the dominant fuel. Electricity production in lignite units is the same under both scenarios and amounts to 43.7 TWh, which is a decrease of 7.9% compared to 2018. It is a consequence of withdrawing lignite-fired units from the system due to their technical condition. In 2025, under the EOM scenario, production in hard coal-fired units is 72.2 TWh and is 11.1% lower compared to 2021. Under the CM scenario, production in these units is 76.6 TWh, which is a decrease compared to 2018 by 13.0%. Hard coal consumption decreases under both scenarios due to the cheaper electricity produced in natural gas units. The total electricity production in natural gas units is 33.2 TWh under the EOM scenario and is 50.5% higher compared to 2021. Under the CM scenario, the volume of electricity is 28.9 TWh, which is an increase of 79.8% when compared to 2021.
In 2030, the total volume of electricity is 197.8 TWh, which is an increase of 7.7% when compared to 2021. Most electricity under both scenarios is produced in natural gas units. It is a consequence of the increase of new natural gas units added to the system in order to cover the power demand. Considering the increasing prices of CO2 European Emission Allowances, these units are characterised by a lower cost of electricity generation than most units using solid fossil fuels. The volume of electricity produced in lignite-fired units is the same under both scenarios in 2030 and amounts to 40.5 TWh, which decreases by 7.3% compared to 2025. The progressive increase in prices of carbon certificates means that lignite-fired units produce electricity at a higher production cost than new natural gas units. In 2030, under the EOM scenario, production in hard coal-fired generation units is 43.7 TWh and is 39.5% lower compared to 2025. Under the CM scenario, production in these units is 48.4 TWh, which is 36.8% less when compared to 2018.
In 2035, the total volume of electricity produced this year is 213.1 TWh, 7.7% higher when compared to 2030. The dominant units in the electricity production fuel-mix are natural gas-fired units. Electricity production in natural gas units under the EOM scenario is 89.7 TWh, which is an increase of 37.9% when compared to 2030. Under the CM scenario, the production volume is 89.9 TWh and is higher by 48.9% when compared to 2030. The decline in the growth rate of electricity production from natural gas-fired units is a consequence of the commissioning of two nuclear units to the power system. These units are characterised by lower production costs than other conventional units, so the electricity produced in them meets the demand in prior. Electricity production in nuclear units is the same under both analysed scenarios and amounts to 21.6 TWh.
In 2040, the total volume of electricity produced is 229.6 TWh, 7.7% higher when compared to 2035. Natural gas is also the dominant fuel. Electricity production in natural gas-fired units is 106.4 TWh under the EOM scenario, 18.7% more than in 2035. Under the CM scenario, the production volume is 108.2 TWh and is higher by 20.3% compared to 2030. Production in nuclear units is the same under both scenarios and amounts to 32.2 TWh, which is an increase of 50.0% compared to 2035.
3.3. Coal Consumption for Electricity Generation
Fuel consumption is directly dependent on the structure of electricity generation. Therefore, coal consumption depends on generation by coal-fired capacity in the power system and the availability of generation units. In order to convert demand for coal consumption from energy units to mass units, the calorific value is adopted in line with data published by the Energy Market Agency (e.g., 21,075 MJ/Mg in hard coal-fired power plants, 21,952 MJ/Mg in hard coal-fired CHP, and 8,019 MJ/Mg in lignite-fired power plants) [37].
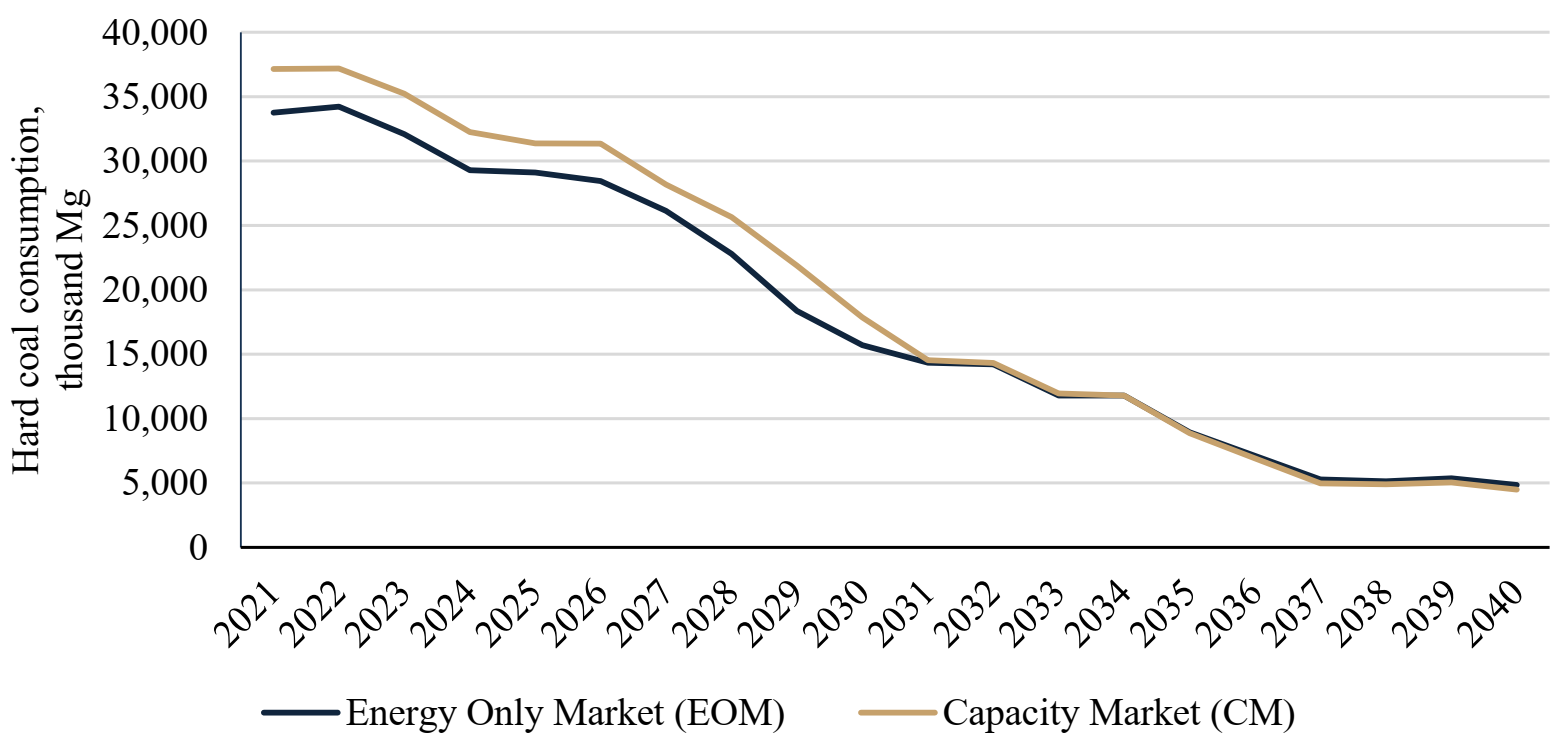
3.3.1. Hard Coal Consumption
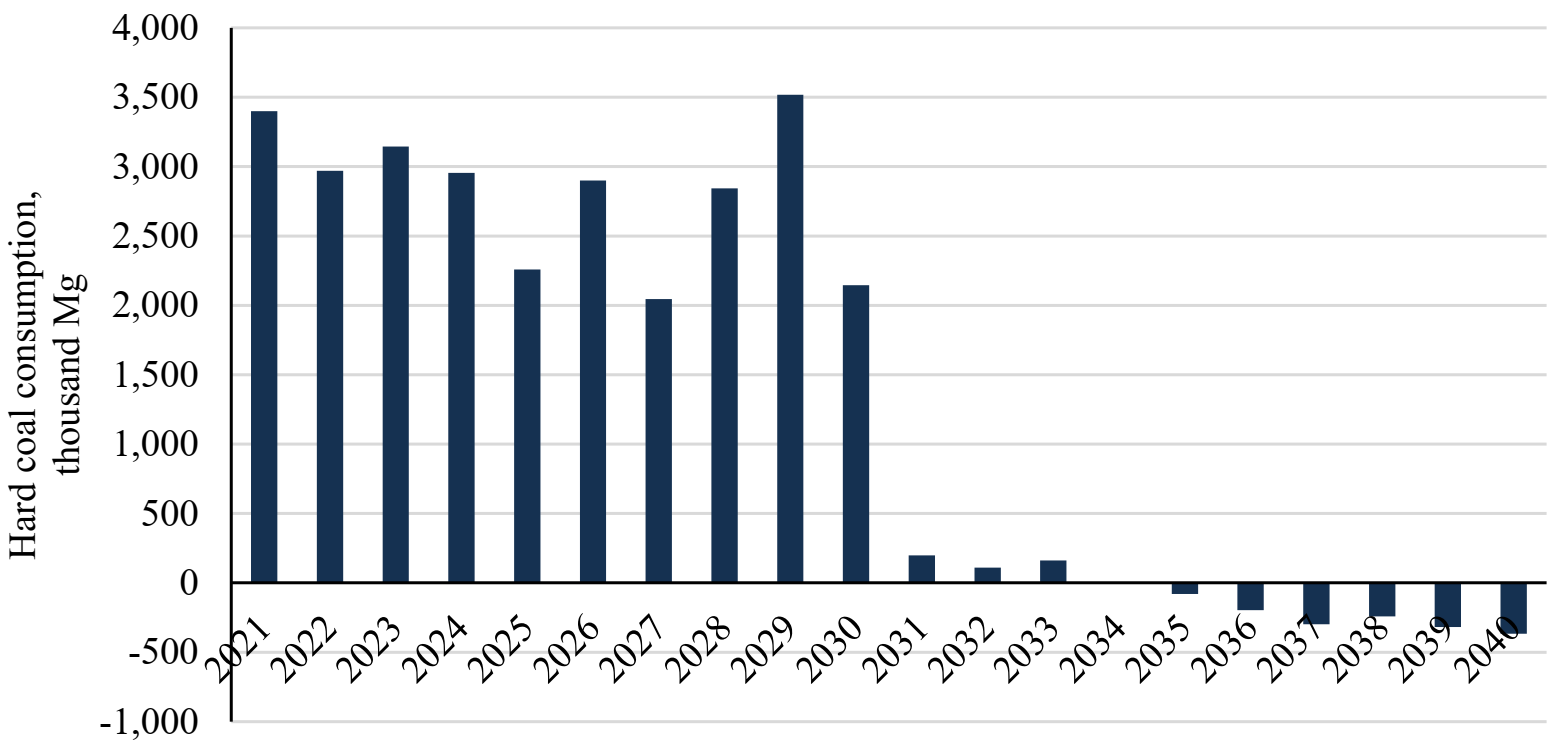
Hard coal consumption over the period 2021–2040 under both scenarios is shown in Figure 15, and the differences between the scenario results are presented in Figure 16. Hard coal consumption for electricity generation decreases in both the EOM and CM scenarios, but the characteristics of these changes are different. Table 8 provides detailed information about these differences over the period analysed and the scenarios examined. The changes over the periods are greater than changes in electricity generation in hard coal-fired units which stems from the increase in net electrical efficiency in existing and new hard coal-fired power generation units.
In 2021–2024, hard coal consumption decreases from 37.2 million Mg to 32.3 million Mg under the CM scenario. In this period, the consumption under the EOM scenario is lower on average by 9.7%. The difference is mainly due to the lower generation capacity in hard coal-fired power plants and CHP plants. Consequently, there is a lower volume of electricity generated in these units under the EOM scenario. In the CM scenario, some units with negative financial results from the energy market receive financial support from the capacity market and are still in the power system.
In 2025–2026, hard coal consumption still decreases in both scenarios. Additionally, some units are decommissioned from the power system due to their technical condition. As a result, the consumption in the CM scenario is higher by 7.8% in 2025 and 10.2% in 2026 when compared to the EOM scenario.
In 2027–2029, hard coal consumption decreases to 21.9 million Mg in the CM scenario. However, the difference between the two scenarios increases compared to the previous years and reaches 19.2% (3.5 million Mg) in 2029. The maintenance of hard coal-fired power generation units in the power system through the support mechanism results in the commissioning of a smaller volume of new generation capacity. Thus, the operation of the capacity market contributes to maintaining the existing generation units that meet the peak power demand. There are no requirements to commission many new units in the CM scenario.
In 2030, hard coal consumption in the CM scenario decreases to 19.9 million Mg. The difference between the scenarios decreases to 2.1 million Mg due to the fact that there are also smaller differences between hard coal generation capacity in the system in both scenarios in 2030. It should also be noted that due to the increasing prices of the CO2 European Emission Allowances, hard coal-fired units are becoming less and less competitive when compared to other technologies. In the following years, the differences between the hard coal consumption in the scenarios are much smaller, and in 2034 hard coal consumption is almost the same in both scenarios.
In 2035–2040, hard coal consumption in the CM scenario reaches 4.2 million Mg (7.6% lower than the EOM scenario). The change of the trend is caused by the greater volume of gas-fired capacity generation in the CM scenario. Natural gas-fired power units are characterised by much lower generation costs than hard coal-fired units due to further increases in the prices of the CO2 European Emission Allowances.
3.3.2. Lignite Consumption
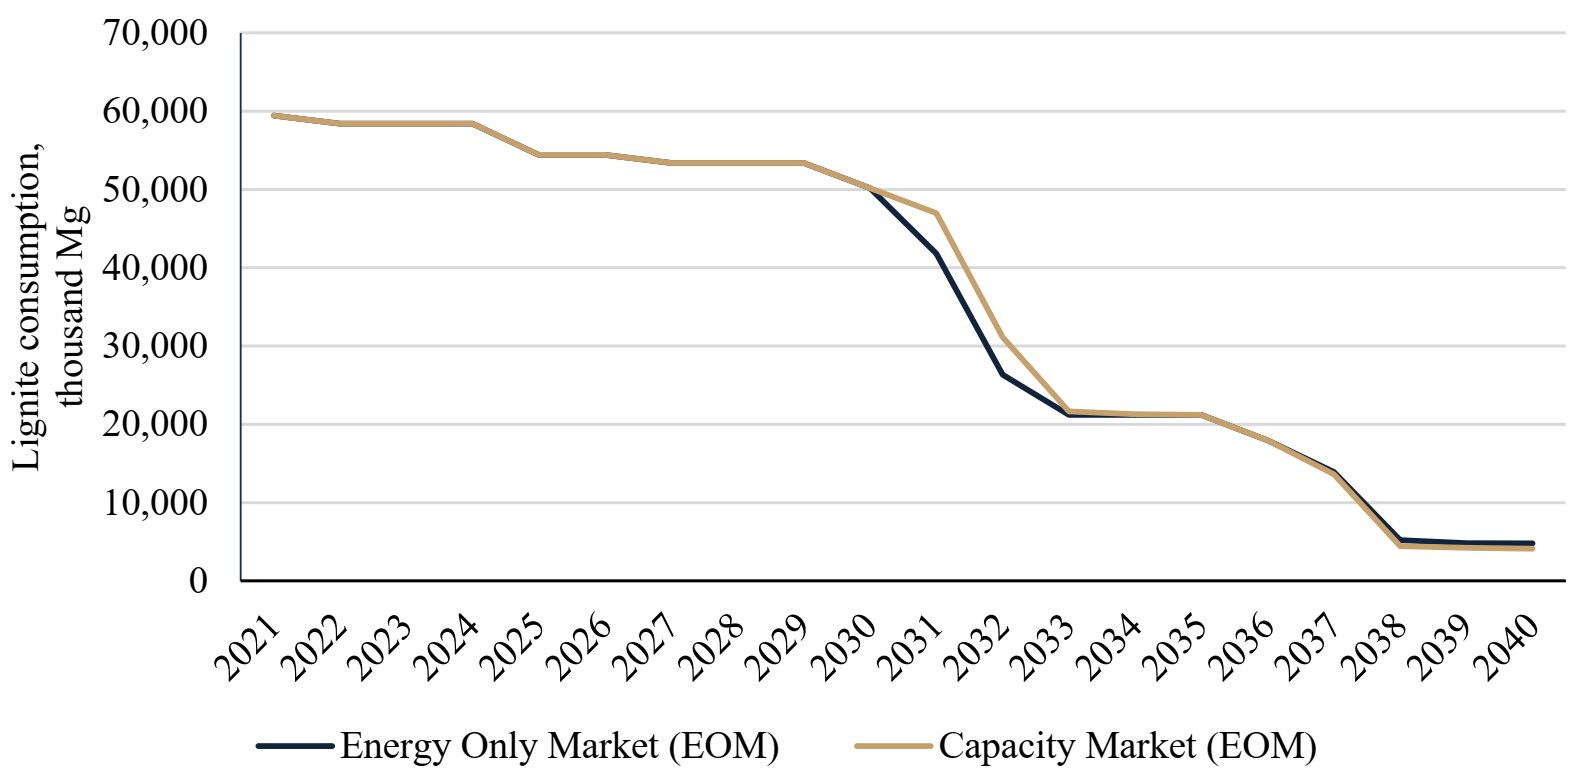
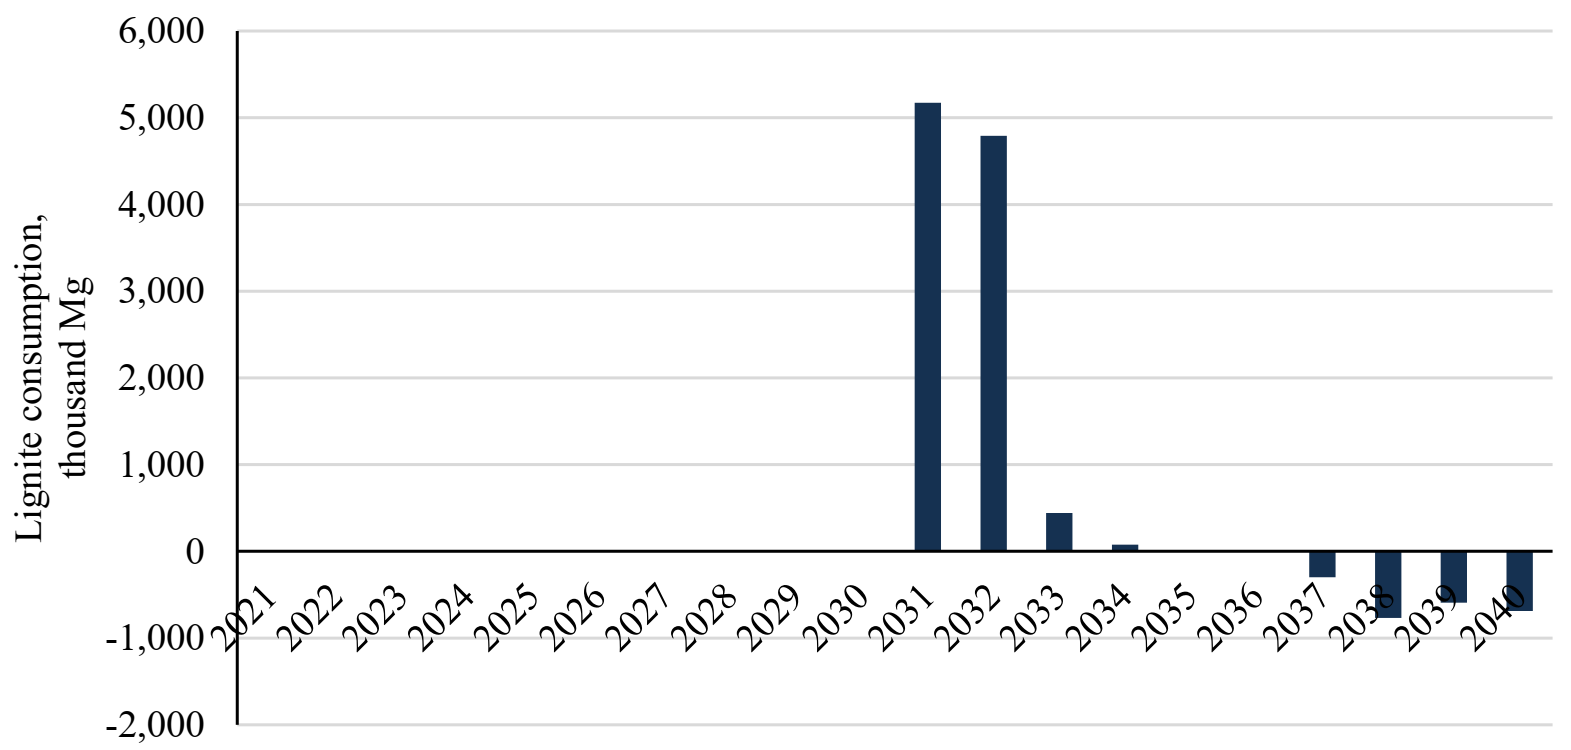
Lignite consumption over the period 2021–2040 under both of the scenarios examined is shown in Figure 17. As is the case with hard coal consumption, the decrease is observed throughout the entire period of analysis and under the two scenarios. Similarly, periods with characteristic differences are observed (Figure 18). Table 9 provides detailed information about these differences over the period analysed and the scenarios examined.
In 2021–2030, lignite consumption decreases from 59.4 million Mg to 50.2 million Mg. The reduction stems from the fact that some lignite-fired power generation units are decommissioned. However, as previously mentioned, the causes of the decommissioning are technical, not financial. The results indicate that lignite-fired units meet the condition of economic efficiency, and they work as base-load units in these years.
The difference between the scenarios is the greatest in 2031–2032. During this period, lignite-fired power units generate a smaller amount of electricity in the EOM scenario because other units have priority due to lower generation costs (e.g., renewable, gas-fired). Increasing prices of the CO2 European Emission Allowances result in increasing costs of electricity generation in lignite-fired power generation units when compared to other technologies. In the following years, lignite consumption is similar under the scenarios examined (2033–2034) or even the same (2035).
In 2037–2040, the lignite consumption is greater in the EOM scenario (4.9 million Mg compared to 4.5 million Mg in the CM scenario). The change of the trend stems from the fact that there is a lower gas-fired generation capacity in the EOM scenario (with a lower cost of power generation). This level is higher in the CM scenario due to reserve margin requirements in the power system at 30.91%.
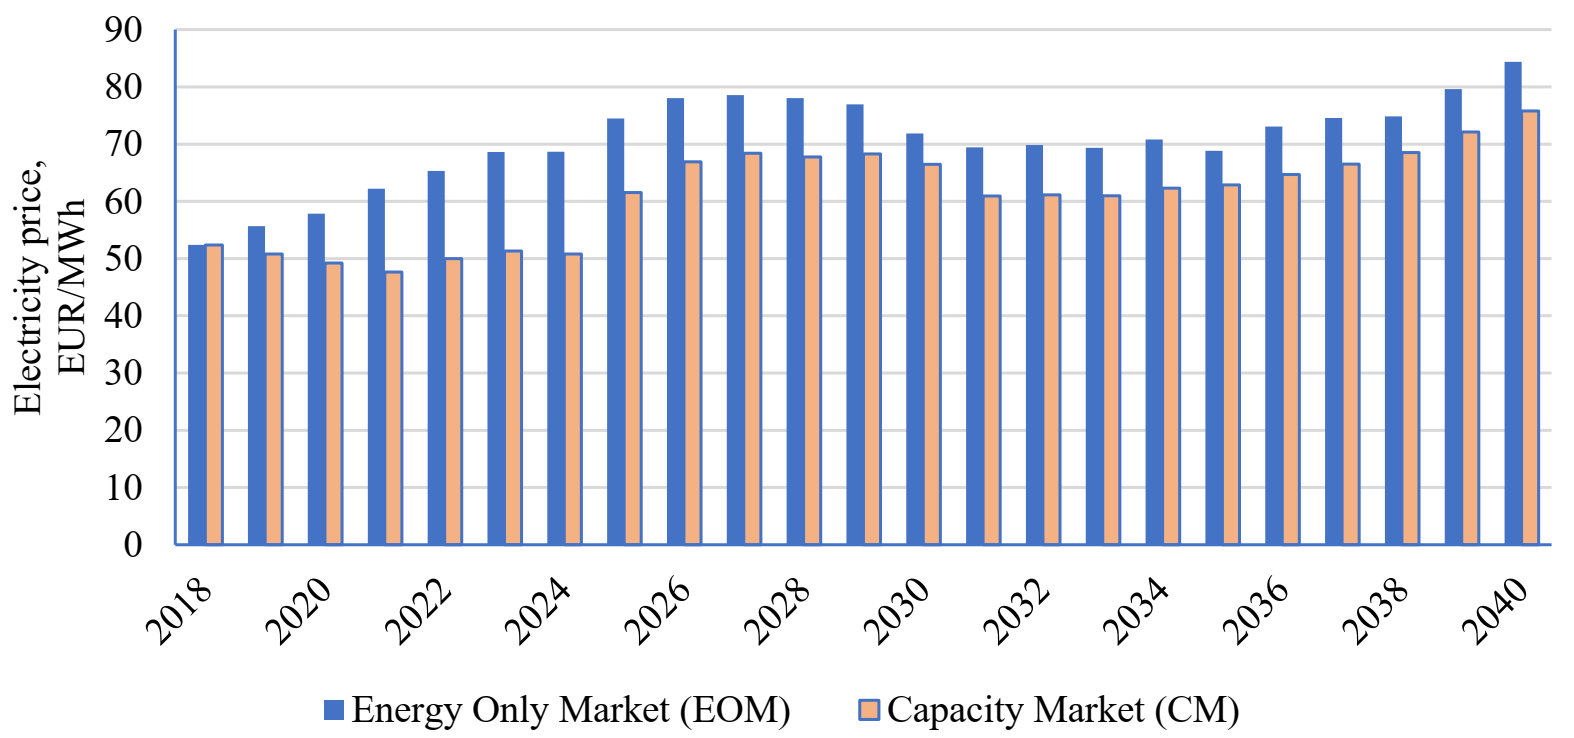
3.4. Electricity Prices
The electricity prices in both scenarios are shown in Figure 19. The prices are higher under the EOM scenario regardless of the year of analysis. They range from EUR 62.2/MWh to EUR 84.4/MWh, while in the CM scenario, electricity prices range from EUR 47.7/MWh to EUR 78.8/MWh. This is because electricity prices reflect not only the generation cost but also the reserve margin in the power system. Since the assumption of a reserve margin at 30.91% was adopted in the capacity market (based on past auctions), this is sufficient to maintain lower prices. In the EOM scenario, the reserve margin is always lower, resulting in greater electricity prices.
Table 10 provides more detailed information about changes in the electricity prices over the period analysed and the scenarios examined.
4. Conclusions
The research carried out in this paper forms the first study on the quantitative assessment of the long-term impact of the introduction of a capacity market on decarbonisation in power systems with a high penetration of fossil fuels. Since the capacity market has been introduced in Poland relatively recently, the results of the analyses and the conclusions drawn on their basis constitute a significant contribution to the discussion on the legitimacy and consequences of its implementation.
The impact of the introduction of a capacity market on the decarbonisation of the Polish power system was assessed based on the (i) coal-fired generation capacity in the power system, (ii) electricity generation from coal-fired units, and (iii) quantity of coal consumption for electricity generation. Additionally, the forecasts for electricity prices in 2021–40 were also calculated.
The findings show that the introduction of the capacity market results in the slowing down of the decarbonisation process in Poland. This instrument mainly provides support for thermal power plants that consume fossil fuels. The consequences of lengthy capacity agreements (for as long as 15 years) are observed in the long-run. As a result, coal-fired power units are maintained far longer than without the capacity remuneration mechanism.
The results indicate that the decarbonisation of the Polish power system is inevitable by 2040 regardless of the scenario analysed. Hard coal consumption decreases by 86.9% and 87.9%, respectively, in the EOM and CM scenarios. Lignite consumption is reduced by 91.8% and by 93.0%, respectively. Research findings point out, however, that the introduction of a capacity market results in a delay in the process of decarbonisation of the Polish power system. A slowing down of the process of withdrawing hard coal-fired power generation units is observed in 2021–2030, and in the case of lignite-fired units in 2031–2032. The greatest difference between hard coal consumption for power generation under EOM and CM scenarios is as much as 19.2% per year. Whereas, in the case of lignite, the greatest difference is 18.2%.
Coal consumption for electricity generation also decreases regardless of the research scenario. Differences are observed between the two scenarios, especially in the case of hard coal consumption. The capacity market supported these units in the first years of its operation. The results indicate that numerous hard coal-fired power units would have to be decommissioned from the power system without the support from the capacity mechanism because maintaining them in the system would be unprofitable. The introduction of the capacity market does not significantly impact lignite consumption. In the first ten years of the analysis, the volume of generation capacity in the system is the same for both scenarios. Lignite consumption decreases regardless of the scenario considered (due to the technical condition of the plants, not because of economic inefficiency). These units generate electricity at a sufficiently low price to operate as the base-load of the power system. The differences between the scenarios occur when the increase in the price of the CO2 European Emission Allowances is large enough to push them out of the system by units with lower generation costs.
In the last year of analysis, the hard coal and lignite consumption is greater in the scenario without a capacity remuneration mechanism. This stems from the fact that coal-fired units have a greater share in the EOM scenario. Consequently, more coal-fired units generate electricity in peak demand than is the case in the CM scenario.
The decarbonisation of the Polish power system through the phasing-out of coal-fired units is inevitable by 2040 regardless of the scenario analysed. The capacity market does not stop the transformation, although it delays the process significantly, particularly in the upcoming years. As a result, the capacity market has a negative impact on carbon neutrality in the short- and mid-term.
However, the operation of the capacity market ensures an adequate reserve margin in the power system. As a consequence, energy security is improved. In addition, the implementation of the capacity remuneration mechanism ensures the stability of energy supplies during the first phase of the decarbonisation process of the Polish power system. The support mechanism also extends the time for the preparation of new regulations and support schemes for other technologies (e.g., renewables, energy storage, demand-side response) and the climate and energy policies required for further phases of the energy transition and decarbonisation of the Polish power system.
Funding
This research was funded by the National Science Centre, Poland, grant number 2019/35/N/HS4/00171.
Institutional Review Board Statement
Not applicable.
Informed Consent Statement
Not applicable.
Data Availability Statement
Not applicable.
Acknowledgments
The author would like to thank Jacek Kamiński and Pablo Benalcazar for their insightful comments and suggestions.
Conflicts of Interest
The author declares no conflict of interest.
Abbreviations
| CHP | Combined Heat and Power |
| CM | Capacity Market |
| CRM | Capacity Remuneration Mechanism |
| DSR | Demand-Side Response |
| EESs | Energy Storage Systems |
| EDP | Economic Dispatch Problem |
| EOM | Energy Only Market |
| GHG | Greenhouse Gas |
| LP | Linear Programming |
| PHS | Pumped Hydro Storage |
| TSO | Transmission System Operator |
| VoLL | Value of Lost Load |
| VOM | Variable Operations and Maintenance |
Appendix A


References
- Kueppers, M.; Pineda, S.N.P.; Metzger, M.; Huber, M.; Paulus, S.; Heger, H.J.; Niessen, S. Decarbonization pathways of worldwide energy systems—Definition and modeling of archetypes. Appl. Energy 2021, 285, 116438. [Google Scholar] [CrossRef]
- Goldthau, A.; Sovacool, B.K. The uniqueness of the energy security, justice, and governance problem. Energy Policy 2012, 41, 232–240. [Google Scholar] [CrossRef]
- Zhang, X.; Löschel, A.; Lewis, J.; Zhang, D.; Yan, J. Emissions trading systems for global low carbon energy and economic transformation. Appl. Energy 2020, 279, 115858. [Google Scholar] [CrossRef]
- Pietzcker, R.C.; Osorio, S.; Rodrigues, R. Tightening EU ETS targets in line with the European Green Deal: Impacts on the decarbonization of the EU power sector. Appl. Energy 2021, 293, 116914. [Google Scholar] [CrossRef]
- Audoly, R.; Vogt-Schilb, A.; Guivarch, C.; Pfeiffer, A. Pathways toward zero-carbon electricity required for climate stabilization. Appl. Energy 2018, 225, 884–901. [Google Scholar] [CrossRef] [Green Version]
- Kamiński, J. The impact of liberalisation of the electricity market on the hard coal mining sector in Poland. Energy Policy 2009, 37, 925–939. [Google Scholar] [CrossRef]
- Bowring, J. Capacity Markets in PJM. Econ. Energy Environ. Policy 2013, 2, 47–65. [Google Scholar] [CrossRef] [Green Version]
- Kirschen, D.; Strbac, G. Fundamentals of Power System Economics, 2nd ed.; John Wiley & Sons Ltd.: Hoboken, NJ, USA, 2004. [Google Scholar]
- Bastos, J.P.; Cunha, G.; Barroso, L.A.; Aquino, T. Reliability mechanism design: An economic approach to enhance adequate remuneration and enable efficient expansion. Energy 2018, 158, 1150–1159. [Google Scholar] [CrossRef]
- Cramton, P.; Ockenfels, A.; Stoft, S. Capacity Market Fundamentals. Econ. Energy Environ. Policy 2013, 2, 27–46. [Google Scholar] [CrossRef] [Green Version]
- Komorowska, A. Capacity remuneration mechanisms: Classification and experiences. Polityka Energetyczna Energy Policy J. 2021, 24, 101–114. [Google Scholar] [CrossRef]
- ACER. Capacity Remuneration Mechanisms and the Internal Market for Electricity. 2013. Available online: https://documents.acer.europa.eu/Official_documents/Acts_of_the_Agency/Publication/CRMs%20and%20the%20IEM%20Report%20130730.pdf (accessed on 20 August 2021).
- Bhagwat, P. Security of Supply During the Energy Transition. The Role of Capacity Mechanisms. Ph.D. Thesis, Delft University of Technology, Delft, The Netherlands, 2016. [Google Scholar]
- Spees, K.; Newell, S.A.; Pfeifenberger, J.P. Capacity Markets—Lessons Learned from the First Decade. Econ. Energy Environ. Policy 2013, 2, 3–26. [Google Scholar] [CrossRef]
- Briggs, R.; Kleit, A.N. Resource adequacy reliability and the impacts of capacity subsidies in competitive electricity markets. Energy Econ. 2013, 40, 297–305. [Google Scholar] [CrossRef]
- Mays, J.; Morton, D.P.; O’Neill, R.P. Decarbonizing electricity requires re-evaluating capacity mechanisms. Nat. Energy 2019, 4, 912–913. [Google Scholar] [CrossRef]
- Lin, J.; Vatani, B. Impact of capacity market design on power system decarbonization. In Proceedings of the 2017 14th International Conference on the European Energy Market (EEM), Dresden, Germany, 6–9 June 2017; IEEE: Piscataway, NJ, USA, 2017; pp. 1–6. [Google Scholar]
- Polzin, F.; Egli, F.; Steffen, B.; Schmidt, T. How do policies mobilize private finance for renewable energy?—A systematic review with an investor perspective. Appl. Energy 2019, 236, 1249–1268. [Google Scholar] [CrossRef]
- Fang, X.; Hodge, B.-M.; Li, F. Capacity Market Model Considering Flexible Resource Requirements. In Proceedings of the 2018 IEEE Power & Energy Society General Meeting (PESGM), Portland, OR, USA, 5–10 August 2018; IEEE: Piscataway, NJ, USA, 2018; pp. 1–5. [Google Scholar]
- Komorowska, A.; Benalcazar, P.; Kaszyński, P.; Kamiński, J. Economic consequences of a capacity market implementation: The case of Poland. Energy Policy 2020, 144, 111683. [Google Scholar] [CrossRef]
- PSE. Summary of Quantitative Data on the Functioning of the National Power System in 2019. 2020. Available online: https://www.pse.pl/dane-systemowe/funkcjonowanie-kse/raporty-roczne-z-funkcjonowania-kse-za-rok/raporty-za-rok-2019. (accessed on 5 June 2020).
- Papadis, E.; Tsatsaronis, G. Challenges in the decarbonization of the energy sector. Energy 2020, 205, 118025. [Google Scholar] [CrossRef]
- Olczak, P.; Kryzia, D.; Matuszewska, D.; Kuta, M. “My Electricity” Program Effectiveness Supporting the Development of PV Installation in Poland. Energies 2021, 14, 231. [Google Scholar] [CrossRef]
- European Commission. The European Green Deal. 2019. Available online: https://ec.europa.eu/clima/policies/eu-climate-action_en (accessed on 20 August 2021).
- Magazzino, C. Is per capita energy use stationary? Time series evidence for the EMU countries. Energy Explor. Exploit. 2016, 35, 24–32. [Google Scholar] [CrossRef]
- Magazzino, C.; Porrini, D.; Fusco, G.; Schneider, N. Investigating the link among ICT, electricity consumption, air pollution, and economic growth in EU countries. Energy Sour. Part B Econ. Plann. Policy 2021, 1–23. [Google Scholar] [CrossRef]
- Farzaneh, H. Energy Systems Modeling—Principles and Applications; Springer: Berlin/Heidelberg, Germany, 2019. [Google Scholar]
- Ministry of Energy. Project of the Polish Energy Policy. 2019. Available online: https://www.gov.pl/attachment/cff9e33d-426a-4673-a92b-eb4fb0bf4a04 (accessed on 5 June 2020).
- Komorowska, A.; Kamiński, J. A review of the 2018 Polish capacity market auctions. Polityka Energet. Energy Policy J. 2019, 22, 75–88. [Google Scholar] [CrossRef]
- European Parliament and Council. Regulation (EU) 2019/943 of the European Parliament and of the Council of 5 June 2019 on the internal Market for Electricity; European Parliament and Council: Strasbourg, France, 2019. [Google Scholar]
- PSE SA. Summary of Quantitative Data on Polish Power System in 2018. 2019. Available online: https://www.pse.pl/dane-systemowe/funkcjonowanie-kse/raporty-roczne-z-funkcjonowania-kse-za-rok/raporty-za-rok-2018 (accessed on 17 August 2019).
- Komorowska, A. Cross-border exchange of electricity between Poland and the neighboring countries. Polityka Energet. Energy Policy J. 2019, 22, 37–52. [Google Scholar] [CrossRef]
- PSE SA. Electricity Generation. Available online: https://www.pse.pl/dane-systemowe/funkcjonowanie-kse/raporty-dobowe-z-pracy-kse/generacja-mocy-jednostek-wytworczych (accessed on 13 April 2019).
- ENTSO-E. Actual Generation per Production Type. 2019. Available online: https://transparency.entsoe.eu/generation/r2/actualGenerationPerProductionType/show (accessed on 14 August 2019).
- IEA. World Energy Outlook 2018. 2019. Available online: https://iea.blob.core.windows.net/assets/77ecf96c-5f4b-4d0d-9d93-d81b938217cb/World_Energy_Outlook_2018.pdf (accessed on 5 April 2020).
- Kryzia, D.; Gawlik, L. Forecasting the price of uranium based on the costs of uranium deposits exploitation. Gospod. Surowcami Miner. 2016, 32, 93–110. [Google Scholar] [CrossRef] [Green Version]
- Energy Market Agency. Statistical Information on Electricity 2018; Energy Market Agency: Warszawa, Poland, 2019.
- Energy Market Agency. Technical and Economic Situation in the Power Sector 2018; Energy Market Agency: Warszawa, Poland, 2019.
- CIRE. CO2 European Emission Allowance in 2003–2019. 2019. Available online: https://handel-emisjami-co2.cire.pl (accessed on 4 October 2019).
- Ministry of Energy. The Act of 8 December 2017 on capacity market (Dz.U. 2018 poz. 9); Ministry of Energy: Warszawa, Poland, 2018.
- Brinsmead, T.S.; Graham, P.; Hayward, J.; Ratnam, E.L.; Reedman, L. Future Energy Storage Trends. An assessment of the Economic Viability, Potential Uptake and Impacts of Electrical Energy Storage on the NEM 2015–2035; CSIRO Energy: Newcastle, Australia, 2015. [Google Scholar]
- PIME. Electricity Storage Market in Poland—Technologies, Implementations, Regulations; PIME: Warszawa, Poland, 2019. [Google Scholar]
- Gawel, E.; Strunz, S.; Lehmann, P.; Purkus, A. The European Dimension of Germany’s Energy Transition; Springer: Berlin/Heidelberg, Germany, 2019. [Google Scholar]
- Ministry of Infrastructure and Development. Guidelines on Issues Related to the Preparation of Investment Projects, Including Income-Generating and Hybrid Projects for 2014–2020; Ministry of Infrastructure and Development: Warszawa, Poland, 2019.
- Widera, M.; Kasztelewicz, Z.; Ptak, M. Lignite mining and electricity generation in Poland: The current state and future prospects. Energy Policy 2016, 92, 151–157. [Google Scholar] [CrossRef]
Figure 1.
The methodology employed in the study.

Figure 2.
Research scenarios.

Figure 3.
Calculation procedure under the EOM scenario.

Figure 4.
Calculation procedure under the CM scenario.

Figure 5.
Power demand in the Polish power system in 2018 (based on [31]).
Figure 5.
Power demand in the Polish power system in 2018 (based on [31]).

Figure 6.
The average utilisation rate of CHP plants in 2018 (based on [33]).
Figure 6.
The average utilisation rate of CHP plants in 2018 (based on [33]).

Figure 7.
Renewable capacity in 2018–2040 (based on [28]).
Figure 7.
Renewable capacity in 2018–2040 (based on [28]).


Figure 10.
Generation capacity in the power system under the EOM and CM scenarios in 2021–2040.

Figure 11.
Hard coal-fired generation capacity under the EOM and CM scenarios in 2021–2040.

Figure 12.
Lignite-fired generation capacity under the EOM and CM scenarios in 2021–2040.

Figure 13.
Electricity generation from hard coal-fired units under the EOM and CM scenarios in 2021–2040.
Figure 13.
Electricity generation from hard coal-fired units under the EOM and CM scenarios in 2021–2040.

Figure 14.
Electricity generation from lignite-fired units under the EOM and CM scenarios in 2021–2040.
Figure 14.
Electricity generation from lignite-fired units under the EOM and CM scenarios in 2021–2040.

Figure 15.
Hard coal consumption for electricity generation under the EOM and CM scenarios in 2021–2040.
Figure 15.
Hard coal consumption for electricity generation under the EOM and CM scenarios in 2021–2040.

Figure 16.
Differences in hard coal consumption between the CM and EOM scenarios in 2021–2040.

Figure 17.
Lignite consumption for electricity generation under the EOM and CM scenarios in 2021–2040.
Figure 17.
Lignite consumption for electricity generation under the EOM and CM scenarios in 2021–2040.

Figure 18.
Differences in lignite consumption between the CM and EOM scenarios in 2021–2040.

Figure 19.
Electricity prices under the EOM and CM scenarios in 2021–2040.

Table 1.
Symbol of sets, parameters, and variables used in the model.
| Name | Explanation |
|---|---|
| Sets | |
| Generation unit or group of units, | |
| Fuel, | |
| Pollutants and carbon dioxide, | |
| Hours, | |
| Parameters | |
| Incidence matrix–assignment of fuel to generation unit or group of units (1–if fuel is used by generation unit or group of units , 0–otherwise) | |
| Generation capacity of a generation unit or group of units (MW) | |
| Own-consumption factor of a generation unit or group of units | |
| Availability factor of a generation unit or group of units at hour | |
| Ramp-up rate of a generation unit or group of units | |
| Ramp-down rate of a generation unit or group of units | |
| Capacity factor of a generation unit or group of units | |
| Net electrical efficiency of a generation unit or group of units | |
| Price of fuel (EUR/MWh) | |
| Emission factor of pollutants or carbon dioxide in a generation unit or group of units (kg/MWh) | |
| Environmental charges for emissions of pollutants and carbon dioxide and CO2 European Emission Allowances (EUR/kg) | |
| Variable operation and maintenance (VOM) cost of a generation unit or group of units (EUR/MWh) | |
| Power demand at hour (MW) | |
| Power import at hour (MW) | |
| Power export at hour (MW) | |
| Duration (1–in the case of a model with hourly intervals) (h) | |
| Variables | |
| Power generation by a generation unit or group of units at hour (MW) | |
| Total variable cost of a power generation in the power system (billon EUR) | |
| Parameters used in post-optimisation calculations | |
| Fixed cost of a generation unit or group of units per 1 MW (million EUR/MW) | |
| System marginal price at hour (EUR/MWh) | |
| Margin at hour | |
| Calorific value of fuel (MJ/Mg or MJ/thousand m3) | |
| Variables calculated in post-optimisation calculations | |
| Market clearing price at hour (EUR/MWh) | |
| Revenue of a generation unit or group of units at hour (million EUR) | |
| Total cost of a power generation in the generation unit or group of units (million EUR) | |
| Profit of a generation unit or group of units (million EUR) | |
| Missing money of a generation unit or group of units (million EUR) | |
| Chemical energy demand of a generation unit or group of units (GJ) | |
| Hard coal consumption in a generation unit or group of units (thousand Mg) | |
| Total hard coal consumption for electricity generation in the power system (million Mg) | |
| Lignite consumption in a generation unit or group of units (thousand Mg) | |
| Total lignite consumption for electricity generation in the power system (million Mg) | |
Table 2.
Electricity demand in 2018–2040.
| Parameter | Unit | 2018 | 2021 | 2025 | 2030 | 2035 | 2040 |
|---|---|---|---|---|---|---|---|
| Electricity demand | TWh | 171.1 | 178.9 | 190.0 | 204.6 | 220.4 | 237.4 |
Table 3.
Power demand in the CM scenario until 2040.
| Year | Power Demand [GW] |
|---|---|
| 2021 | 27.4 |
| 2025 | 37.5 |
| 2030 | 41.0 |
| 2035 | 44.2 |
| 2040 | 47.6 |
Source: Own analyses based on [28].
Table 4.
Generation capacity in hard coal-fired power generation units.
| Energy Only Market (EOM) | Capacity Market (CM) | |||
|---|---|---|---|---|
| 2018 | 20.6 GW | |||
| Generation capacity | Changes compared to 2018 | Generation capacity | Changes compared to 2018 | |
| 2021 | 16.8 GW | 18.6% | 21.4 GW | 3.9 % |
| 2025 | 14.9 GW | 27.5% | 18.8 GW | 8.6% |
| 2030 | 11.3 GW | 45.3% | 13.8 GW | 33.1% |
| 2035 | 7.9 GW | 61.6% | 7.9 GW | 61.6% |
| 2040 | 7.2 GW | 65.0% | 7.2 GW | 65.0% |
Table 5.
Generation capacity in lignite-fired power generation units.
| Energy Only Market (EOM) | Capacity Market (CM) | |||
|---|---|---|---|---|
| 2018 | 8.7 GW | |||
| Generation capacity | Changes compared to 2018 | Generation capacity | Changes compared to 2018 | |
| 2021 | 8.3 GW | 4.9% | 8.3 GW | 4.9% |
| 2025 | 7.5 GW | 14.0% | 7.5 GW | 14.0% |
| 2030 | 6.9 GW | 20.9% | 6.9 GW | 20.9% |
| 2035 | 3.4 GW | 61.0% | 3.4 GW | 61.0% |
| 2040 | 1.9 GW | 78.6% | 1.9 GW | 78.6% |
Table 6.
Electricity generation in hard coal-fired power units.
| Energy Only Market (EOM) | Capacity Market (CM) | |||
|---|---|---|---|---|
| 2018 | 83.2 TWh | |||
| Electricity generation | Changes compared to 2018 | Electricity generation | Changes compared to 2018 | |
| 2021 | 81.2 TWh | 2.4% | 88.0 TWh | 5.9% |
| 2025 | 72.2 TWh | 13.2% | 76.6 TWh | 7.9% |
| 2030 | 43.7 TWh | 47.4% | 48.4 TWh | 41.8% |
| 2035 | 25.7 TWh | 69.1% | 25.5 TWh | 69.3% |
| 2040 | 14.4 TWh | 82.7% | 13.4 TWh | 83.9% |
Table 7.
Electricity generation in lignite-fired power units.
| Energy Only Market (EOM) | Capacity Market (CM) | |||
|---|---|---|---|---|
| 2018 | 45.7 TWh | |||
| Electricity generation | Changes compared to 2018 | Electricity generation | Changes compared to 2018 | |
| 2021 | 47.4 TWh | 3.6% | 47.4 TWh | 3.6% |
| 2025 | 43.7 TWh | 4.5% | 43.7 TWh | 4.5% |
| 2030 | 40.5 TWh | 11.5% | 40.5 TWh | 11.5% |
| 2035 | 17.7 TWh | 61.3% | 17.7 TWh | 61.3% |
| 2040 | 4.4 TWh | 90.3% | 3.8 TWh | 91.6% |
Table 8.
Hard coal consumption for electricity generation.
| Energy Only Market (EOM) | Capacity Market (CM) | |||
|---|---|---|---|---|
| 2018 | 37.1 Million Mg | |||
| Hard coal consumption | Changes compared to 2018 | Hard coal consumption | Changes compared to 2018 | |
| 2021 | 33.8 million Mg | 9.0% | 37.2 million Mg | 0.2% |
| 2025 | 29.1 million Mg | 21.5% | 31.4 million Mg | 15.4% |
| 2030 | 15.7 million Mg | 57.7% | 17.9 million Mg | 51.9% |
| 2035 | 8.9 million Mg | 75.9% | 8.9 million Mg | 76.1% |
| 2040 | 4.9 million Mg | 86.9% | 4.5 million Mg | 87.9% |
Table 9.
Lignite consumption for electricity generation.
| Energy Only Market (EOM) | Capacity Market (CM) | |||
|---|---|---|---|---|
| 2018 | 58.4 Million Mg | |||
| Lignite consumption | Changes compared to 2018 | Lignite consumption | Changes compared to 2018 | |
| 2021 | 59.4 | 1.8% | 59.4 | 1.8% |
| 2025 | 54.4 | 6.8% | 54.4 | 6.8% |
| 2030 | 50.2 | 14.1% | 50.2 | 14.1% |
| 2035 | 21.2 | 63.7% | 21.2 | 63.7% |
| 2040 | 4.8 | 91.8% | 4.1 | 93.0% |
Table 10.
Average annual electricity prices.
| Energy Only Market (EOM) | Capacity Market (CM) | |||
|---|---|---|---|---|
| 2018 | EUR 52.4/MWh | |||
| Electricity price | Changes compared to 2018 | Electricity price | Changes compared to 2018 | |
| 2021 | EUR 62.2 | 18.8% | EUR 47.7 | 9.0% |
| 2025 | EUR 74.5 | 42.2% | EUR 61.5 | 17.5% |
| 2030 | EUR 71.9 | 37.2% | EUR 66.5 | 26.9% |
| 2035 | EUR 68.8 | 31.4% | EUR 62.9 | 20.0% |
| 2040 | EUR 84.4 | 61.1% | EUR 75.8 | 44.7% |
Publisher’s Note: MDPI stays neutral with regard to jurisdictional claims in published maps and institutional affiliations. |
© 2021 by the author. Licensee MDPI, Basel, Switzerland. This article is an open access article distributed under the terms and conditions of the Creative Commons Attribution (CC BY) license (https://creativecommons.org/licenses/by/4.0/).
Share and Cite
MDPI and ACS Style
Komorowska, A. Can Decarbonisation and Capacity Market Go Together? The Case Study of Poland. Energies 2021, 14, 5151. https://doi.org/10.3390/en14165151
AMA Style
Komorowska A. Can Decarbonisation and Capacity Market Go Together? The Case Study of Poland. Energies. 2021; 14(16):5151. https://doi.org/10.3390/en14165151
Chicago/Turabian StyleKomorowska, Aleksandra. 2021. "Can Decarbonisation and Capacity Market Go Together? The Case Study of Poland" Energies 14, no. 16: 5151. https://doi.org/10.3390/en14165151
Note that from the first issue of 2016, this journal uses article numbers instead of page numbers. See further details here.