Article

Limestone Sorbents Market for Flue Gas Desulphurisation in Coal-Fired Power Plants in the Context of the Transformation of the Power Industry—A Case of Poland

by
Jarosław Szlugaj
* and
Krzysztof Galos
*
Mineral and Energy Economy Research Institute, Polish Academy of Sciences, J. Wybickiego 7A, 31-261 Kraków, Poland
*
Authors to whom correspondence should be addressed.
Energies 2021, 14(14), 4275; https://doi.org/10.3390/en14144275
Submission received: 21 May 2021 / Revised: 9 July 2021 / Accepted: 12 July 2021 / Published: 15 July 2021

Abstract

:
Since the beginning of the 1990s, due to international regulations on air quality, a large number of flue gas desulphurisation (FGD) installations have been constructed in the Polish coal-fired power industry. Thanks to that, SO2 capture in this industry increased to ca. 90%. Since wet lime or fluidized bed boilers were mostly used for FGD purposes, a significant increase in the domestic demand for lime sorbents has been reported. Between 1994 and 2019, it has increased from virtually zero before 1994 to about 3.3–3.4 million tpy (tonnes per year) today. On the basis of official governmental data and completed surveys of the Polish power companies, the paper analyses the process of the implementation of FGD in Poland along with limestone sorbents consumption and FGD gypsum production in the Polish coal-fired power plants. It also presents the current and potential limestone resource base for production of limestone sorbents applied in FGD. Electric energy mix in Poland is expected to be changed radically in the coming 30 years. Share of coal-based electricity is still very high—ca. 80%—and it will remain dominant for at least next decade. With the next coming FGD installations, further moderate increase of limestone sorbents consumption is expected, up to 3.7 million tpy in 2030. After 2030, a significant, quick decrease of share of coal-fired electricity is expected in Poland, down to max. 30% just before 2050. This will result in a gradual decrease in limestone sorbent demand, to max. 1.3 million tpy before 2050 and virtually zero after 2050, which will be followed by collapse of FGD gypsum production.

1. Introduction

Global climate warming and pollution-related effects on human health have placed air pollution at the heart of EU policy decision-making [1]. Although from a global perspective, coal will remain one of the main sources of energy for a long time [2], the European Union have implemented strict regulations to improve air quality, including—or even especially—in the Eastern European countries admitted to the EU in 2004 and 2007. First air quality directives at European level were introduced in 1970, 1980 and 1985 [3]. However, a significant step was made in 1996, when the EU adopted a series of actions to decrease pollutant emissions throughout Europe, also implementing harmonised structure for monitoring, reporting and managing air quality across the EU through 1996 Air Quality Framework Directive [4] and its daughter directives, e.g., setting limit values and alert thresholds for major pollutants. The first such daughter directive [5] established limit values for sulphur dioxide, nitrogen oxides, lead and particulates. In 2005, according to 2005 Thematic Strategy on Air Pollution [6], the European Commission proposed to consolidate the Framework Directive and the first three daughter directives into a single Ambient Air Quality Directive, what was finally adopted as [7], providing the current framework for the control of ambient concentrations of air pollution in the EU. As a consequence of these actions, further more detailed actions have been carried out by the European Commission for individual types of activities related to the emission of pollutants into the air. For large combustion plants these have been: the European Union’s Directive 2001/80/EC [8], Directive 2010/75/EU [9] or BAT reference documents [10]. As a result, also intensive Flue Gas Desulphurisation investments have been conducted in recent decades in coal-based power industries of numerous countries, not only in those belonging to the EU [11,12,13].
In recent years, energy and climate started to be one of the cornerstones of EU policy [14]. This process was initiated by establishing a scheme for greenhouse gas emission allowance trading in 2003 [15], improved and extended in 2009 [16]. Recently, the EU energy and climate goals have been incorporated into the Europe 2020 Strategy for smart, sustainable and inclusive growth. The EU has set overarching targets of greenhouse gas (GHG) emissions reduction known as so-called 20/20/20 targets, namely, reduction of GHG emissions by 20%, increase of Renewable Energy Sources (RES) share to 20% and increase of energy efficiency by 20%, until 2020 [17,18]. In 2019, the EC adopted “Clean Energy for Europe Package” which upheld the right of the EU member states to continue their own energy mix, but with an increased share of renewables in it (on average, 32% in 2030 in the EU), with appropriate measures to accommodate such rising share of renewable energy [19]. As a result, decarbonisation of electricity systems together with substantial increase in renewable energy sources is one of the main policy priorities to foster EU energy transition. Thus, energy mixes are at the moment coal-free in 6 EU and 3 EEA countries and are planned to be coal-free until 2030 in the next 12 EU countries, but this is still not the case for numerous Eastern EU countries, including Poland [20].
The above-mentioned EU actions have been followed by detailed actions at the level of individual EU countries [21]. In Poland, the most important of them are at the moment: the “National Air Protection Program by 2020” adopted in 2015 [22], a 2021 Energy Policy of Poland until 2040 adopted in February 2021 [23], and National energy and climate plan for 2021–2030 adopted in December 2019 [24].
In Poland, coal has been a key driver of energy security for decades. Hard coal and lignite are traditionally the most important fuels used in Poland due to their abundant resources available in the country. Despite all transition trends resulting in its declining role, it still accounts for majority of the Polish electricity mix [25,26]. Without doubt, the Polish power industry stands at a crossroads, facing pathways with various ambitions of emission reductions, being strongly affected by environmental and decarbonisation regulations. According to the latest Energy Policy of Poland until 2040, the share of coal in the Polish electricity mix will decrease to a maximum of 56% in 2030, while share of RES will rise to 32%. In the next decade, pace of further decrease of coal in electricity mix will heavily depend on EU ETS allowances prices, achieving 37% in 2040 [24]. Various electricity mix scenarios in perspective of 2050 are still possible. In the strong decarbonisation (high EU ETS allowances prices) scenario, it is assumed that in 2050 coal will be used in Poland at most in CHP (Central Heating Plants) generating electricity together with hot water for district heating networks, with coal-based electricity generation decreasing from ca. 130 TWh in 2015 down to 30–50 TWh in 2050, constituting ca. 15% of the electricity mix. A complete phase-out of coal-based power industry by 2050 also cannot be excluded [26,27].
As the Polish power industry has traditionally relied on the combustion of coal (hard coal and lignite), it has generated significant amounts of SO2 and other gases. Commercial power generation emitted about 1.6 million tonnes SO2 in 1990, about 0.8 million tonnes SO2 in 2000, and only about 0.25 million tonnes SO2 in 2018. The total amount of SO2 generated from combustion processes (mainly coal combustion) was much higher, but there has been a fundamental change in the extent of active flue gas desulphurisation (FGD) systems at domestic power plants and combined heat and power plants over the last 30 years. As a result, the amount of SO2 retained at these FGD plants increased from ca. 0.33 million tonnes SO2 in 1990 to ca. 0.60 million tonnes SO2 in 2000 and ca. 1.9 million tonnes SO2 in 2018 [28,29,30], meaning that these FGD plants were already retaining nearly 90% of the SO2 generated.
Due to the above-mentioned factors, an intensive modernisation process in the Polish power industry started in the early 1990s, concerning in particular the construction of FGD plants, or in the case of general modernisation of power units, sometimes introduction of fluidized bed boilers, where the desulphurisation process takes place in the boiler immediately after the combustion of fuel (mainly coal) [29]. The technological solutions applied to capture the SO2 generated during combustion vary; nevertheless, two approaches have gained the greatest importance in Poland: construction of FGD using the wet limestone method, and semi-dry method, at the existing, modernized or newly built power units burning hard coal or lignite, or the aforementioned introduction of fluidized bed boilers. In both cases, limestone of suitable quality is used as sorbent, with limestone flour, of finer granulation, in the wet limestone method and limestone sand, of slightly coarser granulation, in fluidized bed boilers. In the semi-dry method of flue gas desulphurisation, the main type of sorbent is a quicklime [31,32].
The progressing process of implementation of FGD methods in the Polish power industry (as well as in industrial power sector and partly in the heat industry) contributed to the development of domestic demand for limestone sorbents from practically zero level at the beginning of 1990s to about 3.5 million tpy (tonnes per year) at present. As a result, the power industry has become one of the most important customers of the Polish lime industry, which, on the other hand, have experienced a significant reduction in demand for traditional lime products, in particular for various types of lime [33].
By considering all of the factors mentioned above, this article aims to analyse sources of limestone sorbents in Poland, as well as their use in the Polish power industry for FGD purposes. It has been done not only to recognize current situation, but also with an attempt to forecast in this respect in the perspective of 2050, taking into account the most important economic, technological, environmental and policy factors, both at the EU and at the national level.

2. Materials and Methods

Extensive analyses of the limestone resource base and of limestone use in Poland were performed. For these purposes, the most important sources of information were: annual publications on mineral resource base in Poland [34,35,36], publications reviewing this resources base [37,38], older analyses of industrial limestone market in Poland [39], and official data of the Statistics Poland (GUS) [28,40]. Other official reports on the domestic power generation industry were also used [41,42].
For obtaining reliable information on limestone flour consumption by the Polish power generation industry, the authors surveyed relevant power companies in the field of applied FGD methods, type, amounts and sources of limestone sorbent applied, as well as amount of FGD gypsum (and other FGD products) obtained. In total, 18 power companies were surveyed, of which 14 responded (including all seven major ones). Quantity of limestone consumption and FGD-gypsum production for power industry companies, which did not respond to the survey, were deduced from their actual energy production and known parameters of their FGD installations, as well as their prior available data on sorbent consumption.

3. Results

3.1. Methods of Desulphurisation Used in the Polish Power Plants and Central Heating Plants and the Main Sorbents Applied

The aim of flue gas desulphurisation processes is removing sulphur (mainly in the form of SO2, less frequently other sulphur compounds) from flue gases generated in various industrial processes. The main sources of emissions of sulphur compounds are processes of combustion of fossil fuels (in Poland: especially hard coal and lignite), which in numerous countries still remain the main source for generation of electricity and heat. The amount of sulphur oxides produced in these processes depends on the type of fuel, the content of sulphur compounds in the fuel, as well as the combustion conditions in different types of furnaces [10].
Many methods are known for the removal of sulphur oxides from the flue gases of production processes. All of them involve the introduction of a sorbent into the system, which reacts with the gaseous SO2 contained in the flue gas, binding it into solid compounds, with the removal of the reaction products from the system. Desulphurisation can be carried out on both dust-free gases and those carrying considerable quantities of dust. Moreover, desulphurisation processes can be carried out before, during and after fuel combustion. Sorbents most commonly used in desulphurisation processes are ground limestone (limestone flour), hydrated lime and ground quicklime. Much less commonly used are ground dolomite, calcined magnesite, sodium carbonate, and some industrial wastes (e.g., carbide lime) [10,43,44].
With respect to the ways of introducing the sorbent into the desulphurisation system and receiving the desulphurisation products, the following methods are distinguished: dry, semi-dry and wet. Dry methods are characterised by the fact that SO2 chemical fixation processes take place in the dry state, i.e., in a gas–solid system, and desulphurisation products are obtained in the dry state. They are based on adsorption on solid sorbents with simultaneous drying of desulphurisation products. The most common dry FGD system of dust-free flue gases is spray dry FGD system with use of hydrated lime [45], while, e.g., furnace sorbent injection or duct sorbent injection have minor importance. Circulating Fluid Bed dry scrubbing in fluidized bed boilers is another important method, but in this case limestone or lime sorbent is introduced into the boiler before the combustion process [32,43]. In semi-dry and wet methods SO2 sorbent is introduced to the desulphurisation plant in the form of suspension in liquid, while the desulphurisation products are received in dry state (semi-dry method) or in the form of suspension (wet method). According to the criteria given above, dry desulphurisation methods include also desulphurisation carried out during combustion in furnaces of fluidized bed boilers. The products of desulphurisation by dry and semi-dry methods are so-called desulphurisation ashes (sulfate-rich ashes). They are a mixture of ashes, desulphurisation products and unreacted sorbents. For the wet lime method, the main product is synthetic gypsum with a small amount of unreacted sorbent [10,46,47,48].
Limestone sorbents (lime flour or sand), in some cases also burnt or hydrated lime constitute the most numerous group of reagents used in flue gas desulphurisation systems. It is also the case of Poland, where they are applied mainly in the wet lime method and in fluidized bed boilers, to a lesser extent in semi-dry and dry methods (Table 1). In the Polish power industry, they are used in almost all existing flue gas desulphurisation plants. This is due to their widespread availability, low purchase cost and, in the case of the wet limestone method, the ease of disposal of the resulting synthetic gypsum. In general, calcium desulphurisation sorbents include: in dry desulphurisation methods—ground quicklime and limestone, in semi-dry desulphurisation methods—hydrated lime and ground quicklime, and in wet desulphurisation methods—ground quicklime, ground limestone and chalk [49,50].

3.2. Sources and Production of Limestone Sorbents in Poland

Limestones are sedimentary rocks whose main component is calcite CaCO3, isomorphic with magnesite MgCO3, siderite FeCO3 and other anhydrous carbonates, as a result of which admixtures of MgO, FeO, etc., are present. Depending on the admixtures of other minerals, a number of varieties of transition rocks can be distinguished: with increasing amounts of clay minerals, these are marl limestones, marls and clayey marls, with admixture of silica—gaizes, and with quartz—sandy limestones and calcareous sandstones. The admixture of the dolomite mineral CaMg[CO3]2 is particularly common in rocks of mixed nature—dolomitic limestones and calcareous dolomites. A particular variety of limestone rocks, both in terms of genesis and properties and use, is the chalk [37,51].
Poland has numerous deposits of limestone rocks with the exception of the most noble varieties of sculptural and architectural marbles. The limestone resource base is divided into limestone and related minerals documented for various purposes: limestone for the lime industry, limestone and related rocks for the cement industry (both collectively known as industrial limestone), limestone for the production of crushed aggregates, as well as chalk and lake chalk. In practice, this division has a conventional meaning, as, e.g., cement and lime combinations operate on individual deposits, using the purer parts for lime products, and the remaining parts for cement or crushed aggregate production [37,52].
Limestone deposits for the lime industry are known mainly in the Świętokrzyskie province (60% of total resources, mainly Devonian and Jurassic limestone) as well as in the Łódzkie, Opolskie and Śląskie provinces. The total resources of 120 deposits amounted to 5.4 billion tonnes at the end of 2019 [35]. Deposits of limestone and related rocks for the cement industry are found in the following provinces: Lubelskie (26%, predominantly Cretaceous marls and chalk), Świętokrzyskie (17%, Devonian and Jurassic limestone), Łódzkie (15%, Jurassic limestone), Mazowieckie (12%, Jurassic limestone), smaller ones in Kujawsko-Pomorskie, Opolskie and Śląskie. Total resources of 69 deposits amounted to 12.7 billion tonnes at the end of 2019. Limestone deposits mostly for crushed aggregates production are found mainly in the Świętokrzyskie region (about 90% of resources, Devonian and Jurassic limestone). Many deposits were also documented in the Cracow-Częstochowa Upland and single ones in the Carpathians, Sudety Mountains, Lublin Upland and others. The total resources of 142 deposits of limestone and limestone-related rocks for crushed aggregates production amounted to 2.0 billion tonnes at the end of 2019 [35].
By age of limestone formations, the most significant are Jurassic limestones (over 59% of resources), followed by Cretaceous limestones and related rocks (over 21%), Devonian limestones (about 8%), Triassic limestones (about 8%), Tertiary limestones (about 3%), and marginally—Carboniferous, Cambrian and Precambrian limestones [34,35].
In 2019, limestone was mined in Poland in 86 open pits, of which there were 19 limestone and marl mines delivering the batch to the cement industry, 22 limestone mines—for the lime industry, 36 mines extracting limestone deposits documented for crushed aggregates production, as well as 9 chalk mines [35].
Limestone rocks are used in Poland to produce several groups of products: cement, lime, unburned lime products, crushed limestone aggregates and fertilizers. Burnt and hydrated lime, as well as unburned limestone products, with a diverse range, are manufactured by more than a dozen plants. Some lime plants produce also significant quantities of limestone rock for sale, used as a blast furnace flux or in sugar factories for the production of quicklime necessary for beet juice purification (Table 1). Limestone crushed aggregates for construction are obtained mostly from limestone crushed aggregates deposits, as well as in some industrial limestone mines. Fine waste fractions from limestone crushed aggregates production are often destined for calcium carbonate fertilizers manufacture [39].
At present, fine-grained limestone sorbents, often called limestone flour, with grain size under 100/120 μm are used in the Polish power industry as a sorbent for flue gas desulphurisation in the wet limestone method, while coarse-grained sorbents (so-called limestone sand), with grain size above 100/120 μm, are used mainly for desulphurisation during combustion in fluidized bed boilers.
The majority of the Polish limestone milling plants which produce limestone flour for diverse purposes are located in the direct vicinity of extracted limestone deposits, which minimizes the cost of limestone transportation from the mine to the processing plant. This is why the largest limestone milling plants are located in the Świętokrzyskie province, as well as in the neighbouring provinces: Łódzkie and Małopolskie.
The most important domestic suppliers of limestone sorbents include: Lhoist Polska Sp. z o.o. (Bukowa, Tarnów Opolski, Górażdże, Wojcieszów/Połom plants), KW Czatkowice Sp. z o.o. (Czatkowice plant), ZPW Trzuskawica S.A. (Trzuskawica/Sitkówka and Bielawy plants), Nordkalk sp. z o.o. (Ostrówka, Chęciny-Wolica, Sławno plants), Labtar Sp. z o.o. (Tarnów Opolski plant), EGM Sp. z o.o. (Wierzbica plant) and WKG Sp. z o.o. (Raciszyn plant) (Table 1 and Table 2). One of the basic parameters determining the effects of flue gas desulphurisation is the chemical purity of limestone. This usually means that for such desulphurisation limestone flour should exhibit CaCO3 content of min. 94%, Fe2O3 content usually under 0.4%, and MgO usually <1%, with variable content of SiO2 [49].
The largest limestone flour supplier in Poland is Lhoist Polska, where the production of limestone fine sorbents for FGD wet limestone method (at ca. 700,000 tpy) is carried out in two plants: Bukowa—using Jurassic limestone of Bukowa deposit, and Tarnów Opolski—using Triassic limestone of Tarnów Opolski deposit. Sorbents from the Bukowa plant have a high content of CaCO3 (97–98%), while limestone from the Tarnów Opolski plant is slightly inferior in quality (94.7–96.5% CaCO3). Based on Tarnów Opolski limestone, production of small quantities of fine-grained sorbents is also operated by Labtar Sp. z o.o. (Table 2).
The Czatkowice Limestone Mine (part of the Tauron Polska Energia power company) in Krzeszowice near Krakow is a significant supplier of high-quality limestone sorbents (over 450,000 tpy). It exploits the Czatkowice Carboniferous limestone deposit. It offers limestone sorbents in the form of limestone flour or limestone sand, characterised by high content of CaCO3 (over 96%) and excellent sorption properties [52] (Table 2).
Significant amounts of sorbents (over 200,000 tpy) are obtained on the basis of Jurassic Chęciny-Wolica limestone deposit in the Wolica plant near Kielce owned by Nordkalk Sp. z o.o. Moreover, less than 100,000 tpy of medium-grained sorbents with grain size < 0.15 mm are supplied by ZPW Trzuskawica (belonging to the Irish concern CRH) on the basis of Devonian highest-purity limestone from the Trzuskawica deposit. Smaller manufacturers of fine-grained limestone sorbents of high purity are EGM Sp. z o.o. (Wierzbica Jurassic limestone mine) and WKG Sp. z o.o. (Raciszyn Jurassic limestone deposit) (Table 1 and Table 2).
In the future, it may be possible to commence the production of limestone flour sorbents on the basis of other limestone deposits characterised by the appropriate degree of purity (over 94% CaCO3). It is worth mentioning that the largest domestic Bełchatów Power Plant have recently started to produce limestone sorbents in its own limestone milling plant for the needs of its own 12 power units. Limestone for such purposes is purchased mostly from the Raciszyn, Morawica and Bukowa mines, while the newest Bełchatów power unit uses limestone flour produced among others by Nordkalk, Trzuskawica, WKG Raciszyn and Czatkowice. Moreover, production of limestone flour for the needs of their own desulphurisation plants is carried out in Turów and Połaniec Power Plants.
The total production potential of the Polish plants delivering limestone flour for a variety of applications, is at the moment estimated at approximately 6.0 million tpy, with an increase of approximately 1.5 million tpy over the past decade due to the expansion of a number of existing milling plants (Bełchatów, Sławno, Wolica, Turów, Raciszyn, Wierzbica, Turów and Połaniec). In the coming years it should increase primarily as a result of the expansion of the milling plant located at the Bełchatów Power Plant by approximately 0.4 million tpy. Development of limestone flour production capacity could potentially take place, e.g., at the EGM plant in Wierzbica and at the ZPW Trzuskawica plant in Sitkówka [52].

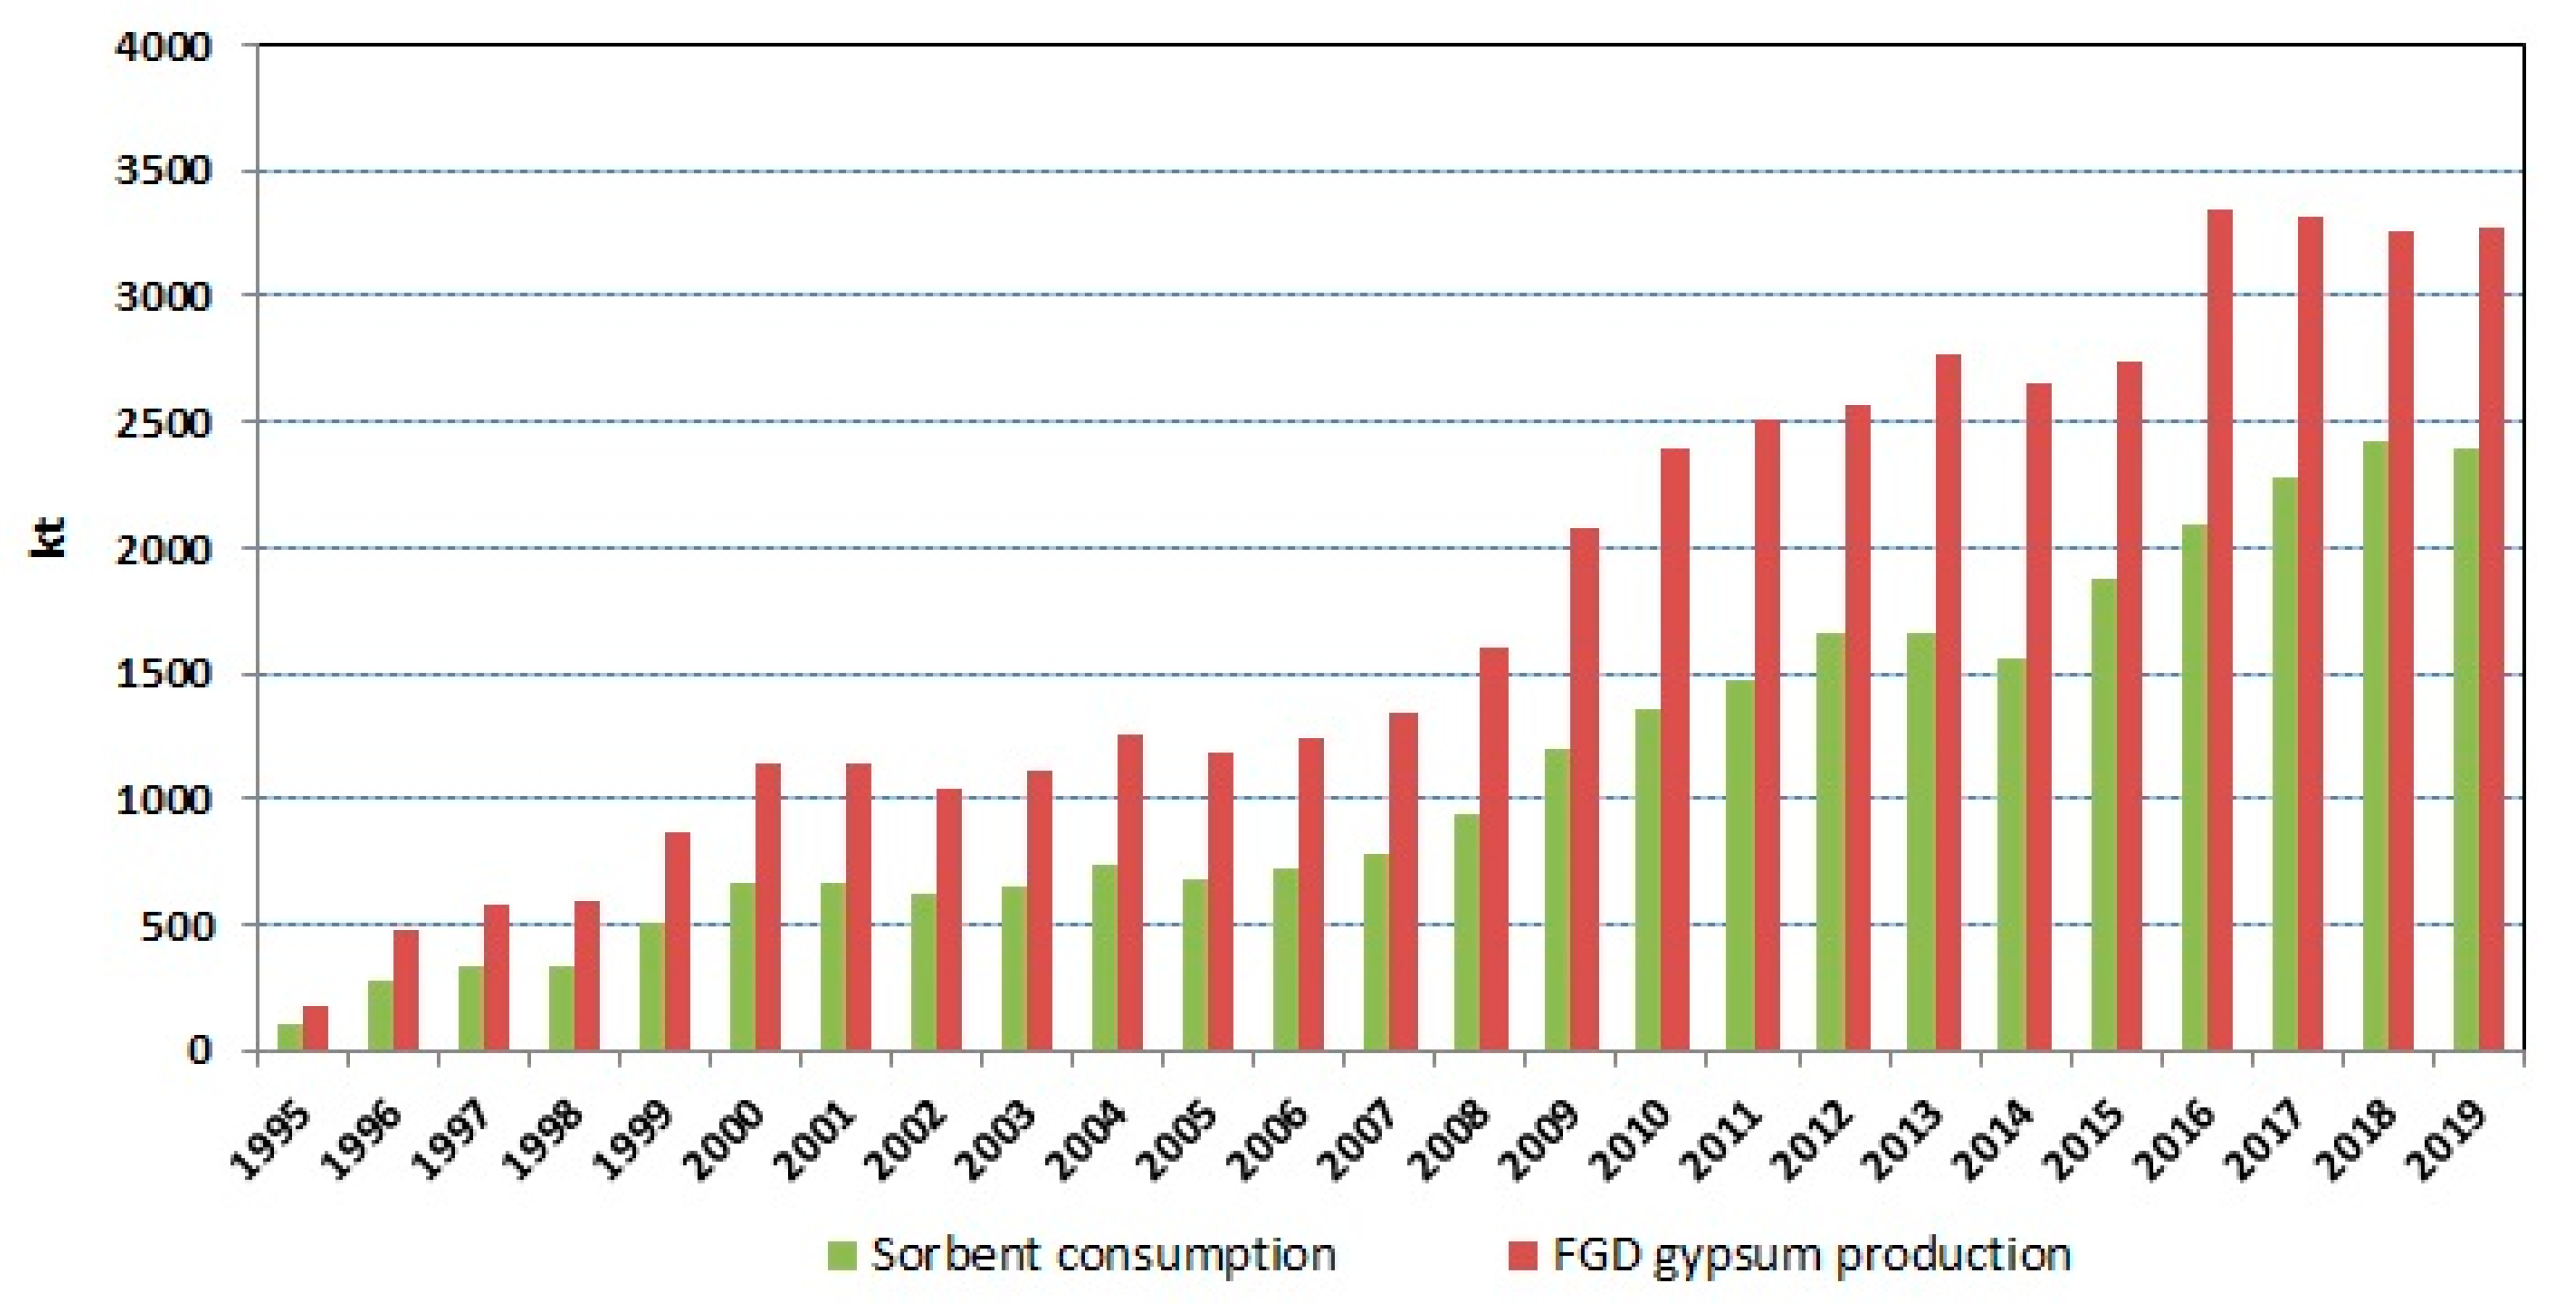
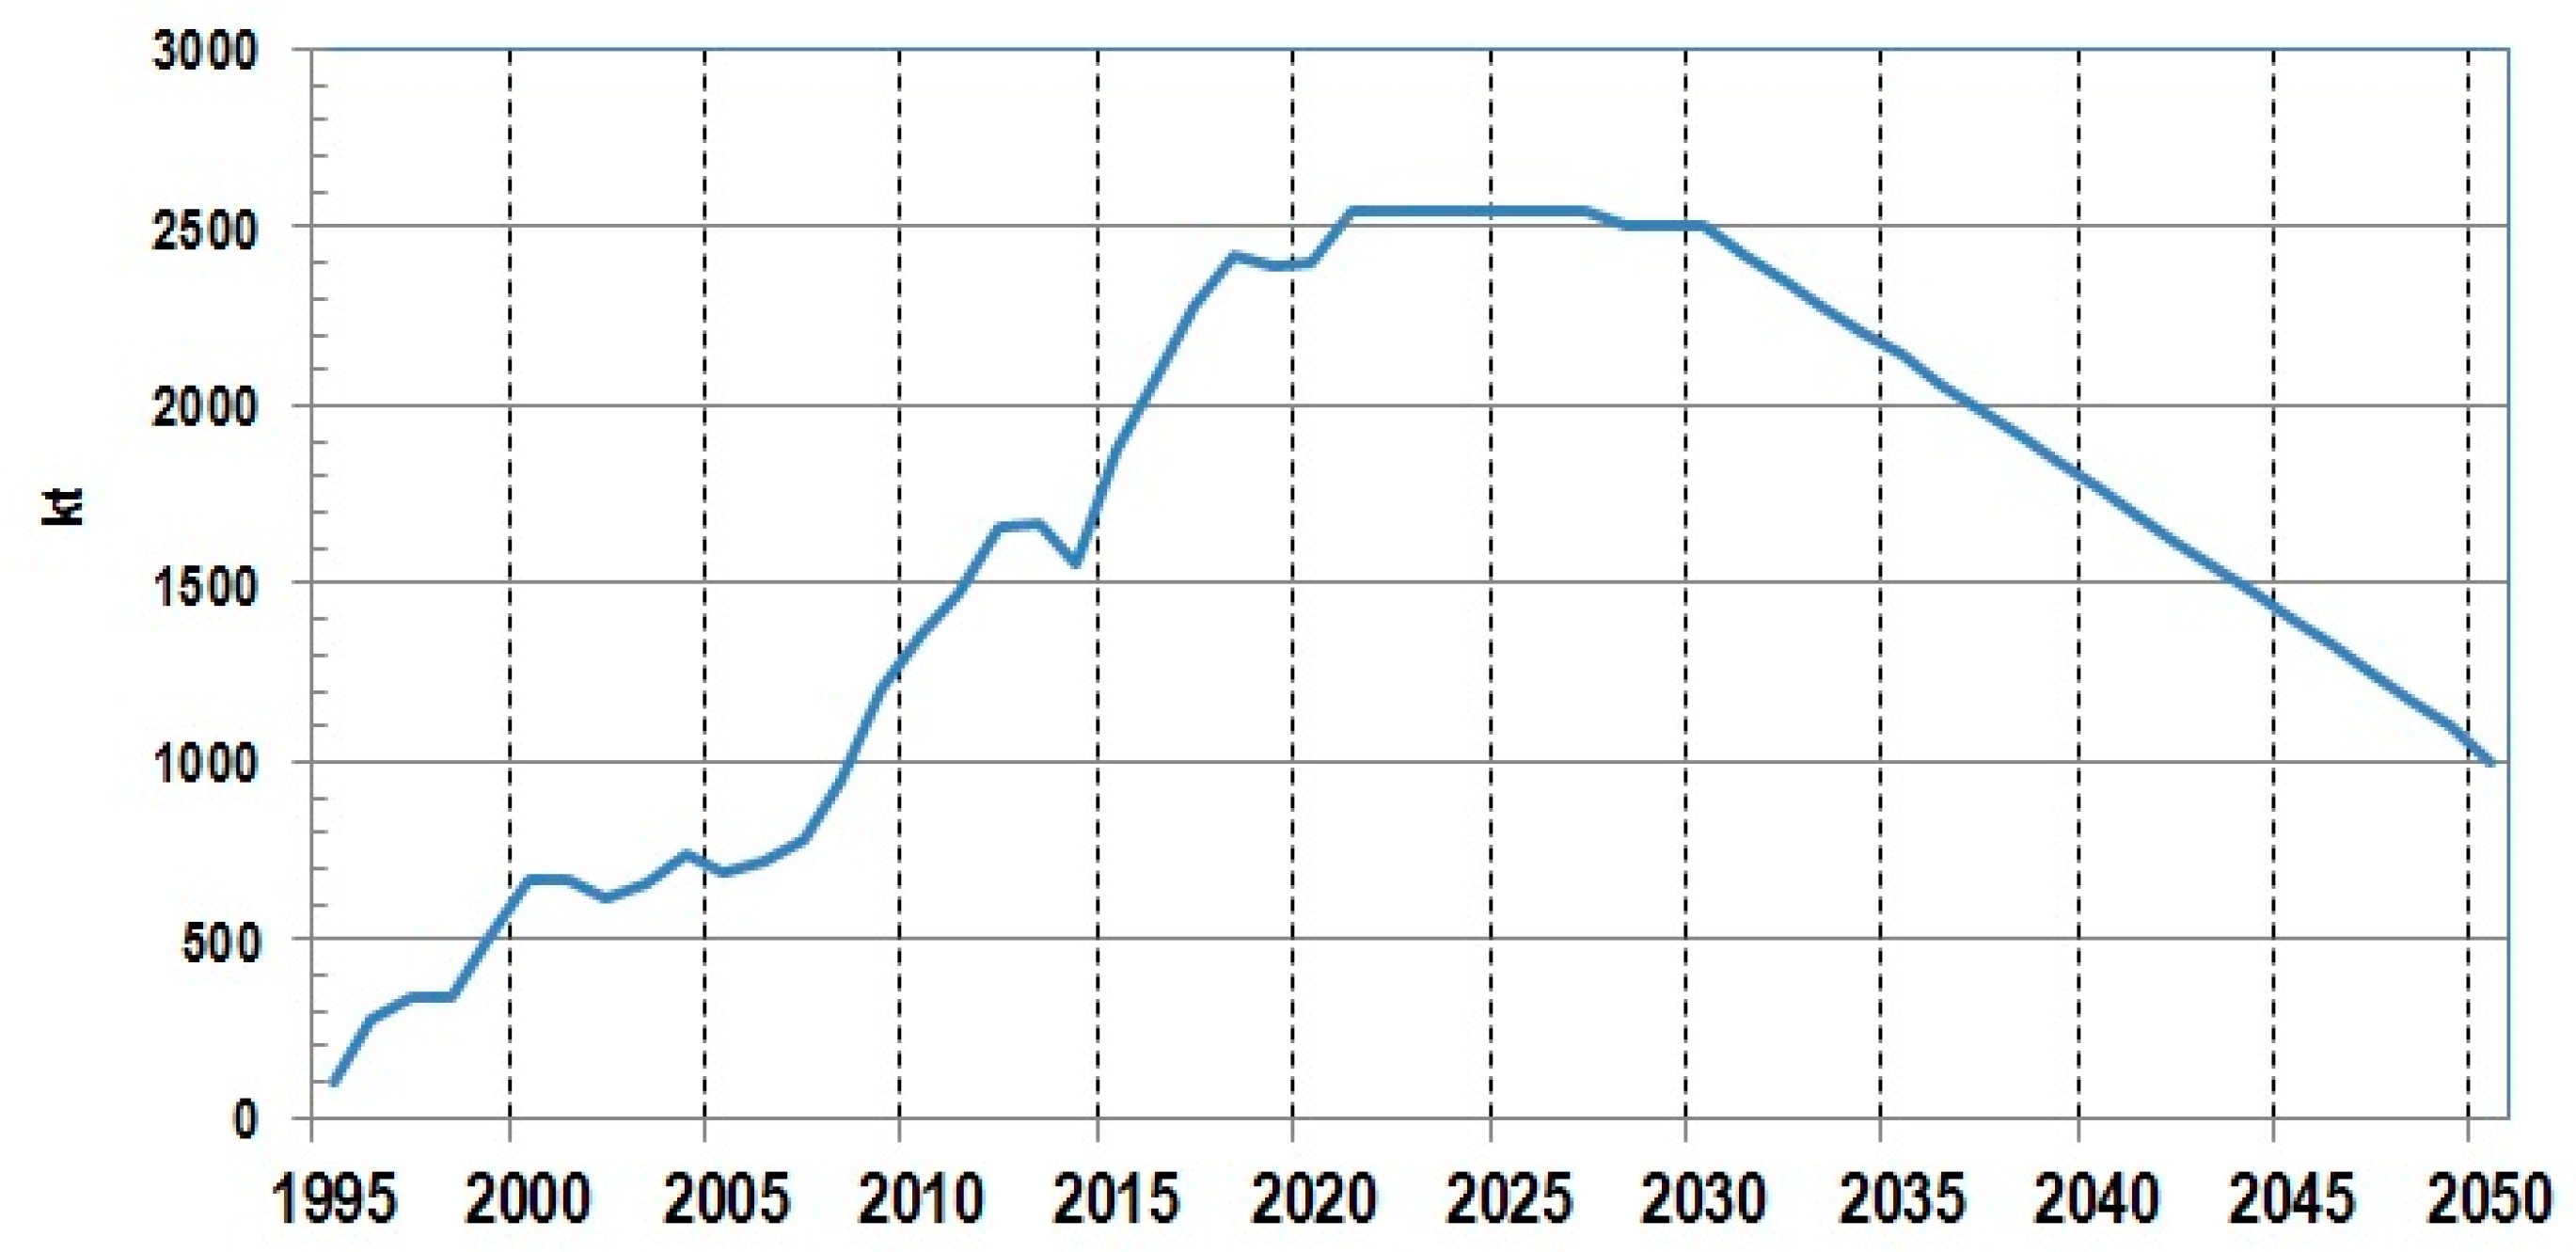
3.3. Use of Limestone Sorbents in the Polish Power Industry with Obtaining FGD Gypsum and Other Desulphurisation Products

Among numerous desulphurisation methods used in large power plants and combined heat and power plants, with coal burning in conventional boilers, the non-regenerative wet limestone method of flue gas desulphurisation using fine limestone flour turned out to be the most effective, including in Poland. In this method, the dust-free flue gases are purified in the absorber by a limestone flour suspension flowing in counter-current. The sulphur dioxide (SO2) present in the flue gas reacts with calcium carbonate (CaCO3), the main component of limestone, resulting in intermediate calcium sulfite (CaSO3·½H2O) and then—after oxidation with air supplied from outside and after crystallization—gypsum (CaSO4·2H2O). This desulphurisation product is received in the form of water suspension with subsequent water removal on appropriate belts or vacuum filters. Implementation of this method requires relatively high investment outlays, but is characterised by high desulphurisation efficiency (92–99%) and obtaining a fully economically useful product, i.e., synthetic gypsum [31,43,49].
The first wet limestone flue gas desulphurisation plants in Poland were put into operation at the Bełchatów Power Plant in 1994. It initiated in Poland the use of suitable limestone flour (limestone sorbent) for flue gas desulphurisation in power plants, together with the production of synthetic gypsum from flue gas desulphurisation. In the following several years, FGD plants using the wet limestone method were put into operation at 11 power plants (PPs) and 5 combined heat and power plants (CHPs) (Table 3). Currently, the maximum total demand of the Polish PPs and CHPs for the sorbent—limestone flour < 0.1 mm—is estimated at about 3.5 million tpy (which corresponds to synthetic gypsum production capacity of about 4.8 million tpy). The actual consumption of this flour in 2019 has been estimated at about 2.4 million tonnes, with synthetic gypsum production amounting to ca. 3.3 million tonnes.
At present the most important users of limestone flour (sorbents) < 0.1 mm and synthetic gypsum producers in Poland are (Table 3):
  • PGE Górnictwo i Energetyka Konwencjonalna S.A.—Bełchatów, Opole, Turów and Dolna Odra PPs;
  • Tauron Wytwarzanie S.A.—Jaworzno III and Łaziska PPs;
  • ZE Pątnów-Adamów-Konin S.A.—Konin and Pątnów I-II PPs;
  • ENEA S.A.—Kozienice and Połaniec PPs;
  • ENERGA S.A.—Ostrołęka PP;
  • PGE Energia Ciepła S.A.—Rybnik PP, Gdańsk, Gdynia, Wrocław, and Kraków CHPs;
  • PGNiG Termika S.A.—Warszawa Siekierki CHP.
The flue gas desulphurisation at the Bełchatów Power Plant has been in operation—as mentioned above—since 1994 and after gradual expansion it is currently the largest flue gas desulphurisation plant in Europe, operating on all active units. The maximum demand for limestone sorbent in this power plant reached 1.6 million tpy and the actual sorbent consumption in flue gas desulphurisation process in recent years has been approaching 1.5 million tpy (Table 3). Bełchatów Power Plant, as one of three in Poland, has its own limestone milling plant where the level of sorbent production reaches almost 1.3 million tpy, with limestone supplied from numerous mines. For flue gas desulphurisation in the newest power unit, there are used approximately 0.3 million tpy of sorbents supplied from the their main domestic suppliers.
Subsequent flue gas desulphurisation plants using the wet limestone method were commissioned successively at the following power plants and combined heat and power plants:
  • Jaworzno III PP—since 1996, sorbent consumption 70,000–75,000 tpy;
  • Opole PP—since 1997 with extension in 2019, sorbent consumption 60,000–90,000 tpy, with an expected increase even to 200,000–250,000 tpy;
  • Konin PP—since 1997, sorbent consumption below 10,000 tpy;
  • Połaniec PP—since 1999 with extension in 2008, sorbent consumption ca. 130,000 tpy, with own limestone milling plant of production capacity 200,000 tpy;
  • Łaziska PP—since 2000, sorbent consumption 40,000 tpy;
  • Dolna Odra PP—since 2000 with extension in 2003, sorbent consumption ca. 35,000 tpy;
  • Kozienice PP—since 2001 with extension in 2007, 2010, 2015 and 2017, current sorbent consumption ca. 200,000 tpy and target consumption ca. 400,000 tpy;
  • Ostrołęka PP—since 2008, sorbent consumption ca. 30,000 tpy;
  • Rybnik PP—since 2008 (in 4 power units), consumption of limestone sorbent 70,000–75,000 tpy, additionally in the next 4 power units semi-dry or dry FGD with quicklime as sorbent;
  • Pątnów I–II PP—since 2008, sorbent consumption up to 125,000 tpy;
  • Siekierki CHP—since 2010, sorbent consumption up to 30,000 tpy;
  • PGE Energia Ciepła S.A. CHPs in Kraków, Wrocław, Gdańsk and Gdynia—since 2015, total sorbent consumption ca. 50,000 tpy;
  • Turów PP—since 2021, sorbent consumption 100,000–110,000 tpy, with own limestone milling plant producing limestone flour for wet limestone FGD and limestone sand for fluidised bed boilers.
Conducting the desulphurisation process during fuel combustion in fluidised bed boilers is the second most popular—after the wet limestone method—technological solution in Polish power plants and combined heat and power plants. It also began to be implemented in Poland in the 1990s. The choice of such solution resulted, among others, from the low temperature of the combustion process (850–950 °C), the possibility of reduction of both SO2 and NOx emissions and the opportunity to use low-quality fuels [53]. Nowadays, fluidised bed boilers with a capacity of up to 500 MWe are in operation [54]. In fluidised bed boilers, ground fuel and sorbent (limestone sand) are fed into the combustion chamber where they form a so-called “bed” together with an inert material (e.g., sand). Continuous mixing of the bed particles with the air stream allows complete combustion of the fuel and capture of sulphur dioxide [55].
In Poland, for capture of sulphur dioxide emitted during fuel combustion in fluidised bed boilers, limestone sorbent (limestone sand) is primarily used, with the necessary stoichiometric excess of the sorbent. In the combustion process, a very important factor is the granulation of individual components forming the bed, which is usually within the range of 0.1–1.2 mm [31].
The first power units with fluidised bed boilers were commissioned in Poland between 1993 and 2004 in the Turów Power Plant (six boilers in total). At the same time, use of suitable limestone sand (coarse-grained sorbents) for flue gas desulphurisation in such boilers in Poland was initiated. In the following years, fluidised bed boilers were put into operation in the next three PPs and five CHPs. Currently, the maximal total demand of these PPs and CHPs for coarse-grained sorbent (limestone sand 0.1–1.2 mm) is estimated at about 1.5 million tpy, while the actual consumption is estimated at about 1.0 million tpy, including up to 0.5 million tpy at the Turów PP only.
At present, the most important users of coarse-grained sorbent (limestone sand 0.1–1.2 mm) used for desulphurisation in fluidised bed boilers in Poland are (Table 3):
  • PGE Górnictwo i Energetyka Konwencjonalna S.A.—Turów PP;
  • Tauron Wytwarzanie S.A.—Łagisza, Siersza and Jaworzno II PP;
  • Tauron Ciepło Sp. z o.o.—Bielsko-Biała and Katowice CHPs;
  • CEZ Chorzów S.A.—Chorzów CHP;
  • PGNiG Termika S.A.—Warszawa Żerań CHP.
In the first phase of fast introduction of flue gas desulphurisation technologies in the Polish coal-based power plants in the years 1994–2000, the consumption of limestone flour showed a powerful upward trend. It was halted in the years 2001–2006 when domestic electricity generation was reduced (Figure 1). In order to meet the new gas emission standards introduced by Directive 2001/80/EC [8], Directive 2010/75/EU [9] and the obligations contained in the Accession Treaty following Poland’s accession to the European Union [56], intensive activities were carried out in subsequent years, as a result of which FGD installations were built at numerous subsequent plants. The development of the use of the wet limestone method resulted in a parallel development of the production and consumption of the fine-grained limestone sorbent necessary for this method. A close correlation is observed between the development of limestone sorbent consumption and synthetic gypsum production coming from this process (Figure 1).
As a result, during the last 25 years, the Polish demand for limestone sorbents (limestone flour) with granulation < 0.1 mm for flue gas desulphurisation by wet limestone method has gradually increased, reaching about 2.4 million tpy (Figure 1). At the same time, the consumption of coarse-grained sorbents (i.e., limestone sand with granulation of 0.1–1.2 mm) used as sorbents in fluidised bed boilers increased in Poland to about 1.0 million tpy. The overall consumption of ground limestone for use as a SO2 sorbent in the domestic power industry in recent years has reached about 3.3–3.4 million tpy, and production of synthetic gypsum has stabilized at the level of approx. 3.3 million tonnes (Figure 1).

4. Discussion

Attempts to forecast the amount of limestone sorbent consumption in flue gas desulphurisation in Poland in the years to come have highly uncertain results, although there is no doubt that this amount will not be significantly reduced in a few years’ perspective, and even, on the contrary, it should increase noticeably. The main factors influencing this will be, among others, the structure of electricity production (the so-called energy mix), current and expected share of hard coal and lignite burning in electricity production, the expected sulphur content in coals to be burnt, the range and scope of planned upgrading of existing power units or their replacement with new ones (taking into account the type of fuel used), and finally—the expected share of electricity generated from renewable sources [57,58].
Leaving aside the issues of the development of the energy mix and the growing share of renewable energy sources in total electricity production, there is no doubt that due to many years of backwardness of the Polish power industry, so far dominated by coal-fired power plants, significant investments are necessary to launch new electricity production capacities and transmission networks. Currently in Poland, 48% of active boilers and 44% of turbine sets are over 30 years old, and about 30% of boilers and about 32% of turbine sets are between 20 and 30 years old [25]. According to the actual Polish Energy Policy until 2040 [23], Poland will try to cover its power demand from its own resources. Polish coal resources will remain an important element of the country’s energy security, but an increase in demand for energy will be met from sources other than coal-fired units. It is assumed that the share of coal in the energy consumption structure will be below 56% in 2030, and with the likely increase in EU ETS allowance prices it may reach the level of approximately 38%. In addition, renewable energy sources will play an increasingly important role, and their share in the structure of net domestic energy consumption will reach no less than 32% in 2030 [23]. This will be achieved primarily through the development of photovoltaics and offshore wind farms, which due to their characteristics of economic and technical conditions have the greatest potential for development. In addition, it is necessary to develop transmission infrastructure, energy storage technologies, as well as to expand the use of gas units as regulating capacity. It is assumed that from 2033, nuclear power will be implemented (a total of six nuclear power units with a total capacity of between six and nine GW are planned to be built), which will ensure the stability of the energy system and clearly reduce emissions from the sector. In subsequent years, low-efficiency generation units will be gradually phased out and replaced with higher-efficiency units (including cogeneration). Ultimately, a completely new energy system based on low- and zero-emission sources will be created by 2040 [23]. The implementation of the assumptions of this plan will significantly change the structure of the domestic energy sector in the future and will directly affect the demand for mineral sorbents for flue gas desulphurisation and for the production of synthetic gypsum.
Since 2016, the production of FGD synthetic gypsum in Poland remained at a similar level of about 3.3–3.4 million tpy, while the demand for limestone flour for the wet FGD method—at the level of 2.4–2.5 million tpy, and demand for limestone sand for fluidised bed boilers—ca. 1.0 million tpy. However, between 2018 and 2020, new flue gas desulphurisation plants were commissioned at four new coal-fired power units at Kozienice PP, Opole PP and Jaworzno III PP. Moreover, it is planned to complete the construction of the last new coal-fired power unit at the Turów PP with a capacity of 490 MW in 2021, also equipped with a flue gas desulphurisation plant using the wet limestone method. The construction of these new, conventional, power units allowed to replace a number of worn-out, oldest units. After 2021, new hard coal-fired or lignite-fired power units will not be built in Poland. So, eventually, starting from 2022, with perspective towards at least 2030, the total demand for limestone flour and limestone sand as FGD sorbents in Poland may achieve the record level of ca. 3.5–3.6 million tpy, including about 2.6 million tpy of fine-grained flour for flue gas desulphurisation in wet limestone method, and about 1.0 million tpy of coarse-grained flour (limestone sand) for desulphurisation in fluidised bed boilers and, subordinately, using dry or semi-dry methods. At the same time, the total production capacity of FGD synthetic gypsum in all Polish power plants can increase to about 5.7 million tpy, while its real production volume—to at least 4.6 million tpy. In the next few years, further new power units will undoubtedly be built in Poland, but they will not be based on hard coal or lignite burning, being mostly gas units and sometimes biomass units [23,57].
Forecasting the role of coal-fired power generation in Poland after 2030, and consequently the demand for limestone sorbents for desulphurisation in this sector, is extremely difficult and burdened with enormous uncertainty. The forecast error may even exceed 50%. The final shape of the Polish power industry is a matter of considerable uncertainty, especially in relation to economy decarbonisation processes pushed by the EU, with possible rapid reduction of the coal share in the energy mix in favour of increasing the RES share. After 2030, there will be another phase of phasing out the oldest power units, e.g., in Kozienice, Dolna Odra, Bełchatów and many other power plants. They are to be replaced mainly by gas units, nuclear units and renewable energy sources such as wind turbines and photovoltaic [23]. In such a scenario, total demand for limestone sorbents for desulphurisation will systematically fall and in 2050 may reach maximum level of about 1.3 million tpy, of which ca. 1.0 million tpy for wet limestone FGD method (Figure 2) and about 0.3 million tpy for flue gas desulphurisation in fluidised bed boilers. As a result, the production of synthetic gypsum in 2050 may decrease to only max. 1.5 million tpy. At that time, only those power units that were built between 2017 and 2021, and maybe also a few older coal-fired units that were upgraded in recent years, are likely to remain in operation. However, we cannot rule out that in 2050 the share of coal in the Polish energy mix may decrease even to zero, with closure of the last coal-fired PPs and CHPs. As a result, the consumption of sorbents for desulphurisation of flue gas coming from coal combustion will also practically disappear at this moment.

5. Conclusions

Measures taken since the beginning of 1990s to reduce SO2 emissions in the Polish power industry (being mainly based on coal burning) resulted in the construction of numerous flue gas desulphurisation plants in the last 30 years. In Poland, they are mainly using the wet limestone method of dust-free flue gases, or use of fluidised bed boilers where the desulphurisation process takes place in the boiler immediately after coal combustion. In both main desulphurisation methods used in Poland, ground limestone of appropriate granulation is used for desulphurisation. This resulted in quick increase in demand for limestone sorbents: from zero in the early 1990s to about 3.4–3.5 million tpy at present. For the production of such limestone sorbent (limestone flour for wet limestone FGD method and limestone sand for fluidised bed boilers) different varieties of limestone are used in a few regions of the country, and they must meet basic requirements regarding, among others, chemical composition and granulation. At present, mostly Jurassic limestone, but also Devonian, Carboniferous and Triassic limestone varieties have the greatest significance in limestone sorbents production in Poland.
In 2022, after the completion of the last new investment project in the Polish coal-fired power industry in 2021—the new power unit in Turów Power Plant, the total demand for limestone FGD sorbents in domestic power plants will reach the maximum level of about 3.7 million tpy. Such a demand should be maintained until 2028–2030, after which it will systematically decrease in the following years, as a result of the gradual closure of subsequent coal-fired power units, while new production capacities based on hard coal or lignite are not expected to be built anymore. As a result of gradual decommissioning of coal-fired units in the 2050 perspective, the total consumption of sorbents in the domestic power sector should be reduced to a maximum of 1.3 million tpy, of which about 1.0 million tpy will be used for limestone flour consumption in wet limestone FGD installations and about 0.3 million tpy for limestone sand consumption in fluidised bed boilers. After 2050, it will probably be reduced practically to zero. As indirect consequence, the production of desulphurisation products, including in particular synthetic gypsum from the wet limestone method, will also decrease. Production of the latter could fall from about 3.6 million tpy in the coming years to only max. 1.5 million tpy just before 2050 and practically to zero after 2050.

Author Contributions

Conceptualization, K.G., J.S.; methodology, K.G., J.S.; validation, J.S., K.G.; investigation, J.S., K.G; writing—original draft preparation, J.S., K.G.; writing—review and editing, K.G., J.S. All authors have read and agreed to the published version of the manuscript.

Funding

This research was financed from the statutory subsidy of the Mineral and Energy Economy Research Institute, Polish Academy of Sciences.

Institutional Review Board Statement

Not applicable.

Informed Consent Statement

Not applicable.

Data Availability Statement

Data sharing not applicable.

Acknowledgments

The preparation of this paper was supported by the Polish National Agency for Academic Exchange under Grant No. PPI/APM/2019/1/00079/U/00).

Conflicts of Interest

The authors declare no conflict of interest.

References

  1. Bagayev, I.; Lochard, J. EU air pollution regulation: A breath of fresh air for Eastern European polluting industries? J. Environ. Econ. Manag. 2017, 83, 145–163. [Google Scholar] [CrossRef]
  2. Cristobal, J.; Guillen-Gosalbez, G.; Jimenez, L.; Irabien, A. Optimization of global and local pollution control in electricity production from coal burning. Appl. Energy 2012, 92, 369–378. [Google Scholar] [CrossRef]
  3. Crippa, M.; Janssens-Maenhout, G.; Dentener, F.; Guizzardi, D.; Sindelarova, K.; Muntean, M.; Van Dingenen, R.; Granier, C. Forty years of improvements in European air quality: Regional policy-industry interactions. Atmos. Chem. Phys. 2016, 16, 3825–3841. [Google Scholar] [CrossRef] [Green Version]
  4. Council Directive 96/62/EC of 27 September 1996 on Ambient Air Quality Assessment and Management. 1996. Available online: https://eur-lex.europa.eu/legal-content/en/TXT/?uri=CELEX%3A31996L0062 (accessed on 29 January 2021).
  5. Council Directive 1999/30/EC of 22 April 1999 Relating to Limit Values for Sulphur Dioxide, Nitrogen Dioxide and Oxides of Nitrogen, Particulate Matter and Lead in Ambient Air. 1999. Available online: https://eur-lex.europa.eu/legal-content/EN/TXT/?uri=CELEX%3A31999L0030 (accessed on 29 January 2021).
  6. Communication from the Commission to the Council and the European Parliament. In Proceedings of the Thematic Strategy on Air Pollution, COM(2005) 0446 Final, Brussels, Belgium, 21 September 2005; Available online: https://eur-lex.europa.eu/LexUriServ/LexUriServ.do?uri=COM:2005:0446:FIN:EN:PDF (accessed on 29 January 2021).
  7. Directive 2008/50/EC of the European Parliament and of the Council of 21 May 2008 on Ambient Air Quality and Cleaner Air for Europe. 2008. Available online: https://eur-lex.europa.eu/legal-content/en/ALL/?uri=CELEX%3A32008L0050 (accessed on 29 January 2021).
  8. Directive 2001/80/EC of the European Parliament and of the Council of 23 October 2001 on the Limitation of Emissions of Certain Pollutants into the Air from Large Combustion Plants. 2001. Available online: https://eur-lex.europa.eu/legal-content/en/TXT/?uri=CELEX:32001L0080 (accessed on 29 January 2021).
  9. Directive 2010/75/EU of the European Parliament and of the Council of 24 November 2010 on Industrial Emissions (Integrated Pollution Prevention and Control). 2010. Available online: https://eur-lex.europa.eu/legal-content/EN/TXT/?uri=CELEX%3A32010L0075 (accessed on 29 January 2021).
  10. Lecomte, T.; de la Fuente, J.F.F.; Neuwahl, F.; Canova, M.; Pinasseau, A.; Jankov, I.; Brinkmann, T.; Roudier, S.; Sancho, L.D. Best Available Techniques (BAT) Reference Document for Large Combustion Plants; EC JRC Institute for Prospective Technological Studies: Seville, Spain, 2017. [Google Scholar]
  11. Pouklikas, A. Review of design, operating, and financial considerations in flue gas desulfurizations systems. Energy Technol. Policy 2015, 2, 92–103. [Google Scholar] [CrossRef]
  12. Kilic, O.; Acarkan, B.; Ay, S. FGD investments as part of energy policy: A case study for Turkey. Energy Policy 2013, 62, 1461–1469. [Google Scholar] [CrossRef]
  13. Graus, W.; Worrel, E. Effects of SO2 and NOx control on energy-efficiency power generation. Energy Policy 2007, 35, 3898–3908. [Google Scholar] [CrossRef]
  14. Fernandez Gonzalez, P.; Landajo, M.; Presno, M.J. The driving forces behind changes in GHG emission levels in EU-27. Differences between member states. Environ. Sci. Policy 2014, 38, 11–16. [Google Scholar] [CrossRef]
  15. Directive 2003/87/EC of the European Parliament and of the Council of 13 October 2003 Establishing a Scheme for Greenhouse Gas Emission Allowance Trading within the Community and Amending Council Directive 96/61/EC (Text with EEA Relevance). 2003. Available online: https://eur-lex.europa.eu/legal-content/EN/TXT/?uri=celex%3A32003L0087 (accessed on 29 January 2021).
  16. Directive 2009/29/EC of the European Parliament and of the Council of 23 April 2009 Amending Directive 2003/87/EC so as to Improve and Extend the Greenhouse Gas Emission Allowance Trading Scheme of the Community. 2009. Available online: https://eur-lex.europa.eu/legal-content/EN/TXT/?uri=celex%3A32009L0029 (accessed on 29 January 2021).
  17. Liobikiene, G.; Butkus, M. The European Union possibilities to achieve targets of Europe 2020 and Paris agreement climate policy. Ren. Energy 2017, 106, 298–309. [Google Scholar] [CrossRef]
  18. EC 2011—COM. A Resource-Efficient Europe—Flagship Initiative under the Europe 2020 Strategy. 2011. Available online: https://eur-lex.europa.eu/LexUriServ/LexUriServ.do?uri=COM:2011:0021:FIN:EN:PDF (accessed on 29 January 2021).
  19. Carlini, E.; Schroeder, R.; Birkebek, J.; Massaro, F. EU transition in power sector. How RES affects the design and operations of transmission power systems. Electr. Power Syst. Res. 2019, 169, 74–91. [Google Scholar] [CrossRef]
  20. Tagliapietra, S.; Zachmann, G.; Edenhofer, O.; Glachant, J.M.; Linares, P.; Loeschel, A. The European union energy transition: Key priorities for the next five years. Energy Policy 2019, 132, 950–954. [Google Scholar] [CrossRef] [Green Version]
  21. Heidrich, O.; Reckien, D.; Olazabal, M.; Foley, A.; Salvia, M.; de Gregorio Hurtado, S.; Orru, H.; Flacke, J.; Geneletti, D.; Pietrapertosa, F.; et al. National climate policies across Europe and their impacts on cities strategies. J. Environ. Manag. 2016, 168, 36–45. [Google Scholar] [CrossRef] [Green Version]
  22. National Air Protection Program until 2020 (with a Perspective until 2030); Ministry of Environment: Warsaw, Poland, 2015; Available online: File:///C:/Users/73RY74J/AppData/Local/Temp/Krajowy%20Program%20Ochrony%20Powietrza%20do%202020%20z%20perspektyw%C4%85%20do%202030.pdf (accessed on 29 January 2021). (In Polish)
  23. Poland’s Energy Policy until 2040—Announcement of the Minister of Climate and Environment of 2 March 2021 on the State’s Energy Policy until 2040. Polish Monitor. 10 March 2021, p. 264. Available online: https://www.dziennikustaw.gov.pl/MP/2021/264 (accessed on 10 March 2021). (In Polish).
  24. National Energy and Climate Plan for the Years 2021–2030; Ministry of State Assets: Warsaw, Poland. Available online: https://www.gov.pl/web/aktywa-panstwowe/krajowy-plan-na-rzecz-energii-i-klimatu-na-lata-2021-2030-przekazany-do-ke (accessed on 30 April 2021). (In Polish)
  25. Gawlik, L. The Polish power industry in energy transformation process. Miner. Econ. 2018, 31, 229–237. [Google Scholar] [CrossRef] [Green Version]
  26. Kaszyński, P.; Kamiński, J. Coal Demand and Environmental Regulations: A Case study of the Polish Power Sector. Energies 2020, 13, 1521. [Google Scholar] [CrossRef] [Green Version]
  27. Antosiewicz, M.; Nikas, A.; Szpor, A.; Witajewski-Baltvilks, J.; Doukas, H. Pathways for the transition of the Polish power sector and associated risks. Environ. Innov. Soc. Transit. 2020, 35, 271–291. [Google Scholar] [CrossRef]
  28. The Statistics Poland (GUS). Environment 2020; GUS: Warszawa, Poland, 2020; ISSN 0867–3217. Available online: https://stat.gov.pl/obszary-tematyczne/srodowisko-energia/srodowisko/ochrona-srodowiska-2020,1,21.html (accessed on 29 January 2021). (In Polish)
  29. Galos, K.; Smakowski, T.; Szlugaj, J. Flue-gas desulphurisation products from Polish coal-fired power plants. Appl. Energy 2003, 75, 257–265. [Google Scholar] [CrossRef]
  30. Galos, K.; Szlugaj, J.; Burkowicz, A. Sources of limestone sorbents for flue gas desulphurization in Poland in the context of the needs of domestic power industry. Polityka Energetyczna Energy Policy J. 2016, 19, 149–170. [Google Scholar]
  31. Gawlicki, M.; Galos, K.; Szlugaj, J. Waste mineral raw materials from power plants, combined heat and power plants and heating plants. In Mineral Raw Materials of Poland. Waste Mineral Raw Materials; Galos, K., Ed.; IGSMiE PAN: Kraków, Poland, 2009; pp. 139–211. (In Polish) [Google Scholar]
  32. Hlincik, T.; Buryan, P. Evaluation of limestones for the purposes of desulphurization during the fluid combustion of brown coal. Fuel 2013, 104, 208–215. [Google Scholar] [CrossRef]
  33. Burkowicz, A.; Galos, K. Limestone and lime. In Minerals Yearbook of Poland 2013; Smakowski, T., Galos, K., Lewicka, E., Eds.; PIG-PIB: Warszawa, Poland, 2014; pp. 313–323. (In Polish) [Google Scholar]
  34. Szuflicki, M.; Malon, A.; Tymiński, M. (Eds.) The Balance of Mineral Resources Deposits in Poland as of 31 XII 2015–2019; PIG-PIB: Warszawa, Poland, 2019. (In Polish)
  35. Brzeziński, D. Limestone and marl for the cement and limestone industries. In The Balance of Mineral Resources Deposits in Poland as of 31 XII 2019; Szuflicki, M., Malon, A., Tymiński, M., Eds.; PIG-PIB: Warszawa, Poland, 2020; pp. 468–476. (In Polish) [Google Scholar]
  36. Brzeziński, D.; Miśkiewicz, W. Crushed and dimension stone. In The Balance of Mineral Resources Deposits in Poland as of 31 XII 2019; Szuflicki, M., Malon, A., Tymiński, M., Eds.; PIG-PIB: Warszawa, Poland, 2020; pp. 105–127. (In Polish) [Google Scholar]
  37. Wyszomirski, P.; Galos, K. Mineral and Chemical Raw Materials of the Ceramics Industry; UWND AGH: Kraków, Poland, 2007; pp. 133–140. (In Polish)
  38. Nieć, M.; Tchórzewska, D. Limestone and other calcium minerals deposits. In Minerals of Poland. Rock Minerals: Carbonate Minerals; Ney, R., Ed.; IGSMiE PAN: Kraków, Poland, 2000; pp. 122–125. (In Polish) [Google Scholar]
  39. Burkowicz, A.; Galos, K. Limestone, lime. In The Balance of Mineral Raw Materials Management in Poland and in the World 2013; Smakowski, T., Galos, K., Lewicka, E., Eds.; PIG-PIB: Warszawa, Poland, 2015; pp. 1013–1034. (In Polish) [Google Scholar]
  40. The Statistics Poland (GUS). Production of Industrial Products in 2019 (and Unpublished Data); GUS: Warszawa, Poland, 2019. Available online: https://stat.gov.pl/obszary-tematyczne/przemysl-budownictwo-srodki-trwale/przemysl/produkcja-wyrobow-przemyslowych-w-2019-roku (accessed on 29 January 2021).
  41. Emitor 2014. Emission of Environment Pollutants from Power Plants and Central Heating Plants—Report of the Agency of Energy Market; Agencja Rynku Energii: Warszawa, Poland, 2015. (In Polish) [Google Scholar]
  42. PSE—Polish Power Grids—Information on the PPS Generation Resources (as of 29 November 2019). Available online: https://www.pse.pl/documents/20182/f6bcb852-387b-4158-be1c-8ef58d25adb0?safeargs=646f776e6c6f61643d74727565 (accessed on 29 January 2021). (In Polish).
  43. Córdoba, P. Status of Flue Gas Desulphurisation (FGD) systems from coal-fired power plants: Overview of the physic-chemical control processes of wet limestone FGDs. Fuel 2015, 144, 274–286. [Google Scholar] [CrossRef]
  44. Hycnar, E.; Ratajczak, T.; Sęk, M. Dolomites as SO2 Sorbents in Fluid Combustion Technology. Resources 2020, 9, 121. [Google Scholar] [CrossRef]
  45. Zheng, Y.; Kill, S.; Johnsson, J.E.; Zhong, Q. Use of spray dry absorption product in wet flue gas desulphurization plants: Pilot-scale experiments. Fuel 2002, 81, 1899–1905. [Google Scholar] [CrossRef]
  46. Roszczynialski, W.; Gawlicki, M. Management directions for flue gas desulphurisation products. In Proceedings of the 7th Conference on “Current Issues and Prospects of Mineral Resources Management”, Polanica Zdrój, Poland, 19–21 November 1997. (In Polish). [Google Scholar]
  47. Bis, Z. Lime sorbents in power industry. In Processing and Use of Rock Raw Materials; Galos, K., Ed.; IGSMiE PAN: Kraków, Poland, 2002. (In Polish) [Google Scholar]
  48. Knura, P. Semi-dry flue gas desulphurization method using a pneumatic reactor integrated with a fabric filter (PR + FF method)—Directions of technology development, potential and possibilities. In Proceedings of the 2nd Conference of Electricity Generators, Skawina, Poland, 28–30 September 2011. (In Polish). [Google Scholar]
  49. Szmigielska, E.; Głomba, M. Physico-chemical analysis of limestone utilized in desulfurization methods of flue gas from the power energy. In Proceedings of the Conference POL-EMIS: Atmospheric Air Protection, Sienna-Czarna Góra, Poland, 13–16 June 2012. (In Polish). [Google Scholar]
  50. Gutierrez Ortiz, F.J. A simple realistic modeling of full-scale wet limestone FGD units. Chem. Eng. J. 2010, 165, 426–439. [Google Scholar] [CrossRef]
  51. Tegethoff, F.W. (Ed.) Calcium Carbonate. From the Cretaceous Period into the 21st Century; Birkhäuser Verlag: Basel, Switzerland, 2001. [Google Scholar]
  52. Lewicka, E.; Szlugaj, J.; Burkowicz, A.; Galos, K. Sources and markets of limestone flour in Poland. Resources 2020, 9, 118. [Google Scholar] [CrossRef]
  53. Niesler, J. Development of fluidised bed furnaces in the power industry. Piece Przemysłowe Kotły 2011, 4, 33–36. (In Polish) [Google Scholar]
  54. Hycnar, J. Fluidized beds—An example of rational solution of wastes problems. Polityka Energetyczna Energy Policy J. 2006, 9, 365–376. (In Polish) [Google Scholar]
  55. Trybuś, T. Fluidized-Bed Combustion (FBC) as a method of abating sulphur dioxide and nitrogen oxides emission. Environ. Pollut. Control. J. Pol. Sanit. Eng. Assoc. 1995, 2, 15–18. (In Polish) [Google Scholar]
  56. European Parliament Legislative Resolution on the Application by the Republic of Poland to Become a Member of the European Union (AA-AFNS 1-6—C5-0122/2003—2003/0901G(AVC)). Available online: https://eur-lex.europa.eu/legal-content/EN/TXT/PDF/?uri=CELEX:52003AP0176&from=ES (accessed on 29 January 2021).
  57. Szlugaj, J.; Naworyta, W. Analysis of the changes in the Polish gypsum resources in the context of flue gas desulfurization in conventional power plants. Gospod. Surowcami Miner. Miner. Resour. Manag. 2015, 31, 93–108. (In Polish) [Google Scholar]
  58. Gawlik, L.; Grudziński, Z.; Kamiński, J.; Kaszyński, P.; Kryzia, D.; Lorenz, U.; Mirowski, T.; Mokrzycki, E.; Olkuski, T.; Ozga-Blaschke, U. Węgiel dla Polskiej Energetyki w Perspektywie 2050 Roku—Analizy Scenariuszowe; Górnicza Izba Przemysłowo-Handlowa: Katowice, Poland, 2013. (In Polish) [Google Scholar]
Figure 1. Comparison of the production volume of synthetic gypsum and consumption of limestone sorbents applied in flue gas desulphurisation in wet method (surveyed gypsum producers’ and sorbent consumers’ data).
Energies 14 04275 g001
Figure 2. Forecast of limestone sorbents consumption for flue gas desulphurisation by wet limestone method in the years 2020–2050 (maximum expected forecasted quantities).
Energies 14 04275 g002
Table 1. Mining production of limestone in major mines, delivering industrial limestones as the main or additional products (kt) 1 [34].
Mine (Deposit)ProvinceApplications20152016201720182019
Barcin-Piechcin-PakośćKujawsko-Pomorskiec,l,a,f,p62526485660678557423
OstrówkaŚwiętokrzyskiea,s,p64175825581758785980
TrzuskawicaŚwiętokrzyskiel,p,a,s,f37753401377740024519
GórażdżeOpolskiec,l,s,f35083486376145354239
Morawica III-1Świętokrzyskiea,s,f,d27622248280932373124
JaźwicaŚwiętokrzyskiea,s,f1000986167820812425
BukowaŚwiętokrzyskiel,s,p,f21842430246825852350
CzatkowiceMałopolskies,p,a18921759148716731752
Celiny IŚwiętokrzyskiea,s9361273117513081481
SzymiszówOpolskiea,s,f40210181375
Tarnów OpolskiOpolskies,l,p,f6405985736451089
WierzbicaŚwiętokrzyskiep,a,s614807617738634
PołomDolnośląskiea,s,p,f,l462531540703578
RaciszynŁódzkiep,f,d,s1002281324484
Raciszyn IIŁódzkiep,f,s549521529578427
SławnoŁódzkiep,f274291320291301
Chęciny-WolicaŚwiętokrzyskiep38107256260
PłazaMałopolskief,a,p231331232634
Izbicko IIOpolskies,f,l966726764843
1 Mines delivering limestone or similar rock only for cement production are excluded, mines delivering a different type of limestone flour are marked in bold. Applications: a—crushed aggregates, c—cement production, d—dimension limestone, f—limestone fertilizers, l—lime, p—limestone flour (powder), s—limestone rock for sale.
Table 2. Basic quality parameters of major limestone sorbents produced in Poland and utilised in wet limestone FGD process (surveyed producers’ data).
Producer/Sorbent.Sorbent SourceChemical CompositionGrain Size Characteristics
CaCO3SiO2 + InsolublesMgCO3Fe2O3Al2O3
ZPW Trzuskawica S.A., Trzuskawica plant/Limestone sorbent for FGDTrzuskawica
Devonian limestone
>98.0%<1.0%<2.0%<0.06%<0.25%85–95% < 0.063 mm
ZPW Trzuskawica S.A.,
Bielawa plant/
Limestone flour
Barcin-Piechcin-Pakość
Jurassic limestone
>93.0%<3.0%<1.5%<0.4%NAmin. 80% < 0.075 mm
KW Czatkowice Sp. z o.o./Limestone flourCzatkowice
Carboniferous limestone
96.0%1.5%1.5%0.15%0.09%98.7% < 0.2 mm
89.4% < 0.09 mm
ZW Lhoist S.A./
Limestone sorbent for FGD
Tarnów Opolski
Triassic limestone
97.5%1.1%0.9%0.3%0.1%min. 90% < 0.09 mm
Labtar Sp. z o.o./
Fine-grained sorbent
Tarnów Opolski
Triassic limestone
>94.0%<2.5%<2.0%<0.7%<0.7%92.3% < 0063 mm
98.9% < 0.09 mm
Nordkalk Sp. z o.o./
Electra 90 (WO) sorbent
Wolica
Jurassic limestone
97.0%1.25%0.70%0.12%0.12%Various sizes: from 0–0.09 mm to 0.8–1.4 mm
EGM Sp. z o.o./
Limestone flour
Wierzbica
Jurassic limestone
>97.3%<0.5%<1.2%<0.15%<0.4%<0.1 mm
WKG Sp. z o.o./
Limestone flour
Raciszyn
Jurassic limestone
>96.0%<1.5%<0.8%<0.5%<0.5%<0.1 mm
Table 3. The main flue gas desulphurisation installations in the Polish power plants and central heating plants (as of 29 November 2019) [41,42], surveyed sorbent user data.
Power Plant (PP)/Central Heating Plant (CHP)Achievable Power (MW)Applied Flue Gas Desulphurisation MethodType of Sorbent
Bełchatów PP5102Wet limestoneLimestone flour < 0.1 mm
Opole PP3342Wet limestoneLimestone flour < 0.1 mm
Kozienice PP4016Wet limestoneLimestone flour < 0.1 mm
Rybnik PP1800Wet limestone, semi-dry and dryLimestone flour < 0.1 mm,
Lime or hydrated lime
Połaniec PP1657Wet limestoneLimestone flour < 0.1 mm
Jaworzno III PP1345Wet limestoneLimestone flour < 0.1 mm
Łaziska PP1155Wet limestone, semi-dryLimestone flour < 0.1 mm,
Lime or hydrated lime
Pątnów I-II PP1120Wet limestoneLimestone flour < 0.1 mm
Dolna Odra PP1350Wet limestoneLimestone flour < 0.1 mm
CHPs: Kraków, Wrocław, Gdańsk, Gdynia902
(in total)
Wet limestoneLimestone flour < 0.1 mm
Ostrołęka PP690Wet limestoneLimestone flour < 0.1 mm
Warsaw Siekierki CHP523Wet limestone, semi-dryLimestone flour < 0.1 mm,
Lime or hydrated lime
Konin PP171Wet limestoneLimestone flour < 0.1 mm
Skawina PP389Semi-dryLime or hydrated lime
Łódź 4, Poznań Karolin, Zabrze, Głogów, and Lublin-Megatem CHPs838
(in total)
Semi-dryLime or hydrated lime
Miechowice, Lublin Wrotków, and Zgierz CHPs303
(in total)
DryLime or hydrated lime
Turów PP1488Fluidised bed boilers, Wet limestoneLimestone flour 0.1–1.2 mm, Limestone flour < 0.1 mm
Łagisza PP700Fluidised bed boilers, semi-dryLimestone flour 0.1–1.2 mm,
Lime or hydrated lime
Siersza PP557Fluidised bed boilers, semi-dryLimestone flour 0.1–1.2 mm,
Lime or hydrated lime
Warszawa Żerań CHP375Fluidised bed boilersLimestone flour 0.1–1.2 mm
Chorzów CHP156Fluidised bed boilers, dryLimestone flour 0.1–1.2 mm,
Lime or hydrated lime
Jaworzno II PP149Fluidised bed boilersLimestone flour 0.1–1.2 mm
Katowice CHP125Fluidised bed boilersLimestone flour 0.1–1.2 mm
Bielsko-Biała CHP103Fluidised bed boilers, dryLimestone flour 0.1–1.2 mm,
Lime or hydrated lime
Publisher’s Note: MDPI stays neutral with regard to jurisdictional claims in published maps and institutional affiliations.

