1. Introduction
Land transportation contributes with 11% to the global Greenhouse Gas (GHG) emissions [
1]. The usage of electricity for urban transportation is seen as one of the main solutions for reducing such emissions. As such, electric vehicles (EVs) will be a key component of sustainable e-transportation systems. Many countries are making efforts to increase the proportion of EVs in the transportation sector [
1,
2]. EVs have many advantages over traditional internal combustion engine (ICE) vehicles, such as being
emission free (to answer the new emissions standards in EU), having a
higher energy efficiency, and producing
reduced noise pollution. Furthermore, there is a growth of small EVs (E-bikes, E-scooters, quadricycles, etc.) observed in cities worldwide [
3]. Customer preferences for small EVs are rising, due to lower prices, higher mobility and accessibility in finding parking places, and lower charging time, as 93% of commuters in EU cities travel less than 37 km per day [
4].
The research data from [
1] shows that, taking Ireland as an example, “EV users prefer to carry out the majority of their charging at home”. Due to the rapid increase in EVs worldwide, it is important to provide a charging infrastructure that adequately addresses these needs and concerns of all EV users.
Moreover, bringing Renewable Electricity production close to the consumption place together with the control improvements in the distribution networks will change the conventional grid by accommodating the new components, in the form of microgrids (MGs) and EVs, of the future Smart Grid [
5].
The outstanding climate changes due to the disastrous effects of GHG emissions in the last decade are forcing measures to be taken earlier than the 2050 agenda had established, in order to reduce the global warming. Related to transportation, in the new Directive (EU) 2018/844 of the European parliament, amending Directives issued in 2010 and 2012, paragraph 26 includes the following: “When Member States establish their requirements for the installation of a minimum number of recharging points …, which are to apply from 2025”. One can see from paragraph 26 that the requirement for charging stations is very acute, as there are now only 4 years left to develop solutions.
In paragraph 29, Directive (EU) 2018/844 states “The digitalisation of the energy system is quickly changing the energy landscape, from the integration of renewables to smart grids and smart-ready buildings. In order to digitalise the building sector, the Union’s connectivity targets and ambitions for the deployment of high-capacity communication networks are important for smart homes and well-connected communities.” From paragraph 29, we concluded that a Residential Smart MG with Charging Station based on RES that has a high-capacity communication network and is able to communicate with a Smart City digital network, therefore responding to this requirements, would be of interest.
To address the situation presented above, a solution under the form of a Residential Smart MG with Charging Station added function was developed through an international research project financed by EU’s Horizon 2020 programme [
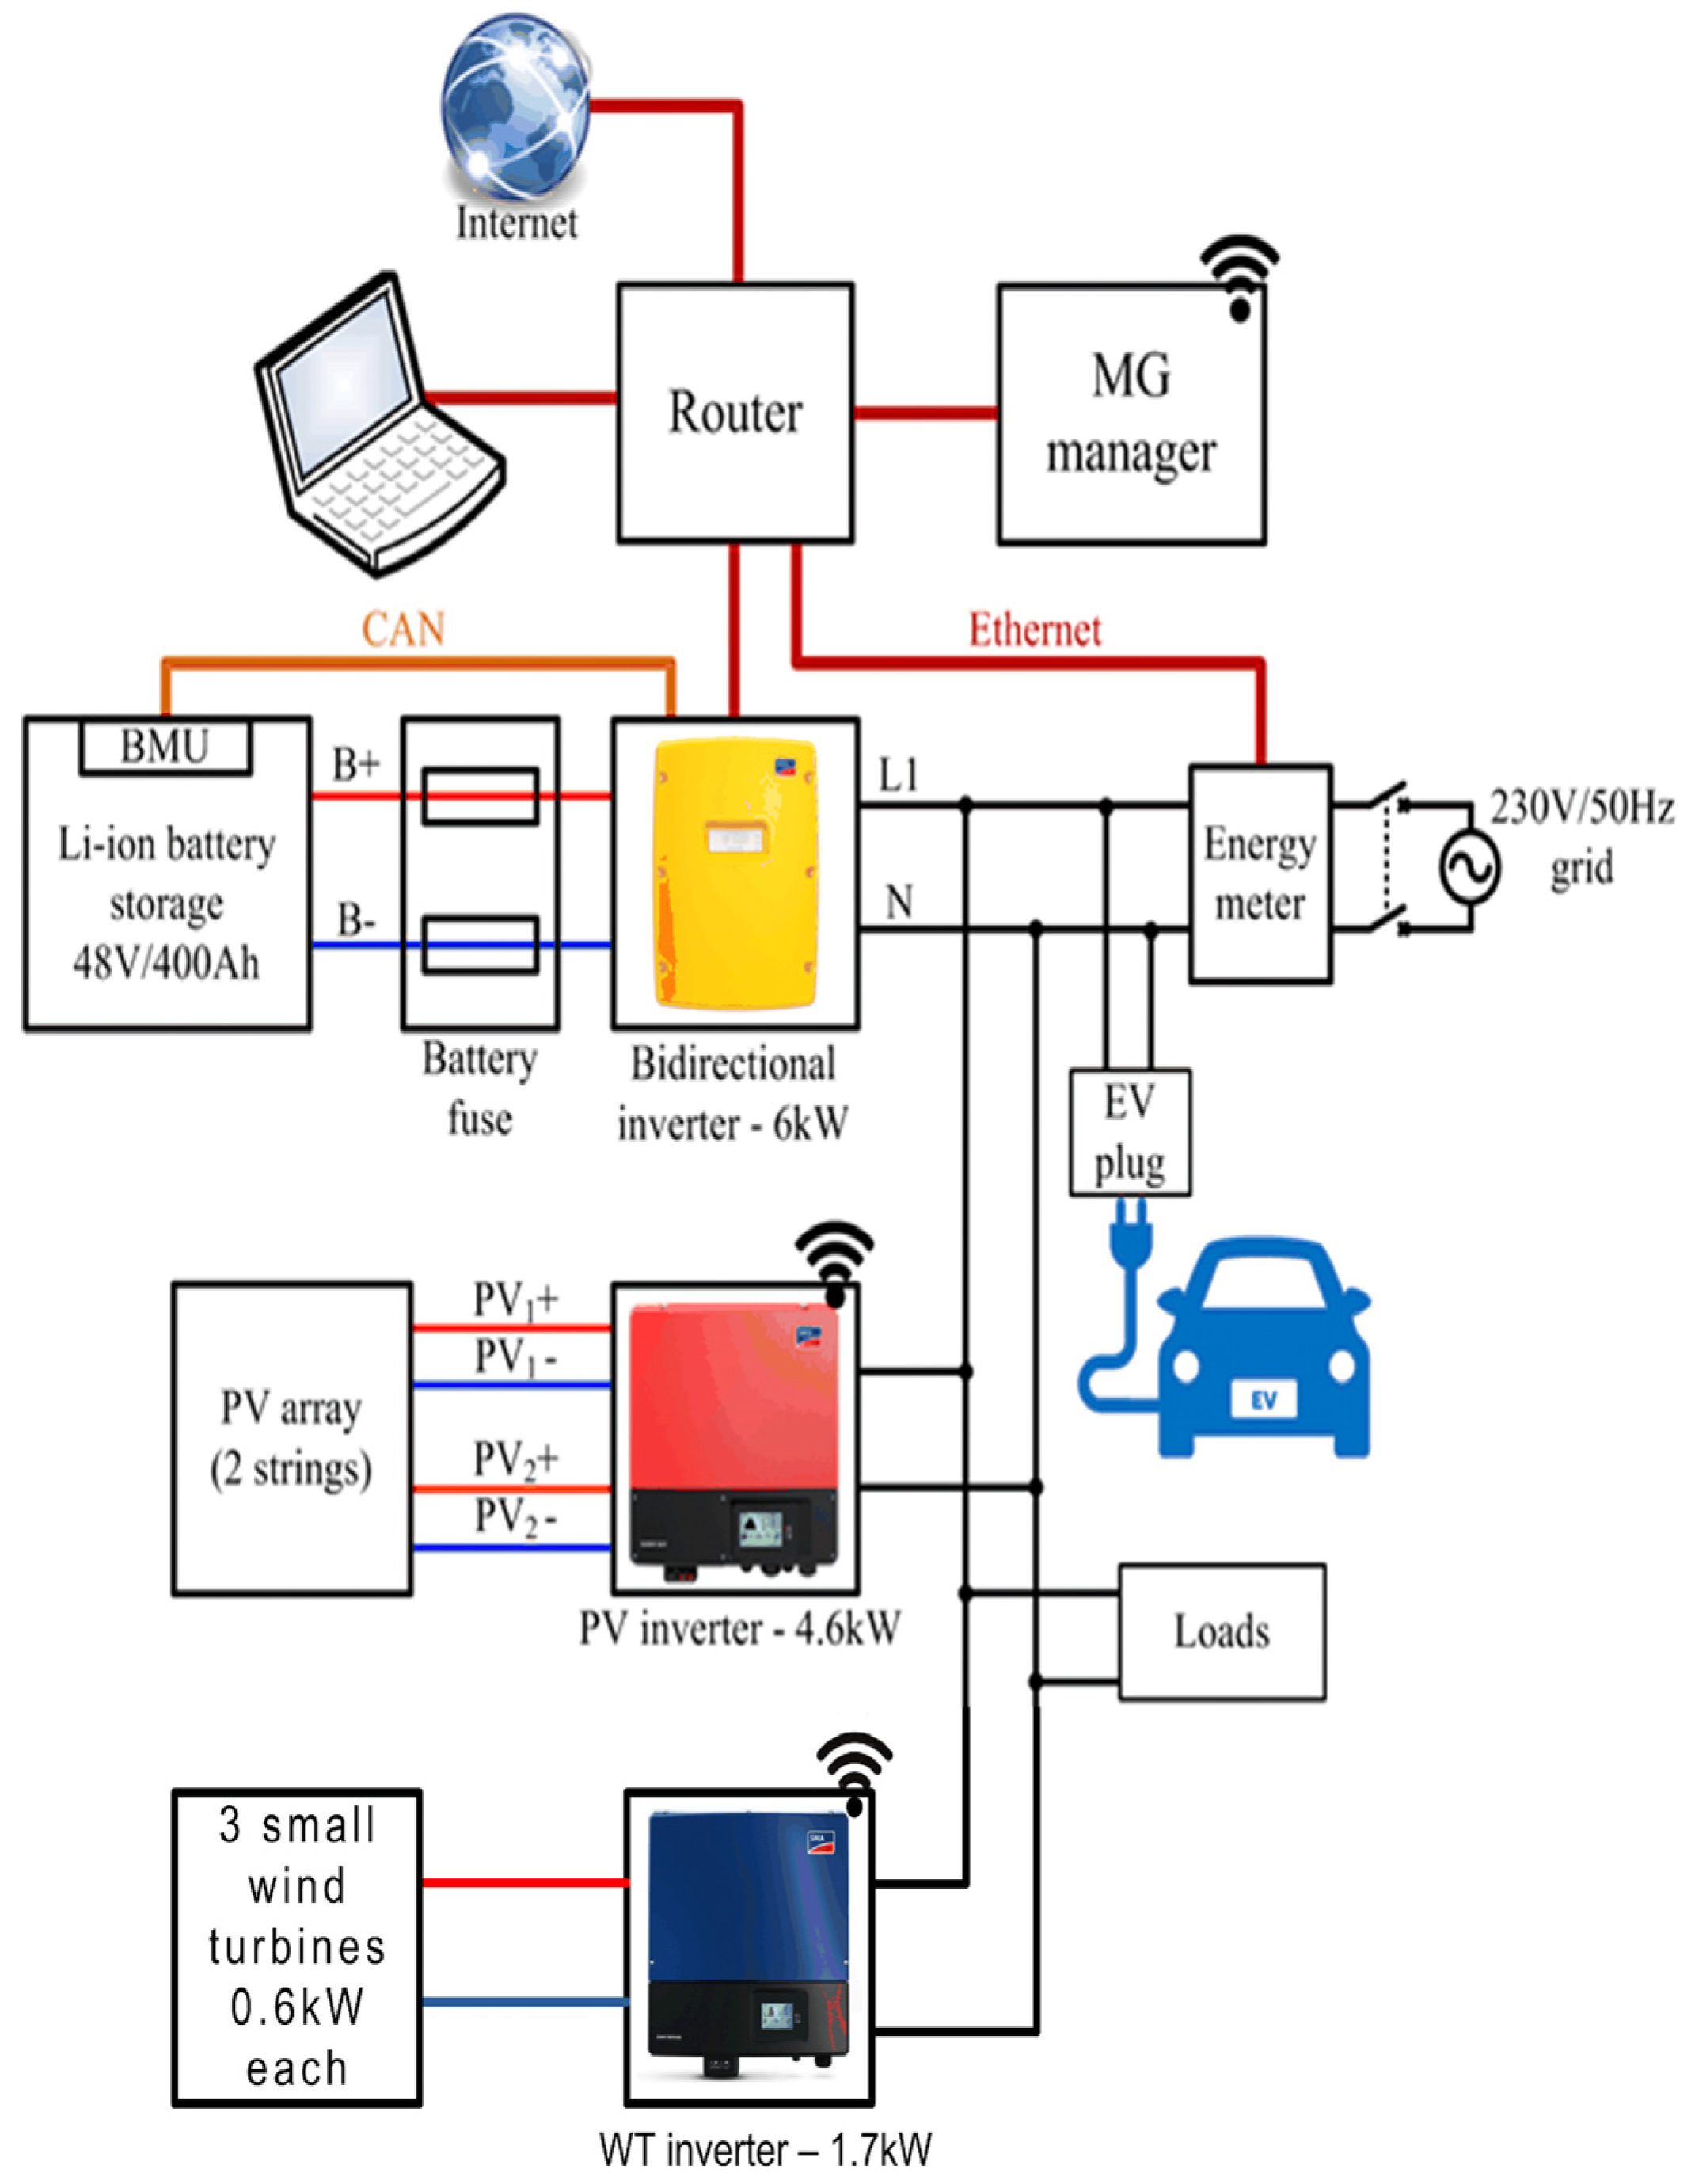
6]. The hardware and the main part of the software solutions were developed by the Romanian team of the project. The schematic of the Residential S-MG prototype can be seen in
Figure 1.
RES, specifically PV modules and wind turbines, energy storage and power electronics components available on the market, were considered in order to increase the reliability and reduce the implementation time of the solution. The MGG controller with the EMS software was implemented on a Raspberry Pi unit.
A large variety of RES-based MG topologies can be found in the literature [
7,
8,
9], including conventional generators, energy storage systems of various types, smart loads and other specific components. However, field expertise and comments on the suitability of components offered by the industry, mainly on the power electronics side, are lacking. Our paper attempts to fill the gap based on several years of research and expertise. It has the advantage of presenting a solution asked by above mentioned Directive (EU) 2018/844.
An optimal energy management system (EMS) can only be developed starting from the specificity of each MG in terms of existing resources and operational constraints. The EMS system also requires adequate control algorithms to coordinate and optimize the MG resources. This involves a reliable communication infrastructure to send real-time information across the MG [
10]. In practice with these components, the Residential MG becomes a Smart MG, S-MG with RCS.
The proposed Residential S-MG represents a residential prosumer, as it includes RES, storage, local loads and an EV charging port available for external users.
It is important to mention that, by using RES, the EVs are becoming more emission-free vehicles. Only a fraction of GHC emissions resulting from the construction of EVs remains to be compensated for.
Following the introduction, the paper is organized as follows:
Section 2 presents the PV design and power considerations; the wind energy-harnessing wind turbine (WT) solution design modeling is described in
Section 3;
Section 4 presents the storage solution and the contribution of the EMS to an optimal use of the battery;
Section 5 presents some important experiments which validate the solution, while
Section 6 highlights the main conclusions of the paper.
2. PV Solution Design
As one of the residential energy sources, the S-MG includes an 8 kW PV power plant mounted on the building rooftop. To match a good energy yield of the PV power plant with the need to comply with the power limitation in single-phase grids imposed by distribution grid operators, the solution was to oversize the PV array with respect to the PV inverter. Until recently, the size of the PV array to be installed on a house was mainly limited by economic reasons and available room to ensure a minimal electricity supply. The situation changes every day, especially as the PV prices are falling significantly. A PV array of 1 kW power was USD 4000 in 2010, it dropped at the end of 2017 to USD 700 [
11] and in 2021 the price is around USD 350 [
12]. Additionally, newly developed PV converters such as roof tiles [
13], air solar panels [
14], facade solar panels [
15] and solar windows [
16], hereby mentioning only those which have passed laboratory test levels, are able to transform every building into a PV plant. Together with a lot of research in development, it is easy to realize that in the near future, almost every building could become a PV power plant.
The solution presented in this paper was developed according to the methodology presented in the following lines.
As the output voltage of the PV panels fluctuates due to variable operating parameters (solar radiation and the module operating temperature), there is a limit imposed by the PV inverter DC voltage. Thus, different PV modules configurations were considered. The configurations considered to obtain the optimal PV power solution are listed in
Table 1 for a residential single phase MG.
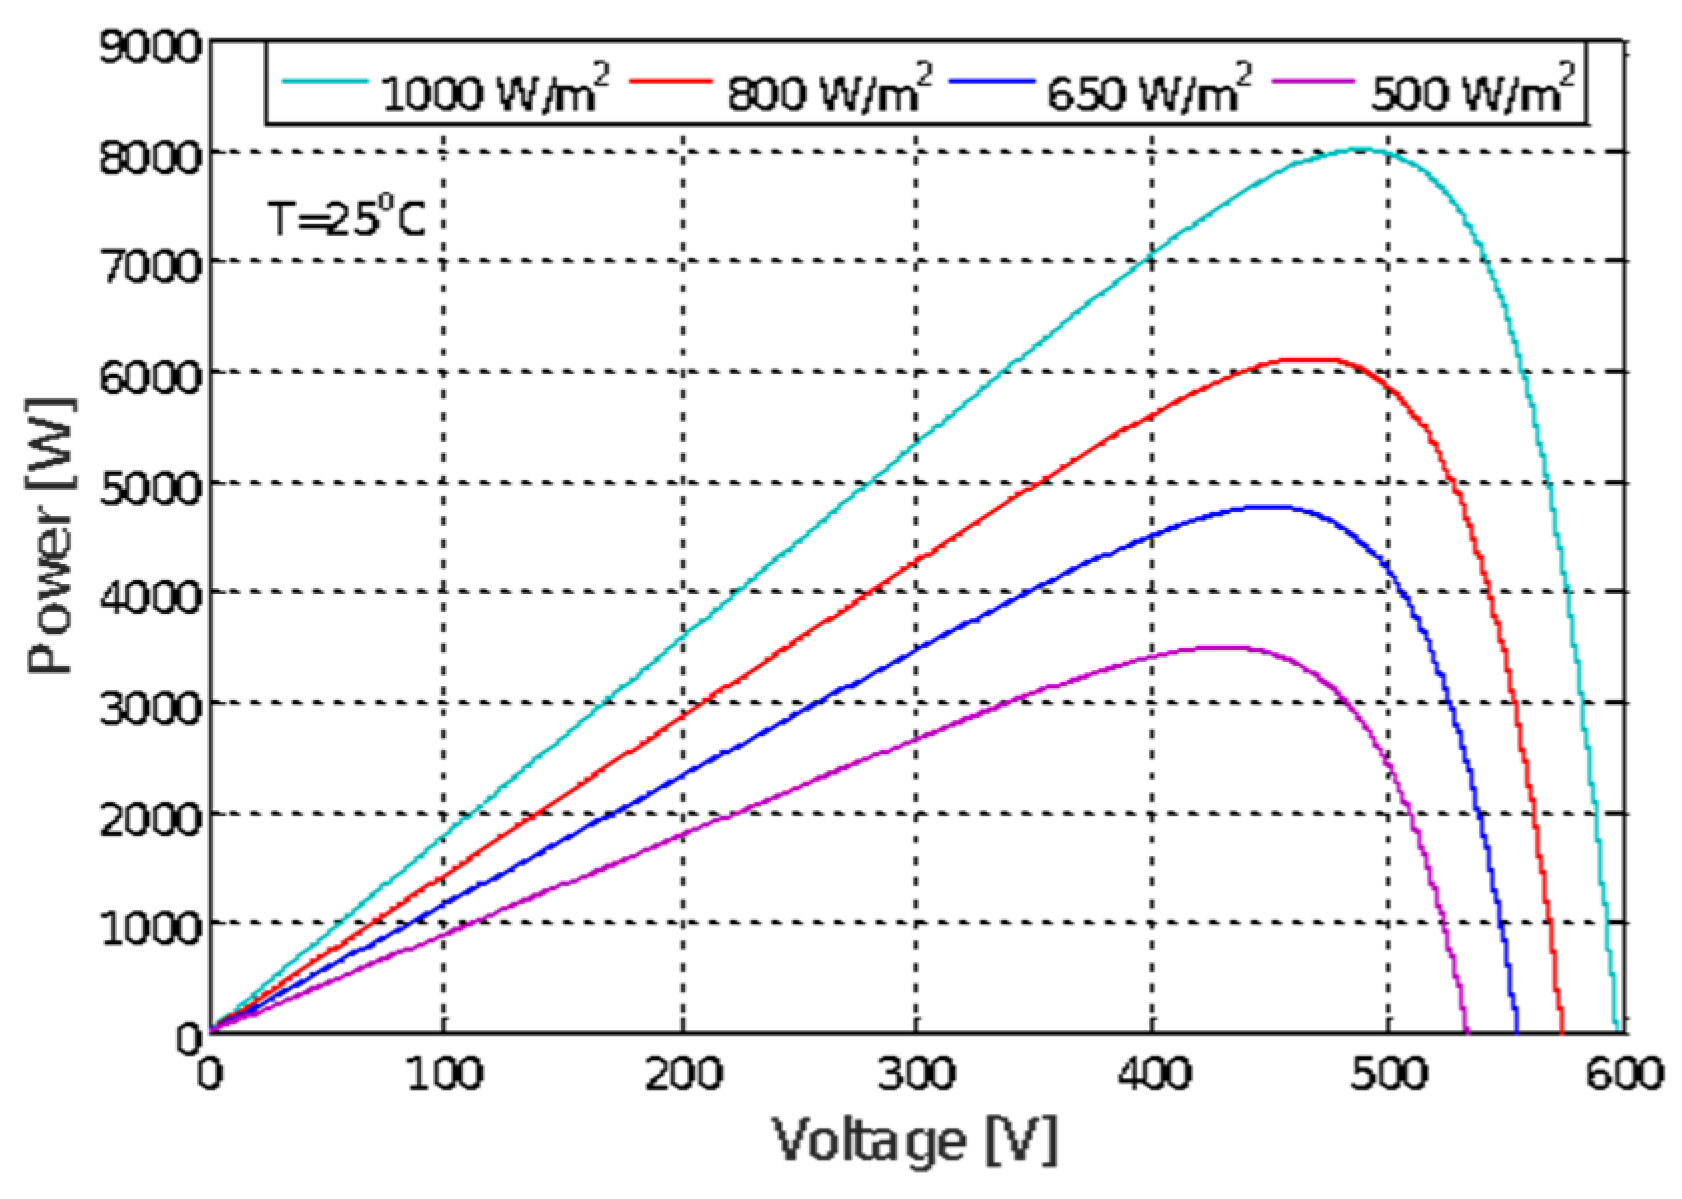
Figure 2 displays the PV characteristics power versus voltage for the 8 kW PV array for different irradiation levels at a standard temperature (25 °C). The same characteristics were computed for the other power levels mentioned in
Table 1, using the data from the datasheets of the considered PV modules. The conclusion was that the 8 kW PV array fits very well in the DC MPPT range of the chosen inverter, as it results from the third column of
Table 1. Moreover, in the case of partial shadings, the DC voltage still remains in the useful range for inverter’s MPPT, as it comes out from
Figure 2; meanwhile, a smaller array can cease to supply for heavy shadings (5 kW array case).
To design an optimal PV system, preliminary considerations of input data (solar radiation, temperature, weather) are essential in order to create a PV model for simulations and later to implement a PV system suitable for the field operating conditions.
For the PV array model, a method based on data mining using a local Gaussian function was employed. The data mining method used was based on the local Gaussian function from MATLAB, Equation (1):
where:
f(
x) represents the weight function for a value of
x;
A is the height of the Gauss curve peak;
μ is the “mean or central” value assigned to the variable; and
σ defines the width of the exploration range, representing the “standard deviation” of the variable.
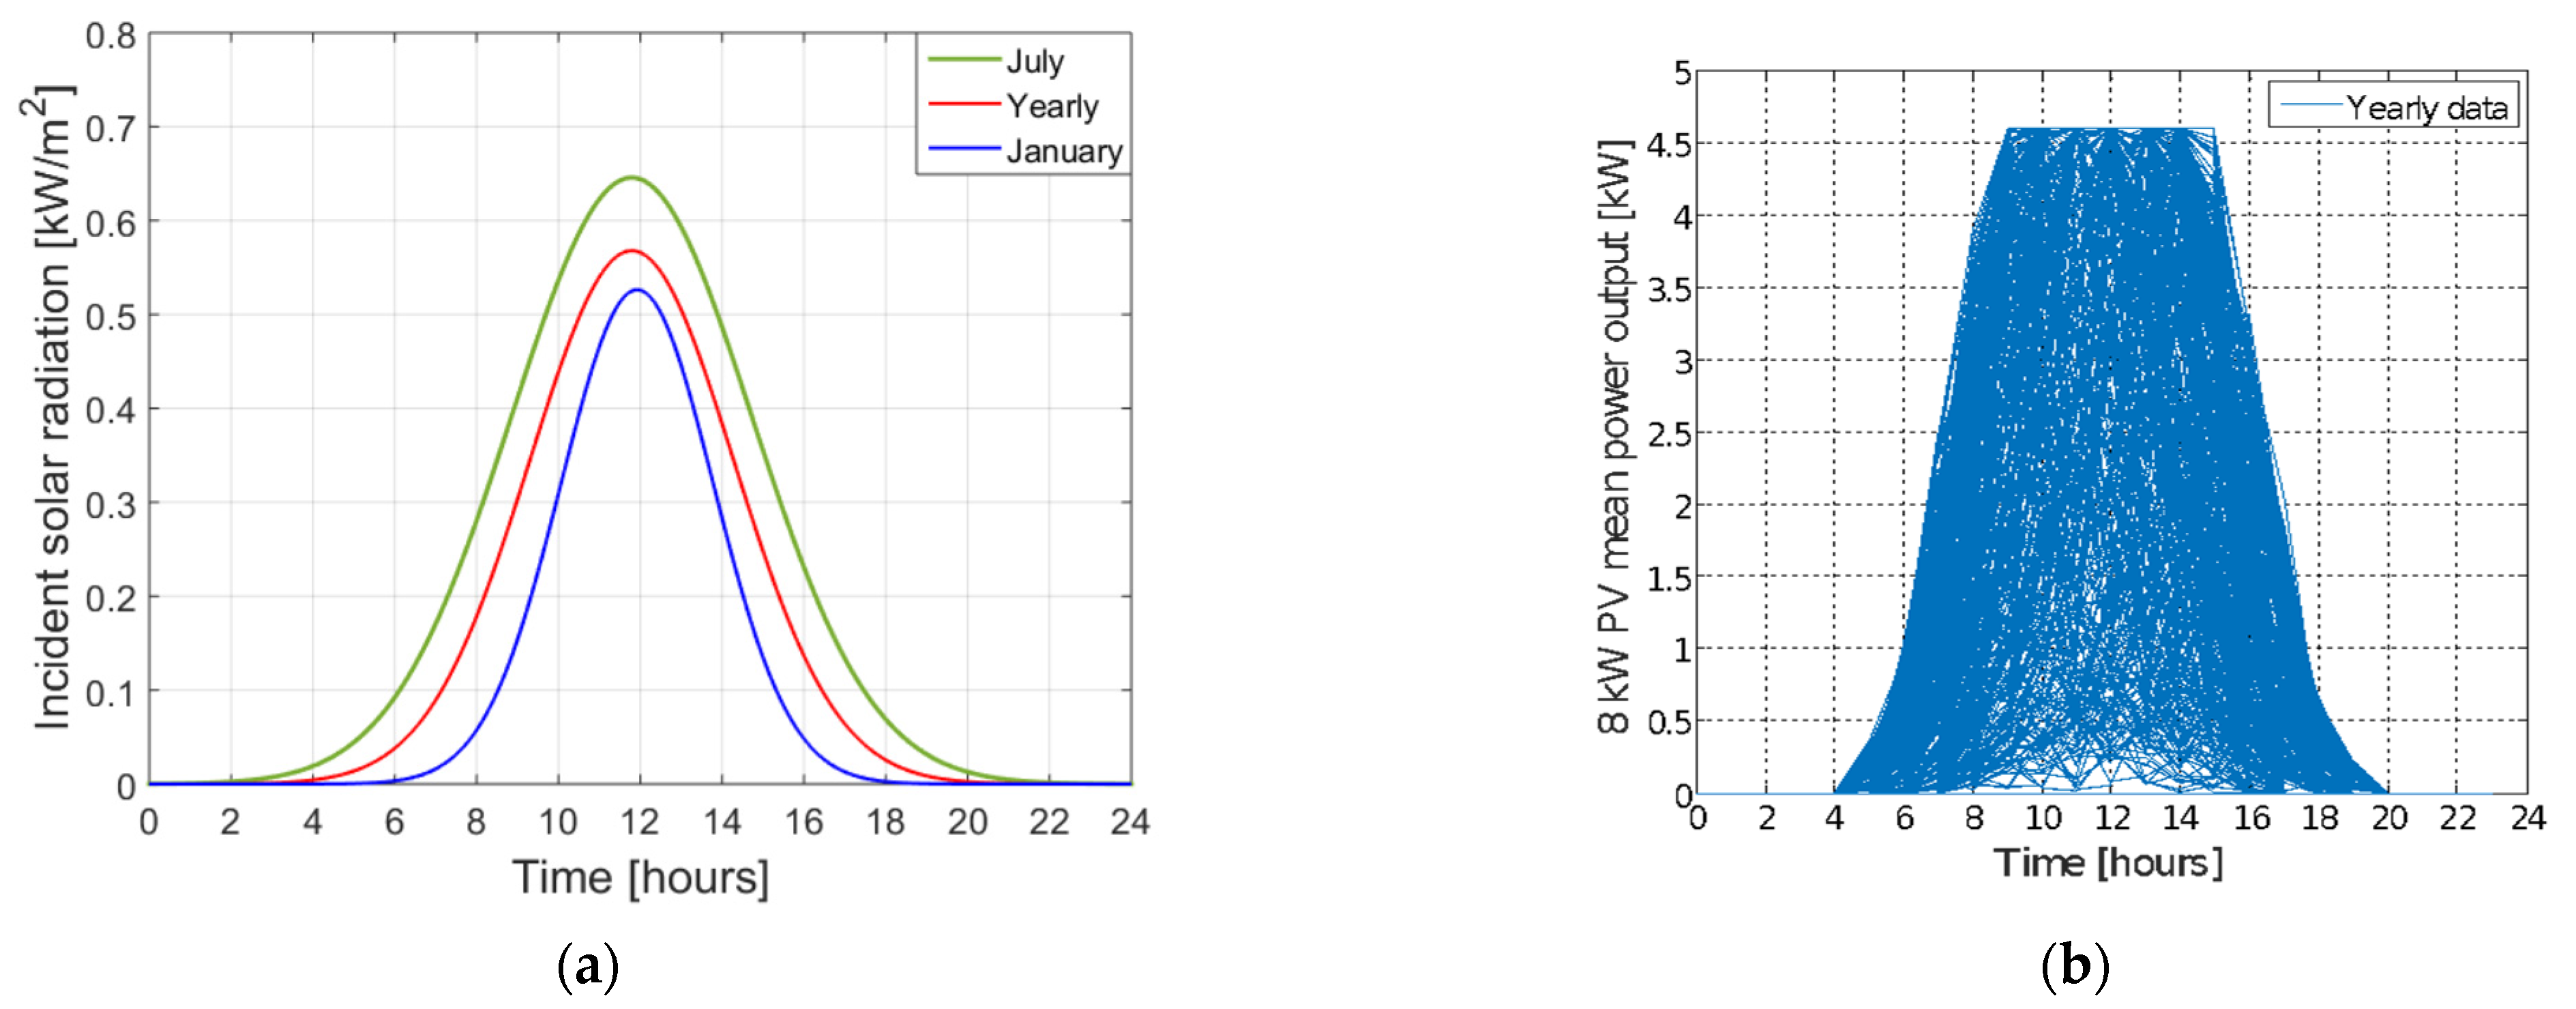
A local database of meteorological data (solar radiation) as input and electrical measured data (power delivered by PV panels) as output have been used. The PV system data are extracted in a suitable numeric form and then uploaded to MATLAB by a command file. Three cases are detailed here:
for scarce solar radiation values (January in Northern hemisphere);
for high solar radiation values (July in Northern hemisphere);
for yearly solar radiation values.
The simulation results can be seen in
Figure 3.
Using HOMER software and the PV power output (according to
Table 1), the energy yield was determined in all analyzed cases. The clipped output power given by the inverter, 4.6 kW, was taken into consideration (
Figure 3b). The modelling results are summarized in
Table 2.
The results show that the best yield is obtained for the 8 kW PV array in all cases.
The conclusion may seem trivial, but the simulations are covering the early and late afternoon and cloudy days’ extra energy yield of the 8 kW array in comparison with the lower power levels. For example, in January, the energy gain obtained from 8 kW PV compared with 5 kW PV is 33.83%; compared with 6 kW it is 20.74%, and compared with 7 kW it is 9.23%. In July, when the irradiation level is the highest, the energy gain obtained for 8 kW PV power increased to 34.97% compared with 5 kW PV power (where clipping is not involved for most of the time), 21.99% compared with 6 kW PV power and 9.93% relative to 7 kW power. For the whole year, the energy gain obtained for the 8 kW PV is greater than in the case of 5 kW PV with 34.8%; compared to 6 kW, it is 21.86% greater and to 7 kW, it is 10.05%.
More about the modelling results can be found in [
17].
Regarding the PV inverters, one can say that they are very well suited for the purpose of being involved in residential S-MG, with good communication and metering facilities. They can be easily integrated in residential S-MG due to the accompanying software. PV inverters are cooperating well with the EMS control.
3. Wind Turbine Solution Design
Small wind turbines are rated between 0.2 kW and 3 kW according to the Distributed Wind Energy Association (DWEA) [
18].
The residential use of wind energy for charging stations is considered only in a few cases in the literature, but without any sound technical approach. This new S-MG component is increasing the complexity of the EMS control solution, and previous studies that consider both PV and wind are not presenting any control solution.
We consider the wind RES because, in the temperate climate zones and above, the wind source and solar source are complementary [
19]. Even if the wind turbines available to install on buildings are of rather small power when compared to PV panels, the energy from wind RES helps to a smaller storage effort and contributes to the safety of the supply, when sun irradiation is not available. Another important reason is the fact that the capacity factor of wind source is between 20–40%, meanwhile for a PV it is in the range of 10–25%. Additionally, the already built houses in today’s cities are not all properly oriented to fully convert the sun irradiation. Small wind turbines can be installed where the conditions are available. Small turbine inertia is reduced so they can start at low speed winds (about 2 m/s) and offer a precious contribution [
20,
21]. Environmental issues are smaller than the pollution generated by fossil fuel-based electricity. To allow for building integration, it is necessary that improvements in reducing tower height, vibrations and noise are designed in the future [
22].
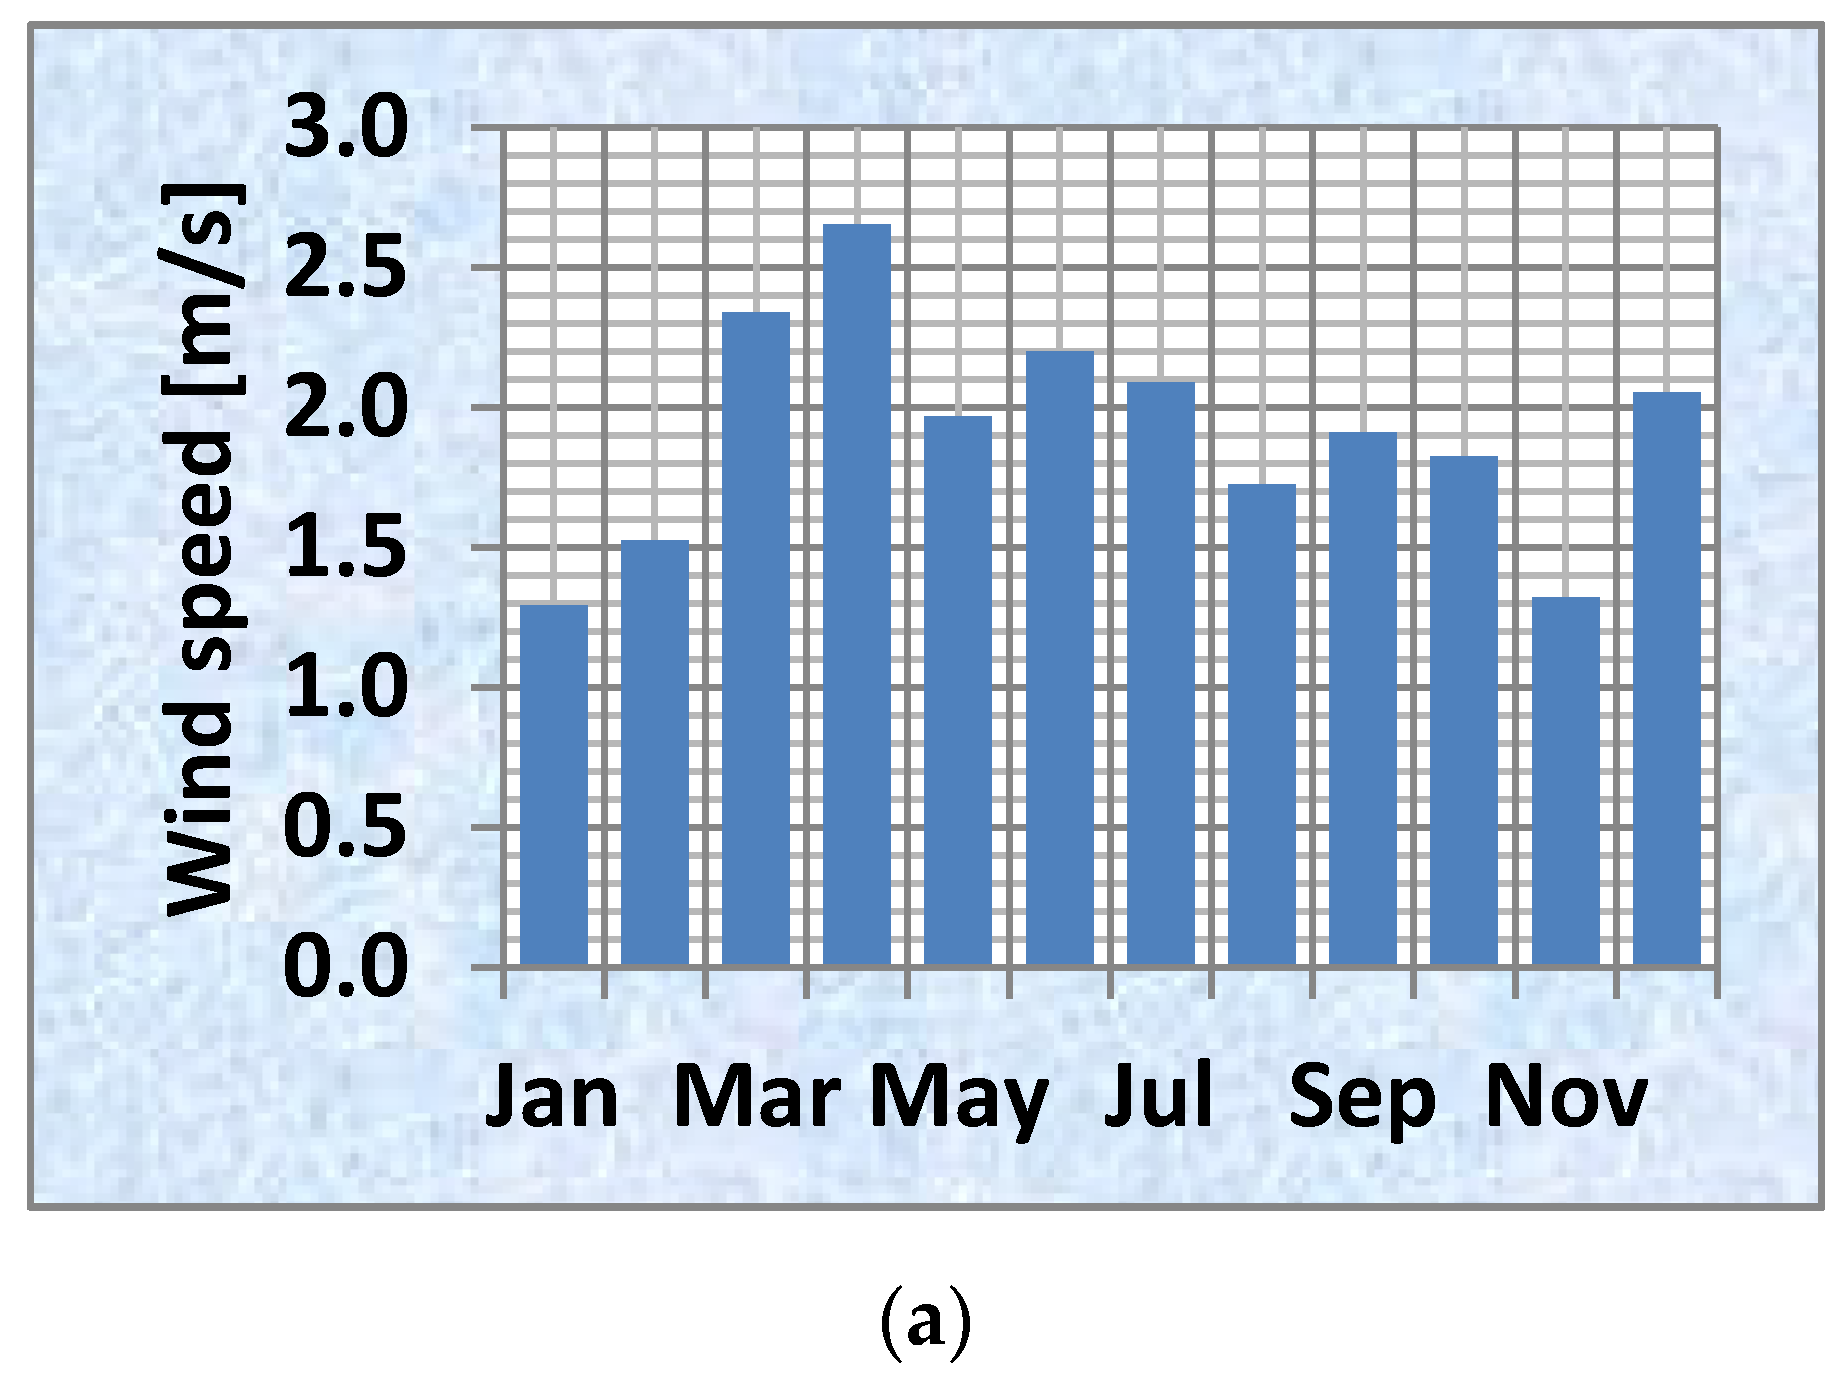
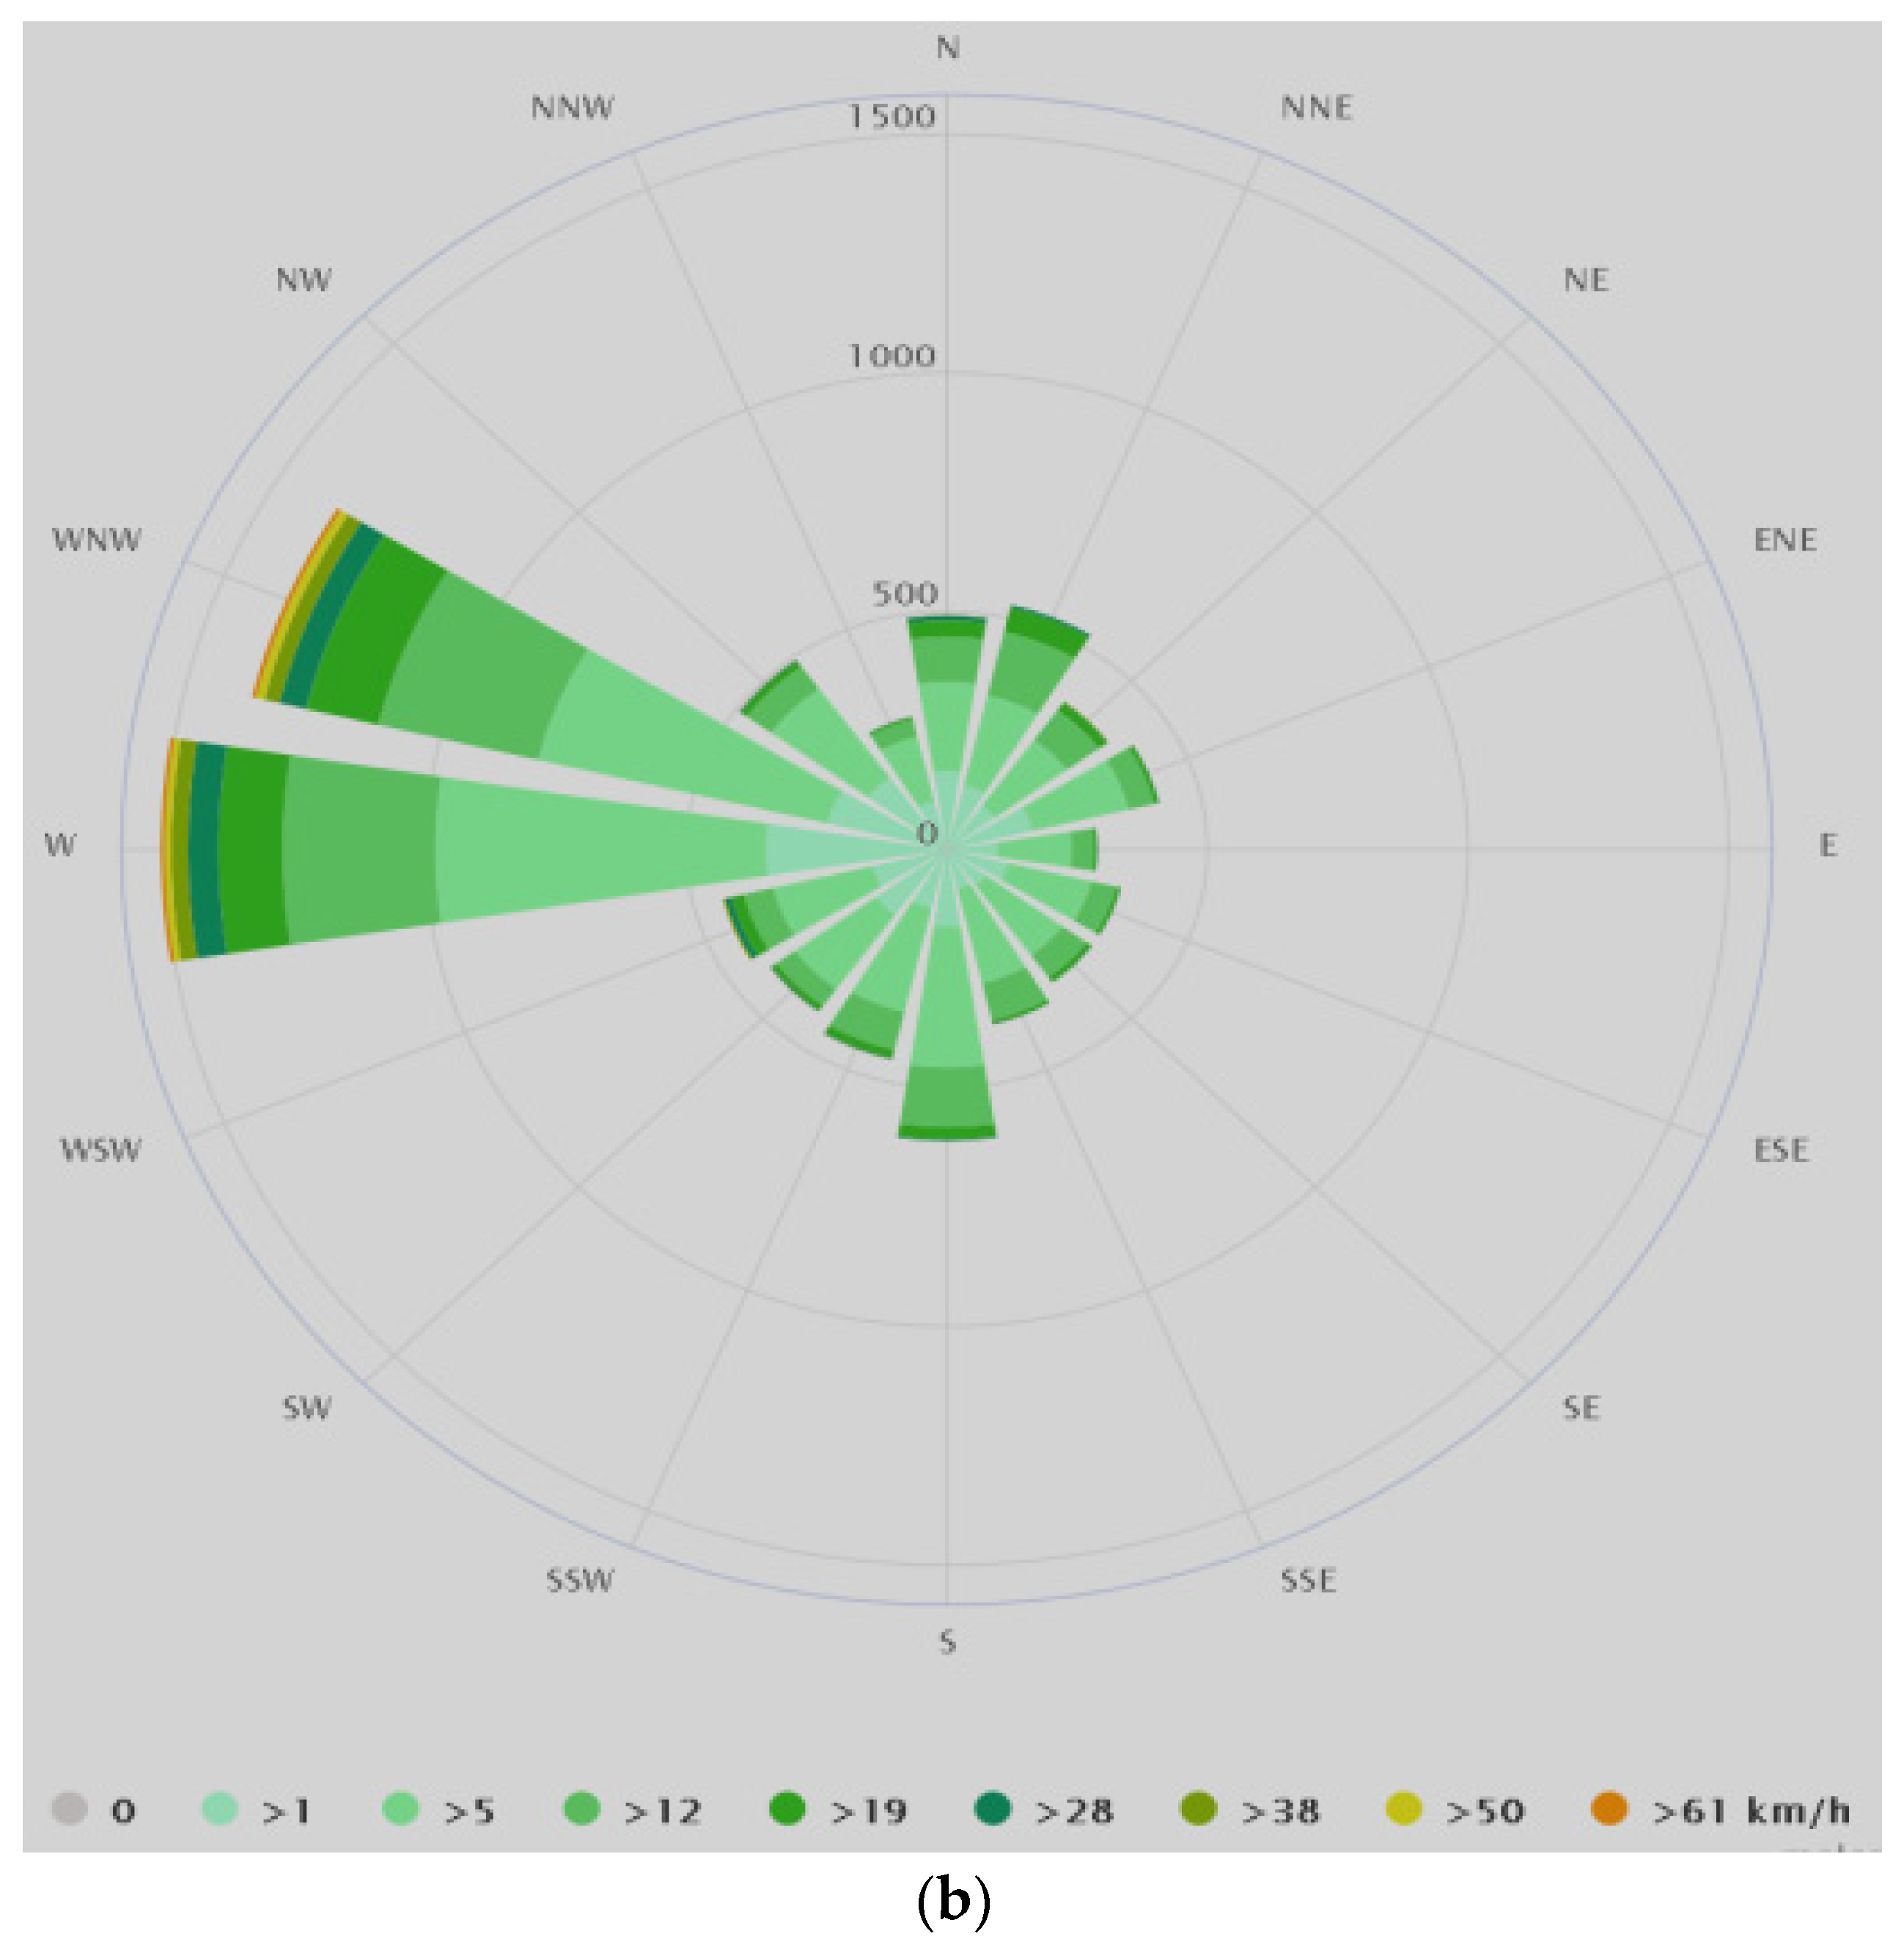
The problem considered is the optimal selection of a small wind turbine that works together with a PV system and energy storage elements in the studied residential RES-based EV charging station. In order to choose the suiting wind turbine for a certain location, preliminary estimation and measurements are mandatory. The recordings for our site have shown that the resource is rather scarce, based on a low wind speed. For the research location area, wind maps issued by the Romanian weather administration show an average wind speed of 2–3 m/s at 10 m altitude. The building to place the WT is around 11 m high. Additional measurements were taken by a weather station placed on the rooftop of the building. Results for 2017 are given in
Figure 4a, yielding an average annual wind speed of 1.9 m/s.
Figure 4b shows the wind rose, where westerly winds are the most frequent. Their orientation is important in the optimal placement of a WT in case of local obstacles on the building roof, in our case, the PV array.
The goal of our research was to find a wind turbine, with an output power around 2 kW, which responded the best the particular wind conditions. Ten small wind turbines were selected, with powers ranging from 0.6 to 2 kW, both vertical wind turbines (VWT) and horizontal HWT types.
Table 3 presents this selection together with important parameters such as nominal power, maximum power, cut-in wind speed, nominal wind speed and rotor diameter. The WTs written with italics have a vertical configuration, VWT.
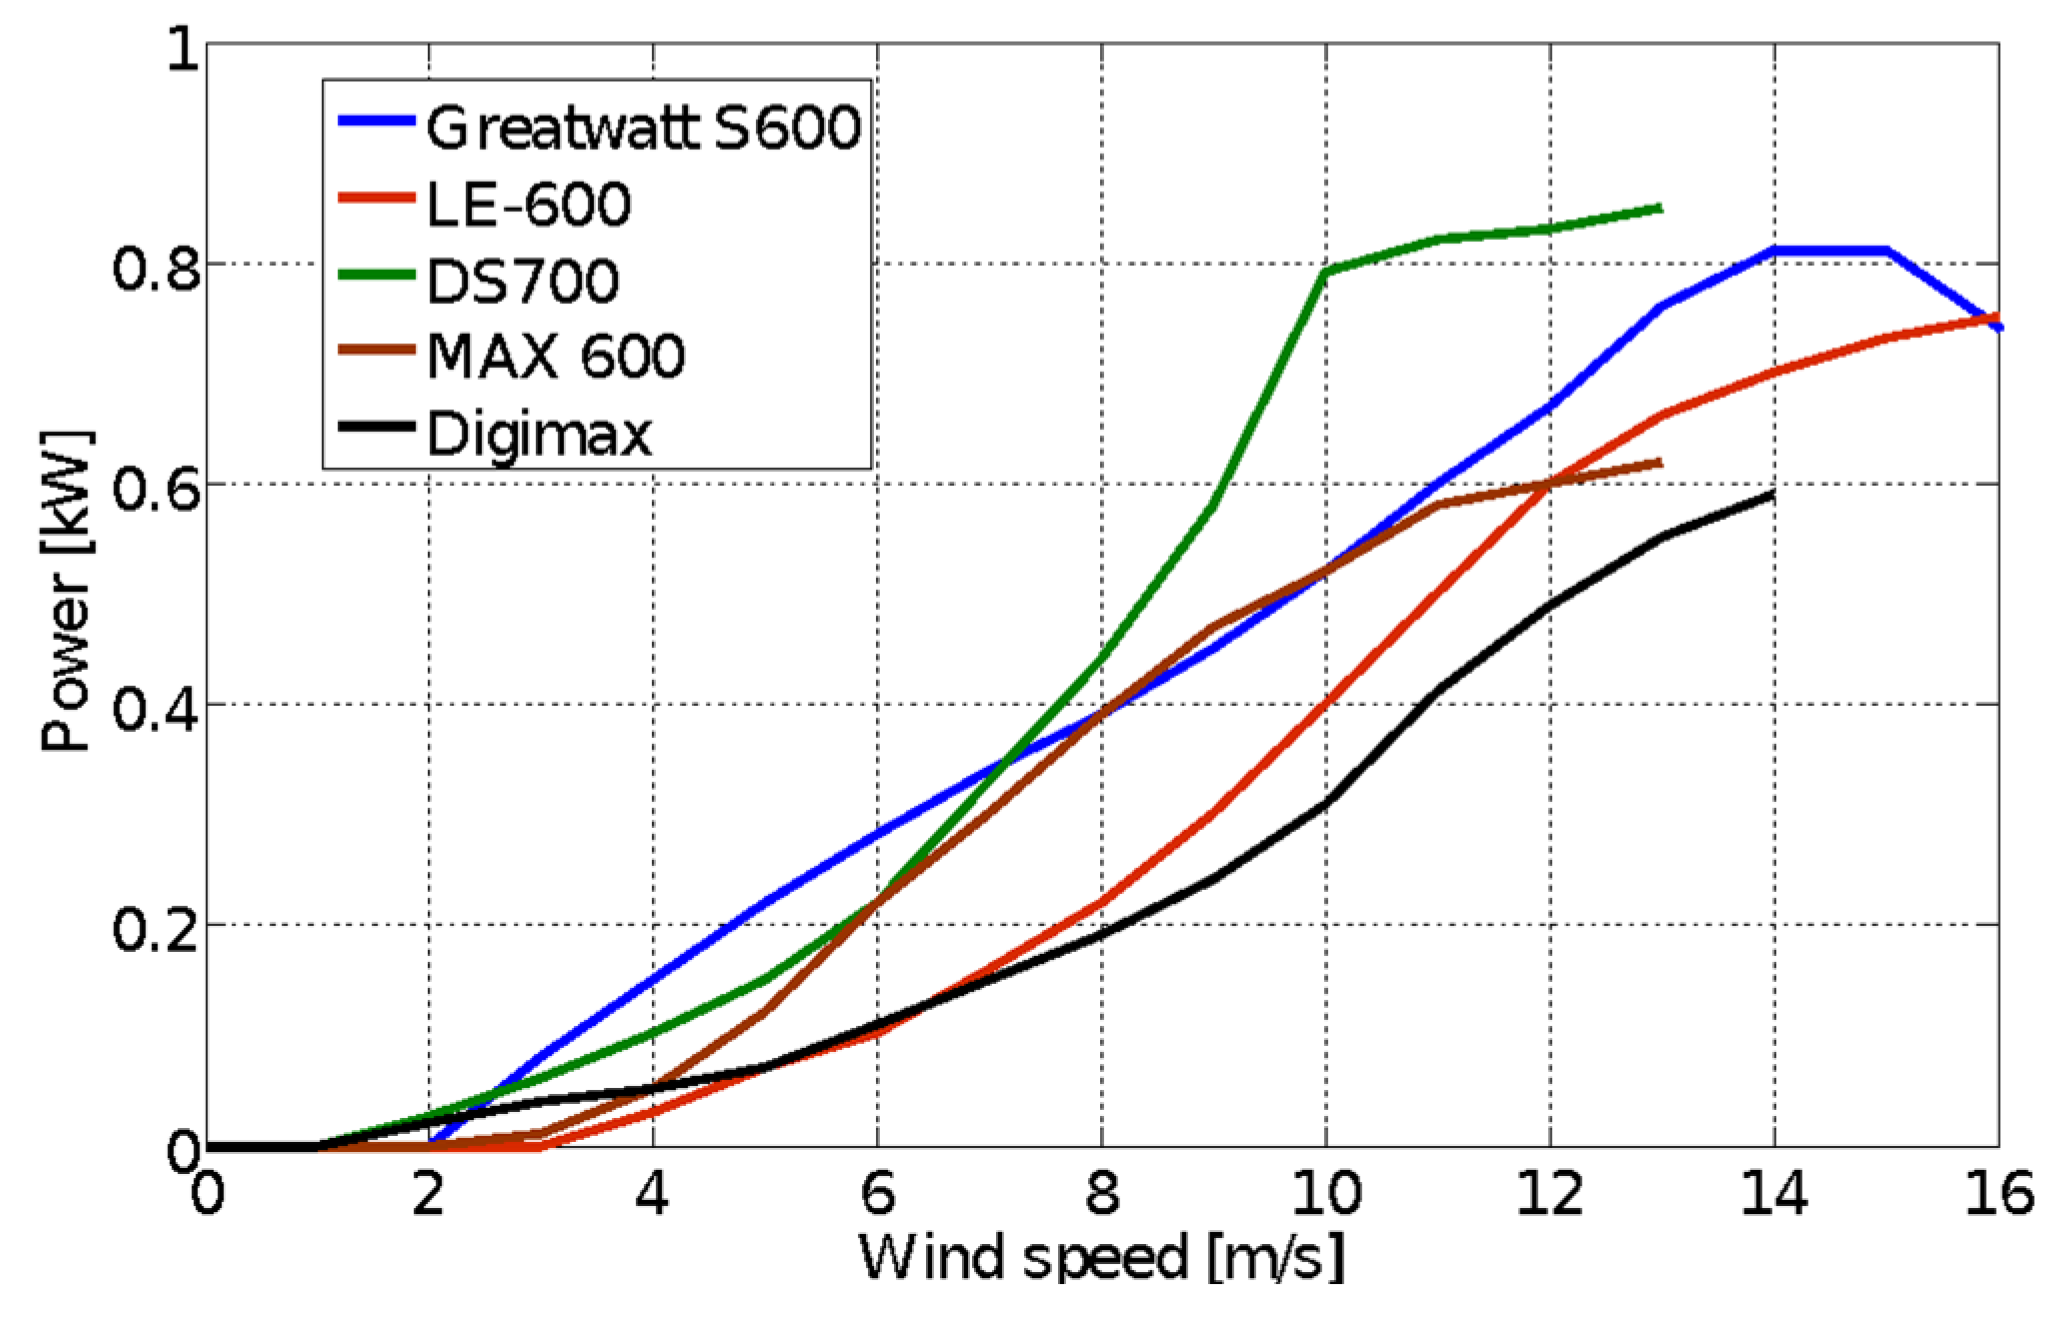
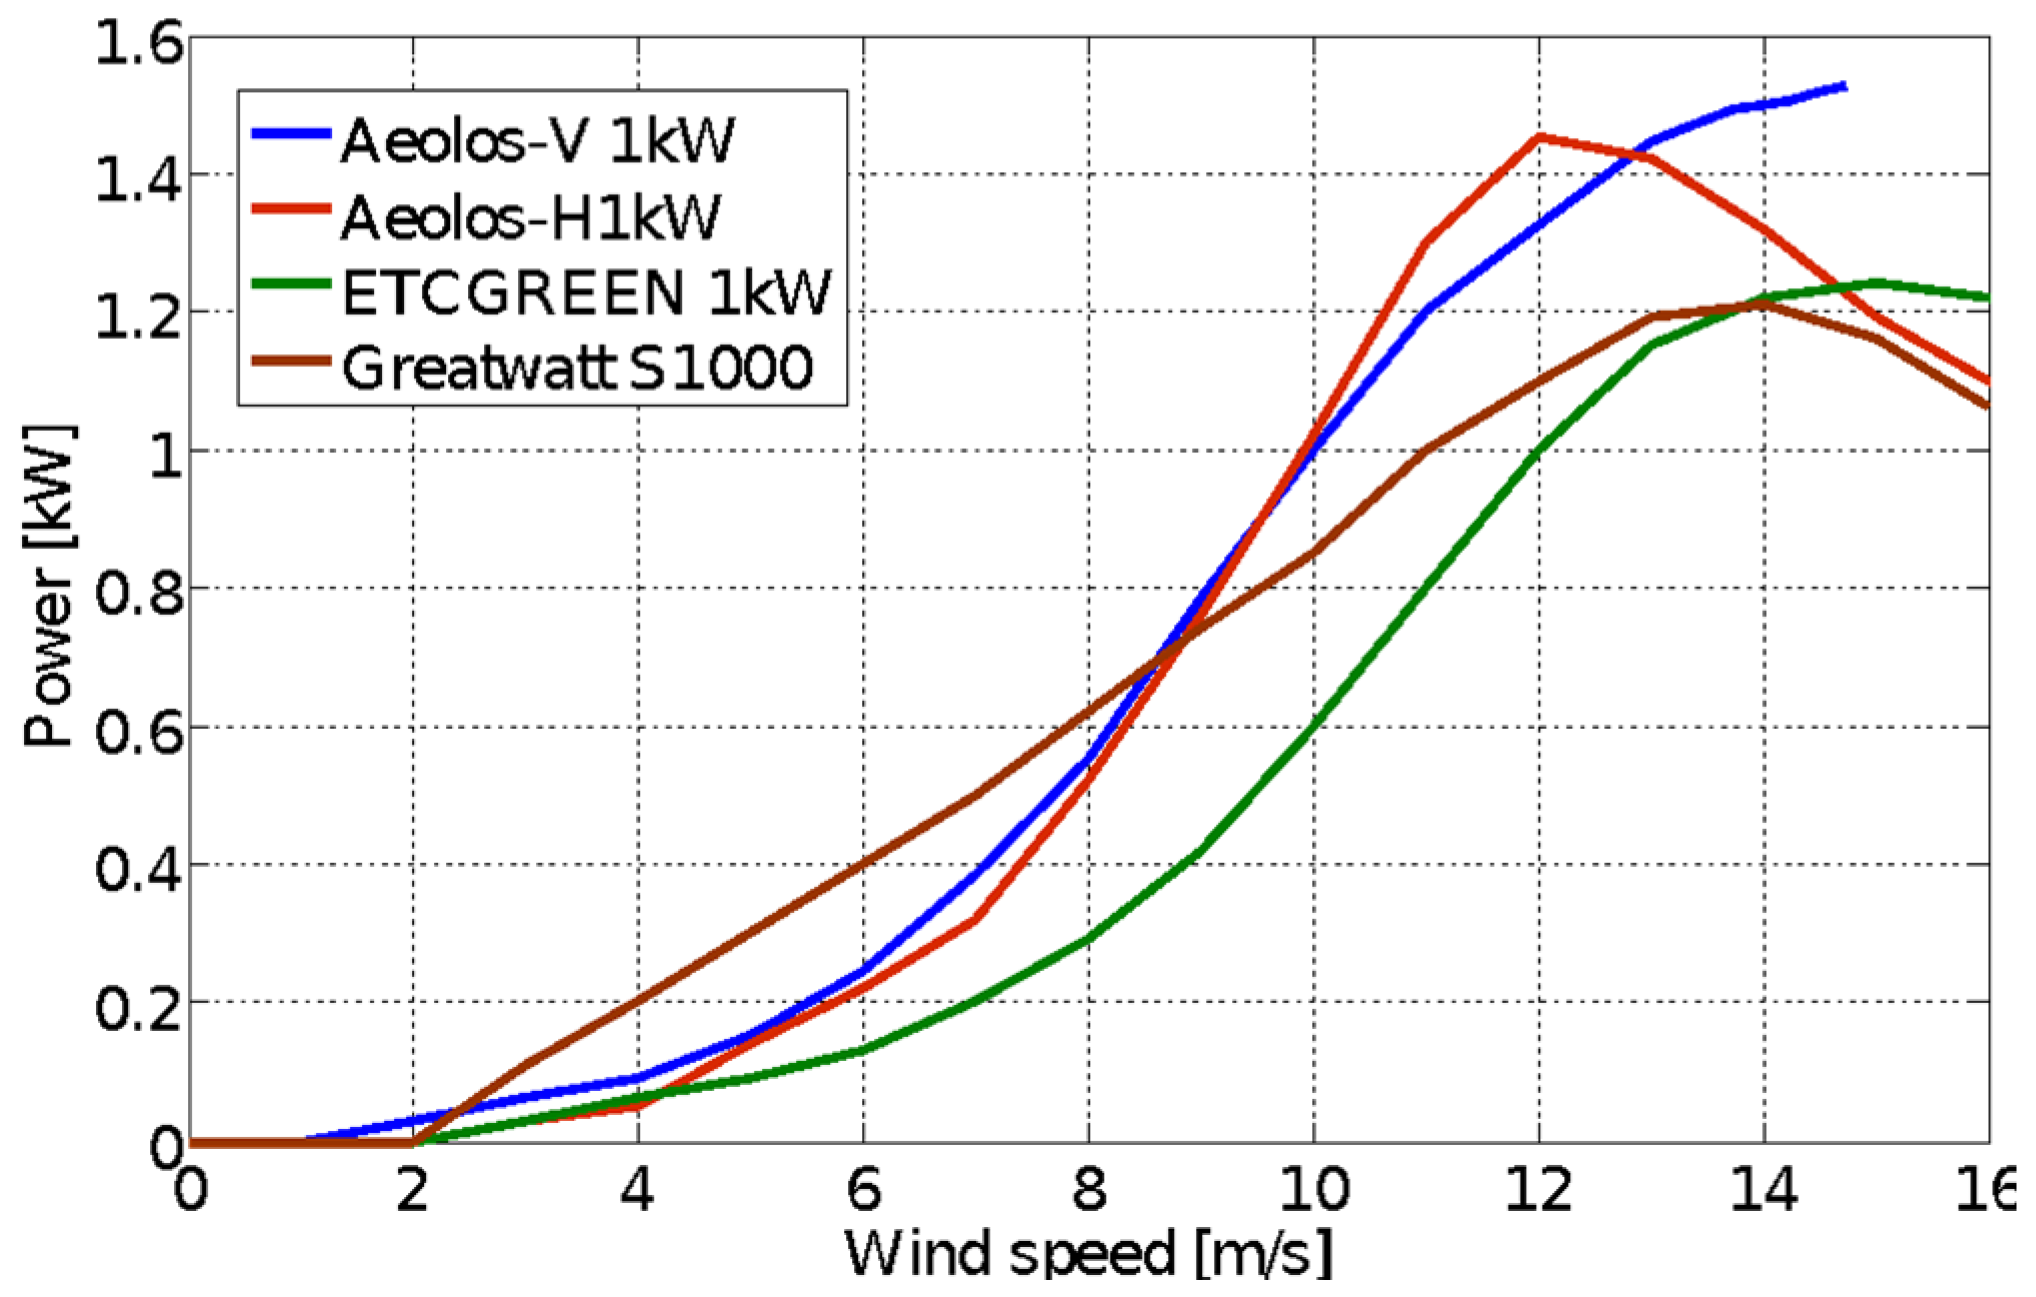
The turbines were divided into three categories, according to their nominal power: 2 kW, 1 kW and 600 W. For each category, the power versus wind speed characteristics (generated in Matlab using data from the manufacturer datasheet) were established.
Their performance was established using HOMER Pro software. The results for the 0.6 kW WTs are presented in
Figure 5 and those for the 1 kW WTs are presented in
Figure 6. Performance of the 2 kW WTs can be found in [
23], but this category was later eliminated in our study due to its sizes (tower height, rotor diameter).
The annual energy production of the considered turbines was obtained with the HOMER Pro software. According to the datasheets, all the WTs have a DC output; three-phase permanent magnet generators convert the turbine energy, and through adequate rectifiers can provide 12/24/48 V DC voltage. The efficiency of the grid inverter was considered to be at 95%. Even if the figure is a little bit high, especially for smaller inverters, we considered that it did not significantly change the situation. The wind resources data were provided by a weather station placed on the building’s rooftop with a 10 min sample time for the entire year 2017.
The Weibull distribution for the wind speed has given the highest frequency of occurrence for wind speeds of 0.5–1 m/s, which is not very useful as the average cut-in wind speed for most of the considered WTs was 3 m/s.
Considering the power–wind profiles from
Figure 5 and
Figure 6, we chose Greatwatt turbines because they have the highest Power/wind speed ratio for low wind speeds in the range 2–7 m/s and start at 2 m/s. Our power target was 2 kW, because as the Capacity Factor of Wind Source is between 20–40%, meanwhile for a PV it is in the range of 10–25% [
24]. So one can expect usually to obtain from a WT of a certain power the double amount of energy than from the same power PV plant. That as a rule of thumb.
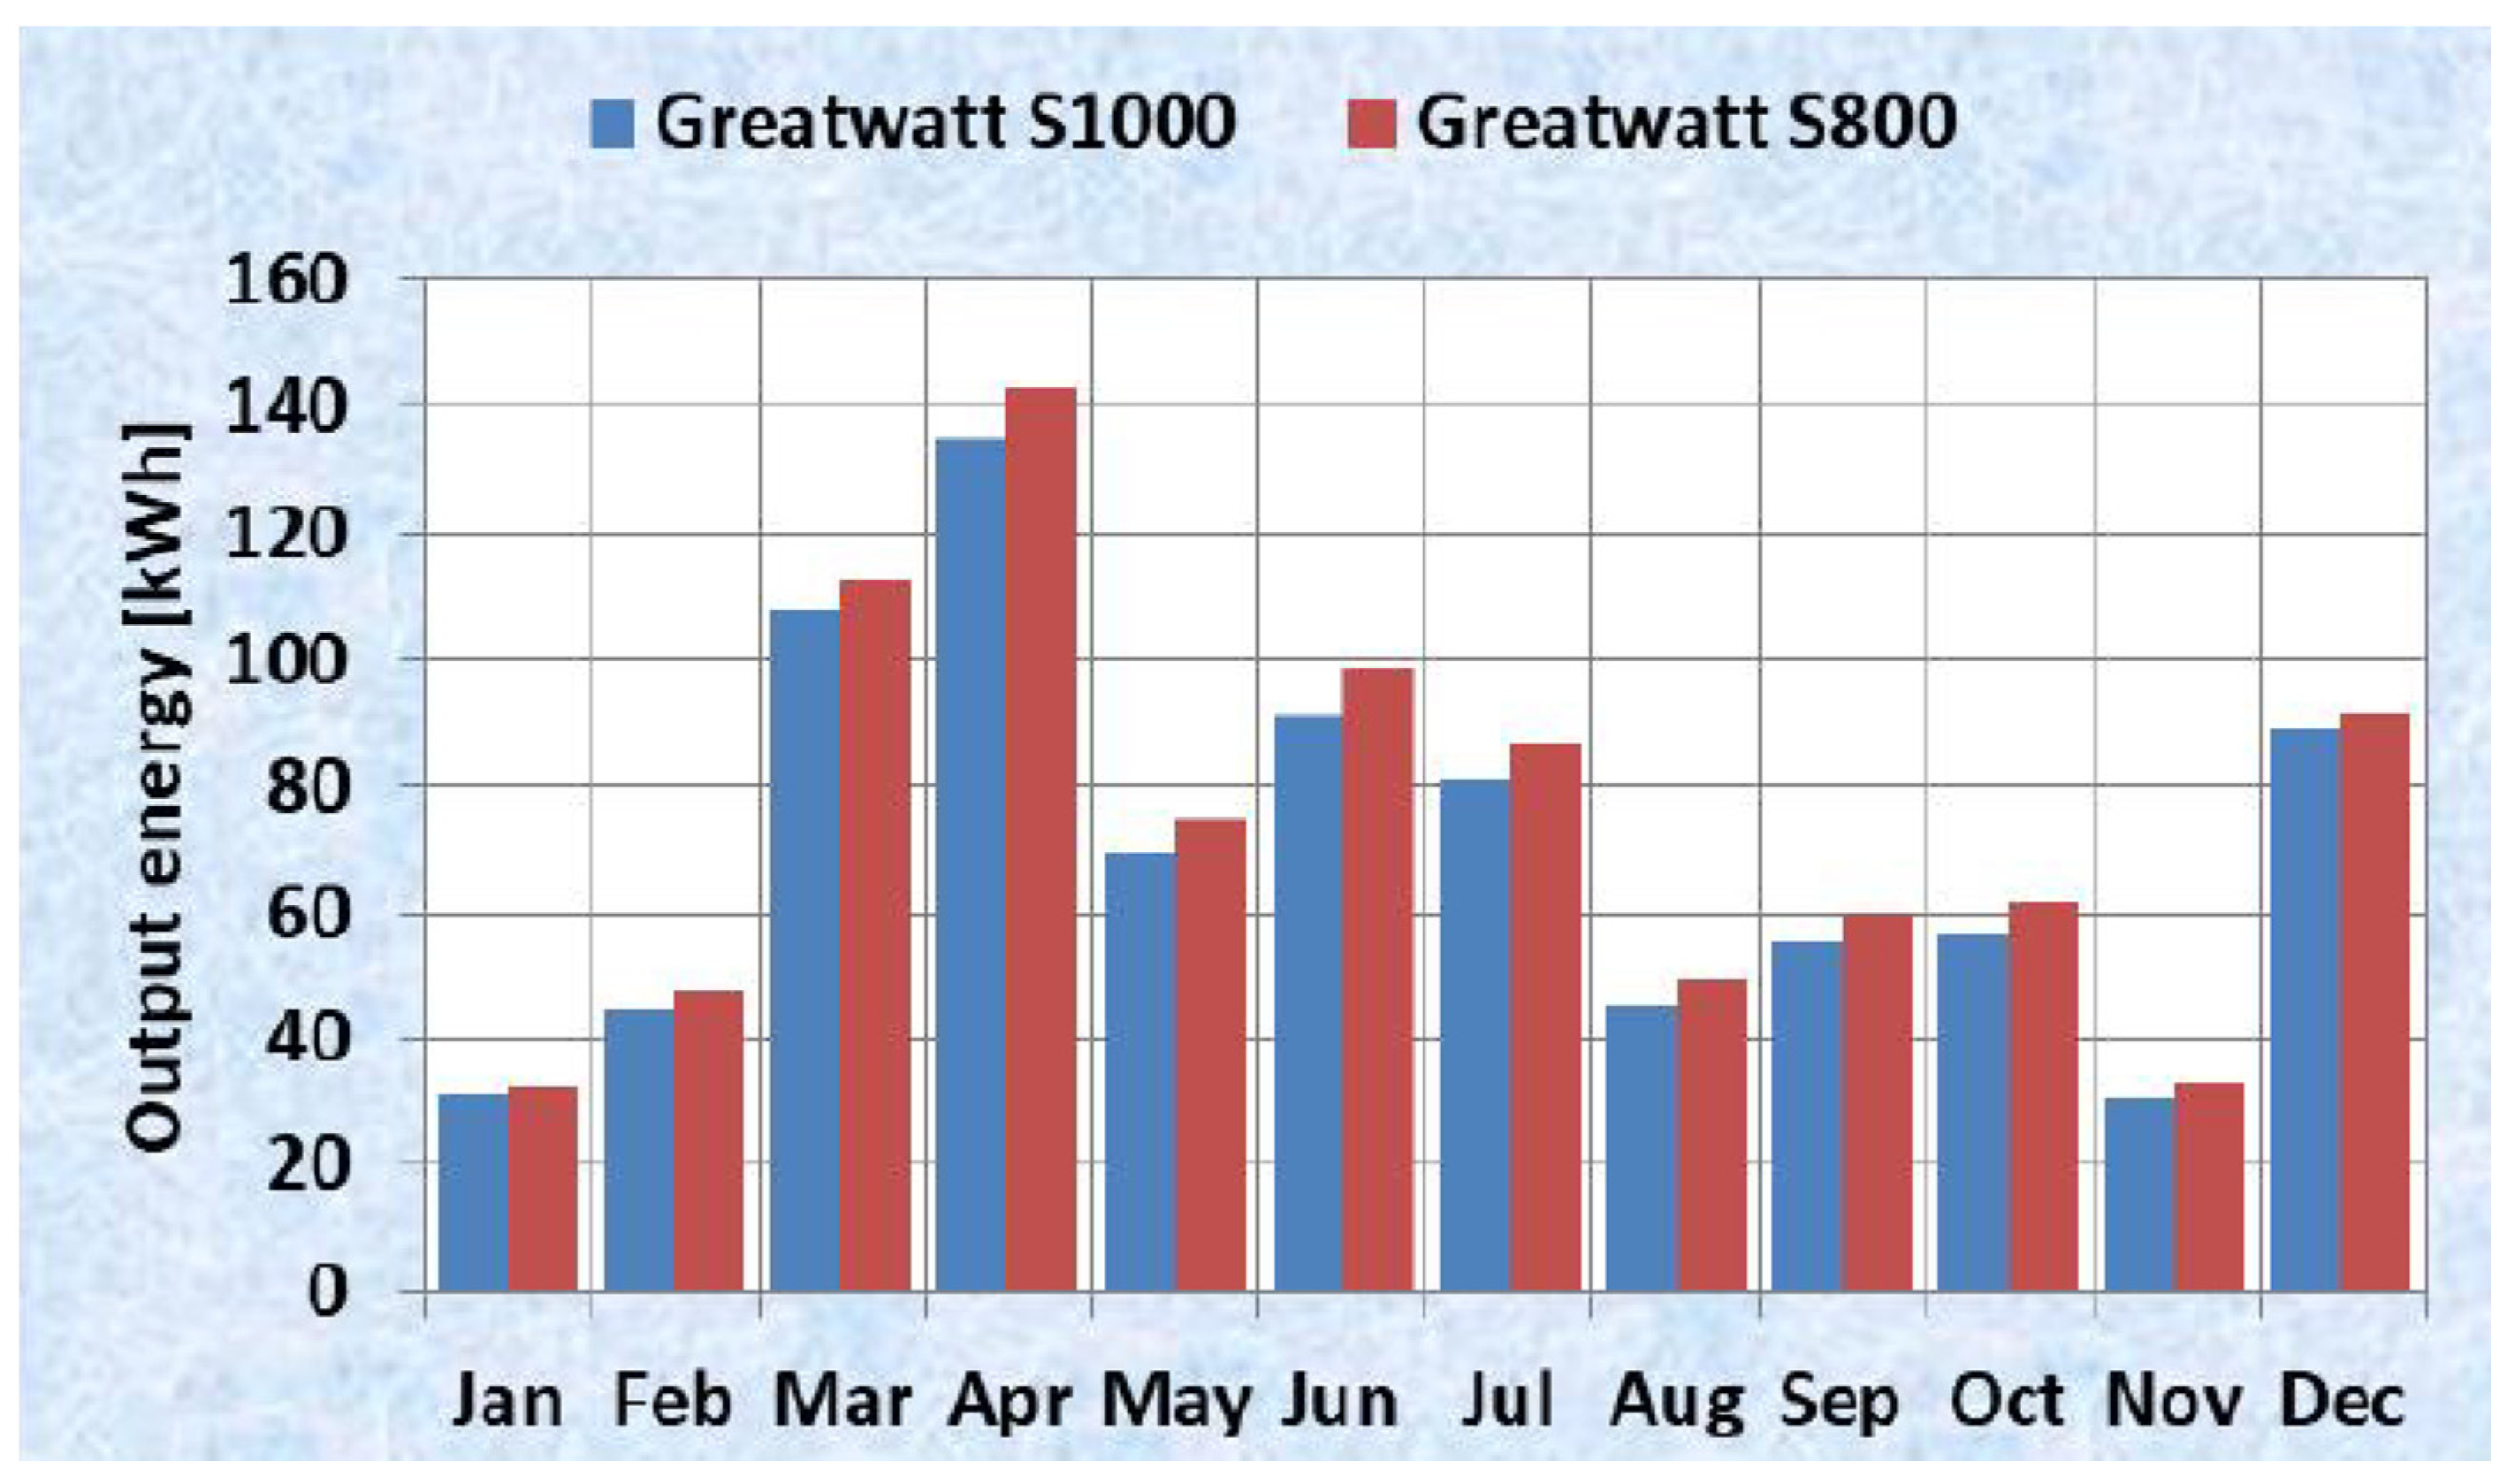
Further simulation results showed that a maximum of 900 kWh could be obtained annually by using 3 Greatwatt 600 W HWT at the local average wind speed of 1.9 m/s. For comparison,
Figure 7 presents the monthly energy yield summarized for two turbines of 1 kW and for 3 WTs of 0.6 kW. One can realize from
Figure 7 that even if the power of 3 WT of 0.6 kW is 1.8 kW and the power of 2 WT of 1 kW is 2 kW, given the local low wind speed, the WT combination of 0.6 kW collects more energy. This result is due to the lower inertia of the 0.6 kW WT.
Another advantage of the 0.6 kW WT is its smaller size (1.7 m rotor diameter and low hub height), allowing it to be placed on the edge of the roof, indicated by the wind rose,
Figure 4b, as the one toward the dominant winds. This orientation would avoid wind turbulence due the friction of the wind with the roof surface.
In financial terms, the cost of the 2 × 1 kW turbines is very close to the cost of the 3 × 0.6 kW WTs.
With respect to power electronics components for WT, here we find the obstacle in implementing the solution. No available power inverter on the market was able to work for our solution.
Small inverters on the market had no communication and external control capabilities necessary to fit in a S-MG EMS. We are working now on a solution able to allow the use of the 1.7 kW inverter from
Figure 1 together with the 3 of 0.6 kW WTs. The inverter datasheets indicate that it is perfectly suited to our purpose. For example, the inverter accepts an 1.85 kW DC input, has a software programmable polynomial curve which allows optimal adjustment to the turbine characteristic curve and an efficiency of 93.5%. Using the WT inverter integrated display and different communication interfaces such as RS485 and Bluetooth, it is possible to monitor all plant values at any time with the MGC.
A general conclusion arising from our study, regarding the power electronics involved in small wind energy conversion, is that while there are a lot of WTs available on the market, the power electronic inverters with communication and distance control properties making them integrable in a grid, residential S-MG in our case, are scarce.
Another conclusion is that there is room for many improvements in the design of small WT inverters and marketable solutions such as the possibility to create inverters with multiple controllable entries, external control and the use of SiC devices to increase the efficiency, even at partial powers, such as in the case of PV inverters. More about our WT solution design can be found in [
23].
4. Storage System Design
To solve the problems related to the inherent variability of the RES, storage is necessary. The storage system, controlled by the EMS, will charge the battery during RES production and when the forecast is predicting an economic profitability of the stored electricity. The battery will be discharged during EV charging or when the residence loads will ask for a cheaper energy than those from the grid. It is well known that the price for importing electricity is significantly higher than that for exporting, (RON 0.78 for importing and RON 0.22 for exporting to the network in Romania). Additionally, the electricity price will increase in the next decade in the EU as Frans Timmermans, the executive vice-president of the European Commission, mentioned in a press release referring to the EU Green Deal law package [
25], which will boost the interest in increasing self-RE generation.
As the battery system still represents the most expensive component of such S-MGs, establishing the battery capacity is of major importance. Considering this, a 48 V Li-ion stationary battery based on LiFePO4 technology was integrated in the S-MG by a 6 kW bidirectional converter, providing a storage capacity of around 20 kWh. Li-ion battery was chosen for its high efficiency of a charge–discharge cycle, 95% for our battery, according to the datasheets. LiFePO4 technology was chosen for its suitability for stationary storage, with a high number of charge–discharge cycles and a possible increased number of partial cycles allowing in this case around 20 years of use for cycles using 60% DoD (Depth Of Discharge) [
26], in the range of 90% to 30% SoC (State of Charge).
A methodology aiming to offer the possibility to realize a good compromise between battery life expectancy, price and DoD, developed during our RETRACT project, is presented in [
27]. It seems that our established battery capacity is quite reasonable, since other recent publications are presenting RES storage solutions with the same capacity value for residential MGs [
9].
The S-MG can work either (a) connected to the single-phase grid or (b) islanded in the case of a grid failure. In the grid-connected mode, the power flow through the Point of Common Coupling (PCC) is measured by a smart meter and it can run in either directions, importing or exporting electricity. The switch between the two states is carried out automatically by the battery bidirectional converter, acting as an inverter whenever an outage affects the grid. In islanded mode, first ensured is the critical supply of the residential consumer, with the electricity coming from the local RES and the energy storage system.
The charging and discharging processes are supervised by the Battery Management Unit (BMU), which provides information about the battery operation to the bidirectional converter by means of a CAN communication bus, which is communicating with the MG Controller using a RS485 interface, as
Figure 1 shows.
Through the MG Central Controller (MGCC—MG Controller in
Figure 1), an energy management system (EMS) runs an optimization algorithm especially designed for this kind of application. The EMS decides the energy balance within the S-MG and the power exchange with the grid, using the data collected from the system (available RESs, available power, battery state of charge, battery wear cost, residential consumption profile) and from outside by means of various web services: weather forecast and energy price for the next 24 h; booking of the EV charging station coming from customers through a web application and eventually, in a Smart City, EV charging status and EV charging profile. In fact, the optimization algorithm, working with a time horizon of 24 h ahead using the data mentioned above, is managed by the EMS. Battery wear cost comes with an important economic weight as the battery is the most expensive component, while its lifetime can be relatively short and strongly influenced by the operating conditions, so the costs of its use can bear a considerable significance in the cost of energy produced by the S-MG as a CS. A proper optimization algorithm can establish the economic viability of the S-MG as CS.
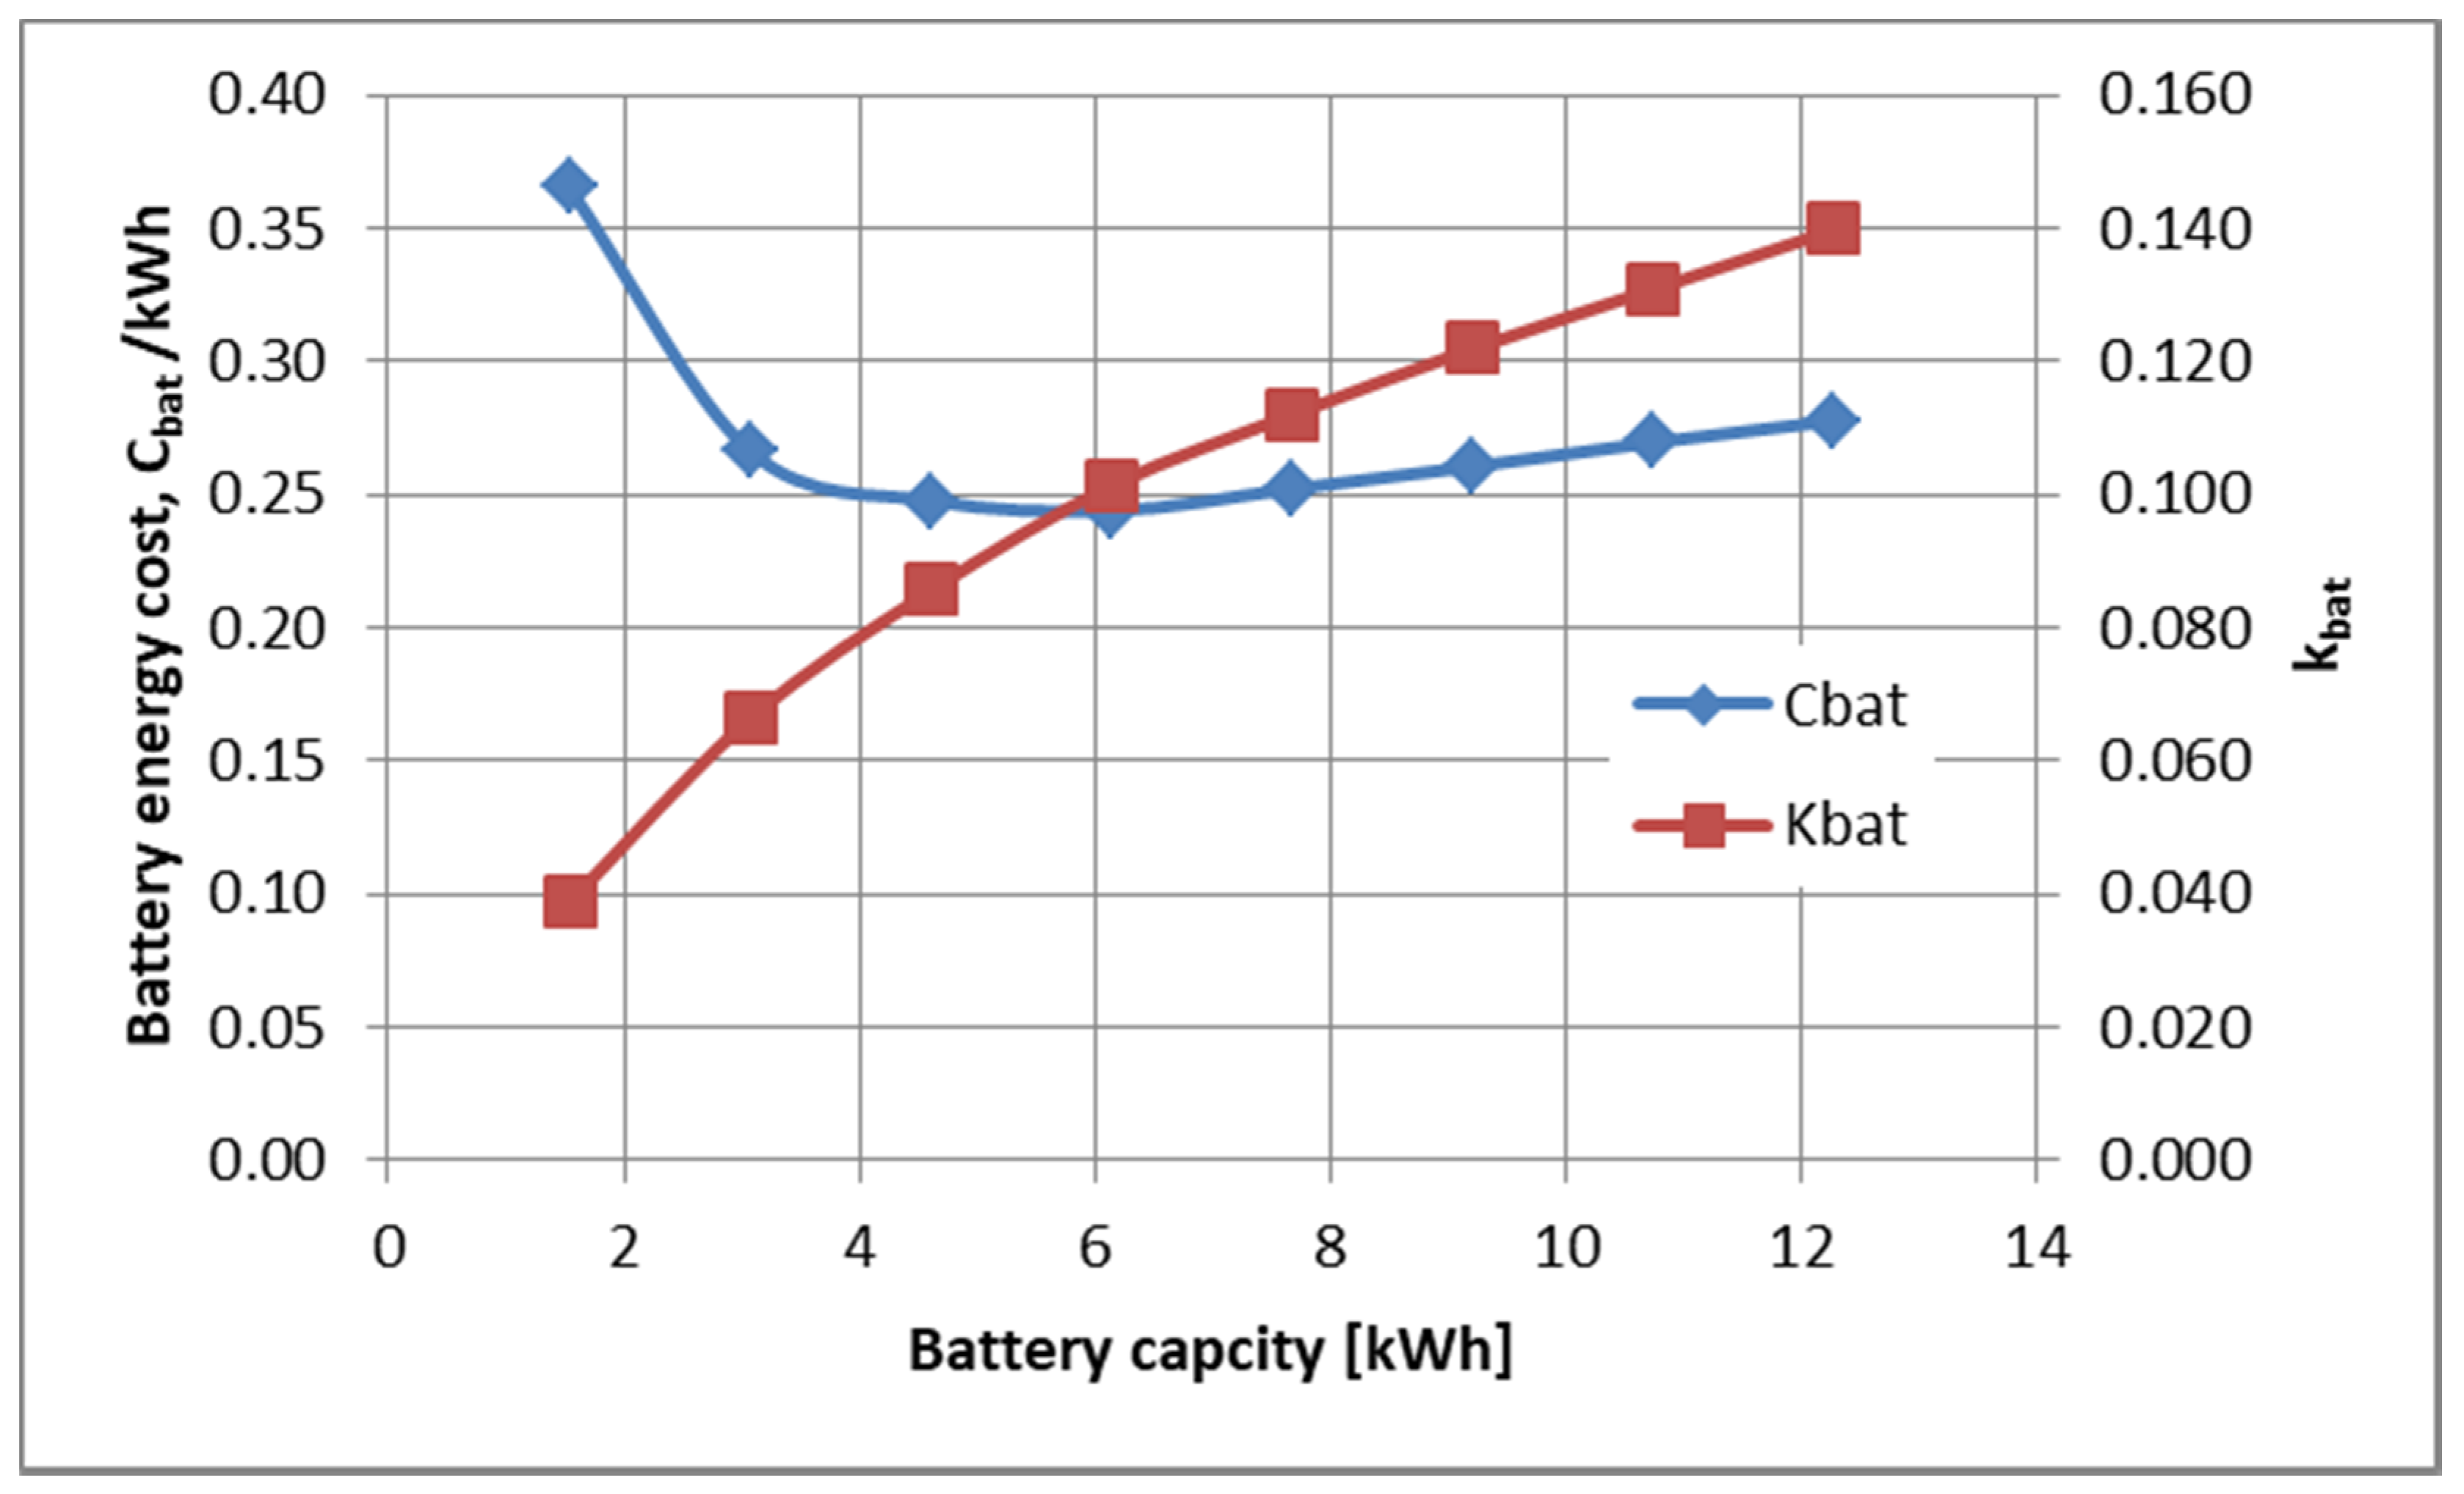
By introducing economic criteria in the adequate sizing design of the battery capacity and its use, we produced the following diagrams, plotted in
Figure 8.
In
Figure 8 C
bat is the battery cost for a delivered kWh energy and K
bat is the battery use coefficient. The battery cost was computed according to the equations from [
28]. The ratio to the energy was established taking into account the price of the energy offered by each RES (including also the one from grid, if necessary) and the one of extracted from the battery on the bases of 6-month, hourly forecasts with electricity produced 24 h in advance (or import from the grid) and on the other hand the EV and residential loads consumption. The battery use coefficient K
bat was computed on the same basis.
It can be seen in
Figure 8 that there is a minimal energy cost for around 6 kWh battery capacity value, and then there is a slight increase for values above 6 kWh. Meanwhile the use of capacity is more involved for increasing capacity values.
Different battery sizing and use strategies can be drawn from
Figure 8.
More details about how the EMS, MGCC and the forecast work in the presented S-MG can be seen in [
29].
In regard to the power electronics device associated, the bidirectional converter acting as a battery charger or inverter, the maximum power found for a single-phase converter on the market was of 6 kW. It would be of interest for countries where the grid allows higher phase unbalance to have converters of higher power available. A reasonable value, around 8 kW, would allow a valuable use of RES, solar and wind combined or to import electricity from the grid during night and on the other hand will reduce the EVs charging time (as it is shown in the next section), without endangering the battery life. The EMS could control and limit the charging-discharging current values, if they can affect the EV or CS battery life.
5. Some Experimental Results
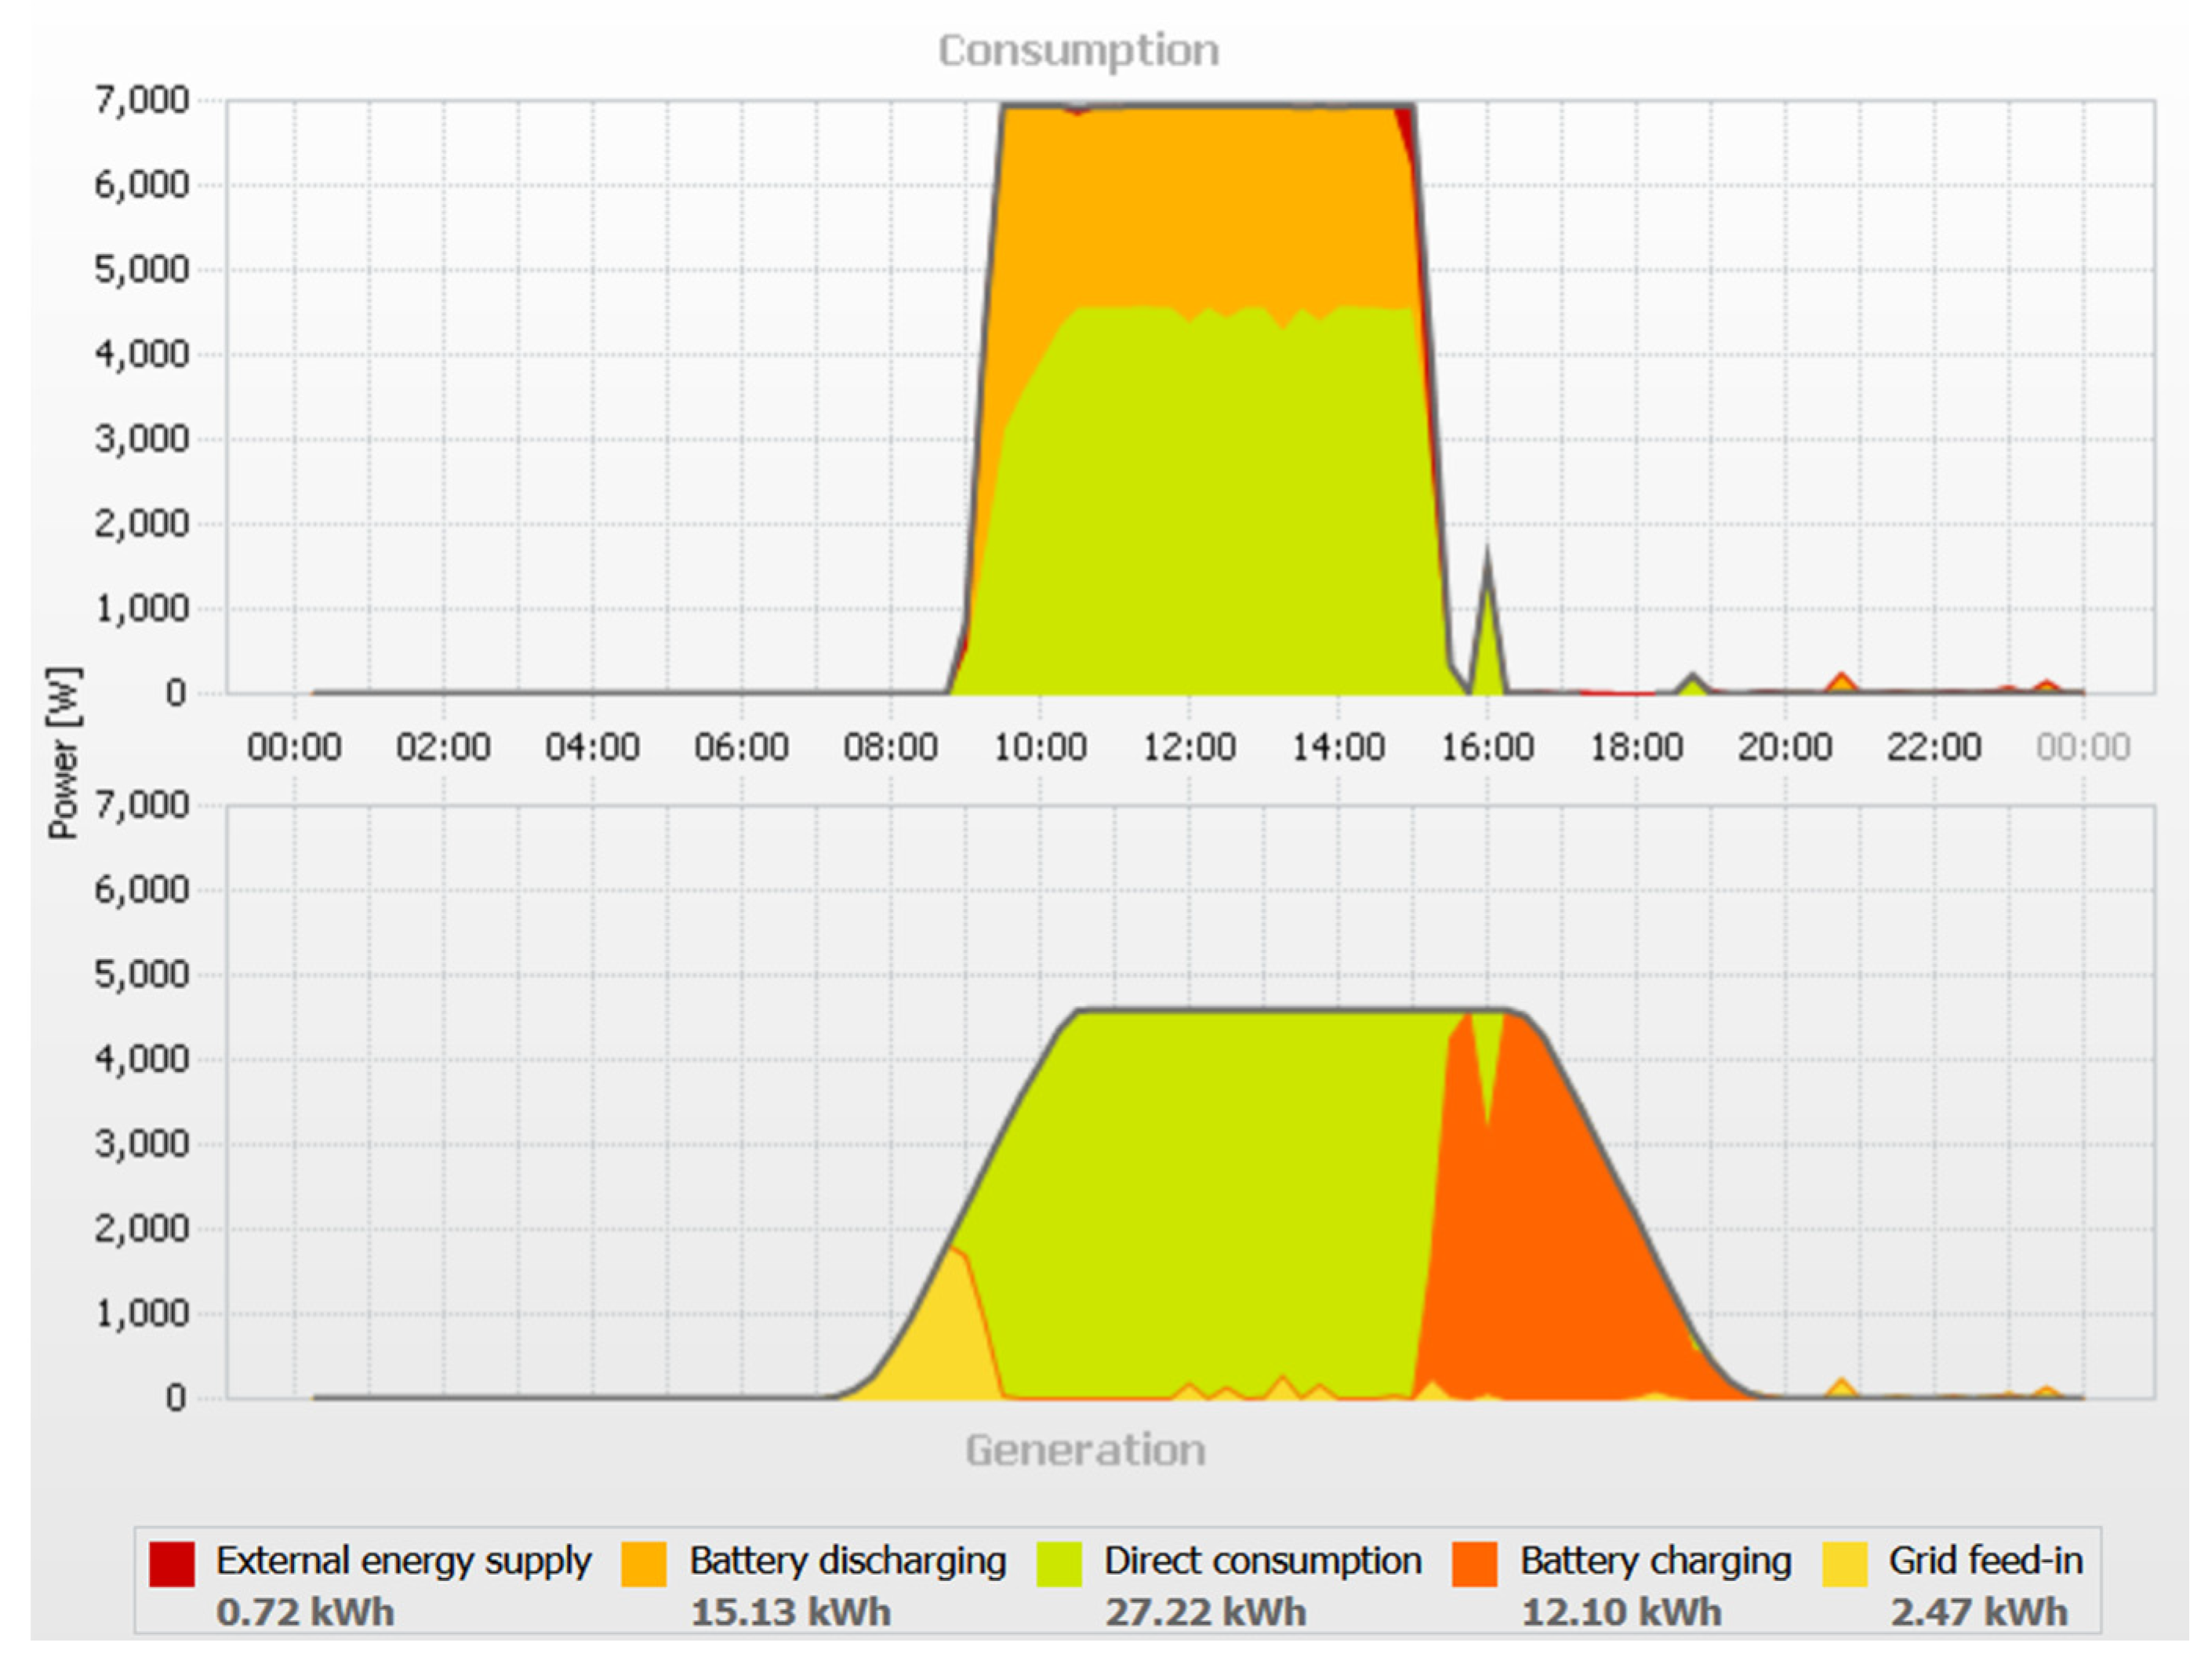
The experiments and later use of the developed Residential Smart MG with Charging Station proved the validity of the design. Moreover, a new property was highlighted as can be seen in
Figure 9.
Following the diagrams from
Figure 9 one can see that the CS is able to supply an EV at a 7 kW power, answering to the definition of a Mode 2 EV charger stipulated by IEC 62,196 standards. As the RES inverters power outputs are blocked to 4.6 kW by the grid rules, the existence of the battery storage system with an adequately sized electronic converter allows to feed with electricity an EV at 7 kW power (without affecting the grid). Thus, the EV charging time is reduced by 49% in comparison with the time required by charging from a CS supplied directly from the grid or by the RES inverters.
6. Conclusions
The paper presents the design considerations and methodologies for developing a Residential Smart MG with EV Charging Station capabilities using RES.
The presented solution is able to rapidly respond to the needs of EV charging, expected to explode in the coming years, with equipment that is currently available.
The proposed solution is also able to reduce the stress of the actual electricity grid in the case of about 11% overcharge occurrence if the necessary power to charge the EVs replacing the internal combustion based cars would be drawn from the grid.
By using mostly RES, the proposed solution avoids the use of the corresponding energy based on fossil fuels offered by the grid.
Introducing the Energy Storage system in the S-MG, the EV charging time is reduced by 49% in comparison with the time required by charging from a CS supplied directly from the grid or by the RES inverters.
By introducing network communication facilities between the S-MG components and with the outer world, the presented design solution can be easily integrated in the communication network of a Smart City answering to Directive (EU) 2018/844, even if this aspect is out of the scope of this paper.
The possible improvements of the existing power electronics related to the solution are mentioned and commented at each equipment level.


