1. Introduction
Strong earthquake observation plays an irreplaceable role in the seismic fortification of Nuclear Power Plants(NPPs), high-speed railways and other major engineering projects. At present, almost all NPPs globally are equipped with seismic instrumentation systems. The functions of seismic instrumentation in NPPs are as follows [
1]: (i) structural monitoring: collecting data on the dynamic characteristics of structures, systems and components of NPPs to evaluate the applicability of the analysis methods used in the seismic design and appraisal of buildings and equipment; (ii) earthquake monitoring: providing an alarm to remind operators to carry out post-earthquake inspection and decide to shut down; (iii) automatic seismic trip system(ASTS), which can provide a triggering mechanism for ASTS of NPPs.
For nuclear safety guidelines and national standards [
1,
2,
3,
4,
5,
6], only the number, location and alarm index of seismic instruments in NPPs are required in principle. However, the alarm parameters, alarm threshold and ASTS function are not specified. Threshold alarm and manual shutdown, based on peak ground acceleration (PGA), are applied to the second generation NPPs in operation in China, while ASTS is based on the PGA for the third generation NPPs under construction. From the perspective of ground motion characteristics, an isolated and prominent single high-frequency acceleration peak generally has no decisive effect on seismic response, especially in the existing 1 out of 7 seismic monitoring alarm logic, which is likely to cause a false alarm. However, it usually takes one month or even longer to restart the reactor after shutdown, which has an impact on the stable operation of the NPPs [
7].
If the seismic instrumentation system is required to alarm accurately, then the alarm parameters have to fully reflect the destructive force of the ground motion. The three elements of ground motion are intensity, frequency spectrum and duration [
8]. The influence of ground motion characteristics on the response of NPPs not only refers to the peak ground acceleration, but also includes frequency spectrum and duration. Therefore, it is not appropriate to use only the PGA. Even though the PGA exceeds the Operating Basis Earthquake (OBE), if the frequency of the wave is over 17 Hz it does not cause serious damage to the NPPs [
9]. The Electric Power Research Institute (EPRI) proposed the concept of cumulative absolute velocity(CAV) [
10]. Meanwhile, the potential damage threshold of CAV is set as
[
11,
12]. Therefore, from the view of both theory and practice, the intensity, frequency spectrum and duration of ground motion should be considered when selecting seismic alarm parameters.
In this paper, the three elements of ground motion are fully considered. On the basis of the original seismic instrument, several parameters, such as three components resultant acceleration, seismic instrument intensity, cumulative absolute velocity and floor response spectrum, are proposed. At the same time, the system launches different functions in different intensity areas: at high intensity sites (local intensity is greater than or equal to 7 degrees), the ASTS function is turned on; when two out of four three components synthetic accelerations in the free field exceed the shutdown threshold, the ASTS function is directly triggered; at low intensity areas (local intensity is less than 7 degrees), the ASTS function is turned off. When various parameters exceed the threshold, the manual shutdown alarm is actuated.
This paper presents an improved seismic instrumentation system for NPPs, which addresses the problem that the peak value of seismic acceleration fails to accurately reflect the destructive force of ground motion, and thus greatly reduces unnecessary shutdown without damage to structures, systems and components (SSCs), and improves the safe and stable operation ability of NPPs in an earthquake.
2. Problems of Existing Seismic Instrumentation Systems
2.1. Existing Manual Shutdown Alarm Settings
At the end of 2020, there were 49 operating units (excluding Taiwan), mainly M310 and M310 improved units in China. Its seismic instrumentation system is mainly the French RFS I.3.b standard [
6], and ASTS function is not set. Generally, the seismic instrumentation system is equipped with seven triaxial accelerators and four tri-axis peak acceleration recorders, which are respectively installed on the free field, reactor building raft foundation, reactor building, reactor building maintenance platform, raft foundation of reactor building, raft foundation of auxiliary building, auxiliary building and reactor building. Taking a NPP Units 5 and 6 as an example, the layout of seismic instruments for earthquake alarm is listed in
Table 1.
The OBE alarm is triggered by seven triaxial accelerometers. When the detected seismic acceleration of any one of the accelerometers exceeds 0.1 g (the value of OBE of a NPP Units 5 and 6 is 0.1 g), the OBE alarm is triggered. The Safety Shutdown Earthquake (SSE) alarm is triggered by seven triaxial accelerometers. When the detected seismic acceleration of any one of these exceeds 0.2 g, the SSE alarm is triggered. When an earthquake occurs, the maximum acceleration on each axis of each accelerometer is compared with 0.1 g. If the measured maximum acceleration exceeds 0.1 g, the logic of 1 out of 7 is adopted, and consideration is given to stopping the NPP, according to the situation.
2.2. Existing ASTS Alarm Related Settings
The third generation NPP is equipped with ASTS in China, which adopts the peak ground acceleration method, and its earthquake triggering function is generally as follows: (i) when the accelerometer in the free field detects that the earthquake reaches the OBE, the OBE alarm is generated in the main control room; (ii) when the ground motion recorded by four accelerometers on the containment foundation exceeds the threshold value (1/2 SSE), an ASTS trigger signal is generated, seismic instruments of ASTS of a NPP are listed in
Table 2.
2.3. Three Current Issues
2.3.1. Strong Randomness of Single Peak Acceleration
From the above actual situation, both the manual shutdown system of the second generation NPPs in operation and the ASTS of the third generation NPPs under construction adopt the parameters of PGA. However, from the perspective of seismic acceleration characteristics, an isolated and prominent single high-frequency acceleration peak generally has no decisive effect on seismic responses. Especially for a seismic instrument alarm of 1 out of 7, false alarm is highly likely.
2.3.2. Time to Restart Caused by Unnecessary Shutdown
With Kariwa NPP, in Japan in 2007, the seismic response spectra exceeded SSE-based, but no damage was observed to SSCs. It took 22–40 months for seven units to restart [
7]. With North Anna NPP, in 2011, the base mat response spectrum exceeded SSE above and below 10 Hz, but no damage was observed to SSCs. However, it took 2–3 months for two units to restart [
7].
2.3.3. No ASTS in High Intensity Areas
In some countries, especially in strong earthquake areas, ASTS is set up. In 2007, a magnitude 6.8 earthquake occurred in Niigata, Japan. The earthquake triggered four unit shutdowns on automatic operation [
13]. After Fukushima accident, nuclear safety regulators in South Korea and other countries or regions all require the establishment of ASTS. As seen in
Table 3, Japan mandates ASTS via the Ministry of International Trade and Industry (MITI) Order No. 62 [
14]. Before the Niigata Chuetsu-oki earthquake in 2007, MITI recommended 0.9S1, where S1 is the maximum earthquake measured as the trip setpoint, referring to the JEAG (Japan Electric Association Guideline) 4601 criteria [
15]. However, the NSC (Nuclear Safety Commission) has changed the trip setpoint, incorporating the lessons learned from the Niigata earthquake. The revised setpoint is set at 120 gal.
The southeast coast of China is a region with frequent earthquake occurrence of high intensity, among which Fujian Province shows the largest distribution of earthquakes, as shown in
Figure 1. The NPPs operating in Fujian Province include Ningde NPP Units 1, 2, 3 and 4, and Fuqing NPP Units 1, 2, 3 and 4. However, no ASTS is set.
In view of the above problems in China, this paper proposes an improved seismic instrumentation system based on the existing seismic instruments, including earthquake monitoring alarm function and the ASTS alarm.
3. Improved Seismic Instrumentation System
3.1. System Parameters
The main parameters of the improved seismic instrumentation system proposed in this paper include three components resultant acceleration (), seismic instrument intensity (SII), cumulative absolute velocity (CAV), floor response spectrum (FRS), etc. Among these, , SII and CAV can give information exceeding the OBE threshold, and FRS can give information on the dynamic characteristics of structures, systems and components (SSCs).
3.1.1. Three Components Resultant Acceleration
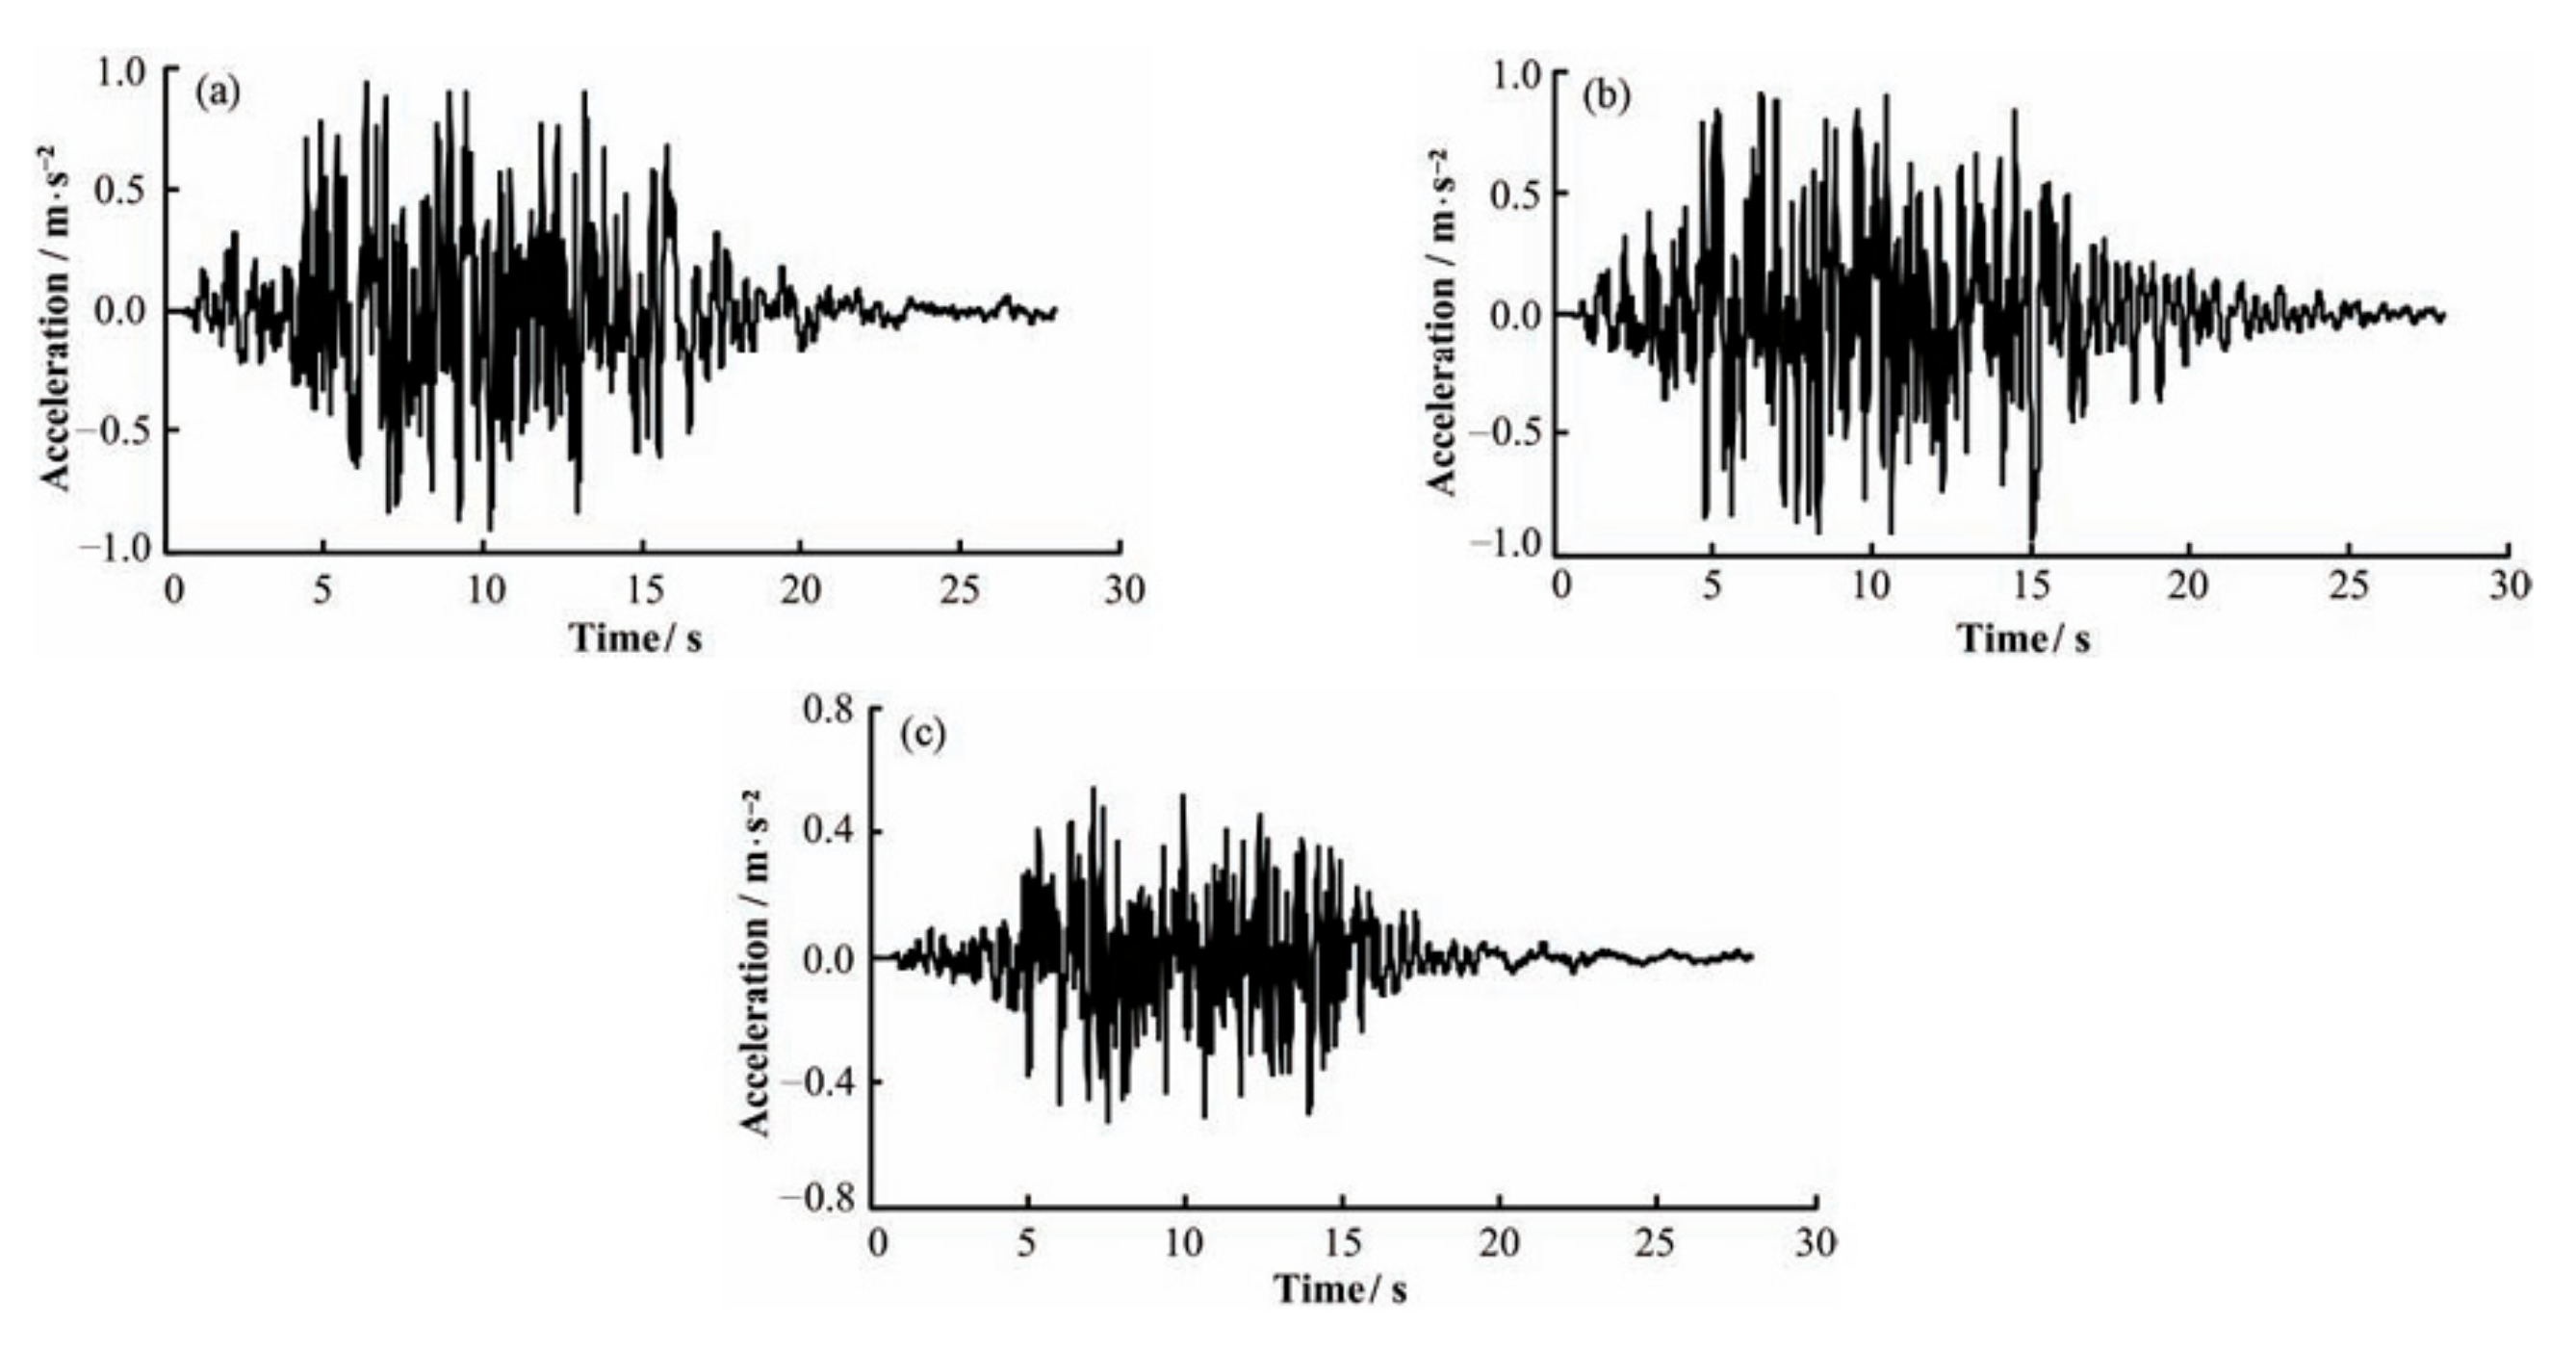
The three elements of ground motion include intensity, frequency spectrum and duration. The time history curve of ground motion is shown in
Figure 2. Therefore, in order to select the seismic parameters related to structural damage, we should not only consider earthquake acceleration peak, but also the selection of seismic frequency band. In this paper, a new method is proposed. Firstly, the time history of ground motion is filtered to filter out high-frequency small earthquakes which are not destructive. Then, three-dimensional fitting is carried out, and the appropriate duration is selected. Finally, the stable acceleration alarm threshold is obtained.
With regard to the filtering frequency band, the joint meeting of the International Atomic Energy Agency [
17] concluded that high frequency acceleration will not cause damage to the SSCs. Therefore, they decided to use acceleration amplitudes of between 2–8 Hz to exceed the OBE. According to the EPRI report [
18], the peak spectral acceleration (average value between 2 Hz and 10 Hz) is a reasonable and consistent damage threshold. Therefore, we can conclude that a frequency acceleration above 10 Hz will not cause damage to safety related SSCs. Therefore, we choose the filtering frequency band of 0.5–10 Hz.
In order to make acceleration more stable, three-dimensional fitting is carried out, and the appropriate duration is selected. Finally, the stable acceleration alarm threshold is obtained. An earthquake record in Kik-NET [
19] is taken as an example. Firstly, the time history is filtered respectively. The calculation step is as follows:
Turn to by Fourier transform.
Turn
to
by filtering.
Here, (
) is the amplitude modulation filter, (
) is a low pass filter, (
) is a High pass filter,
where
,
,
,
is the frequency of seismic wave
Turn
to
by Fourier anti-transform, then three parts of
are combined into vector acceleration
Take the acceleration with holding time greater than or equal to 0.3 s on the full vibration time history, i.e.,
, as shown in
Figure 3.
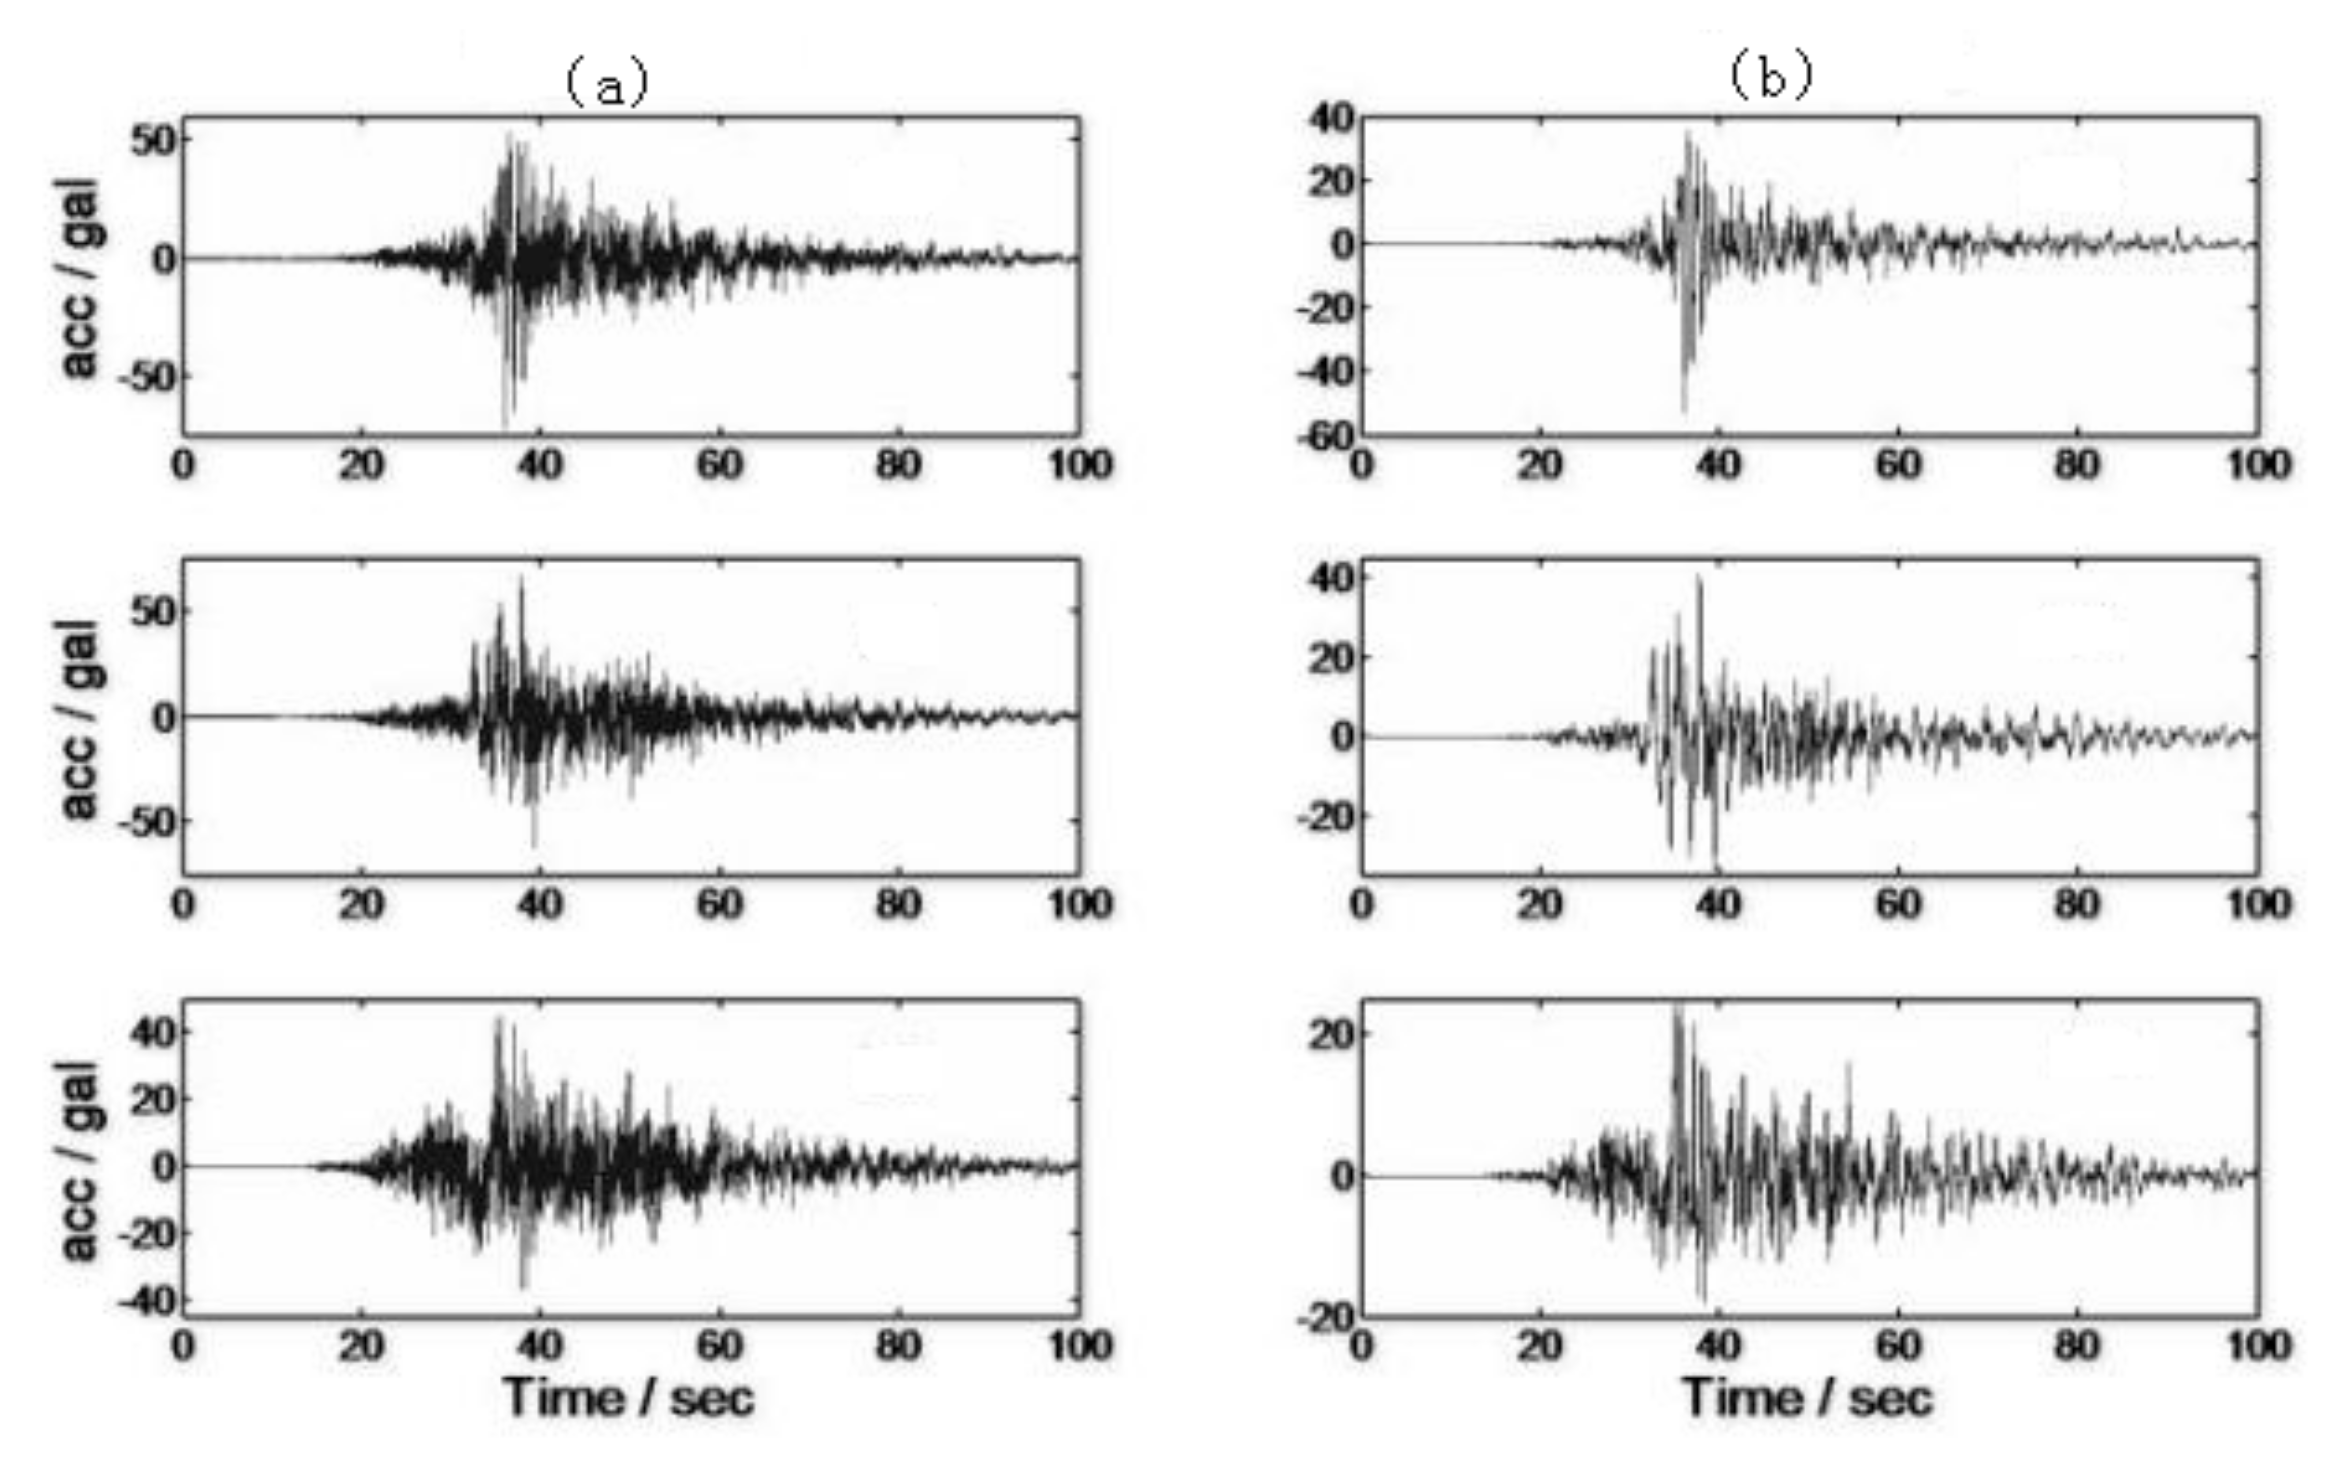
The comparison diagram before and after the three-way acceleration time history filtering is shown in
Figure 4.
Figure 5. shows the filtered three-way time history and the resultant vector acceleration. At this time, the acceleration values are all positive. Finally, the alarm value for three-way synthetic acceleration is obtained.
3.1.2. Cumulative Absolute Velocity
CAV is obtained by integrating the absolute value of ground motion acceleration over 0.025 g in the acceleration time histories of free field, with a time interval of one second. This concept was proposed by EPRI in its Research Report (NP-5930) in 1988 [
11]. The results show that CAV is the best parameter to determine the seismic damage threshold. Then, in the Research Report (TR-100082), the calculation method of the CAV value for a given free field acceleration time history record [
10] was further revised.
Generally speaking, CAV is a function of the duration of ground motion, and the cumulative value of CAV is expressed by the following formula:
where
is the acceleration time history,
.
when
,
, when
; the above formula segments the time history of ground motion in one second, and integrates and accumulates the ground motion of one second. The unit of CAV value is expressed in
. The research results of the Electric Power Research Institute (1988) [
11] show that NPPs and other important industrial facilities can withstand the ground motion corresponding to intensity VIII, which only causes slight damage to the building structure, such as small cracks in concrete and bending of boiler frame supports, and its operation unit can still play its full function after the earthquake. Because the NPP has been subjected to ground motion, it still maintains its functional integrity under the condition of degree VIII. Therefore, the selected CAV failure threshold corresponding to the MMI value of degree VII can be used as a conservative estimate of failure threshold. In view of this, EPRITR-100082 selects the minimum value of a relatively conservative CAV, corresponding to the VII degree value, as
for the determined CAV threshold. This value is used as the screening value of whether the NPPs can operate normally after an earthquake (Electric Power Research Corporation, 1991) [
10], that is to say, for well-designed facilities such as NPPs, the damage may occur only when the CAV value caused by the earthquake is greater than
, and this value can be used as the lower limit of the CAV to determine the potential damage caused by the earthquake.
3.1.3. Seismic Instrument Intensity
Seismic intensity is an important parameter in measuring the size and influence of an earthquake. With the continuous development of seismic observation technology and the increasing number of seismic observation instruments, it is possible to quickly and quantitatively calculate instrument seismic intensity according to the ground motion records obtained by seismic observation instruments. The calculation of instrument intensity is on the basis of rapid reporting of seismic intensity, which can provide a scientific basis for quick judgment, earthquake emergency rescue decisions and action.
The instrument intensity in the American ShakeMap system [
20] comprehensively considers two parameters: amplitude and frequency spectrum. Peak Ground Acceleration (PGA) is used to calculate the instrument intensity when the intensity is low, Peak Ground Velocity (PGV) when the intensity is high, and PGA and PGV together when the intensity is between V and VII. Different intensity levels are calculated with different amplitudes, mainly considering the influence of frequency spectrum. The instrument intensity calculation formula is as follows:
The ShakeMap system calculates the seismic instrument intensity value according to the above formula, and the seismic instrument intensity is shown in
Table 4.
In March 2015, the China Earthquake Administration also issued the “Interim specification for calculation of instrumental seismic intensity” [
22]. This method is adopted in the calculation of instrumental seismic intensity in this paper.
3.1.4. Floor Response Spectrum
FRS reflects the relationship between the maximum response and the vibration frequency of the single degree of freedom system (the lumped mass stick model of the reactor building is shown in
Figure 6) [
23]. Without considering the coupling of the primary and secondary structures, seismic analysis of the substructure of the NPP is carried out. The response of the substructure can be obtained directly by its vibration characteristics of and the generated floor response spectrum. According to the calculation of the response spectrum of the single degree of freedom system, the corresponding integral expression of absolute acceleration under the zero initial condition was as follows:
In the formula,
and
are the damping ratio and natural frequency of single degree of freedom system, respectively. The response spectrum reflects the relationship between the maximum response and the natural vibration characteristics of the structure under a certain damping ratio
The response spectrum of floor acceleration is the curve of the relationship between and .
3.2. System Function Flow Chart
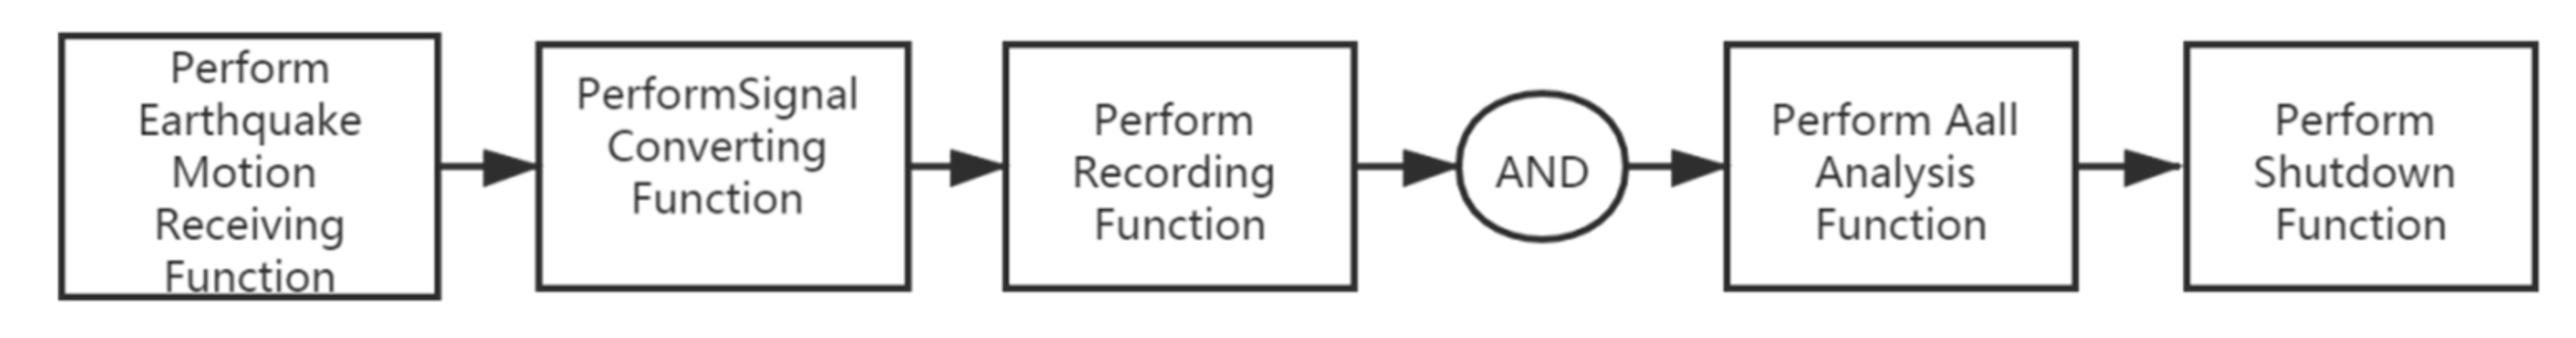
The function flow chart of the existing seismic instrumentation system is shown in
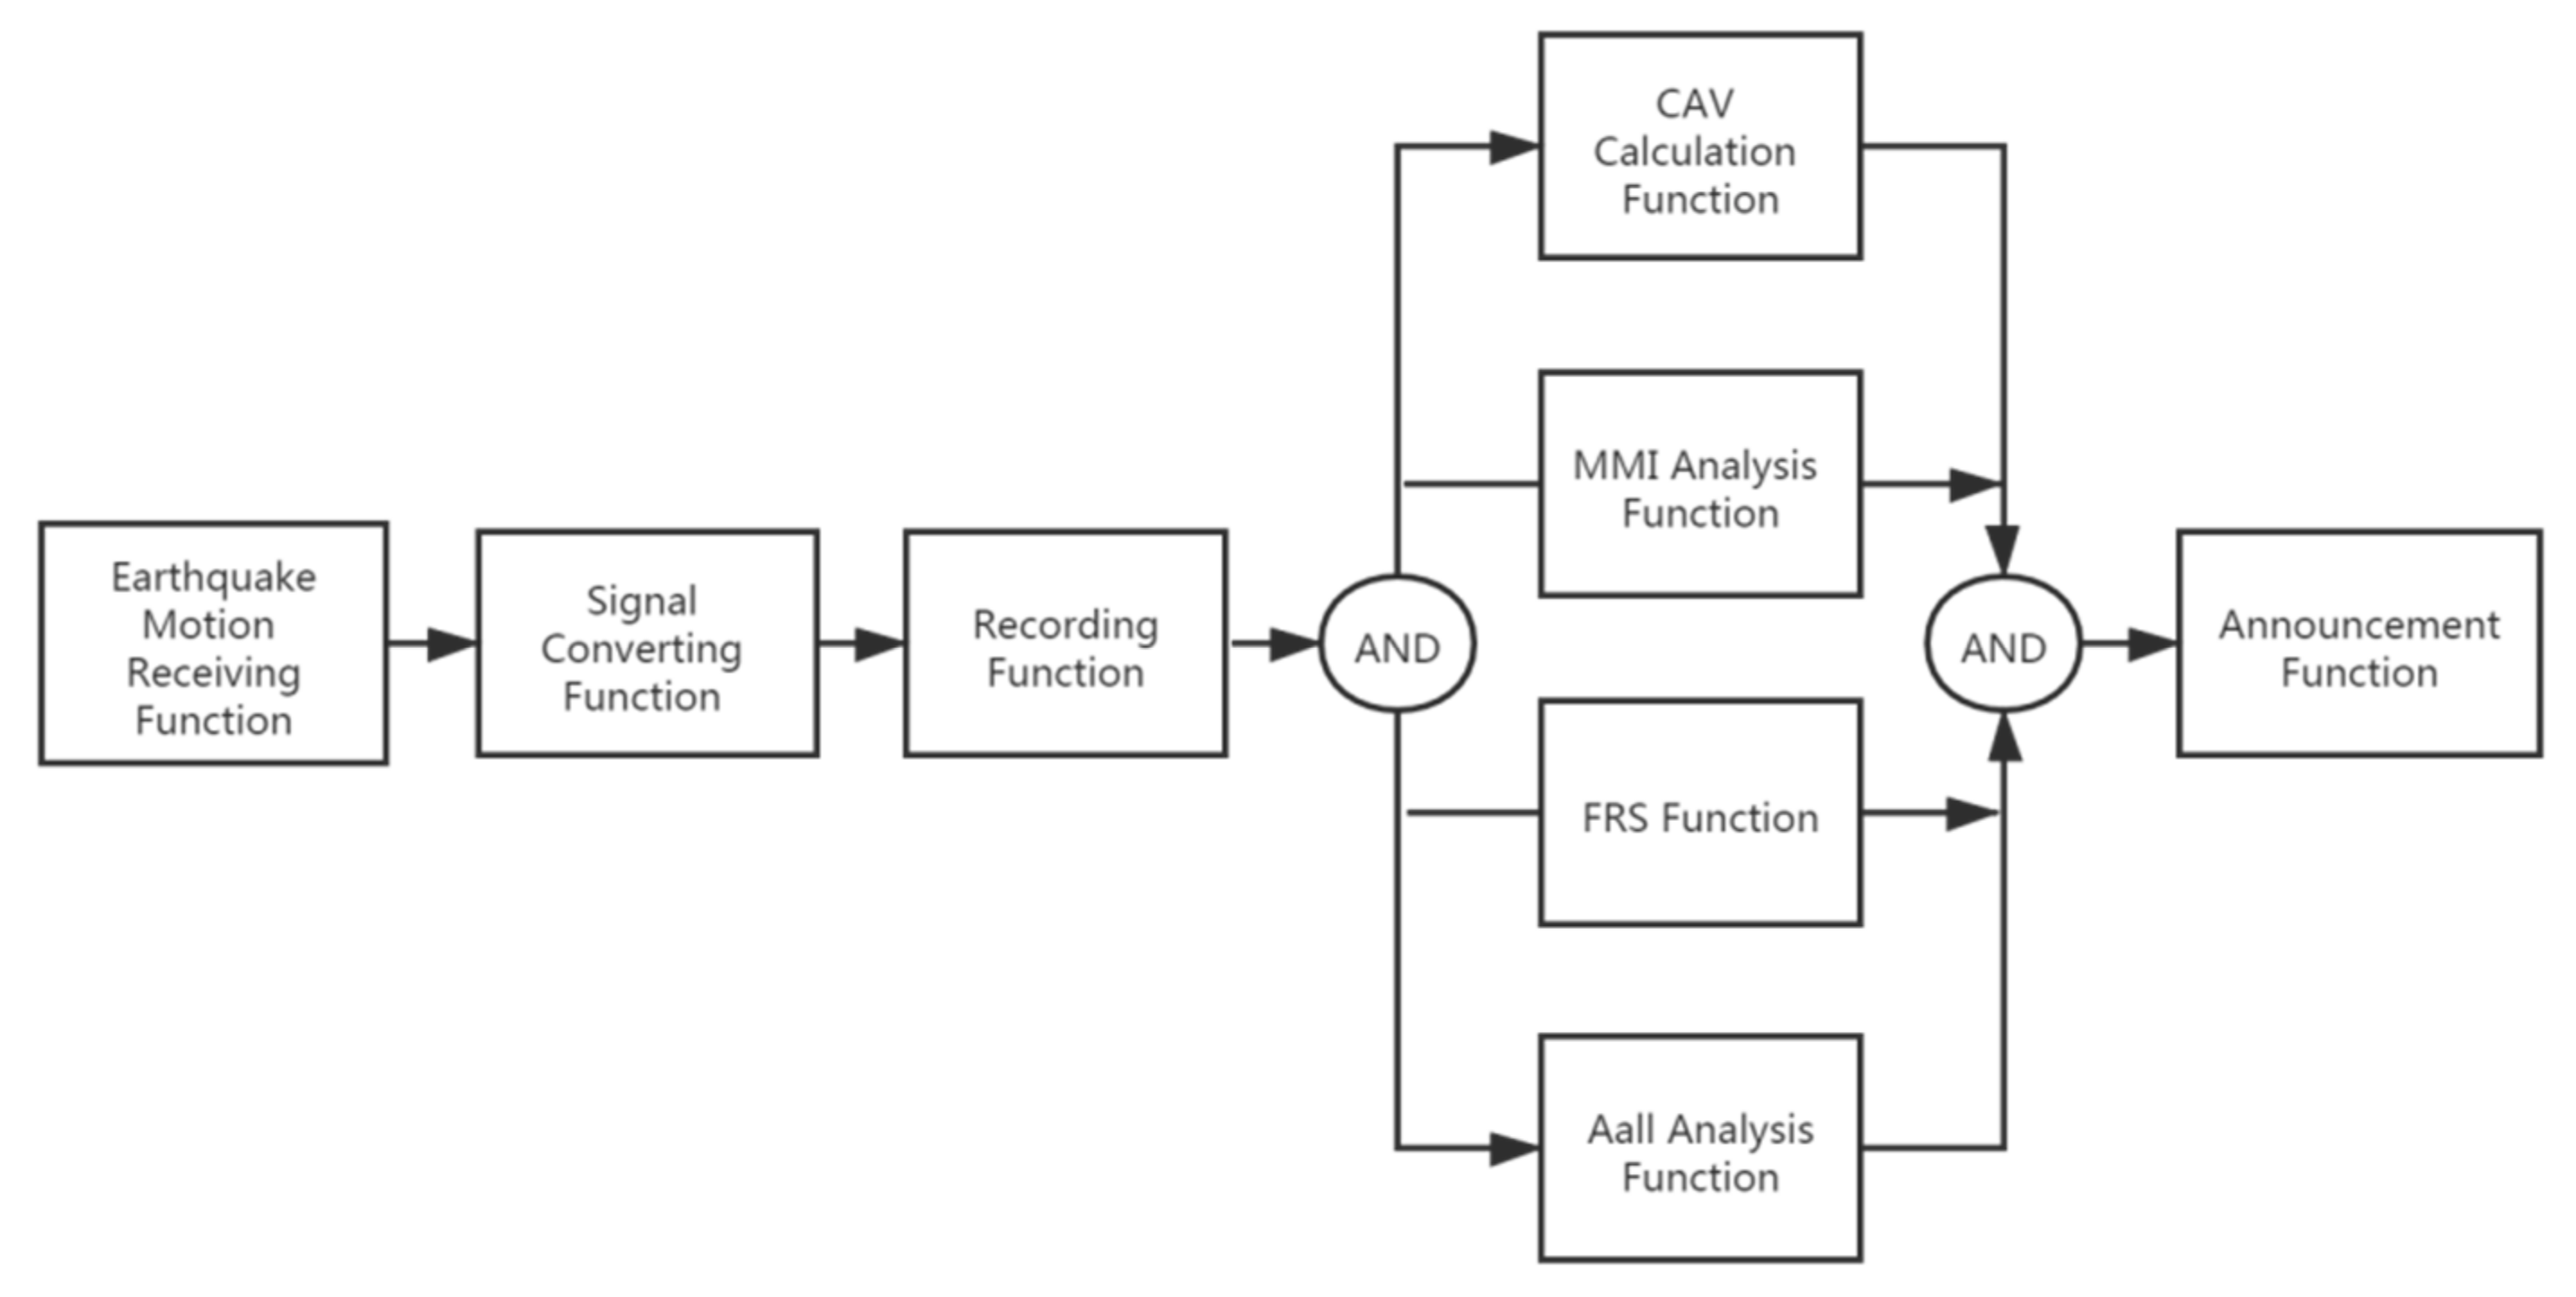
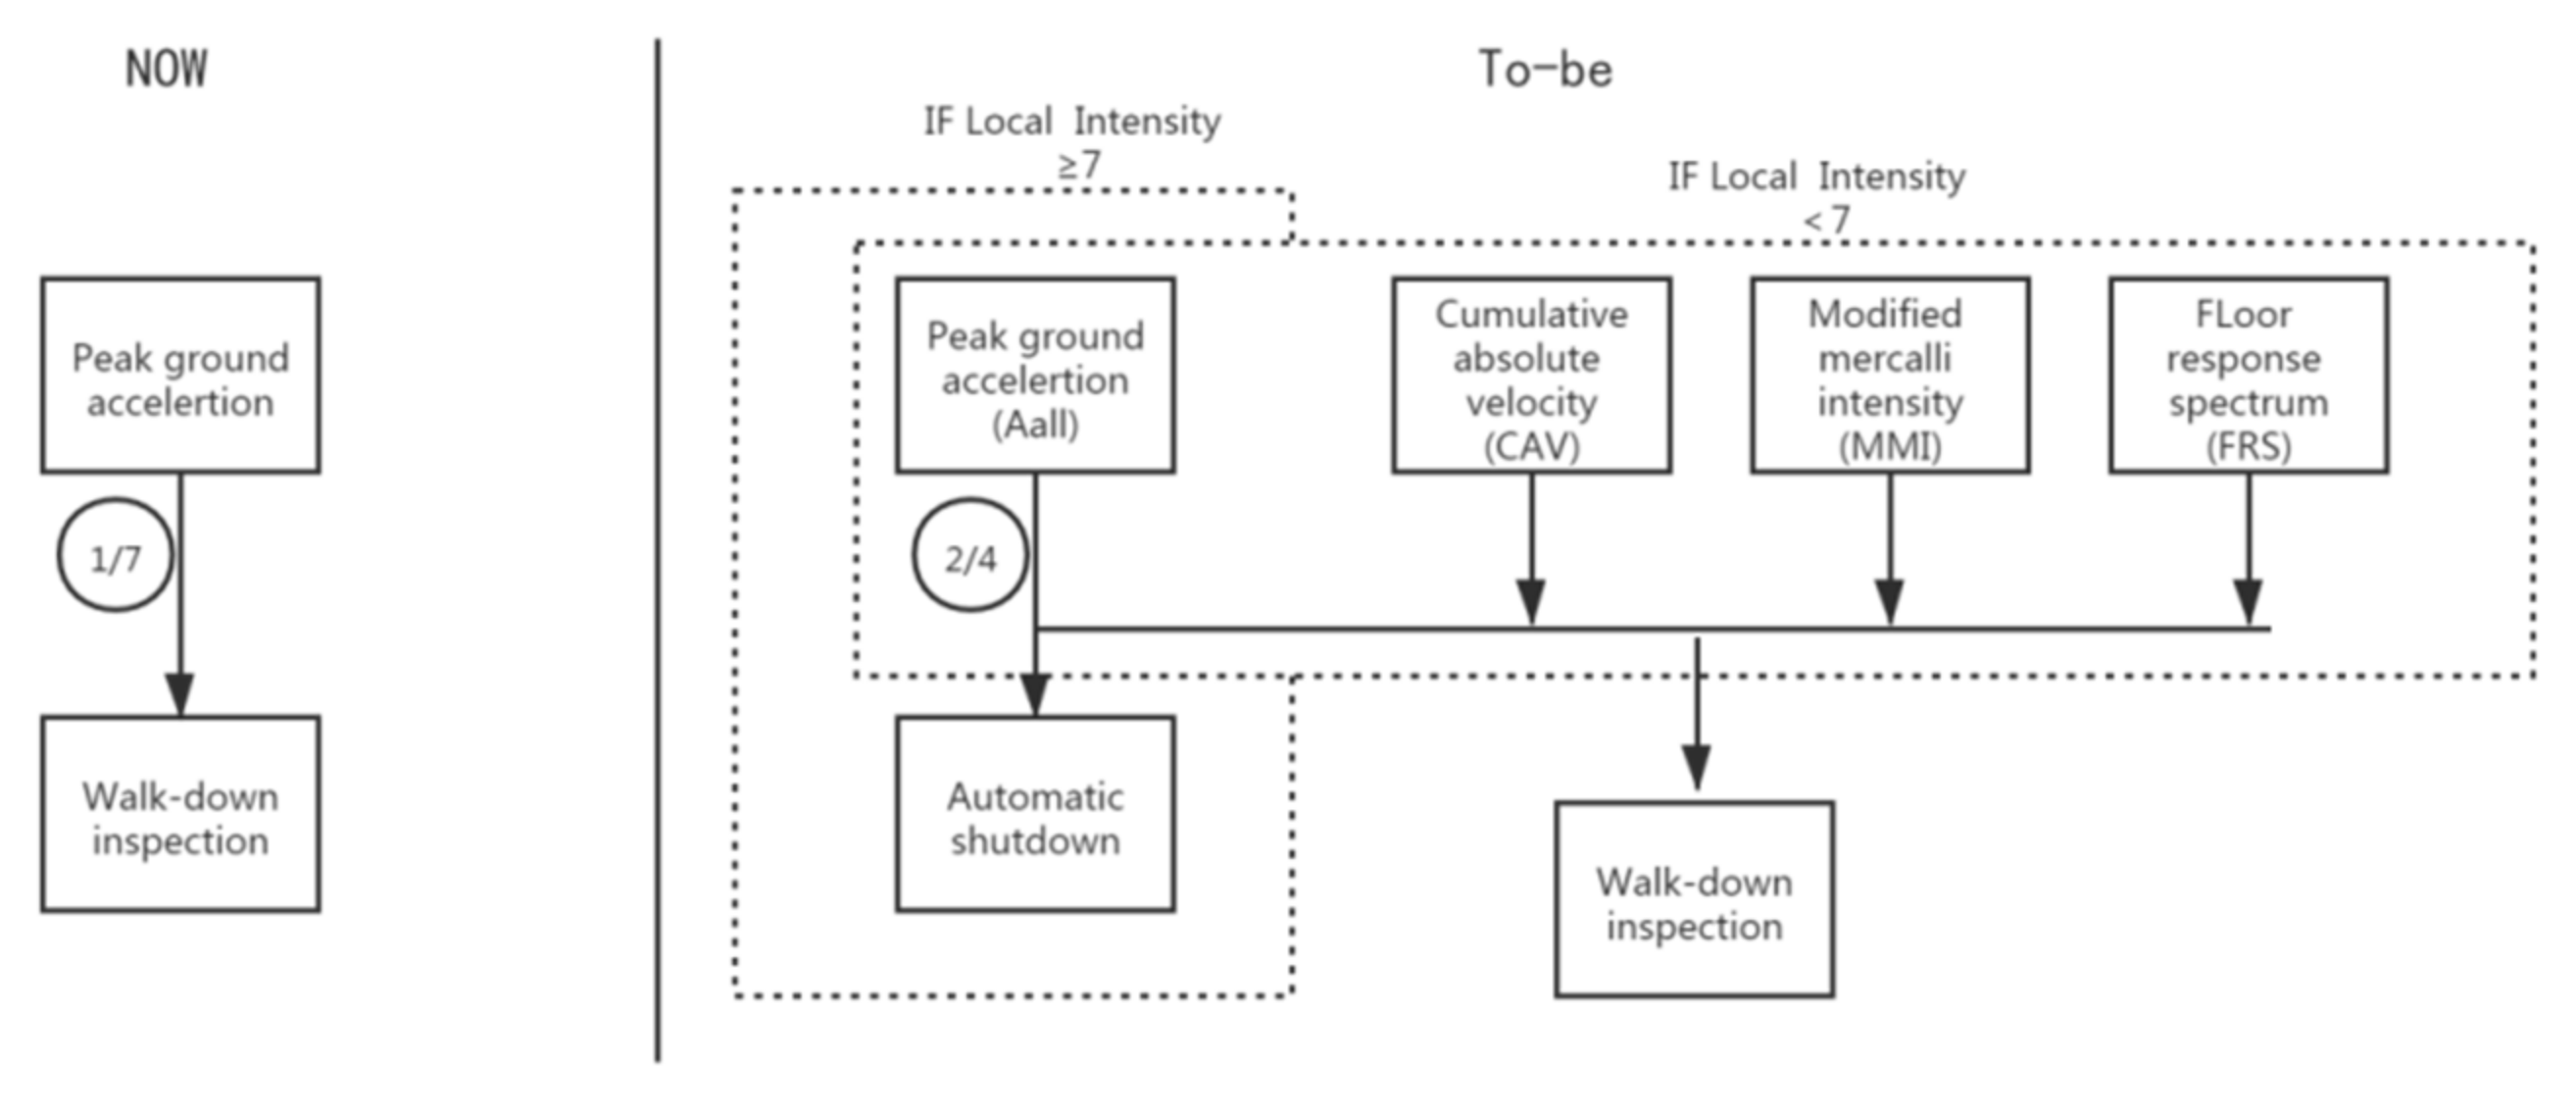
Figure 7, and the function flow chart of the improved seismic instrumentation system is shown in
Figure 8 and
Figure 9. The main difference between the improved seismic instrumentation system and the existing seismic instrumentation system is the addition of
, SII, CAV, FRS and other function modules. At the same time, different functions are set in different intensity areas.
For areas where intensity is greater than 7 degrees, the ASTS is enabled, the earthquake monitoring alarm function is closed, and is used for ASTS. For earthquakes with local intensity less than 7 degrees, the ASTS function is turned off and the earthquake monitoring alarm function is enabled. Parameters such as , SII, CAV and FRS are used to quickly evaluate the earthquake damage, avoiding unnecessary and long-term shutdown inspection.
The comparison between the newly proposed seismic instrument alarm system (multi-parameter method) and the original alarm system (peak acceleration method) is shown in
Figure 10. At the same time, the alarm logic is changed from the original 1 out of 7 seismic acceleration peak alarm (as shown in
Figure 11) to the 2 out of 4 three-way synthetic acceleration alarm (as shown in
Figure 12).
3.3. Seismic Instrument Layout
Taking a NPP Units 5 and 6 as an example, the sensor location of the seismic instrumentation system of the improved NPP (see
Table 5 for details) adds three triaxial accelerometers with three-way synthesis function in the free field, which are mainly used for the ASTS function in high intensity areas, and adds SII, CAV and FRS to the foundation. It is mainly used for its multi-parameter earthquake alarm function. The comparison between the improved seismic instrumentation system and the original system is shown in
Table 6.
4. Verification and Testing of the Proposed Method
After an earthquake, the China Earthquake Administration will organize a large number of professional and technical personnel to carry out a careful investigation of the earthquake intensity (referred to as ‘Macro-seismic Intensity’), and draw a detailed Macro-seismic Intensity distribution map. It should be noted that the Macro-seismic Intensity is not the same as the SII above, but the meaning is the same. In this paper, five earthquake records [
24] in China were collected from the the 2007 Ms6.4 Ning’er earthquake, and 24 groups of strong motion records were obtained. There are 13 groups of strong motion records from the 2008 Ms6.1 Panzhihua earthquake. The 2009 Ms6.0 Yao’an earthquake, and 21 groups of strong motion records were obtained. There are 11 groups of strong motion records from the 2008 Ms5.9 Yingjiang earthquake. There are seven groups of strong motion records and 76 groups of strong motion records from the 2008 Ms6.8 Xinjiang earthquake, as shown in
Table 7.
In order to assess the effectiveness of this method, it is mainly compared with the CAV . The reason why this parameter and threshold are adopted is that they are relatively recognized earthquake parameters which can better reflect the damage degree of the SSCs.
From the conclusion of the analysis (as shown in
Table 8), we can see that there are two and five groups of seismic records exceeding the threshold by using the peak acceleration method (the existing seismic instrumentation system) in the area of V and VI degrees, and there is no threshold exceeding this when using the multi-parameter method (the improved seismic instrumentation system). That is to say, the peak acceleration does not reflect any damage suffered by the SSCs. However, due to the prominent high-frequency acceleration spikes, some records have exceeded the threshold, which may lead to false alarms. The alarm situation in the area of degree VII and above is basically the same. In other words, for high intensity areas, the multi-parameter method and the peak acceleration method show little difference, but for low intensity areas the multi-parameter method is obviously better than the peak acceleration method. This means that the multi-parameter method can more accurately reflect the damage degree of the earthquake for the SSCs, and can avoid many false positives caused by low-level earthquakes.
5. Conclusions
PGA is widely used in the seismic instrumentation systems of the second generation NPPs on operation and the third generation NPPs under construction. However, given the characteristics of peak acceleration, an isolated and prominent single high-frequency acceleration spike is likely to cause false alarm or false shutdown, provoking long restart times.
In this study, the seismic instrumentation system of a NPP Units 5 and 6 is taken as the prototype, and , CAV, SII, FRS and other functional modules are added on the basis of the original seismic instruments. , CAV and SII can rapidly and precisely display information exceeding the threshold of OBE, and FRS can quickly and accurately give dynamic behavior information on the SSCs. At the same time, the system has different functions in different intensity areas: at the high intensity site (local intensity is greater than or equal to 7 degrees), the ASTS function is turned on. When two of four three-dimensional synthetic accelerations on the free field exceed the shutdown threshold, the ASTS function is directly triggered. At the low intensity sites (local intensity is less than 7 degrees), the ASTS function is turned off. When CAV, SII and FRS all exceed the threshold, the manual shutdown alarm is triggered. Finally, through 76 groups of strong earthquake records, it is proved that the multi-parameter method proposed in this paper can accurately determine the shutdown threshold, precisely reflecting the ground motion destructive force. This method can avoid many false alarms or false shutdowns caused by isolated and prominent single high-frequency acceleration spikes.
Author Contributions
Conceptualization, L.L. and X.D.; supervision, R.P.; writing—review and editing, H.L.; data curation, X.Z. All authors have read and agreed to the published version of the manuscript.
Funding
This research was funded by National Science and Technology Major Project of advanced technology research on structural health inspection and evaluation of nuclear power plants (Grant Number: 2018ZX06002008).
Institutional Review Board Statement
Not applicable.
Informed Consent Statement
Not applicable.
Data Availability Statement
Not applicable.
Acknowledgments
This paper was prepared to document work performed by Nuclear and Radiation Safety Center, Ministry of Environmental Protection (NSC). This paper is an independent product does not reflect the view or regulatory position of NSC.
Conflicts of Interest
The authors declare no conflict of interest.
References
- HAF102/02-2019. Seismic Design and Evaluation of NPPs; National Nuclear Safety Administration: Beijing, China, 2019.
- GB50267-2019. Code for Seismic Design of Nuclear Power Plants; China Architecture and Building: Beijing, China, 2019. [Google Scholar]
- ANSI/ANS 2.2. Earthquake Instrumentation Criteria for Nuclear Power Plants; American Nuclear Society: La Grange Park, IL, USA, 2002. [Google Scholar]
- USNRC. Seismic Instrumentation. Standard Review Plan; United States Nuclear Regulatory Commission: Rockville, MD, USA, 2007.
- USNRC. Nuclear Power Plant Instrumentation Earthquakes; United States Nuclear Regulatory Commission: Rockville, MD, USA, 1997.
- Lu, Y.; Wang, Q.; Sun, Z. Review Experience Feedback on Seismic Instrumentation in Nuclear Power Plant; National Conference Structural Mechanics in Reactor Technology: Shanghai, China, 2012. [Google Scholar]
- IAEA. Earthquake Preparedness and Response for Nuclear Power Plants; IAEA: Viena, Austria, 2011. [Google Scholar]
- Yuan, Y.F. Impact of Intensity and Loss Assessment following the Great Wenchuan Earthquake. J. Earthq. Eng. Eng. Vib. 2018, 7, 247–254. [Google Scholar] [CrossRef]
- Whorton, R. US Utility Perspectives on Earthquake Response and Seismic Instrumentation; IAEA Workshop: Viena, Austria, 1995. [Google Scholar]
- EPRI. Standardization of the Cumulative Absolute Velocity; EPRI-100082; Electric Power Research Institute: PaloAlto, CA, USA, 1991. [Google Scholar]
- EPRI. A Criterion for Determining Exceedance of the Operating Basis Earthquake; EPRI Report NP-5930; Electric Power Research Institute: PaloAlto, CA, USA, 1988. [Google Scholar]
- Chen, Z. Application of Atandardized Cumulative Absolute Velocity for the third Generation Nuclerar Power Plant Earthquake Monitoring. J. Geod. Geodyn. 2012, 170–172. [Google Scholar] [CrossRef]
- Pan, H.; Li, J.C.; Wu, D.Z. The Impacts on the kashiwazaki-kariwa Nuclear Power Station Due to the Niigata ken chuetsu oki. Recent Dev. World Seismol. 2007, 11, 21–32. [Google Scholar]
- MITI. Technical Standards for Nuclear Power Plant Facilities; MITI: Japan, 1989. [Google Scholar]
- JEAG. Technical Guidelines for Aseismic Design of Nuclear Power Plants; JEAG: Japan, 1987. [Google Scholar]
- Available online: http://www.fjdzj.gov.cn/ar/2017011519004329.htm (accessed on 3 June 2021).
- IAEA. Seismic Safety of Existing NPPs; IAEA: Viena, Austria, 2009. [Google Scholar]
- IAEA. Earthquake Preparedness and Responses for NPPs; IAEA: Viena, Austria, 2011. [Google Scholar]
- Jin, X. Research Report on Seismic Instrument Intensity Standard; Seismological Bureau of Fujian Province: Fuzhou, China, 2010. [Google Scholar]
- Wald, D.J.; Quitoriano, V.; Heaton, T.H.; Kanamori, H.; Scrivner, C.W.; Worden, C.B. TriNet “ShakeMap”: Rapid generation of peak ground motion and intensity maps for earthquakes in southern California. Earthq. Spectra 1999, 15, 537–555. [Google Scholar] [CrossRef]
- USNRC. Pre-Earthquake Planning, Shutdown, and Restart of a Nuclear Power Plant Following an Earthquake; United States Nuclear Regulatory Commission: Rockville, MD, USA, 2020. [Google Scholar]
- CEA. Interim Regulation for Calculation of Instrumental Seismic Intensity; China Earthquake Administration: Beijing, China, 2015. [Google Scholar]
- Wu, Q.; Liu, Y.; Wong, B. Floor response spectra analysis of the nuclear containment at ultimate safety ground motion. Acta Sci. Nat. Univ. Sunyatseni 2018, 57, 136. [Google Scholar]
- Li, M. Study on the Relationship between Acceleration Response Spectrum and Seismic Intensity; Institute of Engineering Mechanics, China Earthquake Administration: Beijing, China, 2010.
Figure 1.
Epicenter distribution map of Fujian and its surrounding areas (2008–2013), from Fujian Province Earthquake Administration [
16].
Figure 1.
Epicenter distribution map of Fujian and its surrounding areas (2008–2013), from Fujian Province Earthquake Administration [
16].
Figure 2.
Ground motion acceleration time history curve, (a) Horizontal X direction, (b) Horizontal Y direction, (c) Vertical Z direction.
Figure 2.
Ground motion acceleration time history curve, (a) Horizontal X direction, (b) Horizontal Y direction, (c) Vertical Z direction.
Figure 3.
Acceleration time history processing flow chart.
Figure 3.
Acceleration time history processing flow chart.
Figure 4.
Comparison study between acceleration time histories using (a) and not using filter (b).
Figure 4.
Comparison study between acceleration time histories using (a) and not using filter (b).
Figure 5.
Acceleration time history synthesized by three components.
Figure 5.
Acceleration time history synthesized by three components.
Figure 6.
Lumped mass stick model of reactor building.
Figure 6.
Lumped mass stick model of reactor building.
Figure 7.
Function flow chart of the existing seismic instrumentation alarm system.
Figure 7.
Function flow chart of the existing seismic instrumentation alarm system.
Figure 8.
Function flow diagram of the improved seismic instrumentation system (high intensity areas).
Figure 8.
Function flow diagram of the improved seismic instrumentation system (high intensity areas).
Figure 9.
Function flow diagram of the improved seismic instrumentation system (low intensity areas).
Figure 9.
Function flow diagram of the improved seismic instrumentation system (low intensity areas).
Figure 10.
Comparison of the new and old systems.
Figure 10.
Comparison of the new and old systems.
Figure 11.
Peak value alarm logic of seismic acceleration with 1 out of 7.
Figure 11.
Peak value alarm logic of seismic acceleration with 1 out of 7.
Figure 12.
3-way synthetic acceleration alarm logic with 2 out of 4.
Figure 12.
3-way synthetic acceleration alarm logic with 2 out of 4.
Table 1.
Seismic instruments of a NPP Units 5 and 6.
Table 1.
Seismic instruments of a NPP Units 5 and 6.
| NO. | Sensor Location | Function | Seismic
Instruments |
|---|
| 1 | Free field | Participating in shutdown alarm | Triaxial accelerometer |
| 2 | Raft foundation of reactor building of Unit 5 |
| 3 | Containment structure in reactor building of Unit 5 |
| 4 | Raft foundation of nuclear auxiliary building |
| 5 | Raft foundation of Unit 6 reactor building |
| 6 | Containment structure of unit 5 |
| 7 | Nuclear auxiliary building |
| 8 | Reactor building of Unit 5 (+8 m) | Peak acceleration acquisition | Triaxial peak acceleration recorder |
| 9 | Reactor building of Unit 5 (+38 m) |
| 10 | Near the dome of reactor shell 5 (+55 m) |
| 11 | Control room of Unit 5 (+19.4 m) |
Table 2.
Seismic instruments of ASTS.
Table 2.
Seismic instruments of ASTS.
| NO. | Sensor Location | Function | Seismic
Instruments |
|---|
| 1 | Basis of containment | Participating in ASTS | Triaxial accelerometer |
| 2 |
| 3 |
| 4 |
Table 3.
ASTS Design Characteristics of Four Countries.
Table 3.
ASTS Design Characteristics of Four Countries.
| Nation | Background of ASTS | Basis of Setpoint | Sensor Installation |
|---|
| Japan | Mandated by
regulatory authority | 120 gal | Free field |
| USA | Optional | OBE |
| China | Optional | OBE |
| Korea | Mandated by
regulatory authority | 0.18 g |
Table 4.
Intensity table of seismic instruments used in ShakeMap [
21].
Table 4.
Intensity table of seismic instruments used in ShakeMap [
21].
PERCEIVED
SHAKING | Not Felt | Weak | Light | Moderate | Strong | Very Strong | Severe | Violent | Extreme |
|---|
POTENTIAL
DAMAGE | none | none | none | Very light | light | Moderate | Moderate/
Heavy | Heavy | Very Heavy |
| PEAK ACC.(%g) | <0.17 | 0.17–1.4 | 1.4–3.9 | 3.9–9.2 | 9.2–18 | 18–34 | 34–65 | 65–124 | >124 |
| PEAKV EL.(cm/s) | <0.1 | 0.1–1.1 | 1.1–3.4 | 3.4–8.1 | 8.1–16 | 16–31 | 31–60 | 60–116 | >116 |
INSTRUMENTAL
INTENSITY | I | II–III | IV | V | VI | VII | VIII | IX | X+ |
Table 5.
Improved seismic instrument system of NPP.
Table 5.
Improved seismic instrument system of NPP.
| NO. | Sensor Location | Function | Seismic Instruments |
|---|
| 1 | Free field | ASTS | Triaxial accelerometer (adding three-dimensional synthesis function) |
| 2 | Free field |
| 3 | Free field |
| 4 | Free field | ASTS/
Participating in shutdown alarm |
| 5 | Foundation of reactor building of Unit 5 | Participating in shutdown alarm | Triaxial accelerometers (adding three-dimensional synthesis function), instrument intensity meter, cumulative absolute velocity meter, floor response spectrometer |
| 6 | Foundation of nuclear auxiliary building |
| 7 | Foundation of Unit 6 reactor building |
| 8 | Containment structure in reactor building of Unit 5 | Peak acceleration acquisition | Triaxial accelerometers |
| 9 | Containment structure of Unit 5 |
| 10 | Nuclear auxiliary building |
Table 6.
Changes required by the improved seismic instrumentation system.
Table 6.
Changes required by the improved seismic instrumentation system.
| Location | Types | Number | Function |
|---|
| Unchanged | - (i)
The original triaxial accelerometers all add the function of three-dimensional synthesis; - (ii)
add instrument intensity meter, cumulative absolute velocity meter and floor response spectrometer
| - (i)
Three triaxial accelerometers are added to the free field; - (ii)
3 instrument intensity meters, 3 cumulative absolute velocity meters and 3 floor response spectrometers are added on foundation
| - (i)
ASTS function added (high intensity areas) - (ii)
multi-parameter earthquake alarm function is added
|
Table 7.
List of the strong earthquake records.
Table 7.
List of the strong earthquake records.
| Earthquake Events | V
(Macro-Seismic Intensity) | VI
(Macro-Seismic Intensity) | VII
(Macro-Seismic Intensity) | VIII
(Macro-Seismic Intensity) |
|---|
| Ning’er | 4 | 3 | 17 | |
| Panzhihua | 4 | 5 | 3 | 1 |
| Yao an | 2 | 1 | 18 | |
| Ying Jiang | 3 | 3 | 4 | 1 |
| Xin Jiang | 1 | 2 | 4 | |
| Total | 14 | 14 | 46 | 2 |
Table 8.
Comparative statistics of the two methods.
Table 8.
Comparative statistics of the two methods.
Earthquake Intensity
(Macro-Seismic Intensity) | Strong Earthquake Records | Peak Acceleration Method | Multi-Parameter Method |
|---|
| V | 14 | 2 | 0 |
| VI | 14 | 5 | 0 |
| VII | 46 | 46 | 43 |
| VIII | 2 | 2 | 2 |
| Publisher’s Note: MDPI stays neutral with regard to jurisdictional claims in published maps and institutional affiliations. |
© 2021 by the authors. Licensee MDPI, Basel, Switzerland. This article is an open access article distributed under the terms and conditions of the Creative Commons Attribution (CC BY) license (https://creativecommons.org/licenses/by/4.0/).


