Article

Evaluation of New PCM/PV Configurations for Electrical Energy Efficiency Improvement through Thermal Management of PV Systems

1
Birmingham Centre for Energy Storage, School of Chemical Engineering, University of Birmingham, Birmingham B15 2TT, UK
2
Advanced Technology Development Centre, Indian Institute of Technology Kharagpur, Kharagpur 721302, India
*
Author to whom correspondence should be addressed.
Energies 2021, 14(14), 4130; https://doi.org/10.3390/en14144130
Submission received: 21 May 2021 / Revised: 29 June 2021 / Accepted: 5 July 2021 / Published: 8 July 2021

Abstract

:
Photovoltaic modules during sunny days can reach temperatures 35 °C above the ambient temperature, which strongly influences their performance and electrical efficiency as power losses can be up to −0.65%/°C. To minimize and control the PV panel temperature, the scientific community has proposed different strategies and innovative approaches, one of them through passive cooling with phase change materials (PCM). However, further investigation, including the effects of geometric shape, insulation, phase change temperature, ambient temperature, and solar radiation on the PV module power output and efficiency, needs further optimization and research. Therefore, the current work aims to investigate several system configurations and different PCMs (RT42, RT31, and RT25) and compare the system with and without insulation through computational fluid dynamic (CFD) tools. The final goal is to optimise and control the temperature of PV modules and evaluate their system efficiency and energy generation. The results showed that compared with a rectangular shape of the PCM container, the trapezoid-one exhibits a considerably better cooling performance with a negligible variation of the PV temperature, even when the melting temperature of the PCM was lower than the average ambient temperature. Moreover, the study showed that having insulation in the PCM container increases the amount of PCM needed, compared with no insulation case, and the increased amount depends on the PCM type. The newly proposed PV/PCM system configuration shows an efficiency and power generation enhancement of 17% and 14.6%, respectively, at peak times.

1. Introduction

Solar PV, together with wind energy, is fast becoming a mainstream and competitive source of power production. Although accounting for only 4.5% of total electricity generation in 2015, they are expected to represent 58% of total electricity production by 2050 [1]. Electricity generation from solar radiation is achieved through photovoltaic (PV) cells or concentrated solar power plants (CSP). This solar radiation can be used for electricity generation or heat production (space heating, hot water supply).
PV cells absorb 80% of the incident solar radiation and depending on the PV module material, a small part of this solar radiation (only 15 to 20%) is converted into electrical energy while the remaining part is converted into heat [2]. Manufacturers claim that the available photovoltaic modules have an efficiency from 6 to 16% [3]. However, this claimed efficiency is measured at 25 °C, and they have not considered the PV module temperature rise during their working conditions. The overheating temperature of the module is due mainly to high solar radiation and high ambient temperatures [4]. PV modules during sunny days can reach temperatures of 35 °C above ambient temperature. This temperature increment strongly influences the performance and electrical efficiency of the PV system, which can lead to power losses from 0.40%/°C at standard test conditions [5] to 0.65%/°C [6], and increase the ageing of the module. Typical efficiencies for different PV module materials can be found in Table 1.
To inhibit the temperature rise in PV modules, several authors have proposed different cooling techniques using air (natural or forced circulation), water (water cooling system or heat pipes), thermoelectric systems, or Phase Change Materials; some of these methods are passive while some others are active. PV modules can also be combined with solar thermal (PV/T) to deliver heat and electricity into a single module. Some studies have shown an increase in electrical efficiency by 5% [9]. PV/T technology is mainly used in domestic and industrial applications for heating air or water as well as electricity generation [10]. In those cases, water or air are mainly used as the heat transfer fluid. Air type PV/T collectors are used for drying, space heating, and ventilation, whereas water types are used to removing the heat from the PV module. Water types are more effective than air types because the fluid temperature variation is narrower. Already some researchers have pointed out higher thermal efficiencies, 50 to 70% for water heating and 17–51% for air heating [11]. These types of PV/T collectors are mainly used in thermal/heat pump systems, water desalination, solar cooling, or solar greenhouse [2]. However, since 2010 the study of PCMs and nanofluid to increase PV module’s efficiency has increased [12]. PCMs are materials that store thermal energy through a phase change, the solid/liquid phase change being the most used. These materials are used for thermal energy storage and also thermal management applications as they can charge/discharge at an almost constant temperature and have high energy density (small footprint) [13] despite suffering poor thermal conductivity. In recent years, innovative passive cooling methods have been presented, compared to PV/T, as they do not require additional power consumption, work at a higher operating temperature to supply useful heat, and are a more complex system with a higher initial investment [14]. Abd-Elhady et al. [15] proposed drilling through holes in the PV module to allow the hot layer of air under the module to rise, creating natural flows that cool down the module. The temperature of the PV module decreased with the increased number of through-holes until an optimum number of holes was reached. The increase of the through-holes diameter reached a maximum cooling effect on the PV modules, above which less cooling occurred. Also, PCM has been proposed as a potential solution, although further cost-effective studies need to be conducted [16,17,18]. Several researchers have proposed the use of thin layers attached to the PV modules, similar to the research carried out by Stropnik et al. [17] which achieved an increase of the electrical power by 9.2% under experimental conditions. Su et al. [19] introduced a PCM layer to an air-cooled system, improving its efficiency by 10.7% compared with the PV module with no PCM. Also, other researchers proposed the use of microencapsulated phase change material (MEPCM) [20]. A MEPCM layer attached to a water-surface PV module resulted in a 2.1% relative efficiency improvement compared with the one without MEPCM [21]. Hasan et al. [19] used different melting temperature PCMs to evaluate the performance of each PCM in four different systems. They found that the salt hydrate PCM (CaCl2) achieved the highest temperature reduction in most of the insulations. The results showed that the thermal conductivity of the PCM container had a strong impact on low thermal conductivity PCMs performance.
Most PCMs have low thermal conductivity, which strongly affects their heat transfer rate during the charging/discharging process and limits their application, as several researchers have stated in their work. Different strategies to overcome this challenge are currently under study. Huang et al. [22] studied the thermal behavior of PV modules with and without PCM experimentally and by simulation. The system consists of a vertical southeast-oriented PV/PCM system using real ambient temperature and insolation conditions in South East England. The improvement in the thermal performance achieved using metal fins in the PCM container was significant as they enabled a more uniform temperature distribution within the PV/PCM module. The PCM and fins delayed the temperature increment maintaining the operating temperature of the PV cell at a much lower level for extended hours. It was observed that after the PCM melting process, the rate of PV heat extraction decreased, which produced a rapid increase in the module temperature. Khanna et al. [16] focused on optimizing a finned PV/PCM module to achieve the required cooling under different solar radiation; different lengths, thicknesses, and spacing between fins were used. An alternative to increase the thermal conductivity is the use of metallic foams, which was evaluated by Klemm et al. [23]. According to the simulation results, a storage unit consisting of a PCM-filled metallic fibre structure represents an adequate mean for passive thermal management of PV modules in given ambient conditions. The system was able to decrease 20 K of the PCM storage module. However, the configuration has to be validated experimentally under real conditions, and the volume reduction has to be considered. Other researchers used a PV/PCM system with form-stable paraffin/Expanded Graphite (EG) to improve the uniformity of the temperature distribution of the PV modules and thus improve their power output [18]. The PCM/EG helped to control the temperature and the temperature distribution of the PV modules. The output power achieved was above that of the conventional PV module for 230 min, with a maximum increment of 11.50% and an average increment of 7.28% under the experimental conditions. Others, such as Kumar et al. [24], used nanoPCMs to increase the efficiency. The authors achieve a PV panel electrical performance enhancement of up to 4.3%. The prototype studied consisted of a combined PCM mixture of calcium carbonate, copper nanoparticles, and SiC in a ratio of 7:2:1.
Among the techniques for cooling systems mentioned above, PCMs are the most promising and effective cooling technique for photovoltaic due to their higher energy density per unit volume [25,26]. The use of PCM for PV modules cooling shows higher heat transfer rates than both forced air circulation and forced water circulation, a higher heat absorption due to the latent heat, and an isothermal heat removal [27]. Moreover, there is no electricity consumption, no noise, and no maintenance cost. However, the PCM has a higher cost than natural and forced air circulation; some PCMs are toxic, have fire safety issues, are strongly corrosive, and are considered disposable after their life cycle is complete. The research regarding this technology needs to move forward, offer solutions to unresolved problems, and understand the potential barriers to practical application.
Additionally, the geographic location of the PV modules, no matter the system, has a direct impact on the intensity of solar radiation and wind speed, together with humidity conditions, dust in the air and/or pollution, factors that determine the PV module performance and output fluctuation [12]. Although the reported studies showed a considerable enhancement of the PV module’s performance, the experimental results were mainly conducted in lab conditions, where the solar radiation and ambient temperature were fixed at values of 1000 W/m2 and 25 °C, respectively. These tests make it difficult to predict the actual amount of PCM needed for real applications. Therefore, systems must be investigated at a designated location [28]. Studies have shown that common assumptions about the UK, such as not receiving enough sunshine and not being viable to install PV, were wrong; some findings have shown that a significant proportion of a house’s electrical needs could be obtained more than 40% on average [29]. Another aspect that is sometimes overseen is the container dimensions. Typically, a rectangular-shaped PCM container is considered both in modeling and experimental systems. Novel PCM container shapes, different from the usual rectangular solid container filled with the phase change material at the backside of the PV panel, should be considered. Nizetic et al. [30] proposed a new configuration, where several small containers filled with the PCM material were attached to the PV panel. The number of PCM materials was approximately 47% less and the container material, aluminium, was 36% less when compared with a full PCM container. Both configurations performed better than the PV panel without PCM. Although there were periods where the full PCM configuration had the highest power output, the overall performance considering long periods of time for the small container configuration, was better. The authors relate to that outcome due to the more effective thermal management of the small containers owing to less effective heat transfer from the full PCM container strategy.
In this study, passive cooling of PV systems using PCMs was investigated where three different PCM candidates were selected (RT42, RT31, and RT25) based on the average ambient temperature, and a polycrystalline PV module was used. The optimization of the PV module considered different parameters such as ambient temperature, daily solar radiation, PCM type, and its melting temperature, and PCM container shape and size. The parameters were assessed and compared with the system without PCM. This work aims not only to assess the performance of the novel PV/PCM system but also to determine the optimum PCM container parameters (shape/geometry, depth, length, and insulation), the PCM type, and the combined effect on the PV module surface temperature, efficiency and power output using real solar radiation and ambient temperature data. Computational Fluid Dynamic CFD was implemented using Ansys Fluent V18.2 [31], and the dynamic heat transfer, fluid flow, melting/solidification, and other PV/PCM system parameters were studied.

2. Methodology

2.1. System Design

A passive cooling PV module system was considered in this study, consisting of a PCM container attached to the bottom of a Polycrystalline PV module, as shown in Figure 1. The PV module assembly is structured in five layers, and the physical properties of each layer are presented in Table 2. [32]. The PCM container material was made of 4 mm thickness aluminium, with dimensions 1000 mm in length and a variable depth from 20 to 120 mm. A convective heat boundary was applied on the top surface of the PV module, whereas two different boundary conditions were applied on the bottom and the side walls (adiabatic wall and convective heat) to determine the effect of insulation on the dynamic of the system.
The PCM density change during the melting process leads to accumulated heat at the topmost part of the PCM container, which causes nonuniform distribution of the PV module temperature. This difference in temperature across different rows of cells leads to mismatch losses in the PV module. Each cell produces different power based on its temperature and since cells in the PV module are connected in series, the cell subjected to the highest temperature will produce the lowest power. According to Equation (10), the cell current increases with the increase in temperature, so the cooler cells will produce a lesser current. As in series connection, the lowest current producing cell governs the current of the whole string of cells in the module, and the higher current generated by the other cells will get dissipated as heat across the diode, which is parallel to the light source in the single diode model of the solar cell [33]. To address this issue and achieve a uniform temperature distribution, four different PCM container geometries were considered, as shown in Figure 2.
To validate the model, measured solar radiation and ambient temperature data from a study conducted by Savvakis et al. [34] was used as input, and the predicted outputs power was compared to the measured value. The PV module orientation was considered as follows: 30° from horizontal with an azimuth angle of 0°, which were the experimental work conditions; the average ambient temperature for the selected day was approximately 30 °C. Therefore, three different PCMs with higher, similar, and lower melting temperatures (RT42, RT31, and RT25) were selected to determine the relationship between the location average ambient temperature and the PCM phase change temperature. The physical properties of these PCMs are shown in Table 3. The PCM density in the model was set as a function in the PCM temperature while the specific heat capacity was assumed to be constant. The data from the PCM supplier shows that approximately 90% of the phase change occurs within a temperature range of 5 °C, as shown in Figure 3 [35]. Thus, a narrow temperature range has been used for the PCM simulation; this was partially done to reduce the computational time [32,34,36,37].

2.2. PV/PCM System Model

The fraction of the incident solar radiation that passes through the top glass layer and absorbed by the PV cells can be found in Equation (1) which considers the reflectivity of the PV module and the solar radiation losses [34].
I PV = τ α eff × I T
where τ α eff is the effective glass layer transmissivity and absorptivity of the PV cell.
A small portion of the absorbed solar radiation can be converted into electricity, and the other major part will be converted into heat; this heat is expressed in Equation (2).
S h = τ α eff . I T   η c I T
where η c is the cell conversion efficiency.
A computational fluid dynamic (CFD) tool was used to predict the operating temperature of the PV module considering the experimental ambient temperature and solar radiation of the selected day. The main objective is to assess its performance. The assumptions made to reduce the complexity of the problem and the computational time are the following:
  • The thermal resistance between the PV layers is negligible.
  • There is a uniform heat flux distribution on the PV surface.
  • Heat leaks/gains through the insulation are negligible.
Ansys fluent V18.2 software [31] was used in the current study, and a melting and solidification model was chosen to simulate the melting/solidification processes of the different PCMs [31,38,39]. The model can solve thermal and fluid flow problems involving melting/ solidification at a specific temperature such as pure substances or over a wide temperature range such as mixtures or alloys. Enthalpy-porosity formulation method was used in Ansys Fluent to track the liquid/solid front explicitly. The liquid/solid interface is denoted by a mushy zone and treated as a porous zone with a porosity equal to the fluid liquid fraction, which changes from 0 to 1 during the melting process [31,38,39].
To solve the energy equation, the model uses the following equation Equation (3)
ρ H t . ρ   v H = . k T +   S
where ρ is the fluid density, v is the fluid velocity, S is the source term, and H is the material’s enthalpy, which is the summation of the sensible ( h ) and the latent heat ( Δ H ). Enthalpies are written in the manner of Equation (4)
H = h   + Δ H
where
h = h ref T ref T C p dT
where h ref is the reference enthalpy, T ref is the reference temperature, and C p is a specific heat capacity at constant pressure.
Δ H represents the latent heat component which varies from 0 (for the solid phase) at the initial state of the material to 1 (for the liquid phase) at the end of the phase change. Therefore Δ H of material L during the melting process (mushy zone) can be written as:
Δ H = β L
β = 0               if   T < T solidus β = 1                   if   T < T liquidus β = T     T solidus T liquidus   T solidus                   if   T solidus < T <   T liquidus
More details on the melting and solidification model can be found in [31]. Regarding the boundary conditions, a convective heat of 10 W/m2-K and radiation heat were applied on the top wall surface of the PV module. The same boundary conditions with a convective heat value of 7 W/m2. K were applied on the side and bottom walls in cases without insulation and adiabatic walls in cases with insulation. The model used the measured ambient temperature to predict the heat transfer rate through convection and radiation. Regarding the convective heat, these values are not practically constant. They function in many parameters such as ambient temperature, wind speed, and even the cleanliness of the module surfaces; however, these values were selected because they demonstrated good agreement with the experiment. Regarding radiation, it is mainly due to the temperature difference; therefore, considering the measured ambient temperature will lead to a highly accepted prediction of the radiation heat.
The performance of the PV module was assessed in terms of conversion efficiency ( η c ), short circuit current (Isc), open-circuit voltage (Voc), and power output ( P ) based on the predicted operating temperature as defined in Equations (8)–(13) [40]:
η c = η T ref 1   β ref T c   T ref
where η T ref is cell/module electrical efficiency at standard operating conditions (SOC) and β ref is the temperature coefficient (TC) which is defined in Equation (9) [40]:
β ref = 1 T 0   T ref
where T 0 is the PV temperature that drops the module electrical efficiency to zero; this temperature is equal to 270 °C for crystalline silicon cells [40].
The PV module current and voltage at the operating temperature was calculated using Equations (10) and (11), respectively [40].
I SC = G T G T SRC I SC SRC 1 + T c   T SRC
V OC = V OC SRC 1 +   β c G T SRC T c   T SRC 1 +   δ T c ln G T / T SRC
where , β c and δ are the current, voltage, and solar radiation correction coefficients for the operating temperature. G T is the solar irradiance on the PV surface (W/m2). G T SRC is the solar irradiance at standard reporting conditions. The maximum power was calculated using Equation (12).
p m = FF . I SC . V OC
The module power output at the operating temperature is defined by the following equation:
p = η T ref AG T 1   β ref T c   T ref +   γ log   G T
where A is the module surface area.
The power losses generated due to the nonuniformity of the temperature distribution (mismatch loss fraction, L MLF ) on the PV module was calculated using Equation (1) [33]:
L MLF = i = 1 n ( p i ) p mp i   = 1 n p i = row = 1 n r ( p row )   I lowest × row = 1 n r V row row = 1 n r ( V row × I row )
where P mp is the PV module output power, P i is the cell power generation, n is the number of cells in the module, n r is the number of cells in one row, P row is the power output of one row, V row is the open voltage of one row, and I lowest is the lowest current in the module.

3. Model Validation

Nikolaos and Theocharis [34] experimentally tested the PV/PCM system and compared its performance with a conventional PV system. Their measured PV surface temperature with and without PCM cooling system was used to validate the developed CFD modelling. The measured solar radiation and ambient temperature were used in the CFD modelling. The measured PV temperature was compared against the predicted values, and the results are shown in Figure 4. For both cases (with and without PCM attached), the predicted PV temperatures demonstrated good agreement with the experimental work, with a value of R-square of 0.78 and 0.94, respectively, and a maximum temperature difference of only ±2 °C.

4. Result and Discussion

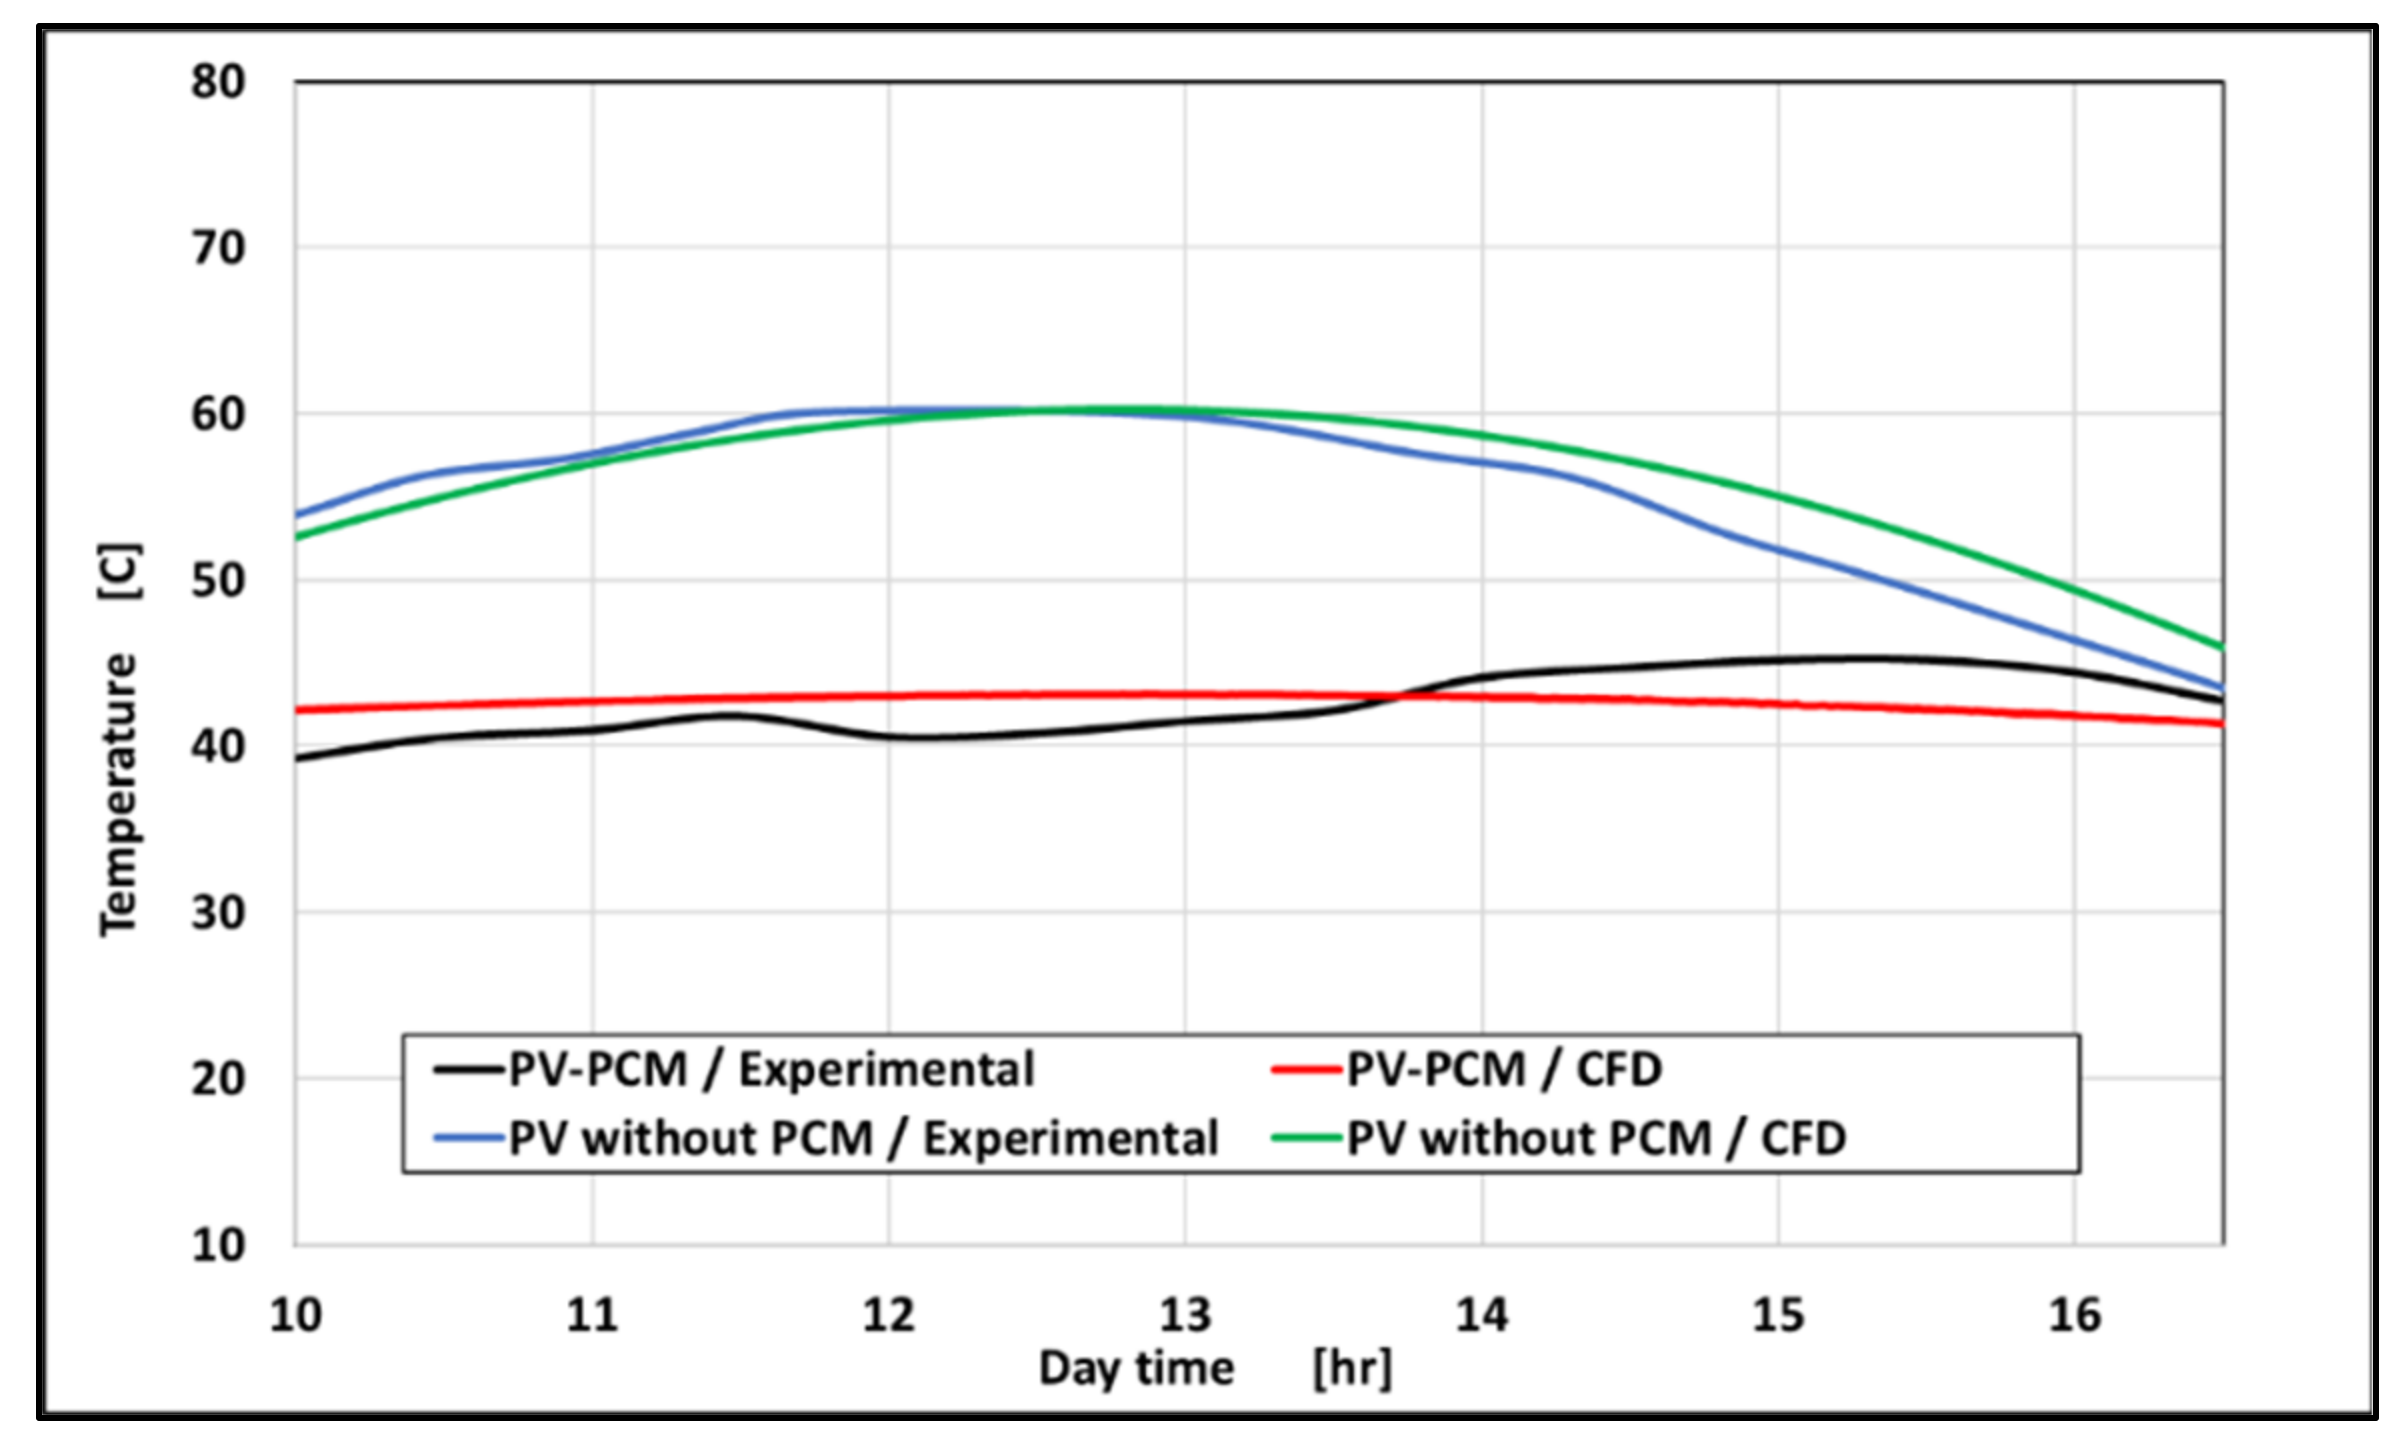
The current work investigates the potential of using PCMs to enhance the performance of PV modules where a PCM container is attached to the bottom surface of the PV module. The study aims to optimise the system variables: PCM container (shape, height/depth and length), insulation and PCM type, which contains a sufficient amount of PCM to meet the cooling load, by studying their effect on the operating temperature of the PV module. The PV module temperature was predicted using CFD modelling with Ansys Fluent V18.2 software to assess its performance. A published experimental work was used to validate the developed model. The dynamic power output from the PV module and its conversion efficiency with respect to the operating temperature was calculated using well-known empirical equations.
Three different PCMs (RT42, RT31 and RT25) were chosen based on the average ambient temperature (~30 °C) of the studied case. The melting temperature of these PCMs was approximately 5 °C less, equal to and 10 °C higher than the average ambient temperature, to determine the effect of the selected phase change temperature on the container size, insulation, PV temperature, conversion efficiency, and power output.
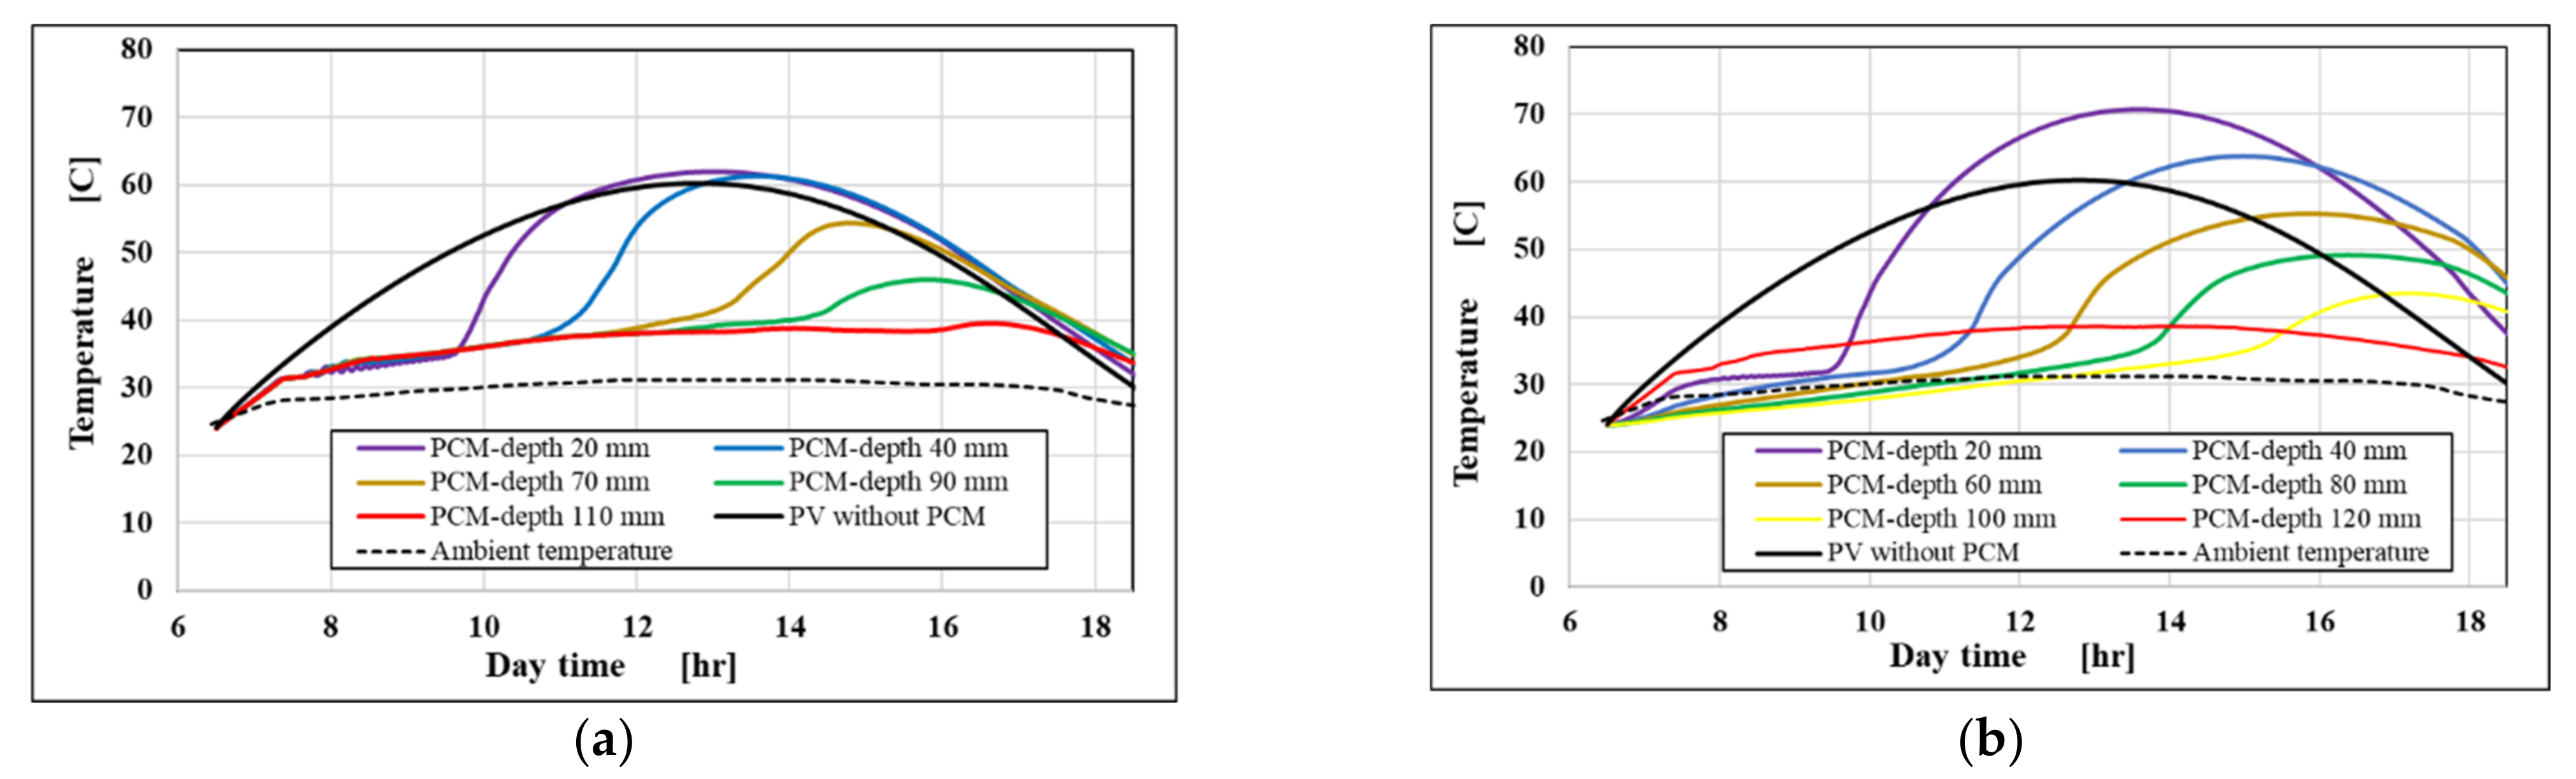
Figure 5a,b show the PV temperature of the RT42 PV/PCM system with different container heights, with and without insulation, versus the daytime. In both cases, the temperature of the PV-only system is included for comparison purposes. The results showed that the insufficient container heights (20, 40, 50, and 60 mm) led to an increase in the PV/PCM module temperature even higher than the conventional system (PV-only) at certain times. The increase was higher with insulation, as shown in Figure 5b; this is due to the increasing PCM temperature when it completely melts and releases its heat, becoming higher than the ambient temperature. Thus, the conventional PV system showed a lower temperature when the heat could be easily separated from the back of the PV module. Without insulation, the optimum tank height was 70 mm while it was 80 mm with insulation; this means that having insulation in the PCM container when RT42 is used increases the required PCM amount by 14%, in addition to its cost.
RT31 and RT25 showed a similar trend to RT42, with and without insulation, as shown in Figure 6 and Figure 7. However, the average PV module temperature using RT31 and RT25 with the optimal PCM height was around 37 °C and 32 °C, respectively, which were lower than that of using RT42 (43 °C). Thus, RT31 and RT25 provide a significant reduction in the PV temperature at peak times by 23 °C and 28 °C, respectively, compared with the PV-only system when it was 17 °C after RT42 was used. The optimum tank height for RT31 was 110 mm when no insulation was used and 120 mm using insulation. When RT25 is used, the optimal heights were 120 and 125 mm, respectively.
Figure 8 shows the comparison of RT42, RT31, and RT25 in terms of the PCM container size. The figure demonstrates that when RT31 and RT25 were used, the required amount of PCM was 56% and 72% higher than that of RT42.
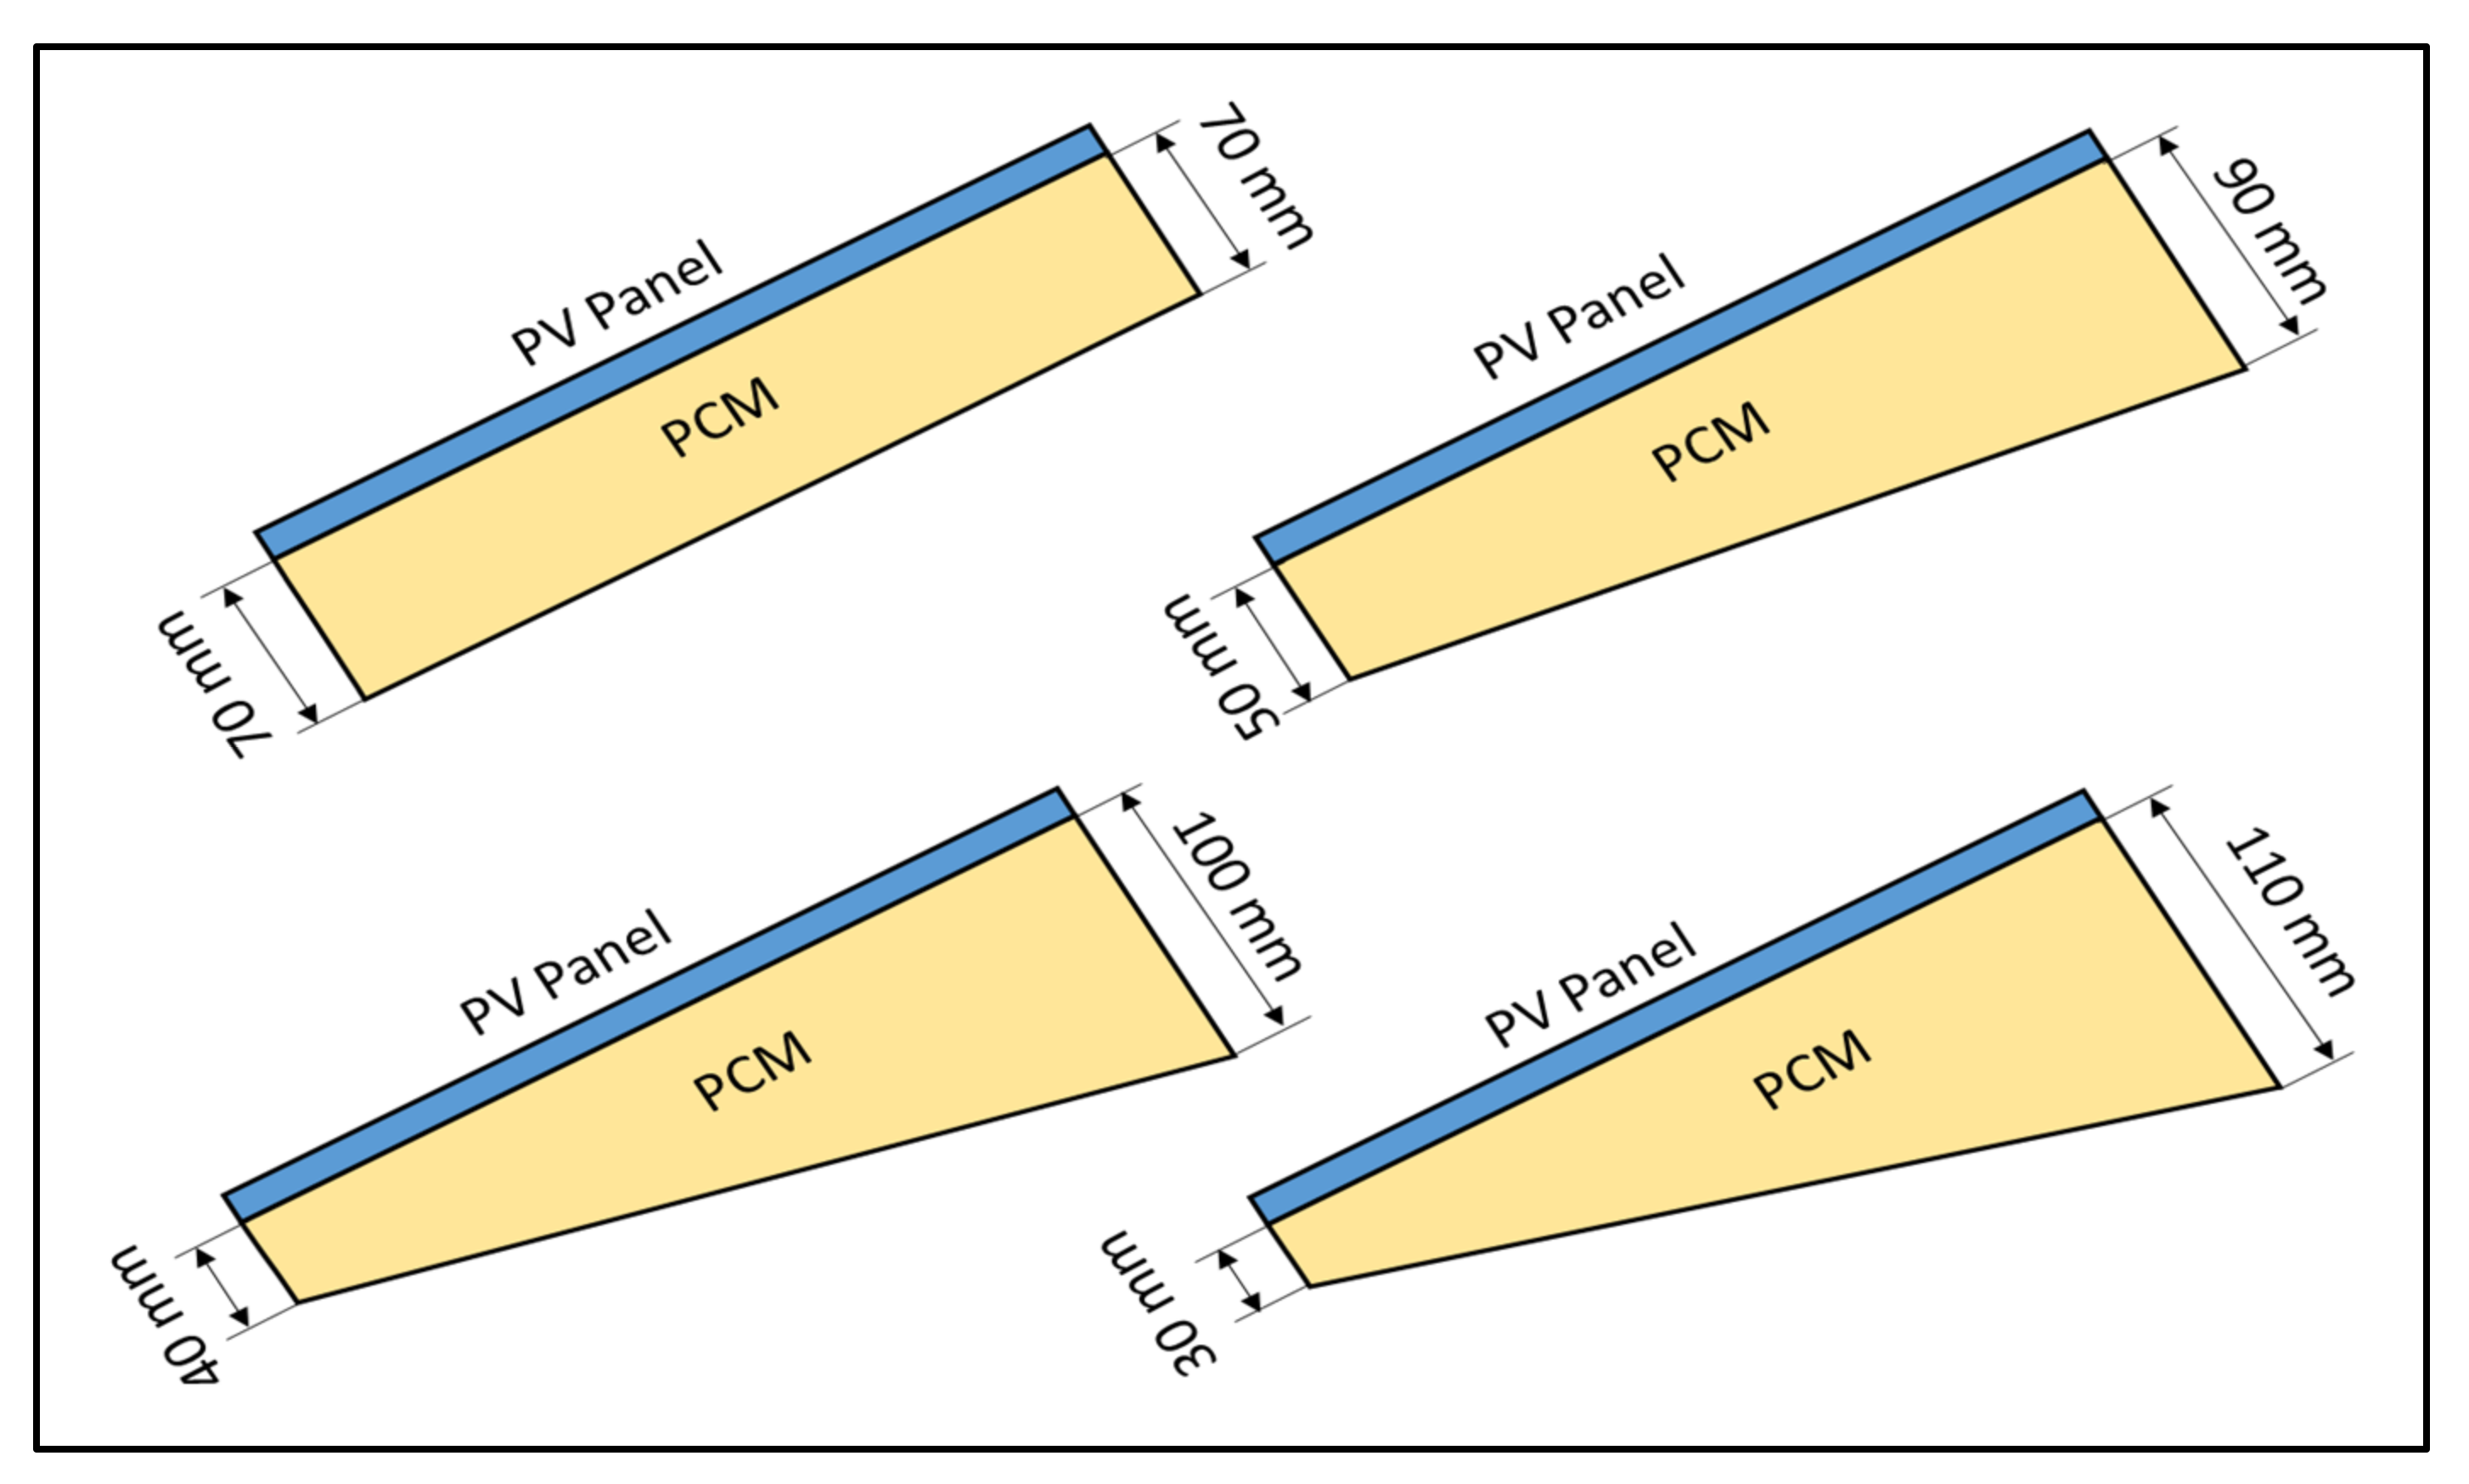
Regarding the effect of the tank shape on the PV module temperature, four different tank geometries (cases) were considered, as shown in Figure 2. In all these cases, no insulation was used, and RT42 was selected as the PCM material. When the PV module temperature becomes higher than the melting temperature of the PCM, the melting process starts, and the density change occurs. This density change forces the liquid phase to move to the top side of the PCM container, leading to a nonuniform temperature distribution in the PV module. As mentioned above, this temperature gradient is highly dependent on the tank depth, shape, and length.
In the first case (Case 1) of the four configurations, the container had a rectangular-shaped cross-section with a height value of 70 mm, while the second, third, and fourth cases (Case 2, Case 3 and Case 4) had container cross-sections shaped like trapezoids, with a variation in height from bottom to top. The bottom heights of Case 2, 3, and 4 were 50, 40 and 30 mm, whereas 90, 100 and 110 mm were the heights of the top side, respectively. In all cases, the tank length was fixed at 1000 mm.
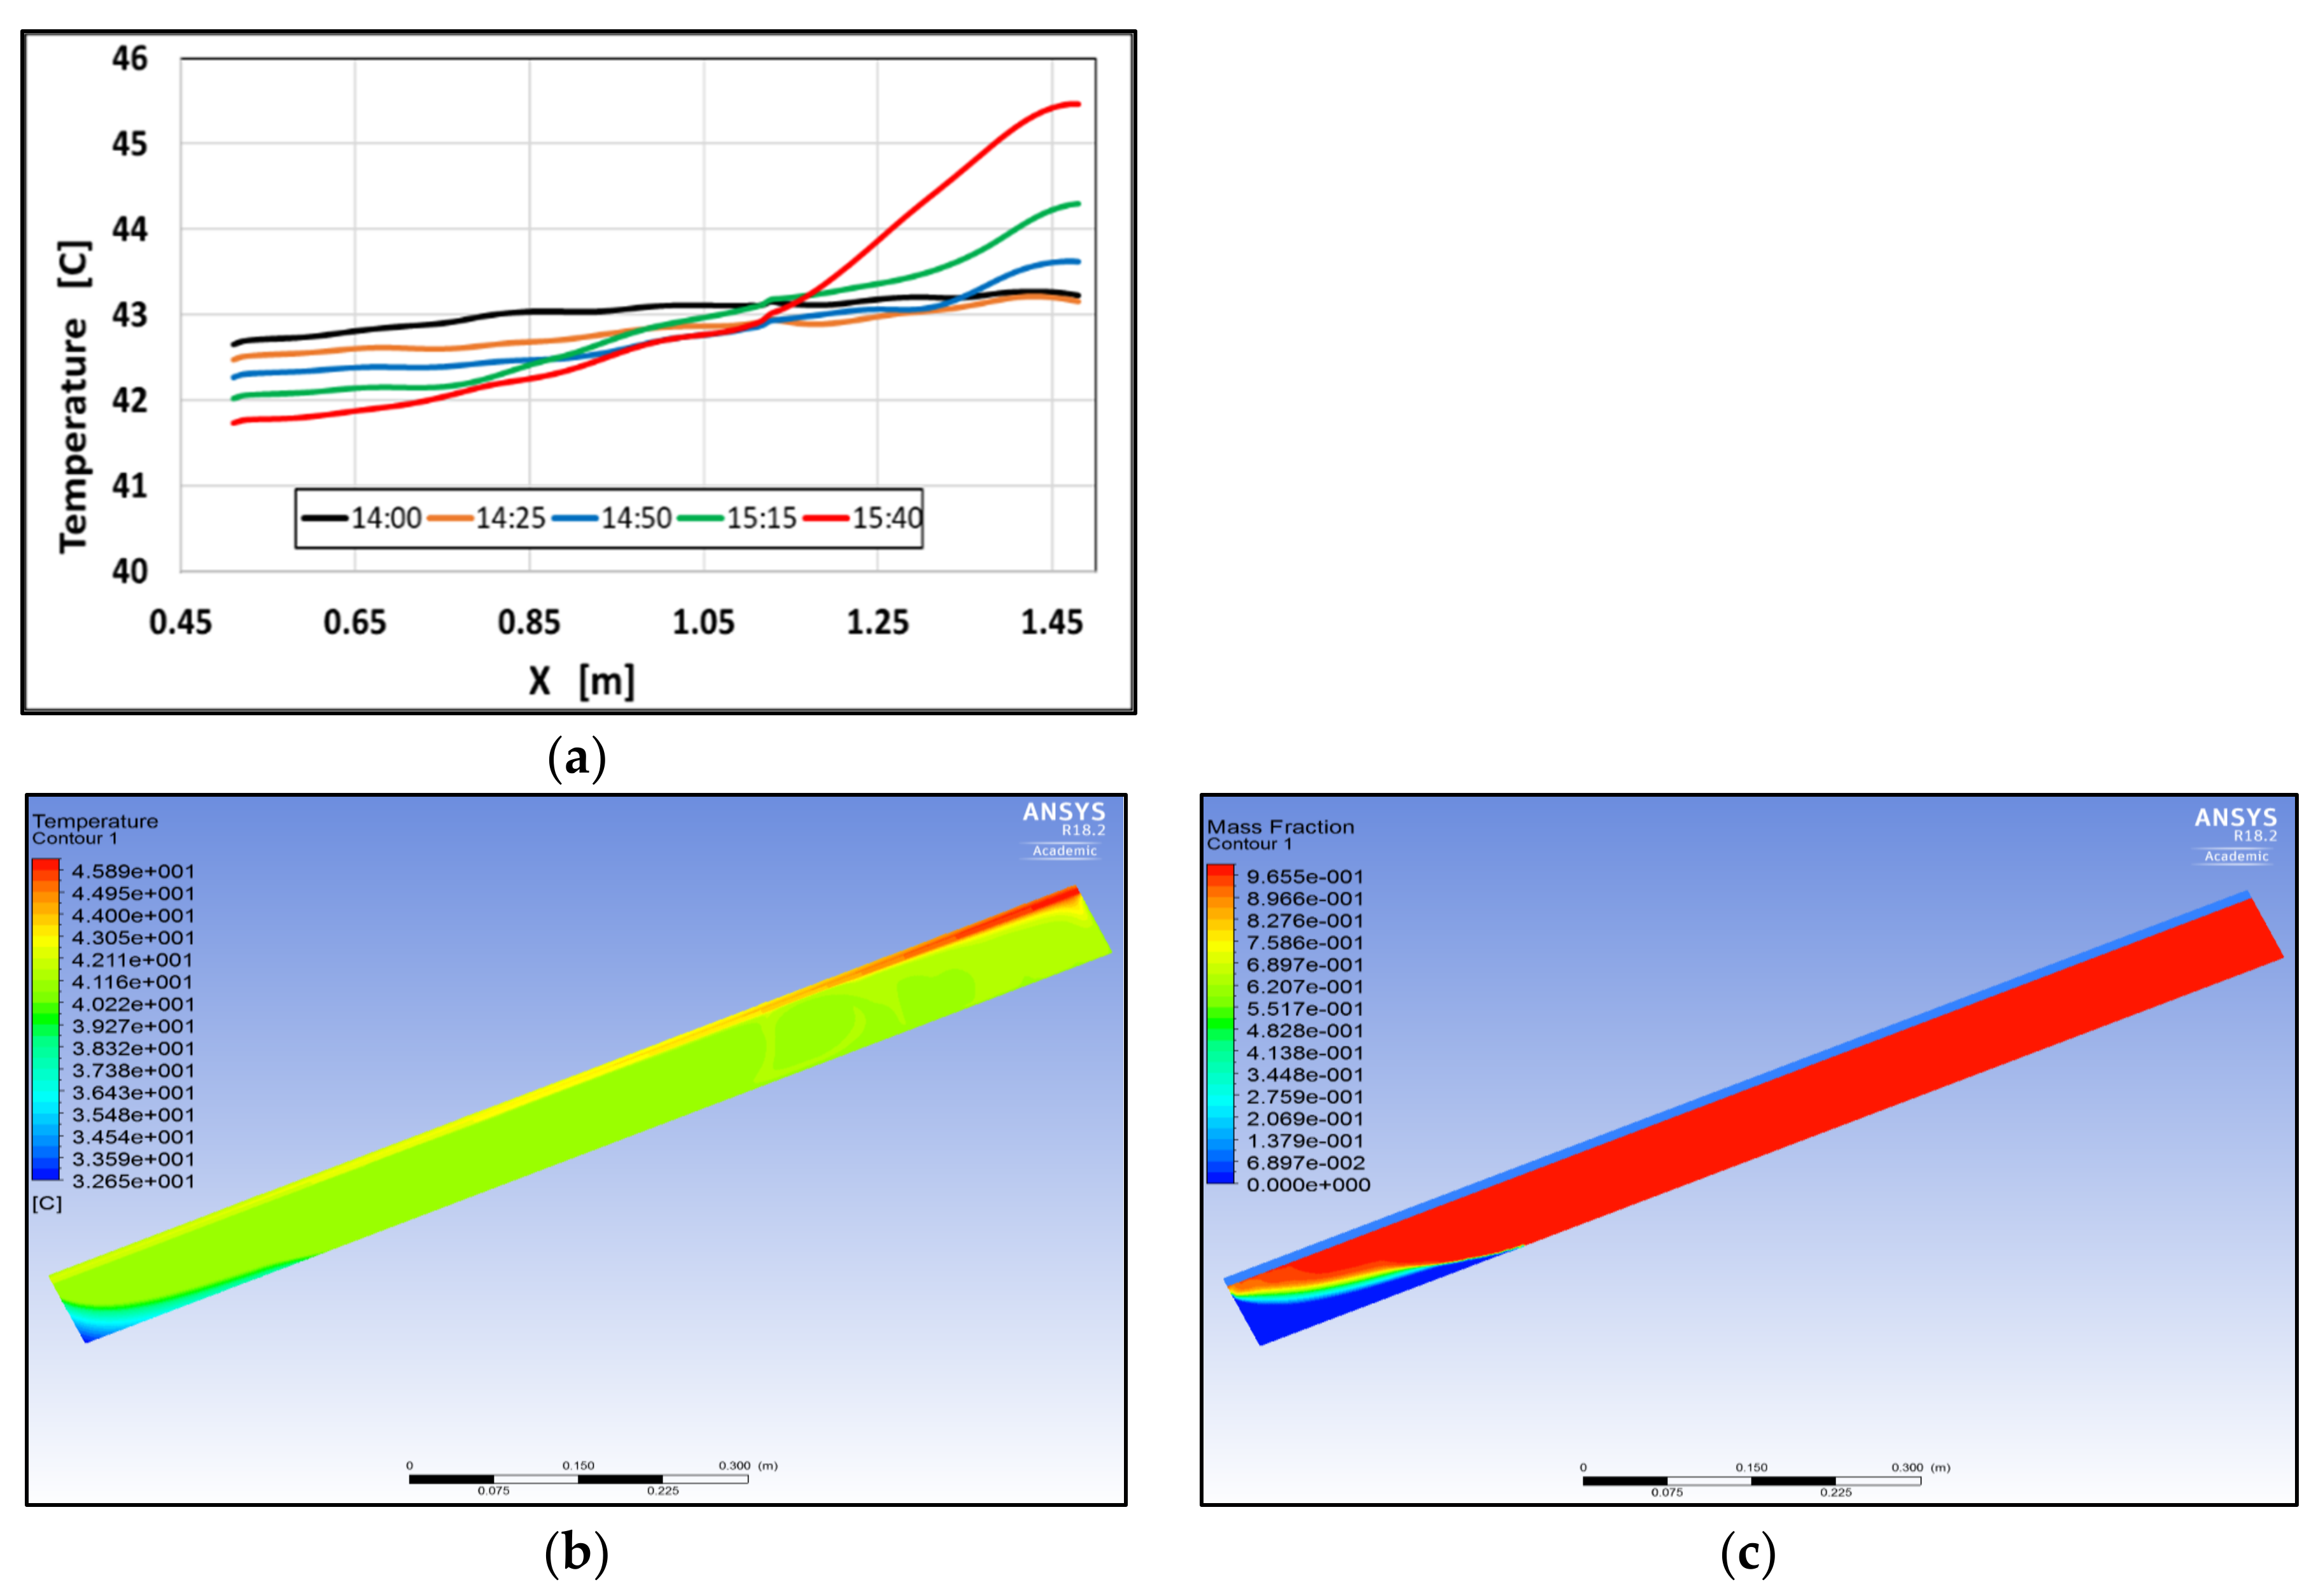
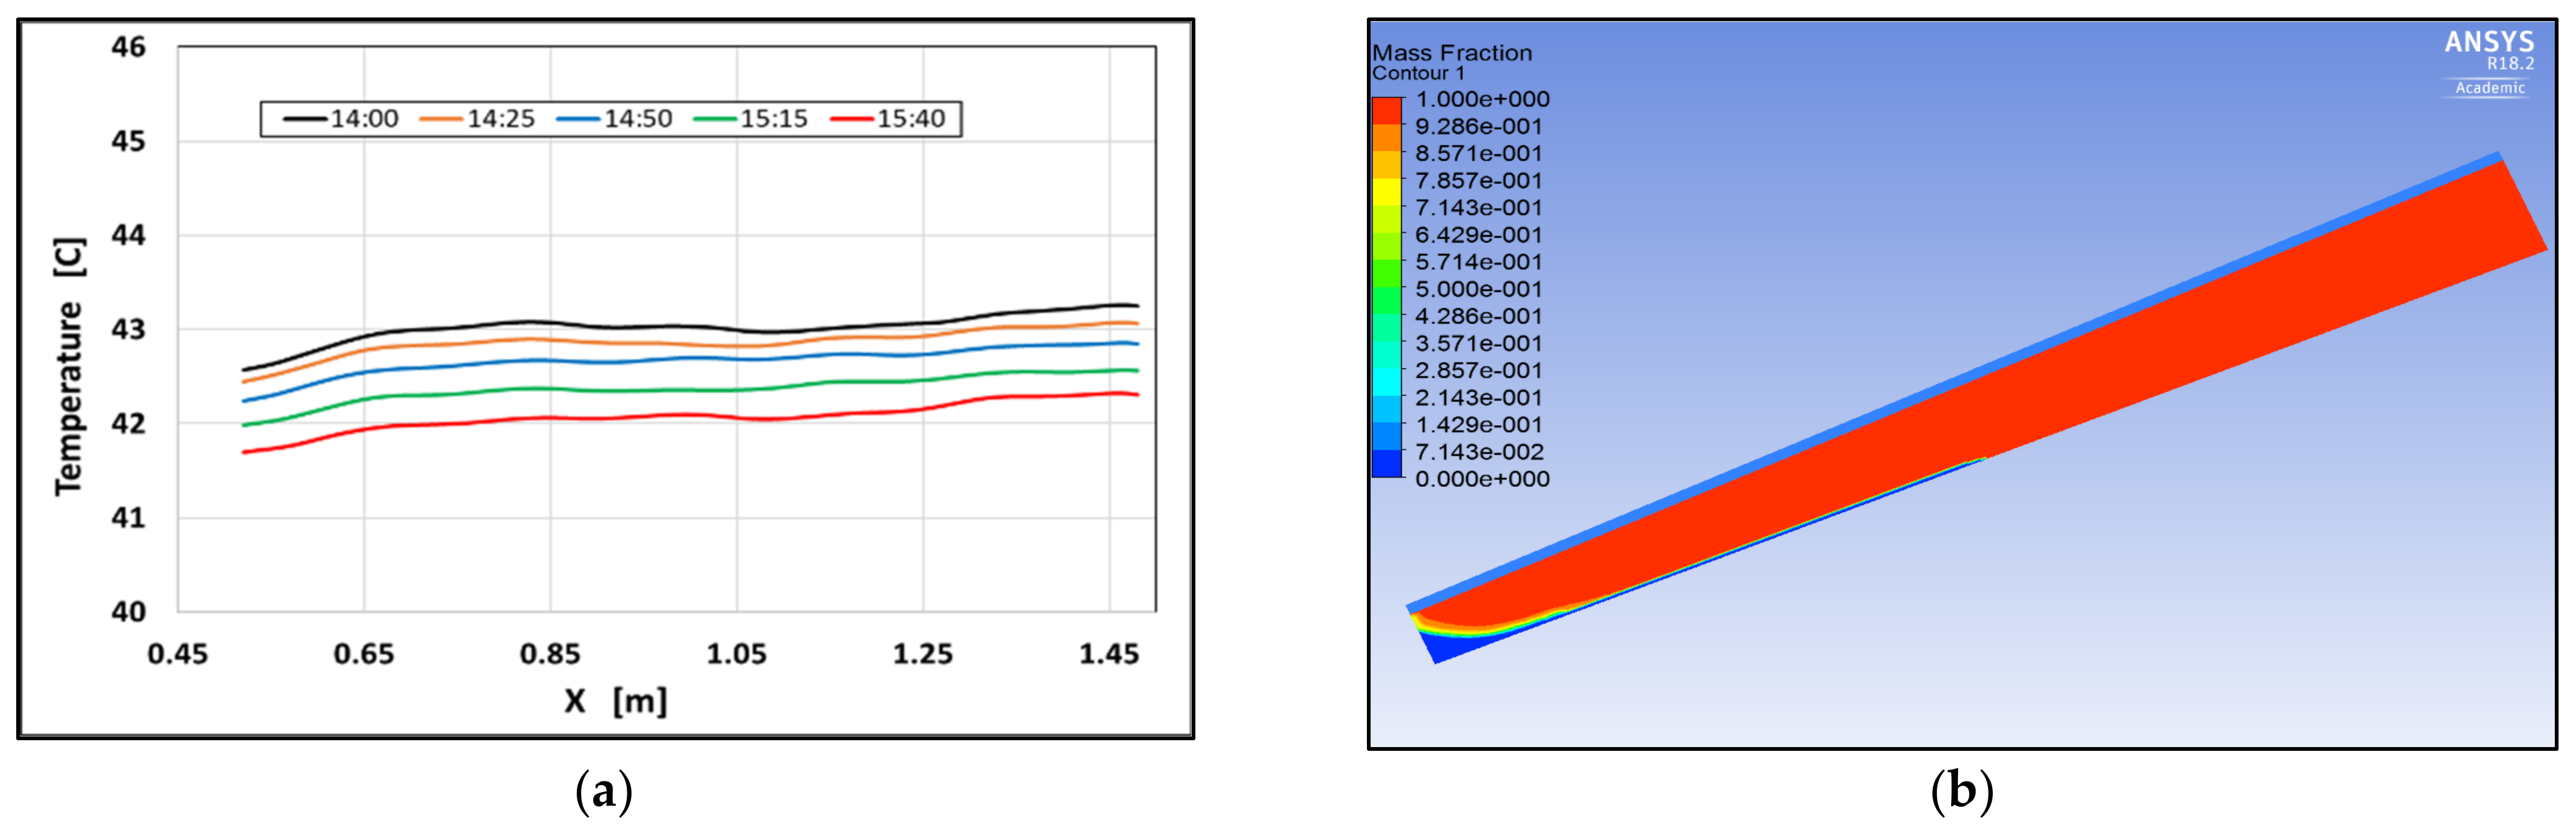
For the first configuration (Case 1), Figure 9 shows the PV surface temperature gradient along its length at different day times. After 14:50, most of the PCM melted, and the top part’s temperature started increasing and reached its peak at 15:40. with a difference higher than 4 °C. Figure 9b,c show the temperature and the mass fraction contours of the PV/PCM system at 15:40.
Figure 10a, Figure 11a, and Figure 12a show the temperature gradients of PV temperature along with the trapezoid shape containers of Cases 2, 3, and 4, respectively. The PV surface temperature is almost constant in Cases 2 and 3, with a variation of less than 0.5 °C. However, Case 4 shows a considerable reduction in the surface temperature at the bottom side of the container. This container part was affected by the ambient temperature due to the thinness of the PCM layer. Figure 10b, Figure 11b, and Figure 12b show the mass fraction contours of the PV/PCM system at 15:40. It can be seen that the solid part of the PCM in Cases 3 and 4 did not move to the bottom side of the container due to their high viscosity and the low container slope.
Reducing the tank length leads to a lower temperature variation and vice versa. Considering both the PV module temperature and the movement of the PCM inside the container, Case 2 was the best configuration; however, this result is subjective to the PV tilt angle and the ambient temperature.
The PV module efficiency at the operating temperature was calculated using Equation (8). Figure 13 shows the variation of the PV module efficiency at the operating temperature during the studied daytime for both the PV/PCM and the PV-only system. By comparing the two systems, unlike the conventional system, the PV/PCM system showed no significant variation in the PV efficiency during the daytime. The lowest melting temperature PCM (RT25) showed the highest PV module efficiency. The PV/PCM systems reached an efficiency increase of 10%, 13% and 17% at 13:00 when RT42, RT31, and RT25 were used, respectively, as shown in Figure 14. This considerable enhancement of the PV/PCM system efficiency resulted in a great increase in the hourly power output, as shown in Figure 15, where the power output of the 1 m2 module’s system is presented.
Figure 16 shows the percentage enhancement of the power output of the PV/PCM system compared to the PV-only system. This enhancement reached around 9%, 11.5% and 14.6% at the maximum solar radiation when RT42, RT31, and RT25, respectively, were used. RT42 showed the lowest PV efficiency and power output enhancement compared with RT31 and RT25. However, the output power when using RT31 and RT25 as PCM showed a maximum increase of only 3% and 5.5%, respectively, compared with RT42, as shown in Figure 17. These results indicate that using PCM with a melting temperature higher than the average ambient temperature significantly reduces the PCM amount without a significant reduction in the total power output.
The rectangular PCM container shows the most inhomogeneous temperature distribution, as seen in Figure 9a. This inhomogeneous temperature distribution leads to a mismatch loss, an outcome previously mentioned in Section 2. A PV module with 72 cells was used to estimate the mismatch losses for Case 1 at the daytime hour of 15:40. The module specification is shown in Table 4 with a landscape orientation. The cells array consists of 10 cells in each row and 6 in each column. The CFD simulation results were used to feed the mathematical model to calculate each row’s output voltage and power and the whole module. The solar radiation was assumed to be 800 W/m2, and the results are shown in Table 5. The results show a mismatch loss fraction of 0.42%, which seems insignificant, but considering a large PV plant consisting of several modules, these losses will significantly contribute to reducing the power generation.

5. Conclusions

Researchers have already reported passive cooling systems for PV modules using phase change materials as a promising and effective cooling technique due to their higher energy density per unit volume and high heat transfer rates compared with air circulation. These systems does not require electricity consumption or moving parts and have a low maintenance cost. This work investigated the effects of different design parameters of PV/PCM systems, including PCM container shape, depth, length, insulation, and PCM type on the PV module surface temperature, efficiency, and power output. Three different PCMs were selected (RT42, RT31, and RT25), and experimental hourly solar radiation and ambient temperature data available in the literature were used. A CFD model using Ansys Fluent was developed to simulate the melting/solidification processes of the PCM and to predict the temperature variation in the dynamics of the PV/PCM system during the daytime. The results showed that:
  • The CFD model demonstrated good agreement with the experimental work found in the literature with a maximum temperature difference of less than 2 °C.
  • Insulation in the PCM container will increase the required amount of the PCM, no matter the melting temperature of the PCM.
  • The rectangular shape (Case 1) and the optimum depth/height of the PCM containers with a sufficient amount of PCM to meet the cooling load during the daytime were 70 mm, 110 mm, and 120 when RT42, RT31, and RT25, respectively, were used in cases without insulation. With insulation, the optimum depth/height of the PCM containers were 80 mm, 120 mm, and 125 mm, respectively.
  • PCMs with a lower melting temperature require more amounts of PCM when there is no significant difference in the latent heat. Compared to RT42, RT31 and RT25 showed an increase in the PCM amount by 56% and 72%, respectively.
  • Regarding the PCM container geometry, trapezoid container configurations (Cases 2, 3, and 4) showed a considerably better cooling performance due to their lower variation of PV temperature. This enhances the performance of the PV systems by reducing mismatched losses.
  • In all investigated PCMs, the PV/PCM system showed a considerable enhancement of the PV module efficiency and maintained it at an almost constant level over the daytime. Compared with the PV-only system, the efficiency enhancement at the peak times reached 10%, 13% and 17% when RT42, RT31, and RT25 were used, respectively.
  • PV/PCM systems showed a considerable power output enhancement; at the solar peak time, the power output increased by 9%, 11.5% and 14.6% when RT42, RT31, and RT25 were used, respectively, compared with the PV-only system.
  • Although RT42 showed the lowest efficiency and power enhancement, it showed a significant reduction in the amount of PCM by 36% and 14.6% compared with RT31 and RT25, respectively. Moreover, the power output from RT31 and RT25 cases showed a maximum increase of 3% and 5.5%, respectively, compared with RT42, indicating that using a PCM with a melting temperature higher than the average ambient temperature will lead to a cost-effective system without a significant reduction in the power output.

Author Contributions

A.A., mathematical and CFD modelling; writing, revising and constructing the main manuscript. H.N., writing the introduction part and revising manuscript. S.G., writing and mathematical modelling of mismatching losses, and revising the manuscript. Y.D., revising and supervising. J.N.R., revising and supervising. All authors have read and agreed to the published version of the manuscript.

Funding

The authors would like to thank the Engineering and Physical Sciences Research Council (EPSRC), Grant NO: EP/P003605/1, Birmingham Centre for Energy Storage (BCES) and the University of Sebha-Libya for supporting this research work.

Institutional Review Board Statement

Not applicable.

Informed Consent Statement

Not applicable.

Data Availability Statement

Not applicable.

Acknowledgments

The authors would like to thank the Engineering and Physical Sciences Research Council (EPSRC), Grant NO: EP/P003605/1, Birmingham Centre for Energy Storage (BCES) and the University of Sebha-Libya for supporting this research work.

Conflicts of Interest

The authors declare no conflict of interest.

Nomenclature

A Module surface area
C p Specific heat capacity at constant pressure
G T Solar irradiance on PV surface (W/m2)
G T SRC Solar irradiance at standard reporting condition
FF Fill factor
H Total enthalpy
h Sensible heat
Δ H Latent heat
h ref Reference enthalpy
I lowest Lowest current in the module
I PV Incident solar radiation absorbed by PV cells
IscShort circuit current
I T Total solar incident
k Thermal conductivity
L MLF Mismatch loss fraction
nNumber of cells in the module
nrNumber of cells in one row
P Power output
P i Cell power generation
P m Maximum power output
P mp PV module output power
P row Power output of one row
S Source term
S h Portion of the solar irradiance converted to heat
T Temperature
T c Cell temperature
T 0 PV temperature that drops the module electrical efficiency to Zero
T liquidus Liquidus temperature
T solidus Solidification temperature
T ref Reference temperature
T SRC Cell temperature at standard reporting condition
v Velocity
VocOpen circuit voltage
V O C SRC Open circuit voltage at standard reporting condition
V row Open voltage of one row
Greek letters
τ α eff Effective glass layer transmissivity and PV cell absorptivity
η c Cell conversion efficiency.
ρ Density
η T ref Cell/module electrical efficiency at standard conditions
Current correction coefficient
β Constant varies from 0 at solid state to 1 at liquid state
β c Voltage correction coefficient
β ref Temperature coefficient
δ Solar radiation correction coefficient

References

  1. Gielen, D.; Gorini, R.; Wagner, N.; Leme, R.; Gutierrez, L.; Prakash, G.; Asmelash, E.; Janeiro, L.; Gallina, G.; Vale, G.; et al. Global Energy Transformation: A Roadmap to 2050; International Renewable Energy Agency: Abu Dhabi, United Arab Emirates, 2018; ISBN 978-92-9260-059-4. [Google Scholar]
  2. Abdelrazik, A.S.; Al-Sulaiman, F.; Saidur, R.; Ben-Mansour, R. A review on recent development for the design and packaging of hybrid photovoltaic/thermal (PV/T) solar systems. Renew. Sustain. Energy Rev. 2018, 95, 110–129. [Google Scholar] [CrossRef]
  3. Hussain, F.; Othman, M.Y.H.; Sopian, K.; Yatim, B.; Ruslan, H.; Othman, H. Design development and performance evaluation of photovoltaic/thermal (PV/T) air base solar collector. Renew. Sustain. Energy Rev. 2013, 25, 431–441. [Google Scholar] [CrossRef]
  4. Fouad, M.M.; Shihata, L.A.; Morgan, E.I. An integrated review of factors influencing the perfomance of photovoltaic panels. Renew. Sustain. Energy Rev. 2017, 80, 1499–1511. [Google Scholar] [CrossRef]
  5. Ma, T.; Li, Z.; Zhao, J. Photovoltaic panel integrated with phase change materials (PV-PCM): Technology overview and materials selection. Renew. Sustain. Energy Rev. 2019, 116, 109406. [Google Scholar] [CrossRef]
  6. Islam, M.M.; Pandey, A.K.; Hasanuzzaman, M.; Rahim, N.A. Recent progresses and achievements in photovoltaic-phase change material technology: A review with special treatment on photovoltaic thermal-phase change material systems. Energy Convers. Manag. 2016, 126, 177–204. [Google Scholar] [CrossRef]
  7. Pandey, A.K.; Tyagi, V.V.; Selvaraj, J.A.; Rahim, N.A.; Tyagi, S.K. Recent advances in solar photovoltaic systems for emerging trends and advanced applications. Renew. Sustain. Energy Rev. 2016, 53, 859–884. [Google Scholar] [CrossRef]
  8. Rajput, U.J.; Yang, J. Comparison of heat sink and water type PV/T collector for polycrystalline photovoltaic panel cooling. Renew. Energy 2018, 116, 479–491. [Google Scholar] [CrossRef]
  9. Abdullah, A.L.; Misha, S.; Tamaldin, N.; Rosli, M.A.M.; Sachit, F.A. Photovoltaic thermal/solar (PVT) collector (PVT) system based on fluid absorber design: A review. J. Adv. Res. Fluid Mech. Therm. Sci. 2018, 48, 196–208. [Google Scholar]
  10. Sultan, S.M.; Ervina Efzan, M.N. Review on recent Photovoltaic/Thermal (PV/T) technology advances and applications. Sol. Energy 2018, 173, 939–954. [Google Scholar] [CrossRef]
  11. Prakash, J. Transient analysis of a photovoltaic-thermal solar collector for co-generation of electricity and hot air/water. Energy Convers. Manag. 1994, 35, 967–972. [Google Scholar] [CrossRef]
  12. Al-Waeli, A.H.; Sopian, K.; Kazem, H.A.; Chaichan, M.T. Photovoltaic/Thermal (PV/T) systems: Status and future prospects. Renew. Sustain. Energy Rev. 2017, 77, 109–130. [Google Scholar] [CrossRef]
  13. Palacios, A.; Navarro, M.E.; Barreneche, C.; Ding, Y. Hybrid 3 in 1 thermal energy storage system—Outlook for a novel storage strategy. Appl. Energy 2020, 274, 115024. [Google Scholar] [CrossRef]
  14. Wu, S.; Xiong, C. Passive cooling technology for photovoltaic panels for domestic houses. Int. J. Low-Carbon Technol. 2014, 9, 118–126. [Google Scholar] [CrossRef] [Green Version]
  15. Abd-Elhady, M.S.; Serag, Z.; Kandil, H.A. An innovative solution to the overheating problem of PV panels. Energy Convers. Manag. 2018, 157, 452–459. [Google Scholar] [CrossRef]
  16. Khanna, S.; Reddy, K.S.; Mallick, T.K. Optimization of finned solar photovoltaic phase change material (finned pv pcm) system. Int. J. Therm. Sci. 2018, 130, 313–322. [Google Scholar] [CrossRef]
  17. Stropnik, R.; Stritih, U. Increasing the efficiency of PV panel with the use of PCM. Renew. Energy 2016, 97, 671–679. [Google Scholar] [CrossRef]
  18. Luo, Z.; Huang, Z.; Xie, N.; Gao, X.; Xu, T.; Fang, Y.; Zhang, Z. Numerical and experimental study on temperature control of solar panels with form-stable paraffin/expanded graphite composite PCM. Energy Convers. Manag. 2017, 149, 416–423. [Google Scholar] [CrossRef]
  19. Su, D.; Jia, Y.; Alva, G.; Liu, L.; Fang, G. Comparative analyses on dynamic performances of photovoltaic–thermal solar collectors integrated with phase change materials. Energy Convers. Manag. 2017, 131, 79–89. [Google Scholar] [CrossRef]
  20. Tanuwijava, A.O.; Ho, C.J.; Lai, C.-M.; Huang, C.-Y. Numerical Investigation of the Thermal Management Performance of MEPCM Modules for PV Applications. Energies 2013, 6, 3922–3936. [Google Scholar] [CrossRef] [Green Version]
  21. Ho, C.J.; Chou, W.-L.; Lai, C.-M. Thermal and electrical performance of a water-surface floating PV integrated with a water-saturated MEPCM layer. Energy Convers. Manag. 2015, 89, 862–872. [Google Scholar] [CrossRef]
  22. Huang, M.J.; Eames, P.C.; Norton, B. Thermal regulation of building-integrated photovoltaics using phase change materials. Int. J. Heat Mass Transf. 2004, 47, 2715–2733. [Google Scholar] [CrossRef]
  23. Klemm, T.; Hassabou, A.; Abdallah, A.; Andersen, O. Thermal energy storage with phase change materials to increase the efficiency of solar photovoltaic modules. Energy Procedia 2017, 135, 193–202. [Google Scholar] [CrossRef]
  24. Kumar, K.S.; Kumar, H.A.; Gowtham, P.; Kumar, S.H.S.; Sudhan, R.H. Experimental analysis and increasing the energy efficiency of PV cell with nano-PCM (calcium carbonate, silicon carbide, copper). Mater. Today Proc. 2021, 37, 1221–1225. [Google Scholar] [CrossRef]
  25. Moradi, K.; Ebadian, M.A.; Lin, C.-X. A review of PV/T technologies: Effects of control parameters. Int. J. Heat Mass Transf. 2013, 64, 483–500. [Google Scholar] [CrossRef] [Green Version]
  26. Chow, T.T. A review on photovoltaic/thermal hybrid solar technology. Appl. Energy 2010, 87, 365–379. [Google Scholar] [CrossRef]
  27. Shukla, A.; Kant, K.; Sharma, A.; Biwole, P.H. Cooling methodologies of photovoltaic module for enhancing electrical efficiency: A review. Sol. Energy Mater. Sol. Cells 2017, 160, 275–286. [Google Scholar] [CrossRef]
  28. Shukla, A.K.; Sudhakar, K.; Baredar, P. Simulation and performance analysis of 110 kWp grid-connected photovoltaic system for residential building in India: A comparative analysis of various PV technology. Energy Rep. 2016, 2, 82–88. [Google Scholar] [CrossRef] [Green Version]
  29. PV in the UK: Early results from the UK photovoltaics field trial. Refocus 2005, 6, 36–37. [CrossRef]
  30. Nižetić, S.; Jurčević, M.; Čoko, D.; Arıcı, M. A novel and effective passive cooling strategy for photovoltaic panel. Renew. Sustain. Energy Rev. 2021, 145, 111164. [Google Scholar] [CrossRef]
  31. Ansys Fluent. Ansys Fluent Theory Guide; ANSYS Inc.: Canonsburg, PA, USA, 2013; p. 814. [Google Scholar]
  32. Khanna, S.; Reddy, K.S.; Mallick, T.K. Performance analysis of tilted photovoltaic system integrated with phase change material under varying operating conditions. Energy 2017, 133, 887–899. [Google Scholar] [CrossRef]
  33. Chamberlin, C.E.; Lehman, P.; Zoellick, J.; Pauletto, G. Effects of mismatch losses in photovoltaic arrays. Sol. Energy 1995, 54, 165–171. [Google Scholar] [CrossRef]
  34. Savvakis, N.; Tsoutsos, T. Phase Change Materials in Photovoltaics: The Assessment of System Performance in the Present Mediterranean Climate Conditions. In Power Systems, Energy Markets and Renewable Energy Sources in South-Eastern Europe; (Engineering and Industry Series Volume); Trivent Publishing: Budapest, Hungary, 2016. [Google Scholar] [CrossRef]
  35. GmbH, R.T. Technical Data Sheet RT 42. Available online: https://www.rubitherm.eu/en/index.php/productcategory/organische-pcm-rt (accessed on 5 July 2021).
  36. Caluianu, I.-R.; Băltăreţu, F. Thermal modelling of a photovoltaic module under variable free convection conditions. Appl. Therm. Eng. 2012, 33, 86–91. [Google Scholar] [CrossRef]
  37. Hasan, M.I.; Tbena, H.L. Using of phase change materials to enhance the thermal performance of micro channel heat sink. Eng. Sci. Technol. Int. J. 2018, 21, 517–526. [Google Scholar] [CrossRef]
  38. Karlsson, L. The Dynamics of Drops Freezing on Cold Surfaces; Luleå University of Technology: Luleå, Sweden, 2013. [Google Scholar]
  39. Muhammad, M.D.; Badr, O.; Yeung, H. Validation of a CFD Melting and Solidification Model for Phase Change in Vertical Cylinders. Numer. Heat Transf. Part A Appl. 2015, 68, 501–511. [Google Scholar] [CrossRef]
  40. Skoplaki, E.; Palyvos, J.A. On the temperature dependence of photovoltaic module electrical performance: A review of efficiency/power correlations. Sol. Energy 2009, 83, 614–624. [Google Scholar] [CrossRef]
Figure 1. PV/PCM cooling system construction.
Energies 14 04130 g001
Figure 2. PCM container geometries considered in this study.
Energies 14 04130 g002
Figure 3. Enthalpy variation of RT42 [35].
Energies 14 04130 g003
Figure 4. CFD model versus experimental work.
Energies 14 04130 g004
Figure 5. (a) PV surface temperature at different PCM thicknesses for RT42 (without insulation); (b) PV surface temperature at different PCM thicknesses for RT42 (with insulation).
Energies 14 04130 g005
Figure 6. (a) PV surface temperature at different PCM thicknesses for RT31 (without insulation); (b) PV surface temperature at different PCM thicknesses for RT31 (with insulation).
Energies 14 04130 g006
Figure 7. (a) PV surface temperature at different PCM thicknesses for RT25 (without insulation); (b) PV surface temperature at different PCM thicknesses for RT25 (with insulation).
Energies 14 04130 g007
Figure 8. Volume increase percentage of RT31 and RT25 compared with RT42.
Energies 14 04130 g008
Figure 9. (a) PV surface temperature at different daytimes (Case 1, 70 × 70 mm); (b) temperature contours at daytime of 15:40 (Case 1, 70 × 70 mm); (c) mass fraction contours at day time of 15:40 (Case 1, 70 × 70 mm).
Energies 14 04130 g009
Figure 10. (a) PV surface temperature at different daytimes (Case 2, 50 × 90 mm); (b) temperature contours at daytime of 15:40 (Case 2, 50 × 90 mm).
Energies 14 04130 g010
Figure 11. (a) PV surface temperature at different daytimes (Case 3, 40 × 100 mm); (b) temperature contours at daytime of 15:40 (Case 3, 40 × 100 mm).
Energies 14 04130 g011
Figure 12. (a) PV surface temperature at different daytimes (Case 4, 30 × 110 mm); (b) Temperature contours at daytime of 15:40 (Case 4, 30 × 110 mm).
Energies 14 04130 g012
Figure 13. PV module efficiency at the operation temperature.
Energies 14 04130 g013
Figure 14. Efficiency increasing of PV/PCM system compared to PV-only system.
Energies 14 04130 g014
Figure 15. Hourly power output of 1 m2 of PV/PCM system.
Energies 14 04130 g015
Figure 16. Percentage of power output enhancement of the PV/PCM system.
Energies 14 04130 g016
Figure 17. Hourly power increase of RT31 and RT25 compared with RT42.
Energies 14 04130 g017
Table 1. Efficiencies of PV modules vs. PV material [7,8].
PV ModuleEfficiency (%)1
Si-Cristalline26.1–25.1
Si-yPolycrystalline21.4–20.2
III–V cells29.7–18.1
Thin-film chalcogenide21.4–18.1
Amorphous/microcrystalline Si11.7–9.9
Dye-sensitized12.3–8.5
Organic11.3–9.2
1 At 25 °C and spectrum (1000 W/m2).
Table 2. Properties of PV module components [32].
MaterialProperties
Cp (kJ/kg·K)ρ (kg/m3)K (W/m.K)Thickness (mm)
Glass0.530001.84
Ethylene-vinyl-acetate (EVA)2.099600.350.5
Silicon0.67723301480.3
Tedlar1.2512000.20.1
Aluminium0.90326752114
Table 3. Properties of the studied PCMs (RT42, RT31, and RT25).
PCMCp (kJ/kg-K)K (W/m-K)ρ (kg/m3)Tm (°C)Lh(kJ/kg)
RT422.000.2083241135
RT312.000.2082031140
RT251.99/2.110.19/0.1883083026.6180
Table 4. PV module specifications.
Module CharacteristicValue
Rated Power340 W
TC of open circuit voltage−0.28%/°C
TC of short circuit current0.057%/°C
TC of power−0.40%/°C
Short circuit current Isc of PV cell/module9.3 A
Open circuit voltage Voc of module46.6 V
Open circuit voltage Voc of cell0.6472 V
Maximum current Imp8.77 A
Maximum voltage Vmp of module38.8 V
Table 5. Output power and voltage of each row in the PV module.
RowTemperature (°C)Current (A)Voltage (V)Power (W)
1487.1086.05043.005
2457.0966.10543.318
3427.0846.15943.629
4397.0726.21343.939
5367.0606.26744.248
6337.0486.32244.556
Minimum current (7.048)Total voltage (37.116)Total power (262.696)
Actual power7.048 * 37.116261.594
Mismatch loss 1.102
Mismatch loss fraction 0.421%
Publisher’s Note: MDPI stays neutral with regard to jurisdictional claims in published maps and institutional affiliations.

