
Evaluation of Flicker of Light Generated by Arc Furnaces

Faculty of Transport, Electrical Engineering and Computer Science, Kazimierz Pulaski University of Technology and Humanities, Malczewskiego 29, 26-600 Radom, Poland
*
Author to whom correspondence should be addressed.
Energies 2021, 14(13), 3901; https://doi.org/10.3390/en14133901
Submission received: 29 April 2021
/
Revised: 19 June 2021
/
Accepted: 23 June 2021
/
Published: 29 June 2021
(This article belongs to the Collection Featured Papers in Electrical Power and Energy System)
Abstract
:Due to the dynamic nature of load changes, arc devices are receivers that generate disturbances to the network that affect the power quality. The main disturbance generated by these receivers are voltage fluctuations. One of the effects of voltage fluctuations is the flicker of light caused by lighting receivers. The article presents an analysis of changes indicators flicker of light measured in networks supplying arc furnaces. The propagation of voltage fluctuations to the lines supplying lighting receivers was analyzed. The network parameters influencing the amount of light flicker were estimated. The paper presents a method for calculating the increased flicker of light when several electric arc furnaces are operated in parallel. The conclusions regarding the use of the presented research in practical applications are given in the summary.

1. Introduction
Arc furnaces are devices that use an electric arc between electrodes and the charge to melt scrap. Arc devices are among the restless receivers of electricity. Due to the unstable operation of the arc furnaces experience rapid changes in power consumption when melting scrap. Very fast changes in the value of the furnace currents cause equally rapid voltage fluctuations in the supply network. In the case of arc furnaces, voltage changes range from a few to several changes per second. Arc furnaces also cause voltage asymmetry and distortion. It is related to the non-linear nature of the electric arc.
The publications [1,2,3,4,5,6,7] show the mechanism of the flicker of light, which is the effect of voltage fluctuations. The publication [8] presents, among others, methods of limiting voltage fluctuations through the use of energy storage. A new construction of energy storage devices in a distribution system was proposed. The article [9] presents examples of power systems to which users are connected, causing voltage fluctuations. Analysis of the impact of the short-circuit power in the nodes to which the consumers are connected on the magnitude of voltage fluctuations was carried out. The voltage fluctuations and flicker of light generated mainly by arc furnaces were discussed in [10,11,12,13,14]. Issues concerning the effectiveness of the devices reducing voltage fluctuations and flicker of light in the lines supplying arc furnaces are presented in publications [15,16,17,18,19,20,21]. Interesting solution limiting voltage fluctuations using Unified Voltage Conditioner (UVC) was presented in publications [22,23].
The significant contribution of the UIE (International Union for Electricity, previously known as International Union for Electroheat) to the research on voltage fluctuations as a source of the flicker phenomenon should also be emphasized. The effect of many years of research was the development of the concept and implementation for production of a flickermeter [24]. Voltage fluctuations are defined according to the standard [25] as: cyclic changes of the voltage envelope or a series of random changes of the RMS voltage around the nominal value. Flicker of light is a phenomenon related to the influence of voltage fluctuations on lighting receivers. It is defined as a subjective perception of changes in the luminous flux, whose luminance or spectral distribution changes with time. Fluctuations in the voltage supplying lighting receivers cause changes in the luminous flux. With a certain amplitude and frequency of changes in voltage fluctuations, flicker of light causes people to become nervous up to the level of irritation, beyond which most people are unable to perform any work related to the perception of small objects, poorly contrasting with the surrounding background. In some cases, light flicker may trigger epilepsy attacks [26].
Flicker of light is a phenomenon that is purely physiological. Voltage fluctuations causing perceivable flickering of light are very difficult to determine objectively. Flickering to which the eye of one person is sensitive may not be noticed by another person [27,28].
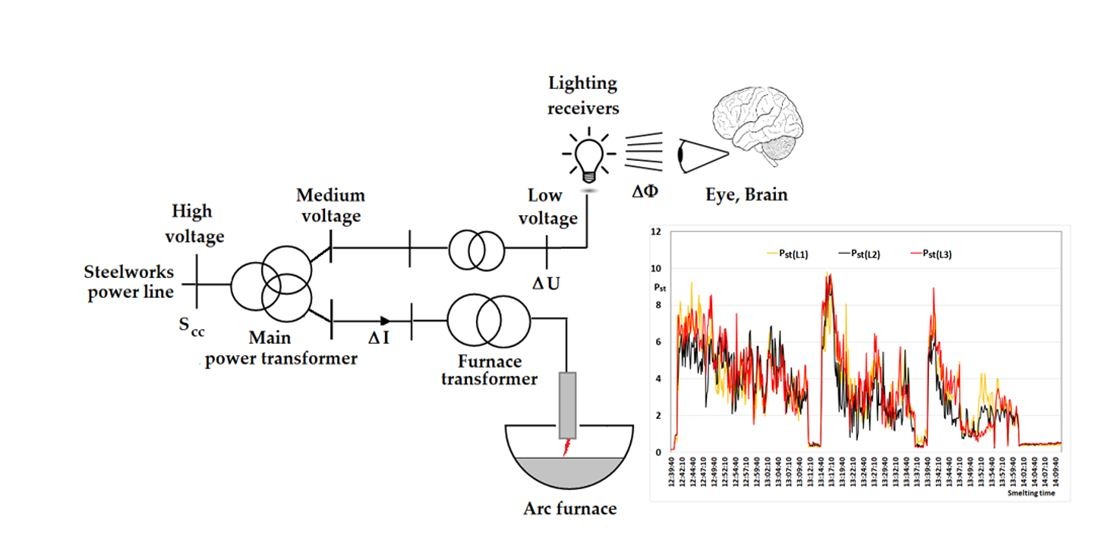
Figure 1 shows the formation and perception of flicker of light caused by arc furnaces. The currents in the supply line to arc furnaces change rapidly (∆I). As a result of changes in currents on the impedance of the transformers and the furnace supply line, rapid voltage fluctuations (∆U) occur.
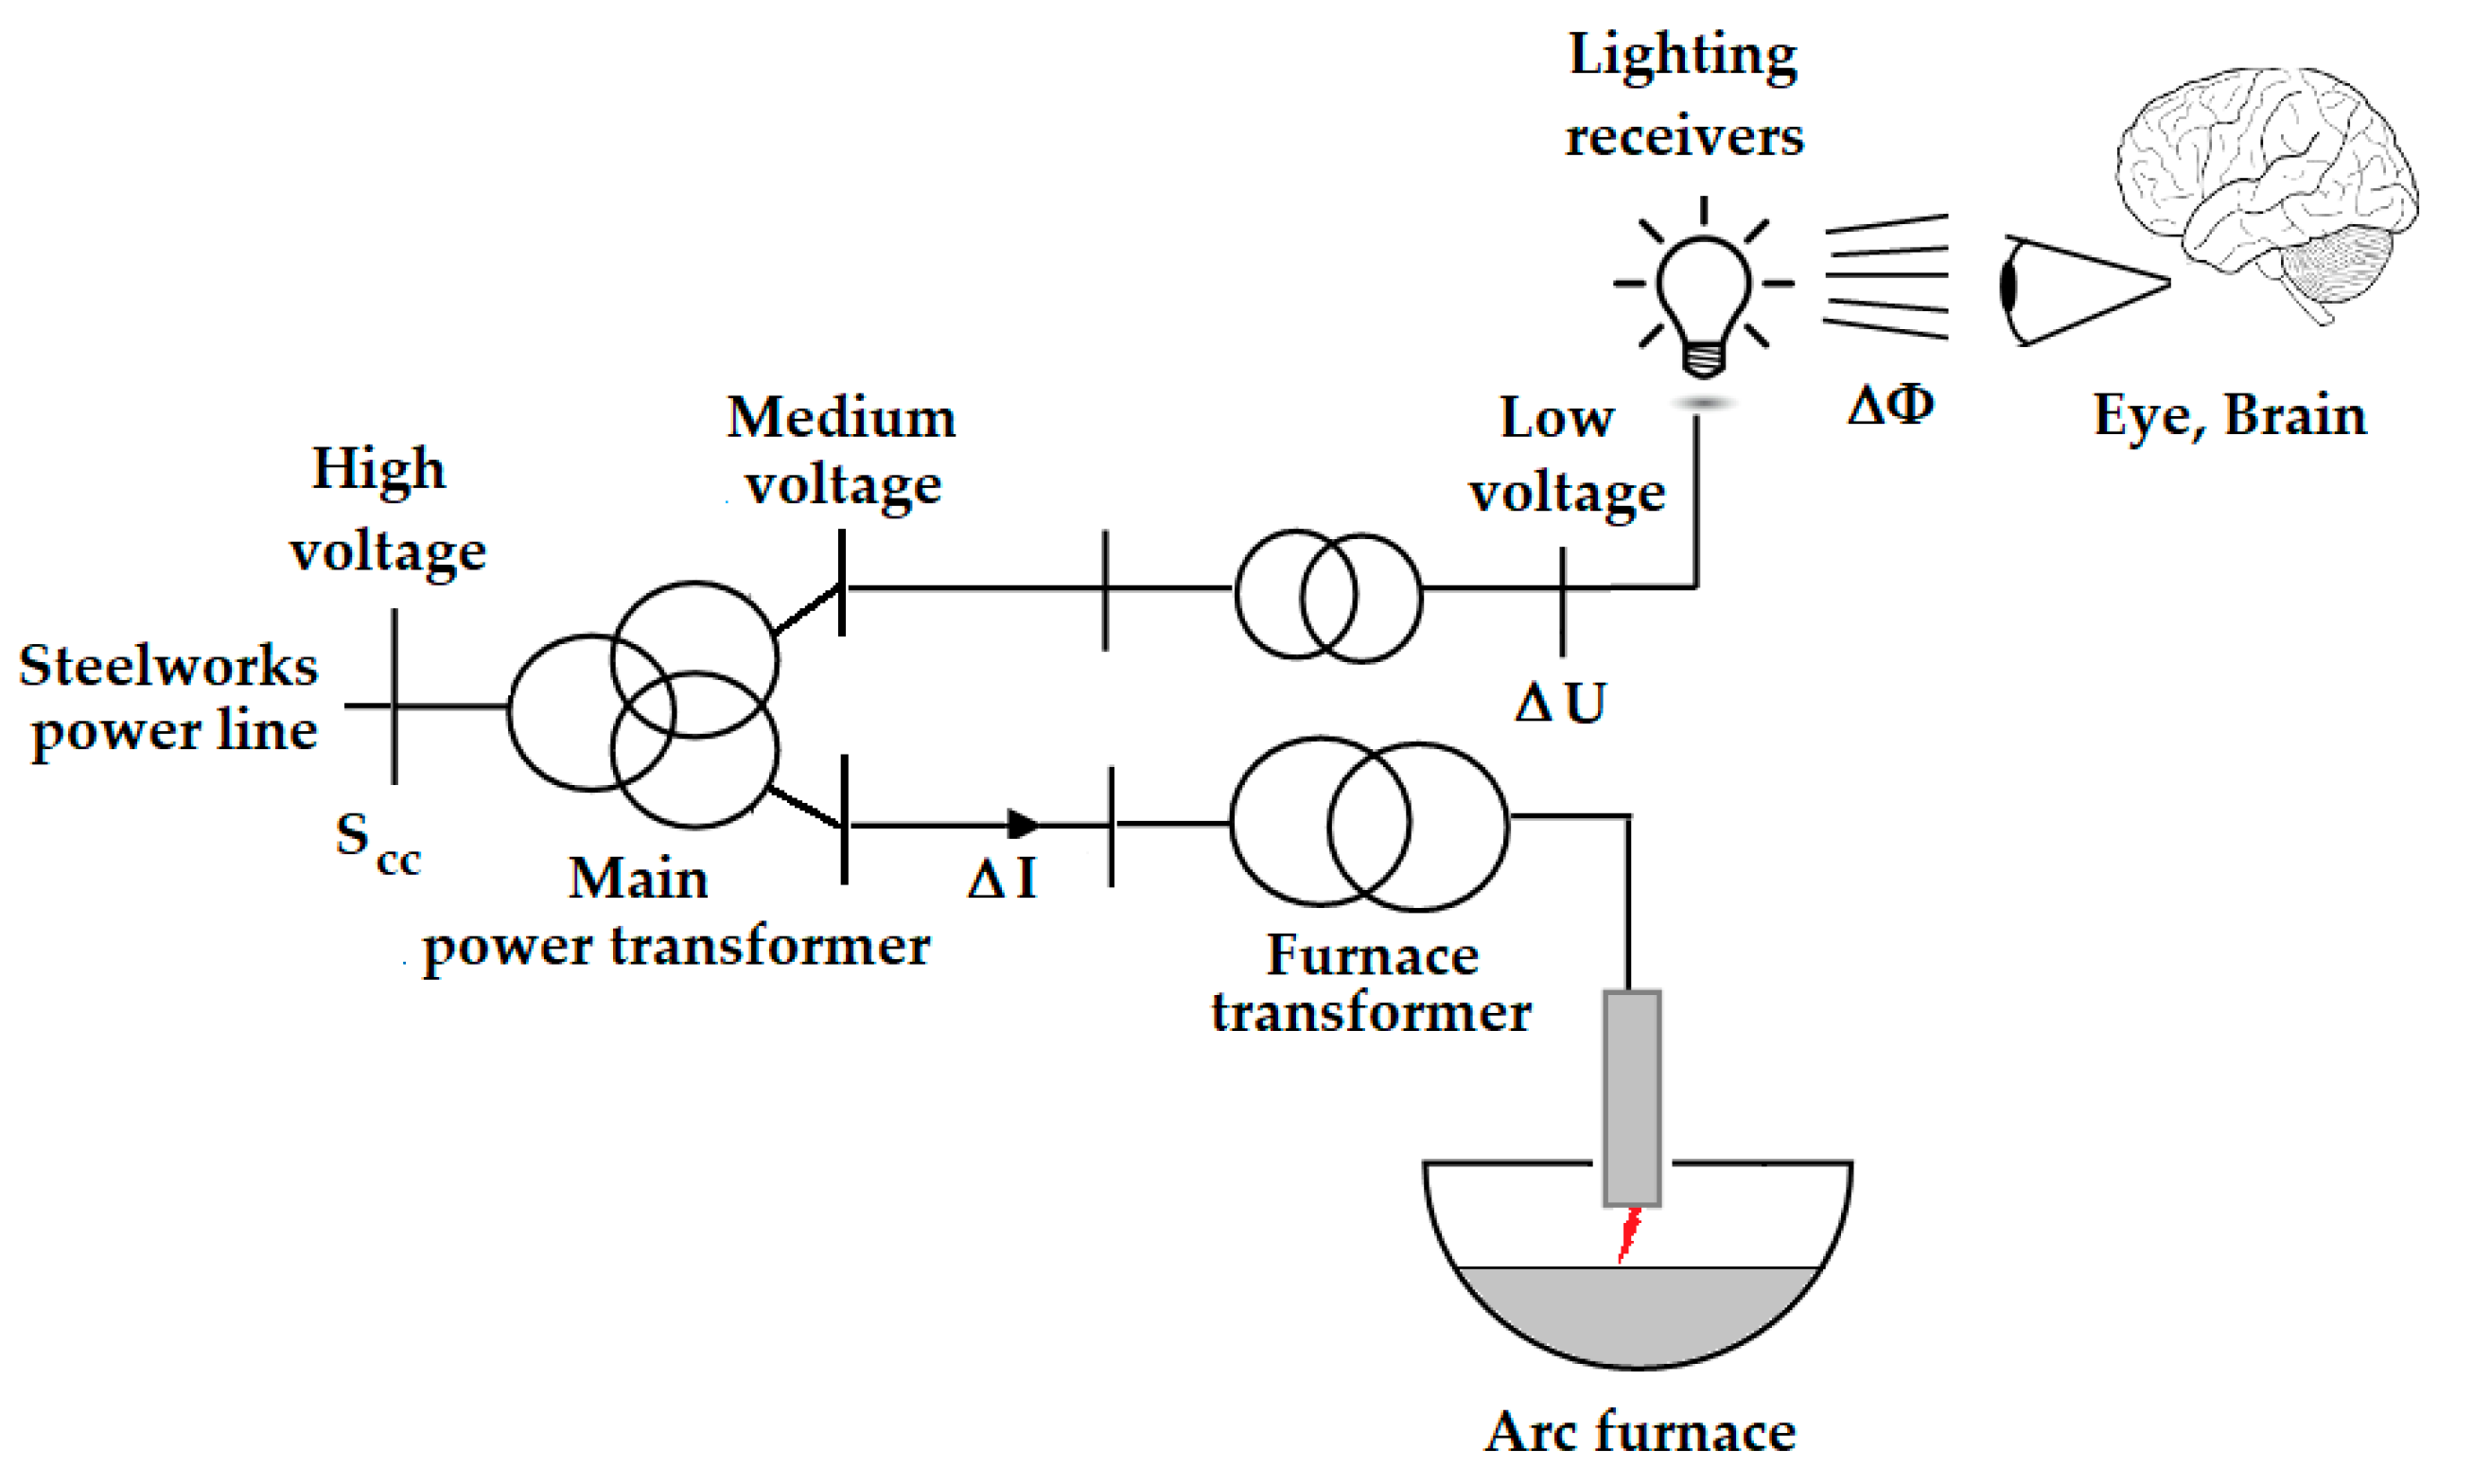
Voltage fluctuations propagate to the supply network and other lines inside the steelworks, including circuits containing lighting receivers—Figure 2. Changes in the voltage supplying lighting receivers cause changes in the luminous flux (ΔΦ), which at a certain amplitude and frequency of changes are noticeable by the human eye, causing the negative effects described above. UIE has established a Committee for the Study of Disturbances (S.C.), composed of experts from various countries. This committee undertook research aimed at assessment of various types of voltage fluctuations, including irregular and time-varying ones, and development of a universal measurement method and regulations for connecting non-static loads to the network. In the first years, several series of comparative measurements were carried out, using measuring devices developed in different countries, to assess their advantages and disadvantages. The effect of long-term experimental and theoretical research was the development of a device for measuring flicker of light, called UIE-flickermeter [29,30].
The purpose of measuring flicker by using a flickermeter is to quantify the degree of flickering caused by changes in the luminous flux due to voltage fluctuations. The input signal of the meter is the voltage measured at the point at which the level of flickering light is assessed. The further operation of the meter is to model the “lamp–eye–brain” system. The measuring device is designed to reproduce the physiological disturbances felt by the person receiving the flux changes produced by the reference lamp, which is a 60 W/230 V bulb.
Two dimensionless quantities form the units of measurement for flicker: short-term flicker severity Pst and long-term flicker severity Plt.
The long-term flicker severity Plt is determined on the basis of the following twelve short-term flicker Pst indicators from Formula (1):
The short-term flicker Pst is determined in a ten-minute period. From the twelve Pst values, the long-term flicker rate Plt for a period of 2 h can be calculated.
Currently, measurements of flicker indicators provide the best way to identify a voltage disturbance that results in the flicker phenomenon. In the case of arc furnaces, the cause of flickering light is voltage fluctuations, the source of which is an electric arc dynamically changing its parameters. The flicker severity assessment uses the direct measurement of flicker indices, and the values of the long-term flicker Plt are compared with the permissible levels given in the relevant standards and regulations [31,32,33,34].
The aim of this article is to evaluate the flicker of light as a result of voltage fluctuations generated by arc furnaces in the power system. In order to estimate network parameters influencing the amount of light flicker, steel plants with different supply conditions (different short-circuit powers) were selected. Several measurement cycles of indicators characterizing the power quality were carried out. Both ten-minute and ten-second measurement intervals were used to record the flicker indicators. The use of measurement intervals of several seconds allowed for a detailed analysis of the impact of arc furnaces on the power system during individual melts. A method for calculating the increase in light flicker in the case of parallel operation of several electric arc furnaces is proposed. The presented method was compared to the method recommended by UIE. In the discussion chapter, reference is made to the Commission Regulation (EU) 2019/2020 European Parliament in relation to the proposed light flicker index PstLM for LED and OLED MLS.
2. Measurement of Flicker of Light Indicators
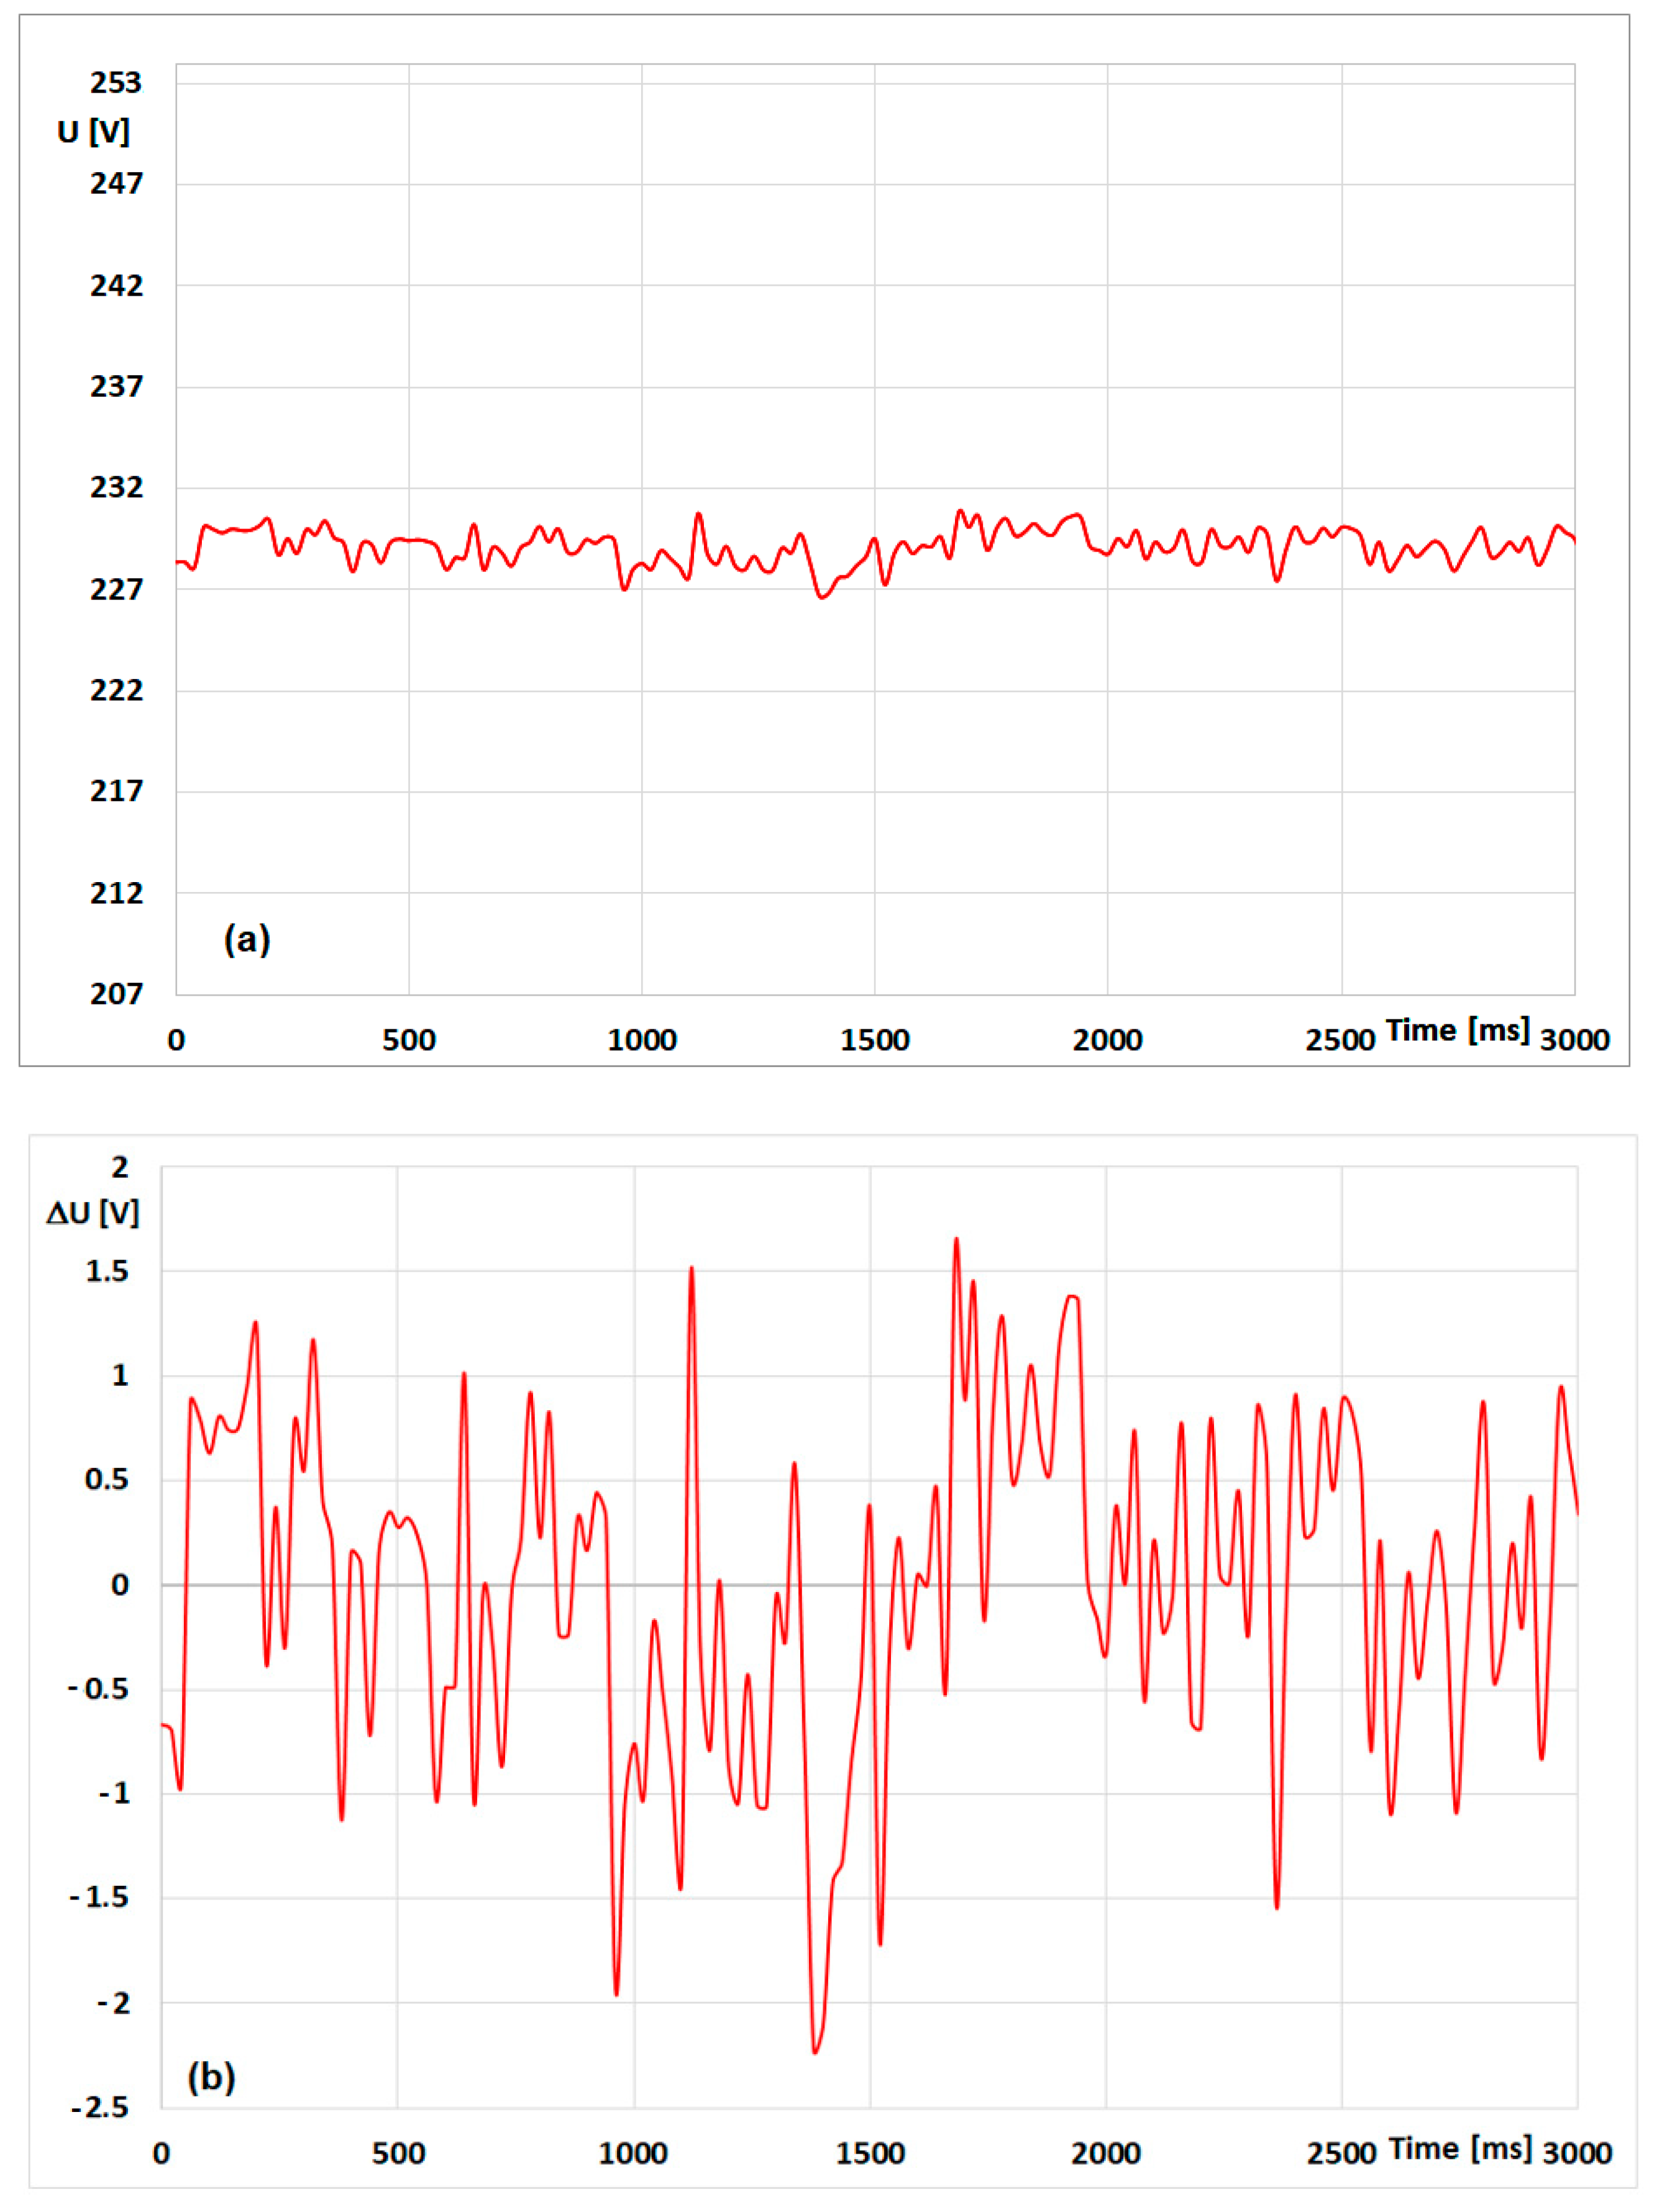
Measurements of flicker indicators in real conditions allow the best assessment of the influence of voltage fluctuations generated by arc furnaces on the formation of the flicker phenomenon. Figure 3 shows the power supply diagram of a steel plant with an electric arc furnace (EAF) with a transformer capacity of 20 MVA and a device for secondary steel processing (ladle furnace—LF) with a transformer capacity of 5 MVA. Figure 3 also shows the connection points of electricity quality analyzers. The following analyzers were used in the research: Memobox 686, Memobox 800 and QWave. A computer measuring system was used to record the voltage and current waveforms. The flicker of light indicators were registered simultaneously at four points: Point A (Un-110 kV/SSC-5000 MVA)—the main line supplying the smelter, Point B (Un-30 kV/SSC-750 MVA)—supply line for the arc furnace (EAF), Point C (Un-6 kV/SSC-500 MVA)—supplying the ladle furnace (LF), Point D (Un-230 V)—circuits supplying lighting receivers. Measurements were made both in long measurement periods (including one week of recording) and short measurement periods for individual melts in the arc furnace. Ten-minute measurement intervals were used for the weekly recording cycle and five-second intervals for the recording of individual melts. Conducting the tests with shortened time intervals (5 s and 10 s) was aimed at more precise determination of changes in the light flicker indicators during the smelting. Parallel to the measurements of light flicker indicators, other parameters characterizing the quality of electricity were recorded.
The article also presents an analysis of disturbances caused by arc devices in a steelworks powered by a Un = 400 kV line with a short-circuit power of SSC = 8774 MVA. The steel plant is powered by a line with a voltage of U = 110 kV and a short-circuit power SSC = 1512 MVA.
On the basis of the recorded data of electricity quality parameters, the following were obtained: evaluation of the propagation of disturbances caused by arc furnaces (mainly light flickering phenomena), statistical analysis of changes in light flicker indices, estimating the value of the KN coefficient determining the increase in voltage fluctuations with a different number of arc devices working in parallel.
Direct measurement of flicker indicators, simultaneously at several points in the energy system, seems to be the easiest way to determine propagation. However, it has some limitations. First of all, this method of propagation analysis uses several light flicker meters (in the case of an extensive energy system), the unit price of which is quite significant. Secondly, this method must have several measuring points available at the same time, in which the meters must be time-synchronized with each other. The indirect (computational) method is used to determine the change of voltage fluctuations on the basis of the network parameters and the light flicker indices registered at the reference point. The considered system takes into account the case where the network is of the radial type and the flicker source is connected at the end of the track (single furnace or group of furnaces). The advantage of the presented method is mainly due to the fact that the flicker emission of the considered disturbed load relates directly to the short-circuit power of the network. The UIE guide suggests, as a compromise between the required accuracy and difficulties in obtaining measurement data, the use of an approximate assessment based on the short-circuit power ratio at the points in the network under consideration [5].
3. Propagation of Disturbances Generated by the Arc Furnace
Issues related to the propagation of disturbances caused by arc furnaces have been presented, among others, in publications [35,36,37,38]. Assessment of the individual emission of voltage fluctuations caused by a single arc furnace, at different voltage levels, can be made on the basis of direct measurements of the flicker indicators. In this way, the actual propagation transfer coefficient TCPstAB is defined [39].
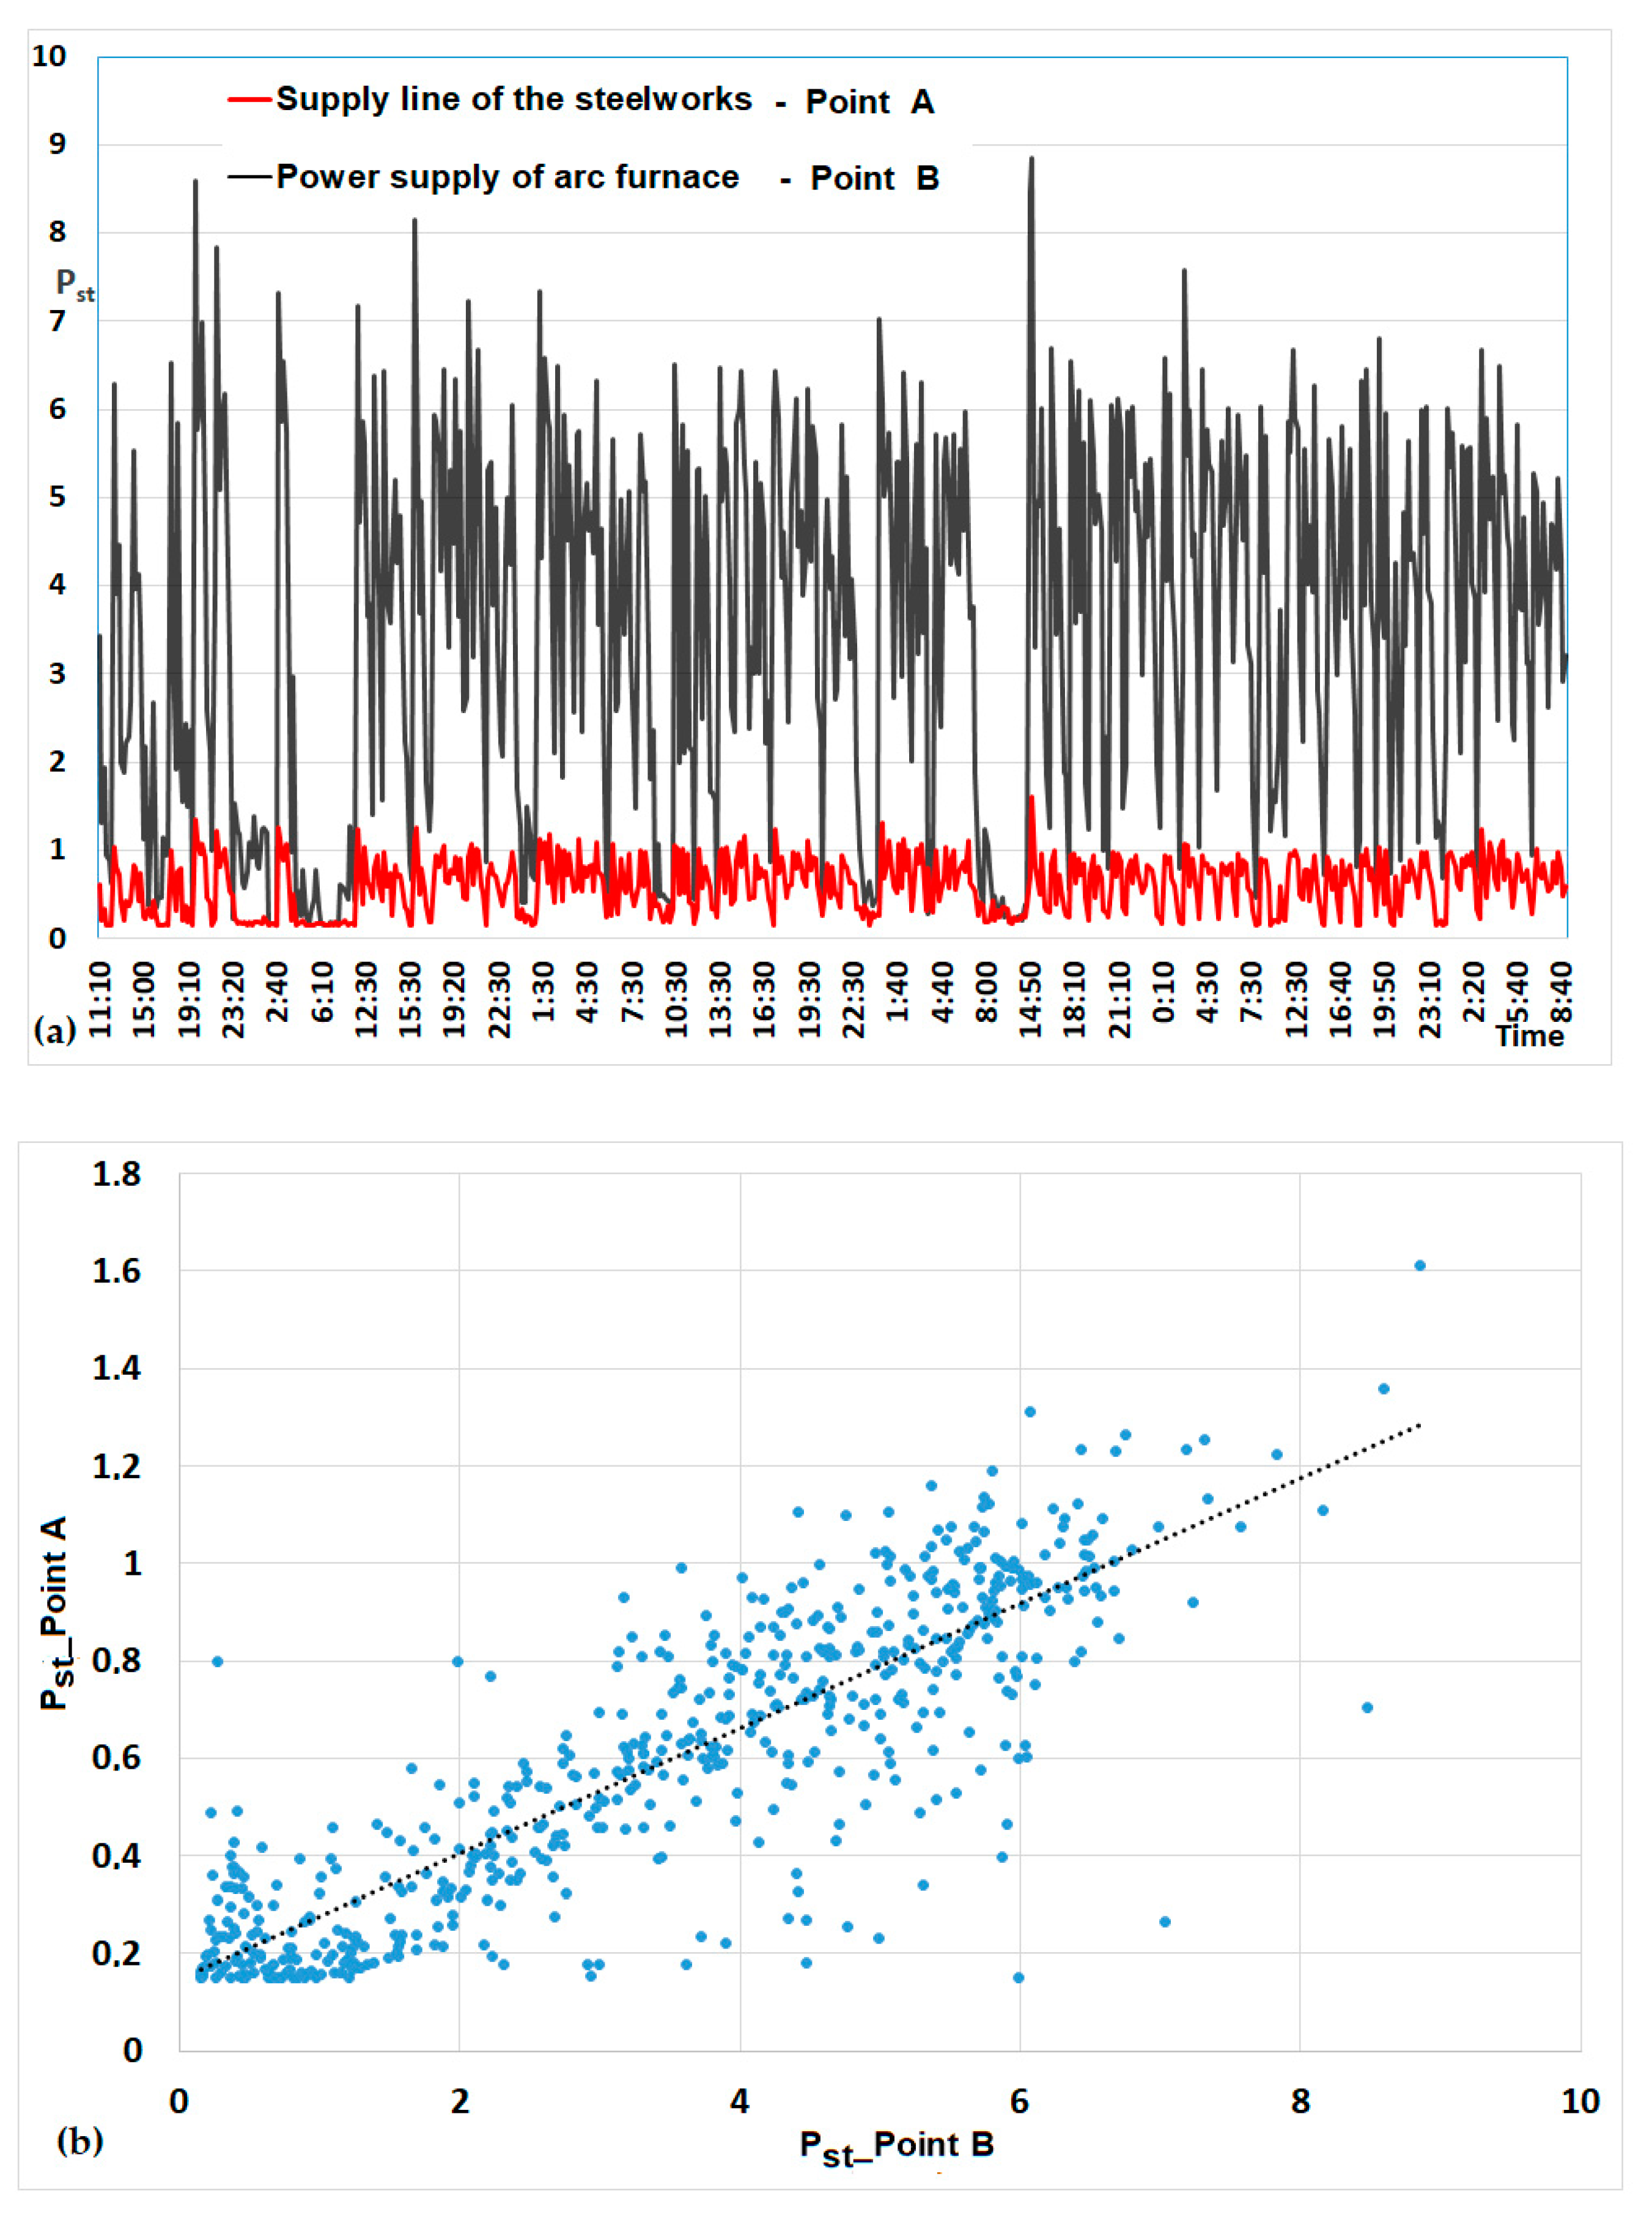
Figure 4 shows changes in short-term flicker Pst measured during one week at point A (110 kV line supplying the steelworks) and point B (30 kV line supplying EAF)—Figure 3.
The correlation coefficient between the short-term flicker severity Pst recorded at the voltage level: 110 kV and 30 kV is 0.86. Based on Formula (2), the following were determined: TCPstABmax = 0.18 and TCPstAB 95% = 0.17.
Figure 5 shows the short-term flicker Pst waveforms measured during one smelting process at point A (110 kV line supplying the steel plant) and point B (30 kV line supplying EAF).
The correlation coefficient between the short-term flicker severity Pst recorded at the voltage level: 110 kV and 30 kV is 0.98. Based on Formula (2), the following were determined: TCPstABmax = 0.20 and TCPstAB95% = 0.19.
The basic parameters for determining voltage fluctuations in point A (Figure 3) there are short-circuit powers SSC(A), SSC(B) and Pst(B)—indicators of short-term flicker of light measured at the reference point. The TCAB propagation coefficient can be calculated from the Formula (3):
Substituting into the formula (B) the values of the short-circuit powers in points A (Figure 3)—SSC(A) = 5000 MVA and B; SSC(B) = 750 MVA—we get:
which allows for the determination of the theoretical values of the index in point A on the basis of measurements at point B:
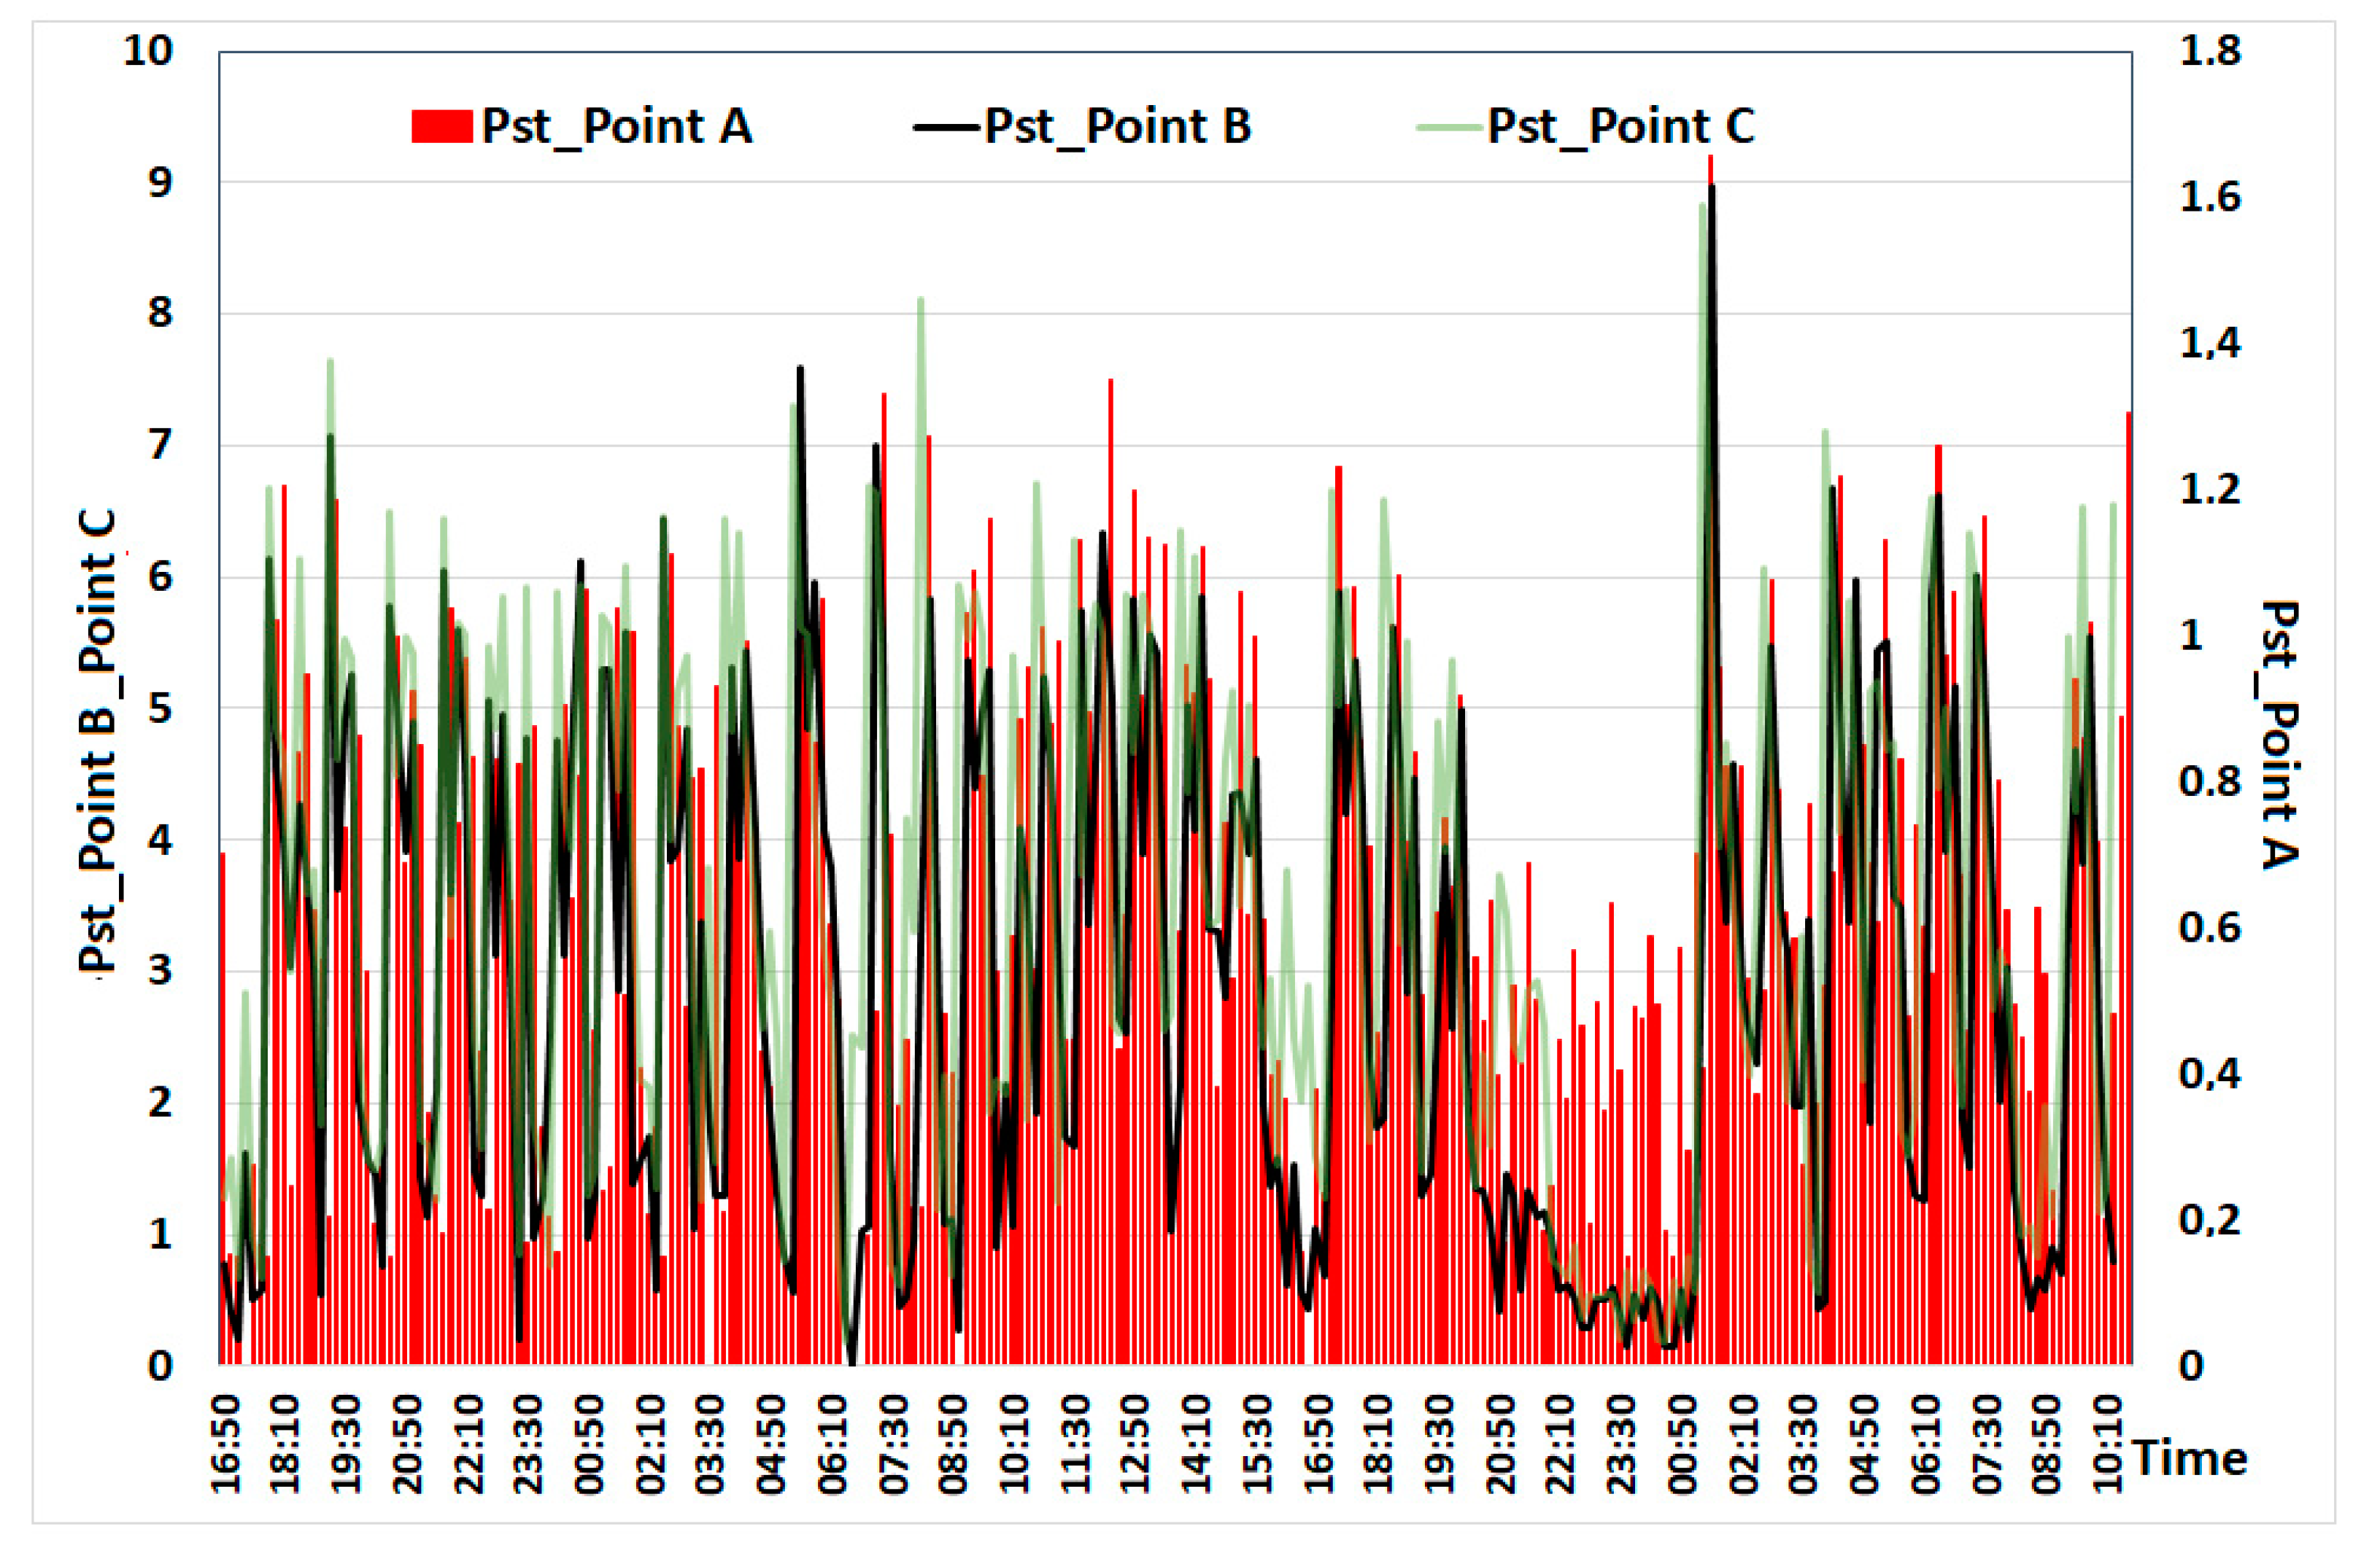
Figure 6 shows changes of Pst short-term flicker severity recorded simultaneously during one week of measurements at three points: steelworks supply line—point A, EAF supply line—point B, LF supply line—point C.
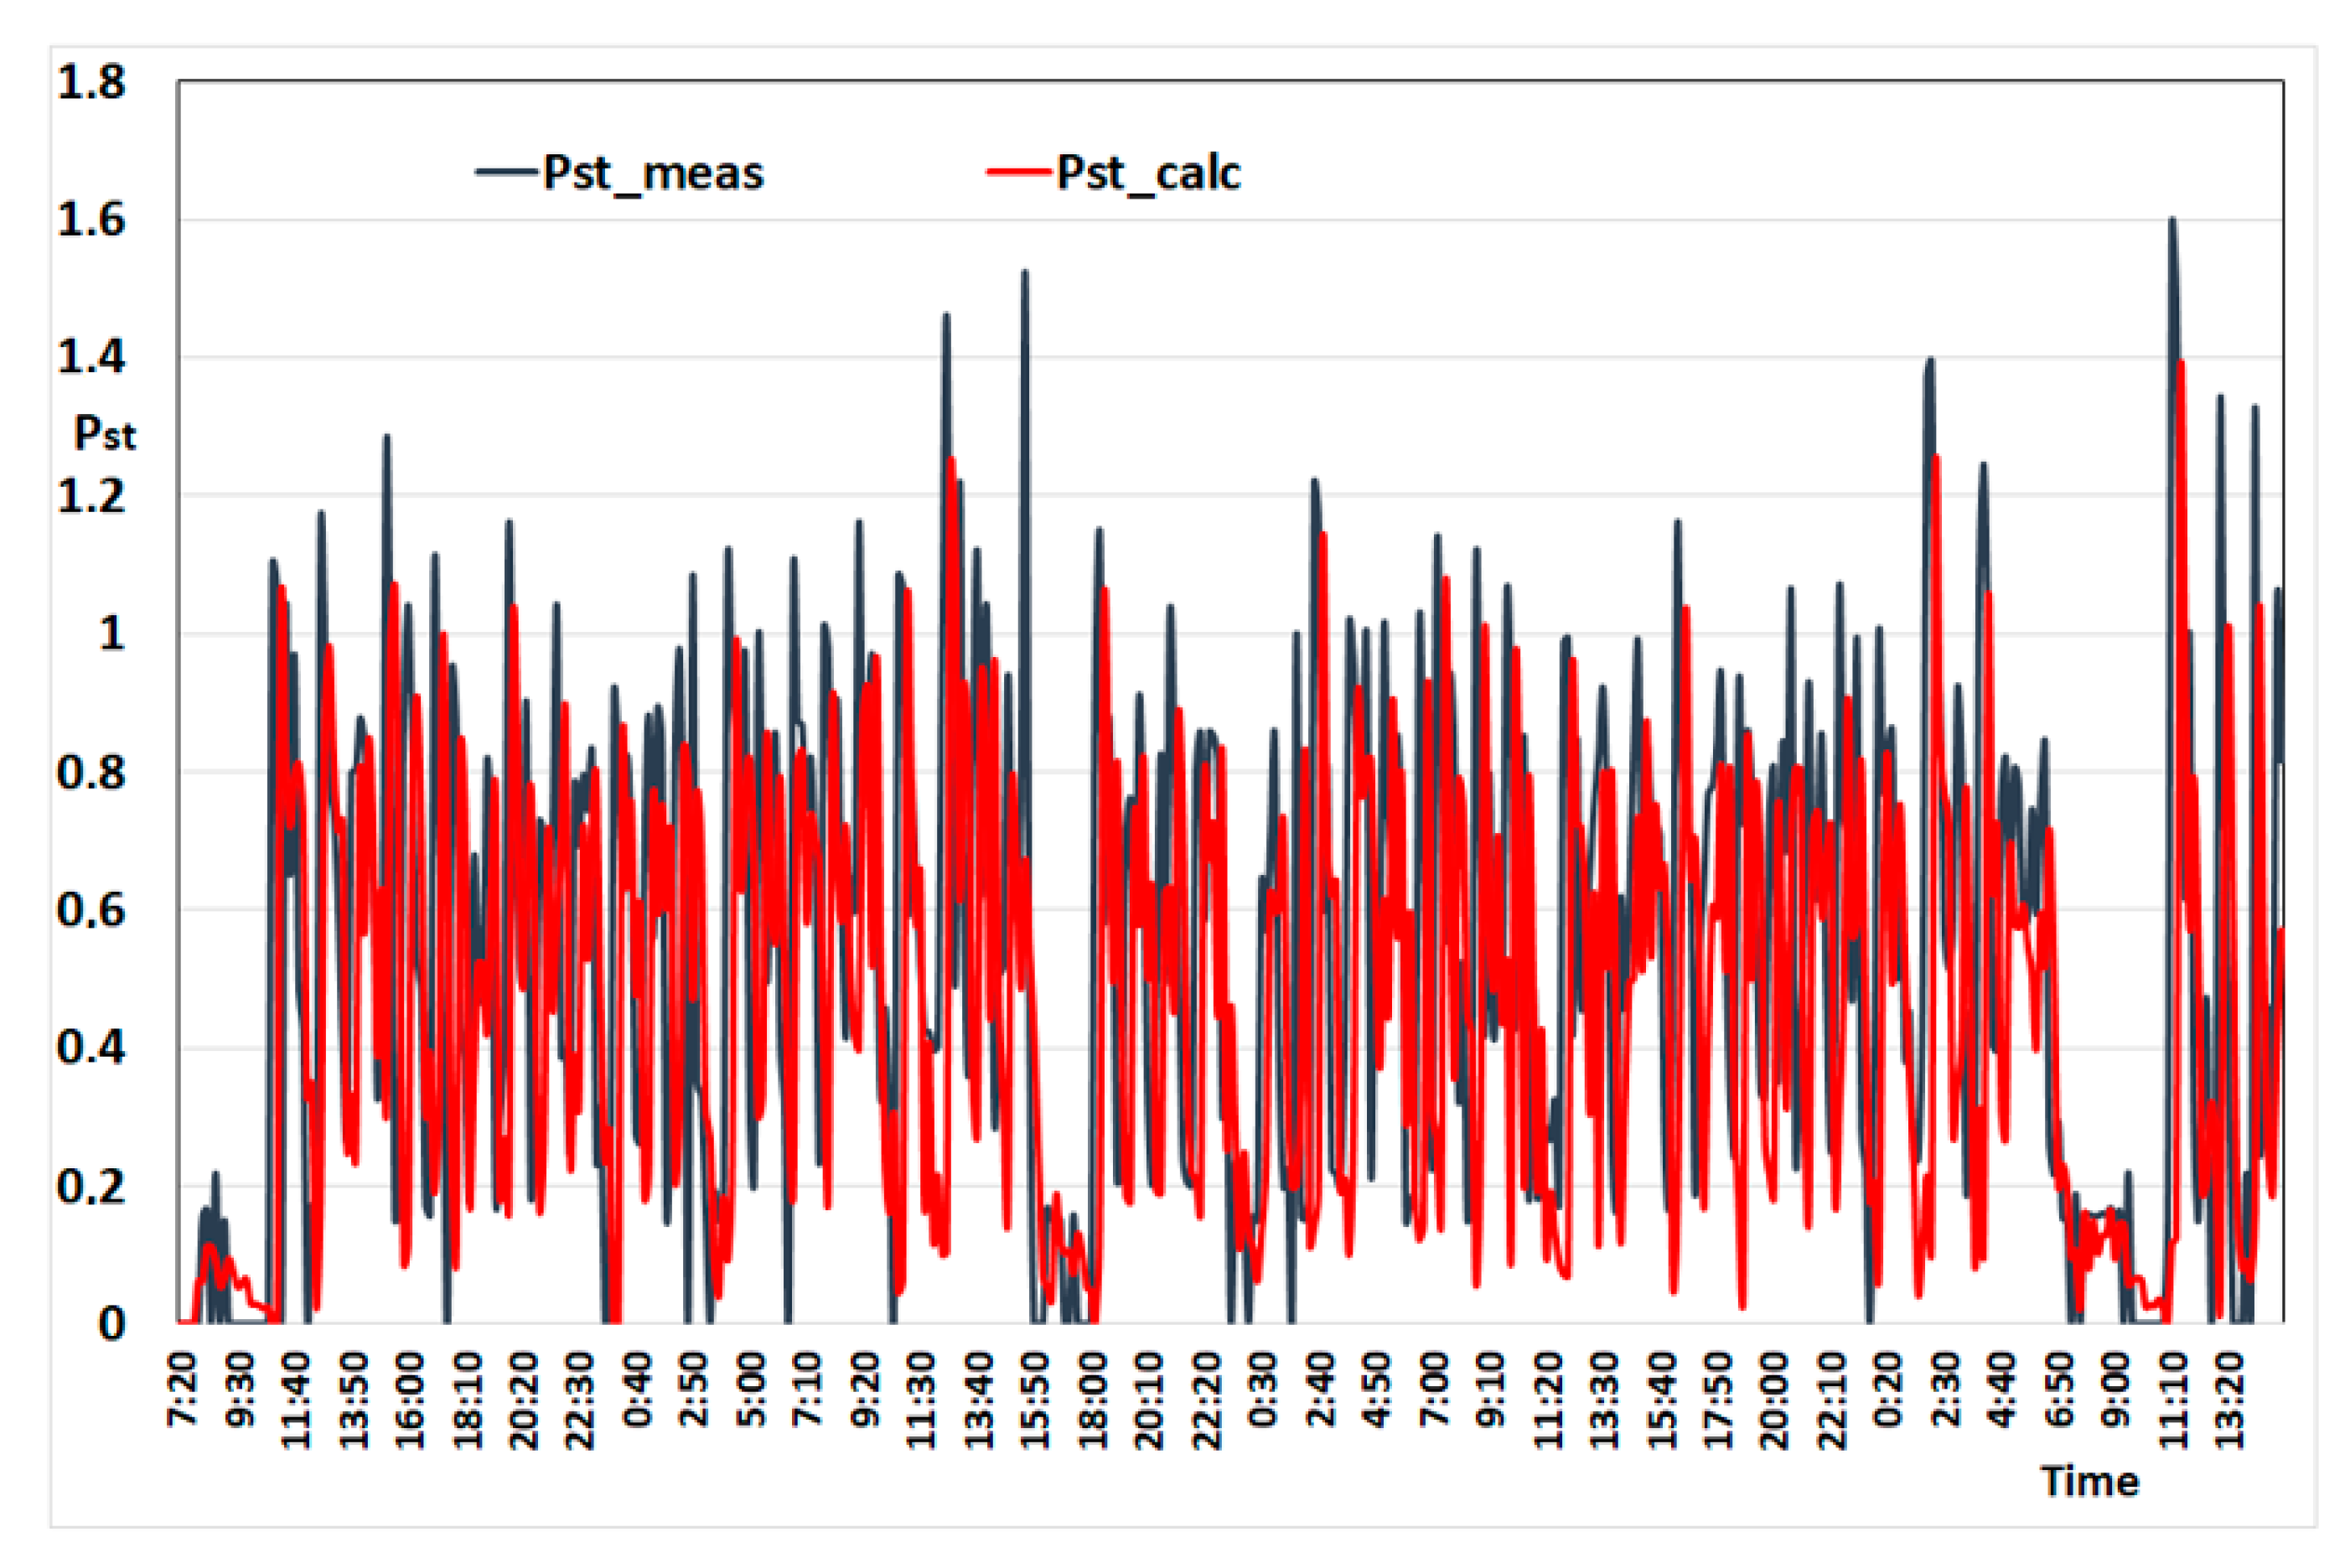
In Figure 7, the waveforms of light flicker indicators measured in the supply network of the steel plant Pst_Point B and the supply network of the steelworks Pst_Point A-cal were presented, as well as the theoretically determined by the Formula (5)—Pst_Point A-cal. Only the Pst_Point-meas and Pst_110 kV-cal indicators are compared.
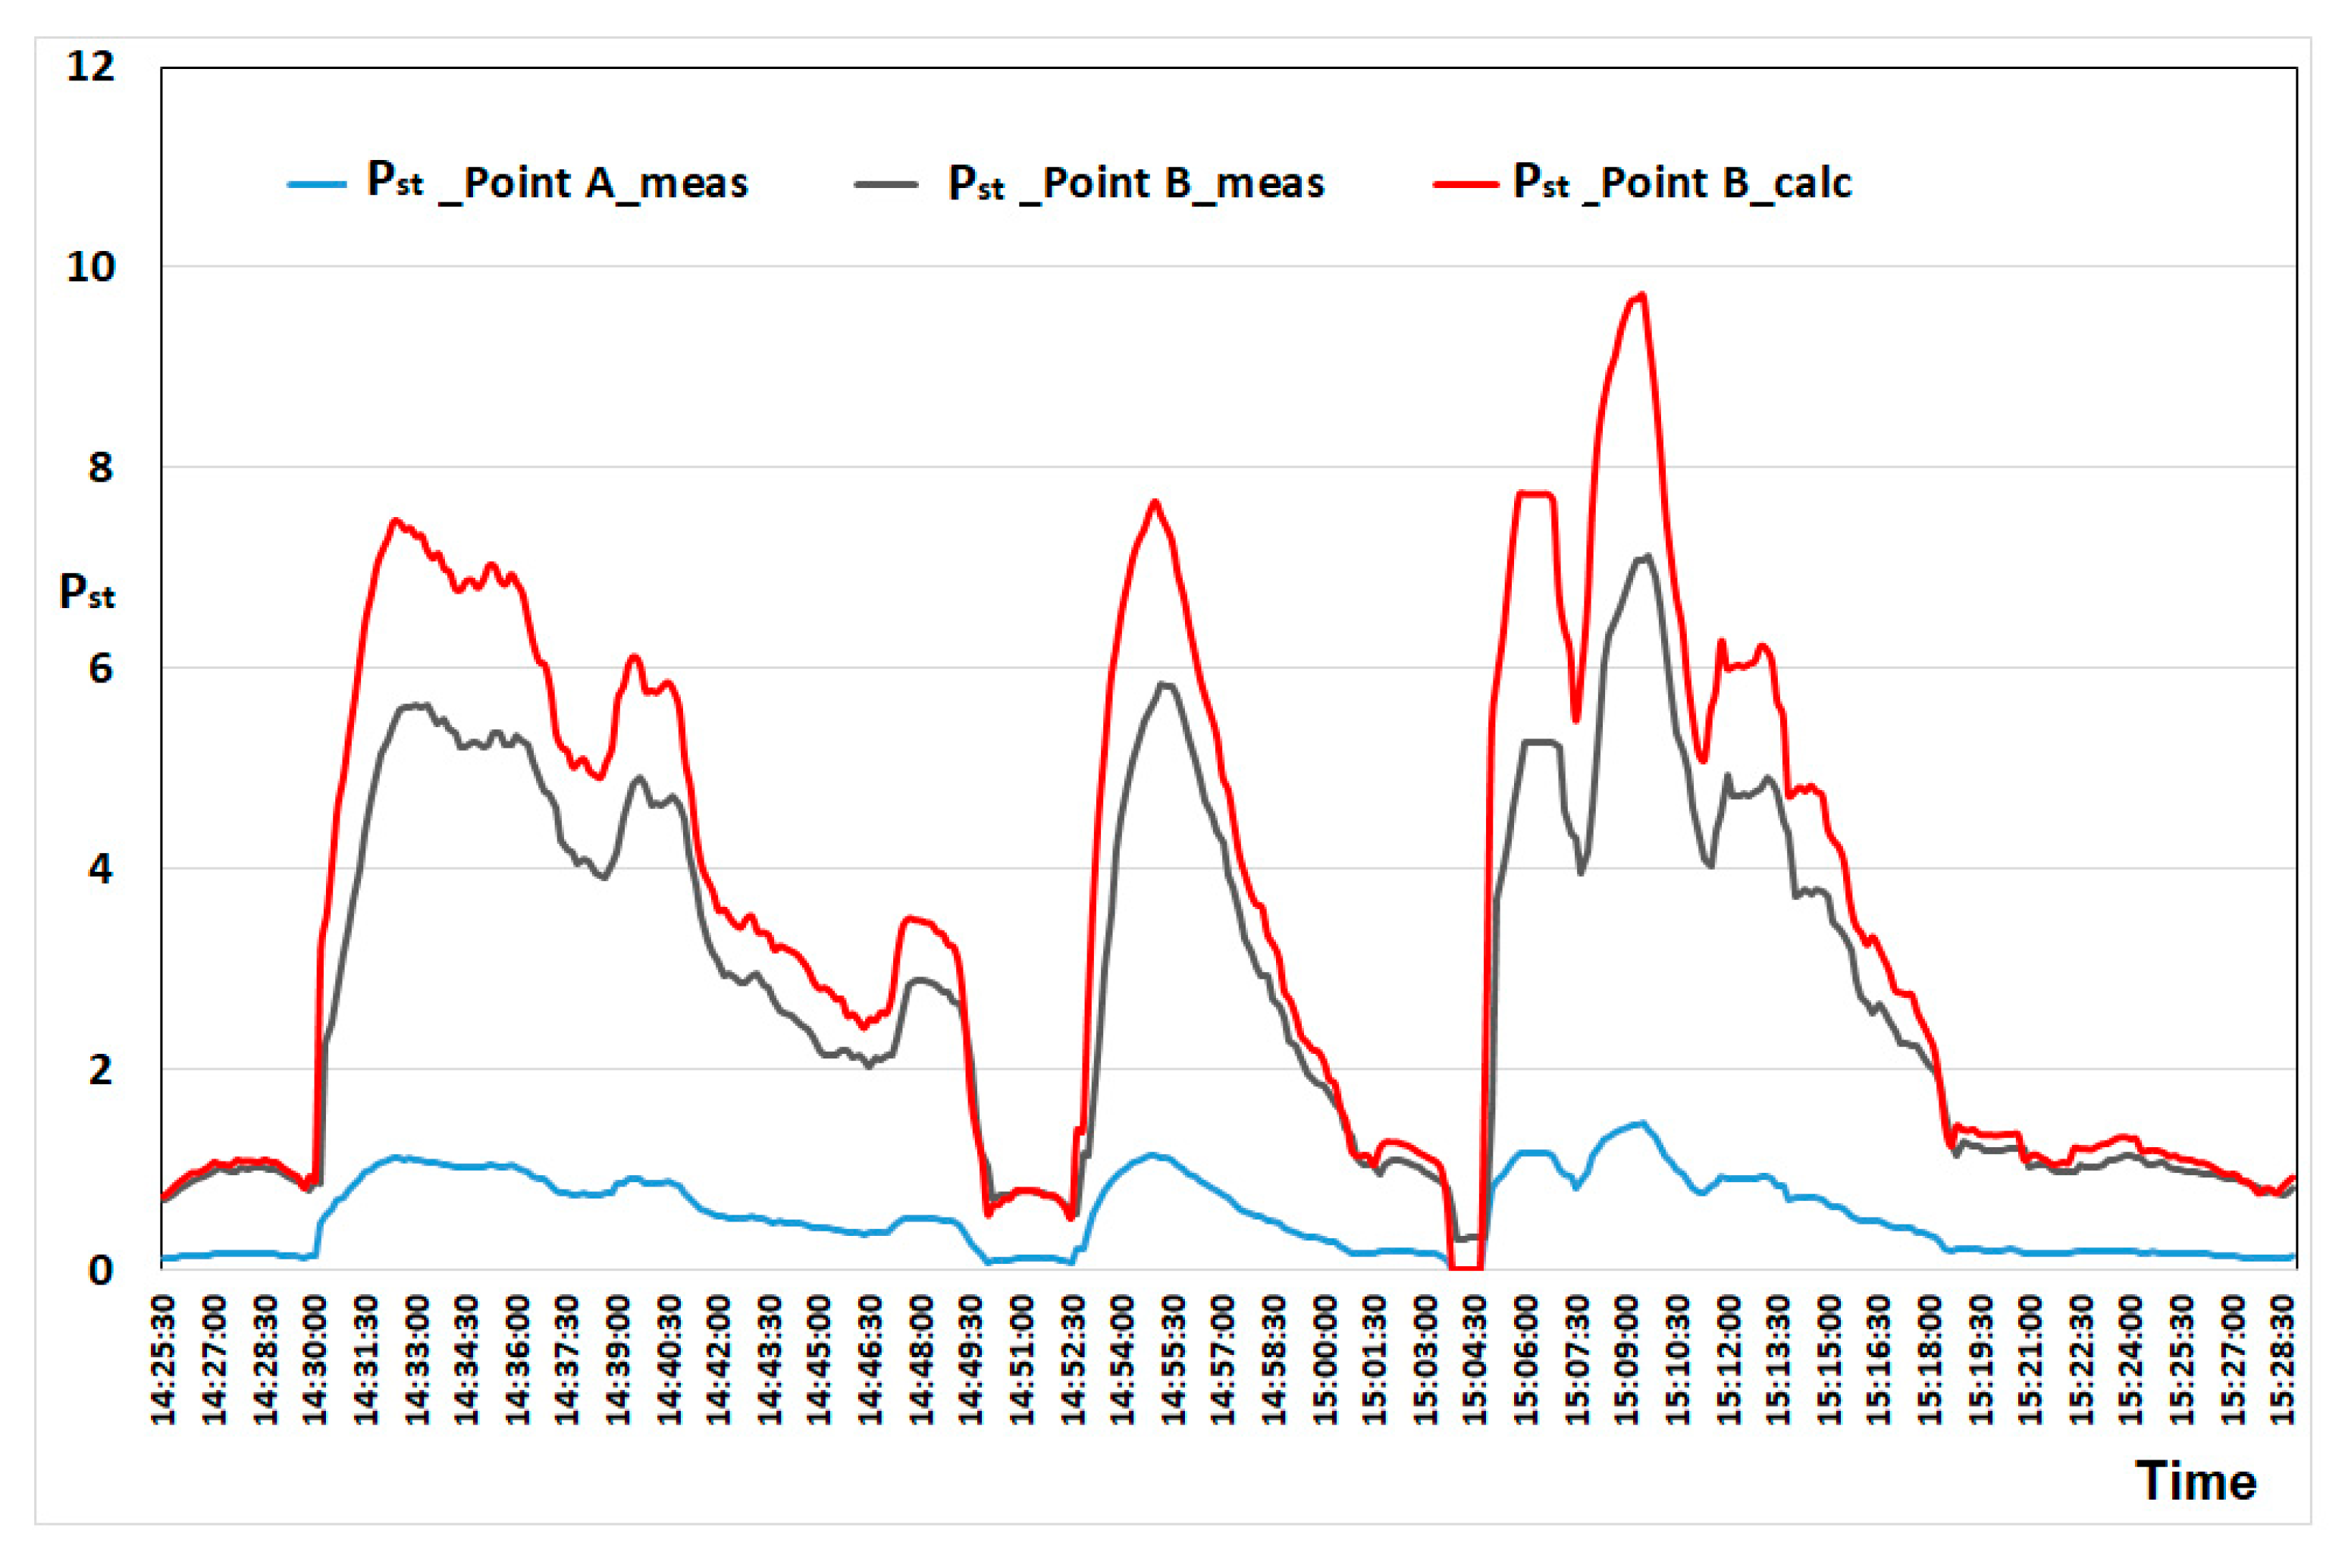
Figure 8 shows changes of Pst short-term flicker severity recorded simultaneously during one week of measurements at two points: steelworks supply line (Pst_Point A_meas), EAF supply line (Pst_Point B_meas) and determined by Formula (5) (Pst_Point B_cal).
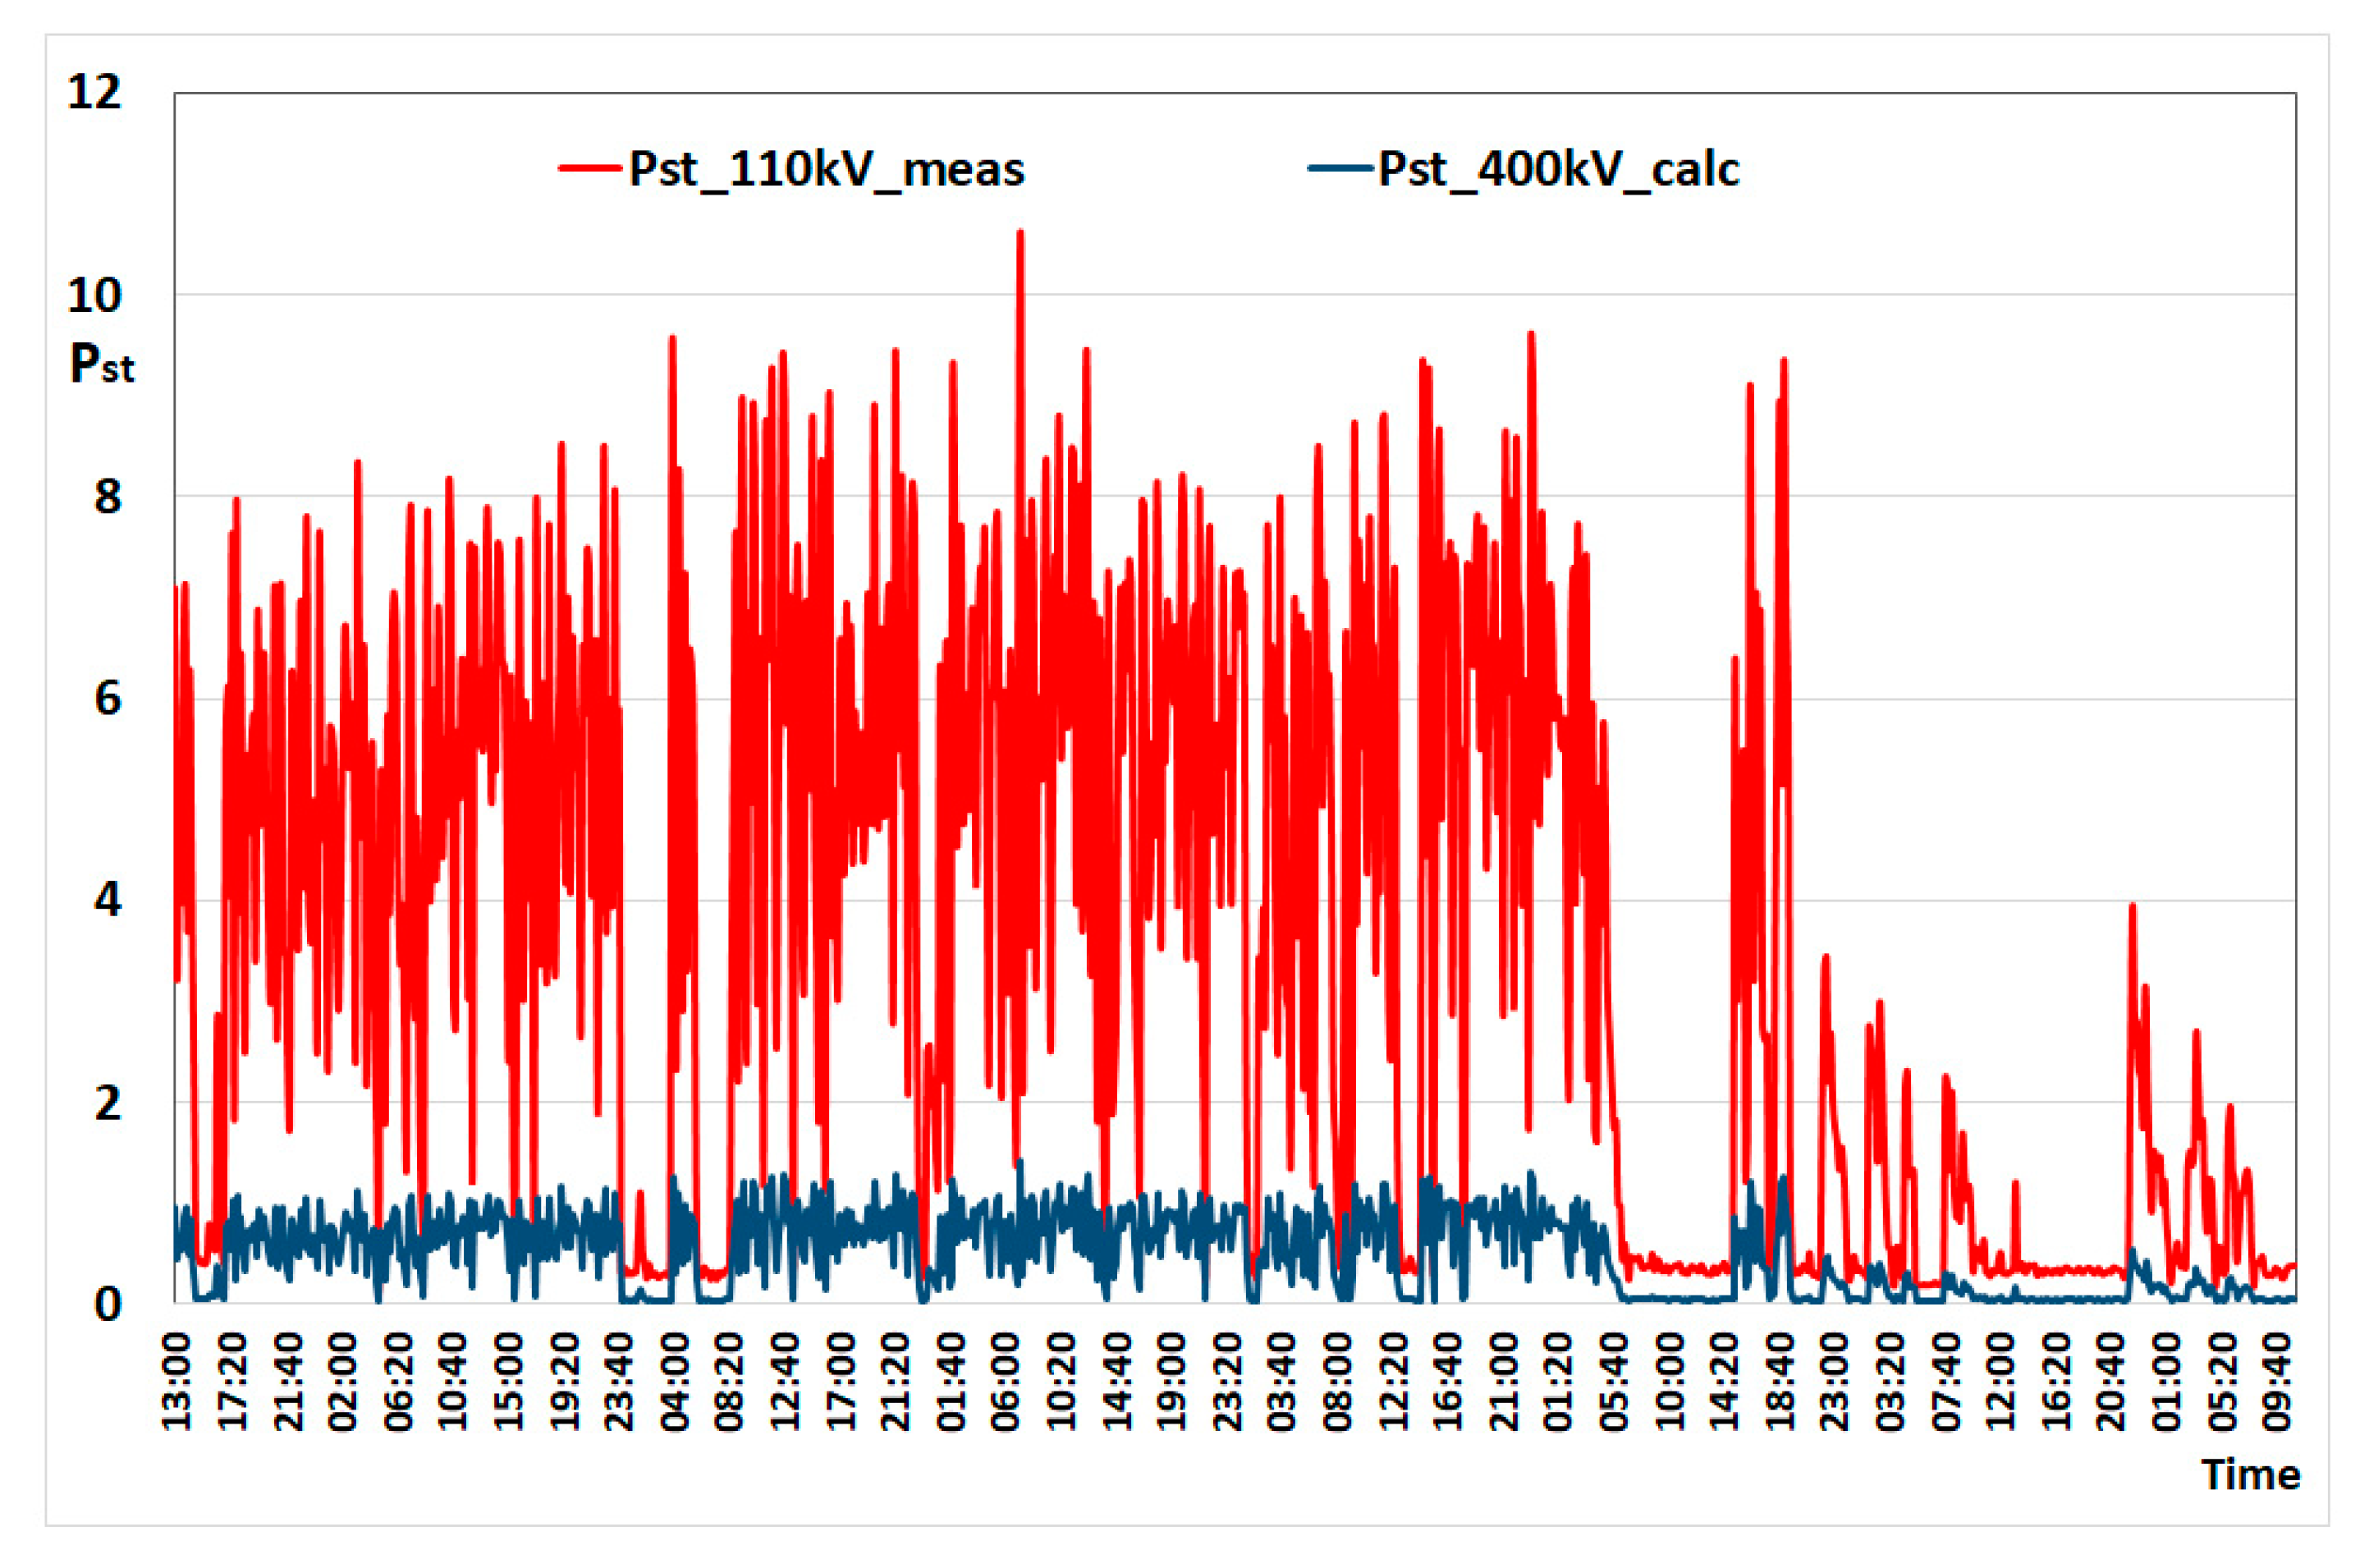
The article also presents an analysis of disturbances caused by arc devices in a steelworks powered by a 400 kV line with a short-circuit power of SSC = 8774 MVA. The steel plant is powered by a line with a voltage of U = 110 kV and a short-circuit power SSC = 1512 MVA. There are three arc furnaces and two ladle furnaces operating in the steelworks.
The flicker indicators were measured at the voltage level of 110 kV. From the Formula (6), the propagation coefficient between the line supplying the steelworks with a rated voltage of 400 kV and the line supplying the steel plant was determined. The propagation factor is then:
With the measurement data of the flicker indicators at the level of 110 kV, the values of the indicators at the level of 400 kV can be determined:
Figure 9 shows changes in flicker indicators recorded during one week and determined theoretically with the calculated TCAB = 0.17 propagation coefficient.
Based on the measurement results, the following attenuation coefficient C values between individual voltages were proposed in [5]:
- -
- from extra high voltage (EHV) networks to high voltage (HV) networks propagation factor equals C = 0.8;
- -
- propagation factor from high voltage (HV) networks to medium voltage (MW) networks equals C = 0.9;
- -
- from medium voltage (MW) networks to low voltage networks (LW) propagation factor equals C = 1.
The above C attenuation coefficient take into account only the influence of the transformer, while the influence of the compensator or series reactor, for example, is neglected.
The publication [40] presents the formula for Pst99% taking into account the above factors:
where
and
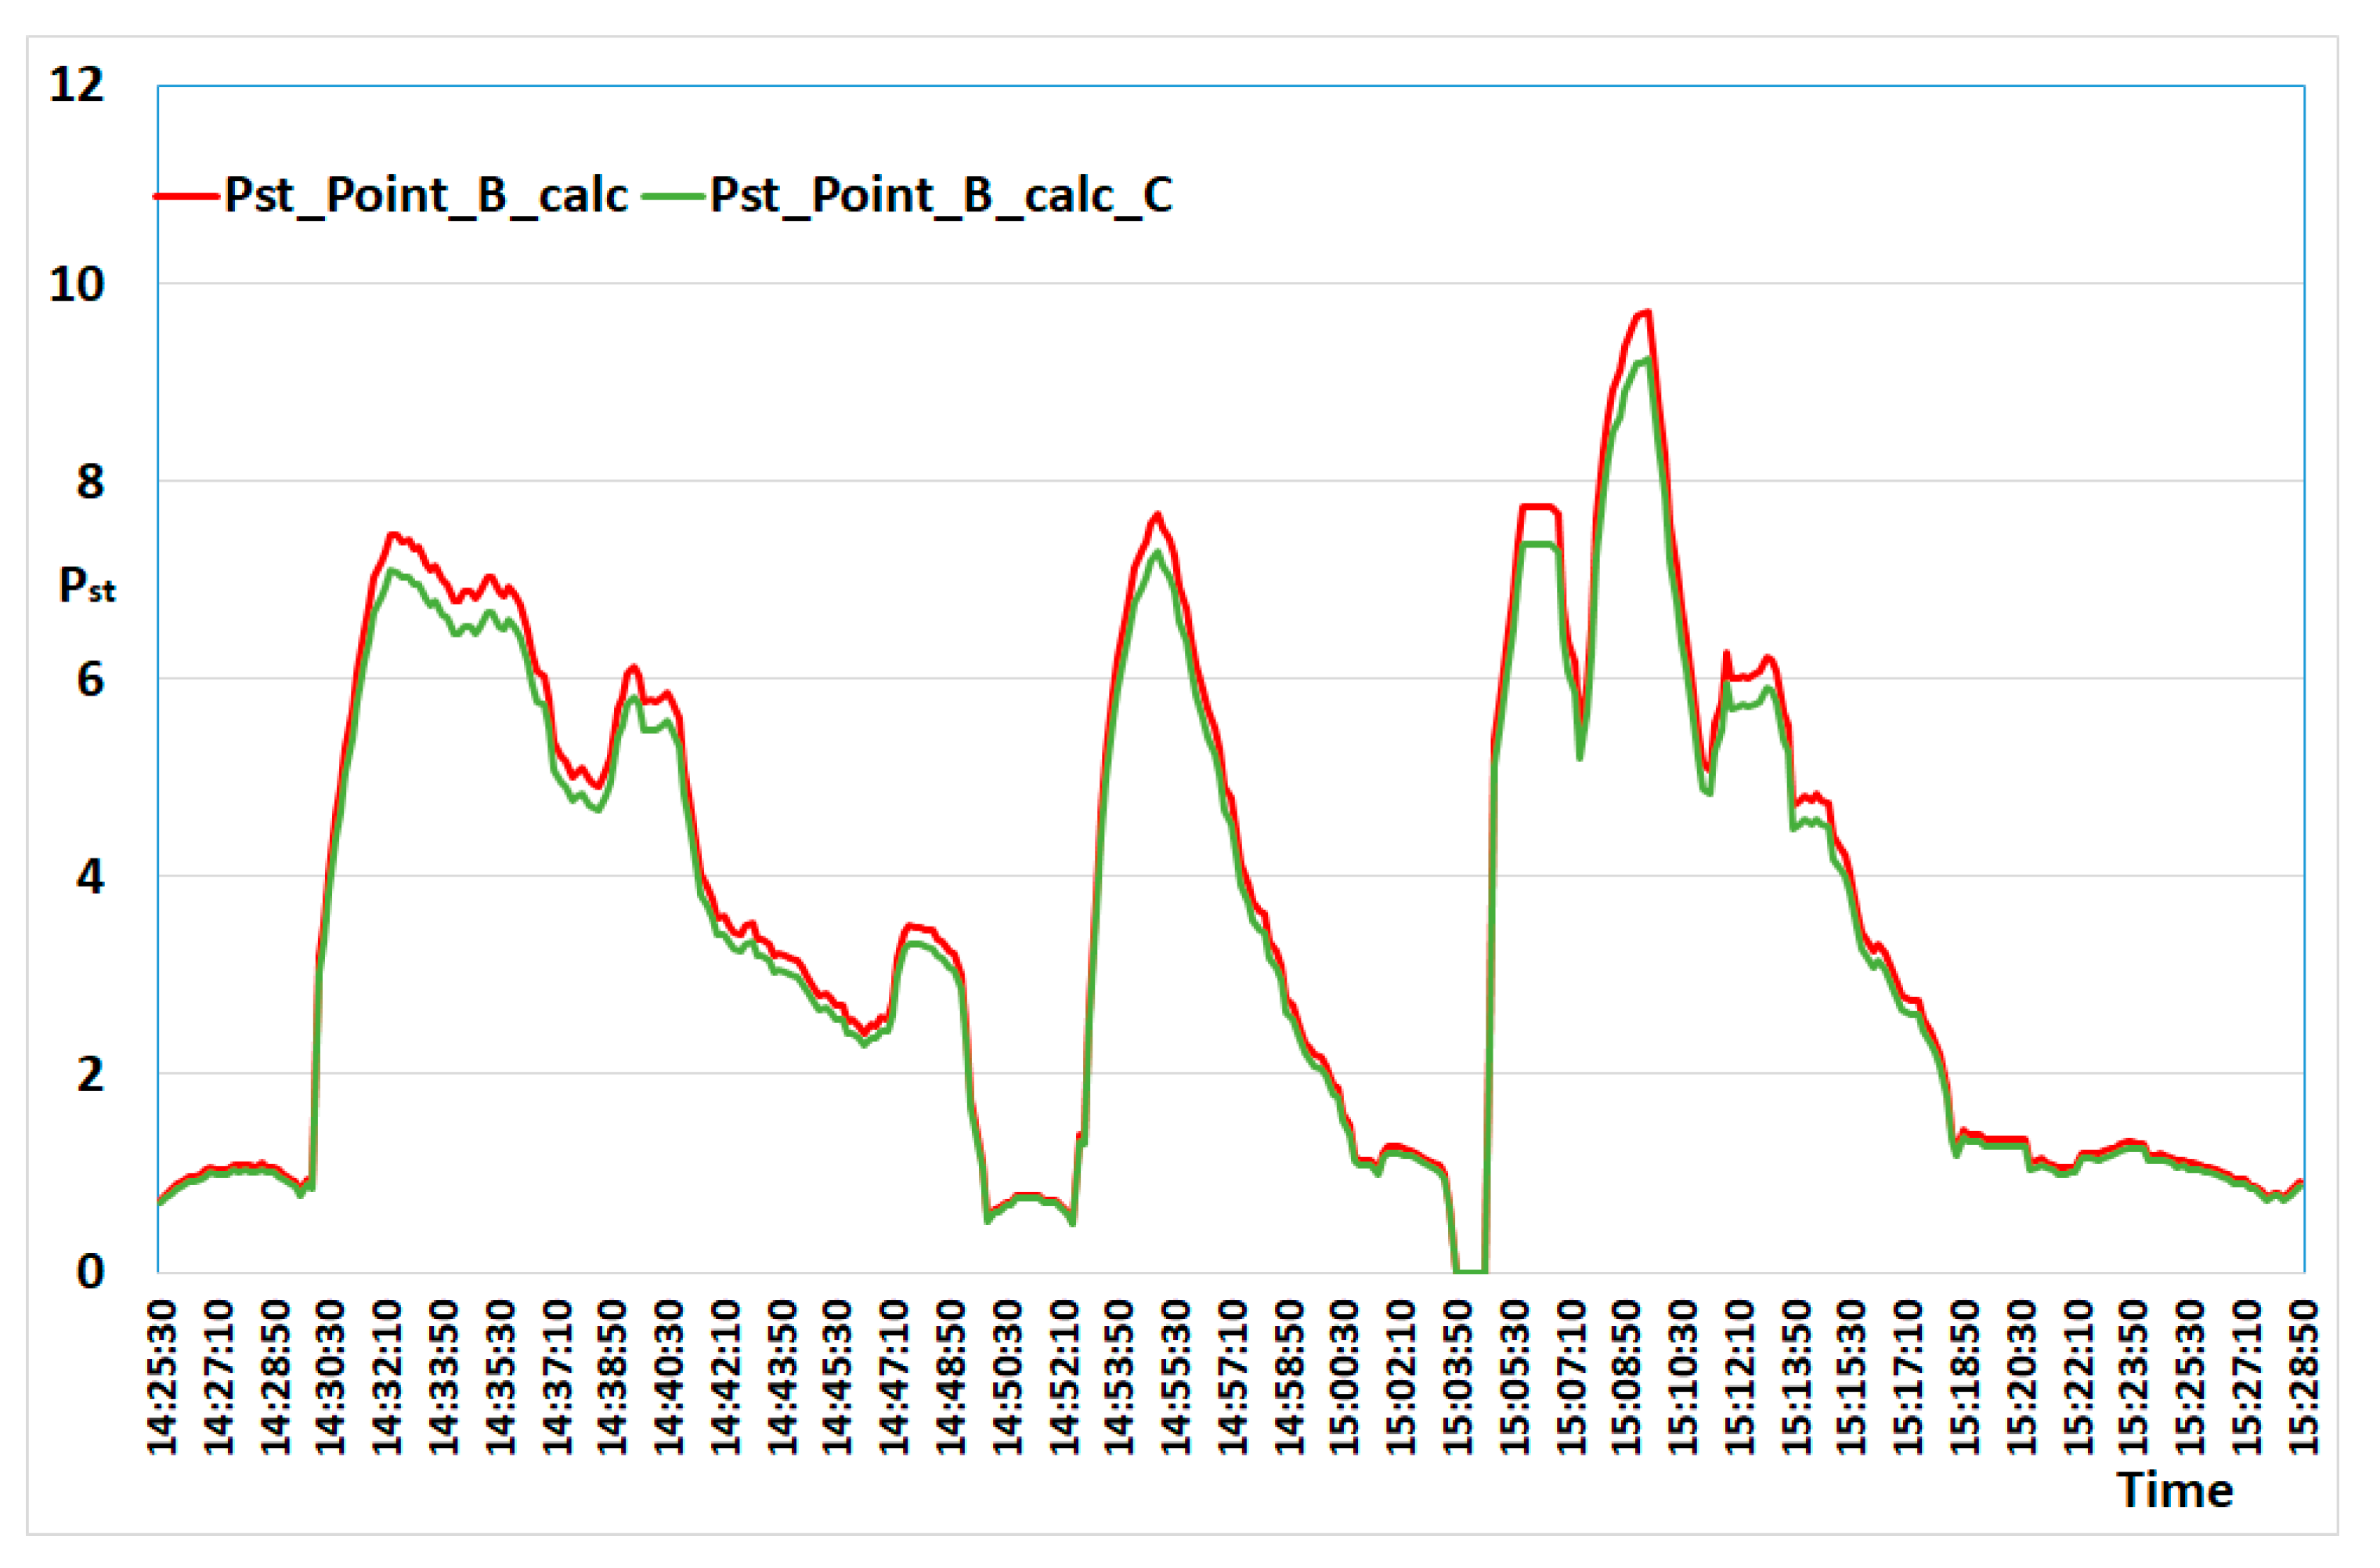
Taking into account that the propagation factor C from high-voltage (HV) networks to medium-voltage (MW) networks equals C = 0.9, we corrected the theoretically determined course of the flicker Pst_Point B_calc shown in Figure 8.
Figure 10 compares the theoretical courses of the Pst_Point_B_calc light flicker indices determined on the basis of the Formula (5) and Pst_Point B_calc_C corrected for the attenuation factor C = 0.9.
In the analyzed supply system arc furnace, voltage fluctuation compensation devices were not installed.
4. Statistical Analysis of Flicker of Light Indicators
Statistical analysis of light flicker indices in networks supplying arc furnaces is presented by the authors of [41]. An analysis was performed for 10-minute measurement intervals of the flicker indicators. Measurement cycles included long measurement periods—one week.
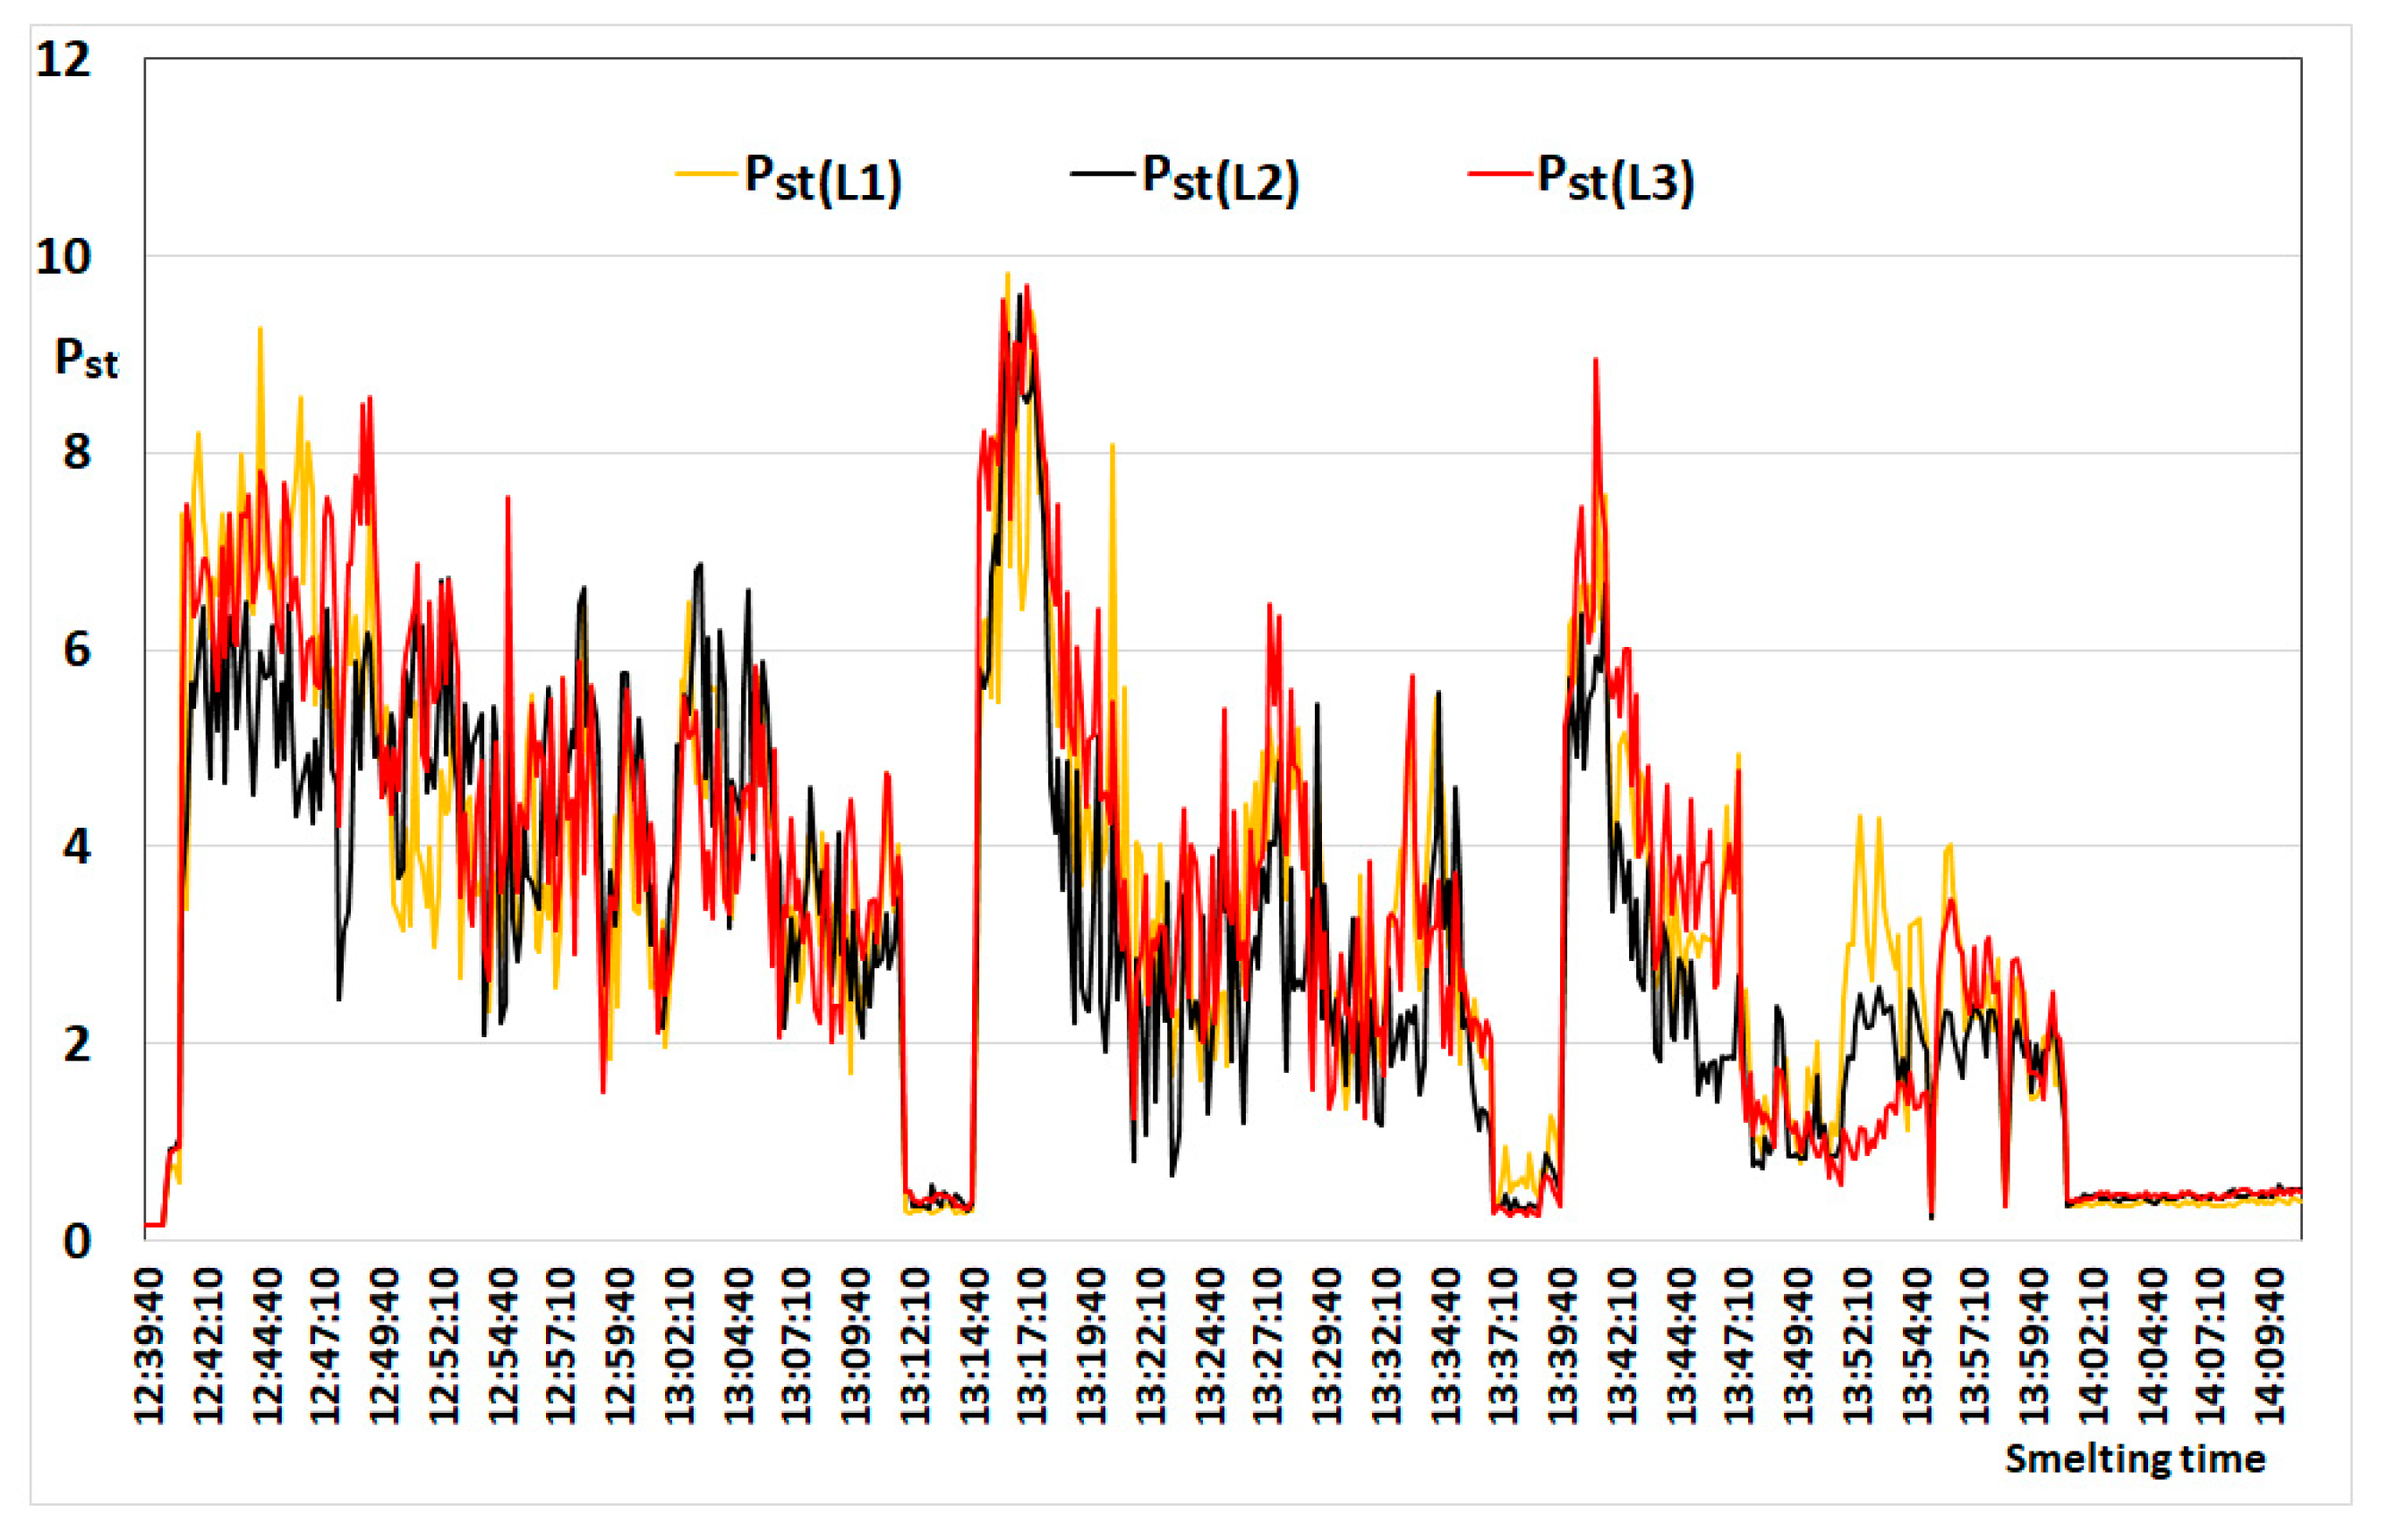
The statistical analysis of changes in short-term flicker severity Pst in short time intervals covering individual heats in the arc furnace is presented below. The statistical analysis of the short-term flicker severity Pst was based on the data recorded during individual melts (10 s measurement intervals). Figure 11 shows the change of the Pst coefficient measured in the three phases of the steelworks supply network during one melt carried out in the arc furnace. Very high values of the flicker coefficient are visible in particular phases, namely, Pstmax(L1) = 9.81; Pstmax(L2) = 9.60; Pstmax(L3) = 9.69. The high-level flicker of lightresults from the relatively low short-circuit power SSC = 750 MVA in relation to the power at the short circuit of the electrodes with the approximate charge SSCf = 40 MVA.
A short analysis of the obtained measurement results in three phases is presented below.
The correlation coefficients between the indicators recorded in individual phases are as follows:
The correlation coefficients between the indicators measured in individual phases and their average values are slightly higher and amount to:
This calculation limited to taking into account the results of measurements in the phase with the greatest voltage fluctuations, as it is adopted by Électricité de France [26].
The conducted analysis reveals that in the case of the disturbing influence of the electric arc furnaces, it is correct to take both average values and those measured in one of the line phases—the phase with the highest Pst. As it results from the measurements carried out by the authors, with the asymmetry coefficient below the permissible value, light flicker indicators in all phases change within a similar range.
Table 1 shows the basic statistical parameters of the short-term flicker severity Pst measured during one melt in the arc furnace.
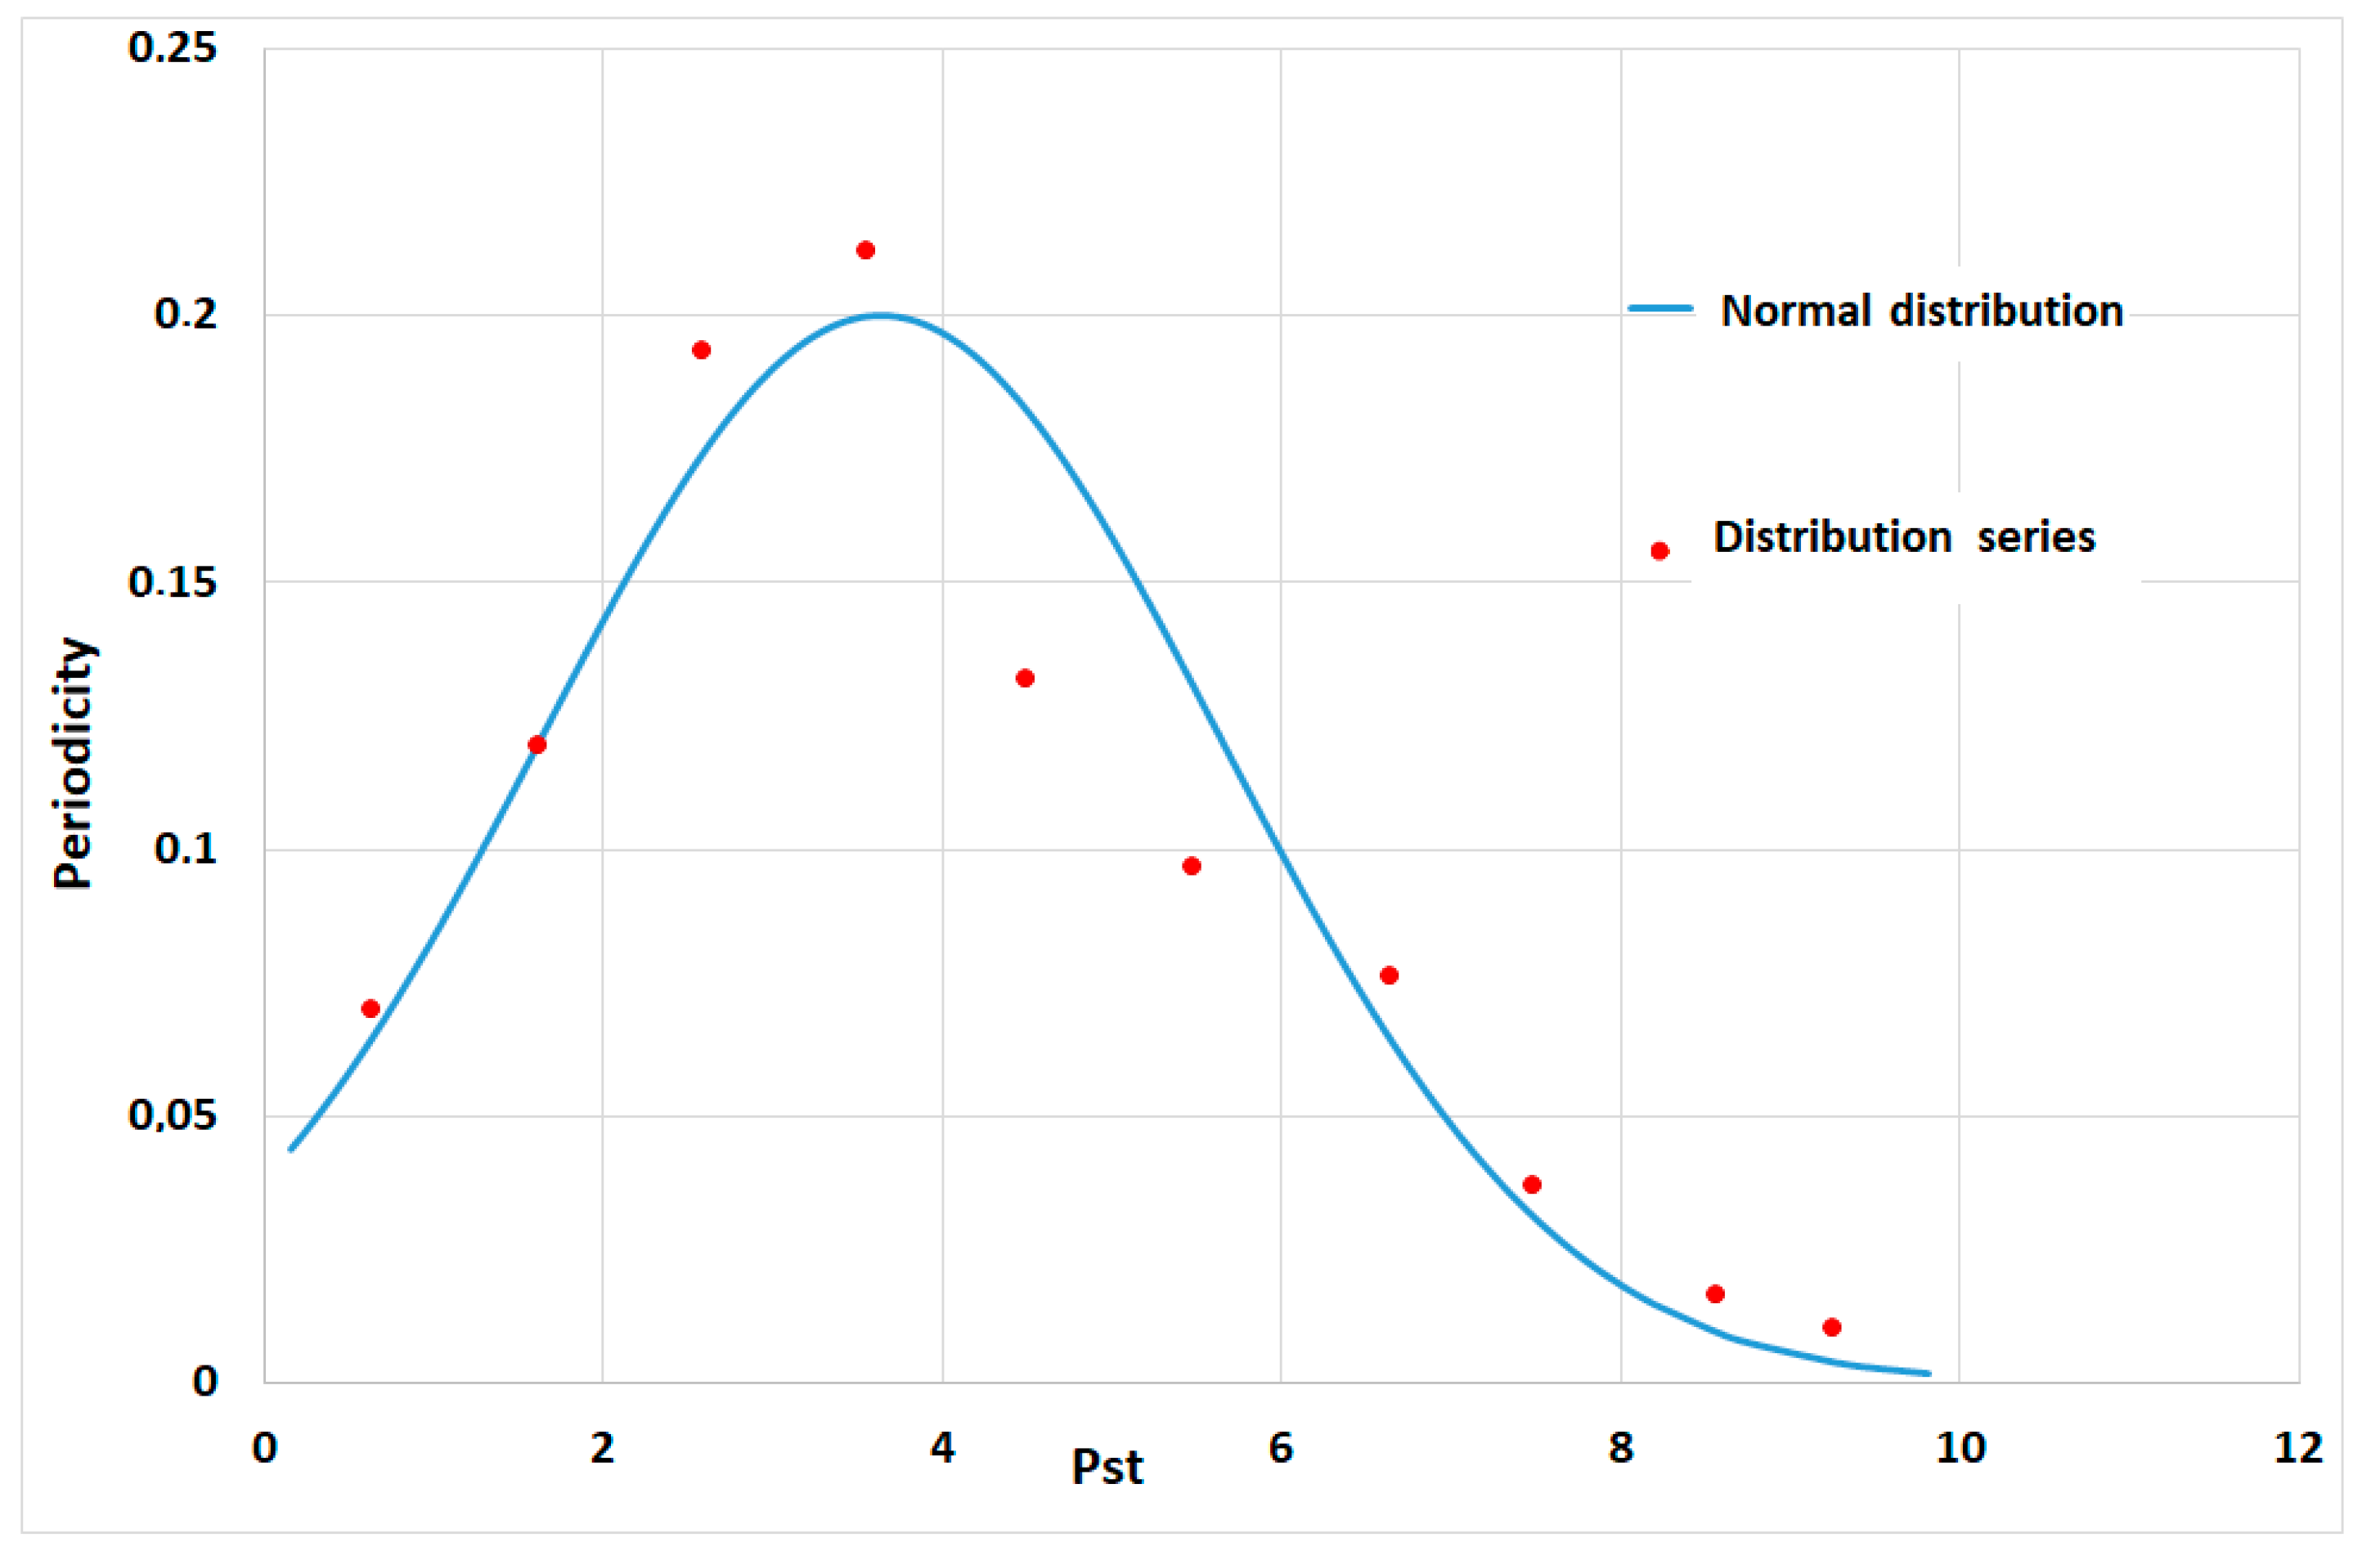
As in the case of voltage fluctuations, the basic statistical parameters of the recorded sample (L1 phase—with the highest Pst) during one melt (10 s sampling periods) were determined for the flicker index. In the first stage, grouping was performed, i.e., the classification of the measured light flicker indices by dividing the sample into classes. For the measured short-term flicker severity during one smelting, the number of samples is n = 443. The number of class intervals per m = 10 was established with the length of the class interval being 0.97.
Figure 12 shows a graph of the distribution of the obtained samples of short-term flicker severity, approximated by the function characterizing the normal distribution with the same mean and standard deviation.
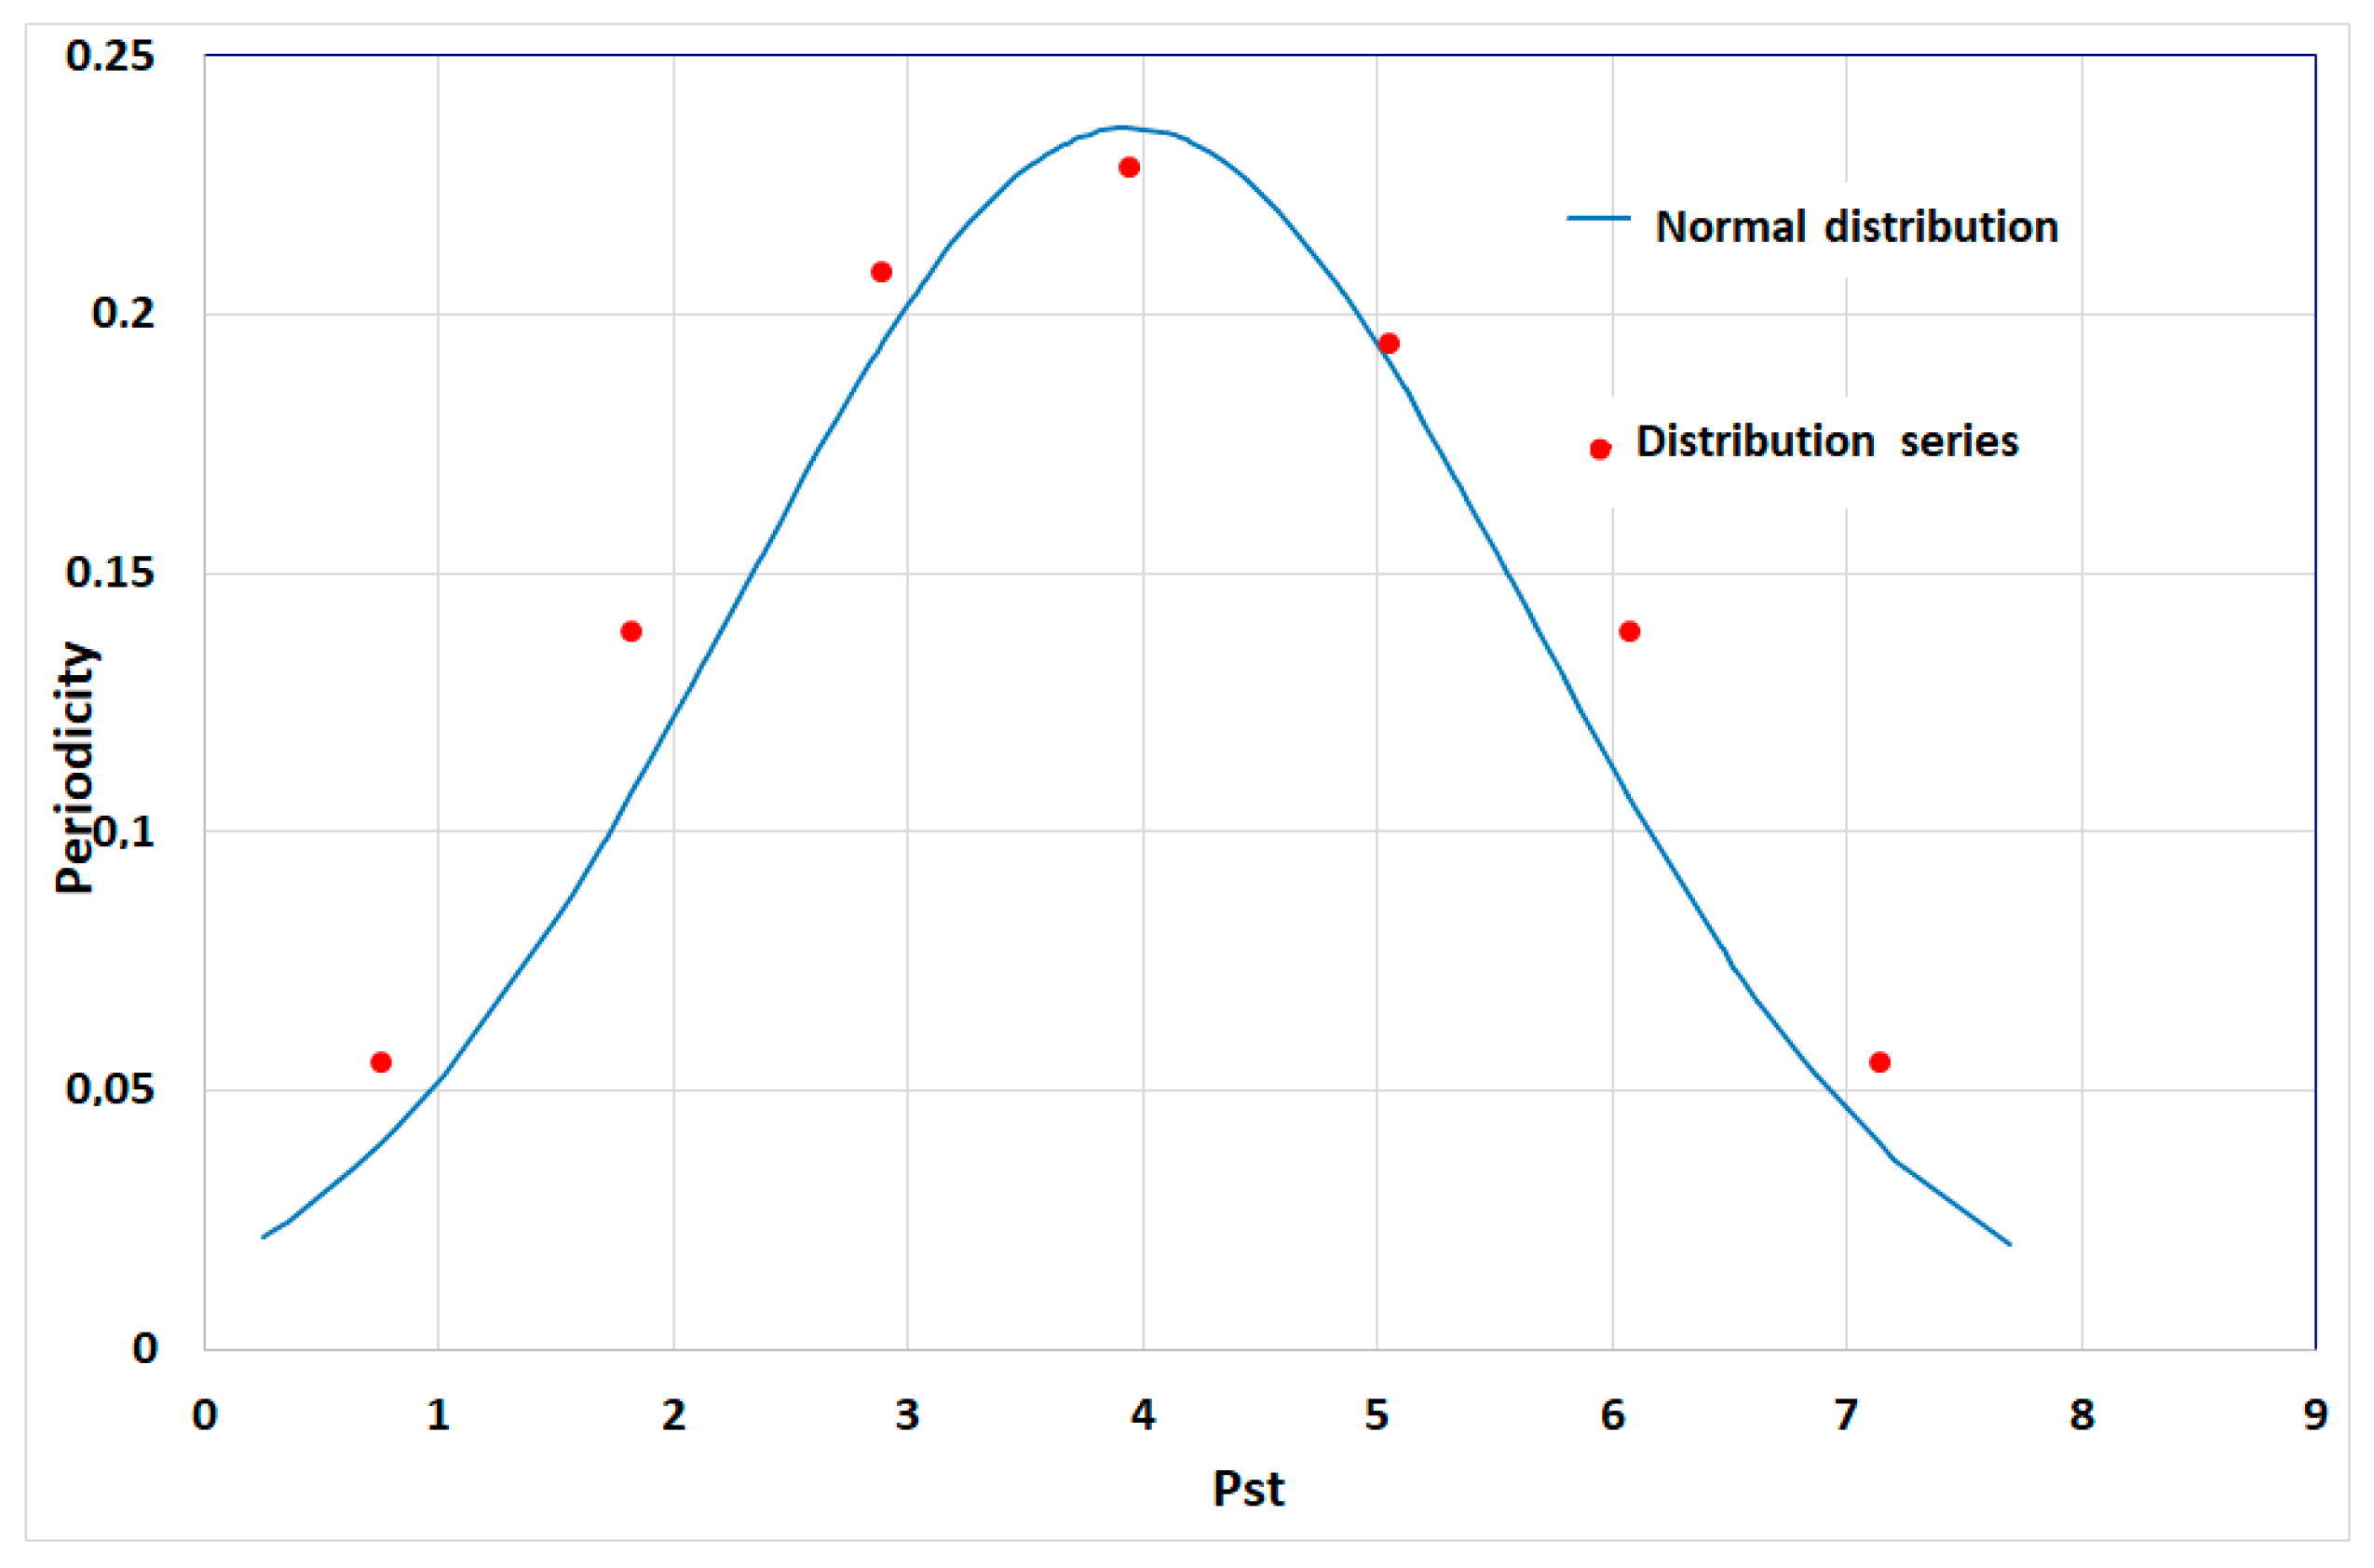
In order to determine the nature of changes in the short-term flicker severity during several successive heats when operating a single furnace, one day of light flicker measurements (selected from a measurement campaign covering one week) was taken into account. The measurement was made in accordance with EN—50160 [32] with 10-minute periods of determining the short-term flicker severity Pst. During one day of measurements, the obtained 144 values of the flicker index varied from Pstmin = 0.25 with the arc furnace off, to Pstmax = 7.69 with the furnace operating in the melting phase. The mean value of the short-term flicker severity was Pstmax = 3.94. and its standard deviation D(Pst) = 1.69. As in the case of the amplitudes of voltage fluctuations and the flicker index of light measured for one smelt, as well as for one-day measurement, the basic statistical parameters of the distribution series created earlier from the measured values were calculated; they are listed in Table 2.
The distribution series was divided into m = 7 classes with the class length calculated as (Pstmax − Pstmin)/m = (7.69 – 0.25)/7 = 1.06.
Figure 13 shows the probability density function for one day of measurements of the short-term severity flicker Pst.
To verify the validity of the hypothesis with a normal distribution, the χ2 Pearson compatibility test was performed at the significance level of 0.05.
Table 3 contains the basic parameters calculated for a given sample (n = 144) with the mean value Pstmean = 3.94 and the standard deviation D(Pst) = 1.69.
The critical value read from chi-squared tables for the adopted significance level α = 0.05 and 4 degrees of freedom is χα2 = 9.49 and since the value determined from the sample is χ2 = 2.24 < χα2 = 9.49, there is no reason to reject the hypothesisthat the analyzed distribution is a normal distribution.
5. Assessment of The Increase in Flicker of Light with Parallel Operation of Arc Devices
The increase in voltage fluctuations resulting from successively connected arc devices is characterized by the KN coefficient. This factor determines the extent to which voltage fluctuations will increase with successively connected arc furnaces in relation to the fluctuations generated during the operation of a single device.
For the value of the short-term flicker index, KN can be determined from the formula [26]:
According to the method proposed by UIE for the assessment of superposition of voltage fluctuations, the substitute parameter Pst obtained with the use of the light flicker meter is assumed, and it is determined from the relationship [42].
Pstn corresponds to flicker level induced by the n-th disrupting receiver. The value of the coefficient m, occurring in the above formula, depends upon the characteristics of unquiet receivers, and can be categorized into five categories:
m = 4—used only for the summation of voltage changes due to arc furnaces specifically run to avoid coincident melts;
m = 3.2—this choice matches the slope of the straight part of the Pst = 1 curve;
m = 3—this is used for most types of voltage changes where the risk of coincidental voltage occurring is small. The vast majority of studies combining unrelated disturbances will fall into this category, and it should be used where there is any doubt over the magnitude of the risk of coincident voltage changes occurring;
m = 2—this is used where coincident stochastic noise is likely to occur, e.g., coincidental melts on arc furnaces;
m = 1—the resultant Pst will approach the value given by this coefficient when there are very high occurrences of coincidental voltage changes.
In the method recommended by UIE, it is proposed to determine the increase in the flicker index caused by successively connected arc devices by changing the m factor in Formula (14) from 2 to 4.
An attempt to explain the reasons for the discrepancies in the assessment of voltage fluctuations occurring with the simultaneous operation of several furnaces, created by various methods, was made in Poland by Wąsowski [43,44].
The KN coefficient was determined from the formula:
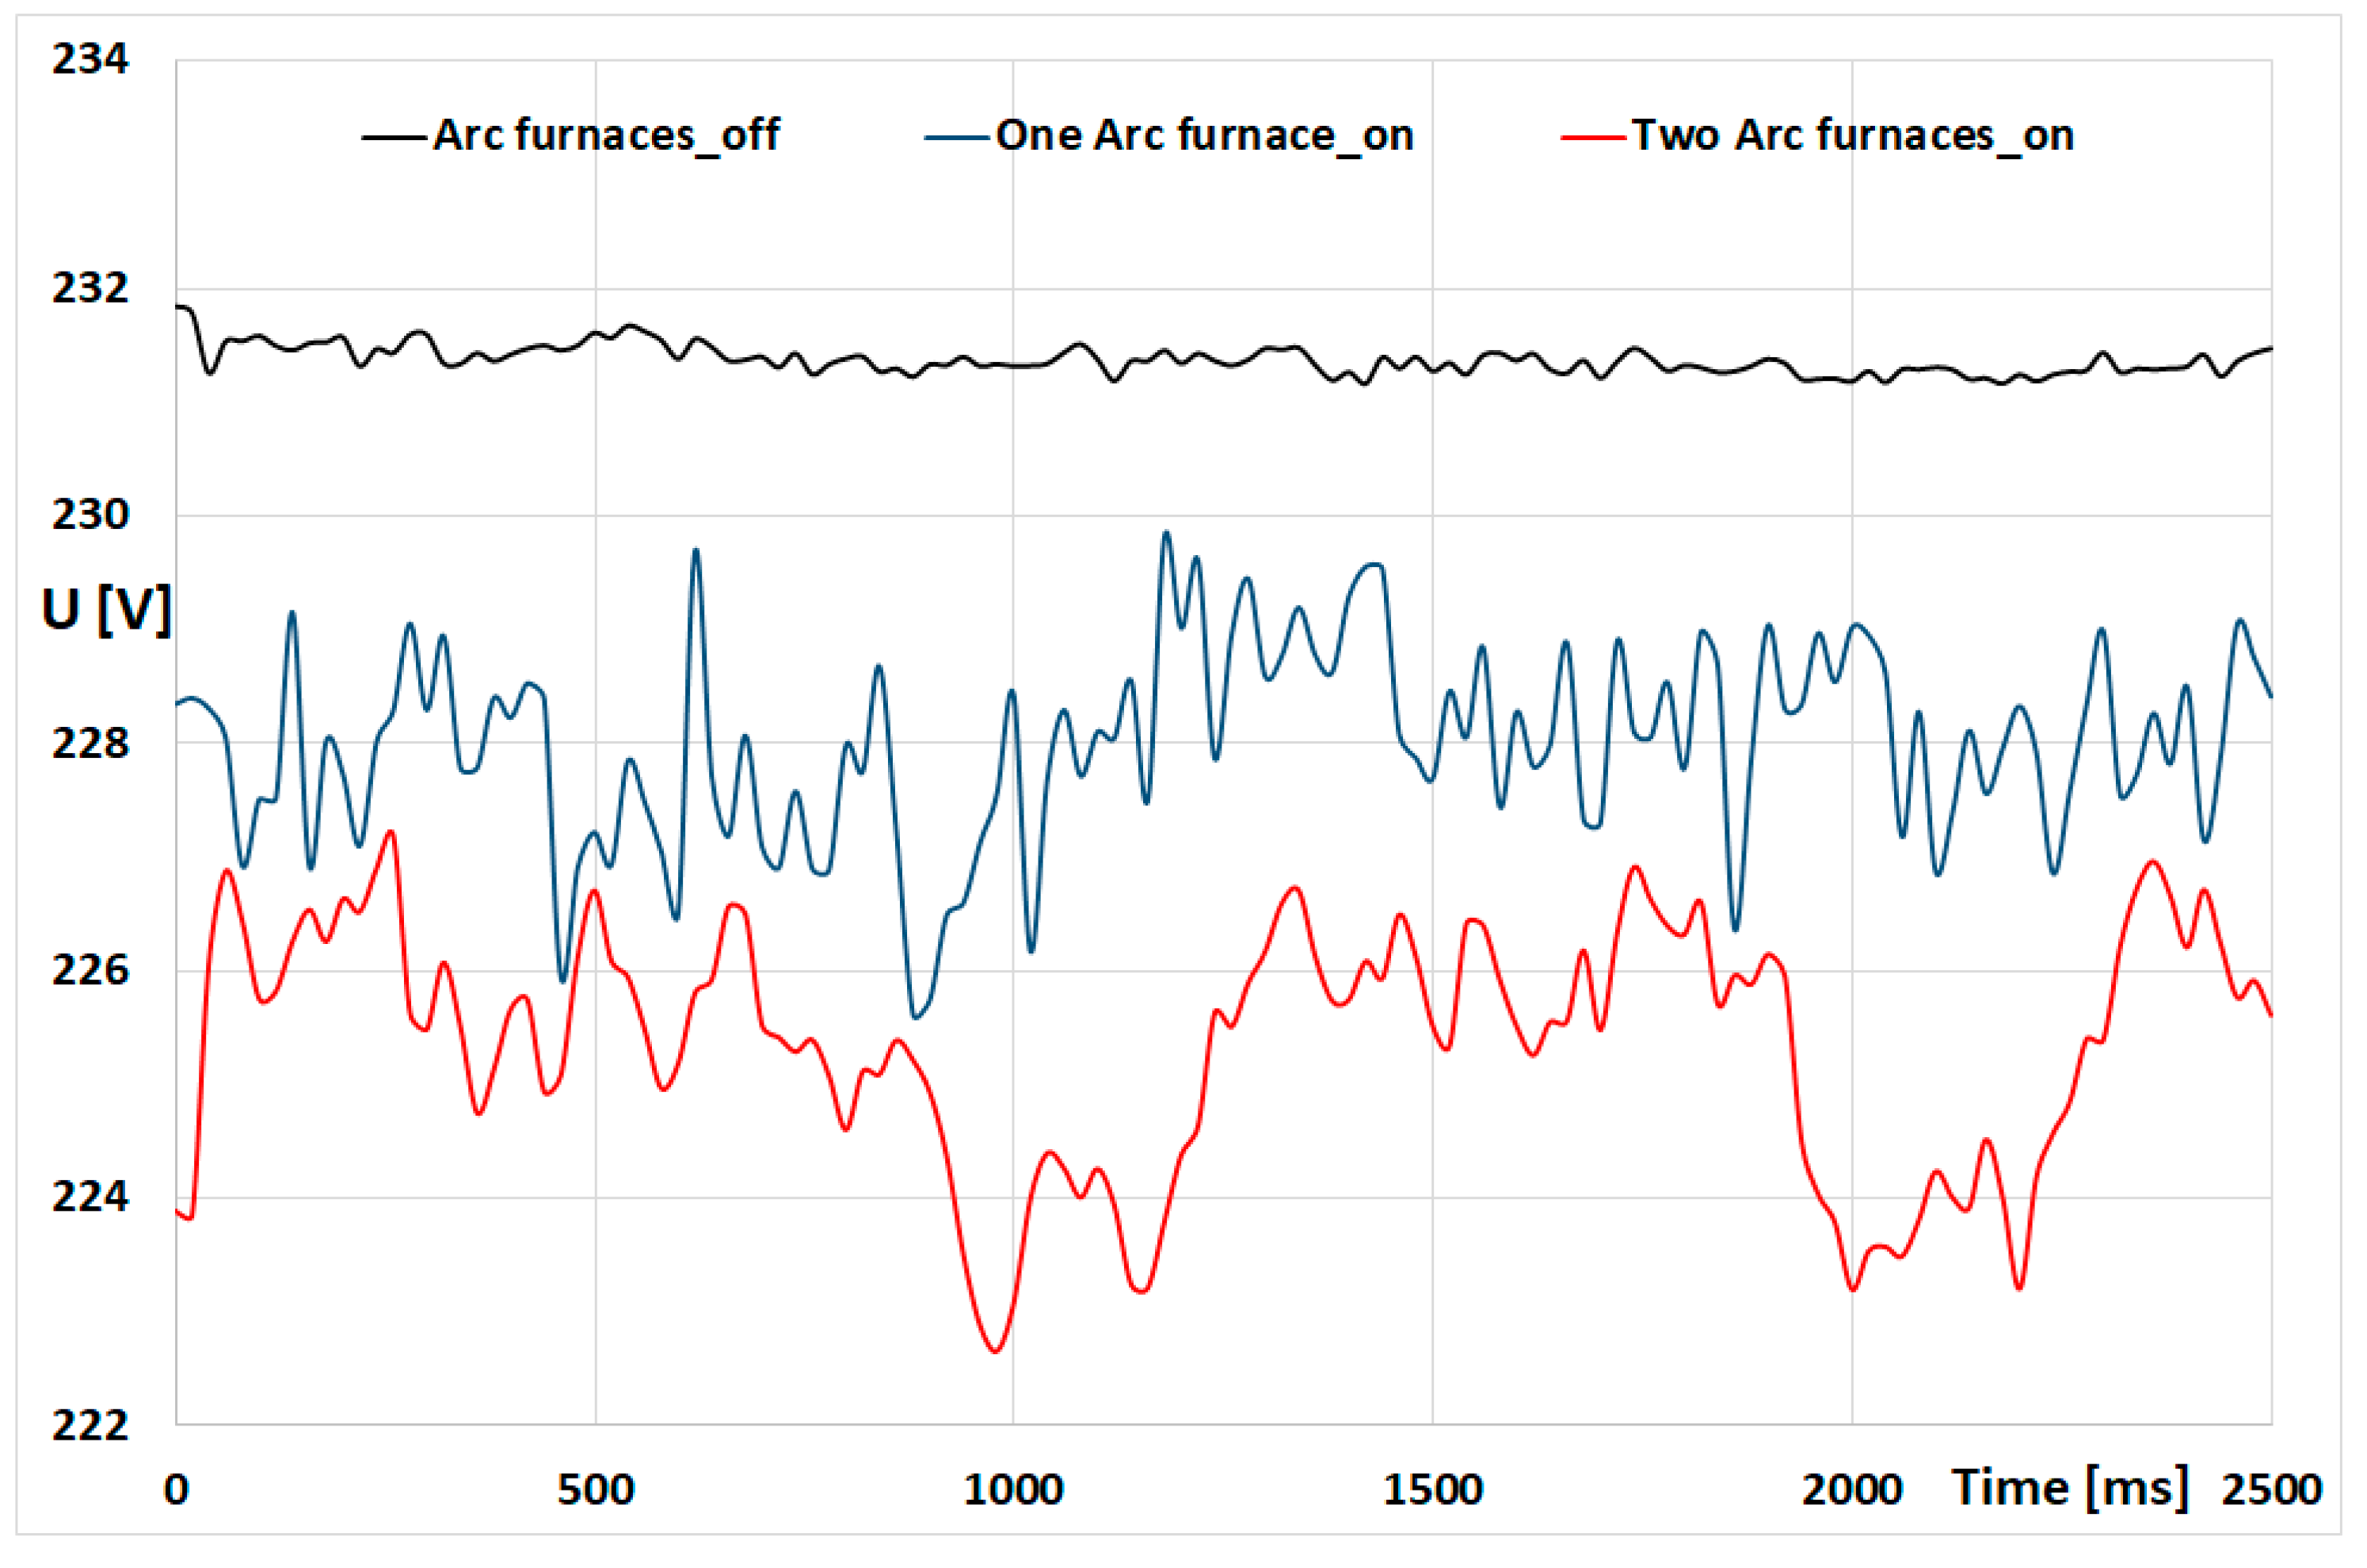
Based on the recorded waveforms of the voltage curve (oscillograms) in the network supplying the lighting receivers of the steelworks (Figure 3—Point D), the RMS voltage values were determined (for the period of 20 ms)—Figure 14.
In relation to the voltage value, with the arc devices off, the switching on the arc furnace causes a decrease in the average RMS voltage value. Switching on other arc furnaces reduces the RMS voltage value. This is due to an increase in voltage drop across the power line impedances.
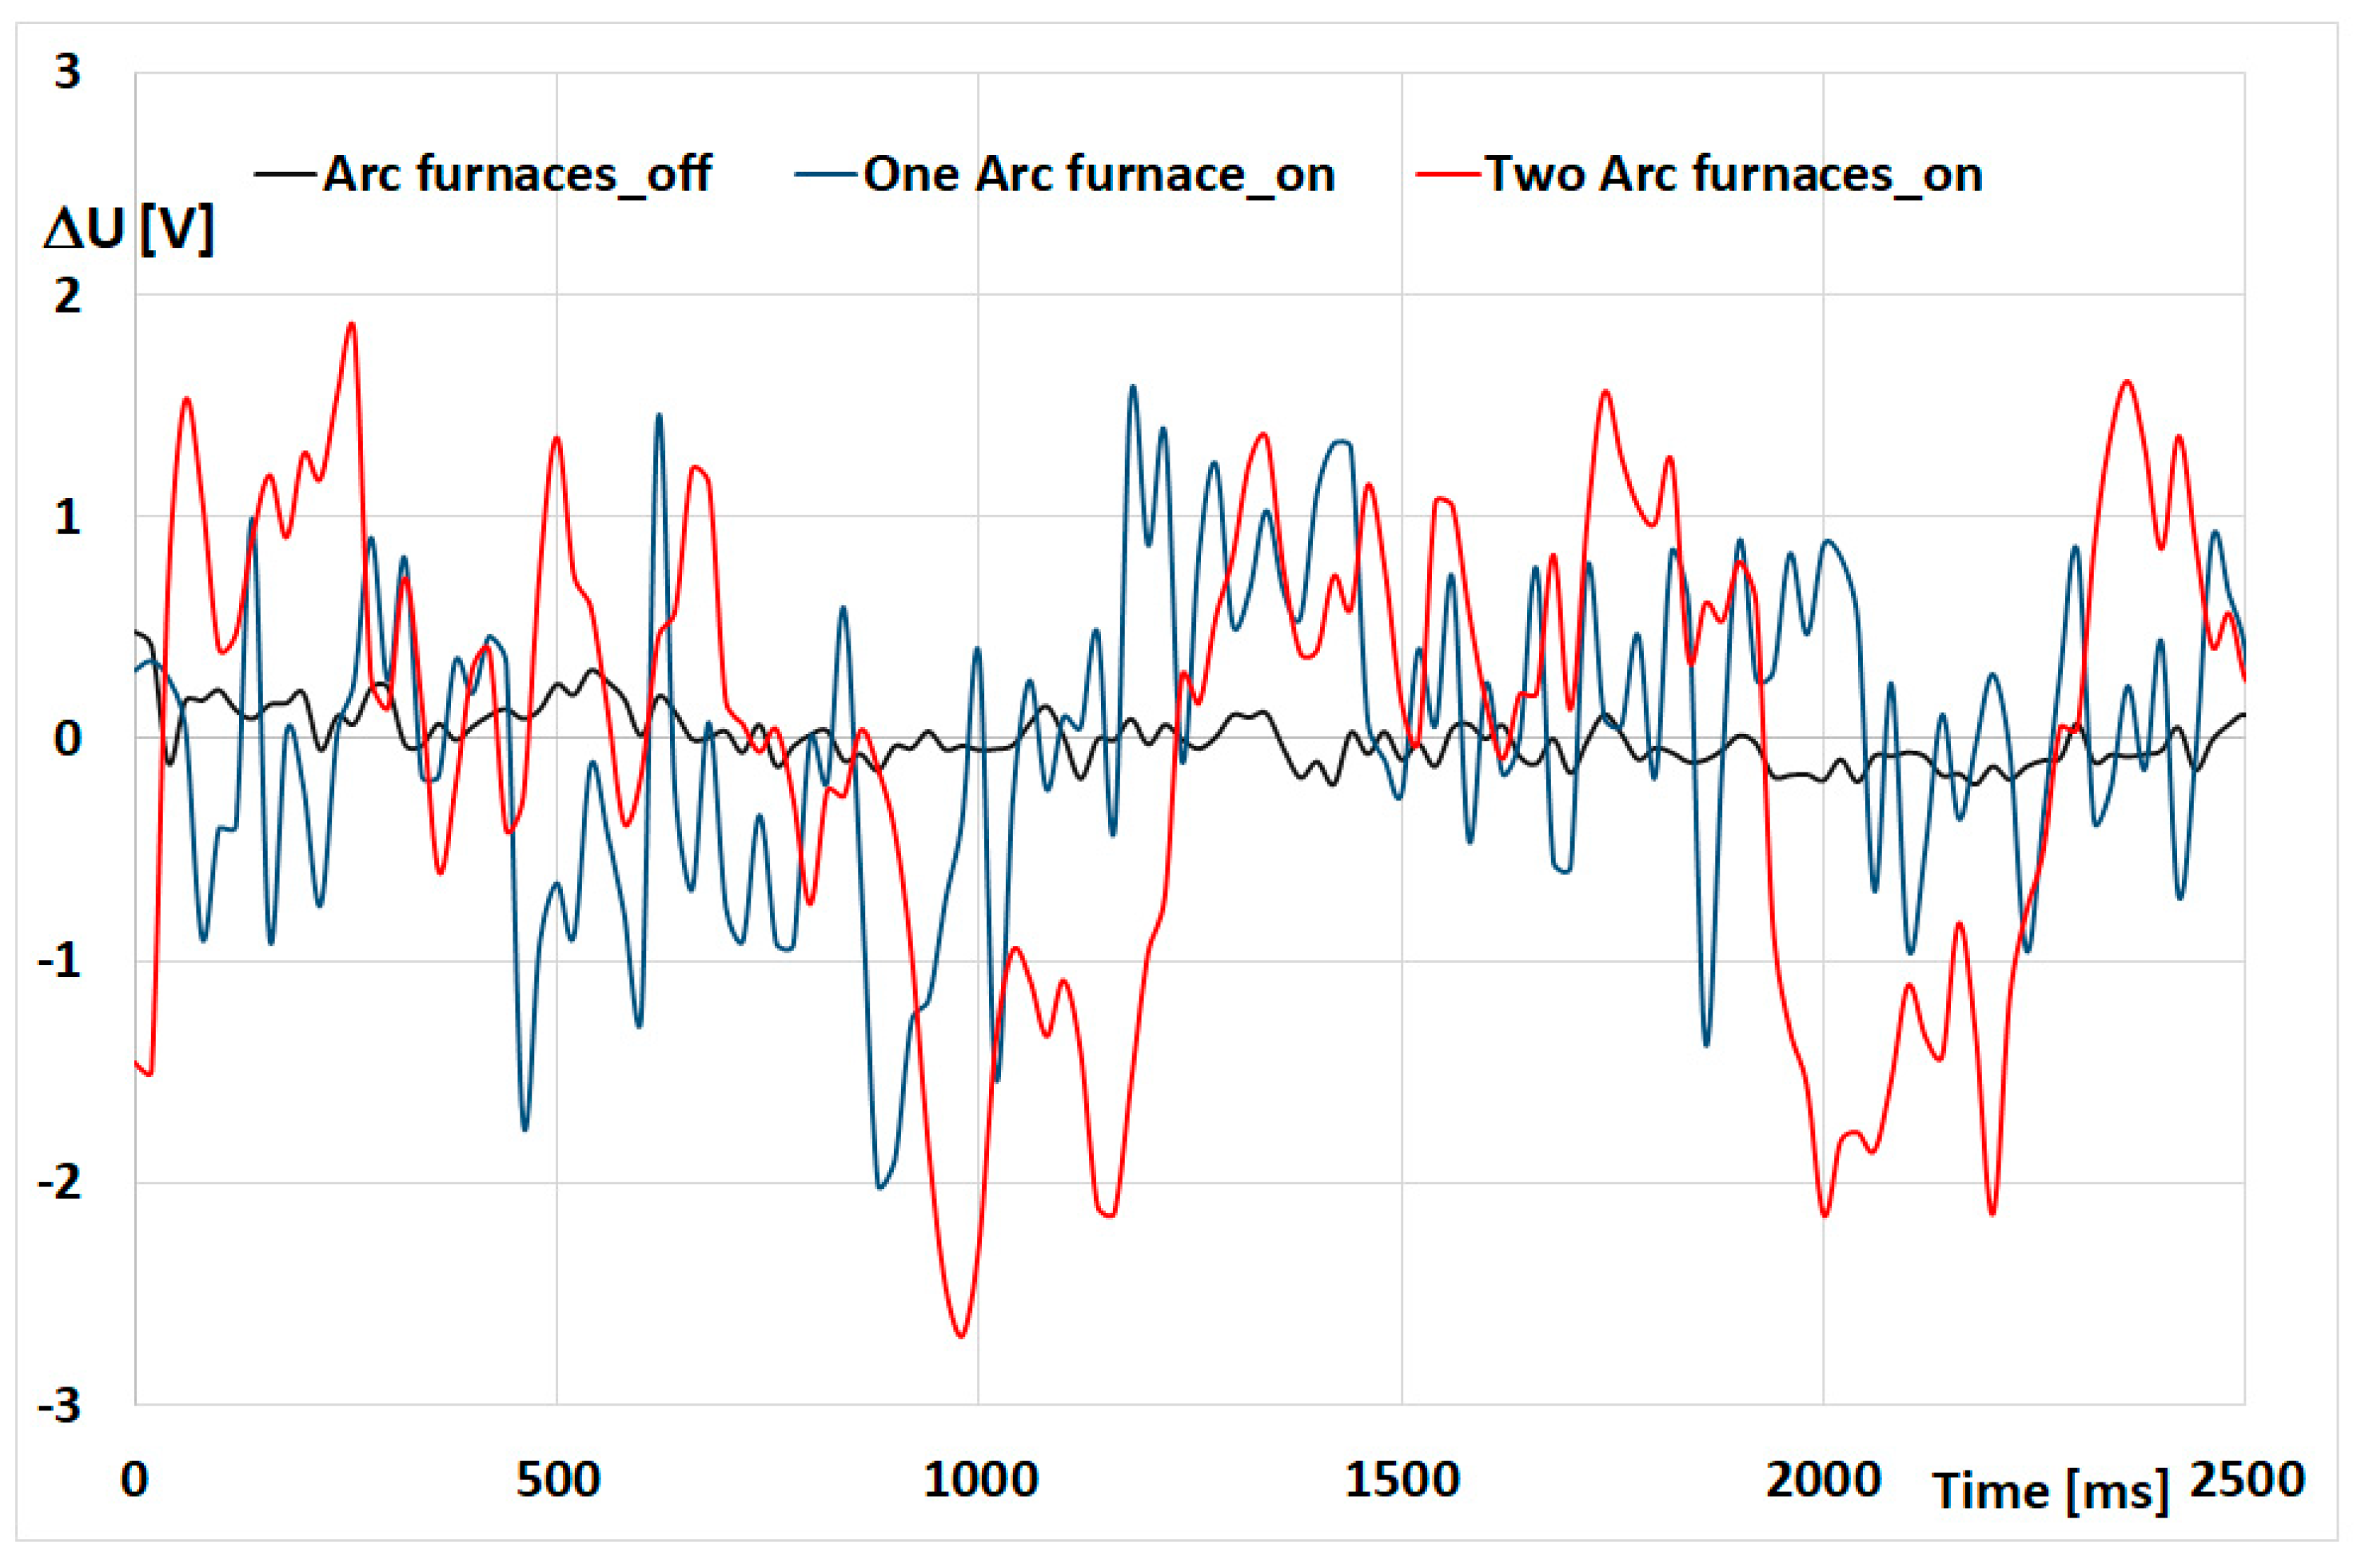
Along with the decrease in RMS voltage, the switching on of arc furnaces causes voltage fluctuations. The amplitude of the voltage fluctuations increases with the number of switched on arc furnaces—Figure 15.
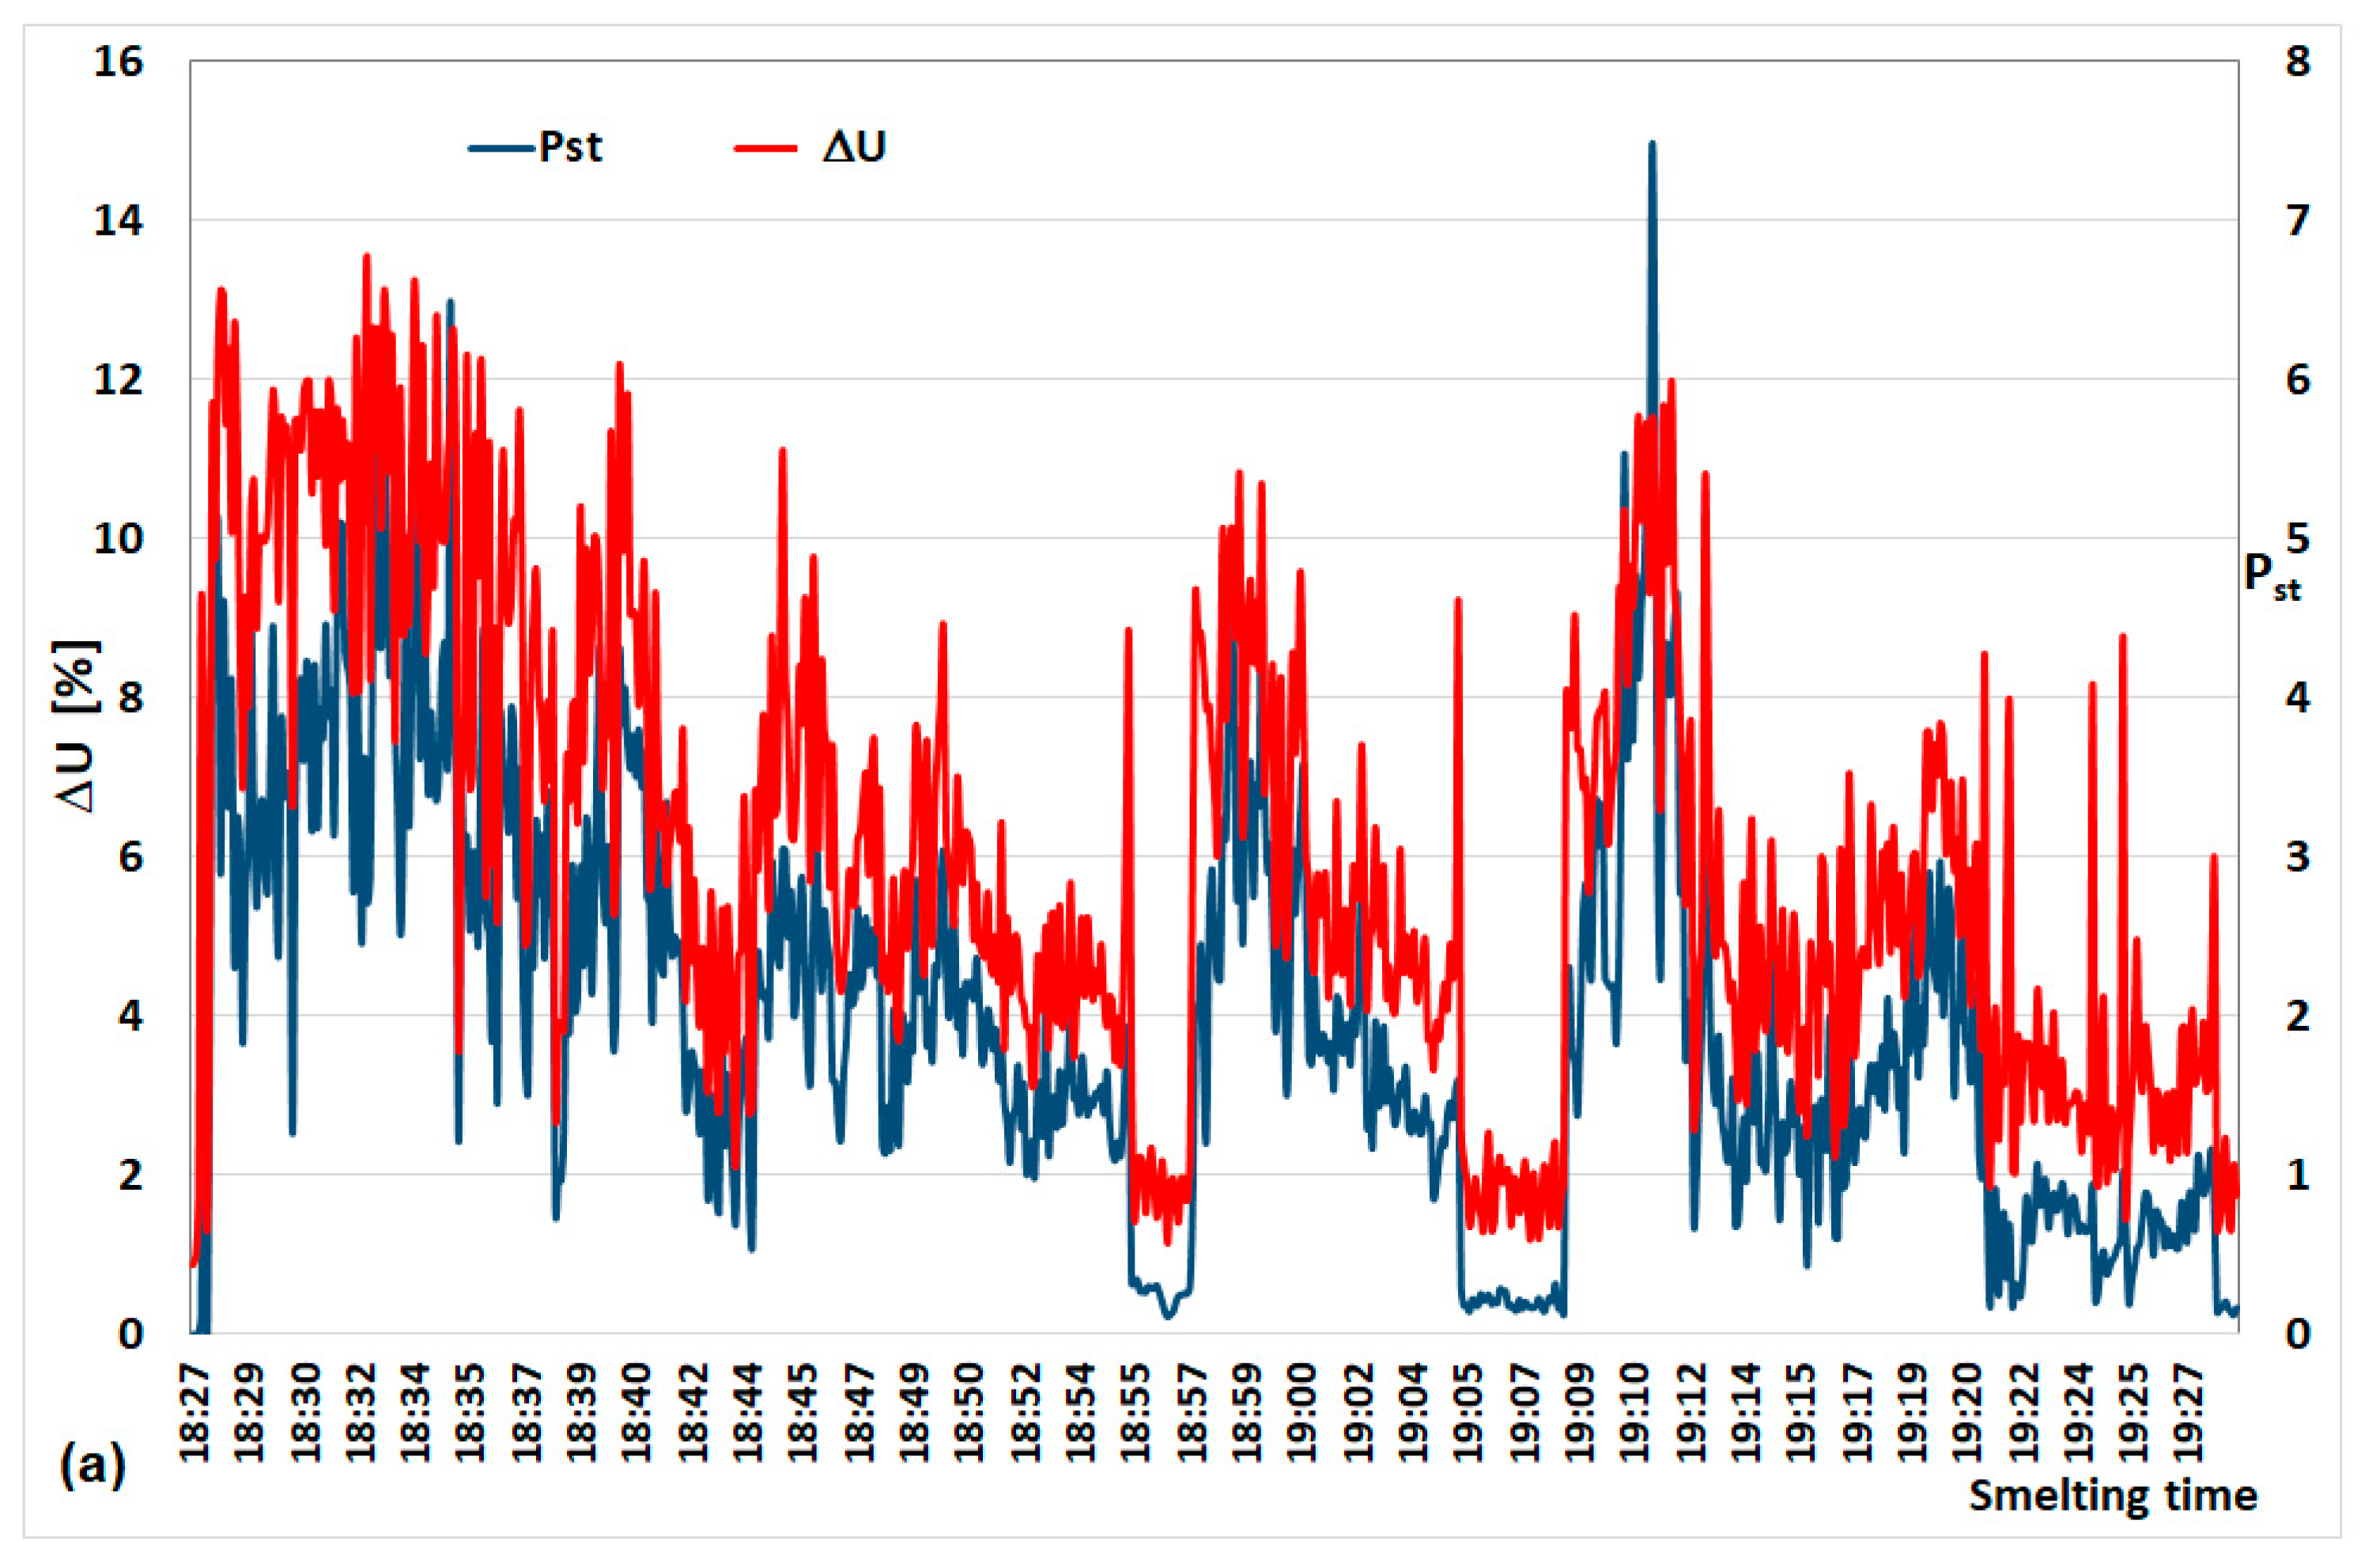
The effect of an increase in voltage fluctuations is an increase in flicker. Based on the analysis of the recorded voltage fluctuations and flicker of light indicators, the correlation between these values was determined. Figure 16a shows the changes in the amplitude of voltage fluctuations and the flicker index recorded during one melting in the arc furnace. A correlation was also established between these values (Figure 16b). The correlation coefficient is rPstΔU = 0.906.
Taking into account changes in the mean RMS voltage when switching on successive arc devices and developed power–voltage characteristics, the set of formulae allowing the determination of the coefficient KN was worked out [45].
The formula determining an increase in voltage fluctuations for arc devices in the melting process can be expressed in the following form:
and for arc devices of different power,
Using the relationship determined for power–voltage characteristics, and replacing the arc by the voltage source in Formulas (16) and (17) at identical devices, we can present the coefficient KN in the following form:
and at different devices,
In the method recommended by UIE, an increase of flicker caused by consecutive connecting arc devices is determined by the change of the coefficient m from value of 2 to 4 in Formula (14). For identical furnaces causing identical flicker (Pst1 = Pst2 =… = Pstn), Formula (14) can be transformed to the form:
At bordering values m = 2 and m = 4 recommended by UIE, this leads to the formula for KN:
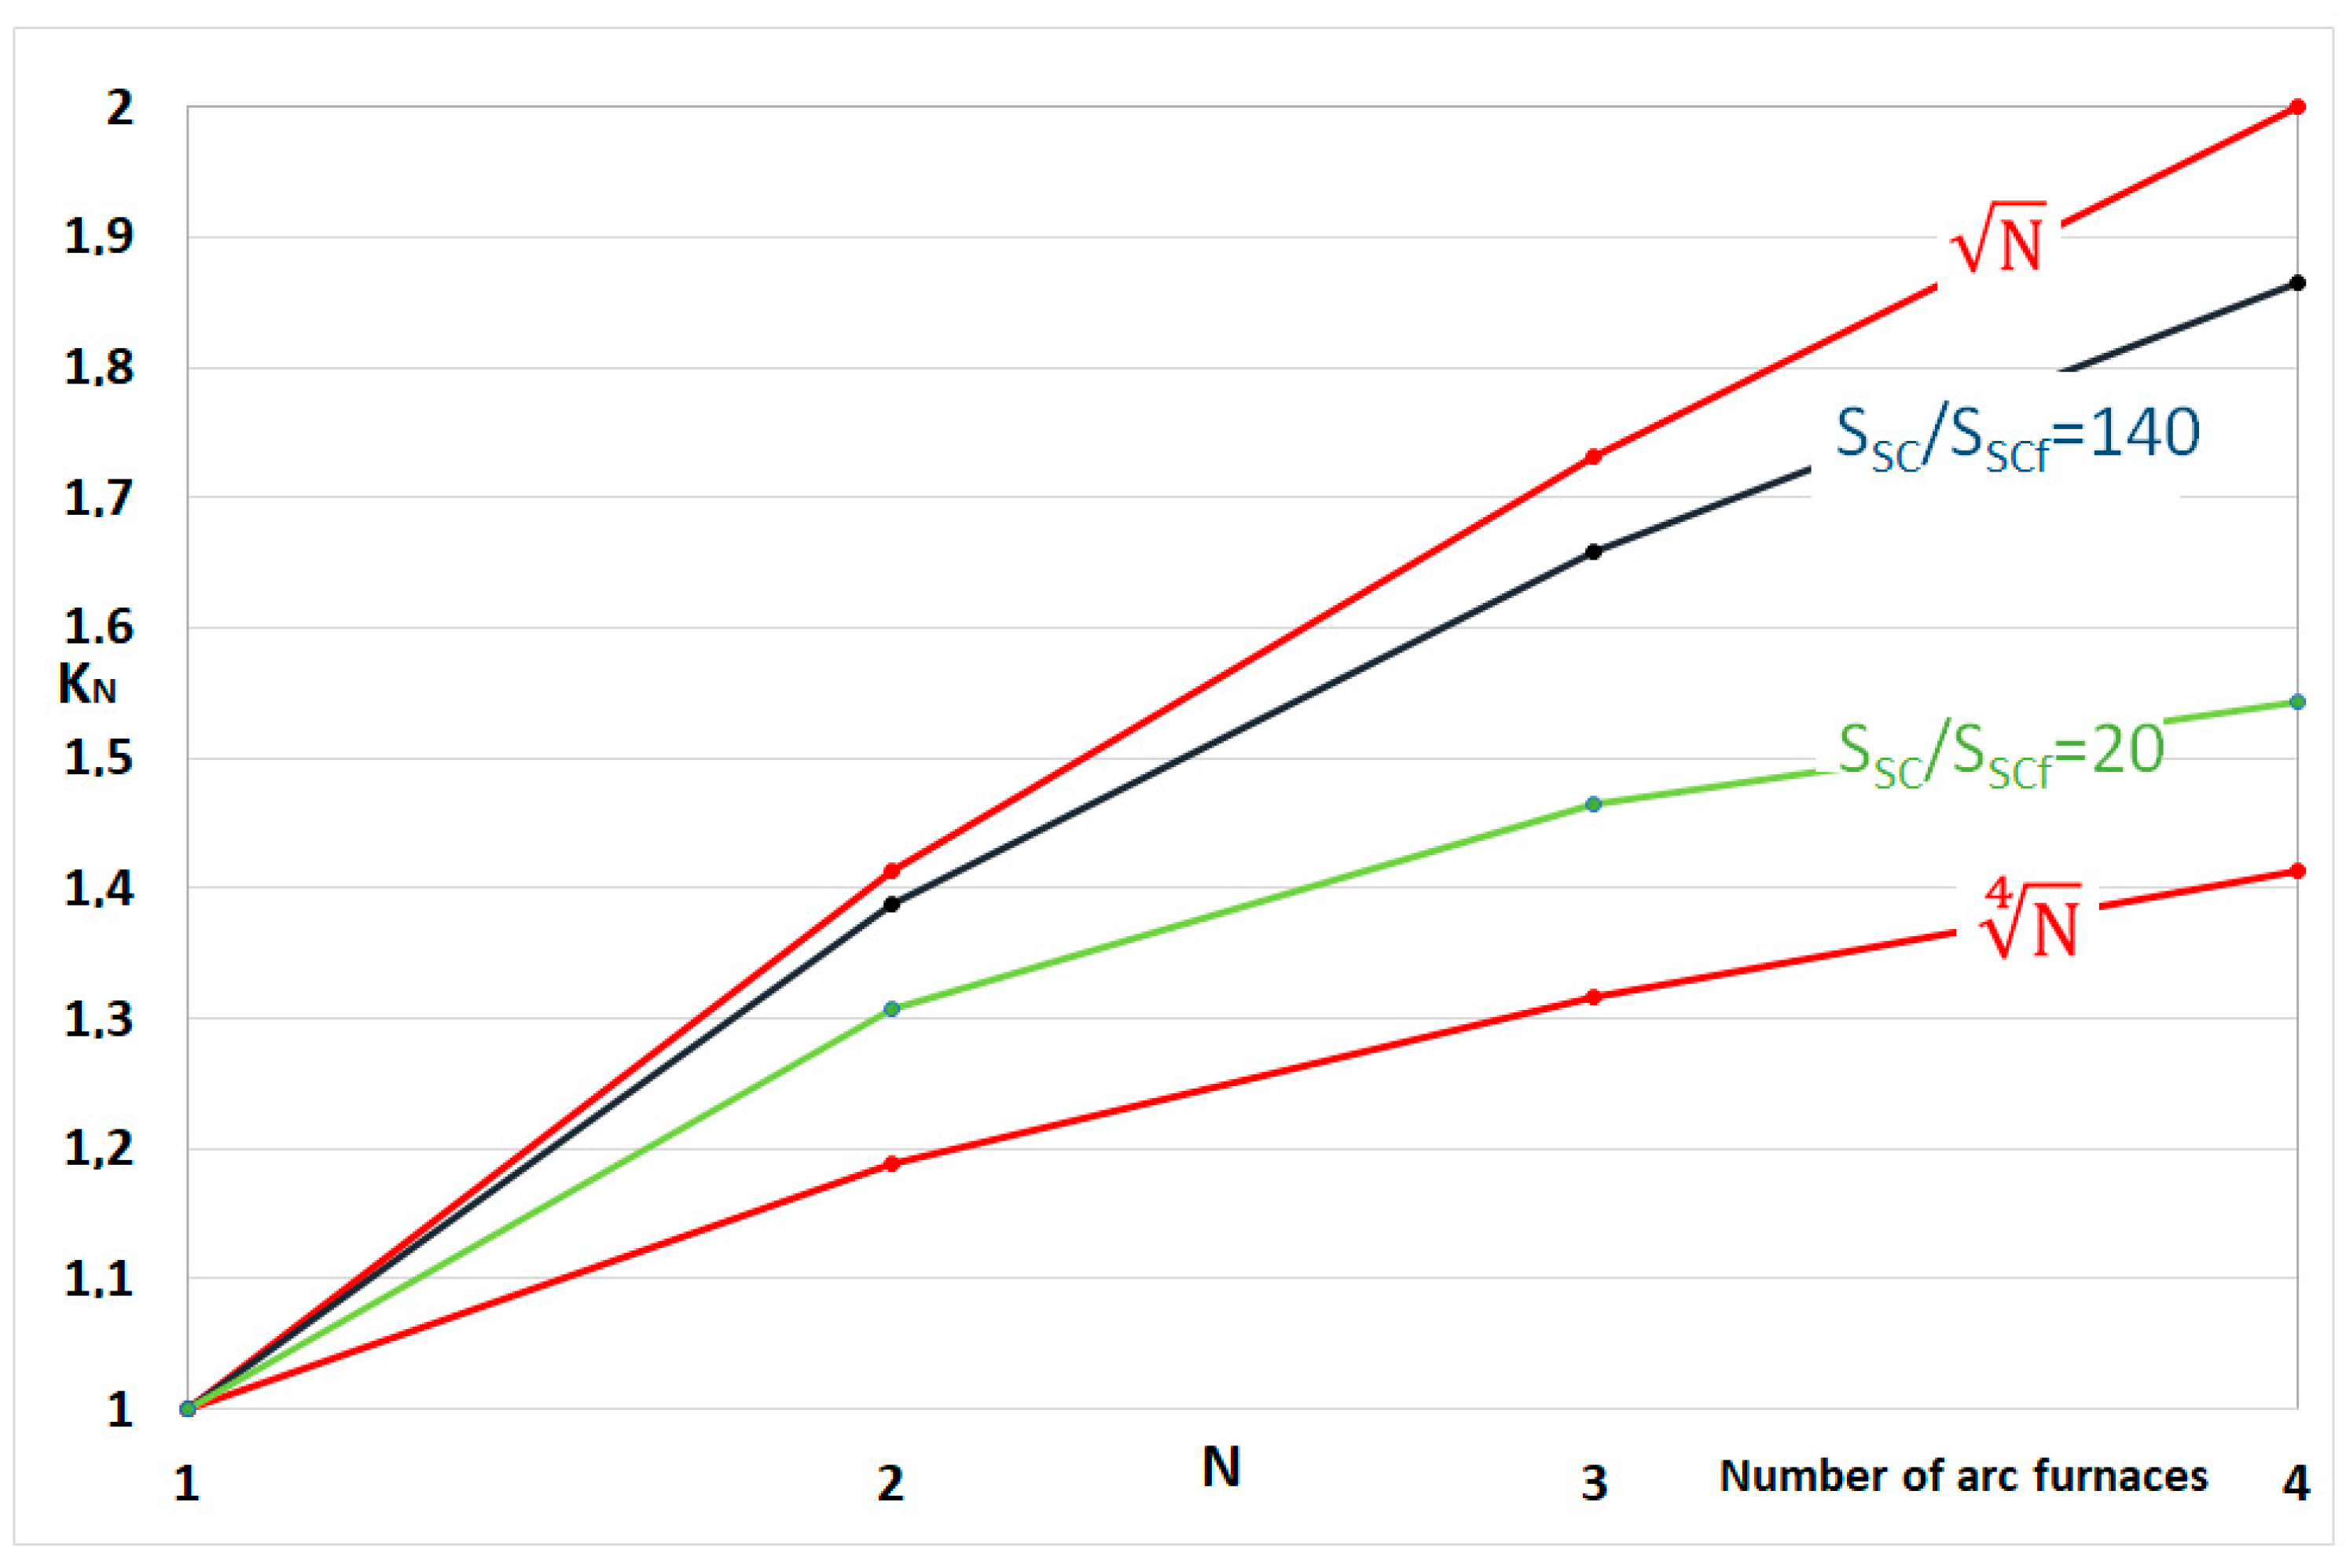
Figure 17 shows the changes in the KN coefficient depending on the number of parallel arc furnaces. The curves drawn on the basis of Formula (20) recommended by UIE are marked in red.
Based on the proposed Formulae (16)–(19), the values of the KN coefficient can be determined depending on the short-circuit power of the SSC network, the power of the transformer at the short-circuit of the electrodes with the charge SSCf, and the voltage in the line supplying the steel plant: respectively for the operation of the N furnaces and the operation of a single furnace (furnace with the highest power, reference furnace). Figure 17 also shows the values of the KN coefficient corresponding to the supply conditions of the steel plant, the supply scheme of which is shown in Figure 3. For point A, the ratio is SSC/SSCf = 140, and for point B it is SSC/SSCf = 20.
The analysis shows that the value of the KN coefficient is decisively influenced by the short-circuit power on the rails of the steel plant. The higher the short-circuit power, the greater the KN coefficient, i.e., the arc devices interact to a lesser extent, mitigating the increase in voltage fluctuations. Obviously, the voltage fluctuations and flicker of light at SSC/SSCf = 20 are greater than at SSC/SSCf = 140.
6. Discussion
The main disturbances generated by arc devices are voltage fluctuations. Voltage fluctuations caused by arc furnaces are characterized by high dynamics of change. The value of the voltage fluctuations depends mainly on the melting phase in the arc furnace and on the short-circuit power of the network in relation to the power of the arc furnace transformer. The periodicity of voltage fluctuations (number of changes during a given time, e.g., a second) changes to a lesser extent.
One of the effects of voltage fluctuations is flicker of light generated by lighting receivers. The flicker annoyance is assessed on the basis of the analysis of the values of the flicker Pst and Plt indicators. The volume measured by the flickermeter (or the power quality parameter analyzer with the flicker index function) is the voltage change. The remaining elements (functions) must be modeled: the reaction of the lamp–eye–brain system. A 60 W bulb was adopted as the reference lamp. With the currently widely used LED lamps, this assumption is debatable. It is therefore appropriate to ask the question: should the algorithm be modified for determining the flicker indicators by introducing a new reference lamp? According to the authors, this may create a problem related to the use of existing flickermeters and the need for further modifications when developing new light sources.
It seems a more reasonable solution to increase the permissible value of the light flicker coefficient depending on the light sources used. Another suggestion is to adopt Plt ≤ 1 for a different registration period, for example, 80% of the time instead of 95% currently used.
Commission Regulation (EU) 2019/2020 of 1 October 2019 lays down ecodesign requirements for light sources and separate control gears pursuant to Directive 2009/125/EC of the European Parliament proposing flicker PstLM ≤ 1 for LED and OLED MLS. The determined value shall not exceed the declared value by more than 10%. Adopting a new Pst LM unit requires the use of specialized photometric equipment that also allows SVM to be measured (stroboscopic visibility measure), as defined in standards SVM = 1, represents the visibility threshold for an average observer. The metric for flicker used in this Regulation is the parameter ‘PstLM’, where ‘st’ stands for short-term and ‘LM’ for light flickermeter method, as defined in the standards. A value of PstLM = 1 means that the average observer has a 50% probability of detecting flicker. Measurements are made in a photometric darkroom by placing the meter at a specified distance from the light source. Another method is to use a meter circuit with an integrating ball, which allows the verification of the ripple characteristics when measuring the luminous flux. The measurements proposed by the EU in [46] are designed to test the resistance of light sources to voltage fluctuations. Before obtaining the certificate, individual types of light sources are tested. This means that the PstLM indicator is completely different from the Pst and Plt indicators. Pst and Plt relate directly to supply voltage fluctuations that directly affect the flickering of light. PstLM is therefore an additional parameter that is taken into account by manufacturers of LED light sources.
The publication in [47] presents a digital flicker detection method based on probability resampling. Uniform probability distribution sampling is applied before statistical evaluation to compress redundant data to reduce storage space and to improve algorithm execution efficiency. The proposed method based on probability resampling overcomes the shortcomings of the low efficiency of algorithms and the high requirements of hardware resources brought by the traditional flicker digital measurement, which has excellent economic significance and practical impact for both new developments of digital flicker detection instruments and upgrades of traditional power quality instruments [47]. The presented method of digital analysis of signal detection used to determine light flicker indicators allows faster detection of electricity quality parameters in modern analyzers. This may be of particular importance when modifying the flicker meter to include new light sources (e.g., LED lamps).
The article presents selected examples (representative) flicker of light indicators recorded in the lines supplying arc furnaces. Two methods of light flicker evaluation were adopted. The first one, according to [32,33,34], consists of the weekly measurement of the parameters characterizing the power quality and relating them to the permissible values.
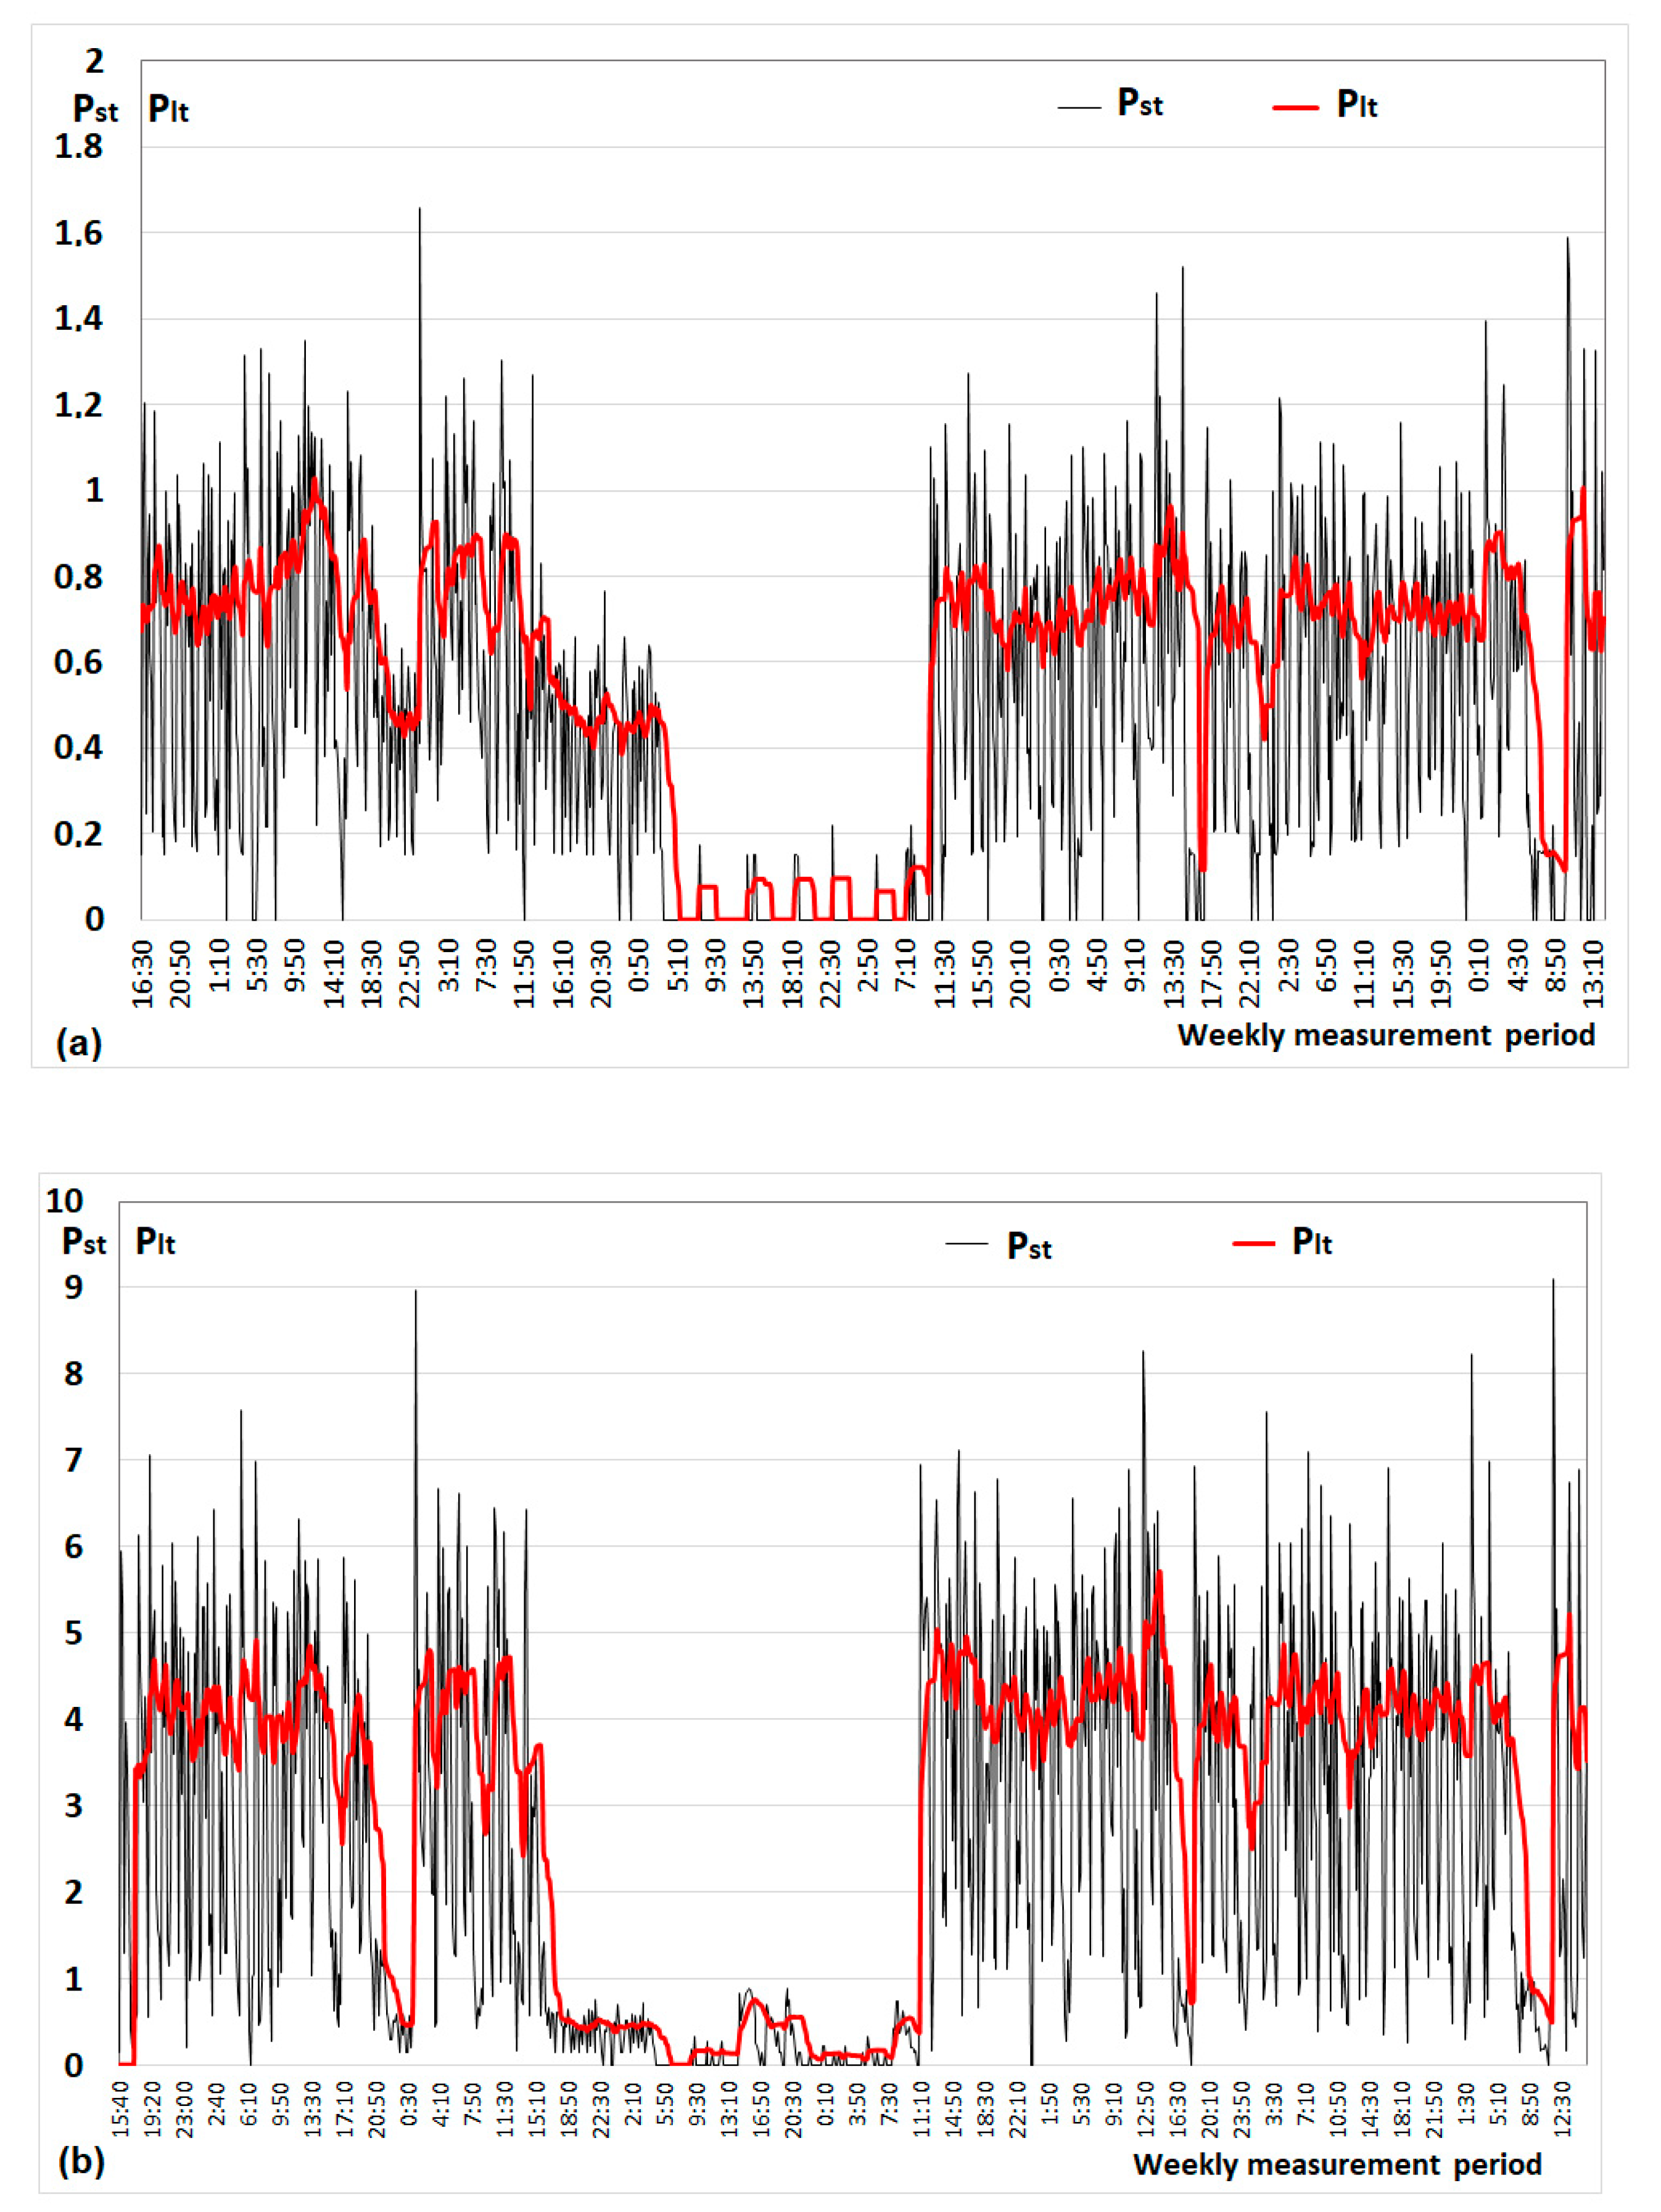
Figure 18 shows the changes of long-term severity flicker Plt and short-term severity flicker Pst recorded in the supply line to the ironworks (a)—Point A (Figure 3) and steel plant (b)—Point B (Figure 3), during the weekly measurement cycle.
Assuming for the 110 kV line, in accordance with the EN 50160 standard [32], the limit value of Plt95% ≤ 0.8, it was found that the acceptable value was exceeded, although to a small extent. For point A, Plt95% = 0.89, Pltmax = 1.03. During several weekly measuring cycles at point A, similar Plt95% values were obtained. The values of Plt95% varied from 0.76 through 0.81 to 0.89 (referring to the phase with the highest Plt values). At point A (Un-110 kV), the short-circuit power of the network is SSC = 5000 MVA. The rated power of the furnace transformer is Sn = 20 MVA. Assuming the operational short-circuit factor ksc = 2, the ratio of the short-circuit power of the network to the power of the furnace transformer at the short-circuit of the electrodes with the charge is SSC/SSCT = SSC/(kSCSn) = 5000/40 = 125.
The publication in [48] proposes the minimum value of SSC/SSCT = 80 and in the publication in [49], SSC/SSCT = 120. On the basis of the conducted research, the authors concluded that the minimum ratio of the short-circuit power of the network to the short-circuit power of the electrodes with the charge should be greater than 125.
The use of short measurement intervals (a few seconds) allows the assessment of disturbances caused by the arc furnace during individual melts. On the basis of the performed statistical analysis, a significant correlation of changes in the flicker coefficients of light in individual phases of the lines feeding the arc furnaces was found—Formulae (11) and (12). Therefore, the Pst and Plt analysis was proposed in the phase in which the highest values were recorded. Comparing the conducted statistical analysis of the Pst light flicker indices recorded at 10 s (one melt) and 10 min (one day of measurements) measurement intervals, a very similar probability density function was found—Figure 12 and Figure 13.
7. Summary
Arc furnaces, being one of the largest receivers connected to the electrical system, generate a number of disturbances affecting the quality of electricity. Voltage fluctuations are among the major disturbances and the flicker phenomenon presented in the article is the effect of these fluctuations. Measuring the flicker with power quality analyzers appears to be the best method of assessing flicker levels. In the case of dynamically changing power consumed by arc furnaces, it is advisable to shorten the measurement intervals. This allows for a detailed analysis of disturbances during individual stages of the arc furnace smelting. The proposed method of determining the KN coefficient defining the increase in light flickering with arc furnaces operating in parallel in a steel mill, compared to the method recommended by UIE (Formula (14)), takes into account, among others: different powers of individual furnace transformers, supply conditions of the steel mill represented by short-circuit power, voltage reduction in supply network at successively connected electric arc furnaces and the individual smelting phases in the electric arc furnace. Assuming that the frequency of voltage fluctuations generated by arc furnaces changes within a small range from a few to several changes per second, it was found that the proposed KN factor determines both the degree of increase in voltage fluctuations and light flicker in the parallel operation of arc furnaces.
Author Contributions
Conceptualization, Z.O.; methodology, Z.O., Z.Ł.; software, Z.O.; validation, Z.O., Z.Ł.; formal analysis, Z.O., Z.Ł.; investigation, Z.O.; resources, Z.O.; data curation, Z.O.; writing—original draft preparation, Z.O.; writing—review and editing, Z.O.; visualization, Z.O.; supervision, Z.Ł.; project administration, Z.Ł.; funding acquisition, Z.Ł. All authors have read and agreed to the published version of the manuscript.
Funding
This research received no external funding.
Institutional Review Board Statement
Not applicable.
Informed Consent Statement
Not applicable.
Data Availability Statement
Data is contained within the article.
Conflicts of Interest
The authors declare no conflict of interest.
Abbreviations
The following nomenclatures are used in this manuscript:
| Plt | long-term flicker severity |
| Pst | short-term flicker severity |
| TCAB | transfer coefficient |
| C | coefficient of propagation (attenuation coefficient) |
| RSVC | factor that limits voltage fluctuations through the compensator |
| Rself | coefficient limiting voltage fluctuations through the choke |
| KN | coefficient determining the increase in flicker of light depending on the number of parallel operating arc furnaces in steel plant |
| PstN | value of the short-term light flicker indicator recorded during the operation N of arc furnaces |
| Pst1 | value of the short-term light flicker indicator recorded during the operation of a single arc furnace |
| N | number of parallel operating arc furnaces in steel plant |
| Sscf | short-circuit power capacity when shorting the electrodes with the scrap |
| Ssc | short-circuit power capacity of the network |
| ni* | cumulative amount |
| fi* | cumulative periodicity |
| Sntr | power of the furnace transformer |
| UN | rated voltage |
| ΔU | voltage fluctuations |
| ; | slope coefficients of the power–voltage characteristic calculated at a constant arc voltage and a constant arc resistance, respectively |
| mean reactive power drawn by j-th furnace | |
| voltage on the bus-bars of the steelwork at the work of N furnaces and the work of a single furnace (the furnace of the highest power, reference furnace), respectively | |
| Kst | coefficient characterizing the emission of fluctuations of the considered furnace, ranging between 48 and 85 with an average value of approx. 60 (Kst changes with the change of the probability function of not exceeding Pst) |
| C | attenuation coefficient between individual voltage levels |
| RSVC | a factor that limits voltage fluctuations through the compensator |
| Rself | coefficient limiting voltage fluctuations through the choke |
References
- Yu, Y.; Ju, P.; Peng, Y.; Lou, B.; Huang, H. Analysis of Dynamic Voltage Fluctuation Mechanism in Interconnected Power Grid with Stochastic Power Disturbances. J. Mod. Power Syst. Clean Energy 2020, 8, 38–45. [Google Scholar] [CrossRef]
- Orgulan, A.; Sukič, P.; Ribič, J. A Procedure for Mitigating the Light Flicker in Office LED Lighting Caused by Voltage Fluctuations. Energies 2019, 12, 3975. [Google Scholar] [CrossRef] [Green Version]
- Xinming, G.; Qunhai, H.; Tongzhen, W.; Jingyuan, Y. A Local Control Strategy for Distributed Energy Fluctuation Suppression Based on Soft Open Point. Energies 2020, 13, 1520. [Google Scholar] [CrossRef] [Green Version]
- Lodetti, S.; Azcarate, I.; Gutierrez, J.J.; Leturiondo, L.A.; Redondo, K.; Saiz, P.; Estela, J.J.M.; Romero, J.B. Flicker of Modern Lighting Technologies Due to Rapid Voltage Changes. Energies 2019, 12, 865. [Google Scholar] [CrossRef] [Green Version]
- UIE. Guide to Quality of Electical Supply for Industrial Installations; Part 1; UIE Edition: Paris, France, 1993. [Google Scholar]
- Marulanda-Durango, J.; Escobar-Mejía, A.; Alzate-Gomez, A.; Alvarez-Lopez, M. A Support Vector machine-Based method for parameter estimation of an electric arc furnace model. Electr. Power Syst. Res. 2021, 196, 107228. [Google Scholar] [CrossRef]
- Kanálik, M.; Margitová, A.; Bena, L.; Kanáliková, A. Power System Impedance Estimation Using a Fast Voltage and Current Changes Measurements. Energies 2021, 14, 63. [Google Scholar] [CrossRef]
- Qingyuan, Y.; Aoki, M. Suppression of Voltage Fluctuation by Utilizing Consumer-Side Energy Storage Devices in PV Connected Distribution System. IFAC Pap. Online 2018, 51, 432–437. Available online: https://www.sciencedirect.com/science/article/pii/S240589631833461X (accessed on 25 June 2021). [CrossRef]
- Albert, H.; Golovanov, N.; Elefterescu, L. Propagation of disturbances as voltage fluctuations in transmission networks; Problemele Energeticii Regionale. Electroenergetică 2016, 2, 48–54. [Google Scholar]
- Singh, A.; Singh, R.K.; Singh, A.K. Power Quality Issues of Electric Arc Furnace and their Mitigations -a Review. Int. J. Adv. Eng. Res. Sci. (IJAERS) 2017, 4, 237114. [Google Scholar] [CrossRef]
- Bhonsle, D.C.; Kelkar, R.B. Analyzing power quality issues in electric arc furnace by modeling. Energy 2016, 115, 830–839. [Google Scholar] [CrossRef]
- Hanzelka, Z. Electricity Supply Quality. RMS Voltagedisturbance, (Jakość Dostawy Energii Elektrycznej. Zaburzeniawartościskutecznejnapięcia); Wydawnictwa AGH: Kraków, Poland, 2013. (In Polish) [Google Scholar]
- Łukasik, Z.; Olczykowski, Z. Estimating the Impact of Arc Furnaces on the Quality of Power in Supply Systems. Energies 2020, 13, 1462. [Google Scholar] [CrossRef] [Green Version]
- Olczykowski, Z. Modeling of Voltage Fluctuations Generated by Arc Furnaces. Appl. Sci. 2021, 11, 3056. [Google Scholar] [CrossRef]
- Kiyoumarsi, A.; Ataei, M.; Hooshmand, R.; Kolagar, A.D. Electric Arc Furnace Voltage Flicker Mitigation by Applying a Predictive Method with Closed Loop Control of the TCR/FC Compensator. J. Electr. Eng. Technol. 2010, 5, 116–128. [Google Scholar] [CrossRef] [Green Version]
- García-Cerrada, A.; García-González, P.; Collantes, R.; Gómez, T.; Anzola, J. Comparison of Thyristor-Controlled Reactors and Voltage-Source Inverters for Compensation of Flicker Caused by Arc Furnaces. IEEE Trans. Power Deliv. 2000, 15, 1223–1231. [Google Scholar] [CrossRef] [Green Version]
- Sarma, P.M.; Jayaram Kumar, S.V. Electric Arc Furnace Flicker Mitigation in a Steel Plant Using a Statcom, International. J. Eng. Sci. Innov. Technol. (IJESIT) 2013, 2, 227–231. [Google Scholar]
- Cernan, M.; Müller, Z.; Josef Tlusty, J.; Valouch, V. An improved SVC control for electric arc furnace voltage flicker mitigation. Int. J. Electr. Power Energy Syst. 2021, 129, 106831. [Google Scholar] [CrossRef]
- Lange, A.G.; Redlarski, G. Selection of C-Type Filters for Reactive Power Compensation and Filtration of Higher Harmonics Injected into the Transmission System byArc Furnaces. Energies 2020, 13, 2330. [Google Scholar] [CrossRef]
- Akkaya, S.; Salor, O. Enhanced spectral decomposition method for light flicker evaluation of incandescent lamps caused by electric arc furnaces. J. Fac. Eng. Archit. Gazi Univ. 2019, 34, 987–1005. [Google Scholar]
- Cheng, F.; Xie, L.; Wang, Z. Research on Serial VSC-LCC Hybrid HVdc Control Strategy and Filter Design Scheme. Energies 2020, 13, 2260. [Google Scholar] [CrossRef]
- Antchev, M. Chapter 9—Classical and Recent Aspects of Active Power Filters for Power Quality Improvement. In Classical and Recent Aspects for Power System Optimization; Academic Press: Cambridge, MA, USA, 2018; pp. 219–254. [Google Scholar] [CrossRef]
- Antchev, M.; Petkova, M.; Gourgoulitsov, V.; Antchev, H. Investigation of "Unified|Voltage Conditioner—UVC". J. Power Electron. 2012, 12, 357–362. [Google Scholar] [CrossRef]
- IEC 61000-4-15: Electromagnetic Compatibility (EMC)—Testing and Measurement Techniques—Flickermeter—Functional and Design Specifications. Available online: https://webstore.iec.ch/p-preview/info_iec61000-4-15%7Bed1.1%7Den_d.pdf (accessed on 25 June 2021).
- PN-T-01030:1996/A1, Kompatybilność Elektromagnetyczna (EMC). Terminologia, (Developed on the Basis of IEC Publication 61000, Part 1: General, Section 1: Application and Interpretation of Fundamental Definitions and Terms). 1999. Available online: https://sklep.pkn.pl/pn-t-01030-1996-a1-1999p.html (accessed on 25 June 2021).
- Désquilbet, G. Les Fluctuations Rapides de Tension et le Phenomene de Papillotement des Lampes (Flicker); Electricite de France—EDF, HR22/95/GD8.A: Clamart Cedex, France, 1995. [Google Scholar]
- Wilkins, A.; Veitch, J.; Lehman, B. LED lighting flicker and potential health concerns: IEEE standard PAR 1789 update. In IEEE Energy Conversion Congress and Exposition; Institute of Electrical and Electronics Engeneers: Atlanta, GA, USA, 2010. [Google Scholar]
- Wolska, A. Psychophysiology of Vision. Lighting Technique ’96. Guide—Guide; Polish Lighting Committee, Association of Polish Electricians: Warsaw. Poland, 1996. (In Polish) [Google Scholar]
- UIE Flickermeter. Functional and Design Specifications. Disturbances Study Committee Flicker Measuring Methods WG; IEC: Geneva, Switzerland, 1983. [Google Scholar]
- Mombauer, W. Calculating a New Reference Point for the IEC-Flickermeter. ETEP 1998, 8, 429–436. [Google Scholar]
- IEC 61000-3-3: Limits-Section 3: Limitation of Voltage Changes, Voltage Fluctuations and Flicker in Public Low Voltage Supply Systems, for Equipment with Rated Current. 2002. Available online: https://standards.globalspec.com/std/14220810/cei-en-61000-3-3 (accessed on 25 June 2021).
- EN 50160: 2011/A3:2020: Voltage Characteristics of Electricity Supplied by Public Electricity Networks. European Standard, European Committee for Electrotechnical Standardization. Available online: https://www.en-standard.eu/une-en-50160-2011-a3-2020-voltage-characteristics-of-electricity-supplied-by-public-electricity-networks (accessed on 25 June 2021).
- PN-EN50160: 2014: Parameters of the Supply Voltage in the Public Power Networks; Polish Committee of Standardization: Warsaw, Poland, 2014.
- Ordinance of the Minister of Economy of 4 May 2007 on the Detailed Conditions for the Functioning of the System. (In Polish) Rozporządzenie Ministra Gospodarki z Dnia 4 Maja 2007 r. w Sprawie Szczegółowych Warunków Funkcjonowania Systemu. 2007. Available online: http://prawo.sejm.gov.pl/isap.nsf/DocDetails.xsp?id=WDU20070930623 (accessed on 25 June 2021).
- Brociek, W.; Grzywacz, T.; Wilanowicz, R. Propagation of higher harmonics of voltage and current in the power system at changing location of nonlinear load. In Proceedings of the 18th International Conference on Computational Problems of Electrical Engineering (CPEE), Kutna Hora, Czech Republic, 11–13 September 2017. [Google Scholar]
- Arlt, D.; De Souza Bronzeado, H.; Cal, R.; De Jeager, E. Review of Flicker Objectives for LV, MV and HV Systems; Technical Repotr number: TB 449 ISBN: 978-2-85873-138-1, Affiliation: CIGRE 2011. Paris: CIGRE. Available online: https://www.researchgate.net/publication/248708309_Review_of_flicker_objectives_for_LV_MV_and_HV_systems (accessed on 25 June 2021).
- Bhattacharyya, S.; Cai, R.; Cobben, S.; Myrzik, J.; Kling, W. Flicker propagation study in a typical Dutch grid, CIRED. In Proceedings of the 20th International Conference on Electricity Distribution, Prague, Czech Republic, 8–11 June 2009. Paper 0102. [Google Scholar]
- Perera, S.; Robinson, D.; Elphick, S.; Geddey, D.; Browne, N.; Smith, V.; Gosbell, V. Synchronized Flicker Measurement for Flicker Transfer Evaluation in Power Systems. IEEE Trans. Power Deliv. 2006, 21, 1477–1482. [Google Scholar] [CrossRef]
- De Jaeger, E.; Borloo, G.; Vancoetsem, W. Flicker Transfer Coefficients from HV to MV and LV System. Laborelec. UIEPQ—9733 1997, 2, 101–102. [Google Scholar]
- Robert, A. Predetermination du flicker provoque par les fours a arc etat de la question. Laborelec. Section E 1991. [Google Scholar]
- Klempka, R. An Arc Furnace as a Source of Voltage Disturbances—A Statistical Evaluation of Propagation in the Supply Network. Energies 2021, 14, 107. [Google Scholar] [CrossRef]
- UIE. Connection of Fluctuating Loads; Disturbances Working Group, Miara, C., Eds.; Union Internationale d’Electrothermie: Puteaux, France; Paris, France, 1988. [Google Scholar]
- Wąsowski, A. Fluctuations de tension (flicker). Révue Générale L’electricité 1979, 3, 1–8. (In Polsih) [Google Scholar]
- Wąsowski, A. The impact of the actual operating conditions of a three-phase arc furnace on the criterion of maximum efficiency and overall efficiency. (in Polish: Wpływ rzeczywistych warunków eksploatacyjnych trójfazowego pieca łukowego na kryterium maksymalnej wydajności oraz na sprawność ogólną.). Electr. Power Qual. Util. 2000, 1, 71–76. [Google Scholar]
- Olczykowski, Z. Methods of determination of the voltage fluctuations and light flicker at simultaneous operation of three-phase arc furnaces. Electr. Power Qual. Util. 2003, 9, 47–58. [Google Scholar]
- Commission Regulation (EU) 2019/2020 of 1 October 2019 Laying Down Ecodesign Requirements for Light Sources and Separate Control Gears Pursuant to Directive 2009/125/EC of the European Parliament and of the Council and Repealing Commission Regulations (EC) No 244/2009, (EC) No 245/2009 and (EU) No 1194/2012. Available online: https://op.europa.eu/en/publication-detail/-/publication/33be9f4b-1729-11ea-8c1f-01aa75ed71a1/language-en (accessed on 25 June 2021).
- Gao, H.; Xu, P.; Tao, J.; S Huang, S.; Wang, R.; Q Zhou, Q. Voltage Flicker Detection Based on Probability Resampling. Energies 2020, 13, 3350. [Google Scholar] [CrossRef]
- Hering, M. Fundamentals of Electrothermic, Podstawy Elektrotermii; Scientific-Technical Publishers: Warsaw, Poland, 1992. (in Polish) [Google Scholar]
- Arlt, D.; Eberlein, C. Network disturbances caused by Ultra High Power electric arc furnaces and possible reduction methods. In Proceedings of the Conference Electrical Power Quality and Utilisation, Cracow, Poland, 23–25 September 1997. [Google Scholar]
Figure 1.
The development and perception of flicker of light caused by arc furnaces.

Figure 2.
RMS value changes (a) and voltage fluctuations (b) recorded in the power supply line lighting receivers.
Figure 2.
RMS value changes (a) and voltage fluctuations (b) recorded in the power supply line lighting receivers.

Figure 3.
Places of measurement of voltage fluctuations and flicker indicators.

Figure 4.
Changes of Pst short-term flicker severity recorded simultaneously during one week of measurements at two points: steelworks supply line—point A, EAF supply line—point B (a); correlation between the flicker Pst Point A and Point B (b).
Figure 4.
Changes of Pst short-term flicker severity recorded simultaneously during one week of measurements at two points: steelworks supply line—point A, EAF supply line—point B (a); correlation between the flicker Pst Point A and Point B (b).

Figure 5.
Changes of Pst short-term flicker severity recorded simultaneously during one smelting of measurements at two points: steelworks supply line—point A, EAF supply line—point B (a), correlation between the flicker Pst Point A and Point B (b).
Figure 5.
Changes of Pst short-term flicker severity recorded simultaneously during one smelting of measurements at two points: steelworks supply line—point A, EAF supply line—point B (a), correlation between the flicker Pst Point A and Point B (b).

Figure 6.
Changes of Pst short-term flicker severity recorded simultaneously during one week of measurements at three points: steelworks supply line—point A, EAF supply line—point B, LF supply line—point C.
Figure 6.
Changes of Pst short-term flicker severity recorded simultaneously during one week of measurements at three points: steelworks supply line—point A, EAF supply line—point B, LF supply line—point C.

Figure 7.
Changes of Pst short-term flicker severity recorded during one week of measurement (Pst_Point A_meas) and determined by Formula (5) (Pst_Point A_cal).
Figure 7.
Changes of Pst short-term flicker severity recorded during one week of measurement (Pst_Point A_meas) and determined by Formula (5) (Pst_Point A_cal).

Figure 8.
Changes of Pst short-term flicker severity recorded simultaneously during one week of measurements at two points: steelworks supply line (Pst_Point A_meas), EAF supply line (Pst_Point B_meas) and determined by the Formula (5) (Pst_Point B_cal).
Figure 8.
Changes of Pst short-term flicker severity recorded simultaneously during one week of measurements at two points: steelworks supply line (Pst_Point A_meas), EAF supply line (Pst_Point B_meas) and determined by the Formula (5) (Pst_Point B_cal).

Figure 9.
Changes of Pst short-term flicker severity recorded during one week of measurement (Pst_110 kV_meas) and determined by the Formula (5) (Pst_400 kV_cal).
Figure 9.
Changes of Pst short-term flicker severity recorded during one week of measurement (Pst_110 kV_meas) and determined by the Formula (5) (Pst_400 kV_cal).

Figure 10.
Changes of Pst Pst short-term flicker severity determined by Formula (5) (Pst_Point B_cal).
Figure 10.
Changes of Pst Pst short-term flicker severity determined by Formula (5) (Pst_Point B_cal).

Figure 11.
Changes in the short-term flicker severity Pst recorded during one melt in the arc furnace.
Figure 11.
Changes in the short-term flicker severity Pst recorded during one melt in the arc furnace.

Figure 12.
Distribution of the probability density function of short-term flicker severity: theoretical and real.
Figure 12.
Distribution of the probability density function of short-term flicker severity: theoretical and real.

Figure 13.
Probability density function for one day of measurements of the short-term severity flicker Pst.
Figure 13.
Probability density function for one day of measurements of the short-term severity flicker Pst.

Figure 14.
Changes in RMS voltage with arc furnaces off, one and two furnaces on.

Figure 15.
Changes in voltage fluctuations (ΔU) with arc furnaces off, one and two furnaces on.

Figure 16.
Changes of short-term severity flicker Pst, voltage fluctuations ΔU (a) measured during one melt and correlation between Pst—ΔU (b).
Figure 16.
Changes of short-term severity flicker Pst, voltage fluctuations ΔU (a) measured during one melt and correlation between Pst—ΔU (b).


Figure 17.
Changes in coefficient KN according to the number of parallel operating arc furnaces in steel plant.
Figure 17.
Changes in coefficient KN according to the number of parallel operating arc furnaces in steel plant.

Figure 18.
Changes of long-term severity flicker Plt and short-term severity flicker Pst measured during one week in the supply line to the ironworks (a) and steel plant (b).
Figure 18.
Changes of long-term severity flicker Plt and short-term severity flicker Pst measured during one week in the supply line to the ironworks (a) and steel plant (b).


Table 1.
Statistical parameters of the short-term flicker severity Pst measured during one melt in the arc furnace.
Table 1.
Statistical parameters of the short-term flicker severity Pst measured during one melt in the arc furnace.
| Class Number | Class Range | Center Class | Amount | Periodicity | Cumulative Amount | Cumulative Periodicity |
|---|---|---|---|---|---|---|
| I | Pst | Pst | ni | fi | ni* | fi* |
| 1 | 0.15–1.12 | 0.635 | 52 | 0.107 | 52 | 0.107 |
| 2 | 1.13–2.09 | 1.61 | 58 | 0.119 | 110 | 0.226 |
| 3 | 2.10–3.06 | 2.58 | 94 | 0.193 | 204 | 0.420 |
| 4 | 3.07–4.03 | 3.55 | 103 | 0.212 | 307 | 0.632 |
| 5 | 4.04–5.00 | 4.52 | 64 | 0.132 | 371 | 0.763 |
| 6 | 5.01–5.97 | 5.49 | 47 | 0.097 | 418 | 0.860 |
| 7 | 5.98–6.94 | 6.46 | 37 | 0.076 | 455 | 0.936 |
| 8 | 6.95–7.91 | 7.43 | 18 | 0.037 | 473 | 0.973 |
| 9 | 7.92–8.88 | 8.4 | 8 | 0.016 | 481 | 0.990 |
| 10 | 8.89–9.85 | 8.92 | 5 | 0.010 | 486 | 1.000 |
Table 2.
Statistical parameters of the short-term flicker severity Pst measured in one day.
| Class Number | Class Range | Center Class | Amount | Periodicity | Cumulative Amount | Cumulative Periodicity |
|---|---|---|---|---|---|---|
| i | Pst | Pst | ni | fi | ni* | fi* |
| 1 | 0.25–1.31 | 0.780 | 8 | 0.0556 | 8 | 0.0556 |
| 2 | 1.32–2.37 | 1.845 | 20 | 0.1389 | 28 | 0.1944 |
| 3 | 2.38–3.43 | 2.905 | 30 | 0.2083 | 58 | 0.4028 |
| 4 | 3.44–4.49 | 3.965 | 30 | 0.2083 | 88 | 0.6111 |
| 5 | 4.50–5.55 | 5.025 | 28 | 0.1944 | 116 | 0.8056 |
| 6 | 5.56–6.61 | 6.085 | 20 | 0.1389 | 136 | 0.9444 |
| 7 | 6.62–7.67 | 7.145 | 8 | 0.0556 | 144 | 1.0000 |
Table 3.
Statistical data for the χ2 Pearson test.
| Psti | ni | zi | F(zi) | pi | npi | (ni − npi)2/npi |
|---|---|---|---|---|---|---|
| 1.31 | 8 | −1.56 | 0.0594 | 0.06 | 8.55 | 0.0358 |
| 2.37 | 20 | −0.93 | 0.1762 | 0.12 | 16.82 | 0.6015 |
| 3.43 | 30 | −0.30 | 0.3821 | 0.21 | 29.65 | 0.0041 |
| 4.49 | 30 | 0.32 | 0.6255 | 0.24 | 35.05 | 0.7275 |
| 5.55 | 28 | 0.95 | 0.8289 | 0.20 | 29.29 | 0.0568 |
| 6.61 | 20 | 1.58 | 0.9429 | 0.11 | 16.42 | 0.7825 |
| 7.67 | 8 | 2.21 | 0.9864 | 0.06 | 8.55 | 0.0358 |
| Sum | 144 | x | x | 1.00 | 144 | 2.2441 |
Publisher’s Note: MDPI stays neutral with regard to jurisdictional claims in published maps and institutional affiliations. |
© 2021 by the authors. Licensee MDPI, Basel, Switzerland. This article is an open access article distributed under the terms and conditions of the Creative Commons Attribution (CC BY) license (https://creativecommons.org/licenses/by/4.0/).
Share and Cite
MDPI and ACS Style
Olczykowski, Z.; Łukasik, Z. Evaluation of Flicker of Light Generated by Arc Furnaces. Energies 2021, 14, 3901. https://doi.org/10.3390/en14133901
AMA Style
Olczykowski Z, Łukasik Z. Evaluation of Flicker of Light Generated by Arc Furnaces. Energies. 2021; 14(13):3901. https://doi.org/10.3390/en14133901
Chicago/Turabian StyleOlczykowski, Zbigniew, and Zbigniew Łukasik. 2021. "Evaluation of Flicker of Light Generated by Arc Furnaces" Energies 14, no. 13: 3901. https://doi.org/10.3390/en14133901
Note that from the first issue of 2016, this journal uses article numbers instead of page numbers. See further details here.