
Identification of DC Thermal Steady-State Differential Inductance of Ferrite Power Inductors


Abstract
:1. Introduction
2. Methodology
2.1. Impact of Losses in an Inductor for DC–DC Converter
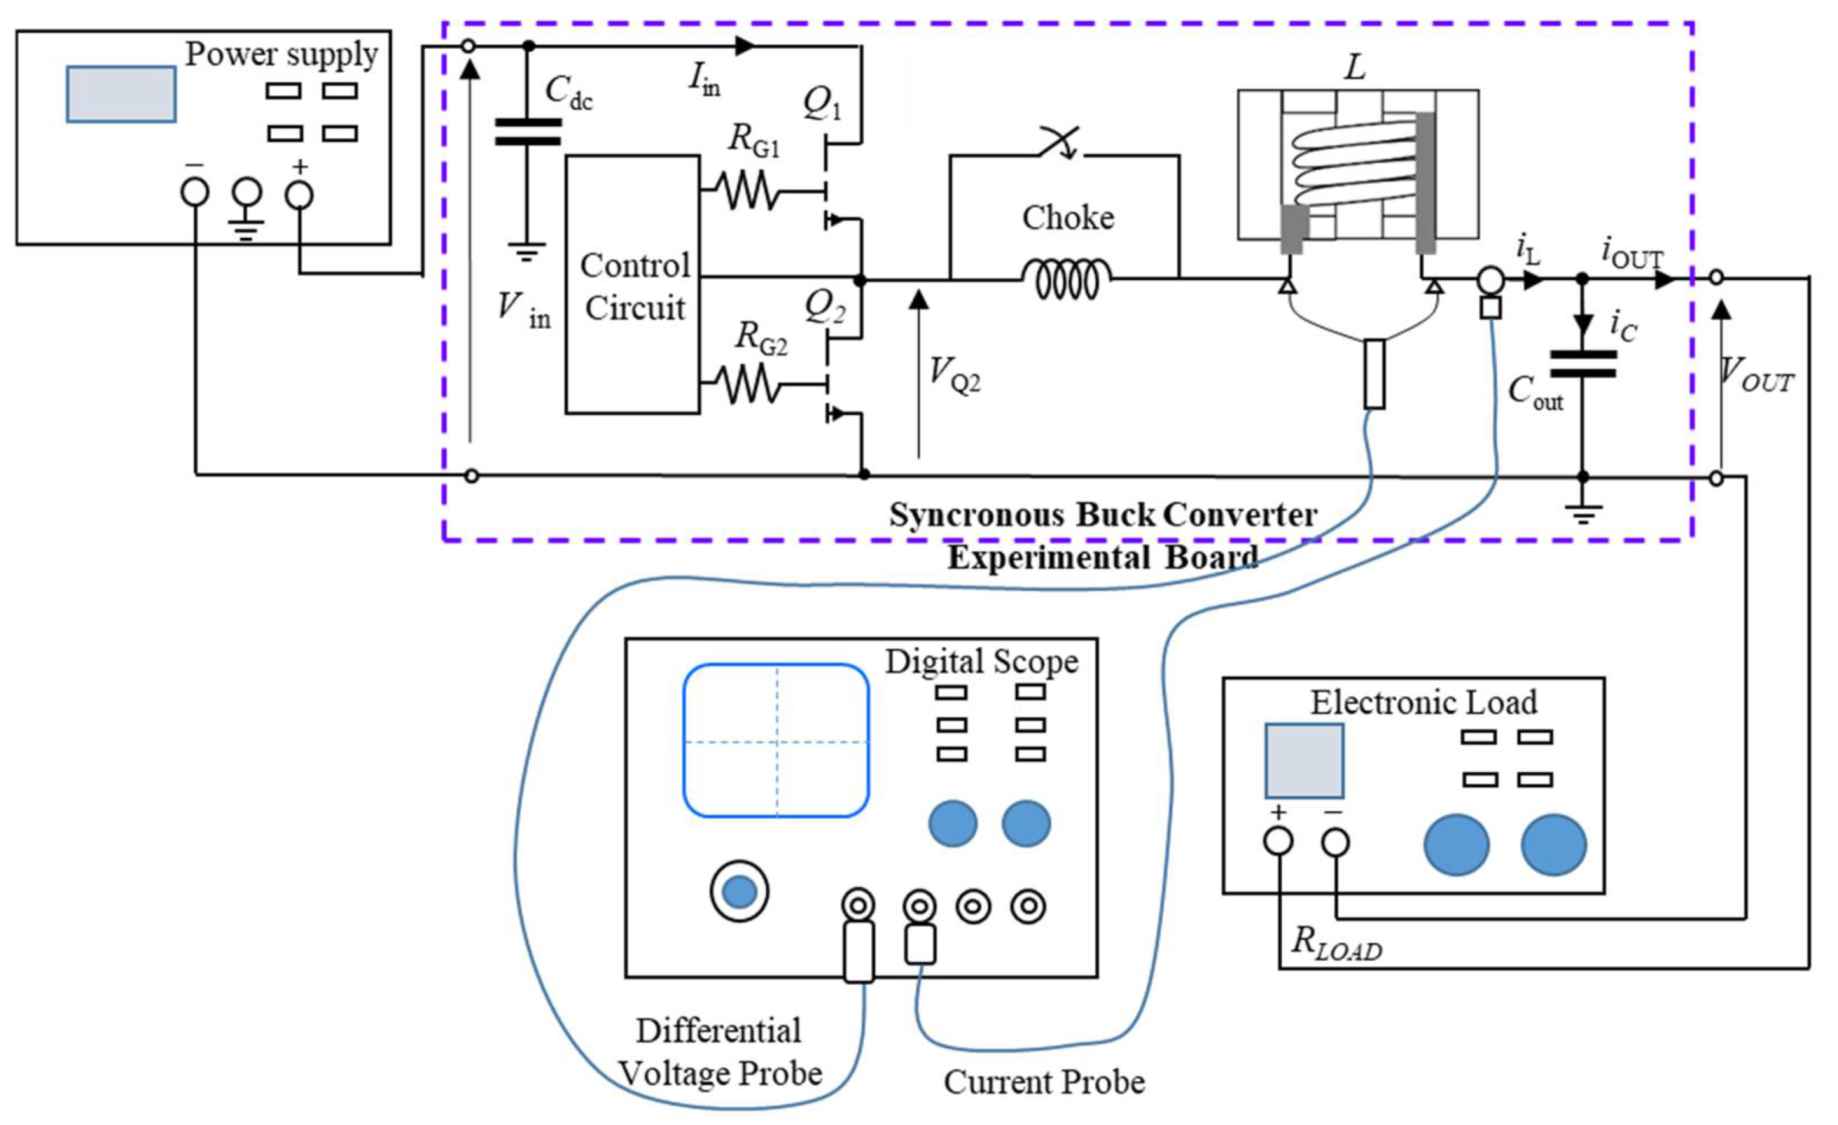
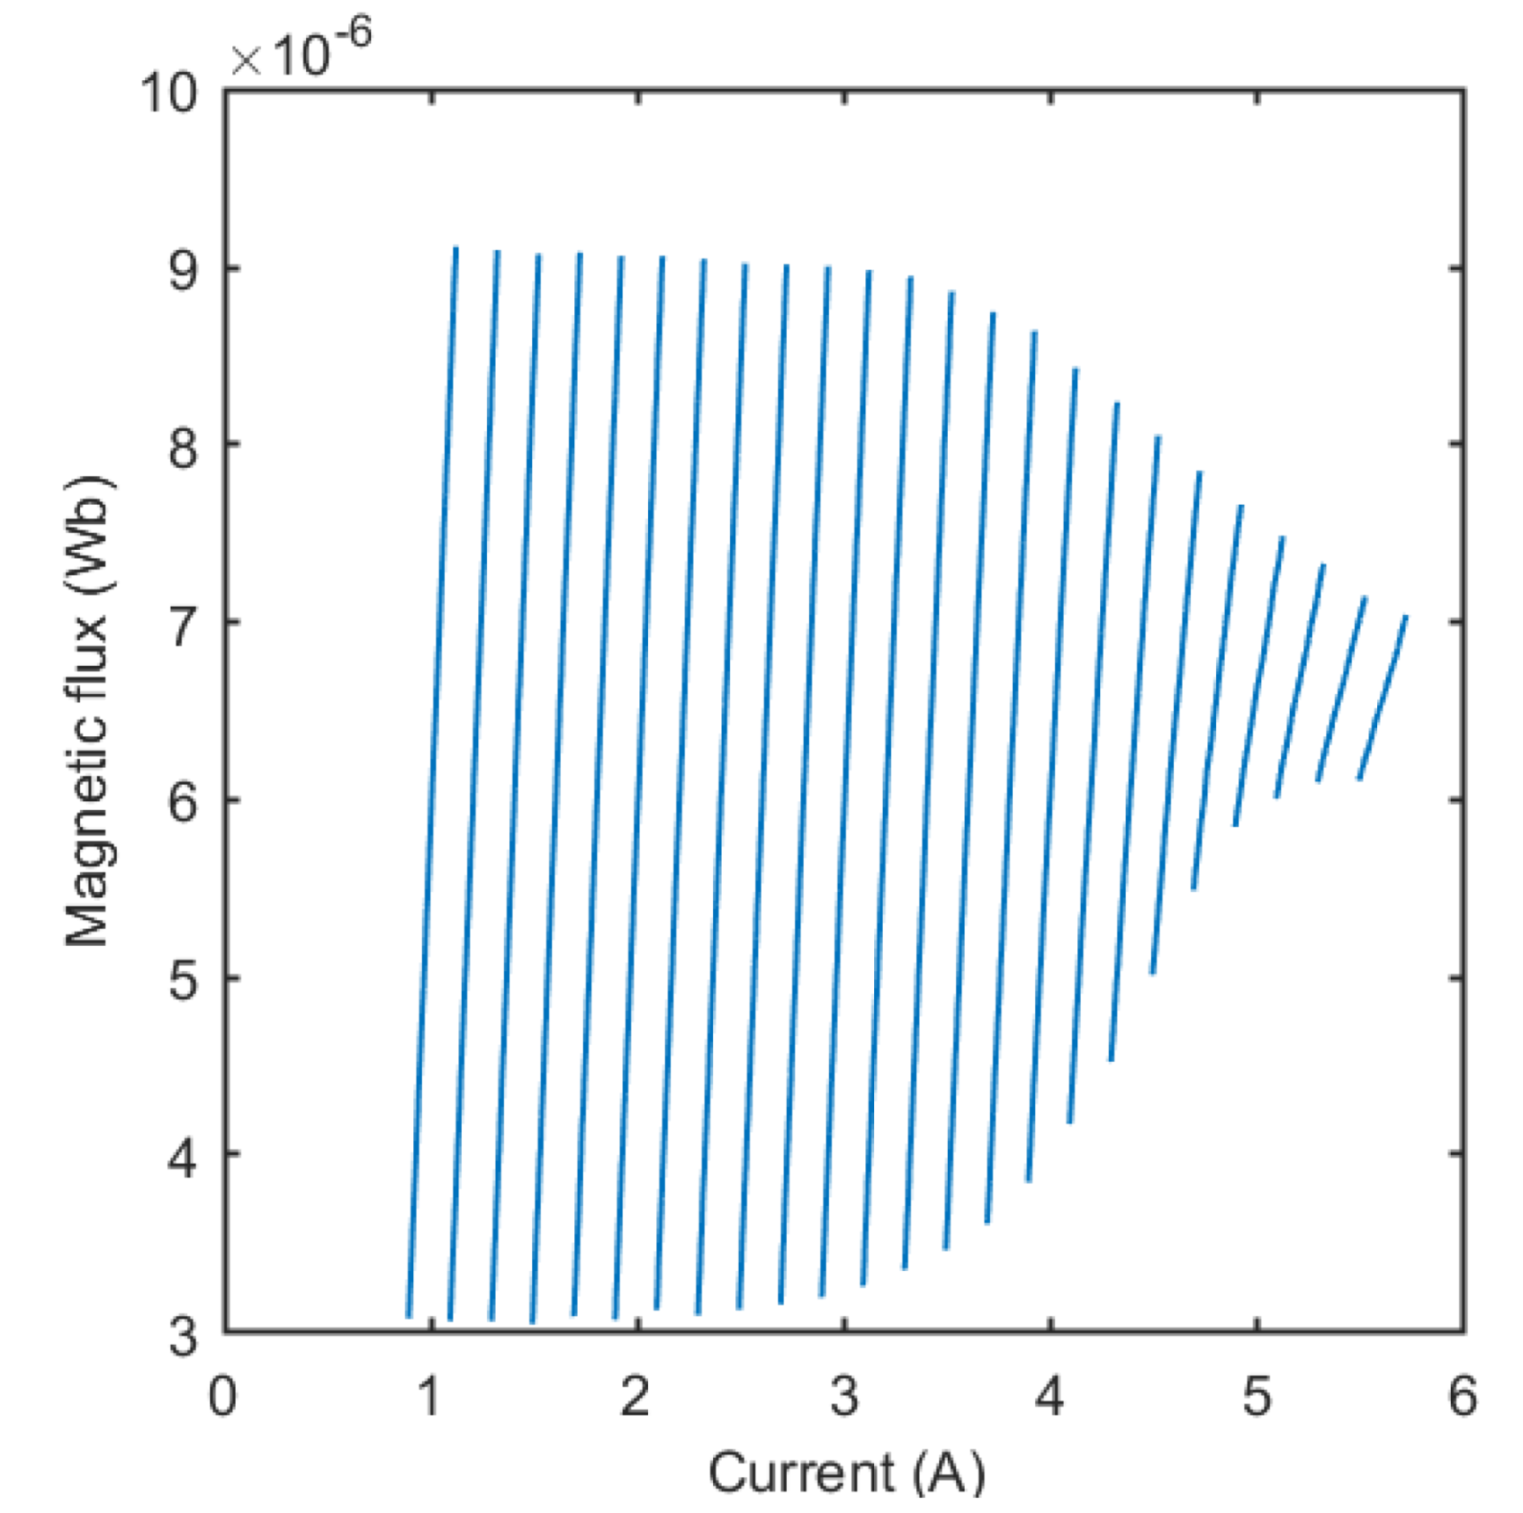
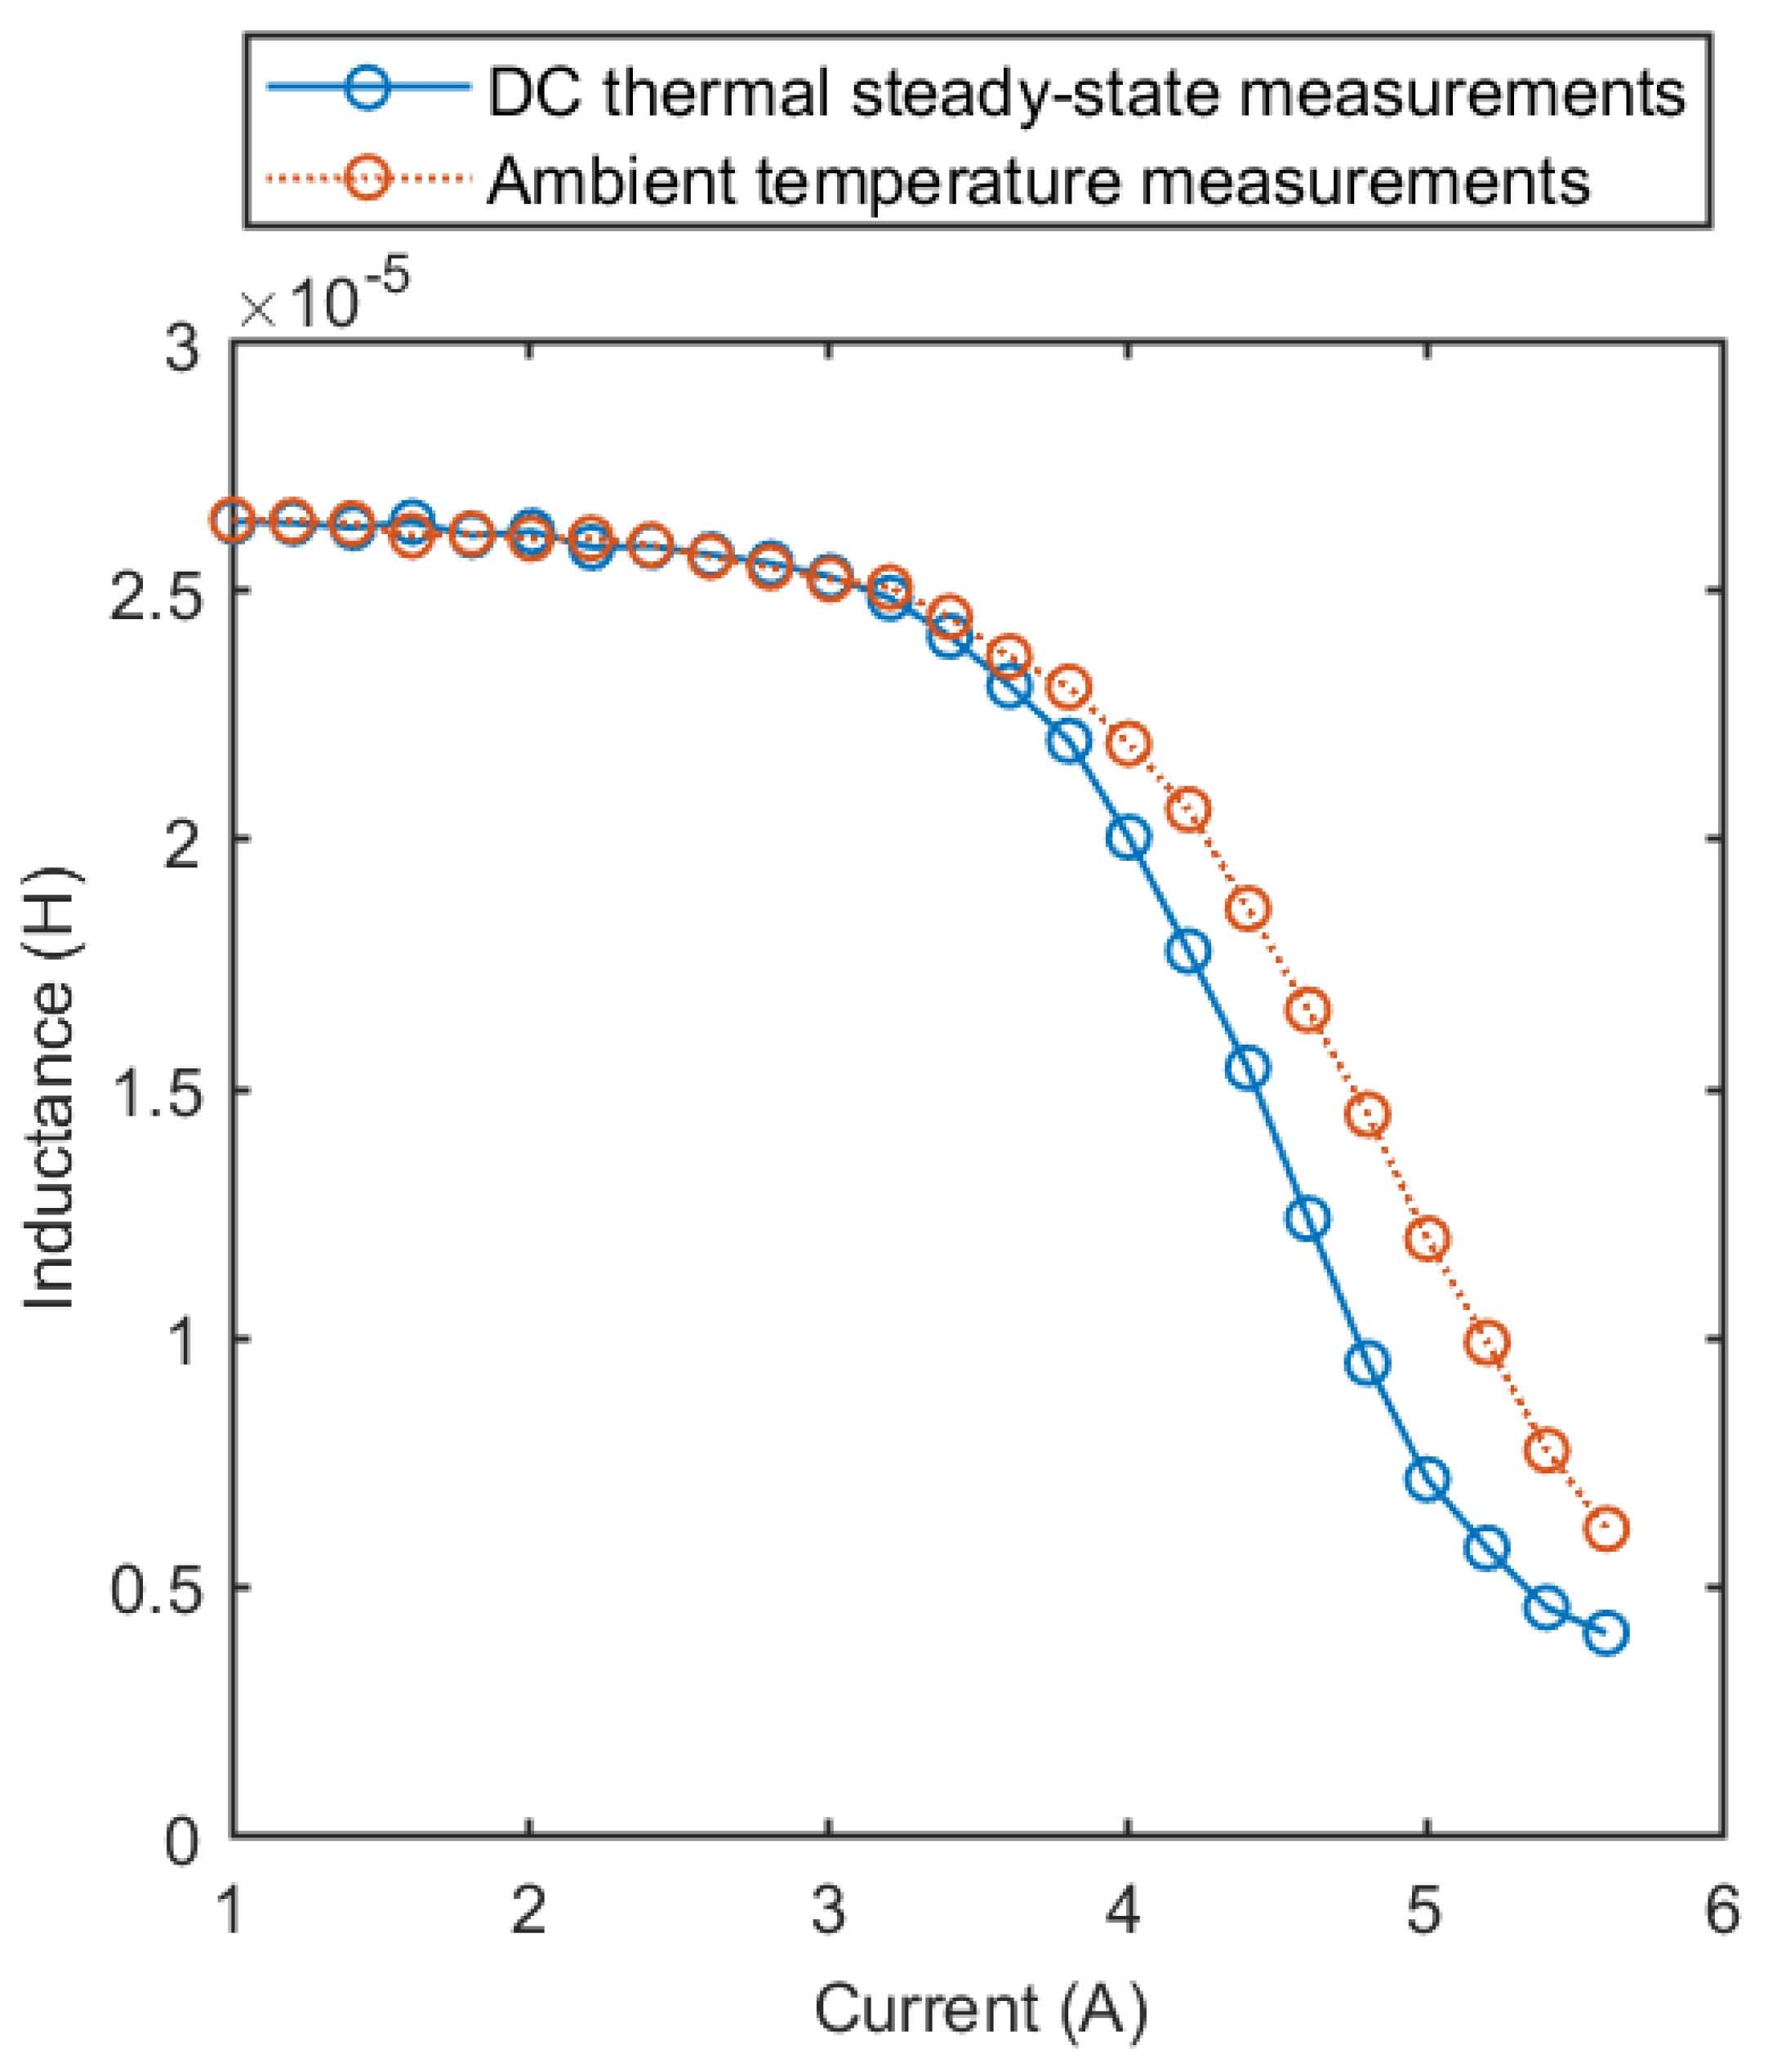
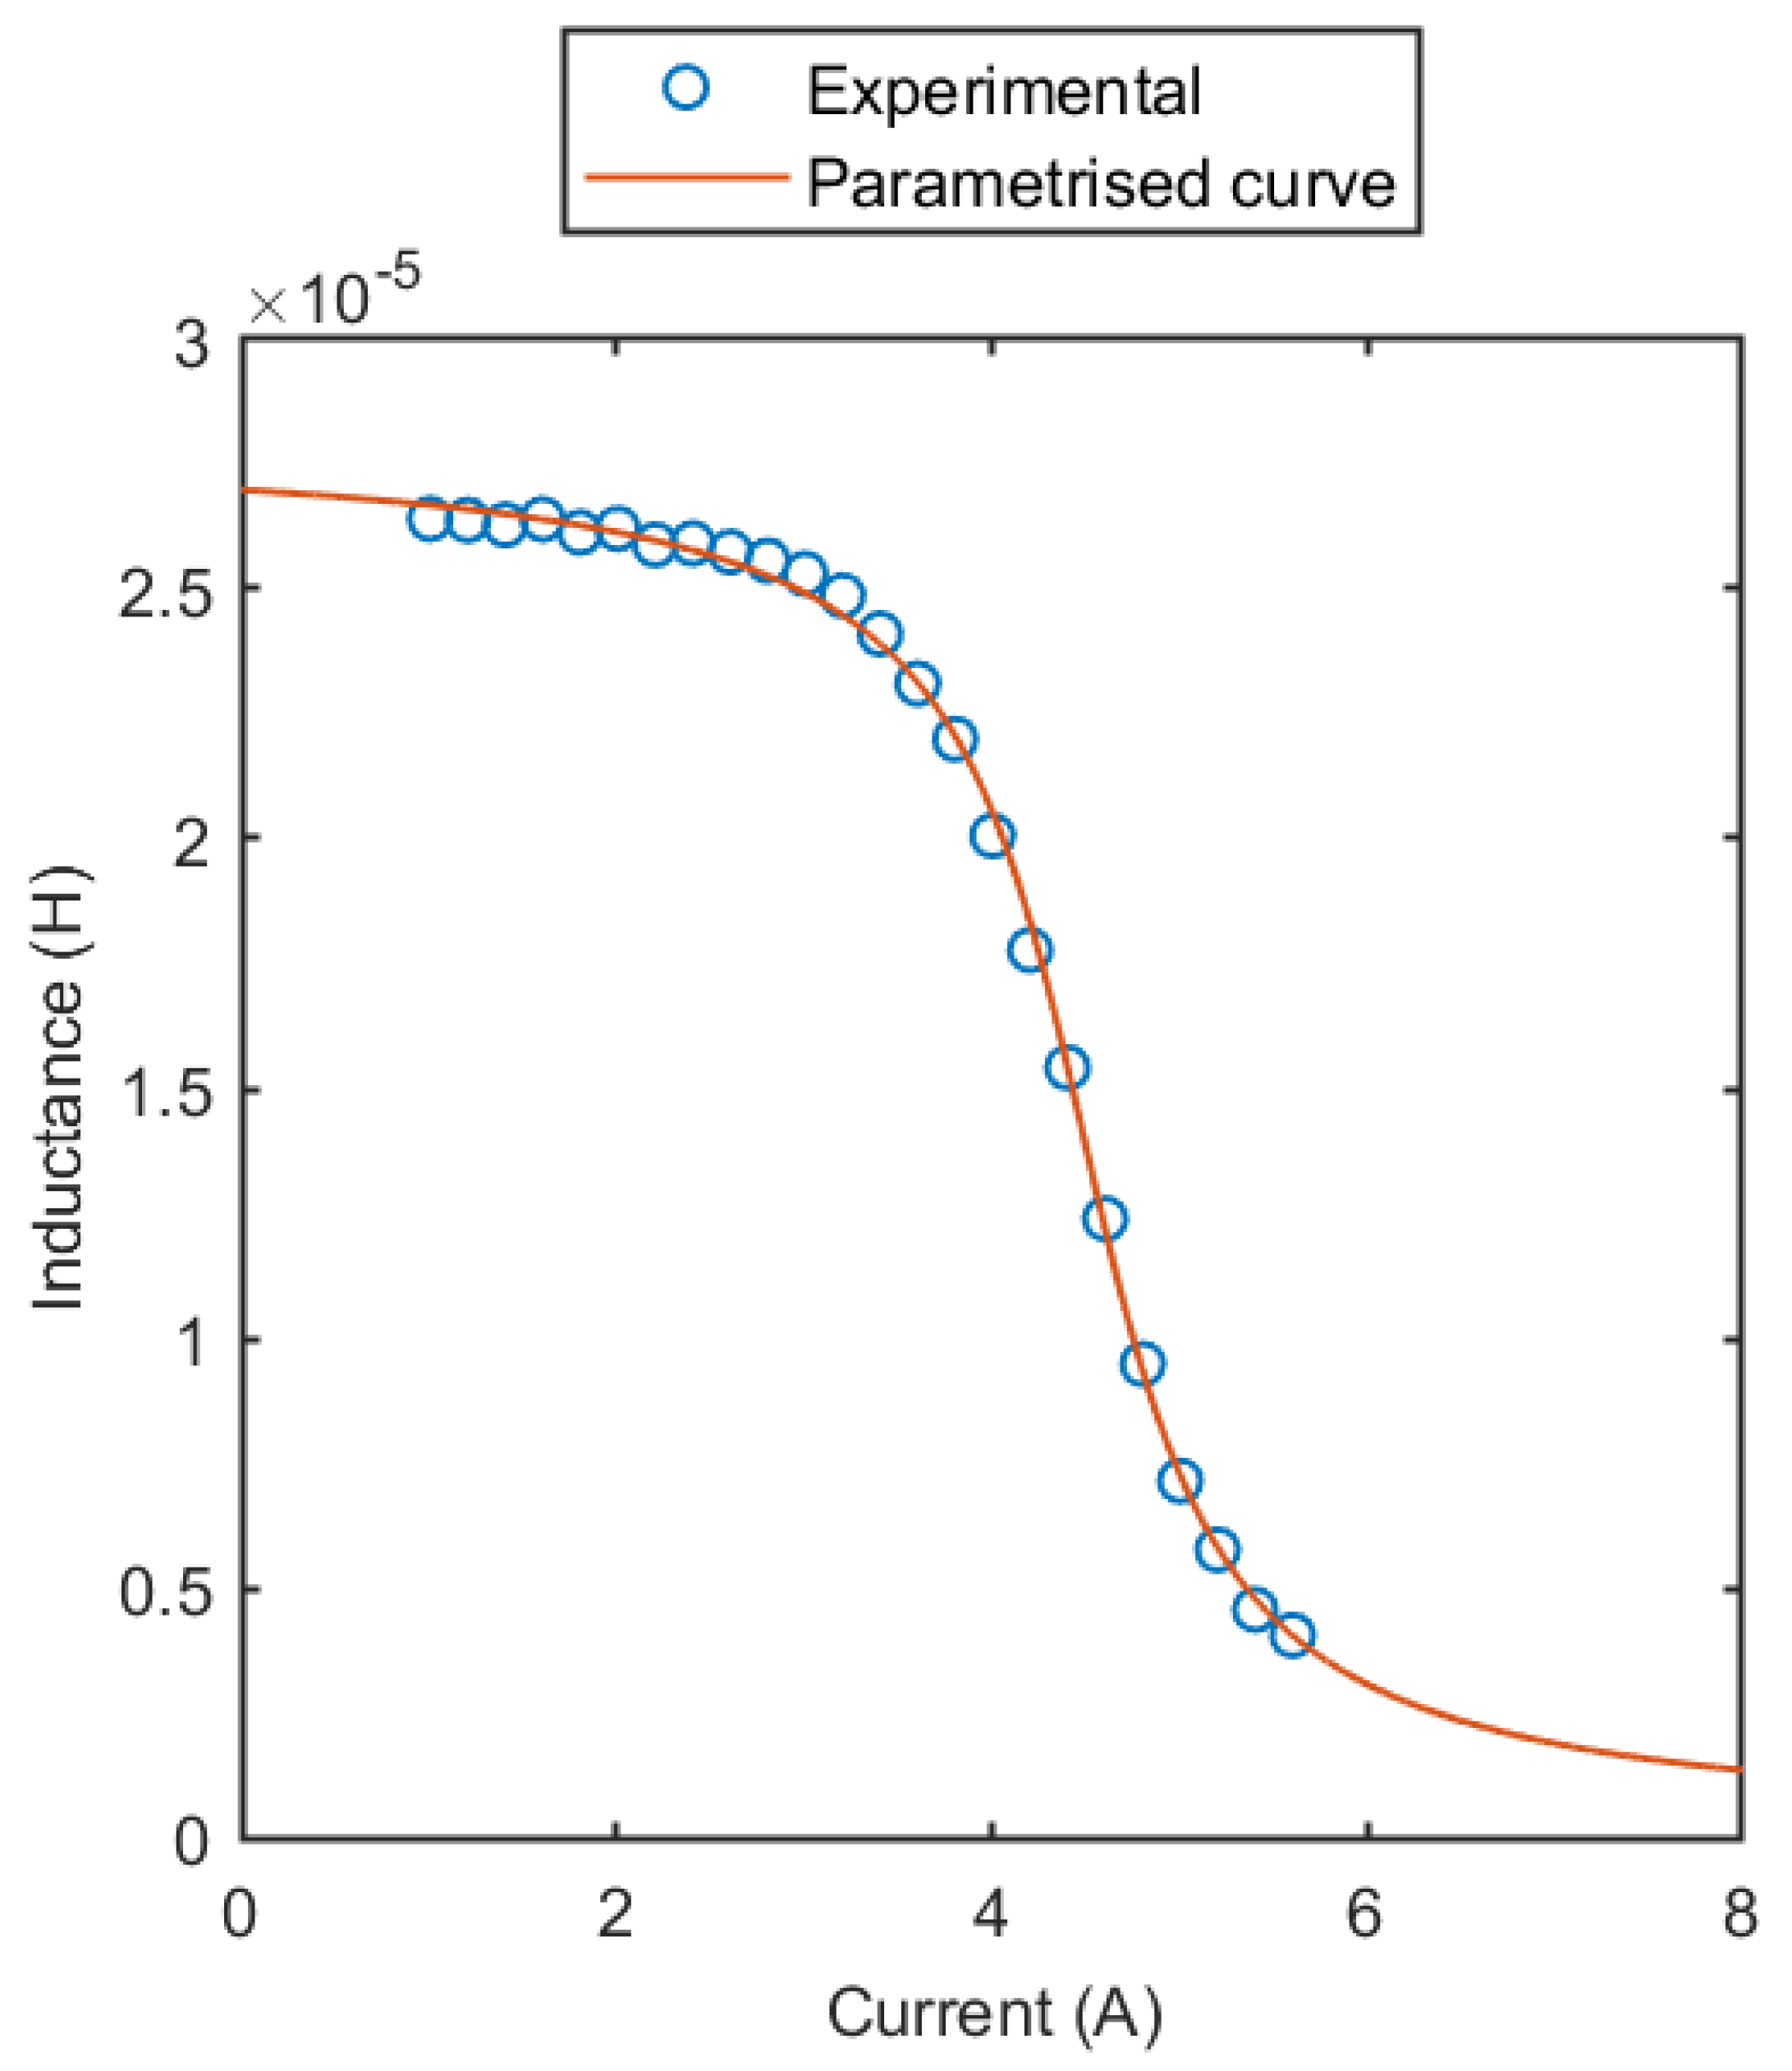
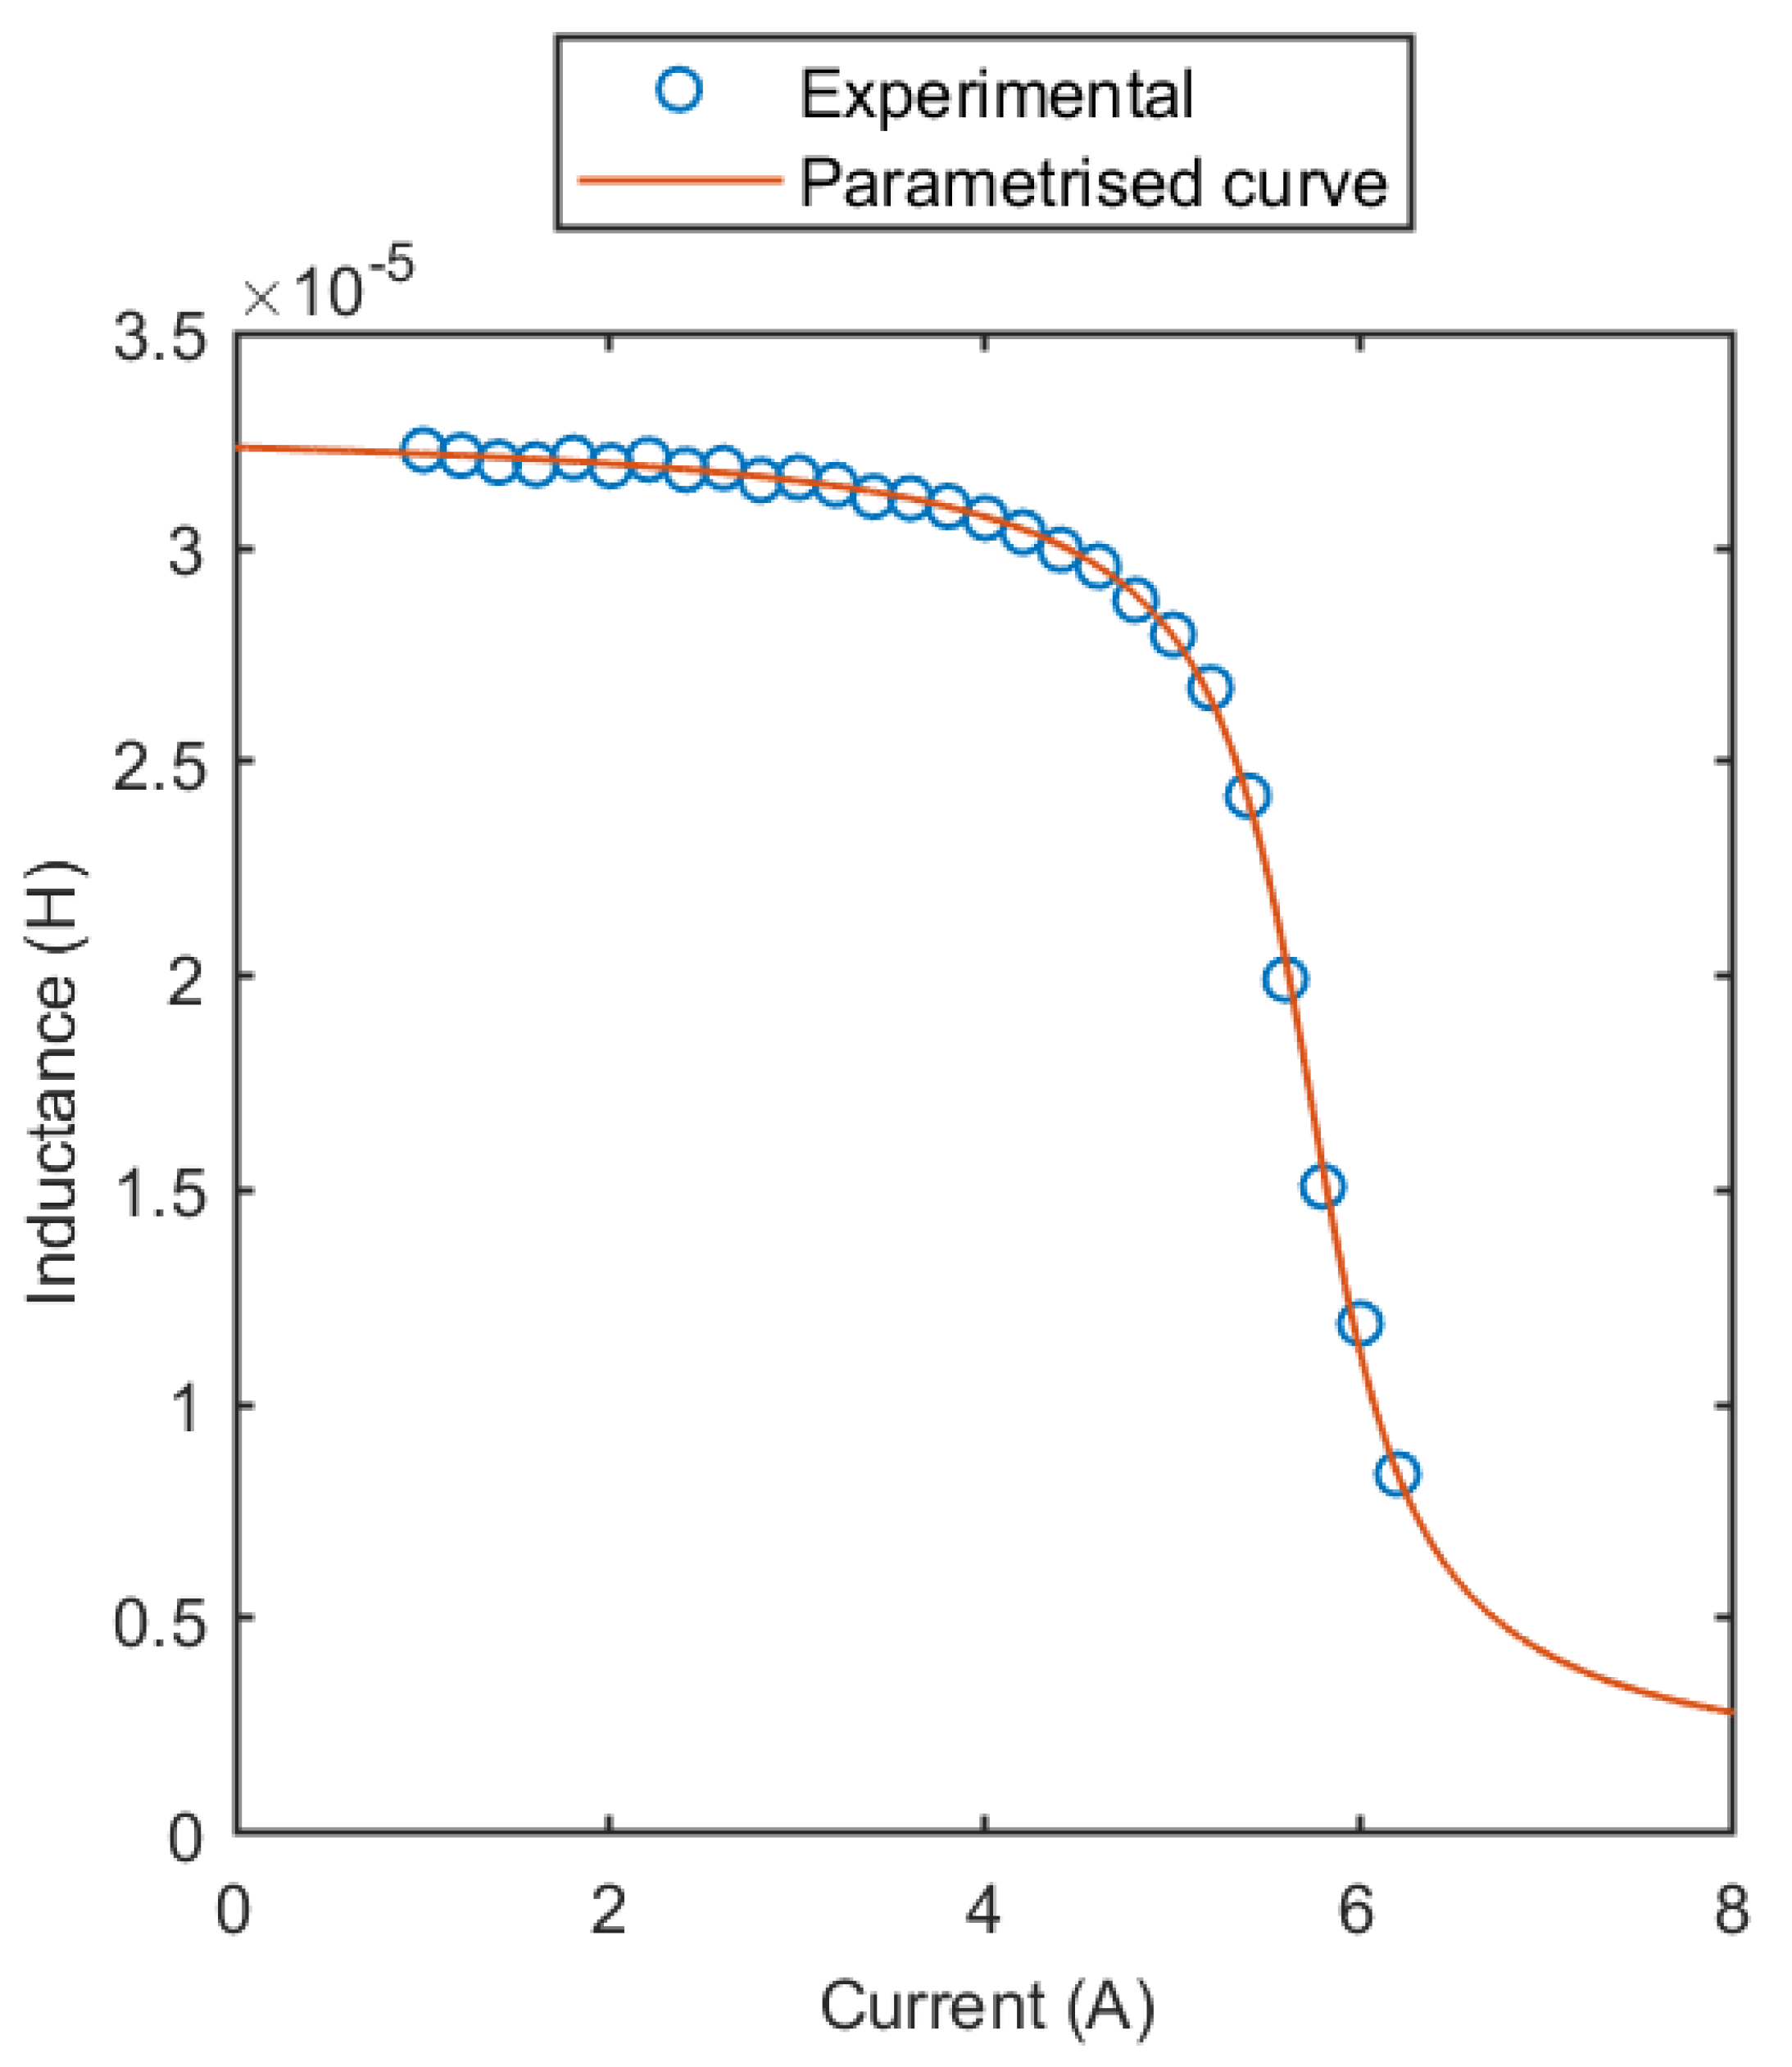
2.2. Experimental Method for the Differential Inductance Measurement
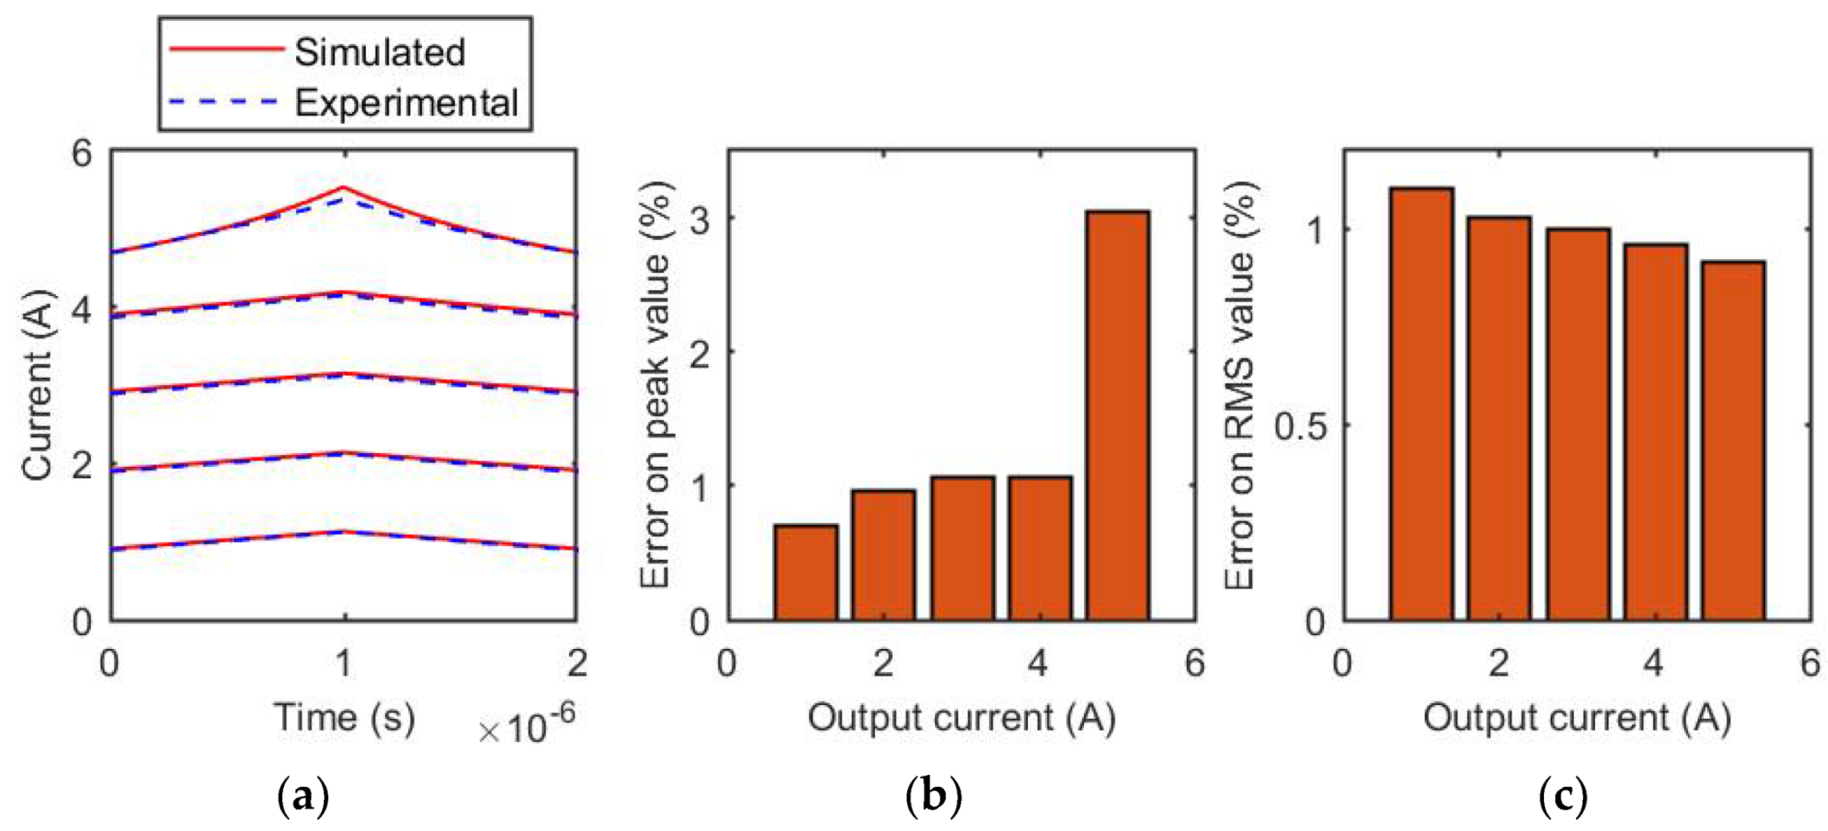
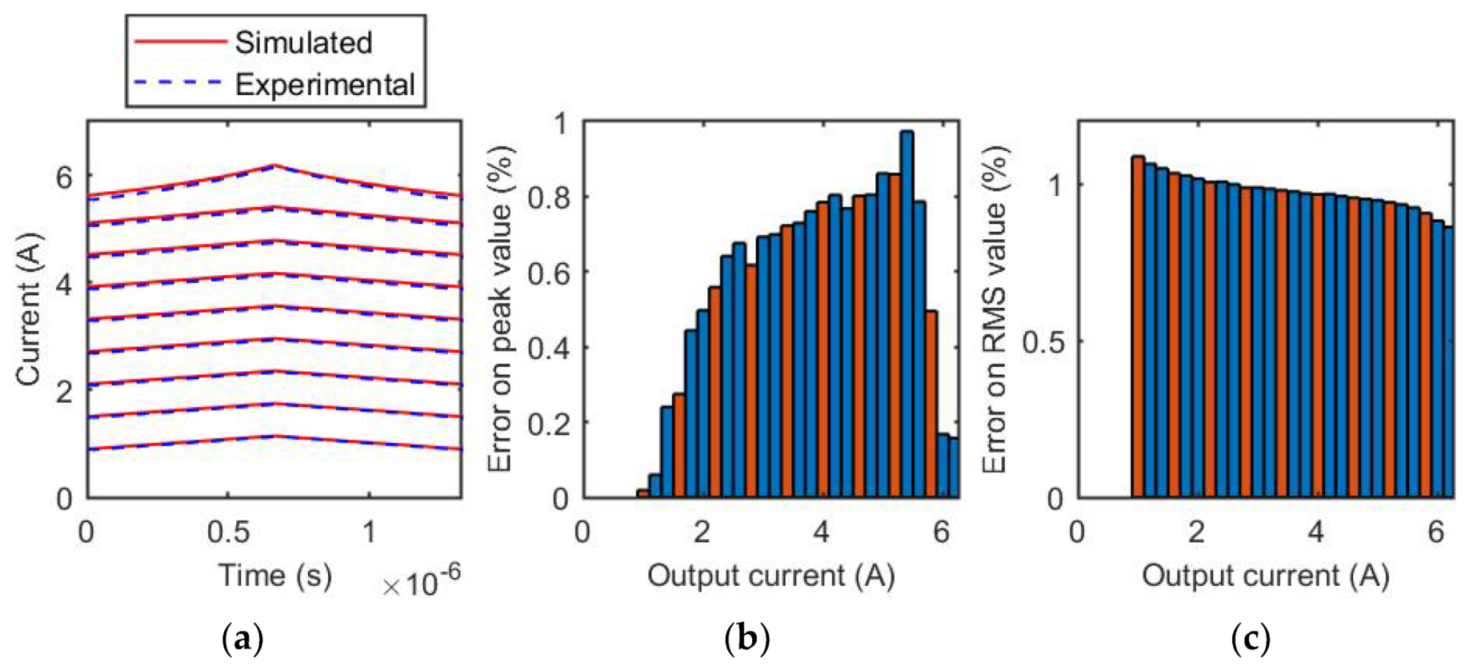
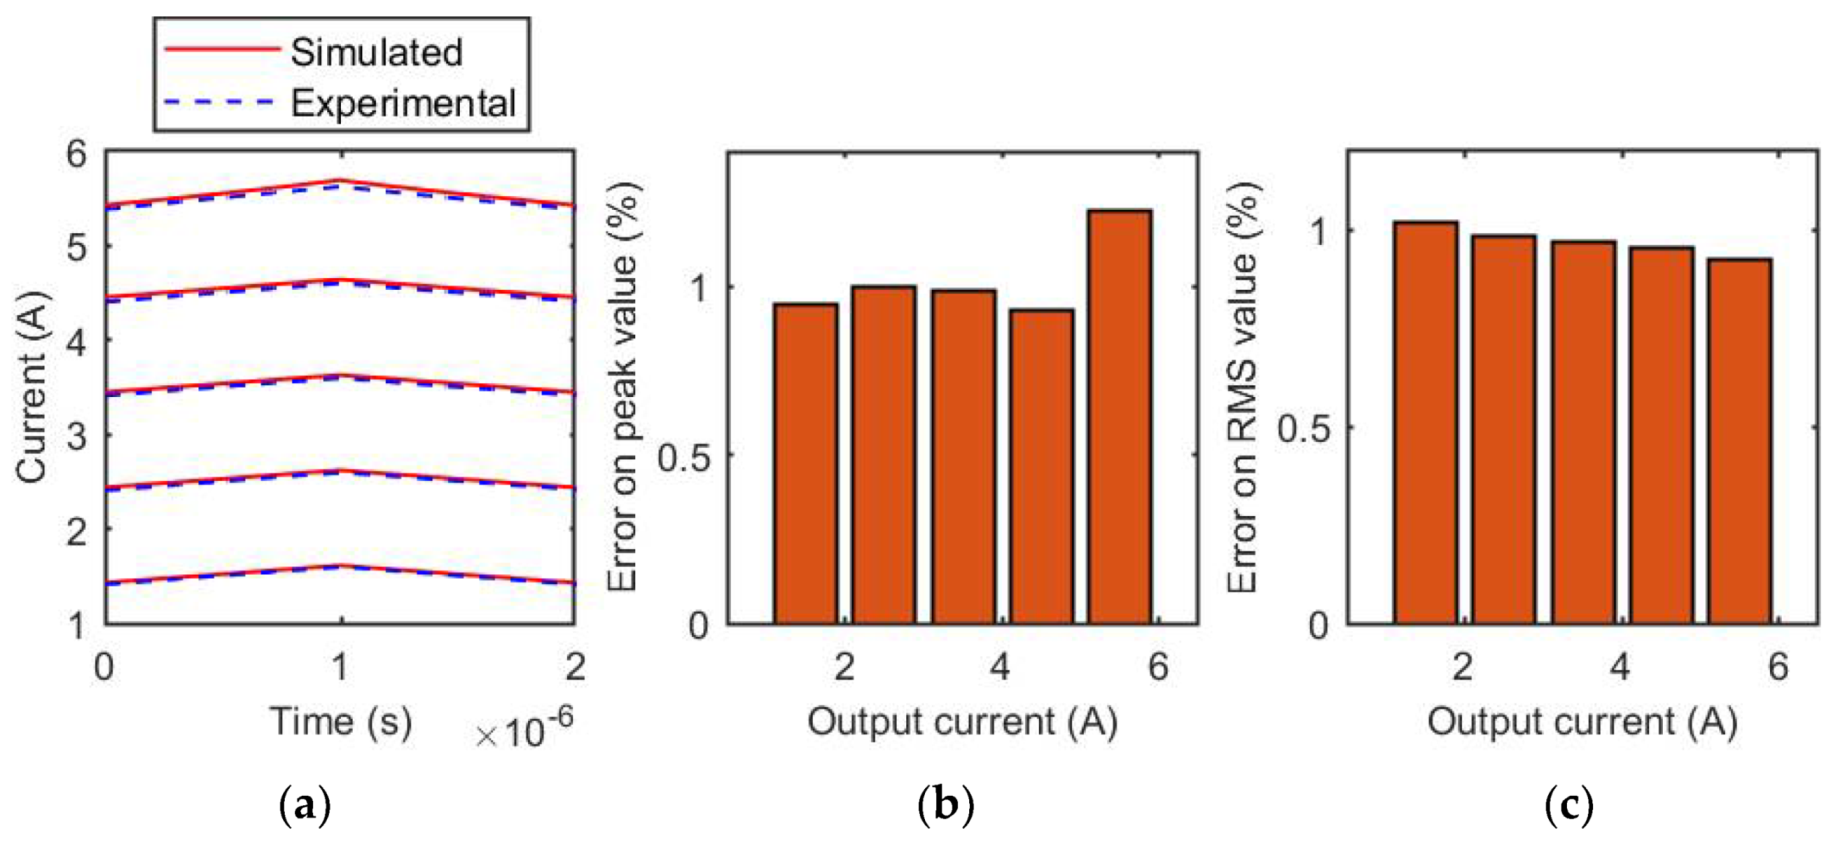
- input voltage: 24 V;
- duty cycle: 0.5;
- switching frequency: 500 kHz;
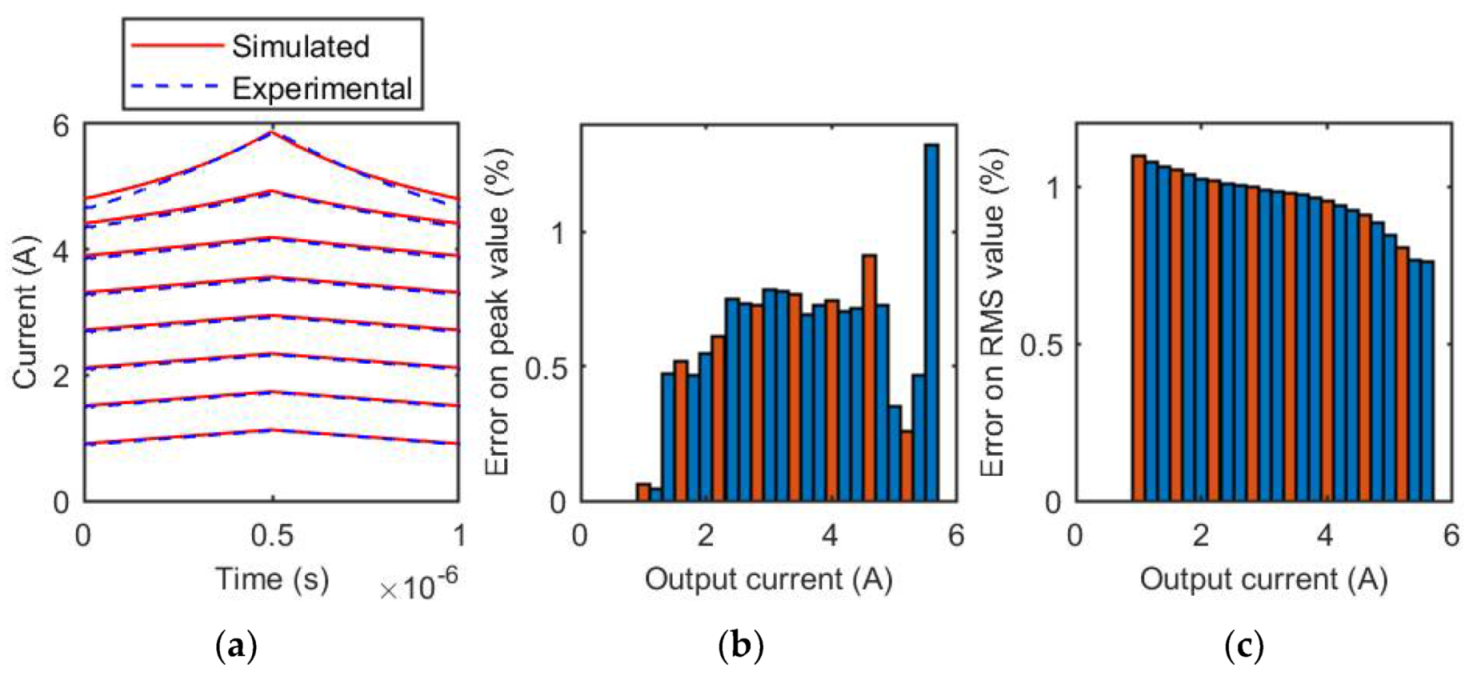
- output current: 1–5.6 A.
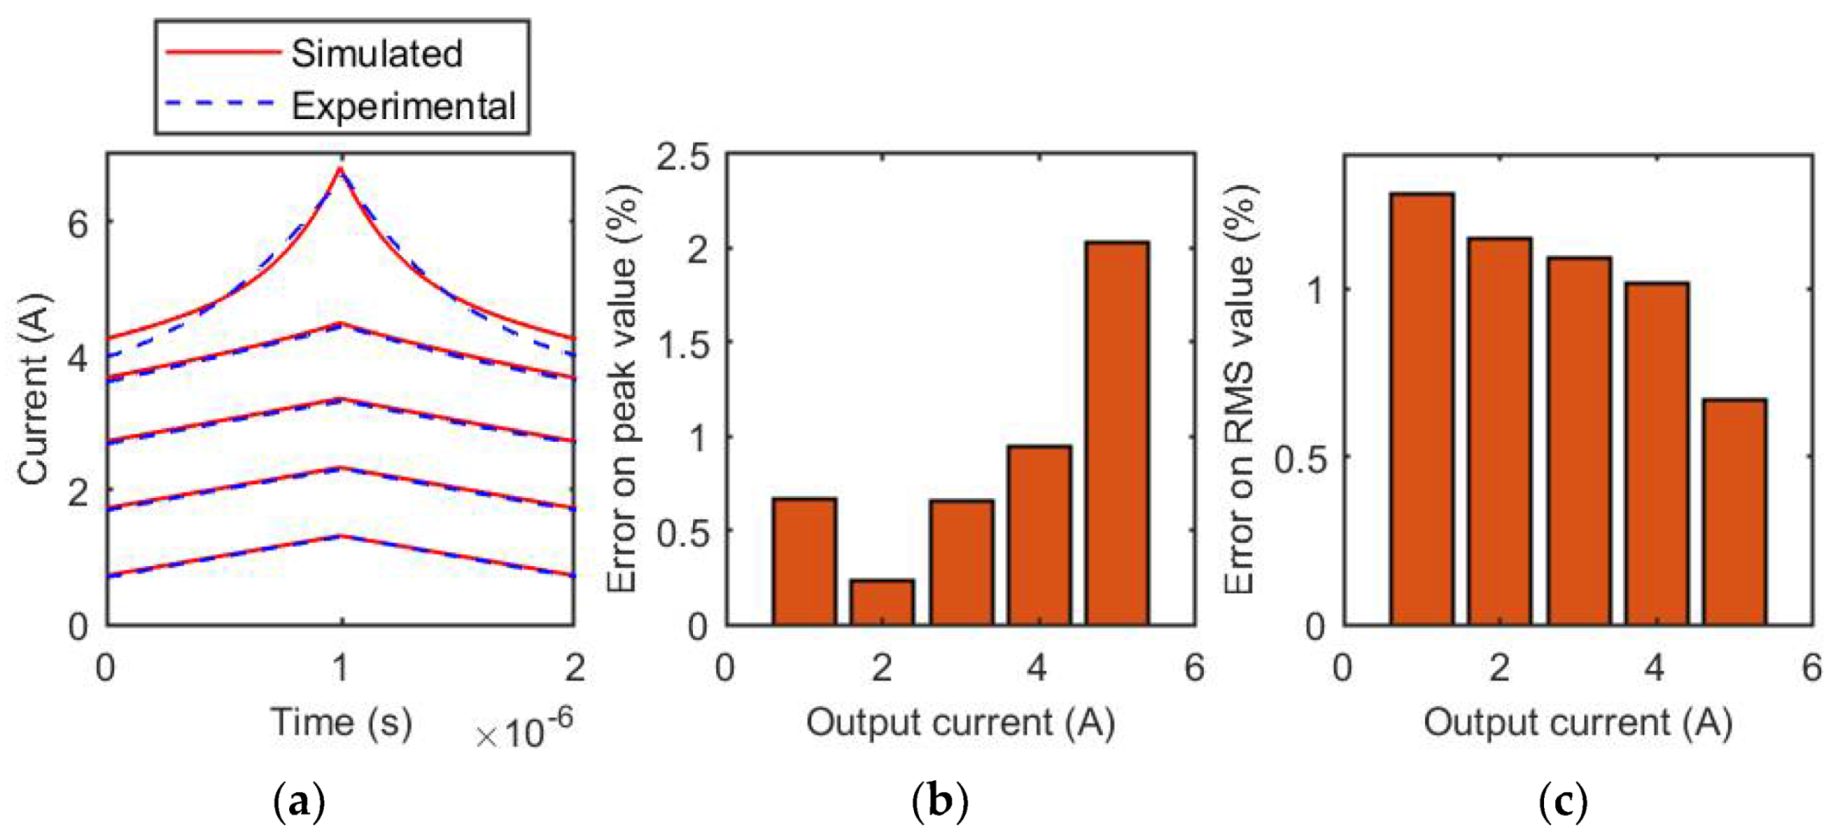
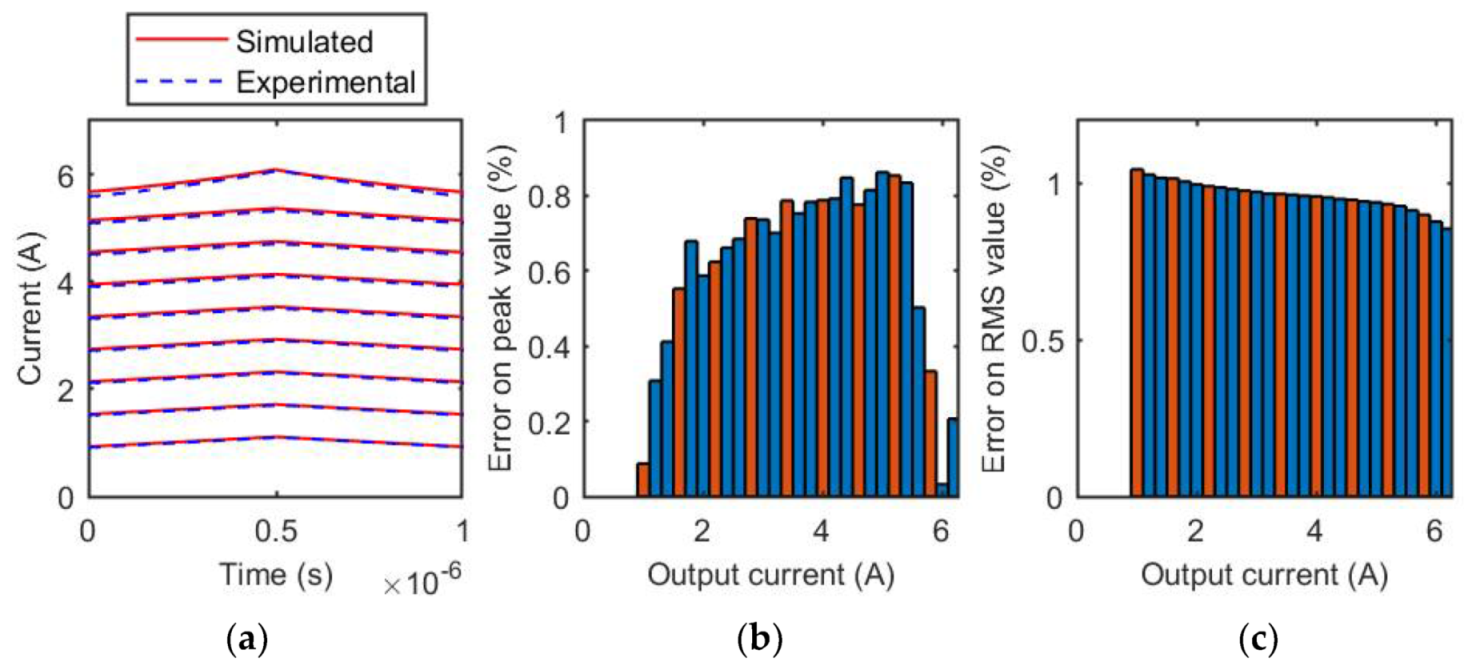
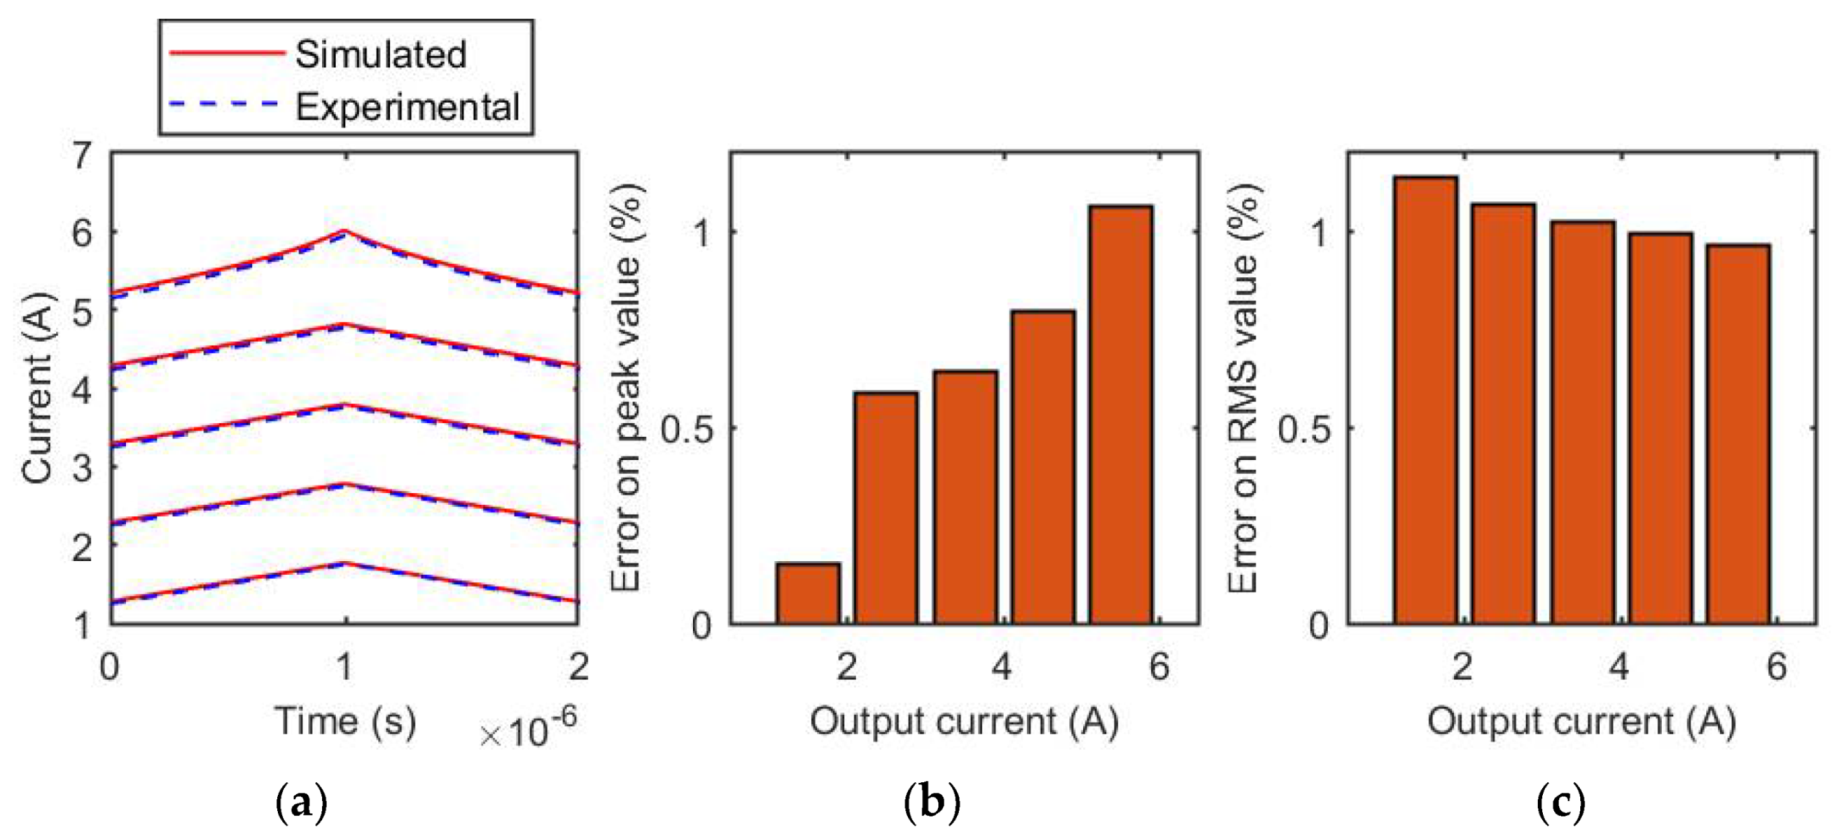
- input voltage: 24 V;
- duty cycle: 0.5;
- switching frequency: 500 kHz;
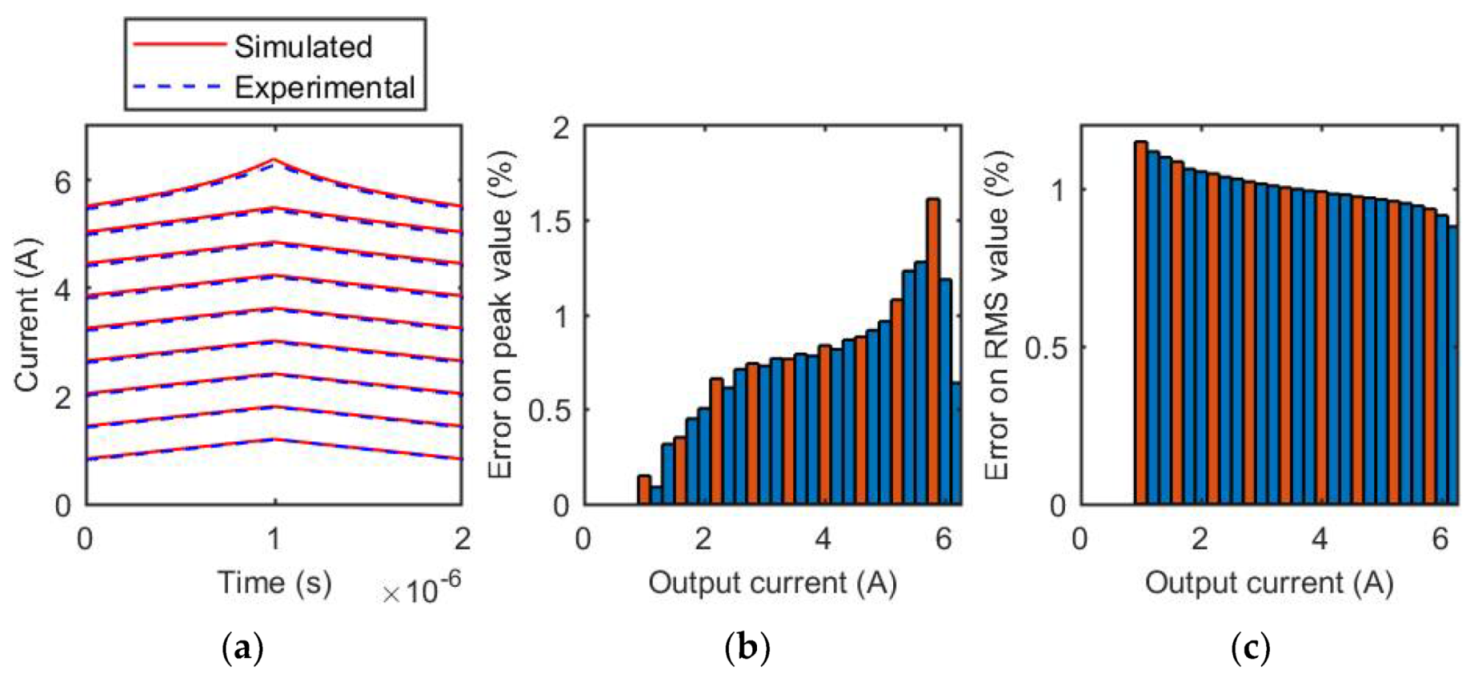
- output current: 1–6.2 A.
3. Current Waveform Simulation Results
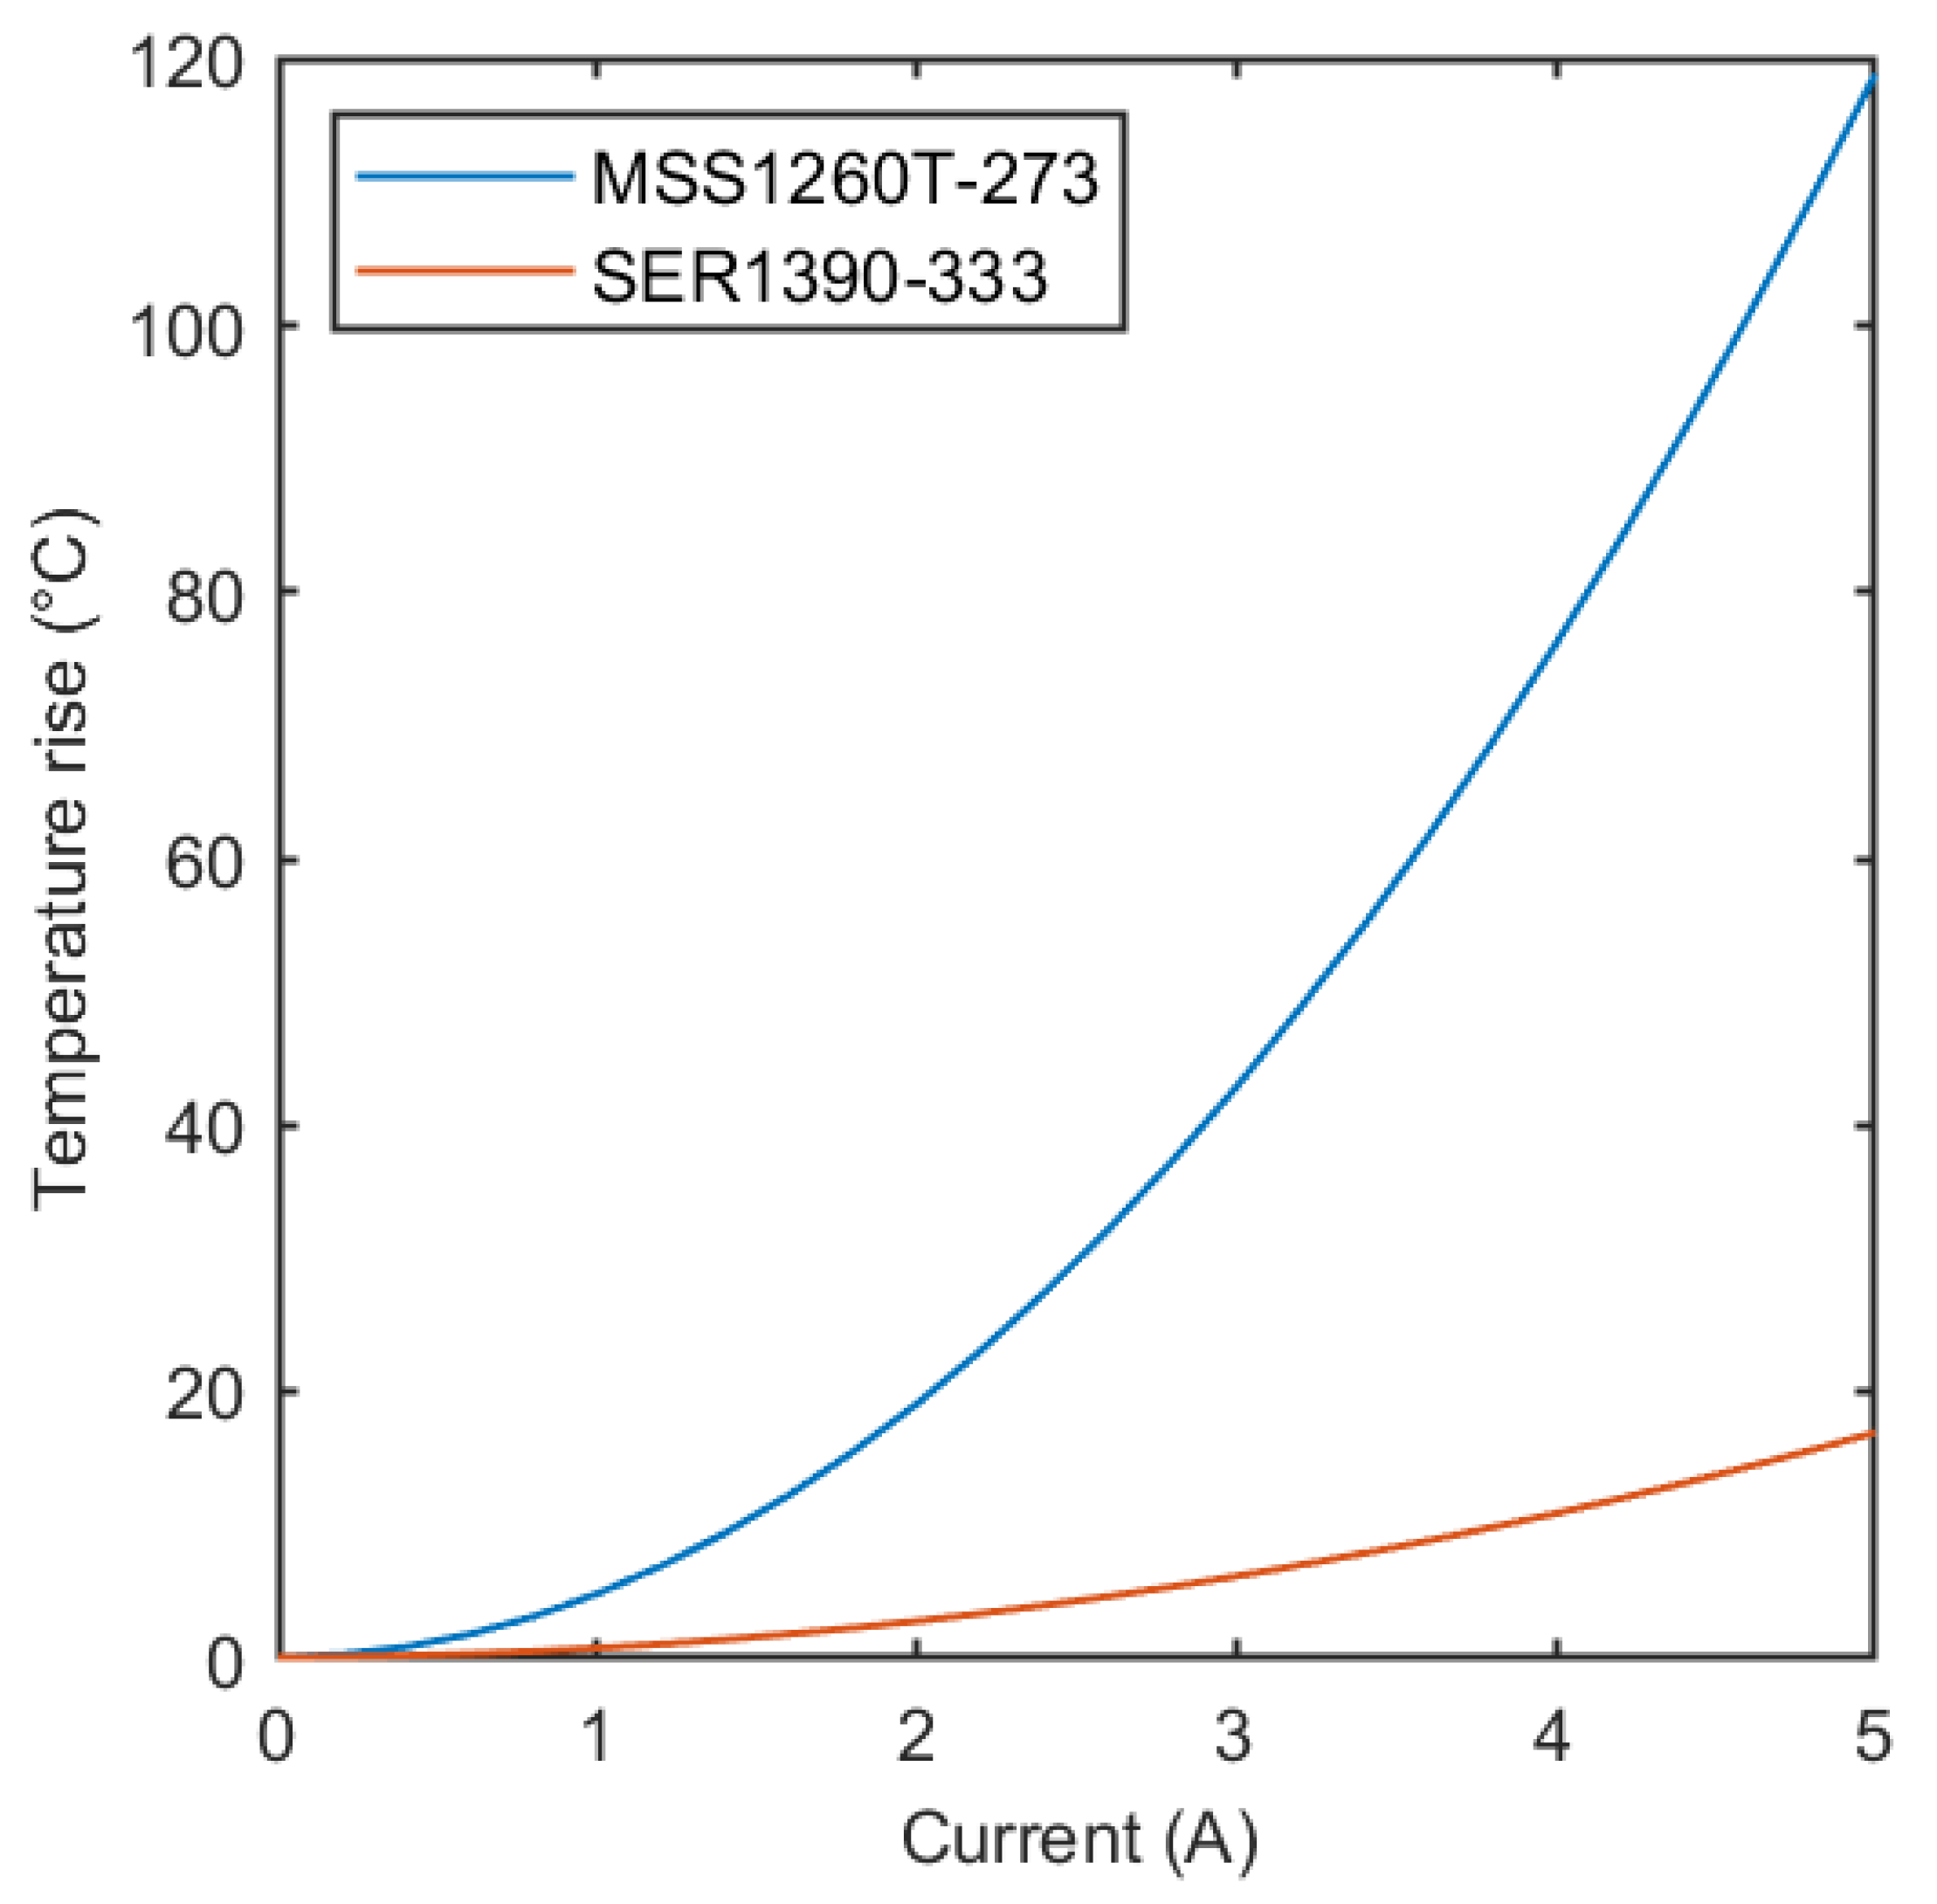
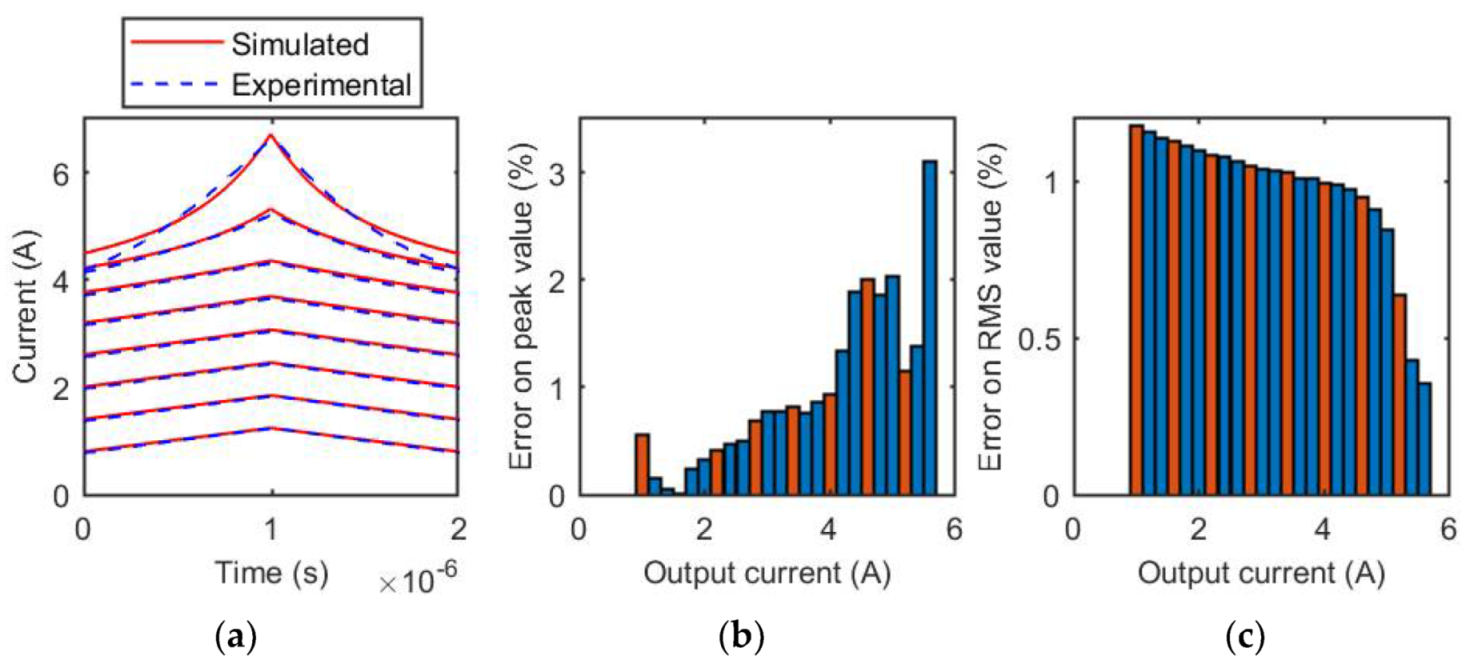
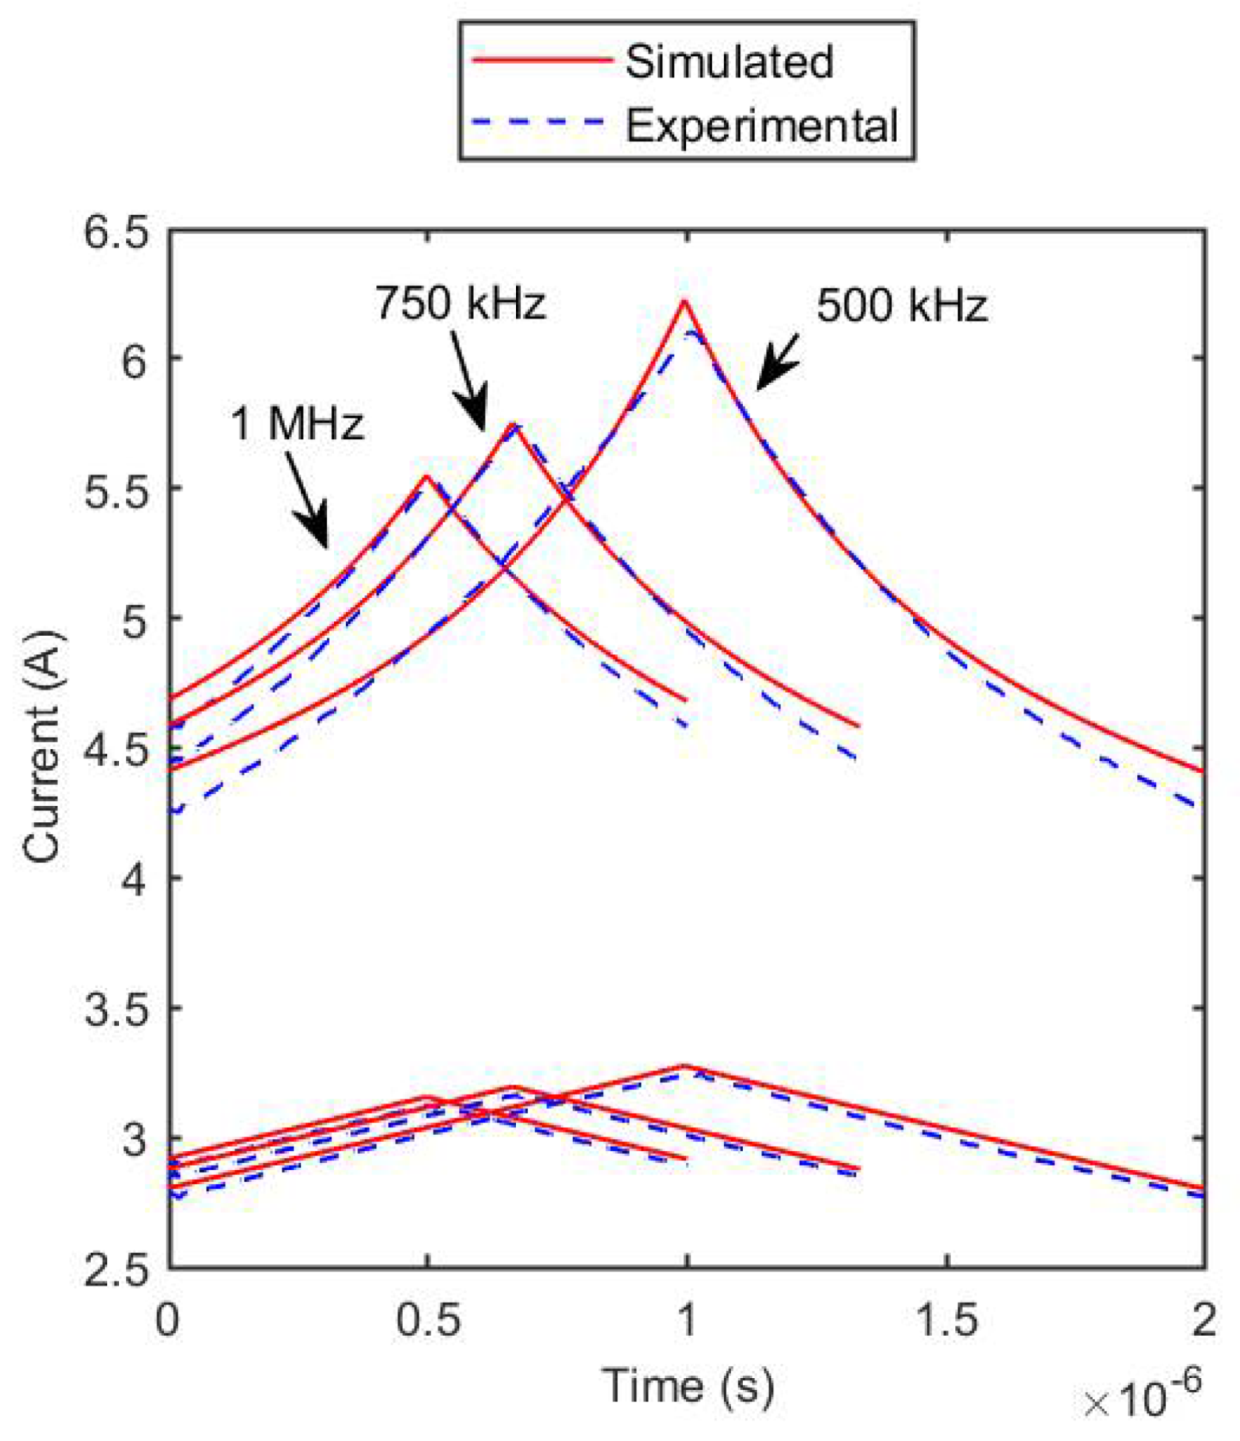
3.1. MSS1260T-273 Inductor
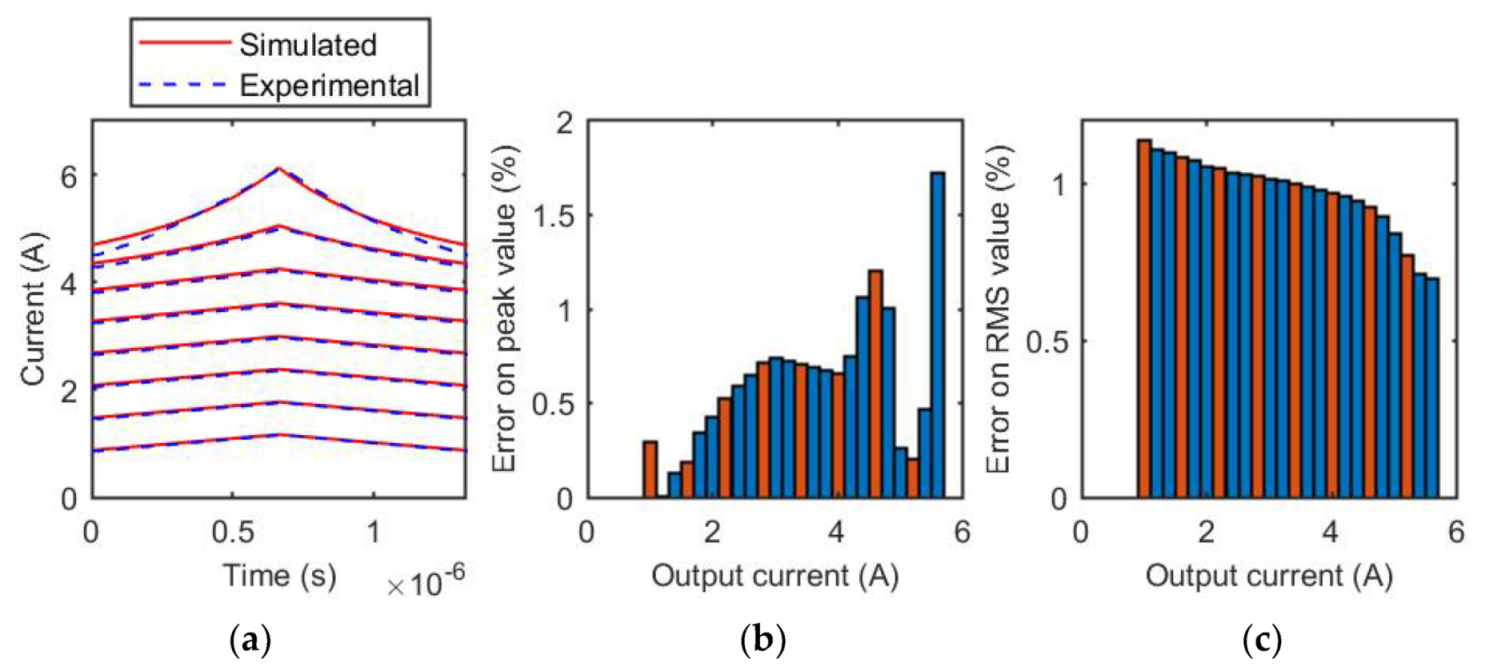
3.2. SER1390-333 Inductor
4. Discussion
5. Conclusions
Author Contributions
Funding
Conflicts of Interest
Nomenclature
| ISAT | DC current at 25 °C that causes a 30% inductance drop from its value without current. Declared by the manufacturer. |
| vL,exp | Measured voltage across the inductor. |
| vL | Inductive component of the voltage across the inductor. |
| Rs | Winding resistance. |
| iL | Inductive current. |
| Φ | Magnetic flux. |
| L(iL) | Differential inductance. |
| LH | Upper horizontal asymptote of the differential inductance curve. |
| LL | Lower horizontal asymptote of the differential inductance curve. |
| I* | Abscissa of the inflection point of the differential inductance curve. |
| σ | Coefficient proportional to the slope of the curve in I*. |
| IL,max | Maximum value of the tested average current. |
| IL,min | Minimum value of the tested average current. |
| Lexp | Experimental differential inductance curve. |
| Lpar | Parametrised differential inductance curve. |
| fmin | Objective function of the optimization problem. |
References
- Trovão, J.P.; Pereirinha, P.G.; Ferreira, F.J.T.E.; Jorge, H.M. Study of inductor effects in a bidirectional DC-DC converter for electrical vehicle. In Proceedings of the XIX International Conference on Electrical Machines-ICEM 2010, Rome, Italy, 6–8 September 2010; pp. 1–6. [Google Scholar] [CrossRef]
- Safaee, A.; Bakhshai, A.; Jain, P. A resonant bidirectional dc-dc converter for aerospace applications. In Proceedings of the 2011 IEEE Energy Conversion Congress and Exposition, Phoenix, AZ, USA, 17–22 September 2011; pp. 3075–3079. [Google Scholar] [CrossRef]
- Bojoi, R.; Fusillo, F.; Raciti, A.; Musumeci, S.; Scrimizzi, F.; Rizzo, S. Full-Bridge DC-DC Power Converter for Telecom applications with Advanced Trench Gate MOSFETs. In Proceedings of the 2018 IEEE International Telecommunications Energy Conference (INTELEC), Turin, Italy, 7–11 October 2018; pp. 1–7. [Google Scholar] [CrossRef]
- IEC TC 51 Strategic Business Plan. Available online: https://assets.iec.ch/public/miscfiles/sbp/51.pdf (accessed on 25 March 2021).
- Kaiser, J.; Dürbaum, T. An Overview of Saturable Inductors: Applications to Power Supplies. IEEE Trans. Power Electron. 2021, 36, 10766–10775. [Google Scholar] [CrossRef]
- Milner, L.; Rincón-Mora, G.A. Small saturating inductors for more compact switching power supplies. IEEJ Trans. Electr. Electron. Eng. 2012, 7, 69–73. [Google Scholar] [CrossRef] [Green Version]
- Di Capua, G.; Femia, N.; Stoyka, K. Validation of inductors sustainable-saturation-operation in switching power supplies design. In Proceedings of the 2017 IEEE International Conference on Industrial Technology (ICIT), Toronto, ON, Canada, 22–25 March 2017; pp. 242–247. [Google Scholar] [CrossRef]
- Lodi, M.; Oliveri, A.; Storace, M. A low-cost online estimator for switch-mode power supplies with saturating ferrite-core inductors. In Proceedings of the 2019 26th IEEE International Conference on Electronics, Circuits and Systems (ICECS), Genoa, Italy, 27–29 November 2019; pp. 851–854. [Google Scholar] [CrossRef]
- Solimene, L.; Musumeci, S.; Ragusa, C. Saturable Ferrite Inductor Parameters Obtained Through a Double Step Optimization. In Proceedings of the 2020 55th International Universities Power Engineering Conference (UPEC), Turin, Italy, 1–4 September 2020; pp. 1–6. [Google Scholar] [CrossRef]
- Di Capua, G.; Femia, N. A Novel Method to Predict the Real Operation of Ferrite Inductors With Moderate Saturation in Switching Power Supply Applications. IEEE Trans. Power Electron. 2016, 31, 2456–2464. [Google Scholar] [CrossRef]
- Stoyka, K.; Femia, N.; di Capua, G. Power Inductors Behavioral Modeling Revisited. IEEE Trans. Circuits Syst. I Regul. Pap. 2020, 67, 5636–5649. [Google Scholar] [CrossRef]
- Salas, R.A.; Pleite, J. Equivalent Electrical Model of a Ferrite Core Inductor Excited by a Square Waveform Including Saturation and Power Losses for Circuit Simulation. IEEE Trans. Magn. 2013, 49, 4257–4260. [Google Scholar] [CrossRef]
- Gurleyen, H.; Mese, E.; Kim, J.H.; Sarlioglu, B. Nonlinear analytical model of an inductance considering saturation and temperature variation. In Proceedings of the 2017 IEEE Energy Conversion Congress and Exposition (ECCE), Cincinnati, OH, USA, 1–5 October 2017; pp. 3150–3154. [Google Scholar] [CrossRef]
- Scirè, D.; Rosato, S.; Lullo, G.; Vitale, G. A Temperature Dependent Non-Linear Inductor Model for a DC/DC Boost Converter. In Proceedings of the 2018 15th International Conference on Synthesis, Modeling, Analysis and Simulation Methods and Applications to Circuit Design (SMACD), Prague, Czech Republic, 2–5 July 2018; pp. 237–239. [Google Scholar] [CrossRef]
- Oliveri, A.; di Capua, G.; Stoyka, K.; Lodi, M.; Storace, M.; Femia, N. A Power-Loss-Dependent Inductance Model for Ferrite-Core Power Inductors in Switch-Mode Power Supplies. IEEE Trans. Circuits Syst. I Regul. Pap. 2019, 66, 2394–2402. [Google Scholar] [CrossRef]
- MSS1260T Series High Temperature Power Inductors|Coilcraft’. Available online: https://www.coilcraft.com/ (accessed on 25 March 2021).
- ‘SER1390-333|Coilcraft’. Available online: https://www.coilcraft.com/ (accessed on 25 March 2021).
- Musumeci, S.; Solimene, L.; Ragusa, C.; Palma, M.; de la Barriere, O. Saturable Inductor Modelling in GaN FETs Based Synchronous Buck Converter. In Proceedings of the 2020 International Symposium on Power Electronics, Electrical Drives, Automation and Motion (SPEEDAM), Sorrento, Italy, 24–26 June 2020; pp. 396–401. [Google Scholar] [CrossRef]
- ‘EPC90122–80 V, 40 A Development Board’. Available online: https://epc-co.com/epc/Products/DemoBoards/EPC90122.aspx (accessed on 25 March 2021).
- Solimene, L.; Ragusa, C.; Musumeci, S.; de la Barrière, O.; Fiorillo, F. Modeling of Saturable Inductors for Application in DC-DC Converters. In Proceedings of the 2019 26th IEEE International Conference on Electronics, Circuits and Systems (ICECS), Genoa, Italy, 27–29 November 2019; pp. 839–842. [Google Scholar] [CrossRef]
- Rosenbrock, H.H. An Automatic Method for Finding the Greatest or Least Value of a Function. Comput. J. 1960, 3, 175–184. [Google Scholar] [CrossRef] [Green Version]
- Ragusa, C.; Solimene, L.; Musumeci, S.; de la Barrière, O.; Fiorillo, F.; di Capua, G.; Femia, N. Computation of current waveform in ferrite power inductors for application in buck-type converters. J. Magn. Magn. Mater. 2020, 502, 166458. [Google Scholar] [CrossRef]
- Dlala, E.; Arkkio, A. Analysis of the Convergence of the Fixed-Point Method Used for Solving Nonlinear Rotational Magnetic Field Problems. IEEE Trans. Magn. 2008, 44, 473–478. [Google Scholar] [CrossRef]
- Hilal, A.; Raulet, M.A.; Martin, C. Magnetic Components Dynamic Modeling With Thermal Coupling for Circuit Simulators. IEEE Trans. Magn. 2014, 50, 1–4. [Google Scholar] [CrossRef] [Green Version]
- Wilson, P.R.; Ross, J.N.; Brown, A.D. Simulation of magnetic component models in electric circuits including dynamic thermal effects. IEEE Trans. Power Electron. 2002, 17, 55–65. [Google Scholar] [CrossRef]


| MSS1260T-273 (ISAT = 4.7 A) | |||||
| Input Voltage (V) | Duty Cycle | Switching Frequency (kHz) | Output Current (A) | DC Losses (mW) | AC Losses (Core + AC Winding) (mW) |
| 24 | 0.5 | 500 | 4 | 768 | 74 |
| 32 | 0.5 | 500 | 4 | 768 | 132 |
| 24 | 0.5 | 1000 | 4 | 768 | 31 |
| SER1390-333 (ISAT = 4.8 A) | |||||
| Input Voltage (V) | Duty Cycle | Switching Frequency (kHz) | Output Current (A) | DC Losses (mW) | AC Losses (Core + AC Winding) (mW) |
| 24 | 0.5 | 500 | 4 | 336 | 44 |
| 32 | 0.5 | 500 | 4 | 336 | 79 |
| 24 | 0.5 | 1000 | 4 | 336 | 34 |
Publisher’s Note: MDPI stays neutral with regard to jurisdictional claims in published maps and institutional affiliations. |
© 2021 by the authors. Licensee MDPI, Basel, Switzerland. This article is an open access article distributed under the terms and conditions of the Creative Commons Attribution (CC BY) license (https://creativecommons.org/licenses/by/4.0/).
Share and Cite
Musumeci, S.; Solimene, L.; Ragusa, C.S. Identification of DC Thermal Steady-State Differential Inductance of Ferrite Power Inductors. Energies 2021, 14, 3854. https://doi.org/10.3390/en14133854
Musumeci S, Solimene L, Ragusa CS. Identification of DC Thermal Steady-State Differential Inductance of Ferrite Power Inductors. Energies. 2021; 14(13):3854. https://doi.org/10.3390/en14133854
Chicago/Turabian StyleMusumeci, Salvatore, Luigi Solimene, and Carlo Stefano Ragusa. 2021. "Identification of DC Thermal Steady-State Differential Inductance of Ferrite Power Inductors" Energies 14, no. 13: 3854. https://doi.org/10.3390/en14133854