1. Introduction
In the last decades, the widespread use of power electronics from equipment used in the home, as well as huge and costly industrial processes, have increased the awareness of power quality issues and concerns. The study of power quality issues has been a major effort of electric energy suppliers and industrial customers for many years. A perfect power supply that has a pure noise-free sinusoidal wave shape (for voltages and currents) that is always stable if voltage and frequency changes is difficult to obtain in practice. Most electric consumers impose disturbances on the systems that make deviations from ideal power supply. A large number of devices based on power electronics have been added to the home applications and industrial sector, which affects the power quality of the whole distribution system [
1,
2,
3,
4,
5,
6].
Power quality is important for electric power providers and customers and consists of transient and steady state electromagnetic disturbances in the electrical distribution system. Power quality contents include impulsive transients, interruptions, oscillatory transients, voltage sags, voltage swells, harmonic distortions of the voltage and current, and unbalance and flicker. A number of power quality indices are defined in the time domain (e.g., crest factors, RMS values, voltage sags, power factor) and others power quality indices are defined in the frequency domain (e.g., total harmonic distortion, THD,
K-factor), depending on the purpose of the application [
7,
8,
9,
10,
11,
12].
The analysis of power quality has evolved into a substantially different form since the use of the microprocessors and digital signal processors. Today, the proliferation of power quality analyzers has forced a new definition of power quality to accommodate the needs of microelectronic equipment. No longer limited to power engineers, power quality now involves control, electronic, and manufacturing engineers [
8,
13,
14,
15].
Usually, in power plants, up to 92–93% of the produced energy is distributed to the electric consumers. The other 7–8% of the energy is dissipated in the transmission and distribution networks (including power transformers from the power substation) as losses. The special design of distribution transformers from the power substation can be used to decrease the losses (up to 21%) in transformer [
16,
17,
18,
19,
20].
With the increase of nonlinear consumers in utility distribution systems, the voltage and current waveforms have become more distorted and the power quality has decreased. Utility engineers have to deal with analyzing and planning for the control of the power distortion. With the availability of these power quality analyzers, much more precise control of the processes has been developed, which makes the processes even more susceptible to the effects of power system disturbances. The power quality degradation may result in other adverse effects, such as overheating of the transformer, errors in measurement, voltage unbalances, and reductions in efficiency [
10,
21,
22,
23].
With repetitive operation, single-phase nonlinear loads such as the classical fluorescent lamp with capacitor, compact fluorescent lamp, sodium-vapor lamp, air conditioning system, laptop—normal operation, desktop PC with LCD display, and laser printer can cause current and, sometimes, voltage fluctuations at the point of common coupling (PCC, e.g., at the power substation). In the distribution system, mitigation devices for the fluctuation of voltages and currents can be used with the distribution static compensator [
24,
25,
26]. For example, the current from fluorescent lamps with electromagnetic ballast has a nonsinusoidal shape because of two nonlinear components, the lamp tube and the iron-core ballast, and the effect increase when the saturation and hysteresis are present [
27,
28]. Typical appliances from the educational area are different devices like PCs with monitors, TV sets, electric motors, classical fluorescent lamps (with electromagnetic ballast), compact fluorescent lamps, and air-conditioning devices. The currents distortion from these devices depends on the design, operating mode, and voltage level [
2,
29].
The evolution of power electronics in the last decades, especially of switching mode power supply (SMPS) with large electrolytic capacitors, has increased the number of single-phase nonlinear consumers. The currents of these nonlinear loads are strongly deformed. The PCs and the compact fluorescent lamps with SMPS are responsible for odd current harmonics. The unbalanced consumers connected to the three-phase supply cause power quality problems. SMPSs themselves can be affected by nonsinusoidal voltages. PCs and classical and compact fluorescent lamps are the most significant items, because a large number of these can be connected to a single phase. In residential and education areas, nonlinear loads are increasingly found in classrooms, offices, etc. [
30,
31,
32].
The unbalance phenomena must be monitored and corrected. An electric device under unbalance supply will create an important unbalance current. The unbalance can affect the single-phase and three-phase loads and cause voltage sags on the electric network. In three-phase power supply, the unbalance of loads has an influence on the magnetization currents through the power transformer but does not cause important output voltage distortion [
3,
21,
33,
34,
35,
36,
37].
The improvement of power factor will reduce the network losses and the energy consumption and save money. For power energy providers, the power factor improvement reduces network losses and increases the electrical capacity for productive and can also help to maintain the voltage at the desired level. The consumers with low power factors are penalized with tariff clauses. For a constant active power, if the power factor decreases, the required apparent power and the electrical system losses increase [
15,
38,
39,
40,
41,
42].
Nonlinear loads generate harmonic currents. The LC filter can be used for nonlinear loads with two purposes: first, to improve the power factor of nonlinear loads, and second, to filter the harmonic load currents. There are differences between the harmonics (current and/or voltage) from industrial plants and residential and educational buildings. The consumers from industrial plants are usually large-power and three-phase -supplied (e.g., large variable speed drives). The low-voltage consumers (e.g., lighting) constitute a small part of the total power of the industrial plants [
2,
4,
43,
44,
45].
In residential and educational buildings, the number of single-phase, low-voltage consumers is higher than the number of three-phase, large-power consumers. The total load of the residential and educational buildings is about tens or hundreds of kW (usually up to 200 kW), distributed among the three-phase, low-voltage network (e.g., 400V/50 Hz) [
8,
19,
28,
31]. The knowledge of balancing these single-phase nonlinear consumers is important to understand the behavior of these loads in different operation modes in low-voltage, three-phase power supplies. Usually in this sector, consumers supplied by SMPS are in the same rooms so they can supply in groups.
In the paper, we show the unbalance and balance of electric consumers (with power factor improvements) using laboratory experiments (different types of electrical loads) and measurements made in the PCC of a residential and educational electrical power substation, on two different days (workday and weekend day). Electric consumers in the residential and educational sectors are nonlinear and low-power, but there are many and they are connected/disconnected in an uncontrollable way (it is extremely difficult to simulate this for a large number of electric consumers). If they (groups of consumers, or different rezistive-inductive (R-L) types) are distributed uniformly approximately by phases, it is possible to achieve an approximate balancing on currents and an improvement of the power factor. This can be highlighted by working during the workday (when there are R-L electrical consumers and many consumers powered by SPMS, e.g., PCs, laptops) and on weekend days (when there are fewer electric consumers powered by SPMS).
The paper is structured in seven sections. In the second section, a review of power quality related to electrical power distribution is presented. Then, in third section, an experimental study on the unbalance condition (made in 2018, before the pandemic crisis, on a semester activity) for consumers from residential and educational sectors is made. In fourth and fifth sections, we show a case study and measurements from the power substation of the residential and educational sectors. Finally, in the sixth and seventh sections, the paper presents discussions and conclusions about the balance of electric consumers in residential and educational sectors.
2. A Review of Power Quality Issues Related to Electrical Power Distribution
Widespread use of nonlinear and time-varying single-phase or three-phase loads increasingly affects the operation of distribution networks in residential, commercial, and industrial sectors. Consequently, single-phase loads are nonsinusoidal, and three-phase loads are nonsinusoidal and unbalanced.
This section is focused mainly on the unbalance and main power factors in the case of three-phase systems with unbalanced and distorted waveforms, this being the most general and widespread case in power delivery systems.
The unbalance includes unequal voltage magnitudes at the fundamental system frequency, fundamental phase angle deviation, and unequal levels of harmonic distortion between the phases [
2]. A major cause of voltage unbalance is the asymmetry of the loads, if the loads are not uniformly spread among the three phases. Additional causes of power system voltage unbalance can be single-phase traction, railroad systems, asymmetrical winding impedances transformer, open wye and open delta transformer banks, asymmetrical transmission impedances possibly caused by incomplete transposition of transmission lines, and blown fuses on three-phase capacitor banks [
20,
22]. Furthermore, the unbalance of voltages represents the most common fault type in electrical networks, which can occur in the case of voltage sags and can cause double-frequency power oscillations [
10].
Below, we present some negative effects of voltage unbalances. An electric machine under unbalanced voltage has unbalanced currents at the phases, and the temperature in different parts exceeds the nominal temperatures. For this reason, large and more expensive electric machines may be fitted with protection to detect extreme unbalance. If the supply unbalance increases beyond a fixed limit, the single-phasing protection will trip the machine [
43,
46].
The unbalanced load creates unbalanced current components that generate harmonic powers flowing backward from the loads to the network [
43]. Some electronic equipment, such as computers, may experience problems if the voltage unbalance is more than 2% or 2.5% [
46]. Another negative effect of unbalance is increased network losses.
Compensation of the load imbalance reduces the energy loss and is usually combined with reactive power compensation. For this purpose, PWM-based switching compensators (SCs), reactive compensators (RC), or hybrid devices can be used [
20,
25,
32,
36].
It is very important to correctly quantify the distortions caused by the nonlinear and unbalanced loads. There are two ways to define the unbalance factors: the European system and the system used by the IEEE. In European standards, the supply voltage unbalance is evaluated using the method of symmetrical components, only for fundamental components (first harmonic, EN 50160) [
2].
Negative sequence unbalance represents the ratio between the magnitudes (RMS measured values) of negative (
) and positive sequence (
) components of voltage (first harmonic) and current (first harmonic,
,
) [
47,
48]:
Also, it can be defined the zero sequence unbalance, as the ratio between the magnitudes (RMS measured values) of zero sequence (
) and positive sequence (
) components of voltage (first harmonic) and current (first harmonic,
,
) [
2]:
In most practical systems,
. An approximate way to calculate the negative sequence unbalance (in %) is [
2]:
In the above relation, SL represents the apparent power of the load and SSC represents the short-circuit power of the supply circuit.
It can be defined a total voltage (or current) unbalance factor (in %) [
43,
47,
49]:
For low-voltage (LV) and medium-voltage (MV) systems, the EN 50160 standard specifies that, under normal operating conditions, during each period of one week, 95% of the 10 min mean RMS values of the negative phase sequence component (fundamental) of the supply voltage shall be within the range of 0% to 2% of the positive phase sequence component (fundamental). This European Standard provides a mediation of the measured quantities for 10 min. Only values for the negative sequence component are given, because this component is the relevant one for the possible interference of appliances connected to the system (EN 50160). In some areas where there are some users with largely single-phase or two-phase loads, unbalance up to about 3% may occur at the three-phase supply terminal. The IEC recommends that the maximum voltage unbalance of electrical LV and MV supply systems be limited to 2% (IEC 61000-2-2:2002+A2:2019, IEC 61000-2-12:2003).
At the load terminals, an unbalance factor of apparent power (in %) can be defined using [
49]:
The IEEE system uses the voltage unbalance in percent, defined as the ratio between the maximum deviation from average and the average of three phase-to-phase voltages (line voltages, IEEE Std 112TM: 2004). The phase angle unbalance does not appear in this definition, because it is based only on magnitudes.
The power losses that occur in AC power systems depended on frequency, waveform distortion, and unbalance [
7,
12,
23,
50]. In the presence of phase displacement, unbalance and waveform distortion it is difficult, but very important, to correctly define the apparent power (
S) and power factor (
PF), which represent a measure of the system’s power delivery capability [
5,
12,
14].
In the last seven decades, there have been many ways of defining and measuring the apparent power and power factor, both in single- and three-phase systems. Even today, these concepts have not been defined in one general and universally accepted way [
2,
5,
6,
7,
8,
9,
10,
11,
12].
A good power theory should explain and describe power-related phenomena in electrical systems for all possible situations and should be able to be used for filter design and reactive compensation to improve the power factor [
5,
8]. Among the numerous approaches to the power theory, the Current Physical Components (CPC) theory, developed by Czarnecki [
8,
15,
23], the Conservative Power Theory (CPT), developed by Tenti [
6] and the
p-q instantaneous power theory, developed by Akagi [
12], are the most distinguished.
One of the main differences of these approaches consists in the description of the power properties of the systems in the time domain, and in the frequency domain respectively. Another difference is the use of instantaneous values of power, and the averaged values (over the period
T) respectively [
5,
6,
8,
12,
15,
23].
All these power theories have certain limitations. Thus, CPT is formulated in the time domain and does not provide fundamentals for compensator design [
6]. The
p-q instantaneous power theory is formulated in the time domain and is not valid in systems with nonsinusoidal and/or asymmetrical voltages [
12]. In addition, there is a major disadvantage of this theory due to the fact that it is based on instantaneous values and the power properties of the systems cannot be identified instantaneously.
The CPC theory, proposed by Czarnecki, introduces some current components: active current, reactive current, scattered current, load generated current, and unbalanced currents (of the positive, negative, and the zero sequence). The reactive current and the scattered current are defined in the frequency domain. The reactive current is related to the phase shift of the voltage and current harmonics. The scattered current is related to the load conductance, which changes with harmonic frequency. The CPC theory can explain the phenomena in single- and three-phase systems, at a sinusoidal or nonsinusoidal supply voltage, and with linear or nonlinear loads, respectively in three-phase systems with asymmetrical voltage [
8,
15,
23].
A new, more general, formulation of power theory, in the frequency domain and in the elementary vector space linear algebra, has been described by the authors of [
5]. This power theory is valid for poly-phase systems, with nonsinusoidal waveforms and DC components, voltage and current unbalance, and unequal and/or frequency-dependent wire impedances.
Further, we present the IEEE Std 1459-2010 approach. IEEE Std. 1459–2010 demonstrates that fundamental positive sequence active power
is the only useful power supplied to the load and unity power factor means minimum possible line losses for a given total active power transmitted (IEEE Std 1459–2010). Maximum efficiency in the electric network is reached when only fundamental positive sequence active current is demanded and the voltages at the PCC only contain the fundamental positive sequence voltage [
9,
11,
16,
32].
For three-phase nonsinusoidal and unbalanced systems, the most general case, the basic quantity is the three-phase instantaneous power. For four-wire systems, the instantaneous power has the following expression (IEEE Std 1459–2010):
where
ua,
ub and
uc are instantaneous line-to-neutral voltages, and
ia,
ib and
ic are instantaneous line currents.
IEEE Std. 1459-2010 defines the effective apparent power assuming a virtual sinusoidal and balanced circuit which has exactly the same line power losses as the real circuit (nonsinusoidal and unbalanced). In this approach, the effective apparent power is considered the maximal active power which can be transmitted by the virtual system (with sinusoidal and balanced voltages and currents), with the same voltage impact and the same transmission losses.
Effective apparent power is given by (IEEE Std 1459-2010):
where
Ue and
Ie represent the effective line-to-neutral voltage and the equivalent current.
The equivalent current Ie is defined as the RMS value of the three-phase currents from fictitious circuit (balanced and sinusoidal), which yields the same losses as the currents from the real circuit.
The RMS current can be separated into two components—the fundamental
Ie1 and the nonfundamental
IeH [
9,
14,
16]:
In the case of four-wire systems,
Ie1 and
IeH are given by the relations (IEEE Std 1459-2010):
Ks1 and Ksn1 are the skin and proximity effect coefficient of the supplying line conductor and the neutral current path at fundamental frequency (50 Hz); Ksh and Ksnh are the skin and proximity effect coefficients of the supplying line conductor and the neutral current path, respectively, computed for the h harmonic order, or any frequency component present in the currents spectra; rDC is the DC line resistance and rnDC is the DC resistance of the neutral current path.
In most practical applications, the ratios
ρ1,
ρh and
kh are not known, being functions of temperature, network topology, and loading. Therefore, it is recommended to use the values
ρ1 =
ρh =
kh = 1, which leads to the following practical expressions (IEEE Std 1459-2010):
The practical expressions for the effective voltage, in the case of four-wire systems, are (IEEE Std 1459-2010):
In the above relations: Ia, Ib, Ic and In are the line currents and neutral current; Ua, Ub, Uc are the line-to-neutral voltages; Uab, Ubc, Uca are the line-to-line voltages.
Effective apparent power can be separated into the fundamental effective apparent power
Se1 and the nonfundamental effective apparent power
SeH (IEEE Std 1459-2010):
The load unbalance can be evaluated using the fundamental unbalanced power (IEEE Std 1459-2010):
where:
In Equations (20)–(23), is the fundamental positive sequence apparent power; is the fundamental positive sequence active power; is the fundamental positive sequence reactive power; is the phase angle between the positive sequence components (first harmonic) of current and voltage (rad).
According to IEEE Std. 1459-2010, the main power factors are (IEEE Std 1459-2010):
- -
fundamental positive sequence power factor (or displacement power factor, DPF):
- -
power factor:
where
P represents the active power:
In Equation (26) p is the instantaneous power. According to Equation (24), increasing the to the unity can be done by compensating the fundamental positive sequence reactive power (). Equation (25) shows that, in three-phase systems with nonlinear unbalanced loads, the ideal situation (maximum utilization of the line, PF = 1) is obtained when P = Se.
Total harmonic distortion (THD) is a measurement of the distortion of voltages or currents due to harmonics. THD of voltages (or currents) is defined as the ratio of the RMS voltage (or current) of all the harmonic frequencies (from the second harmonic on) over the RMS voltage (or current) of the fundamental frequency [
7,
14,
20]:
In Equations (27) and (28), V represents the phase voltage, I represents the line current, i represents the phase (i = 1, 2, 3), and h represents the order of the harmonic (hmax = 40, according to EN 50160).
Crest factor (CF) is calculated from the peak amplitude of the waveform divided by the RMS value of the waveform (voltage or current). When voltage and current have sinusoidal waveforms, the crest factor is 1.41 (
). If
CF > 1.41, then the waveform is a sharp nonsinusoidal waveform, and
CF < 1.41 indicates a flat nonsinusoidal waveform [
7,
14,
20].
In Equations (29) and (30) i represents the phase (i = 1, 2, 3).
K-factor is a weighting of the harmonic load currents according to their effects on transformer heating. A high value of
K-factor means large heating effects due to harmonic currents.
K-factor is defined as a ratio between the additional losses due to harmonics and the eddy current losses at 50 Hz [
7,
14,
20]:
where
Ih represents the RMS current at harmonic
h, in per unit of rated RMS load current.
The duration of maximum power usage (consumption),
Tmax, over a time period
t can be calculated with [
7,
14]:
and the duration of maximum losses,
τmax, over a time period
t can be calculated with:
where
Imax represents the current corresponding to the maximum power.
3. Laboratory Experimental Study in Unbalance Condition of Electric Loads Used in Residential and Educational Buildings
In this section, we present the experimental results from most often used consumers from the residential and educational sectors in an unbalanced operation. In order to analyze the unbalance of voltages and currents for different nonlinear electrical consumers in three-phase systems on each phase and different voltage amplitudes, laboratory measurements were performed.
The laboratory tests were made with nonlinear electric consumers. During the experiments, the voltage source had low distortion (THD < 1.5%).
To investigate the voltage unbalance and the current unbalance in three-phase power systems, an experimental test (
Figure 1) was carried out using a PC (maximum 400 W) on phase
b (
Load 1), and two classical fluorescent lamps (2 × 20 W) on other phases
a (
Load 2) and
c (
Load 3). The lamps did not have capacitors to the improve power factor in the experiments.
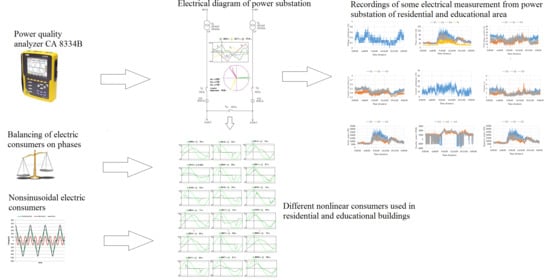
The electrical measurements (currents and voltages) were made on Load 1, Load 2, and Load 3 using a power quality analyzer CA 8334B to measure the current were used current probe MN 93A (maximum 5A). A sampling frequency of 12.8 kHz was imposed in order to avoid aliasing and leakage errors. The measurements were made in the three-phase secondary windings of power autotransformer AT1 (10 kW, Y/y connections).
In the following, we present four sets of experiments. During the experiment sets (set 1–4), the power quality analyzer CA 8334B was directly connected to Load 1, Load 2, and Load 3. In the experiments, we used two classic fluorescent lamps (with inductive ballast 2 × 20 W), identical in design but different at times of operation. In particular, we used an old lamp (10 years of operation) and a new one. Using the power quality analyzer, we measured the crest factor for the voltages and currents, the voltage and current unbalance for three-phase systems, the Fresnel diagrams, the power factor (PF), and the displacement power factor (DPF).
In the first set of experiments, the phase voltages were changed identically between 150 V and 230 V on the single-phase consumers:
Load 1 involved a PC with LCD display;
Load 2 involved an old classic fluorescent lamp 2 × 20 W;
Load 3 involved a new classic fluorescent lamp 2 × 20 W. In this set of experiments,
AT2 was missing from the experimental setup (
Load 1 was connected directly on winding
b from
Figure 1).
Figure 2 and
Figure 3 present the crest factor of phase voltages and the crest factor of currents depending on the supply voltages.
The crest factor of voltages and currents for the three consumers change with the supply voltage and the type of consumer are presented in
Figure 2 and
Figure 3, respectively. With increasing voltage, the crest factor of voltages increased, but it was different even for the same type of nonlinear consumers (old and new classic fluorescent lamps). Deviation from sinusoidal waveform was evidenced by the crest factor values. For the PC, current crest factor had high values (
Figure 3), whereas for fluorescent lamps, crest factor was closer to the value of sinusoidal waveforms (1.41).
The unbalance factor for voltages
Vunb and currents
Iunb are presented in
Figure 4 and
Figure 5, respectively, depending on the supply voltages. It was found that
Vunb was low, below 1.3% (the low-power, nonlinear consumers do not affect the voltages unbalance). For currents,
Iunb was very high, reaching 58% for low-supply voltage (e.g., 150 V). Even at nominal voltage of the nonlinear voltage consumers,
Iunb had high values (45%).
The following figures show the Fresnel diagrams of voltages and currents for 190 V (
Figure 6) and 230 V (rated voltage,
Figure 7).
From
Figure 6 and
Figure 7, we found a strong unbalance of currents characterized by different
RMS values on the three different phases (a, b, and c) and different phase shifts (are not 120°). The Fresnel diagrams indicated the capacitive reactive type of the PC and inductive reactive type of fluorescent lamps.
Power factors
PF1,
PF2, and
PF3 (
Figure 8) and displacement power factors
DPF1,
DPF
2,
DPF
3 (
Figure 9) for the three phases decreased with increasing supply voltage. The values of PFs were under 0.8. In the case of the PC, PF values were between 0.8 and 0.69. We noticed a big difference between PF and DPF for the PC consumer (
DPF 1), indicating a large deviation of current from sinusoidal waveform.
As the fluorescent lamps were not used capacitors to improve power factor, DPF values had an evolution between 0.8 and 0.5, and PF DPF, indicating a closer sinusoidal waveform of current.
Set 2 of measurements is presented below. Phase
b changed between 150 V and 230 V (
Figure 1) using autotransformer
AT2, and the voltage on the other two phases (
a and
c) remained constant (at rated value, 230 V). The consumers were distributed identically with set 1 measurements: The PC with LCD display in phase
b, and each fluorescent lamp with inductive ballast 2 × 20 W in phases
a and
c (
Figure 4).
Figure 10 shows the evolution of
Vunb and
Iunb with increasing of supply voltage to the rated value for the set 2 experiments.
We found a more disadvantageous operation than set 1 of experiments, because for voltages between 150 V and 190 V, the unbalance factor for voltage
Vunb was above 5% (at low voltages).
Iunb values were comparable to those of the previous set (set 1). If the voltage on
Load 1 was less than the other phases,
Vunb increased and
Iunb decreased. When the three phase voltages were equal, it obtained the same values as the set 1 of measurements (
Figure 7 and
Figure 8).
The average values of power factor PF and DPF of the three-phase voltages were lower when using low voltage values (
Figure 11). DPF varied between 0.79 and 0.69, and PF was modified between 0.67 and 0.59. The big difference between PF and DPF indicates deviation from the sinusoidal waveforms of the input current for the three consumers.
In set 3 of measurements, the phase voltage
a (
Figure 1) was modified between 150 V and 230 V and the voltage on the other two phases remained constant (at rated value). Phase
b was connected to the PC with LCD display and other two phases were connected to the two fluorescent lamps 2 × 20 W (with inductive ballast).
Figure 12 shows the evolution of
Vunb and
Iunb when the phase voltage
a (with PC consumer) was modified. The evolution of
Vunb was similar to that of the set 2 experiments.
The average values of the PF and DPF at the three phases are shown in
Figure 13. DPF had an almost constant value (
DPF 0.695) with increasing supply voltage, and PF decreased at minimum values at the rated voltage (230 V). The average values of the PF and DPF were slightly smaller than the set 2 of measurements.
The goal of the set 4 measurements was to study neutral current for three identical nonlinear consumers. We used three compact fluorescent lamps (CFLs using SMPS) with the power of 18 W, with a star connection (each lamp was connected between a phase and neutral conductor).
In the series with each fluorescent lamp, we connected a breaker in order to disconnect/connect each lamp.
With power quality analyzer CA 8334B, we measured the voltage between
L1 and neutral conductor (0), and the current through neutral conductor with
MN 93 A (max. 5 A) probe (
Figure 14,
Figure 15 and
Figure 16).
The first measurement (
Figure 14) was achieved when it was energized with only one CFL at one phase (
L1), with the other two CFLs being disconnected (from
L2 and
L3) by switches.
The neutral current (IN) is the same as the value of the phase current through the fluorescent lamp. The current through the lamps was strongly deformed (with multiple current harmonics, the third order and multitude of three (9, 15, 21).
At the second measurement (
Figure 15), two fluorescent lamps were connected at two different phase voltages (at phases
L1 and
L2), and the third fluorescent lamps was disconnected from the voltage (phase
L3).
From
Figure 15, we found that the neutral current was less deformed and had higher values than in the first situation (current through one CFL,
Figure 14).
Figure 16 measures the current through the neutral conductor when the three lamps were powered separately from each phase,
L1,
L2, and
L3, and the neutral conductor (0). Basically, the current through the neutral conductor was zero if the electrical consumers were the same and linear (extremely rare in practice). In the case of compact fluorescent lamps, the currents have harmonics of the third order and multiplies of three orders, and they add up algebraically through neutral conductor [
34]. A current occurred through the neutral conductor with a frequency of 150 Hz (
Figure 16). So, for nonlinear consumers, even if they are balanced on the three phases, there will be an important neutral current that cannot be reduced.
The set 1 experiments show that, to a relatively small extent, the crest factors for voltage depend on the amplitude of the supply voltage and the type of consumers (
Figure 2). When using electrical consumers powered by SMPS, the crest factors were slightly lower (0.05) than the ideal case. It was found that R-L-type electrical consumers did not significantly reduce the crest factors values (the current was close to sinusoidal shape). Basically, the crest factor for the current decreased with the decreasing voltage (
Figure 3). The crest factors for current depends on the type of electricity consumer: electricity consumers powered by SMPS had higher values compared with R-L consumers. The voltage unbalance was small (less than 1.4%) and depended on the supply voltage amplitude (
Figure 4). In contrast, the current unbalance was higher (below 45%) and had higher values as the supply voltage increased (
Figure 5). Electric consumers powered by SMPS had a capacitive character to which, with the decrease of the supply voltage, they had lower values. Using the R-L classic consumers, both the currents and the phase shifts between voltages and currents increased with the supply voltage amplitude (
Figure 6 and
Figure 7). In both types of consumers, the PF decreased with increasing supply voltage: A smaller decrease (0.1) was found with consumers powered by SMPS compared to the larger decrease (0.25–0.3) found in the R-L consumer type (
Figure 8). DPF (
Figure 9) had higher values (1) for SMPS consumers compared to R-L consumers, which had lower values for DPF (0.55).
In set 2 experiments, when the amplitude of a phase decreased (
Figure 10), the voltage unbalance changed a lot (toward 10%). The current unbalance increased with the supply voltage (values > 40%). The PF and DPF decreased with increasing supply voltage (
Figure 11). In set 3 of experiments, when the amplitude of a phase decreased (
Figure 12), the voltage unbalance changed (toward 10%), and the current unbalance increased with the supply voltage (values > 32%). The PF decreased and the DPF remained constant as the supply voltage increased (
Figure 13).
If nonlinear single-phase and/or nonlinear three-phase consumers (with SMPS) are used in three-phase systems, which have harmonics of currents with rank-three and a multiple of three, the neutral current (IN) zero cannot be diminished, because these current harmonics add up (in some situations, the neutral current can be comparable to the currents on the phases).
From the experimental measurements in the laboratory, it was found that the type of electrical consumers (powered by SMPS and R-L type) and the amplitude of the supply voltage (even a few volts) influenced the unbalance of voltage (to a small extent) the unbalance of current, and the PF and DPF values (to a large extent).
4. A Case Study about Residential and Educational Electrical Grid Distribution
The measurements (voltages and currents) from electric power station were made in the PCC of the LV power substation.
The residential and educational campus consisted of six buildings and comprised 12,800 m2 of floor space.
Figure 17 shows a wire circuit diagram for typical residential and educational buildings electric consumers. The circuit consisted of two main power transformers
T1 (400 kVA, 6/0.4 kV, D/y 11) and
T2 (250 kVA, 6/0.4 kV, D/y 11) and two main low-voltage branches that supplied the consumers through two main breakers
Q1 (to supply the consumers from
T1) and
Q2 (to supply the consumers from
T2). A transversal circuit breaker
Q3 connected the two main branches. These branches were linear and had a lot of nonlinear consumers. Usually, the electrical consumers are connected to
Q1 and
Q3 circuit breakers from transformer
T1.
The upper side of
Figure 18a presents the results of the measurements of the power substation, the phase voltages, and currents from the network.
Figure 18b–v shows the waveforms of voltages and currents from different nonlinear consumers used often in residential and educational buildings.
Initially, the electrical nonlinear consumers were distributed nonequally among the three phases.
The monitoring equipment (power quality analyzer CA 8334B) were connected in PCC after circuit breaker Q1. The current was measured with AmpFlex probes (3000 A). The connection wired of the power quality analyzer used for the measurements was three currents (on each phase) and four wires for voltages (each phase and neutral conductor).
From
Figure 18b–v, it was found that the current waveforms were different from one consumer to another. Some consumers had a current waveform closer to sinusoidal (e.g., classical fluorescent lamps, sodium-vapor lamps, refrigerator, high-speed angular grinder machines, three-phase induction motors (
Figure 18)), and other consumers had a highly distorted current from sinusoidal waveform (e.g., compact fluorescent lamps, air-conditioning system, laptops, PCs, laser printers, single-phase static electric drive converters, induction furnace medium-frequency converters (
Figure 18)).
In residential and educational facilities, a lot of PCs (desktops and laptops) are usually working. The power sources of these electric consumers are SMPSs, with large electrolytic capacitors. These consumers are the capacitive reactive type, and using a large number of these consumers can improve the power factors for other inductive-reactive consumers (e.g., classical fluorescent lamps, electric motors, refrigerators, etc.).
The thermal images (obtained using thermal imagers FLIR 420 and Fluke Ti 25) of different parts of electrical installations in operation allowed the identification of thermal demands over the allowable limits and showed whether or not the electrical equipment were working correctly (
Figure 19). Unbalanced loading phases can be observed through the thermal image in circuit brakers
Q1 and
Q3 (
Figure 19).
5. The Experimental Measurements in Power Substation after Uniform Distribution Balanced the Electric Consumers on Phases
The following measuring data were made in the power substation of the residential and educational sectors, after the electrical consumers (i.e., single-phase consumers from classrooms, offices, and libraries) were uniformly distributed and balanced among the three phases in the following situations: Transient measurements (
Figure 20,
Figure 21 and
Figure 22, during 80 ms), snapshot measurements (
Figure 23), and recording measurements (
Figure 24 and
Figure 25, during 24 h).
During the operation of low-voltage electrical networks, transient events may occur that can change the waveforms of voltages and/or currents.
The measurement of transient waveforms from
Figure 20 was made at the three voltage phases (
L1-0,
L2-0,
L3-0), and the transients from
Figure 21 and
Figure 22 were measured only at one phase (
L1-0).
The different current and voltage switching disturbances are presented in
Figure 20,
Figure 21 and
Figure 22. The disturbances can be classified in fast and slow switching disturbances. Some impulses may be imposed on the current shape during the switching. Changing the current waveform without significant change of voltage supply (
Figure 21) may be due to the start-up of electrical equipment that require time to reach nominal operating conditions (e.g., power transformer, electric motors, classical fluorescent lamps).
The waveforms from
Figure 23 show instantaneous measurements of some electrical quantities from the power substation of the residential and educational area on a workday: three-phase voltages, three-phase currents, harmonic spectrum of phase voltages, harmonic spectrum of phase currents, the Fresnel diagram for phase voltages, and the Fresnel diagram for phase currents. The phase shifts between the voltages and currents, at each phase, were small, showing a weak inductive character and a high power factor.
The deforming voltages and currents waveforms from PCC are an effect of all of the nonlinear consumers (especially single-phase) connected in different places in the low-voltage network.
Further, we present the recordings of some electrical measurements from the power substation of the residential and educational area on a workday (
Figure 24) and weekend day (
Figure 25): phase voltages, THD for phase voltages, crest factor for voltages, voltage unbalance, phase currents, THD for phase currents, crest factor for currents, current unbalance,
K-factor, active power, reactive power, apparent power, apparent power unbalance, power factor, and displacement power factor (for fundamental harmonics). For recording measurements (
Figure 24 and
Figure 25) using the power quality analyzer, the sampling period (that is, an integration period in which we computed the average value) was 5 s.
Below, for the analyzed workday and weekend day, we present the main values (minimum, average, maximum, minimum/maximum) of active powers (
Table 1), the main values (minimum, average, maximum, minimum/maximum) of reactive powers (absolute values,
Table 2), the main values (minimum, average, maximum, maximum/average) of currents (
Table 3), the average RMS effective current (
Ie) and relative errors (
εr) (
Table 4), the main values (minimum, average, maximum, standard deviation) of voltage unbalance (
Vunb), current unbalance (
Iunb) and unbalance factor of apparent power (
Sunb) (
Table 5), the main values (minimum, average, maximum, standard deviation) of power factors (PF,
Table 6) and displacement power factors (DPF,
Table 7), respectively, the duration of maximum power usage (consumption), (
Tmax), and the duration of maximum losses (
τmax, for
t = 24 h,
Table 8).
6. Discussions
The measurements from power substation of the residential and educational buildings revealed that the currents were distorted (the higher current harmonics orders were 5, 3, 7, 9) and, through the neutral conductor, there was a considerable current (approximately 50% of the phase currents,
Figure 23).
Single-phase electrical consumers had a resistive-inductive (R-L) character, and the current unbalance was an order of magnitude larger than the voltage unbalance.
When analyzing the quantities measured over a time interval of 24 h, on a workday and weekend day (
Figure 24 and
Figure 25,
Table 1,
Table 2,
Table 3,
Table 4,
Table 5,
Table 6 and
Table 7), it was found that the voltages had approximately the same evolution, except for the time interval 8–14 and 16–20 of the workday, when the voltage losses were more important (4–5 V). The THD for voltages and the crest factor of voltages had the same evolution in the same field (
Figure 24 and
Figure 25a–c). During the daylight, the voltage decreased (by a few volts) and the currents increased due to the large number of electric consumers in operation (especially single-phase). Consequently, there was a voltage sag on the grid. During the night, only the refrigerators, air-conditioning systems, and some electric lamps (sodium-vapor lamp) were connected to the network. It was found that the voltage unbalance was slightly higher on the weekend day (
Figure 24 and
Figure 25d). In statistics, the standard deviation (SDT) is a measure of the amount of variation or dispersion of a set of values. From
Table 5, it can be seen that the SDT for the current unbalance
Iunb and apparent power unbalance
Sunb had lower values for the workday vompared to the weekend day. The voltage unbalance was almost the same for both days. A low standard deviation indicates that the values tend to be close to the mean value, while a high standard deviation indicates that the values are spread out over a wider range. The same conclusions can be made from
Table 6 and
Table 7, as STD for PF and DPF had smaller values for the workday.
There are important differences between the evolutions and values of the currents, on the analyzed days (workday and weekend day). On the workday, the currents were 3–4-times higher in the active intervals 8–14, 16–20 compared to the weekend day (
Figure 24e and
Figure 25e). The THD for the currents and the crest factor were higher on the weekend day, compared to the workday (
Figure 24f,g and
Figure 25f,g).
The unbalance of the currents was 5–10% higher on the weekend day (when the PCs in the laboratories did not work) compared to the workday (
Figure 24h and
Figure 25h).
On the workday, the
K-factor for the current did not exceed 4. Instead, on the weekend day, the
K-factor exceeded 4 for several hours (
Figure 24i and
Figure 25i).
The active power on the workday in the interval of the active program (8–14, 16–20) was greater than 2–2.5-times the active power on the week-nd day (
Figure 24l and
Figure 25l), and the evolution of the active power differed from a day to another.
There were also differences in the reactive powers where different evolutions were registered from one day to another, with inductive and capacitive character (approximately the same values) and permanent modifications (
Figure 24k and
Figure 25k).
The evolution of the apparent power in time was similar to the evolutions of the active powers on the same day (
Figure 24l and
Figure 25l).
The unbalance of the apparent power was almost double between the weekend day (when the PCs in the laboratories did not work) compared to the workday (
Figure 24m and
Figure 25m).
The power factor was higher, on average, by 0.02–0.03 on the workday compared to the weekend day, and the evolutions of the power factor differed in time from one day to another (
Figure 24m and
Figure 25m).
The fundamental power factor had higher values than the power factor, being higher on the workday (over 0.95) compared to the weekend day (over 0.9). The differences between the two parameters (PF and DPF) show the large harmonic component (especially of the current,
Figure 24o and
Figure 25o).
In
Table 8, we show that the duration of maximum power usage
Tmax and the duration of maximum losses
τmax (
t = 24 h) were higher (with 30–40%) on the weekend day than on the workday.
During the experiments shown in
Figure 20,
Figure 21,
Figure 22,
Figure 23,
Figure 24 and
Figure 25, we did not use the power factor regulator with capacitor banks connected to the power substation. From
Figure 24 and
Figure 25, it can be seen that the power factor was high without using capacitor banks to improve the power factor. The only capacitive consumers used in the experiments were the PC with SMPS power sources. Usually, the capacitor compensation to improve the power factor will increase the voltage and, especially, the currents harmonic components in the network.
The voltage and current unbalance in three-phase power systems occurs due to the unbalanced electrical consumer connection or the persistence of unrepaired faults (e.g., two-phase operation of three-phase consumers).
In addition to household single-phase electrical consumers, which are very numerous but small-power, the main large-power consumers from the industry that cause unbalances in power system are mainly single-phase induction furnaces, arc furnaces, railway traction, etc. Although all power systems are provided with balancing equipment, the equipment may be missing or malfunctioning due to changes in the parameters and operations for these electrical consumers.
Nowadays, power systems do not have additional measurement systems for supplementary circulation of electricity and associated losses conditioned by the presence of unbalance.
The current measuring equipment of powers and energies from power systems do not distinguish between balanced and unbalanced electrical consumers, because measured powers and energies are actually received by consumers.
In this way, the balanced consumers, which are connected to a network with unbalanced consumers, become active power unbalance consumers and record a higher power consumption than actually useful, reducing their overall performance. Also, the losses in supply conductors (own technological consumption) increase. Although these losses are caused by unbalanced consumers, the increases are supported by the power systems.
The unbalanced operation of electrical consumers has following effects [
28,
31,
32,
36]:
- -
The production of additional technological consumptions in both consumer and power system networks;
- -
A reverse rotating field occurs in the electrical machines;
- -
Unbalanced operation negatively influences the electrical energy measurement using three-phase classical induction meters;
- -
Asymmetrical (unbalanced) operation has negative influences on electric motors, because besides vibration and braking, due the reverse rotating field. It also reduces their lifetime due to additional heat produced by this operating condition. For example, if the voltage of an electric motor has a degree of unbalance of 4% instead of 2%, the service life can be halved.
International standards (e.g., EN-50160 and the IEC 1000-3-x series) give limits for the unbalance ratio, defined by (2) of <2% for low voltage and medium voltage systems, and <1% for high voltage, measured as 10 min intervals, with an instantaneous maximum of 4%. The IEC standards recommend that, in general, single-phase consumers should not be connected to three-phase, low-voltage circuits supplying equipment sensitive to phase-voltage unbalance. Instead, a separate circuit should be used.
7. Conclusions
We analyzed the single-phase electric consumers in the residential and educational sectors. In the residential and educational areas, there are a lot of nonlinear single-phase electrical consumers that deform the current waveform more or less (less the voltages waveforms) depending on its nonlinear characteristics.
The unbalancing of nonlinear consumers leads to additional losses in the LV and MV electrical network, negatively affecting the power transformer from the power substation and the measurement of the electric energy of the three-phase electric consumers (e.g., variable speed drives) and single-phase electric consumers (e.g., PCs, laptops).
Today in the residential and educational sectors, there are a lot of small-power consumers with nonlinear characteristics. On the one hand, single-phase nonlinear electrical consumers have a resistive-inductive character (e.g., induction motors, classical fluorescent lamps), and on the other hand, single-phase nonlinear electrical consumers have a capacitive character (e.g., PCs, laptops, compact fluorescent lamps). Of course, in practice, it is impossible to achieve a perfect balance of single-phase consumer in the three phases.
By uniformly arranging (within the technical possibilities) electrical consumers among the three phases and using capacitive electrical consumers (with SMPS, e.g., PCs), balance was achieved. Also, we achieved the relative balance of the current and voltage, respectively, as well as the power factor improvement, without using fixed capacitor banks or a power factor controller with capacitors banks connected to the PCC of the power substations. Also, the type of electrical consumers (SMPS type and R-L type) and the amplitude of the supply voltage changed the unbalance of the voltage to a lesser extent, but the unbalance of current, PF, and DPF were strongly modified.
In order to improve the quality of electrical energy, as future research directions, three-phase interharmonic L-C passive filters (in different configurations), connected in the PCC on LV of the power substation, can be dimensioned and experimential in order to decrease the THD for currents on each phase. Online monitoring of the electrical parameters of the power substation can be achieved by the permanent measurement of voltages, currents, and phase shifts using power quality analyzers to set alarms to warn of exceeding limit values (e.g., unbalance current, power factors) of measured and calculated electrical parameters. An automation system can be developed that, depending on the unbalance of electrical consumers of each phase, introduces or removes larger groups of electrical consumers from one phase to another.


