Effect of Storage Time on the Physicochemical Properties of Waste Fish Oils and Used Cooking Vegetable Oils


Abstract
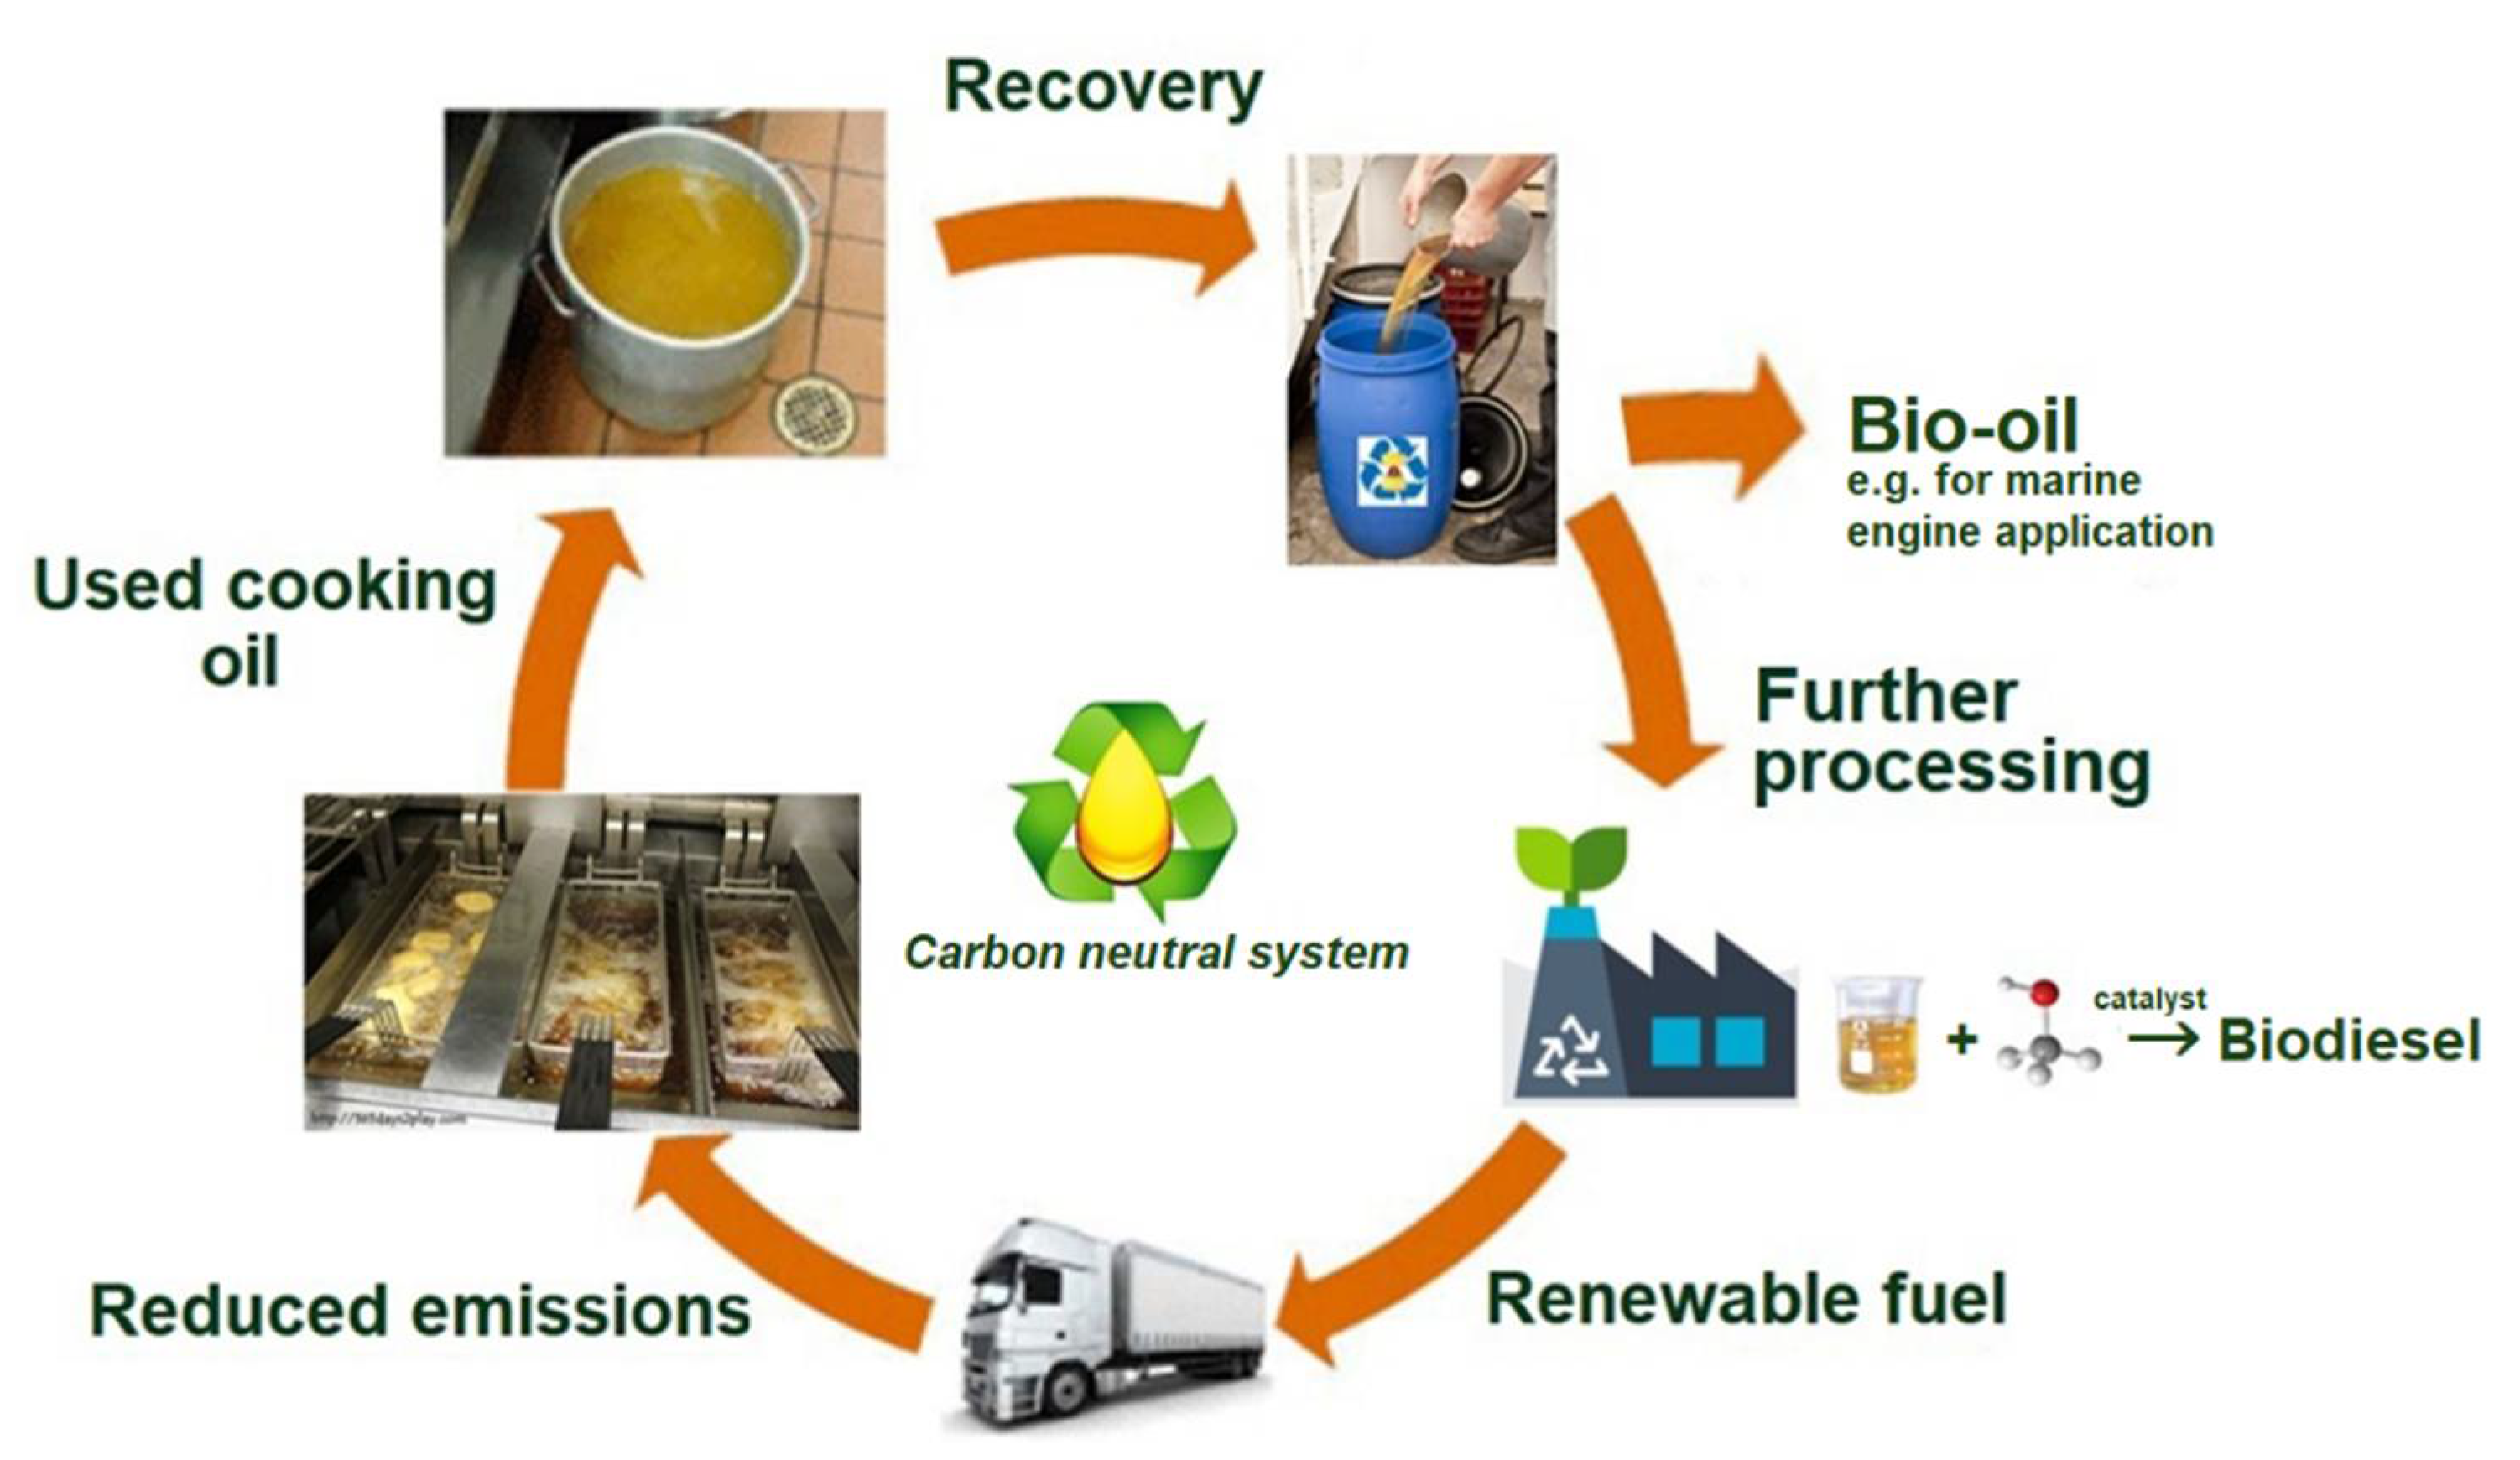
:1. Introduction
2. Materials and Methods
2.1. Materials
2.2. Methods
2.2.1. Chemical Properties
- Water content and acid number
- Oil composition
- Elemental analyses
2.2.2. Density, Kinematic Viscosity, and Surface Tension Measurements
2.2.3. Thermal Properties
3. Results and Discussion
3.1. Oil Composition
3.1.1. Polymerized Triglycerides, Diglycerides, and Fatty Acids and Monoglycerides
3.1.2. Total Free Fatty Acid
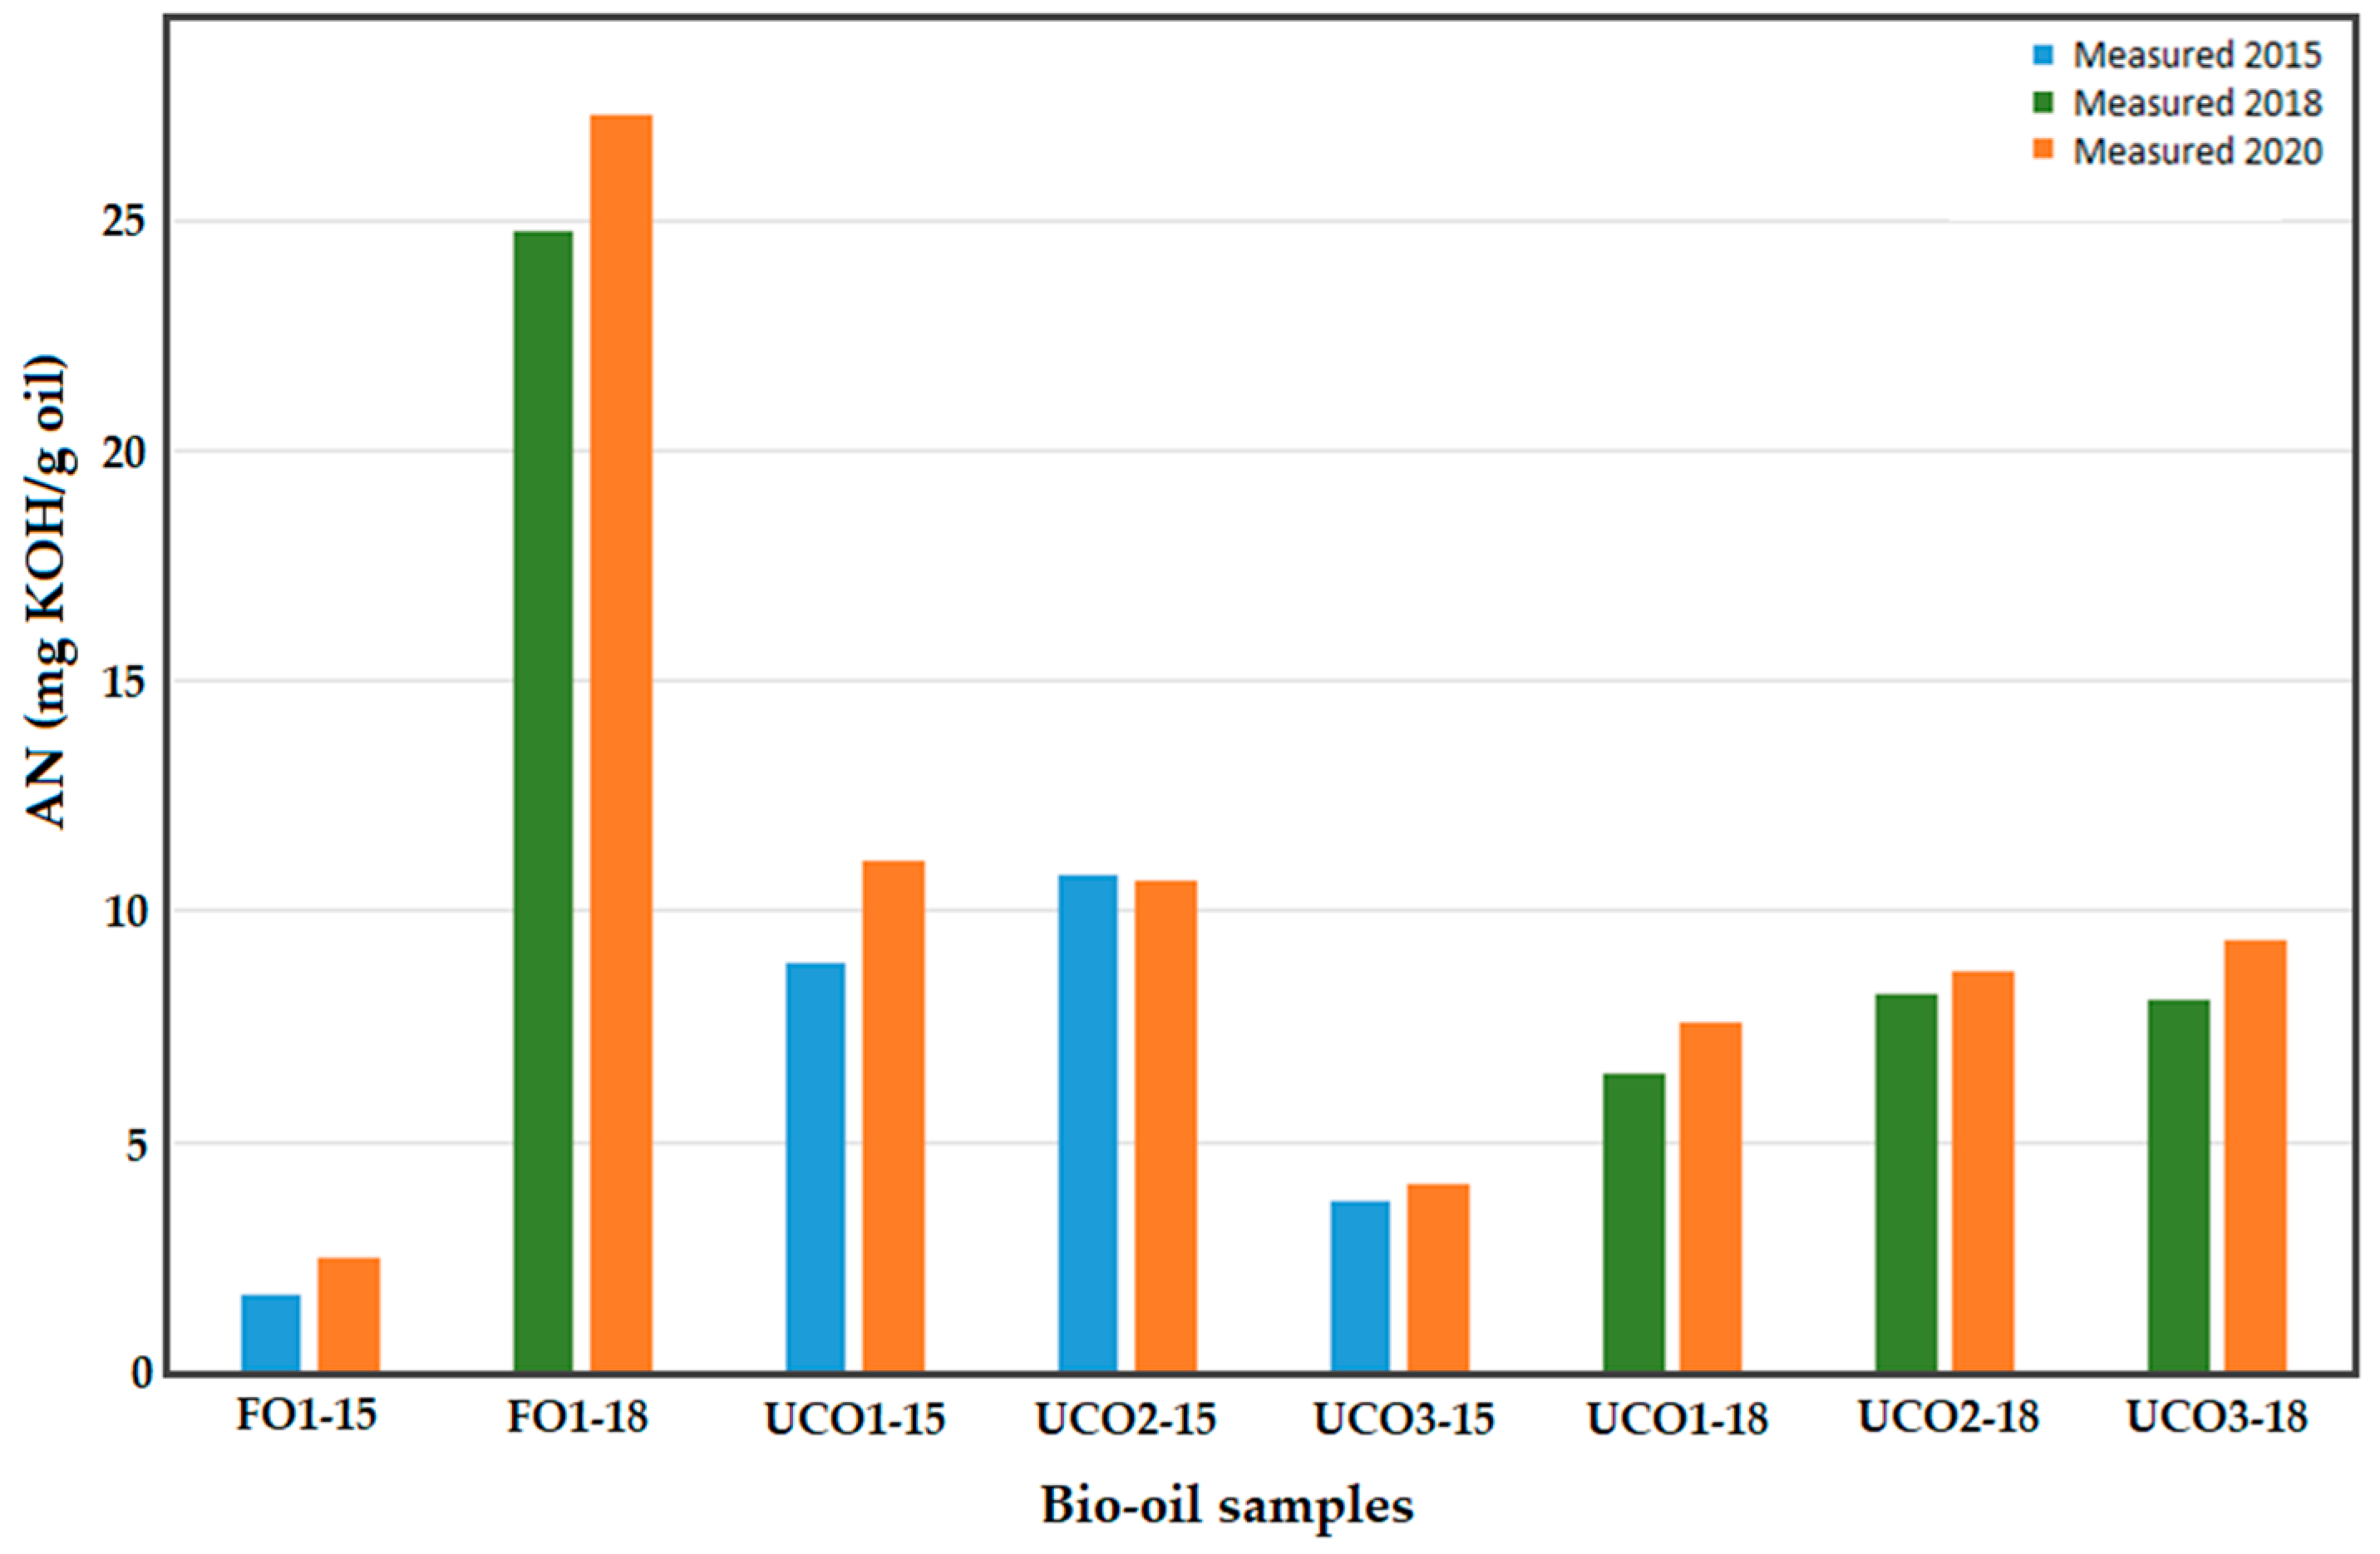
3.1.3. Acid Number
3.1.4. Water Content
3.1.5. Elemental Composition: H and C Contents of the Oils
3.2. Thermal Properties
HV of the Bio-Oils
3.3. Physical Properties
3.3.1. Density of the Bio-Oils
3.3.2. Kinematic Viscosity of the Oils
3.3.3. Surface Tension
3.4. Observations
4. Conclusions
Supplementary Materials
Author Contributions
Funding
Informed Consent Statement
Data Availability Statement
Conflicts of Interest
References
- Kulkarni, M.G.; Dalai, A.K. Waste cooking oil—An economical source for biodiesel: A review. Ind. Eng. Chem. Res. 2006, 45, 2901–2913. [Google Scholar] [CrossRef]
- Capuano, D.; Costa, M.; Di Fraia, S.; Massarotti, N.; Vanoli, L. Direct use of waste vegetable oil in internal combustion engines. Renew. Sustain. Energy Rev. 2017, 69, 759–770. [Google Scholar] [CrossRef]
- Mannekote, J.K.; Kailas, S.V. The effect of oxidation on the tribological performance of few vegetable oils. J. Mater. Res. Technol. 2012, 1, 91–95. [Google Scholar] [CrossRef] [Green Version]
- Chhetri, A.B.; Watts, K.C.; Islam, M.R. Waste cooking oil as an alternative feedstock for biodiesel production. Energies 2008, 1, 3–18. [Google Scholar] [CrossRef] [Green Version]
- Saeed, R.H.S.; Kassem, Y.; Çamur, H. Effect of biodiesel mixture derived from waste frying-corn, frying-canola-corn and canola-corn cooking oils with various ages on physiochemical properties. Energies 2019, 12, 3729. [Google Scholar] [CrossRef] [Green Version]
- Behçet, R. Performance and emission study of waste anchovy fish biodiesel in a diesel engine. Fuel Process. Technol. 2011, 92, 1187–1194. [Google Scholar] [CrossRef]
- Hemmer, M.; Badent, R.; Ströck, G. Einsatzfähigkeit von Rapsöl als Isoliermedium in Mittelspannungstransformatoren. In Nachwachsende Rohstoffe für die Chemie 8, Tübingen, Germany, 26–27 March 2003; Landwirtschaftsverlag: Münster, Germany, 2003; pp. 591–599. [Google Scholar]
- Tye, C.T. Recent advances in waste cooking oil management and applications for sustainable environment. In Handbook of Research on Resource Management for Pollution and Waste Treatment; Affam, A.C., Ezechi, E.H., Eds.; IGI Global: Hershey, PA, USA, 2020; pp. 47–63. [Google Scholar]
- Moirangthem, K. Alternative Fuel for Marine and Inland Waterways: An Exploratory Study; European Commission JRC: Luxembourg, 2016; pp. 1–44. [Google Scholar]
- European Commission (EC). Reducing Emissions from the Shipping Sector. Available online: https://ec.europa.eu/clima/policies/transport/shipping_en (accessed on 7 December 2020).
- Santos, J.C.O.; Santos, I.M.G.; Souza, A.G. Effect of heating and cooling on rheological parameters of edible vegetable oils. J. Food Eng. 2005, 67, 401–405. [Google Scholar] [CrossRef]
- Di Pietro, M.E.; Mannu, A.; Mele, A. NMR determination of free acids in vegetable oils. Processes 2020, 8, 410. [Google Scholar] [CrossRef] [Green Version]
- Talbot, G. The stability and shelf life of fats and oils. In The Stability and Shelf Life of Food, 2nd ed.; Subramaniam, P., Ed.; Elsevier: Amsterdam, The Netherlands, 2016; pp. 461–503. [Google Scholar]
- Marmesat, S.; Rodrigues, E.; Velasco, J.; Dobarganes, C. Quality of used frying fats and oils: Comparison of rapid tests based on chemical and physical oil properties. Int. J. Food Sci. Technol. 2007, 42, 601–608. [Google Scholar] [CrossRef]
- Totani, N.; Yawata, M.; Mori, T.; Hammond, E.G. Oxygen content and oxidation in frying oil. J. Oleo Sci. 2013, 62, 989–995. [Google Scholar] [CrossRef]
- Gnanasekaran, D. Green fluids from vegetable oil: Power plant. In Vegetable Oil based Bio-lubricants and Transformer Fluids: Applications in Power Plants; Gnanasekaran, D., Chavidi, V.P., Eds.; Springer Nature: Singapore, 2018; pp. 3–26. [Google Scholar]
- Gutiérrez González-Quijano, R.; Dobarganes, M.C. Analytical procedures for the evaluation of used frying fats. In Frying of Food: Principles, Changes, New Aproaches; Varela, G., Bender, A.E., Morton, I.D., Eds.; VCH: Weinheim, Germany, 1988; pp. 141–154. [Google Scholar]
- Enweremadu, C.C.; Mbarawa, M.M. Technical aspects of production and analysis of biodiesel from used cooking oil—A review. Renew. Sustain. Energy Rev. 2009, 13, 2205–2224. [Google Scholar] [CrossRef]
- Gertz, C.; Klostermann, S.; Kochhar, S.P. Testing and comparing oxidative stability of vegetable oils and fats at frying temperature. Eur. J. Lipid Sci. Technol. 2000, 102, 543–551. [Google Scholar] [CrossRef]
- Tenbohlen, S.; Koch, M. Aging performance and moisture solubility of vegetable oils for power transformers. IEEE Trans. Power Deliv. 2010, 25, 825–830. [Google Scholar] [CrossRef]
- Sazzad, B.S.; Fazal, M.A.; Haseeb, A.S.M.A.; Masjuki, H.H. Retardation of oxidation and material degradation in biodiesel: A review. Rsc Adv. 2016, 6, 60244–60263. [Google Scholar] [CrossRef] [Green Version]
- Demirbas, A.; Karslioglu, S. Biodiesel production facilities from vegetable oils and animal fats. Energy Sourses Part A 2007, 29, 133–141. [Google Scholar] [CrossRef]
- Bouaid, A.; Martinez, M.; Aracil, J. Long storage stability of biodiesel from vegetable and used frying oils. Fuel 2007, 86, 2596–2602. [Google Scholar] [CrossRef]
- Xu, Y.; Qian, S.; Liu, Q.; Wang, Z.D. Oxidation stability assessment of a vegetable transformer oil under thermal aging. IEEE Trans. Dielectr. Electr. Insul. 2014, 21, 683–692. [Google Scholar] [CrossRef]
- Fox, N.J.; Stachowiak, G.W. Vegetable oil-based lubricants—A review of oxidation. Tribol. Int. 2007, 40, 1035–1046. [Google Scholar] [CrossRef]
- Sidibé, S.S.; Blin, J.; Vaitilingom, G.; Azoumah, Y. Use of crude filtered vegetable oil as a fuel in diesel engines state of the art: Literature review. Renew. Sustain. Energy Rev. 2010, 14, 2748–2759. [Google Scholar] [CrossRef]
- Bruun, N.; Khazraie Shoulaifar, T.; Hemming, J.; Willför, S.; Hupa, L. Characterization of waste bio-oil as an alternate source of renewable fuel for marine engines. Biofuels 2019. [Google Scholar] [CrossRef]
- Ushakov, S.; Valland, H.; Æsøy, V. Combustion and emissions characteristics of fish oil fuel in a heavy-duty diesel engine. Energy Convers. Manag. 2013, 65, 228–238. [Google Scholar] [CrossRef]
- Yin, H.; Solval, K.M.; Huang, J.; Bechtel, P.J.; Sathivel, S. Effects of oil extraction methods on physical and chemical properties of red salmon oils (Oncorhynchus nerka). J. Am. Oil Chem. Soc. 2011, 88, 1641–1648. [Google Scholar] [CrossRef]
- Blin, J.; Brunschwig, C.; Chapuis, A.; Changotade, O.; Sidibe, S.S.; Noumi, E.S.; Girard, P. Characteristics of vegetable oils for use as fuel in stationary diesel engines—Towards specifications for a standard in West Africa. Renew. Sustain. Energy Rev. 2013, 22, 580–597. [Google Scholar] [CrossRef] [Green Version]
- Jayasinghe, P.; Hawboldt, K. A review of bio-oils from waste biomass: Focus on fish processing waste. Renew. Sustain. Energy Rev. 2012, 16, 798–821. [Google Scholar] [CrossRef]
- Adeoti, I.A.; Hawboldt, K. Comparison of biofuel quality of waste derived oils as a function of oil extraction methods. Fuel 2015, 158, 183–190. [Google Scholar] [CrossRef]
- Lee, B.B.; Ravindra, P.; Chan, E.S. New drop weight analysis for surface tension determination of liquids. Colloids Surf. A Physicochem. Eng. Aspects 2009, 332, 112–120. [Google Scholar] [CrossRef]
- Gianino, C. Measurement of surface tension by the dripping from a needle. Phys. Educ. 2006, 41, 440–444. [Google Scholar] [CrossRef]
- Morόn-Villarreyes, J.A.; Soldi, C.; DeAmorim, A.M.; Pizzolatti, M.G.; DeMendonça, A.P., Jr.; D’Oca, M.G.M. Diesel/biodiesel proportion for by-compression ignition engines. Fuel 2007, 86, 1977–1982. [Google Scholar] [CrossRef]
- Graboski, M.S.; McCormick, R.L. Combustion of fat and vegetable oil derived fuels in diesel engines. Prog. Energy Combust. Sci. 1998, 24, 125–164. [Google Scholar] [CrossRef]
- Goodrum, J.W.; Eitcman, M.A. Physical properties of low molecular weight triglycerides for the development of bio-diesel fuel models. Bioresour. Technol. 1996, 56, 55–60. [Google Scholar] [CrossRef]
- Tyowua, A.T.; Targeman, M.; Binks, B.P. Comparison of vegetable oil–silicone oil interfacial tension data from the du Noüy ring and the spinning drop methods. Niger. Ann. Pure Appl. Sci. Maiden Ed. 2018, 209–213. [Google Scholar] [CrossRef]
- Bruun, N.; Demesa, A.G.; Tesfaye, F.; Hemming, J.; Hupa, L. Factors affecting the corrosive behavior of used cooking oils and a non-edible fish oil that are in contact with ferrous metals. Energies 2019, 12, 4812. [Google Scholar] [CrossRef] [Green Version]
- Dirbeba, M.J.; Aho, A.; DeMartini, N.; Brink, A.; Mattsson, I.; Hupa, L.; Hupa, M. Fast pyrolysis of dried sugar cane vinasse at 400 and 500 °C: Product distribution and yield. Energy Fuels 2019, 33, 1236–1247. [Google Scholar] [CrossRef]
- Pölczmann, G.; Tόth, O.; Beck, Á.; Hancsόk, J. Investigation of storage stability of diesel fuels containing biodiesel produced from waste cooking oil. J. Clean. Prod. 2016, 111, 85–92. [Google Scholar]
- Meng, J.; Moore, A.; Tilotta, D.C.; Kelley, S.S.; Adhikair, S.; Park, S. Thermal and storage stability of bio-oil from pyrolysis of torrefied wood. Energy Fuels 2015, 29, 5117–5126. [Google Scholar] [CrossRef]
- Ollus, R.; Juoperi, K. Alternative fuels experiences for medium-speed diesel engines. In Proceedings of the 25th CIMAC Congress on Combustion Engine Technology, Vienna, Austria, 21–27 May 2007; International Council on Combustion Engines: Frankfurt, Germany, 2007. [Google Scholar]
- Karmakar, A.; Karmakar, S.; Mukherjee, S. Properties of various plants and animals feedstocks for biodiesel production. Bioresour. Technol. 2010, 101, 7201–7210. [Google Scholar] [CrossRef]
- Gregg, F. SVO: Powering Your Vehicle with Straight Vegetable Oil; New Society Publishers: Gabriola Island, BC, Canada, 2008; pp. 29–79. [Google Scholar]
- Yahyaee, R.; Ghobadian, B.; Najafi, G. Waste fish oil biodiesel as a source of renewable fuel in Iran. Renew. Sustain. Energy Rev. 2013, 7, 312–319. [Google Scholar] [CrossRef]
- Wisniewski, A.; Wiggers, V.R.; Simionatto, E.L.; Meier, H.F.; Barros, A.A.C.; Madureira, L.A.S. Biofuels from waste fish oil pyrolysis: Chemical composition. Fuel 2010, 89, 563–568. [Google Scholar] [CrossRef]
- Abidin, S.Z.; Patel, D.; Saha, B. Quantitative analysis of fatty acids composition in the used cooking oil (UCO) by gas chromatography-mass spectrometry (GC-MS). Can. J. Chem. Eng. 2013, 91, 1896–1903. [Google Scholar] [CrossRef]
- Czernik, S.; Bridgwater, A.V. Overview of applications of biomass fast pyrolysis oil. Energy Fuels 2004, 18, 590–598. [Google Scholar] [CrossRef]
- Hoekman, S.K.; Broch, A.; Robbins, C.; Ceniceros, E.; Natarajan, M. Review of biodiesel composition, properties, and specifications. Renew. Sustain. Energy Rev. 2012, 16, 143–169. [Google Scholar] [CrossRef]
- Wahyudi, W.; Nadjib, M.; Bari, M.F.; Permana, F.W. Increasing of quality biodiesel of Jatropha seed oil with biodiesel mixture of waste cooking oil. J. Biotech Res. 2019, 10, 183–189. [Google Scholar]
- Jiménez Espadafor, F.; Torres García, M.; Becerra Villanueva, J.; Moreno Gutiérrez, J. The viability of pure vegetable oil as an alternative fuel for large ships. Transp. Res. Part D. 2009, 14, 461–469. [Google Scholar] [CrossRef]
- Liu, Z.W.; Li, F.S.; Wang, W.; Wang, B. Impact of different levels of biodiesel oxidation on its emission characteristics. J. Energy Inst. 2019, 92, 861–870. [Google Scholar] [CrossRef]
- Sahasrabudhe, S.N.; Rodriguez-Martinez, V.; O’Meara, M.; Farkas, B.F. Density, viscosity and surface tension of five vegetable oils at elevated temperatures: Measurement and modeling. Int. J. Food Prop. 2017, 20, 51965–51981. [Google Scholar] [CrossRef] [Green Version]
- Prankl, H.; Wörgetter, M.; Rathbauer, J. Technical performance of vegetable oil methyl esters with a high iodine number. In Proceedings of the 4th Biomass Conference of the Americas, Oakland, CA, USA, 29 August–2 September 1999. [Google Scholar]
- Knothe, G.; Steidley, K.R. Kinematic viscosity of biodiesel fuel components and related compounds. Influence of compound structure and comparison to petrodiesel fuel components. Fuel 2005, 84, 1059–1065. [Google Scholar] [CrossRef]
- Yaws, C.L.; Richmond, P.C. Chapter 21 - Surface tension-Organic compounds. In Thermophysical Properties of Chemicals and Hydrocarbons; Yaws, C.L., Ed.; William Andrew Publishing: Norwich, NY, USA, 2009; pp. 686–781. [Google Scholar] [CrossRef]
- Bajpai, D.; Tyagi, V.K. Biodiesel: Source, production, composition, properties and its benefits. J. Oleo Sci. 2006, 55, 487–502. [Google Scholar] [CrossRef] [Green Version]
- Das, L.M.; Bora, D.K.; Pradhan, S.; Naik, M.K.; Naik, S.N. Long-term storage stability of biodiesel produced from Karanja oil. Fuel 2009, 88, 2315–2318. [Google Scholar] [CrossRef]


| Sample | Polymerized Triglycerides (%) | Diglycerides (%) | Fatty Acids and Monoglycerides (%) | |||
|---|---|---|---|---|---|---|
| Year of Analysis | Year of Analysis | Year of Analysis | ||||
| 2015 | 2020 | 2015 | 2020 | 2015 | 2020 | |
| FO1-15 | n.d. | 4.3 | 0.3 | 1.7 | 0.7 | n.d. |
| UCO1-15 | 5.6 | 6 | 12.6 | 14.6 | 4.2 | 6.1 |
| UCO2-15 | 5.6 | 6 | 13.8 | 15.3 | 4.6 | 6.6 |
| UCO3-15 | 4.8 | 6.6 | 6.2 | 8.2 | 1.7 | 3.1 |
| 2018 | 2020 | 2018 | 2020 | 2018 | 2020 | |
| FO1-18 | n.d. | 1.7 | 7.6 | 11.8 | 10.8 | 14.0 |
| UCO1-18 | 1.2 | 5.7 | 4.5 | 10.1 | 1.1 | 4.7 |
| UCO2-18 | 1.3 | 5.1 | 5.10 | 10.3 | 1.6 | 4.9 |
| UCO3-18 | 1.3 | 6 | 5.2 | 10.8 | 1.6 | 5.8 |
| Water Content (ppm) | |||||
|---|---|---|---|---|---|
| Year | Year | ||||
| Sample | 2015 | 2020 | Sample | 2018 | 2020 |
| FO1-15 | 473 | 900 | FO1-18 | 2473 | 2720 |
| UCO1-15 | 538 | 1094 | UCO1-18 | 1662 | 1773 |
| UCO2-15 | 706 | 1015 | UCO2-18 | 1449 | 1734 |
| UCO3-15 | 740 | 977 | UCO3-18 | 1403 | 1686 |
| Sample | C (wt%) | H (wt%) | C to H Ratio (Mass Basis) |
|---|---|---|---|
| FO1-15 | 79.1 | 12.1 | 6.5 |
| FO1-18 | 76.6 | 11.8 | 6.5 |
| UCO1-15 | 76.8 | 12.0 | 6.4 |
| UCO2-15 | 76.2 | 11.9 | 6.4 |
| UCO3-15 | 76.3 | 11.9 | 6.4 |
| UCO1-18 | 76.4 | 11.9 | 6.4 |
| UCO2-18 | 76.8 | 11.0 | 7.0 |
| UCO3-18 | 76.7 | 12.0 | 6.4 |
| COref | 86.2 | 13.1 | 6.6 |
| Sample | Heating Value (MJ/kg Oil) | Sample | Heating Value (MJ/kg Oil) | ||
|---|---|---|---|---|---|
| 2015 | 2020 | 2018 | 2020 | ||
| FO1-15 | 39.8 | 40.1 | FO1-18 | 40.3 | 39.7 |
| UCO1-15 | 40 | 39.5 | UCO1-18 | 39.6 | 40.0 |
| UCO2-15 | 40 | 39.6 | UCO2-18 | 39.7 | 40.0 |
| UCO3-15 | 39.9 | 39.8 | UCO3-18 | 39.7 | 39.7 |
| Sample | Kinematic Viscosity (mm2/s) 40 °C Year of Analysis | Density (kg/m3) 21 °C Year of Analysis | Surface Tension (mN/m) Year of Analysis | |||
|---|---|---|---|---|---|---|
| 2015 | 2020 | 2015 | 2020 | 2020 | ||
| FO1-15 | 31.9 | 36.4 | 916 | 917 | - | 33.25 |
| UCO1-15 | 40.6 | 43.6 | 914 | 915 | - | 32.91 |
| UCO2-15 | 41.3 | 43.6 | 916 | 916 | - | 32.99 |
| UCO3-15 | 44.3 | 44.1 | 915 | 916 | - | 33.03 |
| 2018 | 2020 | 2018 | 2020 | 2020 | ||
| FO1-18 | 26.6 | 35.7 | 916 | 919 | - | 32.97 |
| UCO1-18 | 40.7 | 41.0 | 916 | 916 | - | 33.01 |
| UCO2-18 | 40.7 | 40.0 | 917 | 914 | - | 33.14 |
| UCO3-18 | 40.3 | 41.7 | 916 | 918 | - | 33.12 |
Publisher’s Note: MDPI stays neutral with regard to jurisdictional claims in published maps and institutional affiliations. |
© 2020 by the authors. Licensee MDPI, Basel, Switzerland. This article is an open access article distributed under the terms and conditions of the Creative Commons Attribution (CC BY) license (http://creativecommons.org/licenses/by/4.0/).
Share and Cite
Bruun, N.; Tesfaye, F.; Hemming, J.; Dirbeba, M.J.; Hupa, L. Effect of Storage Time on the Physicochemical Properties of Waste Fish Oils and Used Cooking Vegetable Oils. Energies 2021, 14, 101. https://doi.org/10.3390/en14010101
Bruun N, Tesfaye F, Hemming J, Dirbeba MJ, Hupa L. Effect of Storage Time on the Physicochemical Properties of Waste Fish Oils and Used Cooking Vegetable Oils. Energies. 2021; 14(1):101. https://doi.org/10.3390/en14010101
Chicago/Turabian StyleBruun, Nina, Fiseha Tesfaye, Jarl Hemming, Meheretu Jaleta Dirbeba, and Leena Hupa. 2021. "Effect of Storage Time on the Physicochemical Properties of Waste Fish Oils and Used Cooking Vegetable Oils" Energies 14, no. 1: 101. https://doi.org/10.3390/en14010101