Article

“Peer-to-Peer Plus” Electricity Transaction within Community of Active Energy Agents Regarding Distribution Network Constraints

1
School of Electronics and Information Engineering, Tongji University, Shanghai 201804, China
2
Institute of Bigdata and Informatization, Tongji University, Shanghai 200092, China
*
Author to whom correspondence should be addressed.
Energies 2020, 13(9), 2408; https://doi.org/10.3390/en13092408
Submission received: 15 April 2020 / Revised: 4 May 2020 / Accepted: 6 May 2020 / Published: 11 May 2020
(This article belongs to the Special Issue Smart Grids and Flexible Energy Systems)

Abstract

:
This paper proposes the concept “active energy agent (AEA)” to characterize the autonomous and interactive entities of power system. The future distribution network is a peer-to-peer (P2P) community based on numbers of AEAs. A two-stage “P2P Plus” mechanism is developed to address the electricity transaction within AEA community. In the first “P2P” stage, electricity is directly traded among AEAs via P2P price bidding. The model of P2P transaction is established, and the method of multi-dimensional willingness is adopted in price bidding. In the second “Plus” stage, the centralized coordination by distribution company (DisCo) is formulated as a constrained optimization problem, in which the objective is to maximize profit and the constraints are the basic rights of AEAs and line ratings of distribution network. A 30-bus test system including 29 AEAs and main grid is investigated. Numeric simulation results verify the effectiveness of the proposed models and methods regarding flow constraint. Comparative study reveals the economic motivations of AEAs to participate in P2P transaction, the efficiency of combined search, and the benefit of DisCo from pricing control.

1. Introduction

The future distribution network is a peer-to-peer (P2P) community based on distributed energy resources (DERs) and distributed intelligence. On the one hand, the boundaries between electricity producers and consumers are blurring fast, leading to the emergence of prosumers. A prosumer can play a time-variant dual-role in electricity transaction, as either a buyer or a seller at different times. On the other hand, advanced information technologies make prosumers capable of active perception, comprehension, decision, and interaction in terms of various energy behaviors, such as production, consumption, and storage. This paper proposes the concept of active energy agent (AEA) to characterize the autonomous interactive entities in electricity market. Numbers of AEAs form a P2P community and each AEA is an equivalent peer of the community, regardless of physical implementations. An AEA in reality can be a smart appliance, a rooftop photovoltaic, an electric vehicle, a household energy management system, a microgrid, a virtual power plant, etc.
The P2P transaction is generally adopted among entities that are organized in a P2P manner, due to the advantages with respect to renewable energy use and economic benefit. Reference [1,2] developed the P2P transactions between renewable energy modules and electric vehicles. The use of renewable energy is significantly improved, since electric vehicles can charge batteries to consume the excess output of renewable energy modules which would, otherwise, be curtailed to avoid over-voltage issues. Reference [3] proposed the P2P power sharing mechanism in a microgrid through two-level battery management, and verified that P2P could lead to higher benefits for both parties in the transaction than the traditional mode of the feed-in grid. The matchmaking and negotiation are the two key factors of the P2P transaction. Firstly, matchmaking refers to the mechanism and criterion according to which the two parties in the P2P transaction are successfully matched. Reference [4] believes that the matchmaking is solely dependent on price, and the seller chooses the buyer who has a low bid price. Reference [5,6] aimed to find the optimal match among nodes by minimizing the energy output of the central node. Meanwhile, connection cannot be set up if the distance between two nodes exceeds the threshold. By considering the distance between two nodes, sellers would give more power to buyers who is closer to them [7]. Reference [8] integrates the cost and quantity of electricity in the utility function to describe the agent’s preference or value for an offer. Secondly, the negotiation refers to the strategies according to which the two parties in P2P transaction dynamically update their bids. The classical zero intelligence strategy simply locks the bid price into not being below the cost or above the value [9]. The closing rate can significantly increase, but the market players cannot dynamically respond to the changing market since the price is independent of the willingness of market players. The unilateral bidding mechanism is modified to improve the flexibility of P2P energy trading. The zero intelligence plus strategy provides all traders with the right to choose counterparties, significantly improving the benefits of both parties in the transaction [10]. Reference [11] adopts an adaptive and aggressive trading strategy that reflects the willingness of market players in P2P energy trading. By using agent modelling to capture the preferences of entities, the impact of three negotiation strategies on transaction process are discussed in reference [8]. Most existing work offers the P2P market players with the principal one chance to select the counterparty. This paper attempts to propose a modification that can offer more right to market players by comprehensively regarding their willingness.
Despite of the efficiency and flexibility of P2P transactions, it is of high risk to solely rely on P2P transactions in a real distribution network. For example, some orders cannot be successfully matched, and some lines can be congested. It is crucial to apply centralized coordination or intervention after spontaneous P2P transactions. In the context of setting up the electricity market, economic measures such as electricity prices are the preferred options. Demand response is a typical centralized coordination scheme, and falls into two categories—price-based and incentive-based—which have significant effects on transferring load and reducing load, respectively [12]. Demand response programs are applied in various scenarios to improve the rationality of electricity consumption [13], reduce peak-to-valley differences of load demand [14], alleviate power supply demand imbalances and save energy [15], realize the reliability and economical operation [16]. Reference [17] proposes a joint program that makes the demand side actively participate in scheduling, and a load change rate following wind power fluctuations to optimize the load curve. Reference [18] adopts the demand-price elasticity model to increase the allocation capacity of renewable energy while reducing the use of energy storage and the thermal power. Reference [13] integrates demand response and the robust stochastic optimization to deal with the uncertainty of wind power. The cited work mainly focuses on the management of demand side, while neglects the impact of the power flow on the safety of power system. Generally speaking, the flow of electric power can be calculated by using the Power-Flow or Load-Flow methods [19]. Reference [20] includes a Power-Flow algorithm in the model to determine the network currents and voltages. Reference [21] sets up a general approach for modeling multi-carrier energy systems. However, little effort is made in terms of imposing power flow constraints on demand response in case of line congestion.
The setting up of electricity markets has been undergoing progress [22]. Documents issued by NDRC (National Development and Reform Commission of China) and NEA (National Energy Administration of China) strongly promote near-site bilateral transactions and encourage the local consumption of distributed energies [
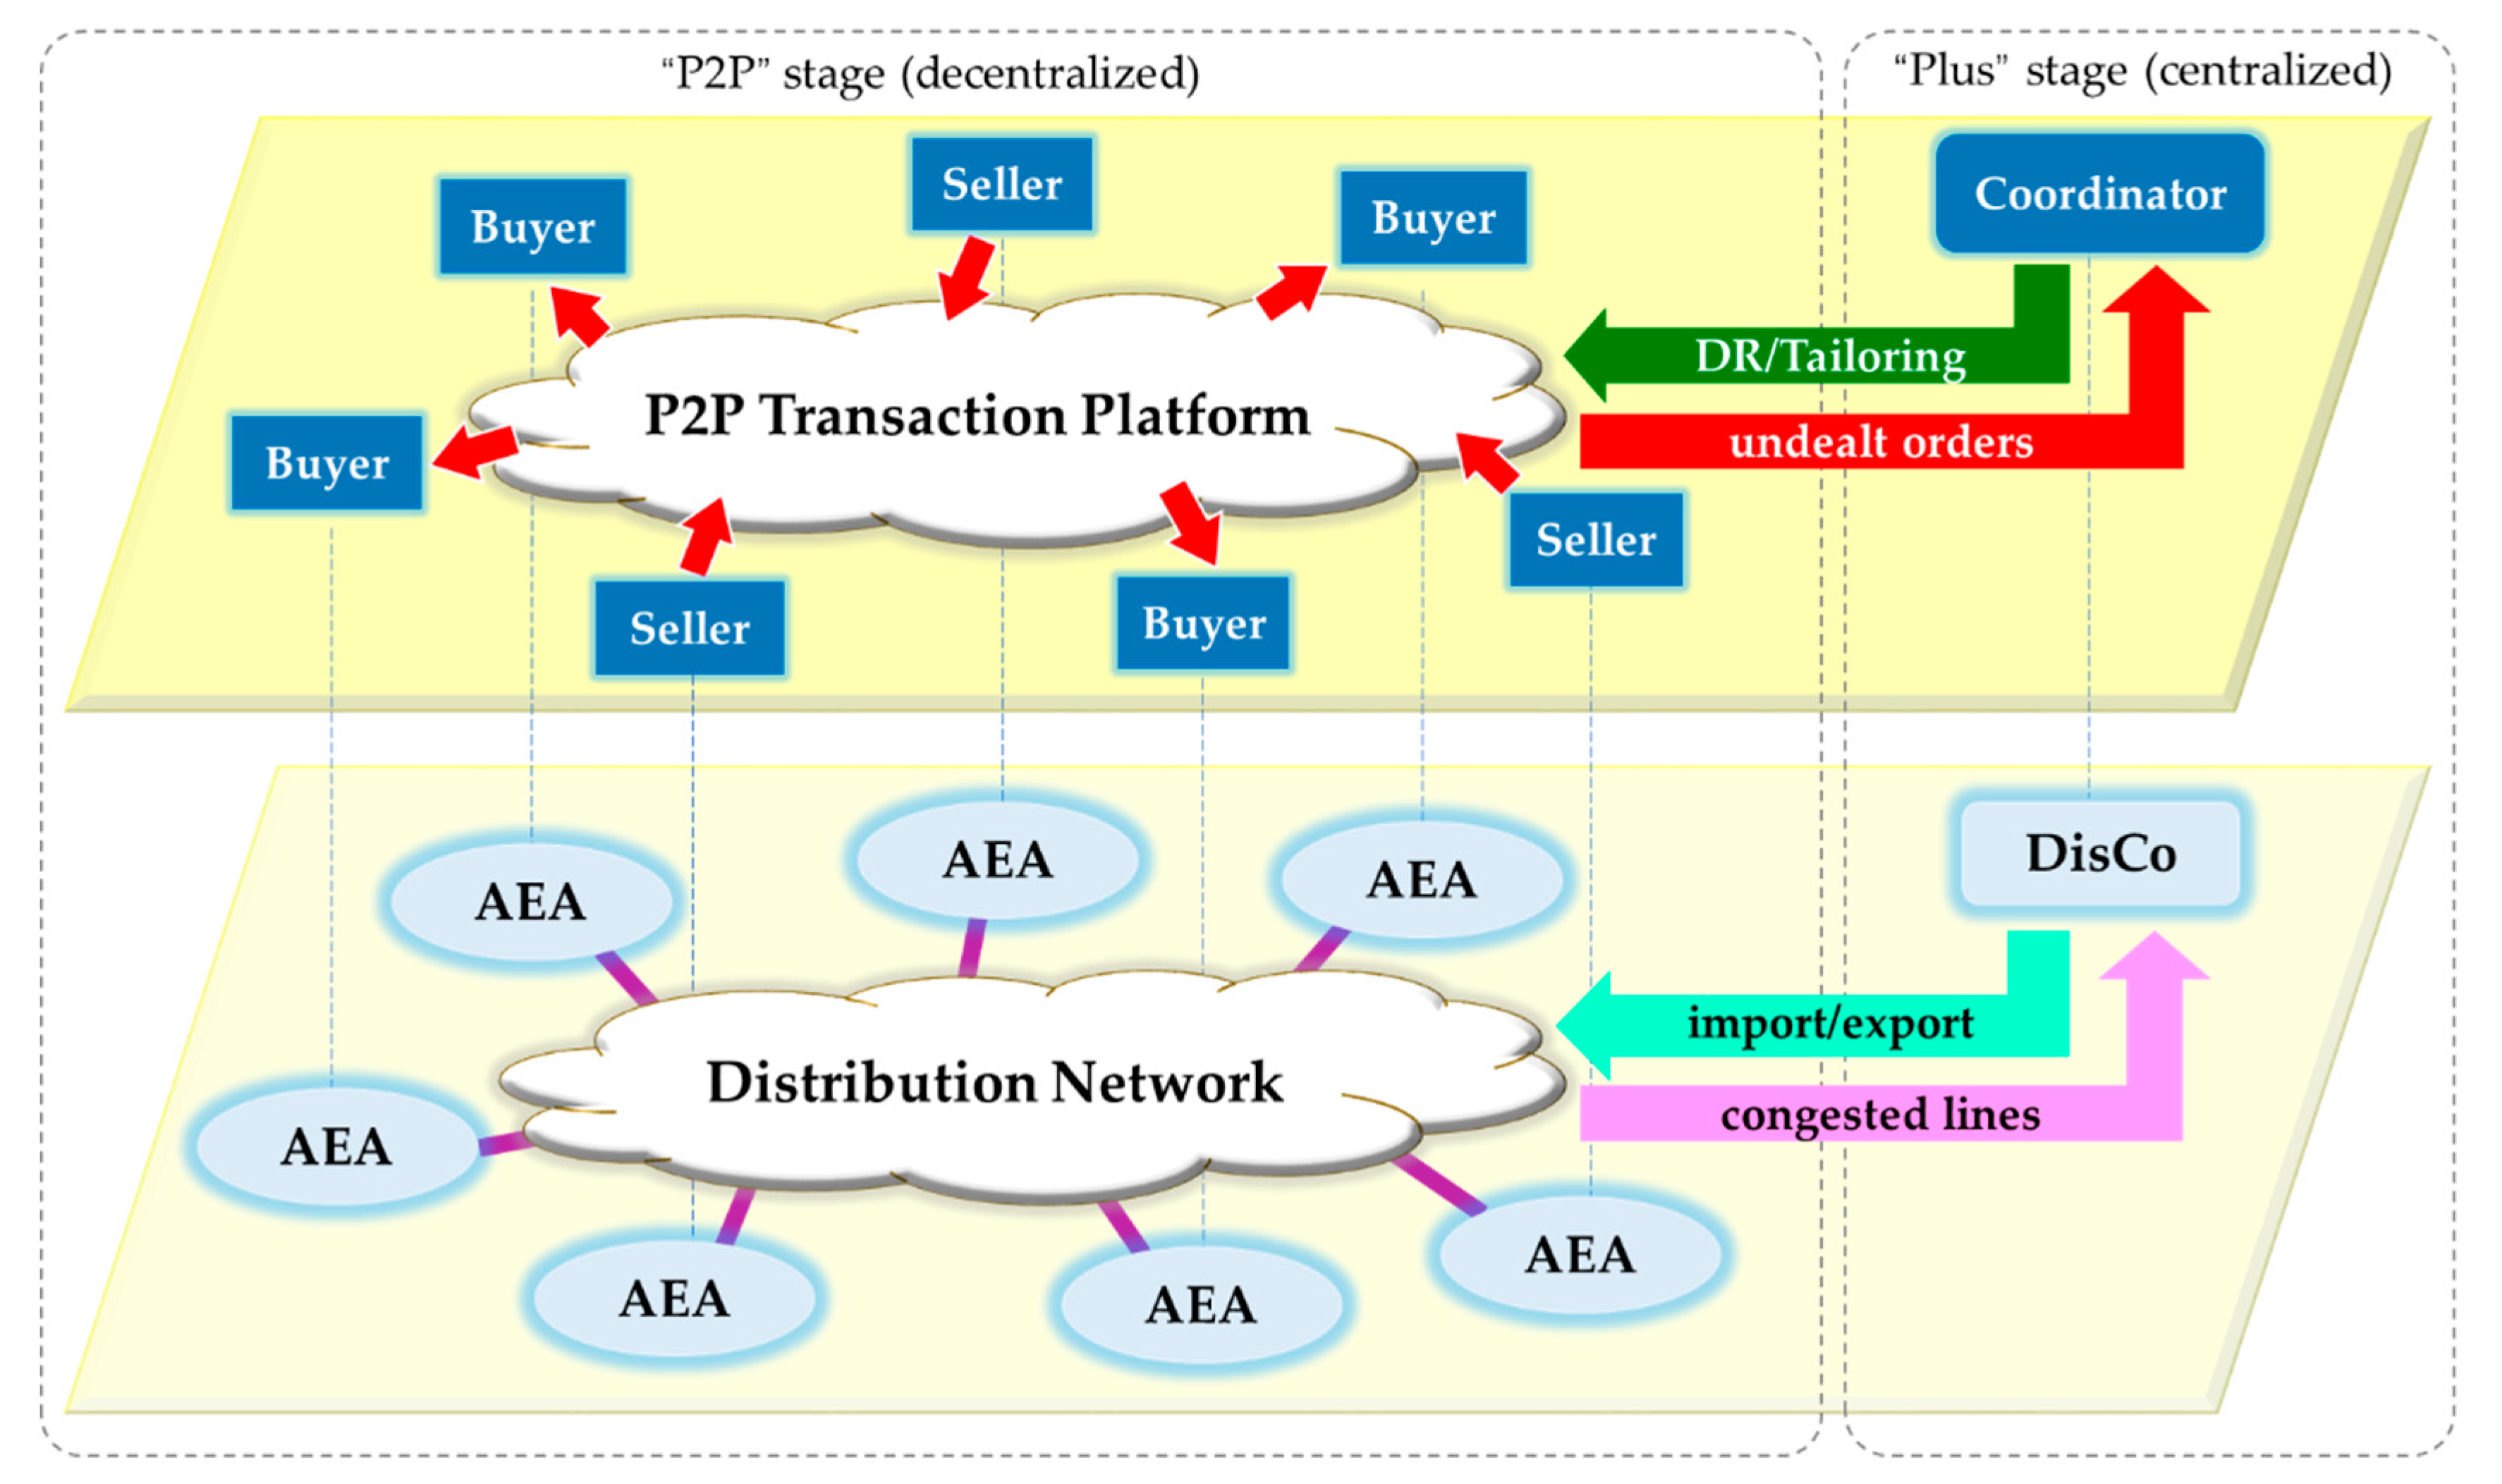
23]. With the opening of retail markets and the construction of incremental distribution networks, a number of novel distribution companies (DisCo) have emerged. DisCo is the dual-role participant in the electricity transaction. On the one hand, DisCo is a self-interested market player that maximizes profit from electricity transactions, on the other hand, DisCo is the system operator responsible for ensuring the basic rights of users and the safety of the distribution network [24]. In this context, this paper proposes a two-stage “P2P Plus” mechanism of transaction that is a hybrid of the decentralized P2P transaction with centralized coordination. The mechanism takes full account of the willingness of the AEA and guarantees the energy supply and the safety of the distribution network. The innovative contributions of this article can be outlined as follows:
(1).
The concept of the “active energy agent” is proposed to characterize any autonomous entity exhibiting active energy behavior in electricity transaction, regardless of their specific physical appearance.
(2).
The two-stage “P2P Plus” mechanism is developed, which integrates the decentralized transaction and centralized coordination or intervention by considering the benefits of all parties in electricity transaction.
(3).
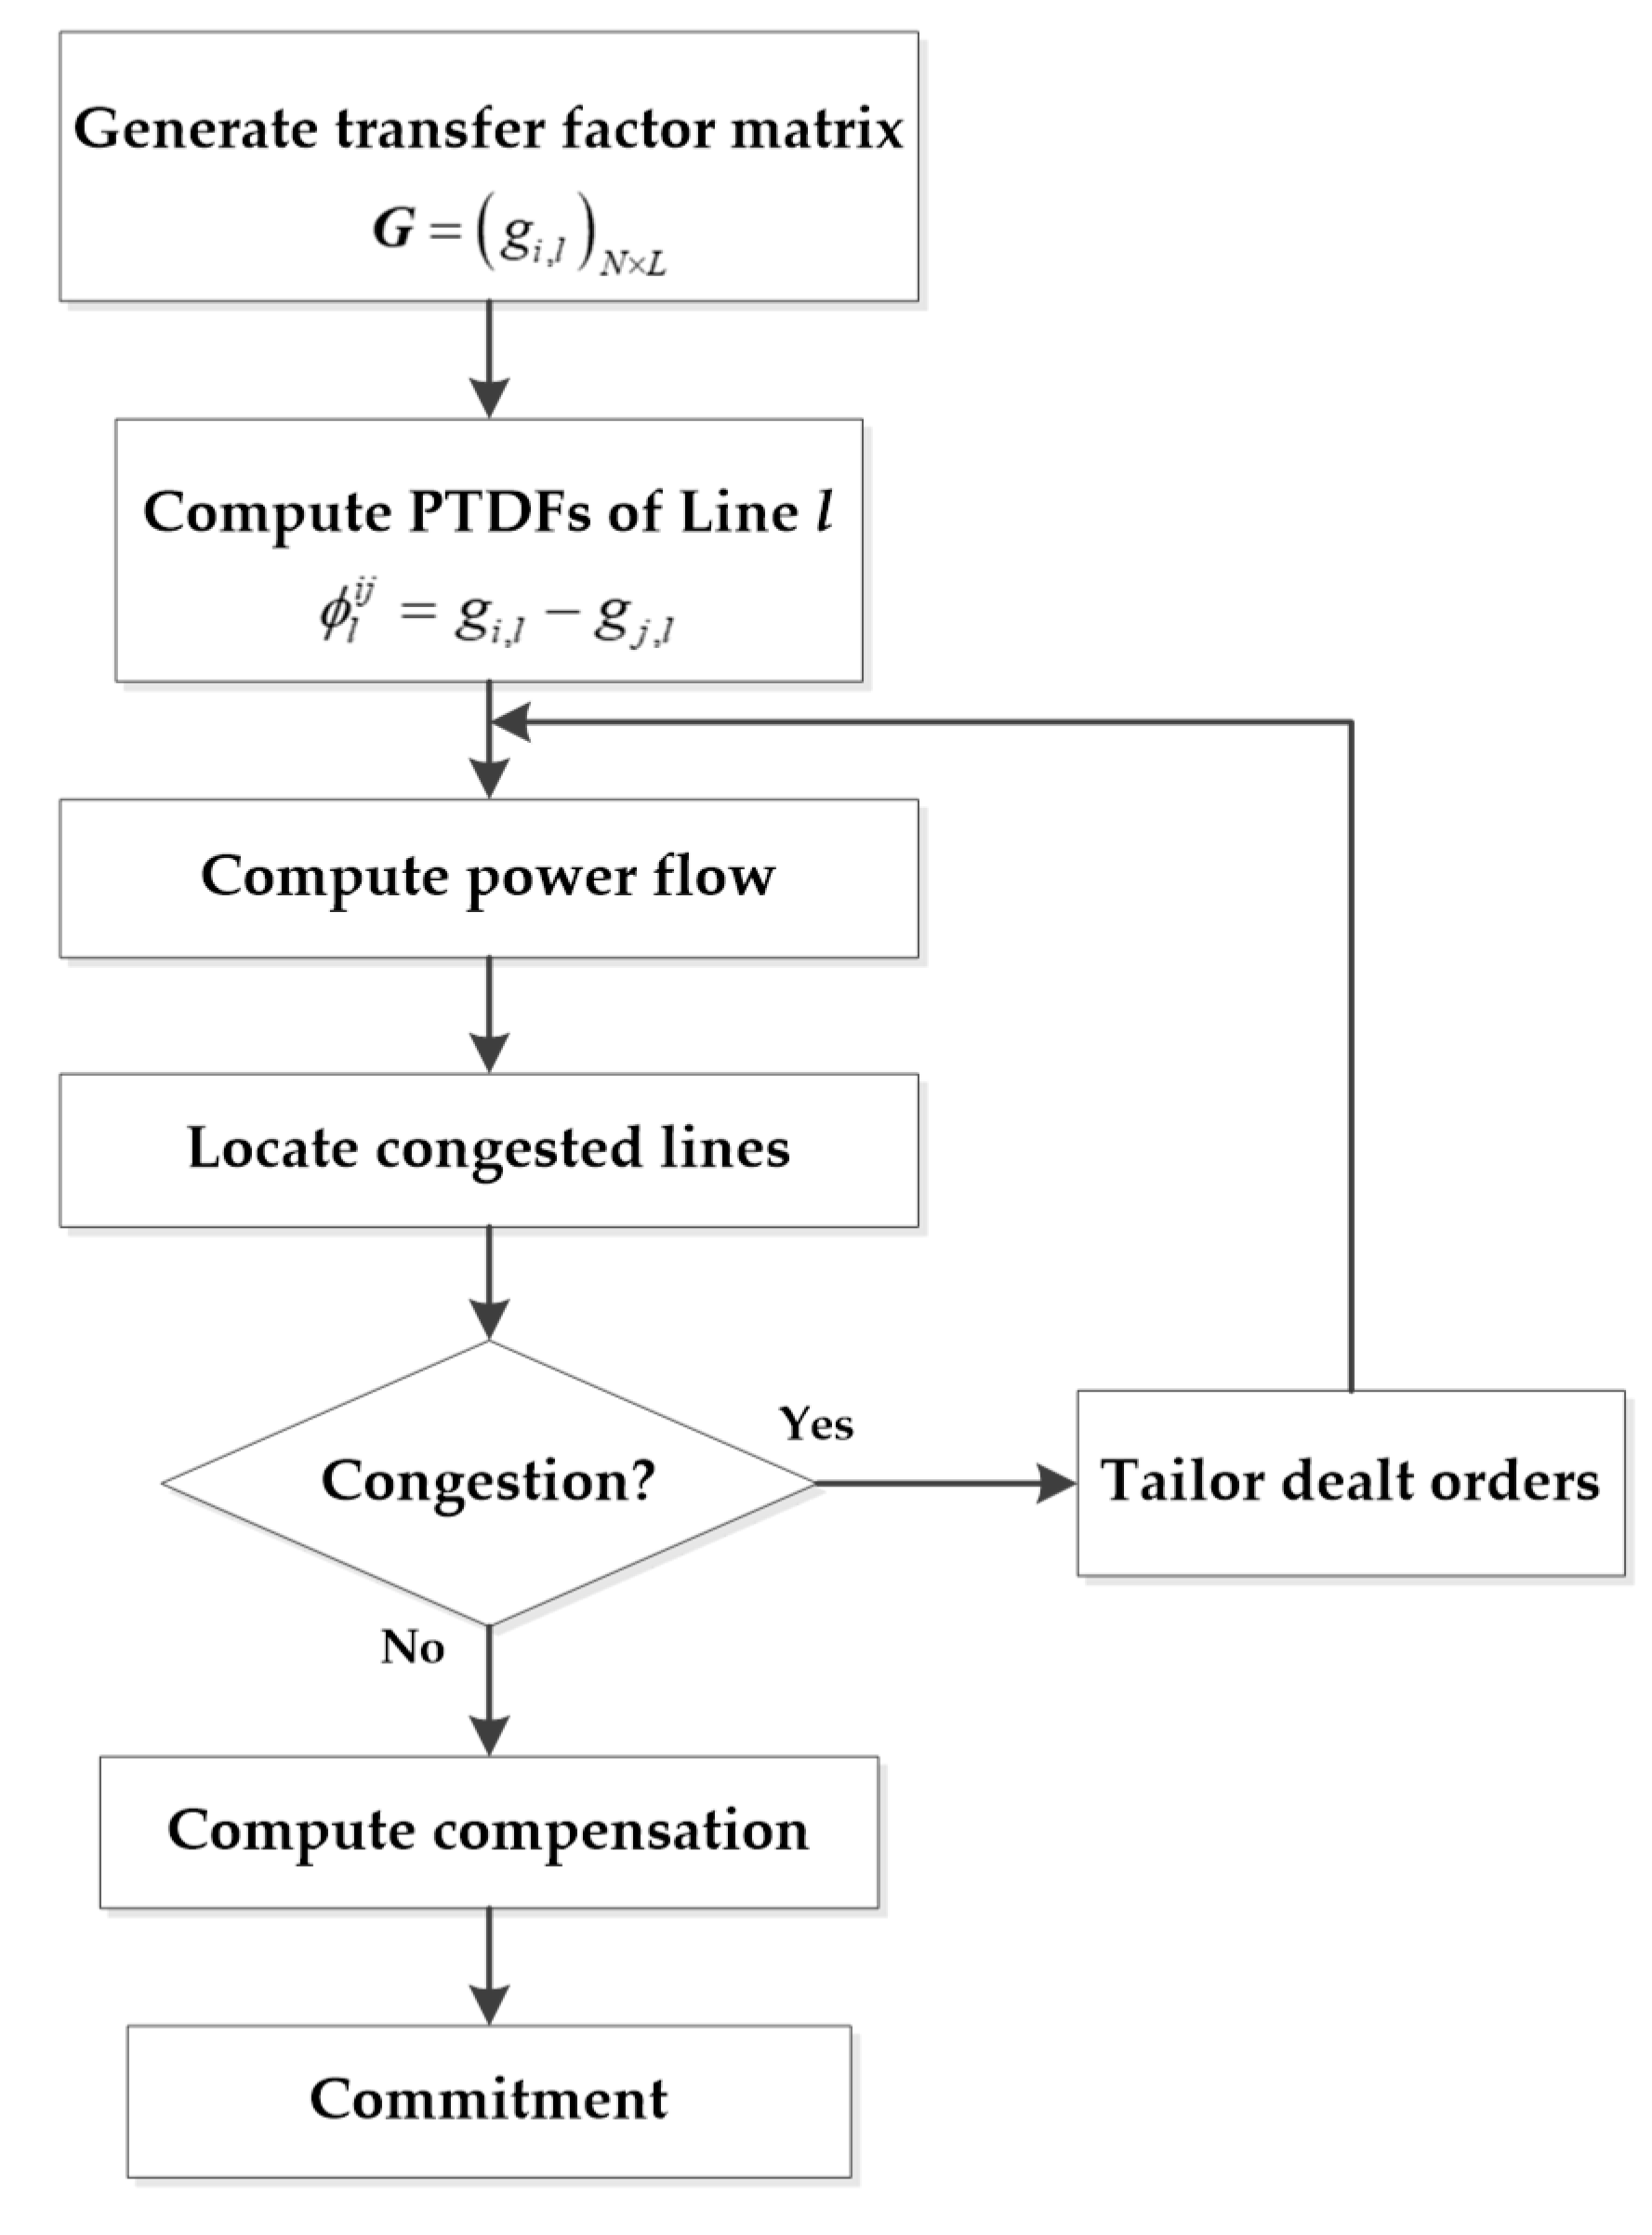
Realistic constraints, such as users’ basic rights and line ratings, are incorporated in the optimization model. The tailoring algorithm based on power transfer distribution factor is designed to locate and tailor orders causing congestion.
(4).
This study is performed in the context of setting up electricity market in China. The proposed methodology and the results obtained can provide a reference for accelerating the local energy transaction and distributed renewable energy use.
The remainder of this paper is organized as follows: Section 2 presents the structure and process of the “P2P Plus” transaction mechanism. Section 3 and Section 4 establish the mathematical models and performs a numeric case study, respectively. The concluding remarks are drawn in Section 5.

2. System Description

2.1. Structure of AEA Community

The AEA is a unified behavioral model of the entities that exhibit active energy behavior in electricity transaction. An AEA may have various physical implementations: a smart appliance, a rooftop photovoltaic, an electric vehicle, a household energy management system, a microgrid, a virtual power plant, etc. As illustrated in Figure 1, several AEAs connecting to distribution network form a community, and perform decentralized electricity transactions in P2P manner. The distribution company (DisCo) is responsible for the basic rights of AEAs and the safety of distribution network. To implement the electricity transaction within an AEA community, this paper proposes the “peer-to-peer plus (P2P Plus)” mechanism that consists of two stages as follows:
(i).
The “P2P” stage is the decentralized matchmaking of transaction orders among multiple AEAs;
(ii).
The “Plus” stage is the centralized coordination by DisCo to solve the unaddressed orders and congested lines.

2.2. Process of Electricity Transaction

In the “P2P Plus” transaction, each AEA is an autonomous peer that accesses the distribution network, and interacts with peers in the AEA community. The AEAs with electricity shortage and surplus are electricity buyers and sellers, respectively. Notice that the role of an AEA can vary with time, since the internal production and consumption are both time-variant. However, it is assumed that the role of an AEA is invariant in each hour, i.e., given a specific hour, an AEA can be either a buyer or a seller in electricity transaction.
Considering the day-ahead market, the process of the “P2P Plus” electricity transaction can be expressed as follows:
{“P2P” stage}
Step 1
Each AEA initializes its transaction order (including bid quantity and bid price) of t-th hour and publishes in community.
Step 2
Each AEA searches for counterparties to form bidding pairs
Step 3
Each bidding pair performs price bidding for H bouts, unless the bid quantity of any party is cleared.
Step 4
Each AEA repeats Step 2–3 for R rounds, unless its bid quantity is cleared.
Step 5
All AEAs repeat Step 1–4 for 24 h of a day.
{“Plus” stage}
Step 6
DisCo optimizes pricing control to solve the undealt quantities.
Step 7
DisCo computes power flows and quantities to be tailored to solve line congestions.
Figure 2 shows the flowchart of the “P2P Plus” electricity transaction mechanism proposed in this paper.

3. Problem Formulation

3.1. Model of “P2P” Stage

3.1.1. Initialization of Transaction Orders

For the electricity buyer A i , its transaction order can be expressed as [ Q t , r i , λ t , r ( h ) i ] , and can be simplified as [ Q r i , λ r ( h ) i ] since P2P order matching is independent in different hours. Q r i represents the electricity shortage of A i in r-th round of bidding, λ r ( h ) i is the bid price of A i at the h-th bout of the r-th round. As a sequel, the initial order is [ Q 1 i , λ 1 ( 1 ) i ] , and the initial bid price of A i is set as follows:
λ 1 ( 1 ) i = μ _ ( 1 + ε r a n d ( 1 ) )
where ε is a small positive number, and rand(1) is a random number for simulating individual diversity among different buyers. Given the feed-in price μ _ , i.e., the price at which DisCo buys electricity from AEAs, the rational buyer A i cannot expect to buy electricity at a price that is lower than μ _ .
Similarly, for the electricity seller A j , its transaction order is denoted by [ Q r j , λ r ( h ) j ] , where Q r j and λ r ( h ) j are the electricity surplus of A j in r-th round and the bid price at h-th bout of r-th round, respectively. The initial bid price of A j is set as follows:
λ 1 ( 1 ) j = μ ¯ ( 1 ε r a n d ( 1 ) )
Given the retail price μ ¯ , i.e., the price at which DisCo sells electricity to AEAs, the rational seller A j cannot expect to sell electricity at a price that is higher than μ ¯ .
All transaction orders are published on the P2P transaction platform of the AEA community for retrieval and matchmaking.

3.1.2. Search of Transaction Counterparties

Each buyer retrieves transaction orders on the P2P transaction platform and searches for qualified sellers as its transaction counterparties. Once a bidding pair is formed, the two parties negotiate price for a maximum of H bouts. We consider two strategies for buyers to search for qualified sellers: price-based search and quantity-based search. As shown in Figure 3, the buyers search for sellers that offer the lowest bid price, and that can satisfy all its electricity shortage, respectively.
Where S r represents a set of all seller AEAs in r-th round. In quantity-based search, the candidate set could be an empty set if there is no seller can satisfy all shortage of A i .
In the following sections, we assume that buyers apply the combined search, which is the union of price-based search and quantity-based search. As long as S r , Buyer A j must has one transaction counterparty from price-based search; and may have one more counterparty from quantity-based search.

3.1.3. Negotiation of Deal Prices

Once the transaction counterparties are determined, the buyer and the seller start the procedure of price negotiation in each bidding pair. Notice that all the negotiations are in parallel, i.e., multiple buyers may choose a seller, and the same seller/buyer may simultaneously negotiates price with different counterparties in different bidding pairs. Once the price agreement is reached in a bidding pair, the involved orders of the two parties of the bidding pair immediately update, and price games of other related pairs can be affected or even be terminated if some orders are cleared. A bidding round ends if a deal is made in the bidding pair or the deadline is reached (h = H). AEAs can reselect counterparties and form new bidding pairs in a new bidding round. The maximum round of price bidding in each hour is R.
Consider a bidding pair in the r-th round including Buyer A i and Seller A j ; the bidding price of A i at h-th bout is:
λ r ( h ) i , j = λ r ( h 1 ) i , j + w r ( h ) i , j i B r ; j S r i ; h = 2 , , H
and the bid price of A j at h-th bout is:
λ r ( h ) j , i = λ r ( h 1 ) j , i w r ( h ) j , i j S r ; i B r j ; h = 2 , , H
where w r ( h ) i , j is the willingness of A i to make a deal with A j , λ r ( 1 ) i , j = λ r ( 1 ) i , λ r ( 1 ) j , i = λ r ( 1 ) j . B r is a set that contains all buyer AEAs in r-th round. S r i and B r j are candidate set for A i and A j , respectively.
w r ( h ) i , j = δ r × S D × N R r i × ( T P r ( h ) i + M D r i , j )
Notice that w r ( h ) i , j is proportional to the urgency of A i to buy electricity. A high willingness implies that A i would like to make a deal as soon as possible, while a low willingness indicates that A i would like to wait for more favorable prices. This paper adopts the concept of multi-dimensional willingness, which comprehensively integrates multiple factors including the gap of initial supply demand situation of market, the transaction history of an individual AEA, the time pressure of transaction, the matching degree of two parties in a bidding pair, etc.
(a)
δ r is the basic step of price adjustment, and is proportional to the difference between the two initial prices of the seller and the buyer in a bidding pair,
δ r = λ r ( 1 ) j λ r ( 1 ) i H
(b)
S D describes the supply demand situation of the whole market in the AEA community,
S D = 1 + 1 π arctan [ i B Q 1 ( 1 ) i j S Q 1 ( 1 ) j max ( i B Q 1 ( 1 ) i , j S Q 1 ( 1 ) j ) ]
0.75 < S D < 1.25
S D = 1 if supply and demand are balanced, S D > 1 and S D < 1 indicate that the AEA community is globally oversupplied and undersupplied respectively. Notice that the function of arctangent is used to map S D into a symmetric bounded interval (0.75, 1.25) centered at 1.
In the case of an oversupplied market, buyers take the advantages in price game since it is easy to buy electricity. The sellers have higher willingness and are more active to decrease the bid prices so as to sell their surplus electricity. On the contrary, in the case of an undersupplied market, sellers possess an advantage due to the overall shortage of electricity. Consequently, buyers actively increase the transaction willingness and tend to bid higher prices to satisfy the electricity shortage.
(c)
N R r i is the transaction record of Buyer A i , and is related to the undealt quantity Q r i and the basic value b 0 . Larger undealt quantity results in higher transaction record.
N R r i = b 0 + Q r i Q 1 i [ 1 ( 0.35 b r 2 i + 0.65 b r 1 i ) ]
where b r i is a Boolean value. b r i is 1 if a deal is made in the r-th round, and otherwise 0.
b r i = { 1 Q r i > Q r 1 i 0 Q r i = Q r 1 i
Similarly, we can also define N R r j as the transaction record of Seller A j .
(d)
T P r ( h ) i is the time pressure due to the approaching deadline of the current bidding round,
T P r ( h ) i = 1 ( 1 h H ) Q r i Q 1 i
Obviously, closer to deadline and more undealt electricity cause larger time pressure.
(e)
M D r i , j is the matching degree of Buyer A i with its transaction counterparty (Seller A j ) in r-th round,
M D r i , j = { 1 Q r i Q r j 1 exp ( 1 Q r i Q r j ) Q r i Q r j > 1 j S r i
where S r i is the set of sellers forming a bidding pair with buyer A i in r-th bidding round. M D r i , j = 1 if all the electricity shortage of A i can be satisfied by the electricity surplus of A j through a single deal, and otherwise M D r i , j < 1 .
Similarly, we can also define M D r j , i , the matching degree of Seller A j , with its counterparty (buyer A i ) in r-th round.
M D r j , i = { 1 Q r j Q r i 1 exp ( 1 Q r j Q r i ) Q r j Q r i > 1 i B r j
where B r j is the set of buyers forming a bidding pair with Seller A j in r-th bidding round.

3.1.4. Match and Update of Transaction Orders

In each bidding pair, Buyer A i and Seller A j repeatedly adjust their bid prices according to Equations (6) and (7), respectively. A deal is made once the two bid prices intersect. Assume the deal is made at h*-th bout of bidding,
λ r ( h ) i , j λ r ( h ) j , i ; λ r ( h ) i , j < λ r ( h ) j , i , h < h
where λ r ( h ) i , j is the price of A i bids to A j at h-th bout of r-th round.
Then the deal price is
λ r j i = λ r ( h ) i , j + λ r ( h ) j , i 2
and the deal quantity is
q r j i = min ( Q r i , Q r j )
Once a deal is made, the bid quantities of both two parties of the bidding pair immediately update.
Q r + 1 i = Q r i j S r i q r j i
Q r + 1 j = Q r j i B r j q r j i
The buyer/seller, whose bid quantity is cleared, will terminate price games with other counterparties and withdraw from the relevant bidding pairs. All the other buyers/sellers will continue the price game until the end of R rounds or a bid quantity of zero.

3.2. Model of “Plus” Stage

The centralized coordination of the “Plus” stage can be formulated as a constrained optimization problem, through which DisCo maximizes its profit by satisfying constraints of basic rights of AEAs and line ratings of distribution network. Hereafter, we analyze the net incomes of market participants, build the pricing control model, develop the tailoring algorithm, and finally derive the problem formulation.

3.2.1. Economics Analysis

The future distribution network is a decentralized community based on numbers of autonomous AEAs. However, the decentralized P2P negotiation among AEAs can neither ensure that all transaction orders are matched nor guarantee that all deals are feasible as far as the physical constraints are concerned. It is required for DisCo to perform the centralized coordination. The DisCo plays a dual role in the AEA community: on the one hand, an independent market participant that maximizes the profit; on the other hand, the system operator that is responsible for ensuring the basic rights AEAs and the safety of distribution network.
From the perspective of an AEA, there are two options to handle the undealt quantities.
(i).
Abandon transactions. The renewable energies, such as wind and solar, can be curtailed, the interruptible load can be switched off, and the flexible load may be translated to other periods. All the above operations may obtain economic compensation from DisCo. The compensation rate is dynamically set according to supply demand factor in the community.
(ii).
Direct transaction with DisCo. Buyers can also retail electricity from DisCo at the retail price to satisfy the electricity shortage, and sellers can feed electricity back to DisCo at the feed-in price to clear the electricity surplus. Both the retail and feed-in prices are dynamically set by DisCo.
From the perspective of DisCo, there are also two options of the centralized coordination.
(i).
Incentive measures. In the context of market-oriented reform, it is expected for DisCo to take economic approaches (prices, compensation rate, import/export electricity, etc.) to affect the energy behaviors of AEAs.
(ii).
Mandatory measures. In the case of unsatisfied hard constraints (line congestion, basic living conditions, etc.), it is also required for DisCo to tailor some already-dealt quantities.
The net income of AEAs and DisCo can be computed over the whole process of “P2P Plus” electricity transaction.
The net income of Buyer A i in t-th hour includes the payment of P2P transaction, the payment of retailed electricity from DisCo, and the revenue of compensation for tailoring dealt quantities.
z t i = v t P 2 P , i v t retail , i + u t tailor , i
where
v t P 2 P , i = r = 1 R j S t , r i q t , r j i λ t , r j i
v t retail , i = ( μ ¯ + Δ μ t ) ( Q ^ t i + q ^ t i q t i )
u t tailor , i = ρ q t i
The pricing control is applied on A i when DisCo handles its undealt electricity in a P2P transaction, which is denoted by Q ^ t i . Δ μ t is the variation of retail price in the t-th hour. q ^ t i and q t i are the corresponding quantity for pricing control and tailored quantity in the case of line congestion, respectively. ρ is the compensation rate for tailoring quantities. Notice that the intervention of DisCo on P2P transaction results is financially constrained since large amount of tailoring implies high expense of compensation.
The net income of Seller A j in the t-th hour includes the revenue of P2P transaction, the revenue of feeding electricity to DisCo, and the revenue of compensation for tailoring dealt quantities.
z t j = u t P 2 P , j + u t feed - in , j + u t tailor , j
where
u t P 2 P , j = r = 1 R i B t , r j q t , r j i λ t , r j i
u t feed - in , j = μ _ ( Q ^ t j q t j )
u t tailor , j = ρ q t j
For Seller A j , Q ^ t j and q t j are its undealt electricity in the P2P transaction and the tailored quantity in ”Plus” stage, respectively.
The net income of DisCo in t-th hour includes the revenues of retailing electricity to AEAs and exporting electricity to main grid, and the expenses of purchasing feed-in electricity from AEAs, importing electricity from the main grid, and compensating with tailored quantities.
Z t = U t retail V t feed - in + U t export V t import V t tailor
where
U t retail = i B t v t retail , i
V t feed - in = j S t u t feed - in , j
U t export = ω _ q t export
V t import = ω ¯ q t import
V t tailor = i B t u t tailor , i + j S t u t tailor , j

3.2.2. Pricing Control

DisCo applies pricing control to handle the undealt electricity in P2P transaction. DisCo initiates variable price on AEAs as incentives, and AEAs actively respond with variable output profiles. The mechanism can be modeled as a generalized version of demand response.
The elasticity is defined to quantitatively describe the impact of price variation on demand variation,
e t , t = Q t / Q t μ t / μ t = Q t μ ¯ t μ t Q t
The elasticity matrix can be computed,
E = ( e t , t ) T × T = ( e 1 , 1 e 1 , 2 e 2 , 1 e 2 , 2 e 1 , T e 2 , T e T , 1 e T , 2 e T , T )
where each element on the main diagonal e t t is the self-elasticity that shows the impact of price on quantity in the same time unit t; each off-diagonal element e t t is the cross-elasticity that shows the impact of price on quantity of a different time unit. The self-elasticity and cross-elasticity are negative and nonnegative numbers, respectively.
Taking Buyer A i , for example, the quantity variation can be computed as follows,
( q ^ 1 i q ^ 2 i q ^ T i ) = ( Q ^ 1 i 0 0 0 Q ^ 2 i 0 0 0 Q ^ T i ) E 1 μ ¯ ( Δ μ ¯ 1 i Δ μ ¯ 2 i Δ μ ¯ T i )
where Q ^ and q ^ are the undealt quantity after P2P stage and responded quantity in Plus stage, respectively. Δ μ ¯ is the variation of retail price. The update undealt quantity after applying pricing control is Q ^ 1 i + q ^ 1 i .

3.2.3. Tailoring Algorithm

DisCo carries out the safety check in distribution network to ensure that the power flow through any line l not exceed the transmission rating. In the case of line congestion, DisCo is authorized to mandatorily tailor the deals that cause the congestion. Given one transmission line l, and two nodes i and j, the power transfer distribution factor (PTDF) Φ l i j presents the impact of the power injections of Node i and Node j on the power flow through Line l. Based on the concept of PTDF, this paper proposes a method of tailoring dealt quantities that cause line congestion. The procedure is shown in Figure 4.
Where N and L are the total numbers of lines and nodes in the distribution network, respectively. g i , l is the power transmission factor which presents the impact of the power injections of Node i on the power flow through Line l. Please refer to the Appendix A for more details of the calculation of transfer factor.
Based on the descending sort of ϕ l i j , DisCo tailors dealt quantities of relevant AEAs that contribute on the congestion. Finally, it computes the economic compensation for the tailored quantities.
Notice that the AEA output may include the decentralized deals made in “P2P” stage and the direct transactions with DisCo in “Plus” stage. The priority of tailoring should be definitely determined in the case of line congestion. In this paper, the transactions with DisCo are first tailored, and secondly the P2P deals if necessary.

3.2.4. Constrained Optimization

Based on the aforementioned analyses, we can establish the model of the centralized coordination of DisCo on AEAs, which can be formulated as a constrained optimization problem. The objective is to maximize the 24-h profit. The constraints are the basic rights of AEAs and the safety of distribution network. The controlled variables are the elastic demand. The decision variables are the price signals, and the import/export quantities.
max t T Z t
s.t.
k _ μ Δ μ t i μ ¯ k ¯ μ
k _ q ^ q ^ t i Q ^ t i k ¯ q ^
P l P ¯ l l L
0 q t i Q t i k ¯ q i B t
0 q t j Q t j k ¯ q j S t
where Equation (36) maximizes the 24-h profit of DisCo, Equations (37) and (38) maintain stationary price and demand, and Equation (39) ensures the power flow safety of the distribution network, i.e., the power flow through any line l should not exceed the transmission rating P ¯ l . Equations (40) and (41) ensure the basic rights of AEAs. Accordingly, k _ and k ¯ are the lower and upper limit of the variation ratio of the relevant decision variables. All the constraints define the limits of which DisCo can manipulate the P2P transaction results. Hence, equitable market distribution can be achieved.

4. Case Study

4.1. Simulation Setup

In this section, we perform a case study to verify the effectiveness of the proposed model and method. Figure 5 depicts the 30-bus test system that is modified from the IEEE 30-bus network: on each node connects one and only one AEA, and Node 30 represents the substation integrating to main grid. In the “P2P stage”, 29 AEAs exchange the electricity surplus and shortage within the distribution network. In the “Plus stage”, DisCo handles the undealt electricity through centralized coordination on 29 AEAs and exchange (import or export) with the main grid.
Open access data from Energinet, which include a 3-year record of electricity production and consumption in a region of Denmark, are adopted as the 24-h output profiles of 29 AEAs [25]. As shown in Figure 6, the electricity surplus and shortage electricity of AEAs are presented by positive and the negative output, respectively. Three AEAs, A 8 , A 11 , and A 26 , are selected as representatives and their output profiles are depicted with thick lines. Notice that A 11 and A 26 respectively have positive and negative profiles in 24 h, while the output profile of A 8 varies from positive to negative in 24 h. It means that the roles of both #11 and #26 are time-invariant in 24 h: either seller or buyer; while the role of A 8 varies from buyer to seller in different hours.
The parameter settings are shown below: μ _ = 0.24 ¥/kWh, μ ¯ = 0.72 ¥/kWh, ε = 0.1 , b 0 = 0.2 , H = 30 , e t , t = 0.46 , e t , t = 0.16 , ω _ = 0.35 , ω ¯ = 0.65 , k _ μ = 0.16 , k ¯ μ = 0.08 , k _ q ^ = 0.12 , k ¯ q ^ = 0.12 , k ¯ q = 0.18 . The electricity prices are set by referring to the tariff in Western China. It is reasonable to assume μ _ < μ ¯ , and otherwise there is no profit space for DisCo to survive in the electricity market. The simulation environment is MATLAB-2018a, CPLEX12.8, Intel (R) Core (TM) i7-7700 @ 3.6 GHz, and 8 GB DDR3 RAM.

4.2. Main Results

4.2.1. Results of P2P Price Bidding

Since the P2P transaction is independent of time, without loss of generality, the 8th hour ( t = 8 ) is taken as an example to demonstrate the mechanism and process of P2P transaction in details. In this hour, the supply demand factor defined by Equation (10) is 1.15, which indicates the oversupplied market.
Table 1 lists the transaction information of 19 deals among 29 AEAs in 8th hour. The first column is the deal index; the second and third columns present the two parties of each deal; the fourth and fifth columns respectively show the quantity and price of each deal. Notice that the same buyer may make deals with different sellers due to multiple bidding rounds, e.g., Buyer A 1 with Sellers A 2 , A 28 , and A 17 . Similarly, the same seller may also make deals with different buyers in different bidding rounds, e.g., Seller A 20 with Buyers A 13 and A 3 .
Three typical groups are investigated to further analyze the price bidding process of the P2P stage. In each group, the buyer has two sellers as the counterparties and simultaneously participates in two price games. Figure 7 depicts the whole processes of price bidding in the 8th hour, and Table 2 lists the specific parameters. The solid and dashed lines illustrate the bidding processes between a buyer and the two sellers, which are from price-based search and quantity-based search, respectively.
(a)
The buyer is A 25 , and its counterparties are A 6 from price-based search and A 11 from quantity-based search, respectively. Assume the price games between A 25 and two counterparties are independent of each other, A 25 will reach an agreement on price with A 11 and A 6 in 26th and 27th bout, respectively. Therefore, A 25 makes a deal with A 11 in reality. Although the two bidding pairs have the same transaction record, there is a significant difference in the matching degree, from the perspective of A 25 , the matching degree with A 6 is 0.607, indicating that the surplus electricity of A 6 cannot satisfy its shortage. The higher matching degree with A 11 results in higher willingness of A 25 to make a deal and earlier agreement on price.
(b)
The buyer A 7 has very similar price bidding strategies to its two counterparties, since they have little difference. The deal is mainly determined by the strategies of sellers. It is demonstrated that the bid curve of A 23 declines much faster than that of A 17 , since A 23 has a higher matching degree with A 7 and stronger willingness to make a deal.
(c)
Both sellers have made deals in previous rounds and the transaction records A 18 of A 19 and are 0.351 and 0.763, respectively. Due to the higher ratio of sold to the total tradable, A 18 shows lower willingness than A 19 to make a deal and tend to wait for more favorable prices. In this round, A 19 finally makes a deal with A 8 , while A 18 fails in reaching an agreement with A 8 before deadline.
It can be summarized that the transaction records, matching degree, and supply demand factor determine the price bidding strategy significantly and then affect the results of the bidding round. Besides, the impact of time pressure on bidding process can be observed from the slopes of price bidding curves of both buyers and sellers: the slopes increase as the deadline is approaching.
As a global parameter of the electricity market, the supply demand ratio simultaneously affects the price bidding strategies of both two parties (buyer and seller) in a bidding round. Although the deal prices may vary significantly with different bidding pairs due to individual diversities, the overall trend can be witnessed. Figure 8 demonstrates that the average deal price positively correlates to the corresponding supply demand ratios on the 24-h horizon. All deal prices are bounded within the interval [ μ _ , μ ¯ ] , and the average deal price is approximately below/above the interval median during the undersupplied/oversupplied periods.

4.2.2. Results of Pricing Control

According to the transaction mechanism of “P2P Plus”, the undealt electricity in the decentralized P2P stage will be handled by DisCo in the centralized “Plus” stage. DisCo applies time-variant price on AEAs, and AEAs make response by actively changing their output profiles. For the ease of demonstration, the internal demands of all buyer AEAs are accumulated in the entire AEA community. Figure 9 shows 24-h retail price and its impact on the accumulated demand. It is observed that the retail price and demand are positively correlated, and the peak-to-valley difference of demand is reduced by applying pricing control.

4.2.3. Results of Tailoring Transaction

The transmission line rating is a hard constraint of electricity transaction. The power flows of the distribution network are physically determined by the power injections on all nodes, and are economically affected by three factors: P2P deals among AEAs, direct transactions between AEA and DisCo, and import/export with main grid. The power flows on all lines are computed by applying the DC power flow method. Table 3 takes 9 lines for example and lists the relevant PTDFs. Without loss of generality, we assume that Line 13 and Line 22 are congested; the data are shown in Table 4.
Figure 5 shows that Line 13 links A 11 and A 9 , and Line 22 links A 15 and A 18 . Table 3 further reveals that the flow on Line 13 is mainly affected by Deal#1, and Deal #2, #5, and #7 are the top three that have the largest impact on the flow on Line 22. Table 5 presents the solution of tailoring transaction. It can be observed that the transactions with DisCo is firstly tailored in case of congestion, and the P2P deals may be tailored if the congestion still exists after all transactions with DisCo having been canceled.
The above described the P2P transaction and DR optimized scheduling scheme at t = 8 in detail, and demonstrated the results of each stage through simulation. We enumerated the bidding strategies in P2P transactions, and demonstrated the optimization scheme that the distribution network adopted for internal resources and the benefits the DSO received in the power grid. The safety check is a necessary action taken to ensure the safety of the system. Generally, most of the power transmission in the power grid meet the requirements, and only in extreme cases needs adjustment. During the tidal current safety inspection, 471.9 kW of power which is traded with DSO was mainly reduced.

4.3. Comparison and Discussion

4.3.1. Advantages of P2P transaction

The following figure shows the specific benefits of AEAs.
To demonstrate the motivations of AEA to participate in P2P transaction, we compute the net income of AEAs under two mechanisms of electricity transaction:
(i).
Sole centralized coordination
(ii).
“P2P Plus” proposed in this article
Figure 10 illustrates the net revenues/expenses of 29 AEAs under the two transaction mechanisms. It can be observed that all AEAs, no matter whether as buyers or sellers, can benefit from participating in P2P transaction since the deal prices are always between the retail price and the feed-in price. As a result, buyers and sellers can respectively save expenses and expand revenues, as compared to the direct transaction with DisCo. As for all AEAs, the P2P transaction is more attractive to than the sole centralized coordination due to the economic advantages.

4.3.2. Efficiency of Counterparty Search Strategies

In the previous sections, each buyer applies the combined search to determine its transaction counterparties: one from price-based search and one (at most) from quantity-based search. This subsection performs a comparative study on the three strategies: (i) sole price-based search, (ii) sole quantity-based search, and (iii) combined search, and verifies the superiority of the combined search over the former two. Dozens of runs of simulation are conducted under the same conditions, and computational results are averaged to avoid the experimental contingency.
Since the P2P transaction relies on the independent decision-making of a large number of AEAs, not all orders can be successfully matched in the P2P stage and there can be some tradable electricity remaining undealt. Figure 11 shows the total undealt electricity in the distribution network by applying the three search strategies, and Table 6 lists the convergence performances in details. It is observed that the combined search has the highest ratio of dealt quantity to the total tradable electricity, and the fastest convergence. The price-based search has slightly inferior performance compared to the combined search, and the quantity-based search rapidly stagnates in the 2nd bidding round and a large amount of electricity is left undealt. These phenomena can be interpreted as the former two search strategies (combined and price-based) providing more opportunities for buyers to find a qualified seller as the transaction counterparty, while the quantity-based search only accepts sellers with enough surplus electricity.
Hereinafter we further compare the performances of the combined search and the price-based search. For the ease of comparison, we assume that there are 15 sellers and 14 buyers in the community and the initial price of each seller is proportional to the tradable quantity. Figure 12 shows three scenarios which are designed to present three different market conditions in the AEA community.
(a)
Well-matched community, i.e., sellers and buyers are equivalent on average, and neither party is in the dominant position.
(b)
Seller-dominated community, i.e., most sellers have abundant surplus electricity that can entirely satisfy any buyer.
(c)
Buyer-dominated community, i.e., few sellers have abundant surplus electricity that can entirely satisfy any buyer.
The performances are quantitatively investigated in terms of the total undealt electricity and the average effective bidding rounds. The former is the total quantity of unmatched orders of all AEAs in the community, and the latter is the average of the effective bidding rounds in which deals are made. These two indexes present the completion ratio and convergence speed of P2P transaction, respectively. Figure 13 shows that the combined search can always enable AEAs to achieve the Pareto optima, i.e., non-inferior in the total undealt electricity and the average effective bidding rounds as compared to the price-based search. Notice that the two search strategies have almost the same performance of total undealt electricity in Scenario C and Scenario B but they show an advantage in the number of effective bidding round.
In summary, the combined search can achieve the highest efficiency in P2P transaction among the three strategies as far as the completion ratio and convergence speed are concerned.

4.3.3. Benefit from Pricing Control

Hereinafter we analyze the impact of pricing control on the profit of DisCo. Six different AEA communities are investigated, of which the AEA number varies from 9 to 59, and it is assumed that the average demand of AEAs is constant. Figure 14 compares the profit of DisCo before and after pricing control. It is revealed that DisCo can always benefit from applying pricing control, and larger accumulated demand can result in higher profit increment.
In summary, the “P2P Plus” two-stage transaction mechanism is both economically favorable and environmentally friendly, since it can improve of the net income of market players and promote the market-based use of renewable energies in the distribution network. In the first stage, the P2P transaction breaks down market barriers, provides the opportunity for market players to participate in electricity market, and fully considers the willingness of each market participant. In the second stage, a centralized coordination is adopted. The DisCo uses price incentives to affect AEAs’ electricity consumption behaviors. Since the proposed “P2P Plus” transaction can provide more opportunities and possibilities for AEAs to exchange the internal electricity surplus and shortage, the overall use of renewable energies can be significantly promoted through consuming the surplus electricity of neighbored AEAs rather than retailing from DisCo or importing from main grid.

5. Conclusions

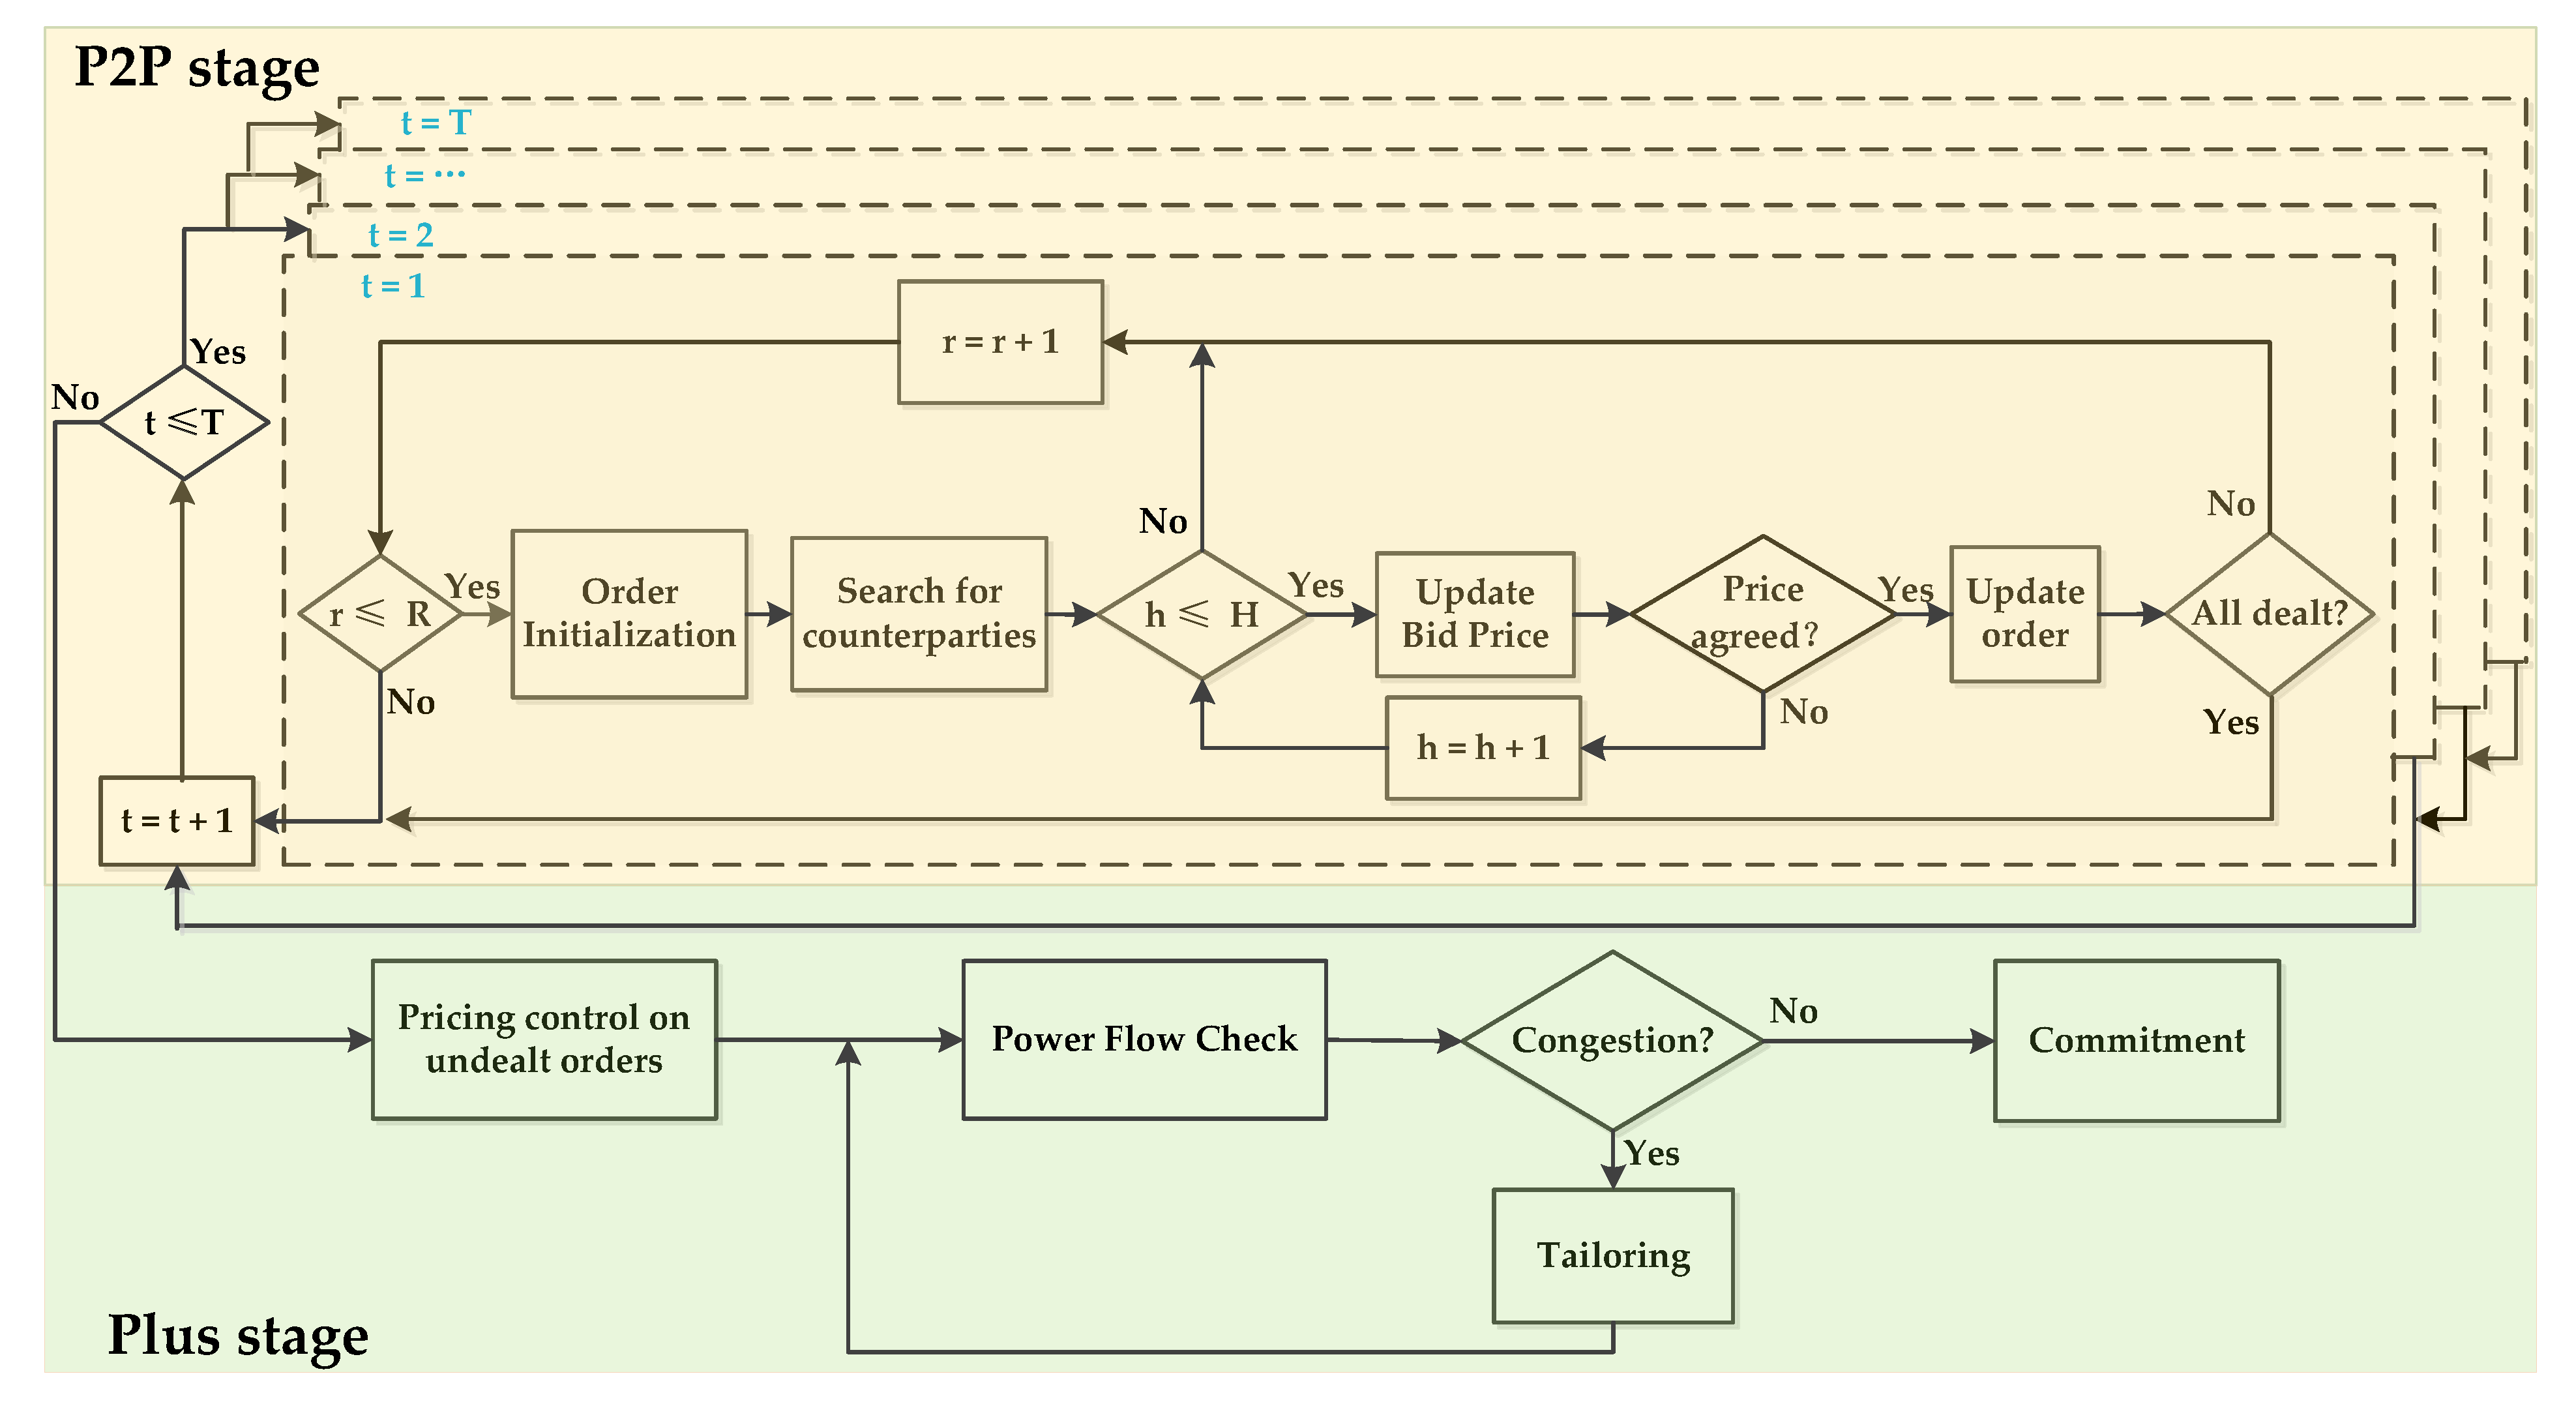
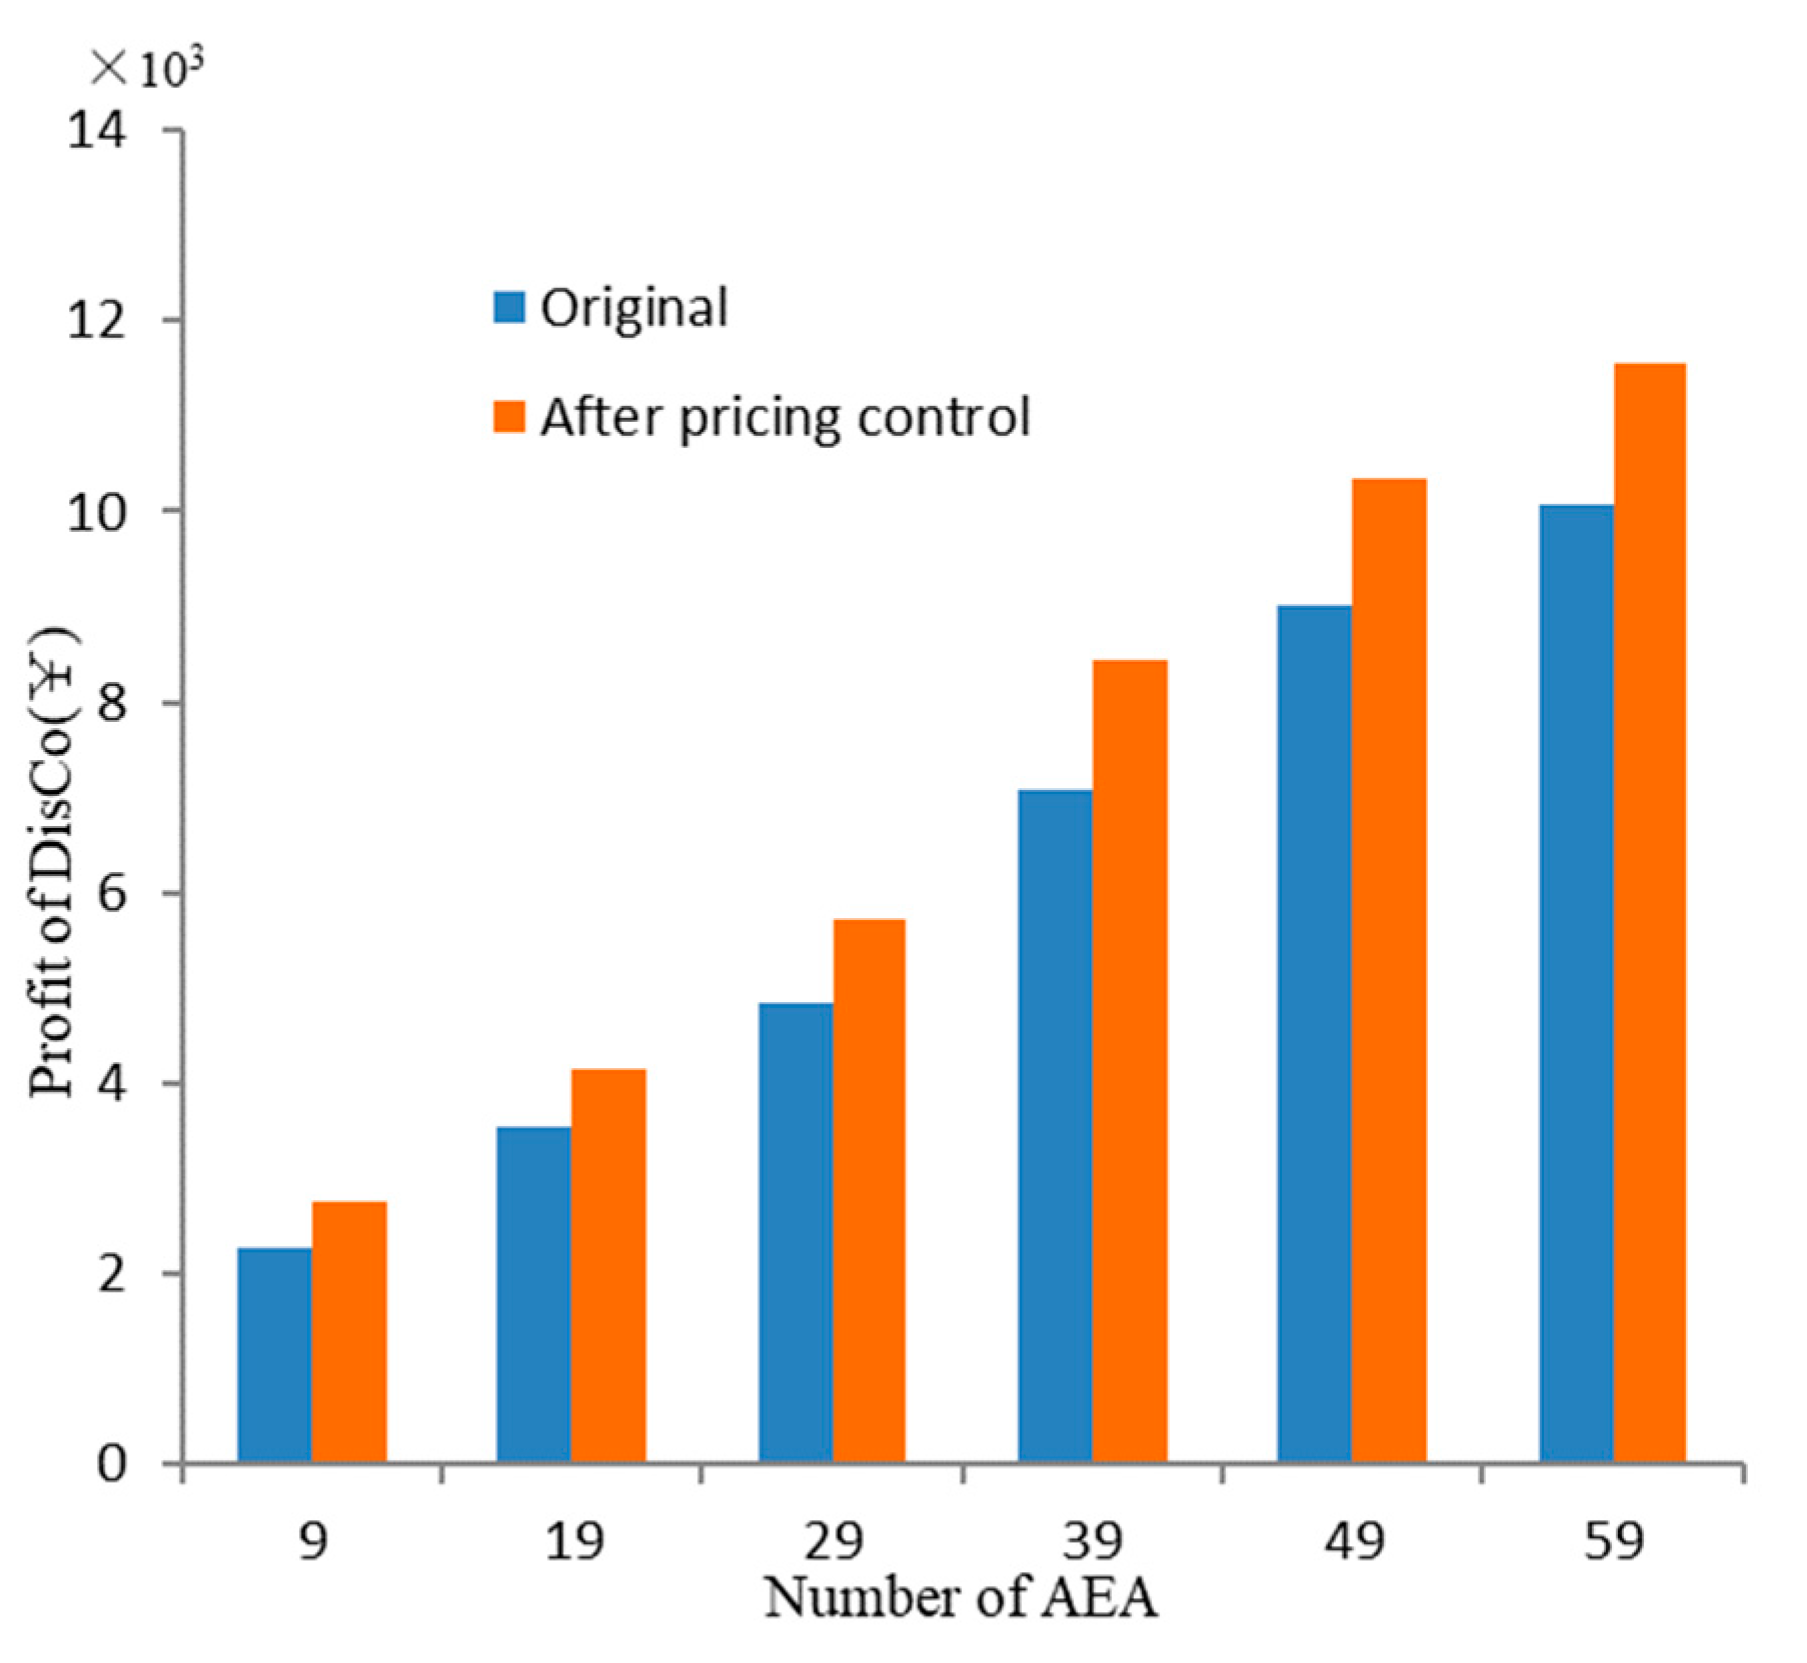
This paper proposes the concept of AEA and the “P2P Plus” mechanism for the electricity transactions within AEA community. In the first “P2P stage”, all AEAs perform decentralized matchmaking of transaction orders through multiple rounds of price bidding. The procedure of P2P matchmaking is developed and the strategy of multi-dimensional willingness is adopted, which comprehensively considers overall and individual factors, such as supply demand factor, transaction record, time pressure, and matching degree. In the second “Plus stage”, DisCo conducts the centralized coordination to handle the undealt electricity and congested lines. The centralized coordination is formulated as a constrained optimization problem. DisCo can benefit from applying pricing control in plus stage though it subject to constraints of distribution network power flow and basic rights of AEAs.
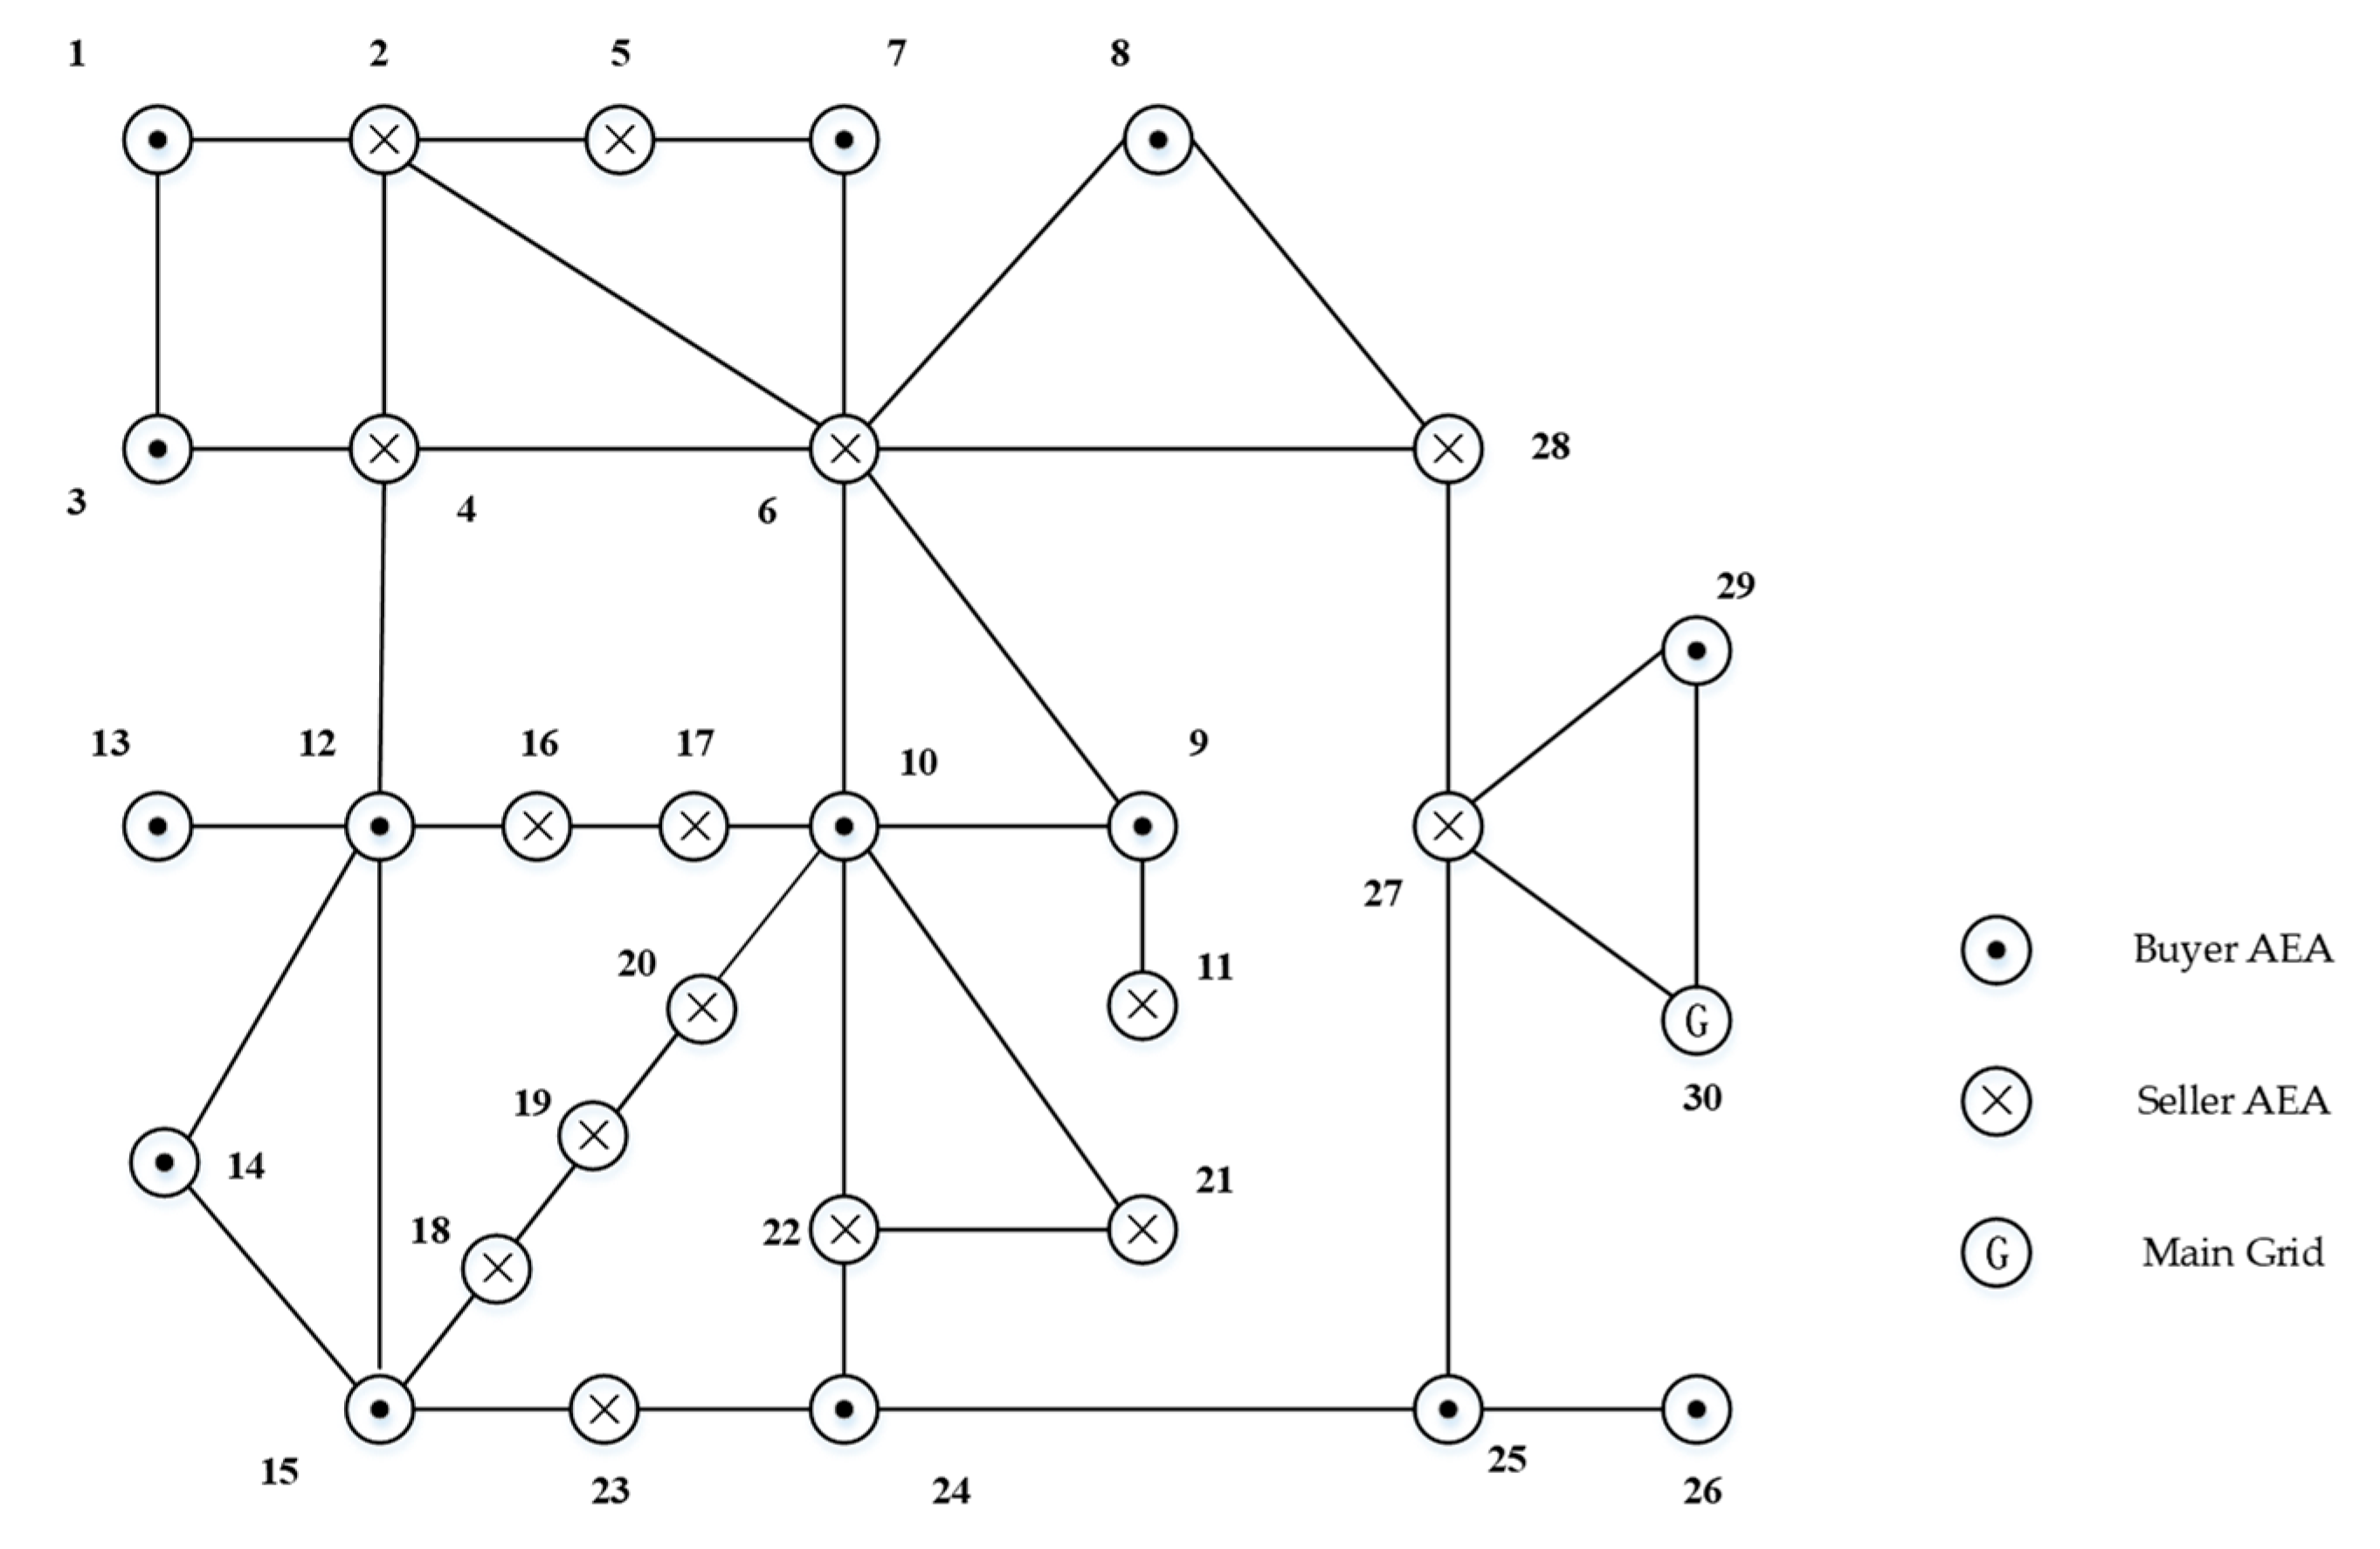
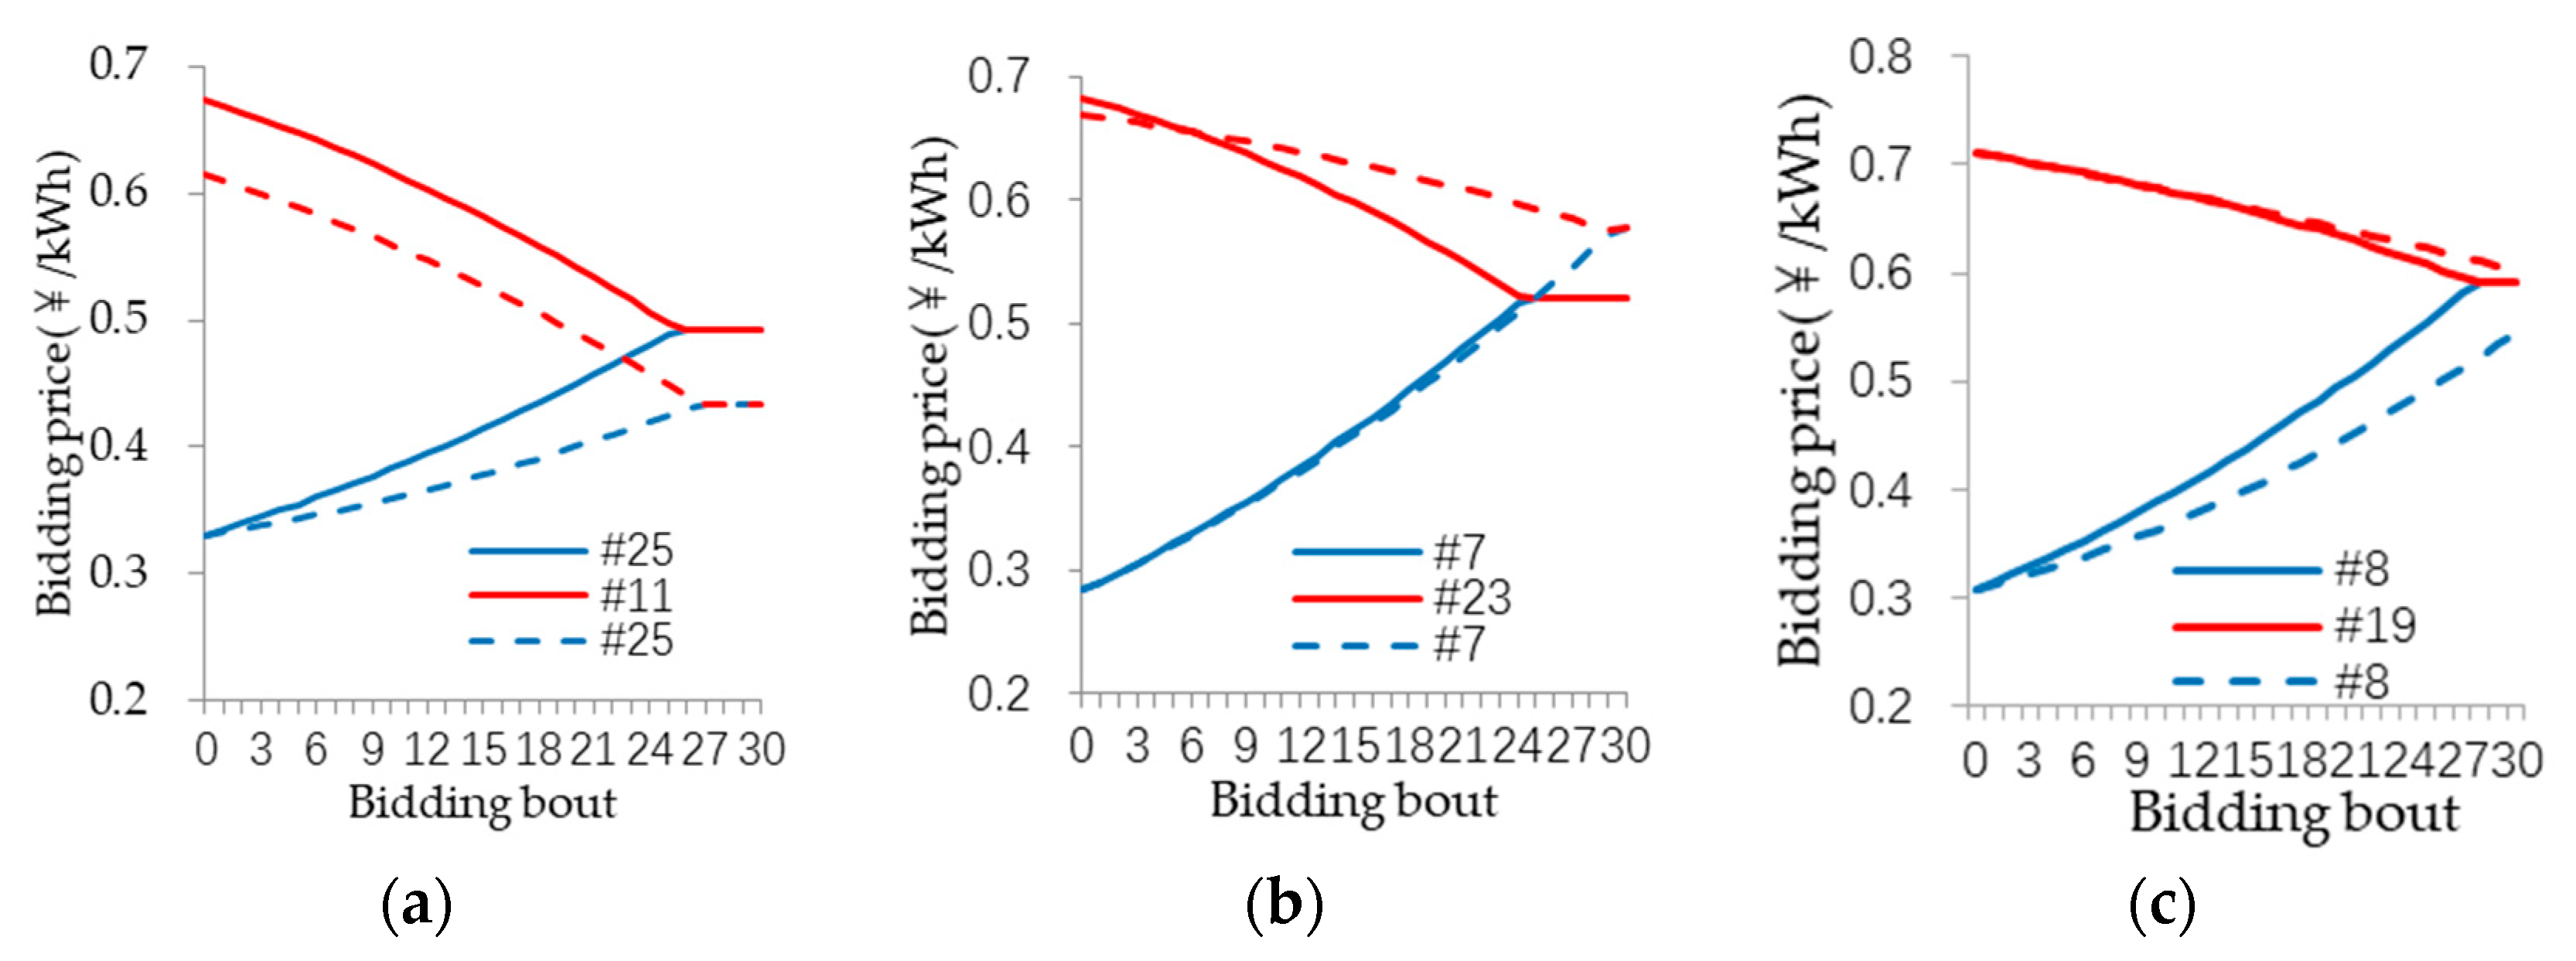
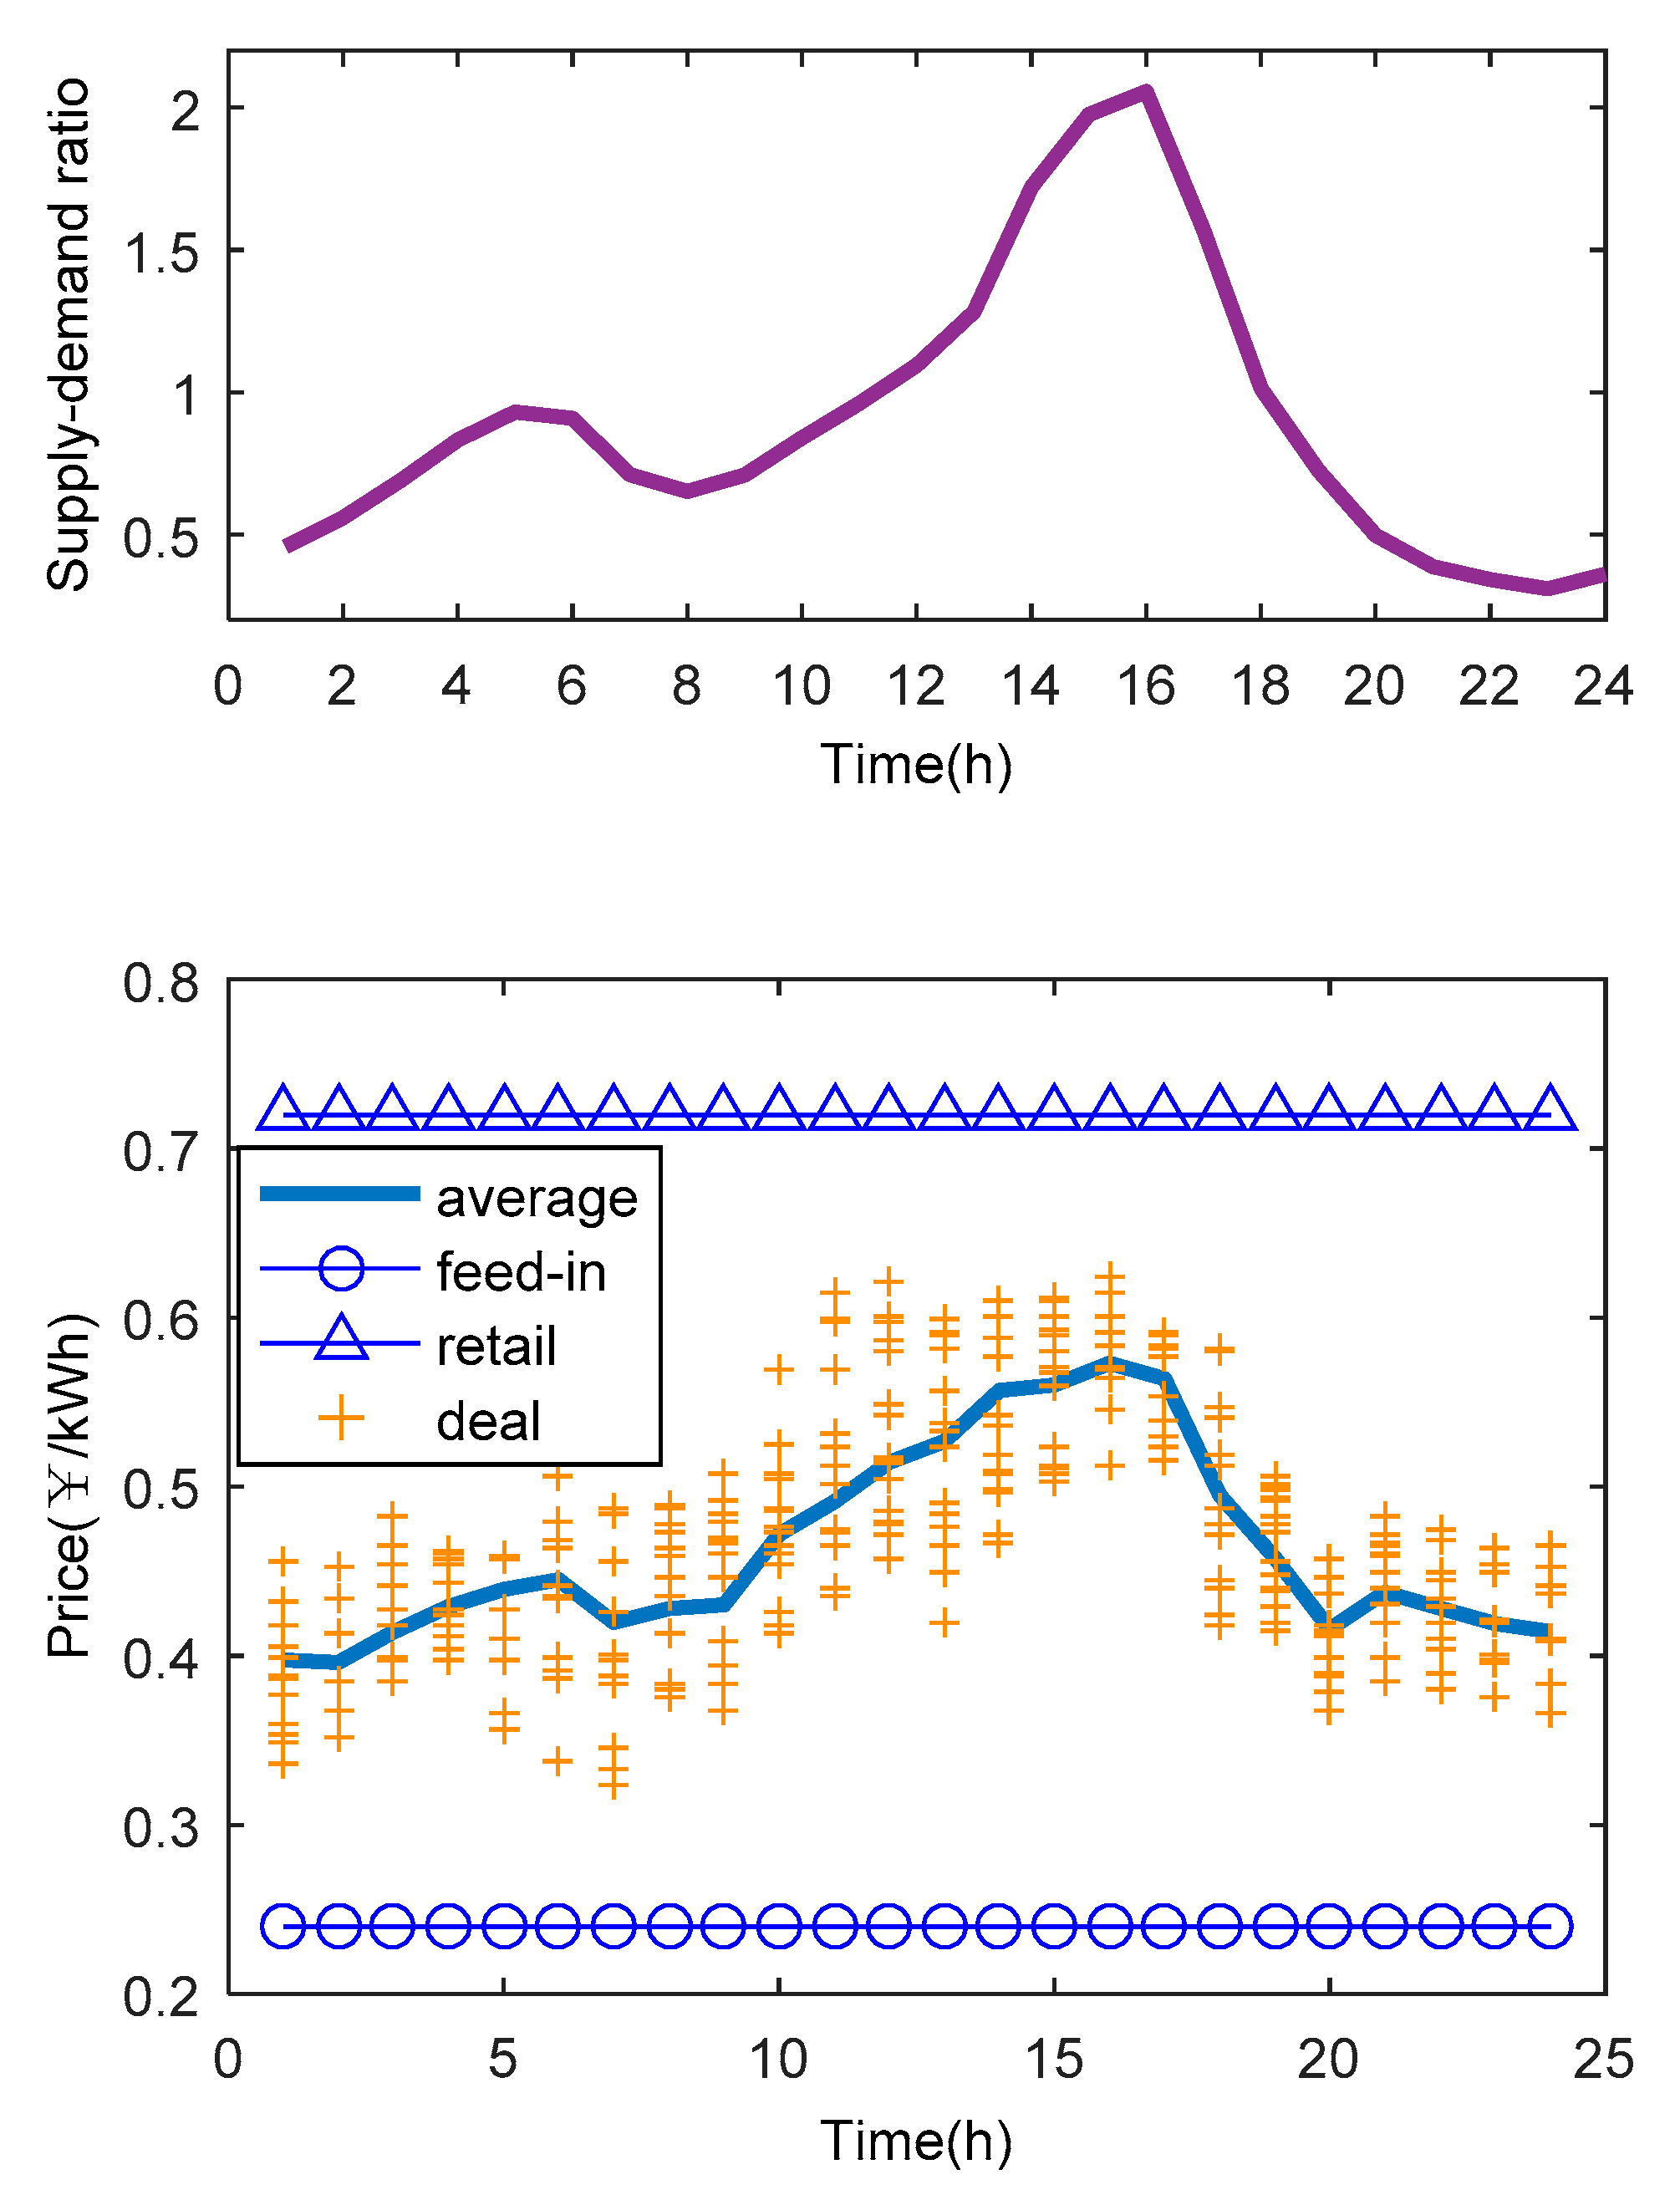
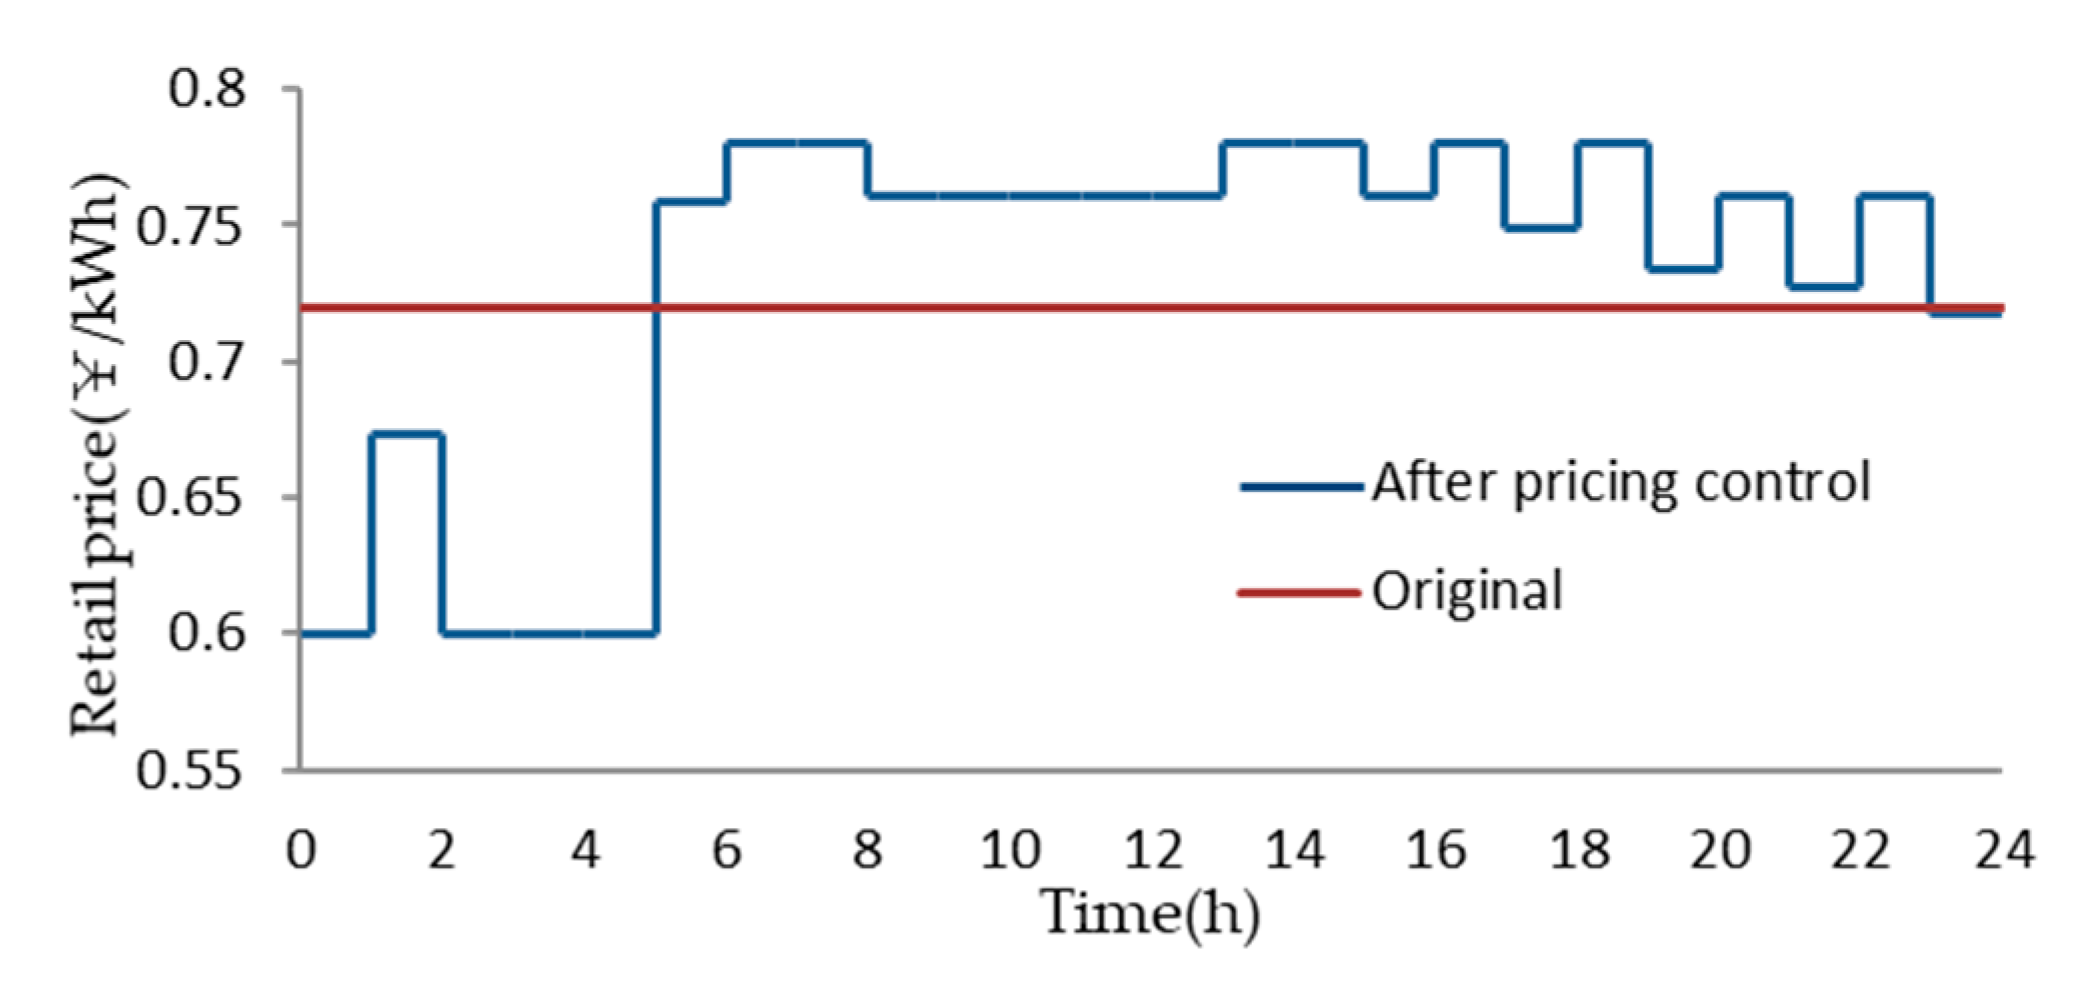
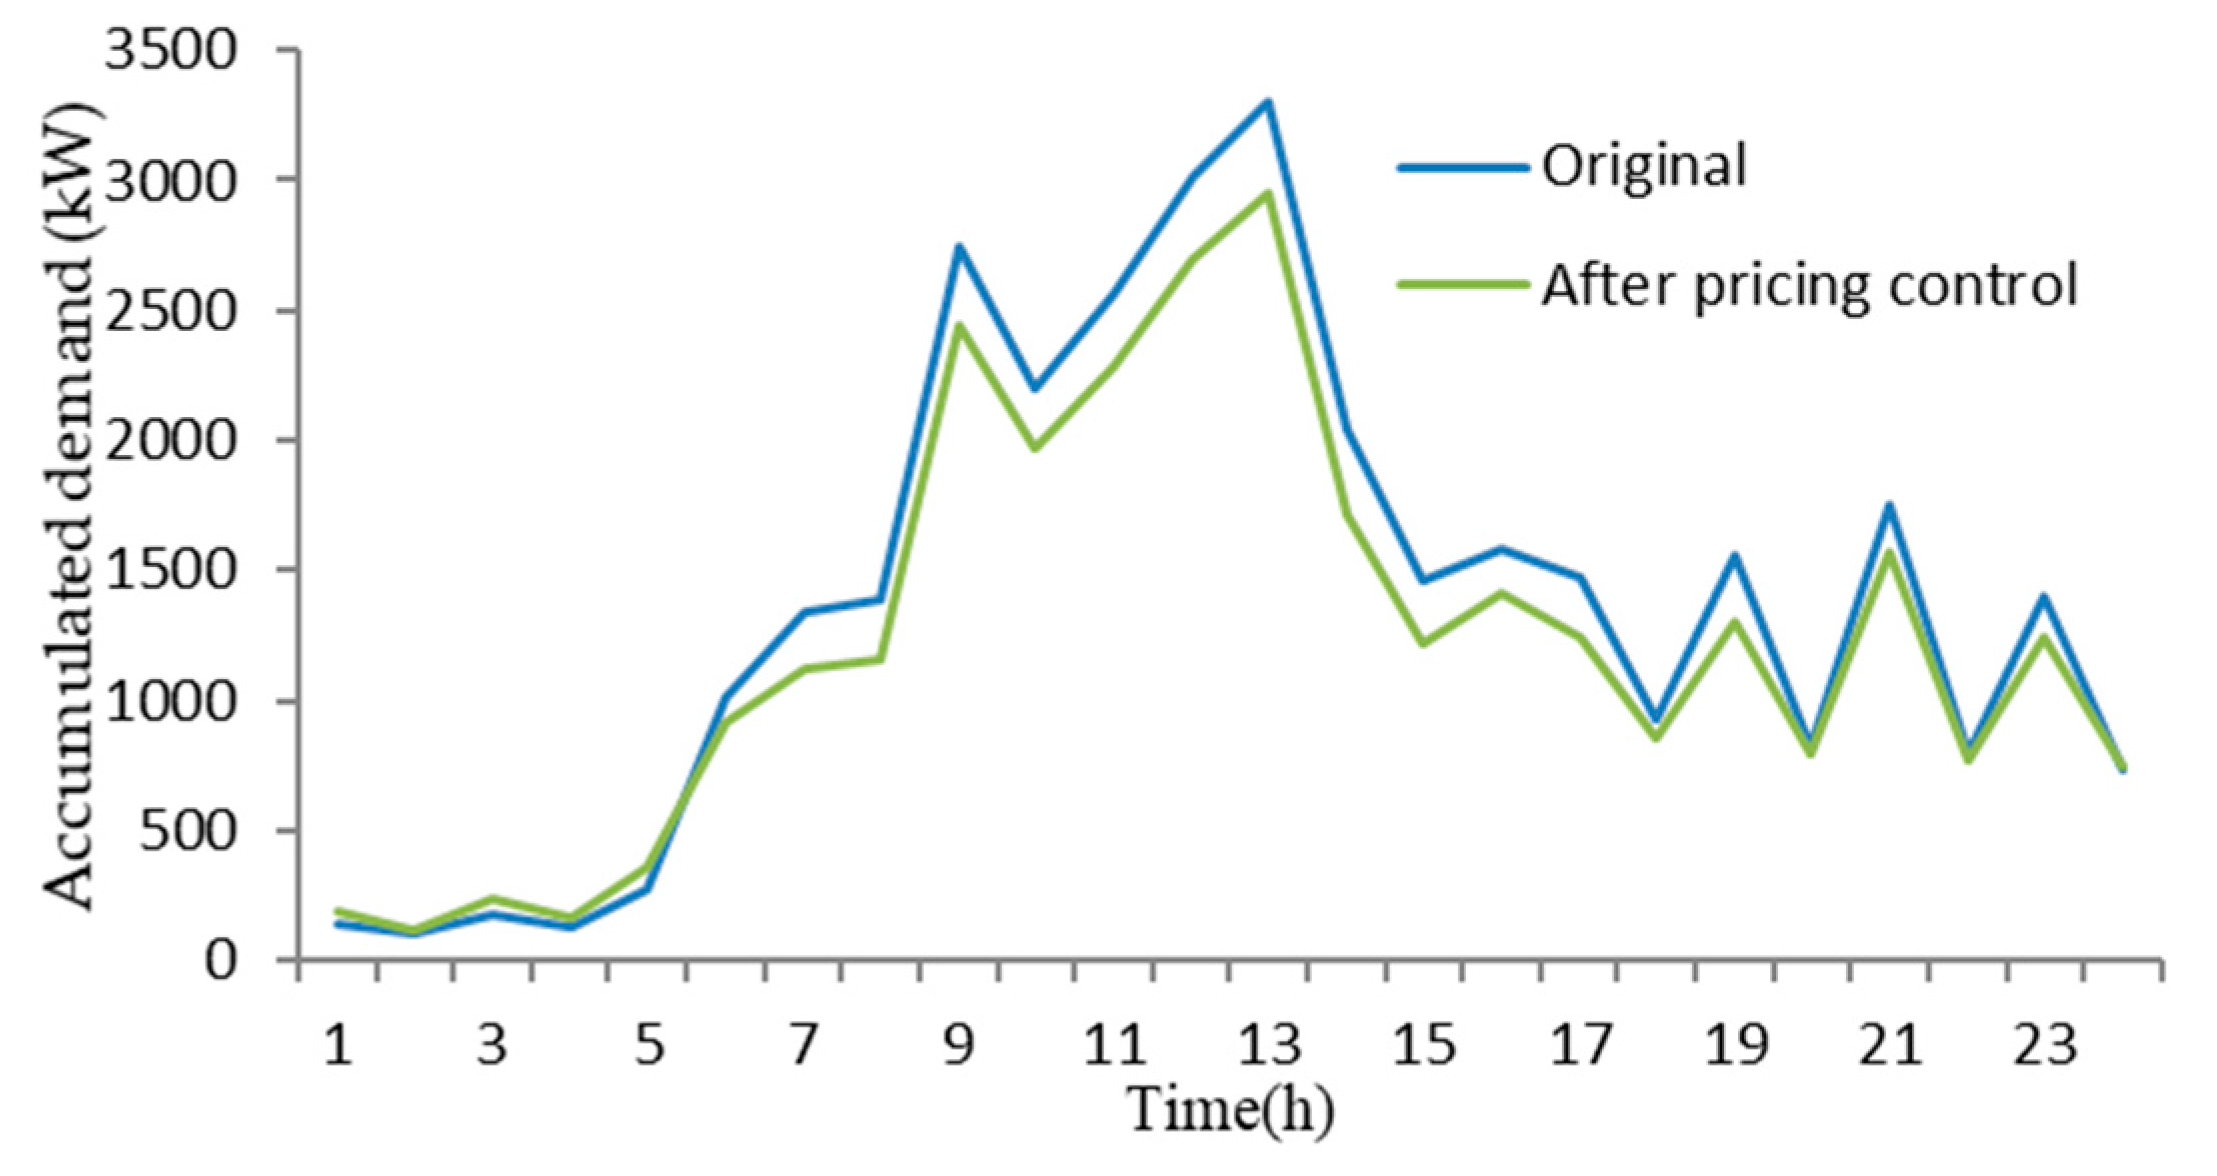
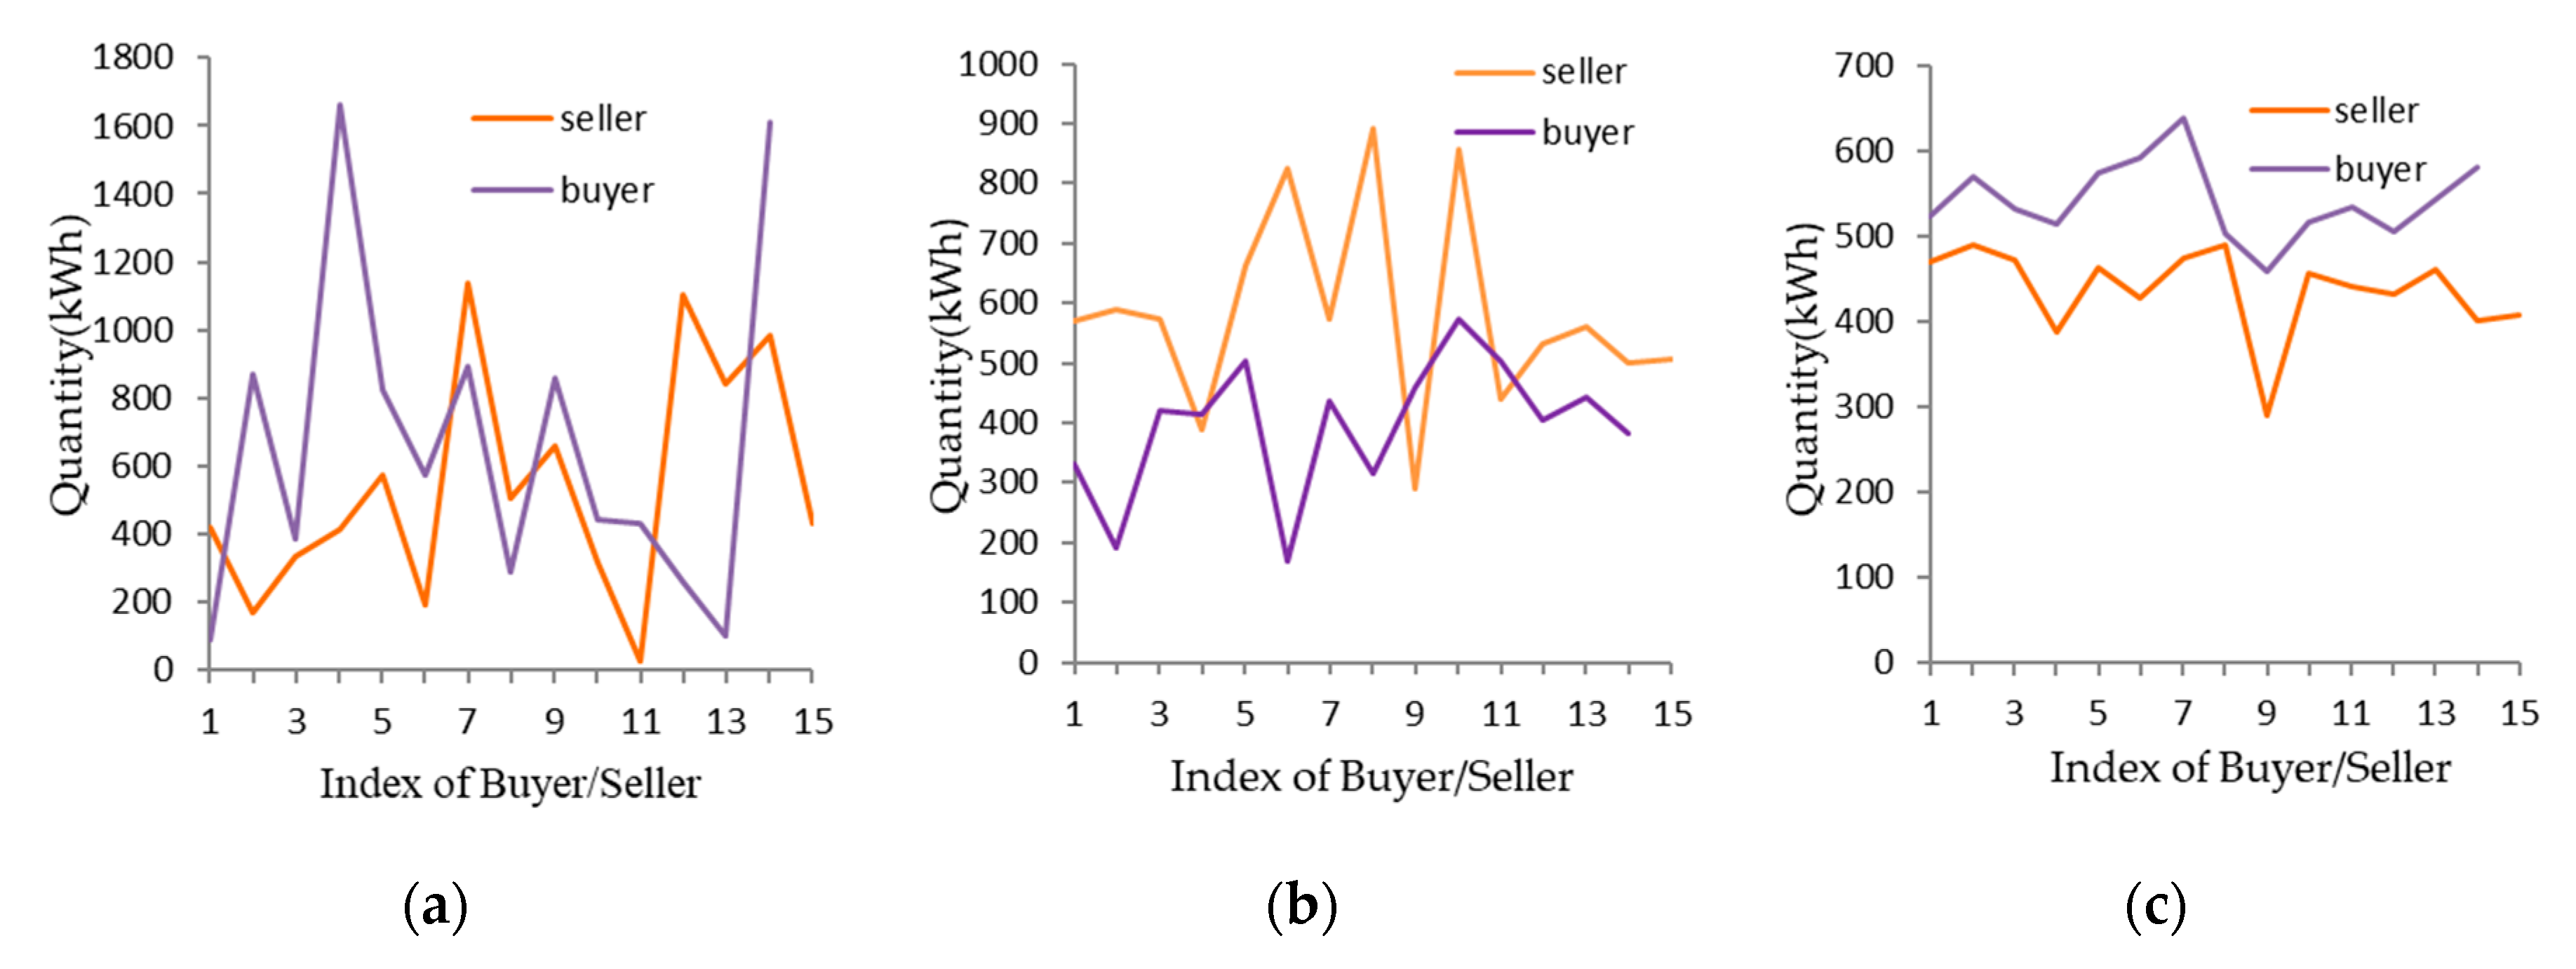
Numeric study is performed on a 30-bus test system, which includes 29 AEAs on 29 nodes and connects to main grid on 30th node. The multi-bout convergence processes of price bidding among three representative bidding pairs are demonstrated and analyzed. It is revealed that the deal price is positively correlated with the supply demand ratio of the market. In addition, it is illustrated that the peak-shaving impact of retail price on the accumulated demand. The deals causing congestion can be accurately located by computing the network PTDFs and then tailored by solving the constrained optimization problem of DisCo.
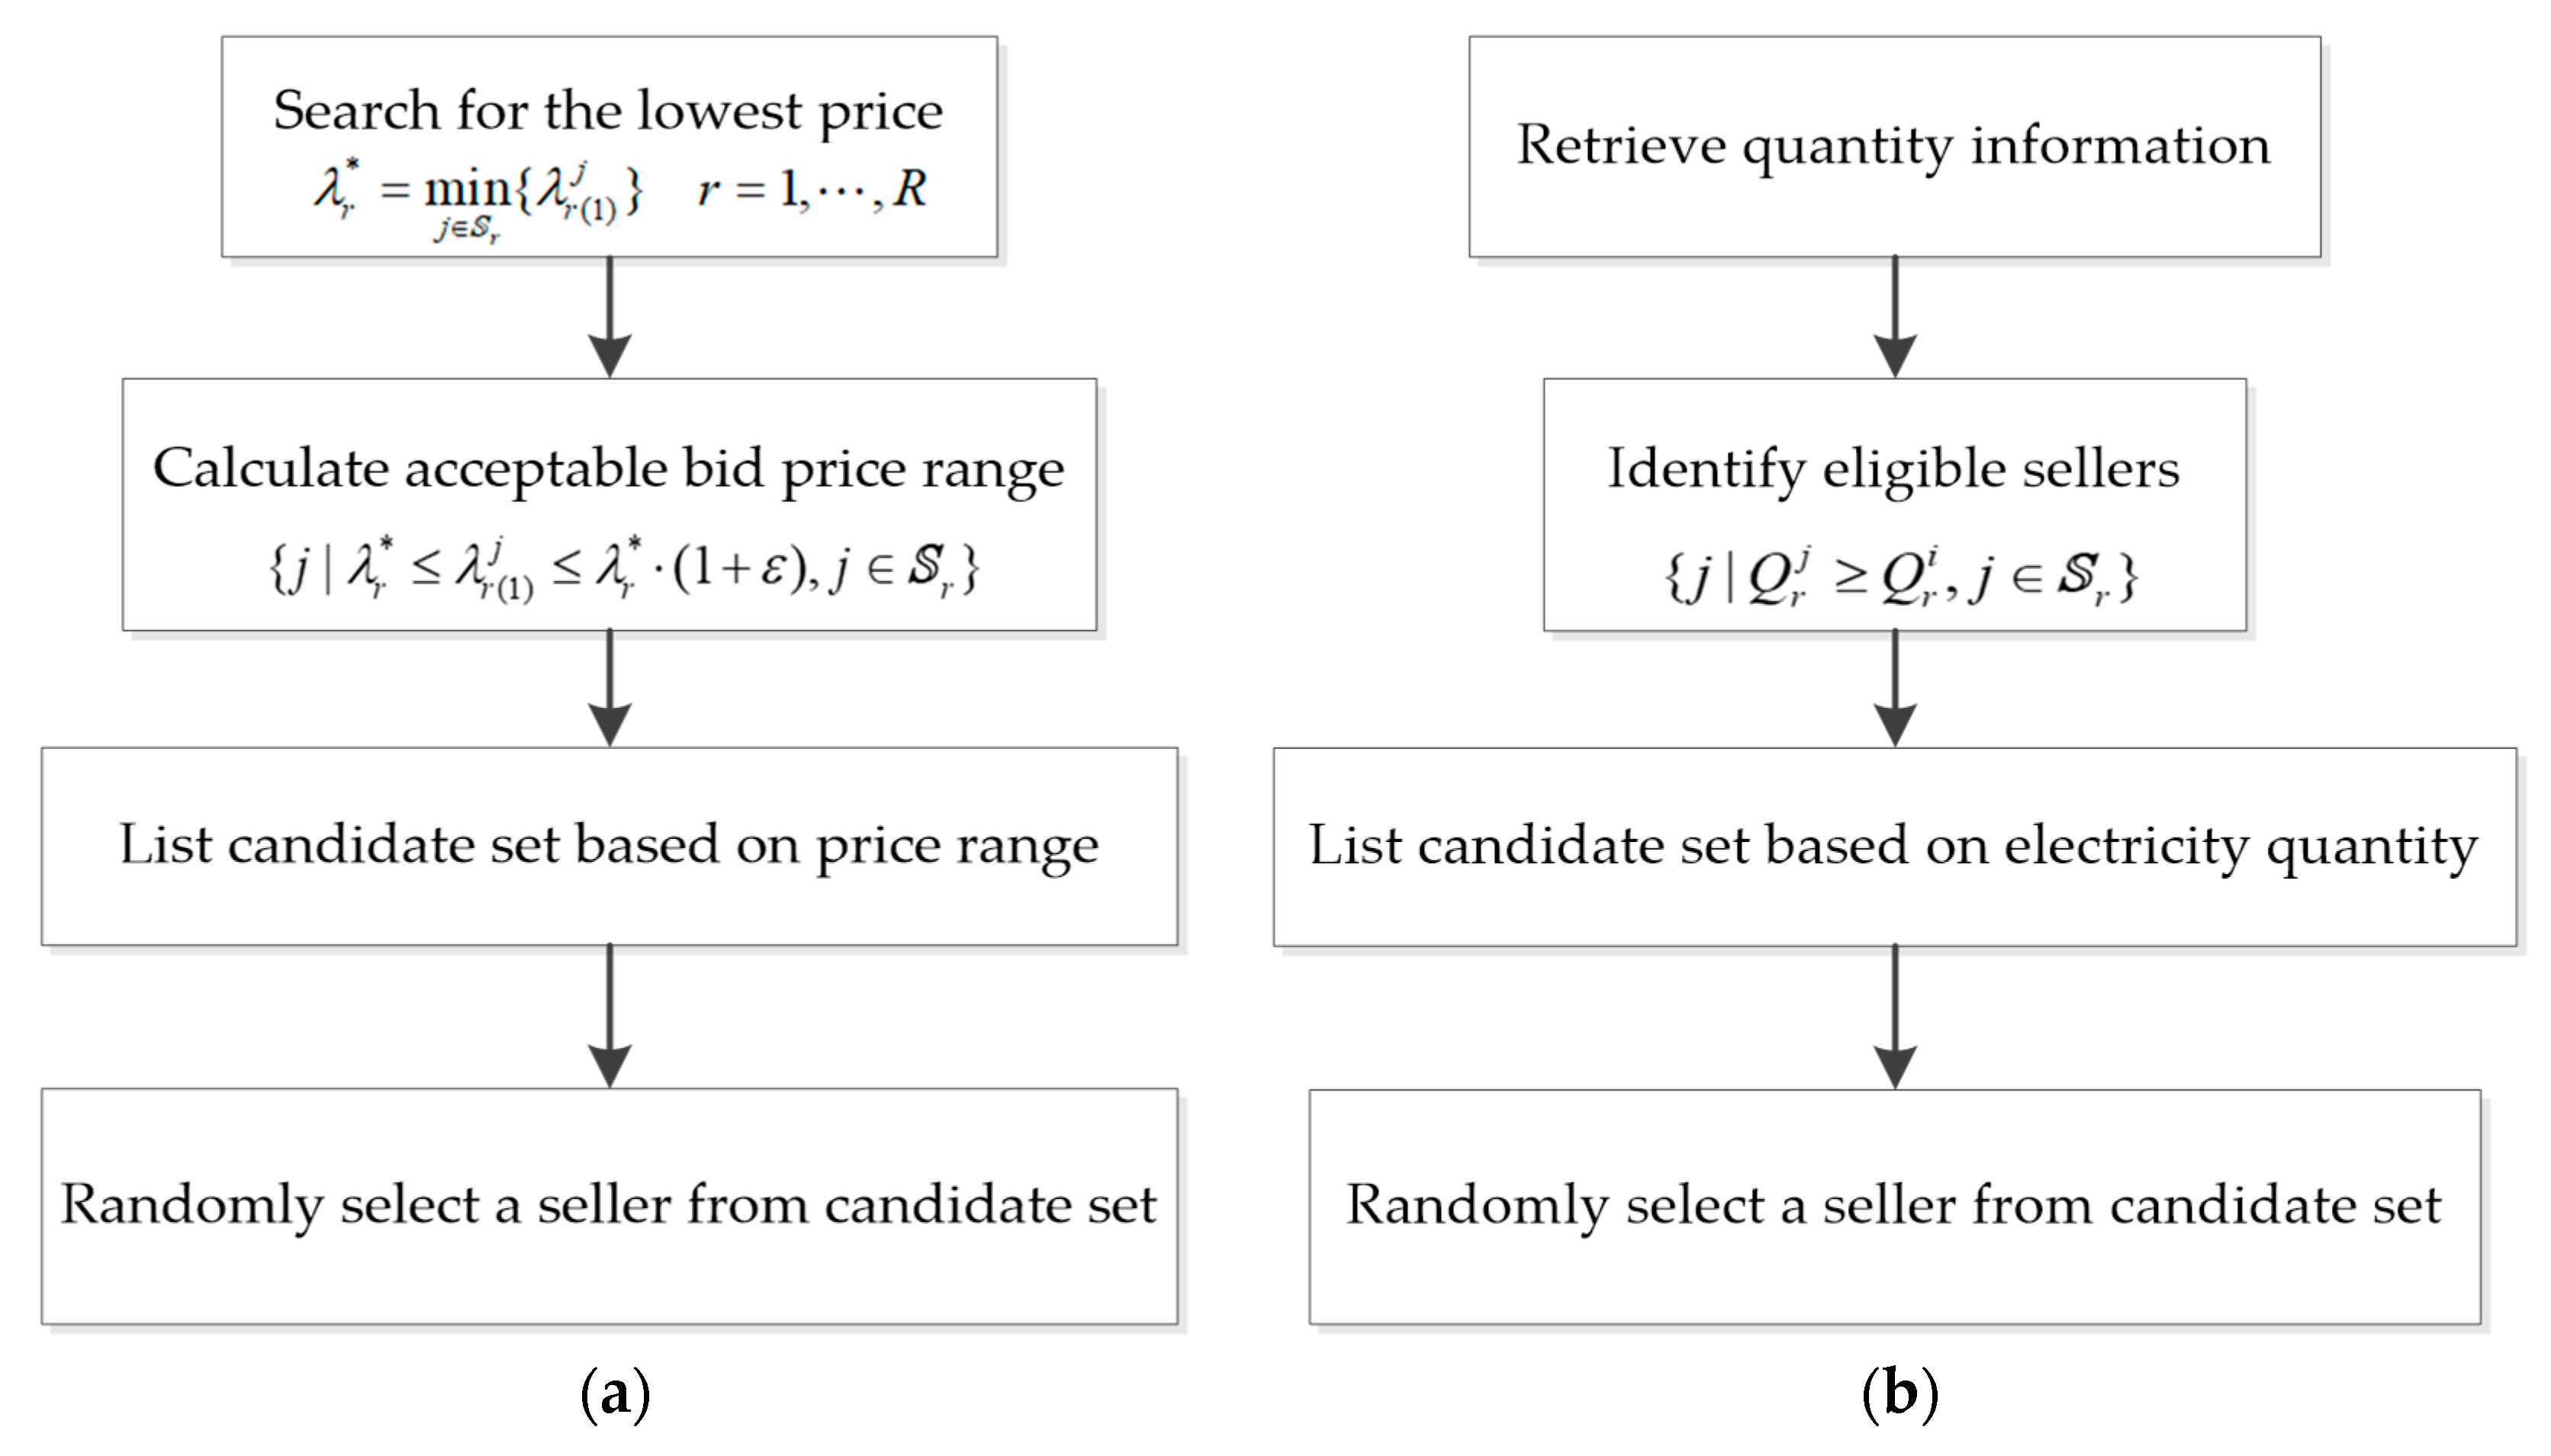
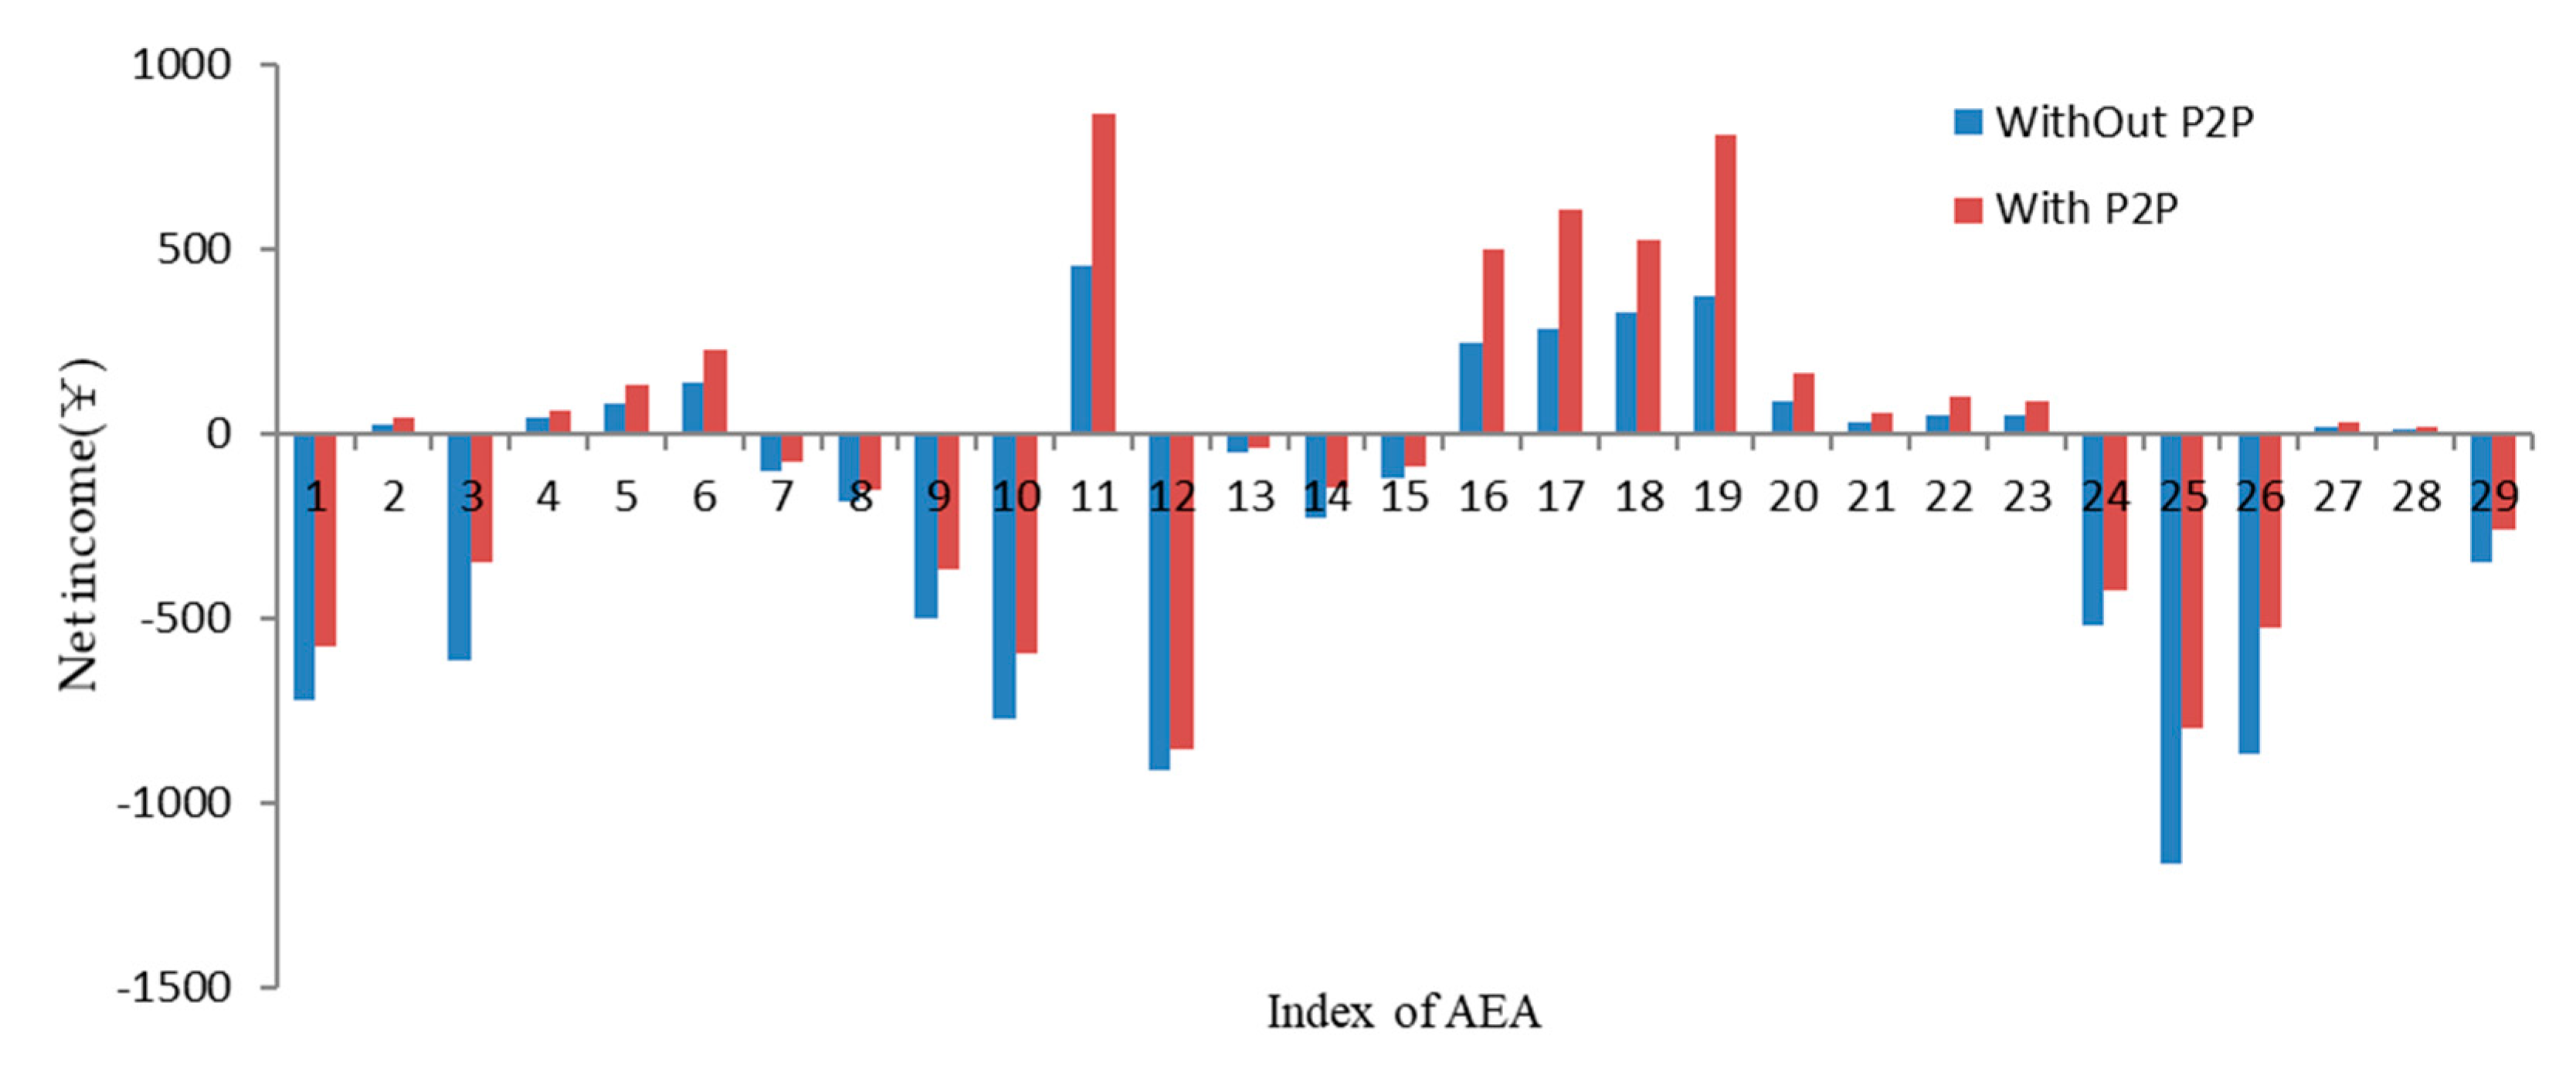
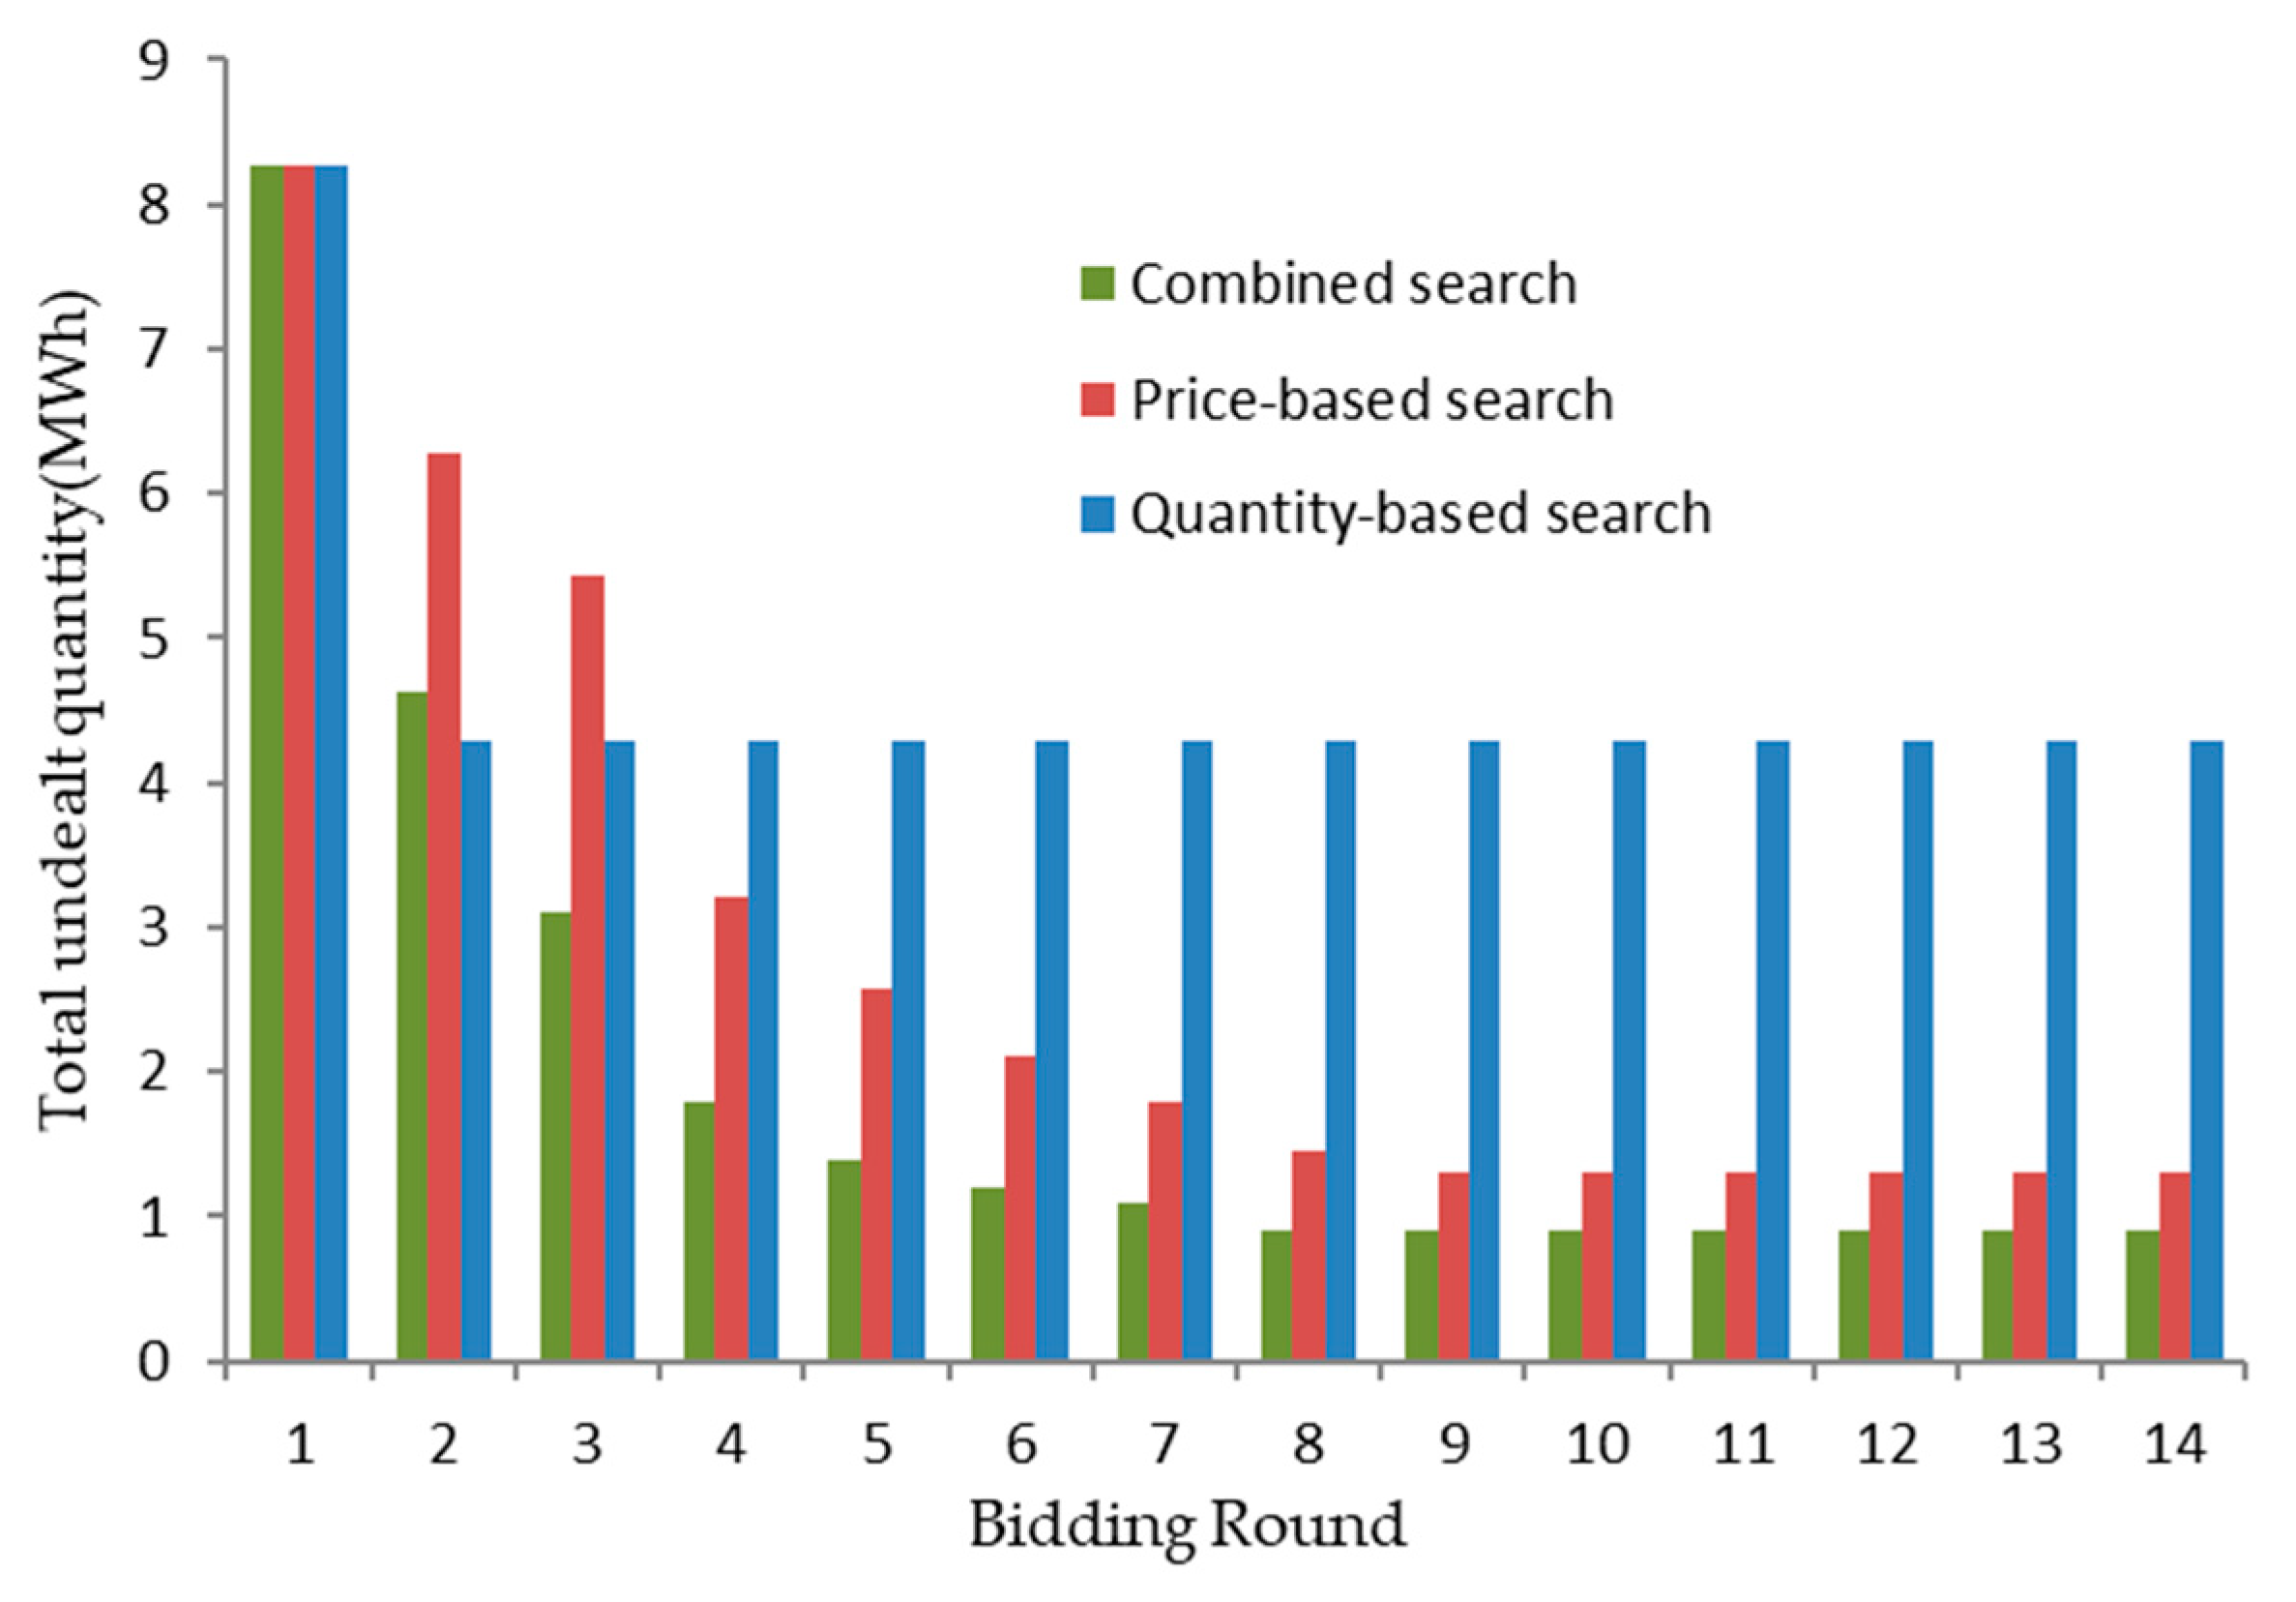
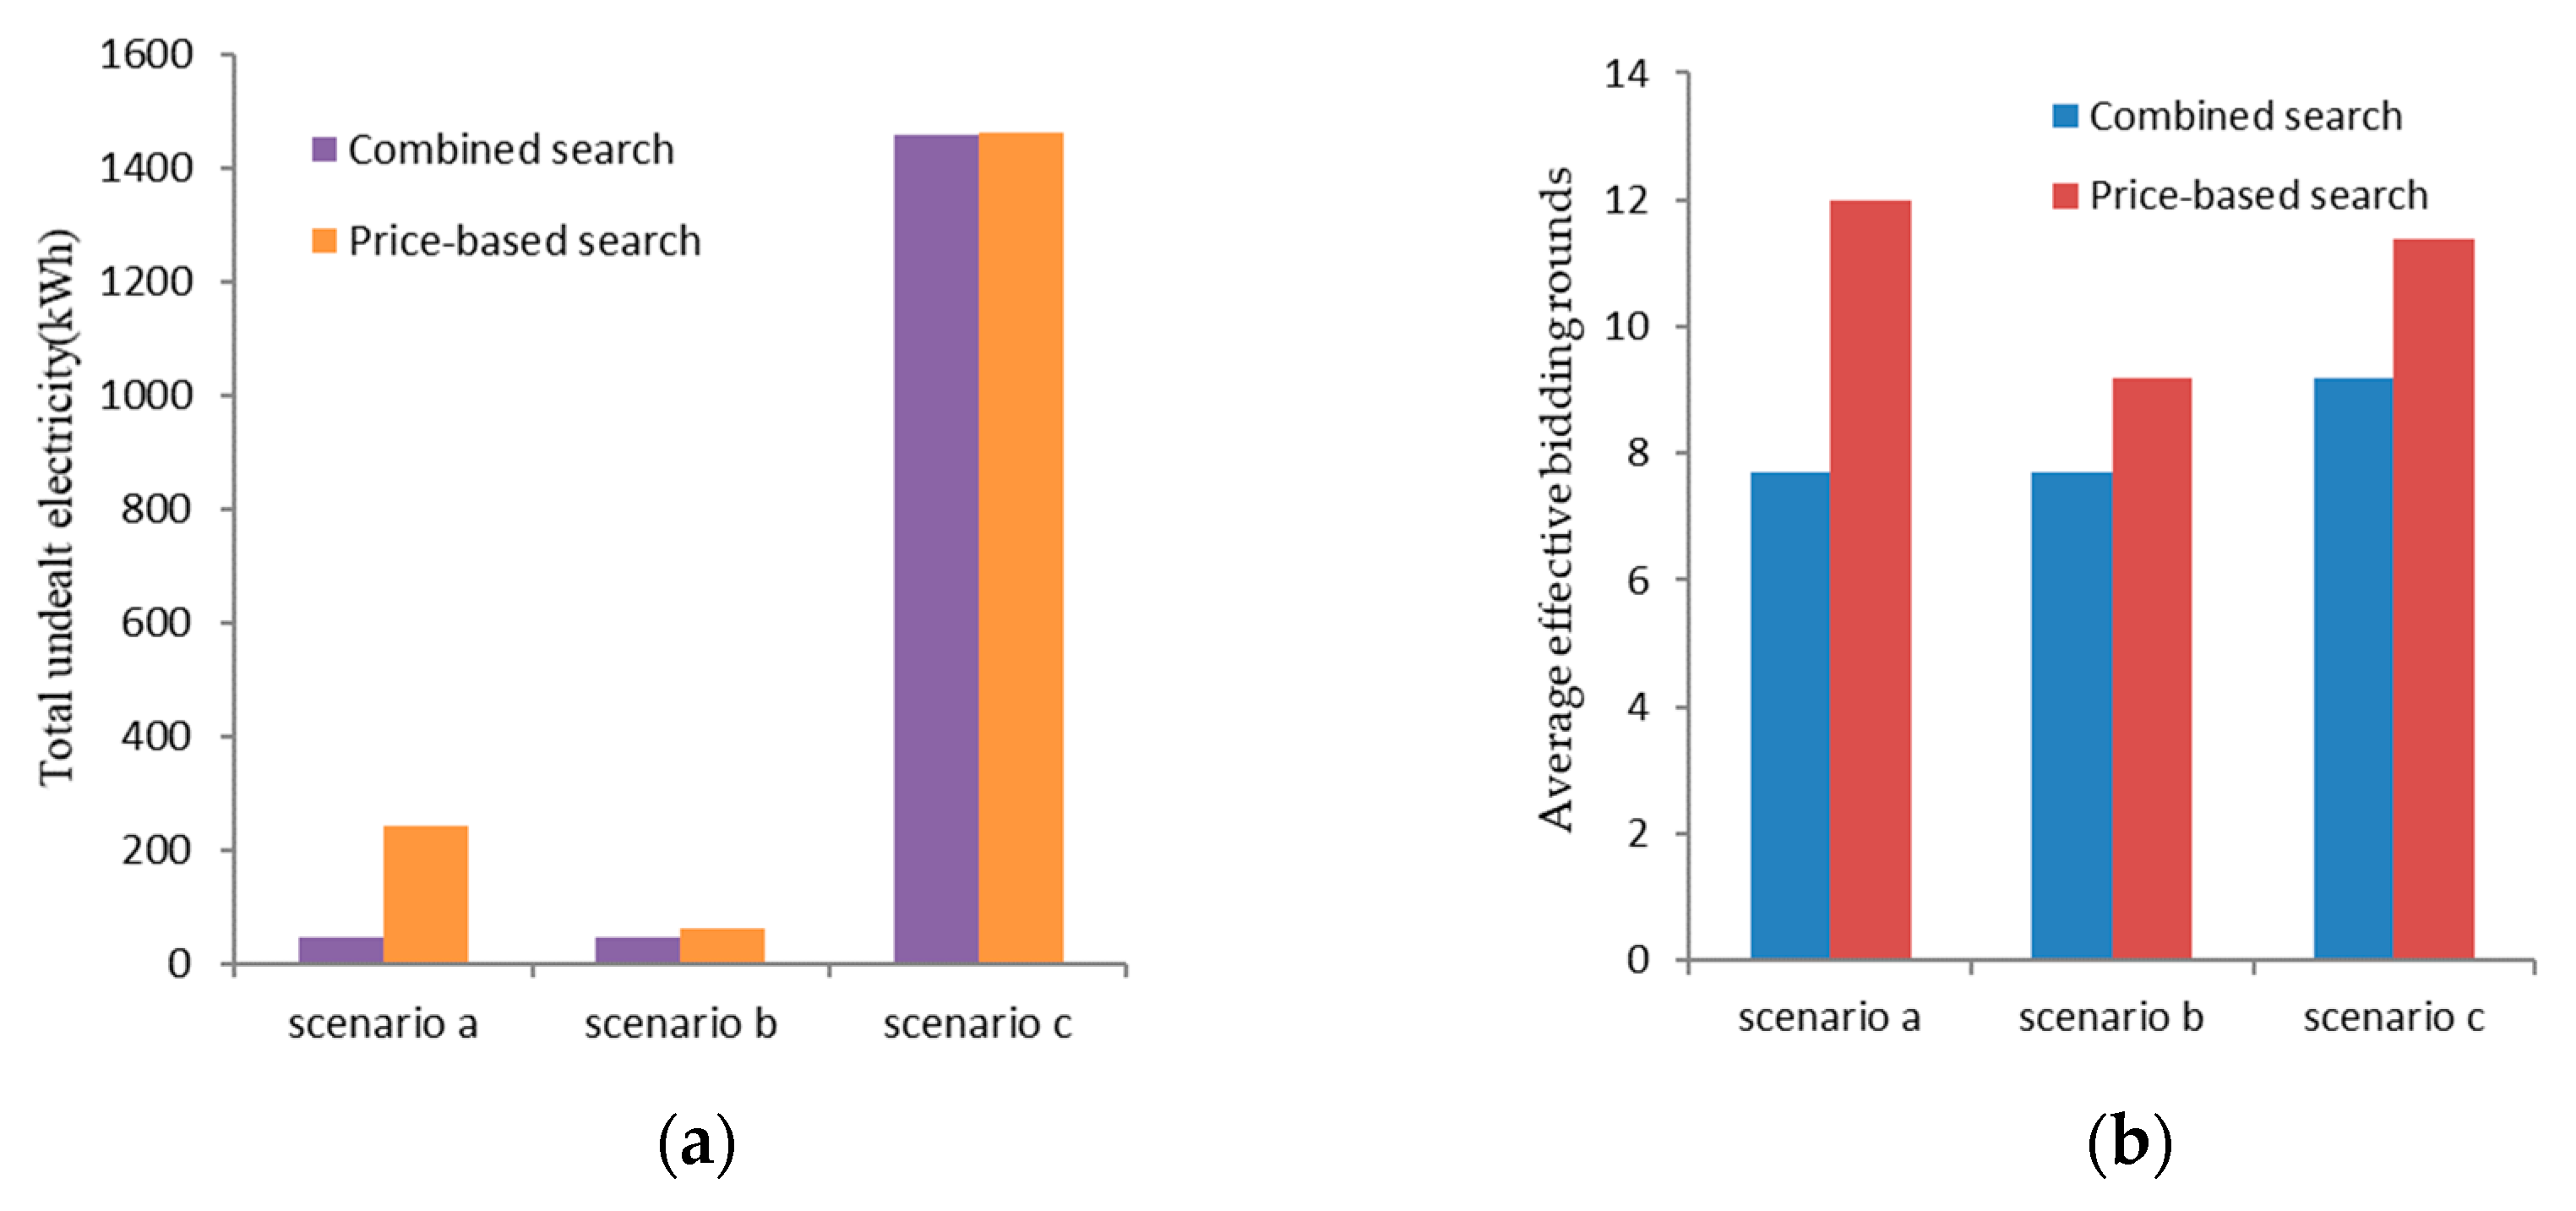
Comparative discussion validates the advantage of P2P transaction over centralized methodology as all AEAs can improve net incomes by participating in P2P transaction, the combined search for counterparty can achieve faster convergence and higher transaction quantity than the search solely based on price or quantity, and DisCo can always benefit from applying pricing control in various scales of AEA communities.
It is verified that the proposed “P2P Plus” transaction is equitable and mutually beneficial for market players, as well as flexible and reliable for the system operator. This contribution provides a reference for the establishment of future distribution network and the implementation of power market reform in China.

Author Contributions

Conceptualization, M.F. and Z.X.; methodology, M.F. and N.W.; software, M.F.; supervision, Z.X. and W.X.; validation, M.F. and X.L.; visualization, M.F.; writing—original draft, M.F.; writing—review and editing, Z.X. All authors have read and agreed to the published version of the manuscript.

Funding

This research was funded by National Natural Science Foundation of China under Grant No. 61973238, 61773292, and Technology Development Program of Guizhou Power Grid under Grant No. GZKJXM20160635.

Acknowledgments

The authors thank Feiyu Zhu for his explorative work that provides basis of this paper.

Conflicts of Interest

The authors declare no conflict of interest.

Abbreviations

DERdistributed energy resource
P2Ppeer-to-peer
AEAactive energy agent
DisCoDistribution company
PTDFpower transfer distribution factor
Variables:Description:
B , S set of buyer, seller AEAs in the community
T set of time units of electricity transaction
L set of lines in the distribution network
A AEA
i , j index of buyer, seller AEA, generally used as the superscript of a variable in this paper
t index of time unit of electricity transaction, generally used as the subscript of a variable in this paper t = 1 , , 24
Δ t time unit of electricity transaction, Δ t = 1   h in this paper
r index of round of price bidding in a time unit, generally used as the subscript of a variable in this paper, r = 1 , , R
h   index of bout in a single round of P2P price bidding, generally used in a bracket as the subscript of a variable in this paper, h = 1 , , H
Q P2P bid quantity of an AEA (unit: kWh)
q P2P deal quantity of a bidding pair (unit: kWh)
Q ^ undealt quantity of an AEA after P2P stage (unit: kWh)
q ^ responded quantity of an AEA in Plus stage (unit: kWh)
q tailored quantity of an AEA (unit: kWh)
λ P2P price of an AEA (unit: ¥/kWh)
¯ μ feed-in price, the price at which AEAs sell electricity to DisCo (unit: ¥/kWh)
μ ¯ retail price, the price at which AEAs buy electricity from DisCo (unit: ¥/kWh)
r a n d ( 1 ) a random number following the uniform distribution on interval [0,1]
εa small positive number
wwillingness of an AEA to make a deal with to its counterparty (unit: ¥/kWh)
δbasic step of price adjustment (unit: ¥/kWh)
S D supply demand factor of electricity market
N R transaction record of an AEA
T P time pressure of an AEA
M D matching degree of an AEA with its counterparty
u , v , z revenue, expense, net income of a buyer/seller AEA
U , V , Z revenue, expense, net income of DisCo
¯ ω price at which DisCo exports electricity to main grid (unit: ¥/kWh)
ω ¯ price at which DisCo imports electricity from main grid (unit: ¥/kWh)
ρ compensation rate for tailoring quantities of AEAs (unit: ¥/kWh)
e , E elasticity, elasticity matrix
P electric power flow (unit: kW)
l index of transmission line, generally used as the superscript of a variable in this paper
g , G transfer factor, transfer factor matrix
power transfer distribution factors (PTDF) of two nodes on a line
N number of nodes in distribution network
L number of lines in distribution network
k _ , k ¯     lower, upper limit

Appendix A

The power transfer distribution factor (PTDF) can be calculated as follows:
Step 1 Calculate the connectivity matrix
M = ( m n , l ) N × L
where each element m n , l indicates the connectivity of Node n and Line l, and the direction of power flow if connected.
m n , l = { 1 power   out   of   n 1 power   into   n 0 otherwise
Step 2 Calculate the admittance matrix
B = diag ( 1 γ 1 , , 1 γ l , , 1 γ L )
where each element γ l on the main diagonal is the susceptance of Line l.
Step 3 Calculate the injection transfer matrix
G = ( g n , l ) N × L = B M T ( M B M T ) 1
where each element g n , l describes the impact of the power change on Node n to Line l.
Step 4 Calculate PTDFs by using the two corresponding elements of the injection transfer matrix
ϕ l i j = g i , l g j , l

References

  1. Wang, X.; Zhang, H.; Zhang, S. Game Model of Electric Power Market Involving Virtual Power Plants Composed of Wind Power and Electric Vehicles. Autom. Electr. Power Syst. 2019, 43, 155–164. [Google Scholar]
  2. Ustun, T.S.; Hussain, S.M.S.; Kikusato, H. IEC 61850-Based Communication Modeling of EV Charge-Discharge Management for Maximum PV Generation. Ieee Access 2019, 7, 4219–4231. [Google Scholar] [CrossRef]
  3. Long, C.; Wu, J.; Zhou, Y.; Jenkins, N. Peer-to-peer energy sharing through a two-stage aggregated battery control in a community Microgrid. Appl. Energy 2018, 226, 261–276. [Google Scholar] [CrossRef]
  4. Khorasany, M.; Mishra, Y.; Ledwich, G. Peer-to-peer market clearing framework for DERs using knapsack approximation algorithm. In Proceedings of the IEEE PES Innovative Smart Grid Technologies Conference Europe, Torino, Italy, 26–29 September 2017; pp. 1–6. [Google Scholar]
  5. Fichera, A.; Frasca, M.; Palermo, V.; Volpe, R. Application of the Complex Network Theory in Urban Environments. A Case Study in Catania. Energy Procedia 2016, 101, 345–351. [Google Scholar] [CrossRef]
  6. Fichera, A.; Frasca, M.; Volpe, R. The centralized energy supply in a network of distributed energy systems: A cost-based mathematical approach. IJHT 2017, 35, S191–S195. [Google Scholar] [CrossRef]
  7. Reihani, E.; Siano, P.; Genova, M. A New Method for Peer-to-Peer Energy Exchange in Distribution Grids. Energies 2020, 13, 799. [Google Scholar] [CrossRef] [Green Version]
  8. Etukudor, C.; Couraud, B.; Robu, V.; Früh, W.; Flynn, D.; Okereke, C. Automated Negotiation for Peer-to-Peer Electricity Trading in Local Energy Markets. Energies 2020, 13, 920. [Google Scholar] [CrossRef] [Green Version]
  9. Gode, D.K.; Sunder, S. Allocative Efficiency of Markets with Zero-Intelligence Traders: Market as a Partial Substitute for Individual Rationality. J. Polit. Econ. 1993, 101, 119–137. [Google Scholar] [CrossRef]
  10. Guo, L.; Chen, X.; Deng, H.; He, Y.; Chen, Q. A Framework of Operating Mechanism Based on Peer-to-Peer Transaction Among Distributed Energy Resources in Community Microgrid. State Grid 2018, 39, 2–9. [Google Scholar]
  11. Wang, N.; Xu, W.; Xu, Z.; Shao, W. Peer-to-Peer Energy Trading among Microgrids with Multidimensional Willingness. Energies 2018, 11, 3312. [Google Scholar] [CrossRef] [Green Version]
  12. Nguyen, A.; Bui, V.; Hussain, A.; Nguyen, D.; Kim, H. Impact of Demand Response Programs on Optimal Operation of Multi-Microgrid System. Energies 2018, 11, 1452. [Google Scholar] [CrossRef] [Green Version]
  13. Ju, L.; Qin, C.; Wu, H.; He, P.; Yu, C.; Tan, Z. Wind Power Accommodation Stochastic Optimization Model with Multi-type Demand Response. Power Syst. Technol. 2015, 39, 1839–1846. [Google Scholar]
  14. Bludszuweit, H.; Dominguez-Navarro, J.A.; Llombart, A. Statistical Analysis of Wind Power Forecast Error. IEEE Trans. Power Syst. 2008, 23, 983–991. [Google Scholar] [CrossRef]
  15. Dam, Q.B.; Mohagheghi, S.; Stoupis, J. Intelligent Demand Response Scheme for Customer Side Load Management. In Proceedings of the 2008 IEEE Energy 2030 Conference, Atlanta, GA, USA, 17–18 November 2008; pp. 1–7. [Google Scholar]
  16. Zhou, B.; Huang, T.; Zhang, Y. Reliability Analysis on Microgrid Considering Incentive Demand Response. Autom. Electr. Power Syst. 2017, 41, 70–78. [Google Scholar]
  17. Zhou, R.; Liu, Y.; Yu, H.; Li, J.; Chao, D. Optimal Operation of Microgrid Based on Classified Load Model and Demand-side Response. Proc. CSU-EPSA 2018, 30, 89–94. [Google Scholar]
  18. Zhang, Y.; Ren, S.; Yang, X.; Bao, K.; Xie, L.; Qi, J. Optimal configuration considering price-based demand response for stand-alone microgrid. Electr. Power Autom. Equip. 2017, 37, 55–62. [Google Scholar]
  19. Gonzalez De Durana, J.; Barambones, O. Technology-free microgrid modeling with application to demand side management. Appl. Energy 2018, 219, 165–178. [Google Scholar] [CrossRef]
  20. Kremers, E.; Gonzalez De Durana, J.; Barambones, O. Multi-agent modeling for the simulation of a simple smart microgrid. Energy Convers. Manag. 2013, 75, 643–650. [Google Scholar] [CrossRef]
  21. De Durana, J.M.G.; Barambones, O.; Kremers, E.; Varga, L. Agent based modeling of energy networks. Energy Convers. Manag. 2014, 82, 308–319. [Google Scholar] [CrossRef] [Green Version]
  22. Lüth, A.; Weibezahn, J.; Zepter, J.M. On Distributional Effects in Local Electricity Market Designs—Evidence from a German Case Study. Energies 2020, 13, 1993. [Google Scholar] [CrossRef] [Green Version]
  23. Yu, S.; Yang, S.; Li, Y.; Geng, J.; Shi, F. Research on Distributed Generation Marketization-oriented Electricity Transaction Mechanism Based on Blockchain Smart Contract. Smart Power 2018, 46, 43–48. [Google Scholar]
  24. Liu, Y.; Chen, X.; Li, B.; Zhu, J. State of Art of the Key Technologies of Multiple Microgrids System. Power Syst. Technol. 2020, 1–21. [Google Scholar] [CrossRef]
  25. Energinet. Energy Data Service. Available online: https://www.energidataservice.dk/en/dataset/electricitybalancenonv (accessed on 4 October 2019).
Figure 1. The structure of “P2P Plus” electricity transaction in an AEA community.
Energies 13 02408 g001
Figure 2. The flowchart of the “P2P Plus” electricity transaction.
Energies 13 02408 g002
Figure 3. Two strategies of counterparty search: (a) Price-based search; (b) Quantity-based search.
Energies 13 02408 g003
Figure 4. Flowchart of tailoring algorithm.
Energies 13 02408 g004
Figure 5. 30-bus test system interconnecting 29 AEAs and integrating to main grid.
Energies 13 02408 g005
Figure 6. 24-h output profiles of 29 AEAs in the test system.
Energies 13 02408 g006
Figure 7. Price bidding process of three groups. (a) buyer A25; (b) buyer A7; (c) buyer A8.
Energies 13 02408 g007
Figure 8. The relationship between deal prices and supply demand ratio of market.
Energies 13 02408 g008
Figure 9. Correlation of retail price and accumulated demand.
Energies 13 02408 g009aEnergies 13 02408 g009b
Figure 10. Advantage of P2P transaction on net income of AEAs.
Energies 13 02408 g010
Figure 11. Comparison of undealt electricity under the three search strategies.
Energies 13 02408 g011
Figure 12. Performance comparison between combined search and price-based search: (a) well-matched; (b) seller-dominated; (c) buyer-dominated.
Energies 13 02408 g012
Figure 13. Performance comparison results of combined search and price-based search: (a) Total undealt electricity; (b) Average effective bidding round.
Energies 13 02408 g013
Figure 14. Profit of DisCo by applying pricing control in communities of different AEA numbers.
Energies 13 02408 g014
Table 1. Deals of P2P electricity transaction in 8th hour (t = 8).
Deal#Buyer#Seller#Deal Quantity (kWh)Deal Price (¥/kWh)
1251116120.492
226181203.40.439
336590.30.390
41522164.40.557
52919483.00.531
61221142.60.394
7819258.20.592
82416718.30.592
9142776.220.445
10917689.50.534
11132072.70.498
121299.80.458
13124174.10.366
14723140.60.521
15145234.60.461
1612850.70.414
171019815.90.493
18320257.50.453
19117496.10.485
Table 2. Comparison of search strategies in three cases.
Group.BuyerShortage (kWh)X-Based SearchSellerSurplus (kWh)Transaction RecordMatching DegreeFinal BoutDeal Price (¥/kWh)Deal
a251612price6590.31/10.607/1270.4343
quantity111907.61/11/0.832260.4924
b7140.6price17469.131/11/0.607300.5771
quantity23209.461/11/0.613250.5216
c8258.2price18176.21/0.3510.628/1----
quantity191074.11/0.7631/0.607280.5922
Table 3. PTDFs of nine lines in the 30-bus test system.
Line#167101314182233
Deal#
1−0.001−0.003−0.0220.084−10.5930.066−0.0580.582
2−0.0110.0220.1410.0760−0.106−0.213−0.5610.621
3−0.1590.134−0.7580.00200.024−0.020−0.012−0.009
40.013−0.023−0.195−0.0050−0.1310.359−0.2470.024
5−0.0120.0230.1900.1090−0.205−0.174−0.4080.455
6−0.017−0.032−0.266−0.0080−0.172−0.292−0.1730.042
70.0190.0350.2970.8450−0.345−0.258−0.4040.111
80.0080.0150.1260.02700.0080.2560.021−0.136
9−0.021−0.040−0.333−0.11100.1030.101−0.151−0.448
100.0080.0140.118−0.0060−0.7670.0160.0050.032
11−0.013−0.024−0.204−0.0040−0.139−0.402−0.3030.021
12−0.8380.057−0.078000.003−0.002−0.0010
130.0210.0390.3290.01500.199−0.164−0.098−0.074
140.056−0.034−0.250−0.0320−0.281−0.3530.1120.158
15−0.1140.133−0.2240.01900.2380.192−0.152−0.095
160.668−0.313−0.500−0.19100.001−0.023−0.008−0.044
170.0060.0110.090000.069−0.1700.3250.003
18−0.141−0.102−0.481−0.0200−0.340−0.2370.3350.095
190.652−0.284−0.257−0.0190−0.367−0.056−0.0550.093
Table 4. Congested lines and tailored orders in the 30-bus test system.
Congested LineOriginal Flow (kW)Line Rating (kW)Power to be Tailored (kW)Affected Order NumberFlow after Tailoring (kW)
131907.61600307.611600
221757.81600157.82,5,71600
Table 5. Affected orders and tailored quantities.
Deal#Party (#AEA)Transaction in P2P (kWh)Transaction with DisCo (kWh)Tailored Transaction (kWh)Granted Transaction (kWh)
1Seller (#11)1612295.6307.61600
Buyer (#25)16120121600
2Seller (#18)1203.4176.3237.81141.9
Buyer (#26)1203.4061.51141.9
5Buyer (#29)482.96030.5452.46
Seller (#19)1557.1060.51496.4
7Seller (#19)
Buyer (#8)258.24030228.24
Table 6. Comparison of convergence performances of three search strategies.
#Search StrategyUndealt Electricity (kWh)Effective Bidding Round
1Combined9029
2Price-based1332.610
3Quantity-based4283.92

