Article

Bio-Based Carbon Materials from Potato Waste as Electrode Materials in Supercapacitors

Conversion Technologies of Biobased Resources, University of Hohenheim, Garbenstr. 9, 70599 Stuttgart, Germany
*
Author to whom correspondence should be addressed.
Energies 2020, 13(9), 2406; https://doi.org/10.3390/en13092406
Submission received: 17 April 2020 / Revised: 1 May 2020 / Accepted: 6 May 2020 / Published: 11 May 2020
(This article belongs to the Special Issue Hydrothermal Technology in Biomass, Utilization & Conversion II)

Abstract

:
This study investigates the production of biobased carbon materials from potato waste and its application in energy storage systems such as supercapacitors. Three different categories of carbons were produced: hydrochar (HC) from hydrothermal carbonization (HTC) at three different temperatures (200 °C, 220 °C, 240 °C) and two different duration times (two hours and five hours), pyrolyzed hydrochar (PHC) obtained via pyrolysis of the HTC chars at 600 °C and 900 °C for two hours and pyrochar from the pyrolysis of biomass at 600 °C and 900 °C for two hours. The carbon samples were analysed regarding their physico-chemical properties such as elemental composition, specific surface area, bulk density and surface functionalities as well as their electrochemical characteristics such as electric conductivity and specific capacity via cyclic voltammetry. N- and O-enriched carbon materials with promising specific surface areas of up to 330 m2 g−1 containing high shares of microporosity were produced. Electric conductivities of up to 203 S m−1 and specific capacities of up to 134 F g−1 were obtained. The presence of high contents of oxygen (4.9–13.5 wt.%) and nitrogen (3.4–4.0 wt.%) of PHCs is assumed to lead to considerable pseudocapacitive effects and favor the high specific capacities measured. These results lead to the conclusion that the potential of agricultural biomass can be exploited by using hydrothermal and thermochemical conversion technologies to create N- and O-rich carbon materials with tailored properties for the application in supercapacitors.

1. Introduction

Rising greenhouse gas emissions combined with the depletion of fossil fuels lead to increased pressure on innovation within energy storage systems to create a suitable alternative for combustion engines in the mobility sector.
The electric double layer capacitor (supercapacitor) (EDLC) is regarded as a key technology in this context due to its enormous power density in combination with its large number of charging and discharging cycles and its broad temperature compatibility [1] and has already successfully established itself in some fields of application such as in the automotive industry (regenerative braking systems), in hybrid electric vehicles, and in consumer electronics [2,3].
It is particularly suitable for the application areas mentioned, because it has a significantly higher power density compared to batteries, although its energy density is usually significantly lower. Depending on the design, up to 500,000 charging and discharging cycles with high charging and discharging energy densities can be achieved [4].
The energy storage mechanism in an EDLC takes place by electrostatic adsorption of electrolyte ions on the surface of an electrically conductive porous electrode material [1]. Thus, electrode materials with very high specific surfaces can also achieve very high capacities [5].
In addition to the double layer capacity, the so-called pseudo-capacity can increase the overall capacity of the EDLC. It occurs when voltage-induced redox reactions occur at the interface between the electrolyte and functional groups on the electrode surface. The resulting electron flow of the redox reactions increases the amount of charge flowing, called faraday current [4,6,7,8].
In addition, capacity C also has a direct influence on the level of energy density E, as shown in Equation (1) V is the nominal voltage.
E = 1 2   C   V 2  
The capacitance of an EDLC strongly depends on the properties of the electrode material. In particular, the pore size distribution and the specific surface area are decisive. According to Pandolfo et al., the following characteristic physical-chemical properties can thus be determined for an electrode material in a supercapacitor [4]:
  • high electric conductivity
  • high specific surface (>2000 m2 g−1)
  • high corrosion resistance
  • good thermal stability
  • homogeneous pore structure
  • high material purity
  • low cost
An extensive literature review showed that a lot of experiments have already been conducted regarding the production of carbon-rich materials from different biomasses by applying various combinations of hydrothermal carbonization and pyrolysis with varying residence times and reaction temperatures [9,10,11,12] with regards to their application in [13,14,15]. From these studies, different conclusions have already been drawn, regarding bio-based electrode materials. Some of them are:
  • microporous carbon structure positively influences the electric conductivity [4]
  • high electric conductivity leads to better capacitances [5,16]
  • high carbon contents and a graphite-like structure lead to better electric conductivity [13,14,17]
Based on these findings and previous experiments with other N- and O-rich waste biomasses such as coffee grounds, bakery waste, or vineyard residues [14,18], potato waste was studied as precursor material for the production of bio-based electrode materials by applying hydrothermal carbonization and pyrolysis. Previous experiments with the above-mentioned biomasses showed that carbons with high N- contents of up to 10 wt.% can be produced via in-situ functionalizing of HTC-chars (carbons from hydrothermal carbonization). To verify, if this process works for a broad range of different waste biomasses, it was applied to potato waste, since this specific biomass has high contents of starch and proteins [19] which serve as N-source during the conversion to carbon materials. Furthermore, due to strict quality requirements from the food trading sector, each year in Germany between 730.000 and 750.000 tons of potatoes are discarded (up to 50% of the total potato harvest), often because of minor optical flaws [20]. Potatoes with starch contents > 13% can be used in starch manufacturing, but the great majority is used as substrate in biogas plants or converted into animal feed. This means not only an economic loss for the farmer but also on a material level, this utilization is very inefficient [20,21].
It only used residual potatoes, which are not considered suitable for food use anymore, because of growth behavior, size, or deformity. For the utilization of this biologically and morphologically still perfect biomass, there are only constantly changing, temporally limited emergency solutions, which have the highest premise to keep the disposal costs as low as possible. The aim is to assess the enormous potential of the vast quantities of biomass produced and create a highly value-added material out of this low-cost biomass. Due to the enormous mass and starch content of the potato, it is possible to convert this biomass by means of conversion technology and then to characterize and further process it for various possible applications.
A closer look at the chemical composition of the biomass potato reveals that it consists of up to 21 wt.% starch (fresh mass) and low amounts of proteins, depending on the variety. In general, floury varieties contain more starch than waxy varieties. This potato starch consists of 80% amylopectin. This is a polysaccharide and is composed of D-glucose monomers which are linked to each other α-1,4-glycosidically and to each other after each 15–30 monomers α-1,6-glycosidically. Thus the structure on molecular level can be described as a branched structure. The remaining 20% of the starch consists of amylose, which is also a polysaccharide, but unlike amylopectin has only α-1,4-glycosidically linked D-glucose monomers and can therefore be described as a linear polymer [22]. Furthermore, the presence of oxygen and nitrogen in the dry matter is also a decisive reason why potatoes are promising as biomass for the production of heteroatoms-enriched carbon materials for EDLCs. This is because the high content of heteroatoms could generate pseudo-capacities, which are created by redox reactions at the contact points of the electrode and electrolyte [23]. It is also assumed that the nitrogen in the biomass positively influences the electric conductivity of carbon due to its valence electrodes and thus gives rise to the total capacity [1].
Originating from these preconditions, the main goal is to study the (hydro-) thermal conversion of this specific biomass and to gain new insights into the correlation between the carbonization parameters, the resulting physico-chemical properties and the electrochemical performance of the obtained bio-based carbons materials.

2. Materials and Methods

2.1. Biomass

A floury potato variety was selected for the biomass, because of its higher starch content [22]. The sample, which was provided for experimental purposes by a potato packaging company in Rhineland-Palatinate, represents the quantity of potatoes, which are undesirable for sale, due to their too small or too large size and are thus sorted out. In the pre-treatment process, the potatoes were crushed to 2–3 mm3 chips by means of a kitchen machine. The wood chips were then dried at 100 °C for 16 h. Finally, the dry mass was finely ground with a mortar.

2.2. Hydrothermal Carbonization

The hydrothermal carbonization (HTC) process was applied to produce six types of carbon materials: the biomass was treated by HTC at 200 °C, 220 °C, and 240 °C for two and five hours reaction time, respectively. At the beginning of each carbonization process, a stainless steel autoclave with a maximum filling volume of 250 mL was filled with 25 g dry biomass and 150 g water. This corresponds to a ratio of 1:6. The autoclave was then heated up to the respective temperature in a gas chromatography oven. As soon as the desired reaction temperature was reached in the autoclaves, the reaction time was recorded. At the end of the reaction, the autoclave was quenched in a 20 °C cold water bath. Solid and liquid phases were separated by vacuum filtration. Filter paper with a particle retention of 5–13 µm (VWR) was used for this purpose. The filter cake was dried overnight at 105 °C.

2.3. Pyrolysis

The six different HTC chars (hydrochars, HC) and the pure biomass were pyrolyzed at 600 °C and 900 °C for two hours each. As a result, 12 different pyro-hydrochars (PHC) and two different pyrochars (PC) were obtained. To perform pyrolysis at a specific temperature, a sample of 5 g of each hydrochar and biomass was weighed in a small crucible. All crucibles were placed in a metal box sealed with sand. A nitrogen atmosphere was established in the box through a flow rate of 15 L min−1 in order to avoid undesirable oxidations. During the reaction and during cooling, the nitrogen flow was kept constant at 5 L min−1. The reaction time started as soon as the furnace has reached the desired temperature. At the end of the reaction time, the box with the samples was cooled to room temperature for 20 min and the samples were then placed into a desiccator.

2.4. Elemental Analysis

For the elemental analysis, a Euro EA 3000 CHNS (HEKAtech GmbH) was used. The method can be summarized as a dynamic spontaneous combustion with subsequent chromatographic separation and analysis. More precisely, the sample to be measured was catalytically burnt at 1050 °C with pure oxygen. The resulting combustion gases were then passed through a helium stream with helium serving as a carrier gas, to a 600–900 °C hot tungsten contact. Here the nitrogen oxides (NOx) contained in the gas stream are reduced to molecular nitrogen. The measurable combustion gases CO2, H2O, SO2 and N2 are separated from each other by the gas chromatograph and then quantified separately by a thermal conductivity detector in order to be able to determine the respective mass fraction of the elements C, H, N, and S.
The HCs, PCs, PHCs, and biomasses were filled into two zinc cartridges. For the biomass, the filling weight was 2–3 mg, whereas for the carbons the filling weight was 1.3–2.5 mg. Finally, the cartridges were placed into the magazine before starting the measurement.

2.5. Specific Surface Area (BET)

The specific surface area (SSA) was measured and evaluated by nitrogen adsorption and desorption according to the analytical methods of Brunauer, Emmett, and Teller (BET) [24]. SSA was first measured with N2 as adsorption gas and samples with promising SSA values were further measured with CO2 as adsorption gas. In order to prepare the material for the measurement, a measuring cell was half filled with the respective char and the mass was determined. The cell was then sealed with a filter and placed into the degas station of NOVA e-4200 analyzer (Quantachrome Instruments). The samples were degassed before the measurement for 12 h at 100 °C for HCs and 180 °C for PHCs and PCs. The measurement with N2 was carried out at −196.15 °C (liquid nitrogen), whereas the measurement with CO2 took place at 0 °C (cooled water). To check reproducibility, each BET measurement was repeated three times and statistical tests showed negligibly low standard deviation.
The SSA was then calculated based on the obtained adsorption and desorption isotherms by applying the BET Equation (2)
q = K × q m a x × C e q ( C s a t C e q ) × ( 1 + ( k 1 ) × C e q C s a t )
  • q—loading of the adsorbent (mass of adsorbate relative to mass of adsorbent)
  • K—adsorption coefficient
  • qmax—maximum concentration of adsorbate in a layer on the surface of the carbon
  • Ceq—concentration of adsorbate in solution
  • Csat—solubility of adsorbate

2.6. Electric Conductivity (EC)

To determine the electric conductivity, the electric resistance of the carbon powder is measured, which is the reciprocal value of the electric conductivity. The resistance of a sample is influenced by the intrinsic resistance of a single carbon particle and the total contact area between the carbon particles [25].
The measurement was carried out with a device and method described by Hoffman et al. [13], Celzard et al. [26], among others, in which the sample powder is filled into a glass cylinder and compressed by a brass stamp. The bottom of the cylinder as well as the upper piston are serving as electrodes and are connected to a multimeter to detect the resistance. By placing different weights (2, 5, 10 kg) on the upper piston (weight = 0.199 kg), the sample is compressed to different degrees. By taking into account the height and mass of the different samples, the electric conductivity can be calculated by applying the following Equation (3):
EC   = h ( R   ×   A )
  • EC—electrical conductivity [S m−1]
  • H—height of the carbon in the measuring cylinder [cm]
  • R—measured resistance of carbon [Ω]
  • A—area of the measuring cylinder (7.9 × 10⁻⁵ m2)
Furthermore, the bulk density (Equation (4)) of the samples were determined to gain information about the structural properties. The compression rate (CR) is calculated from the ratio of the volume of a sample without compression and the volume at the highest compression. The volumes of the coal can be calculated from the different height of the coal before (h1) and after (h2) the measurement.
ρ = m A × h
  • ρ—density of the coal [kg m−3]
  • m—mass of coal [g]
Each EC measurement was repeated three times to ensure reproducibility of the results (experimental error given in Section 3.3).

2.7. Cyclic Voltammetry

A three-electrode setup, where the sample to be investigated forms the working electrode, was used to conduct cyclic voltammetry. A 0.5 mol H2SO4 solution was used as electrolyte, an Ag/AgCl electrode as reference and a platinum wire formed the counter electrode. A potentiostat Autolab PGSTAT204 (Metrohm) was used to apply a cyclic voltage and measure the current output. The charge flow is recorded as a function of the applied voltage in a cyclovoltamogram. To check reproducibility, each measurement was repeated three times and statistical analysis showed very low standard deviations and coefficient of variation for all samples.
Based on the cyclovoltamogram and the mass of the respective sample, the capacity was calculated using Equation (5). In addition to the capacitance, a pseudo-capacitance caused by redox-reactions can also occur. The presence of the redox potential can later be recognized in the cyclovoltamogram by peaks, because electrons generated by the redox reaction cause their own temporary abrupt current rise [27,28,29].
C = 1 m × v ×   Δ V × v i v t I V d v
  • m—masse of carbon on the working electrode [g]
  • V—scan rate [Vs−1]
  • ΔV—voltage range [V]
  • I v —current [A]
For the preparation of the working electrode, 5 wt.% acetylene black and 10 wt.% polytetrafluoroethylene (PTFE) were mixed with the carbon sample. After adding ethanol, the mixture was homogenized for 12 h by stirring. The obtained slurry was then filtered via vacuum filtration and washed several times with water. The slurry was applied on the current collector with a size of 1 cm2. Before the measurement, the working electrode was weighted to determine the sample weight (by subtracting the mass of the current collector, the acetylene black and the PTFE). Finally, the back of the electrode was insulated before drying the electrode for two hours in a vacuum furnace at 60 °C.

2.8. Ash and Oxygen Content

The ash content was determined in accordance with DIN 51719. Samples of 0.75 g of each carbon and biomass were weighed into a crucible. These crucibles were placed in a muffle furnace and heated up to 815 °C. As soon as the furnace reached the reaction temperature, the reaction time of two hours was set. At the end of the reaction time, the crucibles cooled down to 200 °C in the furnace and were placed into the desiccator for 12 h. The crucibles and the remaining mineral ash were weighed. Each measurement was repeated two times.
The oxygen content of the biomass and the carbon samples were calculated with formula (6) (in wt.%):
O % = 100 %   ( C % + N % + H %   + S % + A s h % )

2.9. Fourier Transform Infrared Spectroscopy (FT-IR)

Fourier transform infrared spectroscopy (FTIR) was conducted to study the different molecule groups in the carbon samples more precisely. The measurement was carried out with a Varian 660-IR (Bruker) spectrometer, in a wavenumber range from 500 to 4000 cm−1 with an ATR-module.

2.10. Experimental Error

Due to small mass losses (max. 0.5 g) during the separation of the liquid and solid phase after HTC a maximum error of 2 wt.% can be expected for hydrochar yield. The error of the pyrochar yield is likely a little bit higher, since only 5 g of biomass or hydrochar were used. However, if one expects an absolute error of 0.25 g the relative error for the pyrolysis yield will be in a range of 5 wt.%. The error of the elemental analysis raises from inaccuracies during the weighing-in of the sample into the zinc-cartridge. These inaccuracies, if present, should not be more than 0.05 mg per cartridge, which makes 2.5 wt.% related to 2 mg of sample mass.

3. Results and Discussions

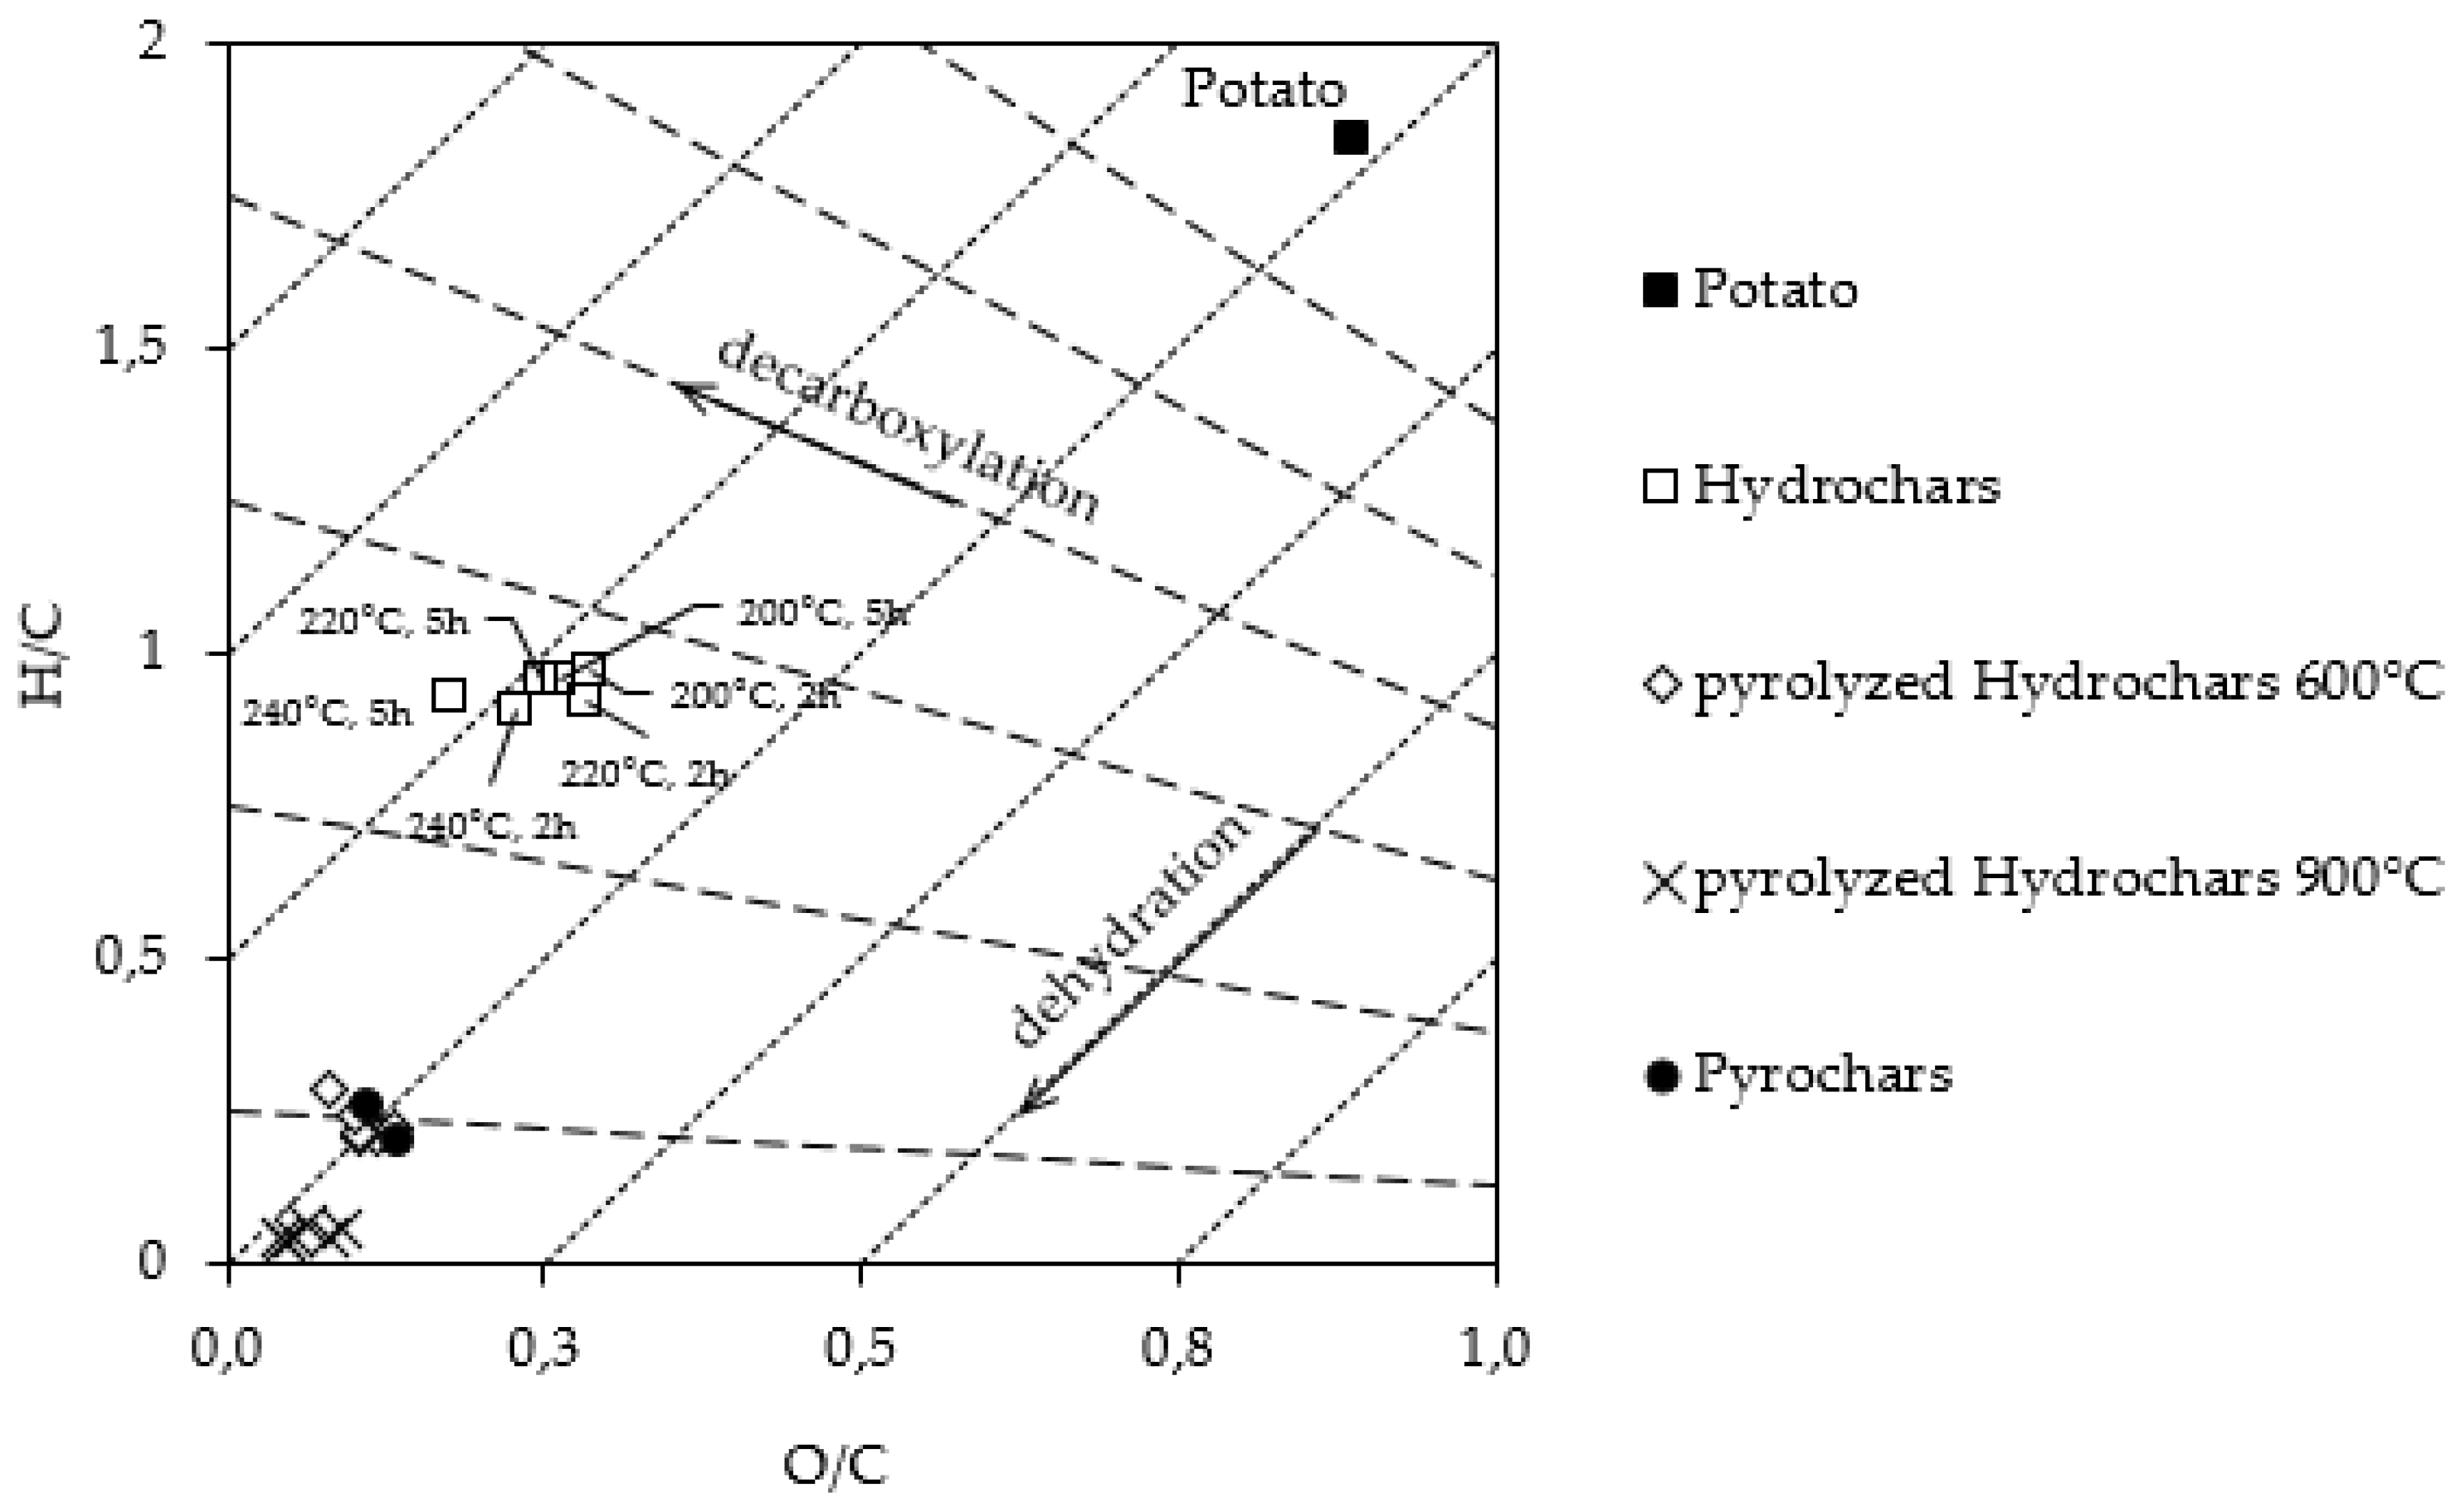
3.1. Thermochemical Conversion

During the elemental analysis the samples were measured in duplicates. The mean values are displayed in Table 1, whereas the standard deviation as well as the single values can be found in the Appendix A. In short, the average standard deviation for nitrogen was 0.028%, for carbon 0.47%, and for hydrogen 0.063%, which shows that the reproducibility is very accurate for the elemental analysis.

3.1.1. Hydrochars

Considering the results for HTC in Table 1, it can be observed that the mass yield of the produced carbon is in the range of 36–42 wt.% and decreases with increasing temperature, as well as with increasing residence time. Carbon yields in the range between 63–69 wt.% are achieved. Furthermore, it can be stated that the carbon content in the carbon increases with temperatures as well as with reaction time.
In the case of HTCs, the carbon materials with the longest residence time and the highest reaction temperature also have the highest carbon content of 71.9 wt.%.
For the HCs produced via 5 h residence time, the ash content decreases with increasing reaction temperature, which is not the case for the HCs obtained via 2 h HTC treatment.
The oxygen content in the HCs decreases with increasing reaction temperature and residence time. This is also reflected in the lower atomic ratio O/C. Comparing the atomic ratios of the carbons with that one of the initial biomass, a strong decline can be noted. The atomic ratio H/C has almost halved. The O/C ratio is only one third of the initial ratio. These changes are also represented by the Van Krevelen diagram (Figure 1). Here, the HCs follow the ideal path of dehydration with a reaction time of two hours. In the case of HTC-240-2, in addition to dehydration, decarboxylation also has to be considered.
The carbon materials synthesized at higher temperatures and longer residence times show a higher degree of dehydration. Furthermore, as the HTC temperature rises, the chars move further to the left in the diagram, which indicates stronger decarboxylation. This is particularly noticeable in the case of HCs with a five-hour reaction time.
During HTC, the biomass is partly decomposed, resulting in two distinctive reaction pathways, from which one can be described as a solid-to-solid conversion, and the second, as a result of the polymerization/condensation of dissolved intermediates, liquid-to-solid conversion [30,31]. A solid, rich in carbon as well as gases, and organic compounds solved in process water are produced [32]. The carbohydrates in the biomass are partly hydrolyzed and broken down into sugar monomers. These monomers further react via dehydration to hydroxymethylfurfural (HMF). HMF then either decomposes into levulinic acid and formic acid or, as described by Jung et al., reacts via two interconnected pathways to HTC char [9,33]. Two interrelated steps are defined here. In the first step, the HMF polymerizes by water elimination, aldol condensation, and Diels-Adler addition to the so-called HTC char. Based on stoichiometric calculations Jung et al. proposed that the carbon content of fructose based HTC-chars cannot exceed 66.7 wt.% via the aldol-condensation formation mechanism. According to this conception further increase is based on decarboxylation, which can be observed in the Van Krevelen diagram [9,32].
The elimination of water and carbondioxide explains the mass loss of HTC chars during reaction. Furthermore, parts of the biomass are dissolved in the process water. Dehydration and decarboxylation can also be seen in the Van Krevelen diagram of HTC samples (Figure 1), as they are located below and left to the initial biomass in the diagram. This means that during HTC a loss of carbon, hydrogen and oxygen takes place. Mainly water elimination takes place, which is also shown through the lower atomic ratios of O/C and H/C compared to the initial biomass. At both residence times (2 h, 5 h), it can be assumed that water elimination reactions (dehydration and aldol-condensation) are almost completed, since the ash-free carbon content of the samples is approximately 66.7 wt.% and higher. This means that even with a residence time of two hours, the formation of HTC char does not only take place via aldol-condensation, but also decarboxylation takes place. This trend of decarboxylation continues with increasing residence time of HTC by a further left trend in the Van Krevelen diagram. However, the degree of dehydration no longer increases with increasing residence time, since the chars of both residence times are approximately at the same level (Figure 1). Thus, it can be concluded that the dehydration takes place at the beginning of the HTC process and is probably completed within two hours at each of the selected temperatures. However, decarboxylation of char is a slower step, due to a higher activation energy [34]. Although it also takes place, to a certain extent, during the reaction time of two hours, it is even more noticeable during the reaction time of five hours. Jung et al. also made the same observations and assumptions concerning the time span of dehydration and decarboxylation in the synthesis of HTC carbons from fructose [13].
Decarboxylation is also the reason why the carbon yield decreases at both residence times with increasing temperatures, but at the same time the elementary carbon content in the char increases. By splitting off a carbonyl group, carbon and oxygen, which were originally part of the carbohydrates in the biomass, convert into the gas phase and are therefore no longer found in the final solid product. This carbon deficit thus reduces the carbon yield. As already stated above, the degree of decarboxylation increases with increasing severity of the reaction parameters, which also explains the decrease of the yield within the same residence time at increasing temperatures and within the same temperature at increasing residence time. Since, however, the amount of carbon atoms decreases during the splitting, but twice as much oxygen as carbon is split off, the non-carbon content in the char decreases twice as fast as the carbon content and thus leads to an increasing elementary content of carbon, but also to a lower mass and carbon yield with increasing degree of carboxylation.
The lower ash content of the HTC char compared to biomass can be explained by the fact that during the HTC process, mineral components are leached into the process water by the acids formed in the process water. Here it can be observed in the series with a residence time of five hours that the ash content decreases with increasing HTC temperature, which allows the assumption that higher reaction temperatures lead to an increased leaching of mineral components. Thus, the significantly higher ash content of PCs is also attributed to this, because since the PCs were not hydrothermally pre-treated, all mineral components remained in the char and the percentage of mineral content has more than tripled compared to initial biomass due to the high mass loss during pyrolysis.
According to Hoffmann, Jung et al., the ash content in the HTC char also decreases with increasing temperature and residence time [14]. This finding is confirmed by the results of the carbon materials obtained via HTC with five hours reaction time.

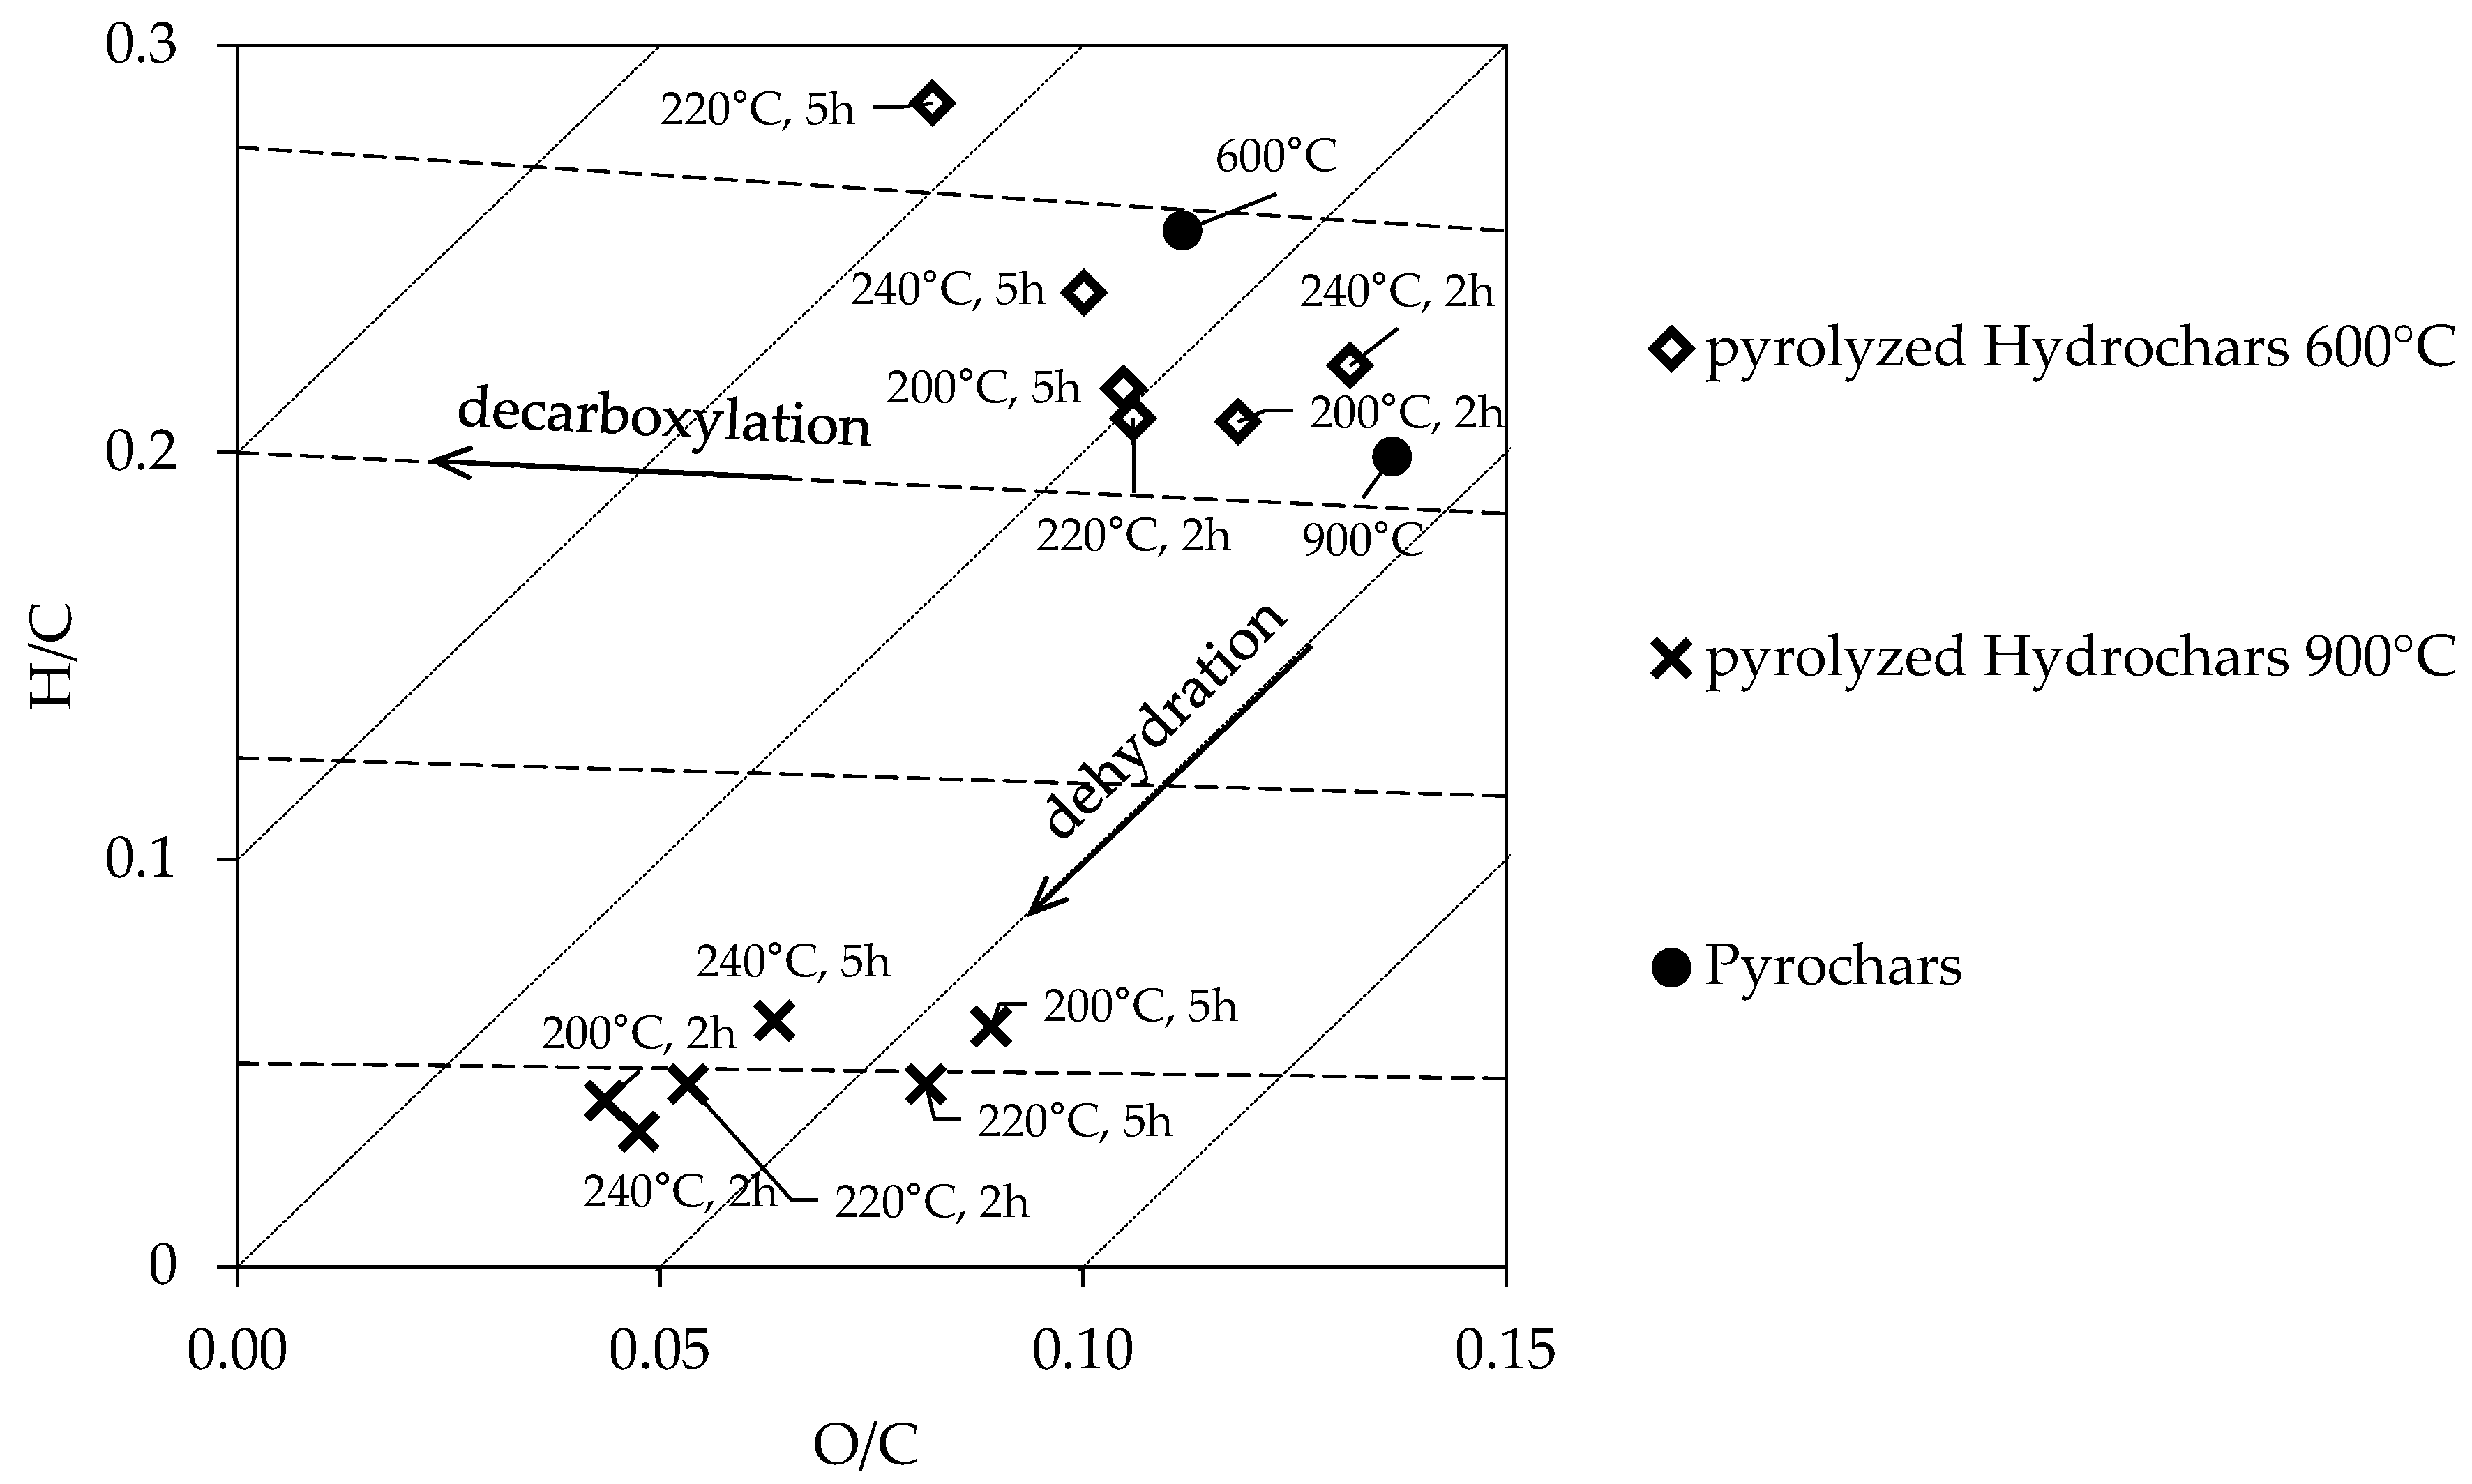
3.1.2. Pyrochars and Pyrolyzed Hydrochars

Comparisons among the pyrolyzed samples are governed by elucidating the difference between PCs and PHCs. In the following a summary of the most noticeable differences is given. It can be observed that PHCs have a remarkably higher carbon concentration than the PCs. While PHC600 range from 76–80% and PHC900 from 81–87%, the PC600 has 69%, and PC900 67%. Vice versa the ash-content is higher in the PC samples, which is 16–17%, compared to the PHCs, which all lay between 3–6%. In terms of carbon efficiency, the PHC conserve less carbon in the char than the PC, the drop in carbon yield is maximum 6%. The nitrogen content in the PHC is approximately 1–1.5% higher compared to the PCs samples. The PHC900 samples have hydrogen content between 0.2–0.4%, whereas PHC600 and PCs range from 1–2%. Due to the low hydrogen content, the PHC900 samples appear lower in the Van-Krevelen diagram than the PHC600 and PCs (Figure 2).
After pyrolysis, the carbon content of the samples reached up to 84 wt.% (600 °C pyrolysis temperature) and 90 wt.% (900 °C pyrolysis temperature) (Table 1). This increase is due to the mass loss of volatile, oxygen-rich compounds at high temperature treatments. The loss of hydrogen is due to the volatility of remaining compounds in the HTC coal and the oxygen loss as shown in the Van Krevelen diagram in Figure 2 due to continued decarboxylation. As expected, the higher the pyrolysis temperature the higher the carbon content. In addition, PHC600 samples have a significantly higher proportion of oxygen due to the lower pyrolysis temperature. The nitrogen content is almost similar within PHC600 and PHC900 samples. It is therefore assumed that nitrogen is mostly embedded in thermally stable compounds, such as pyridine or pyrrole groups in the carbon matrix and is only found to a small extent in thermally unstable functional groups on the carbon surface [35].

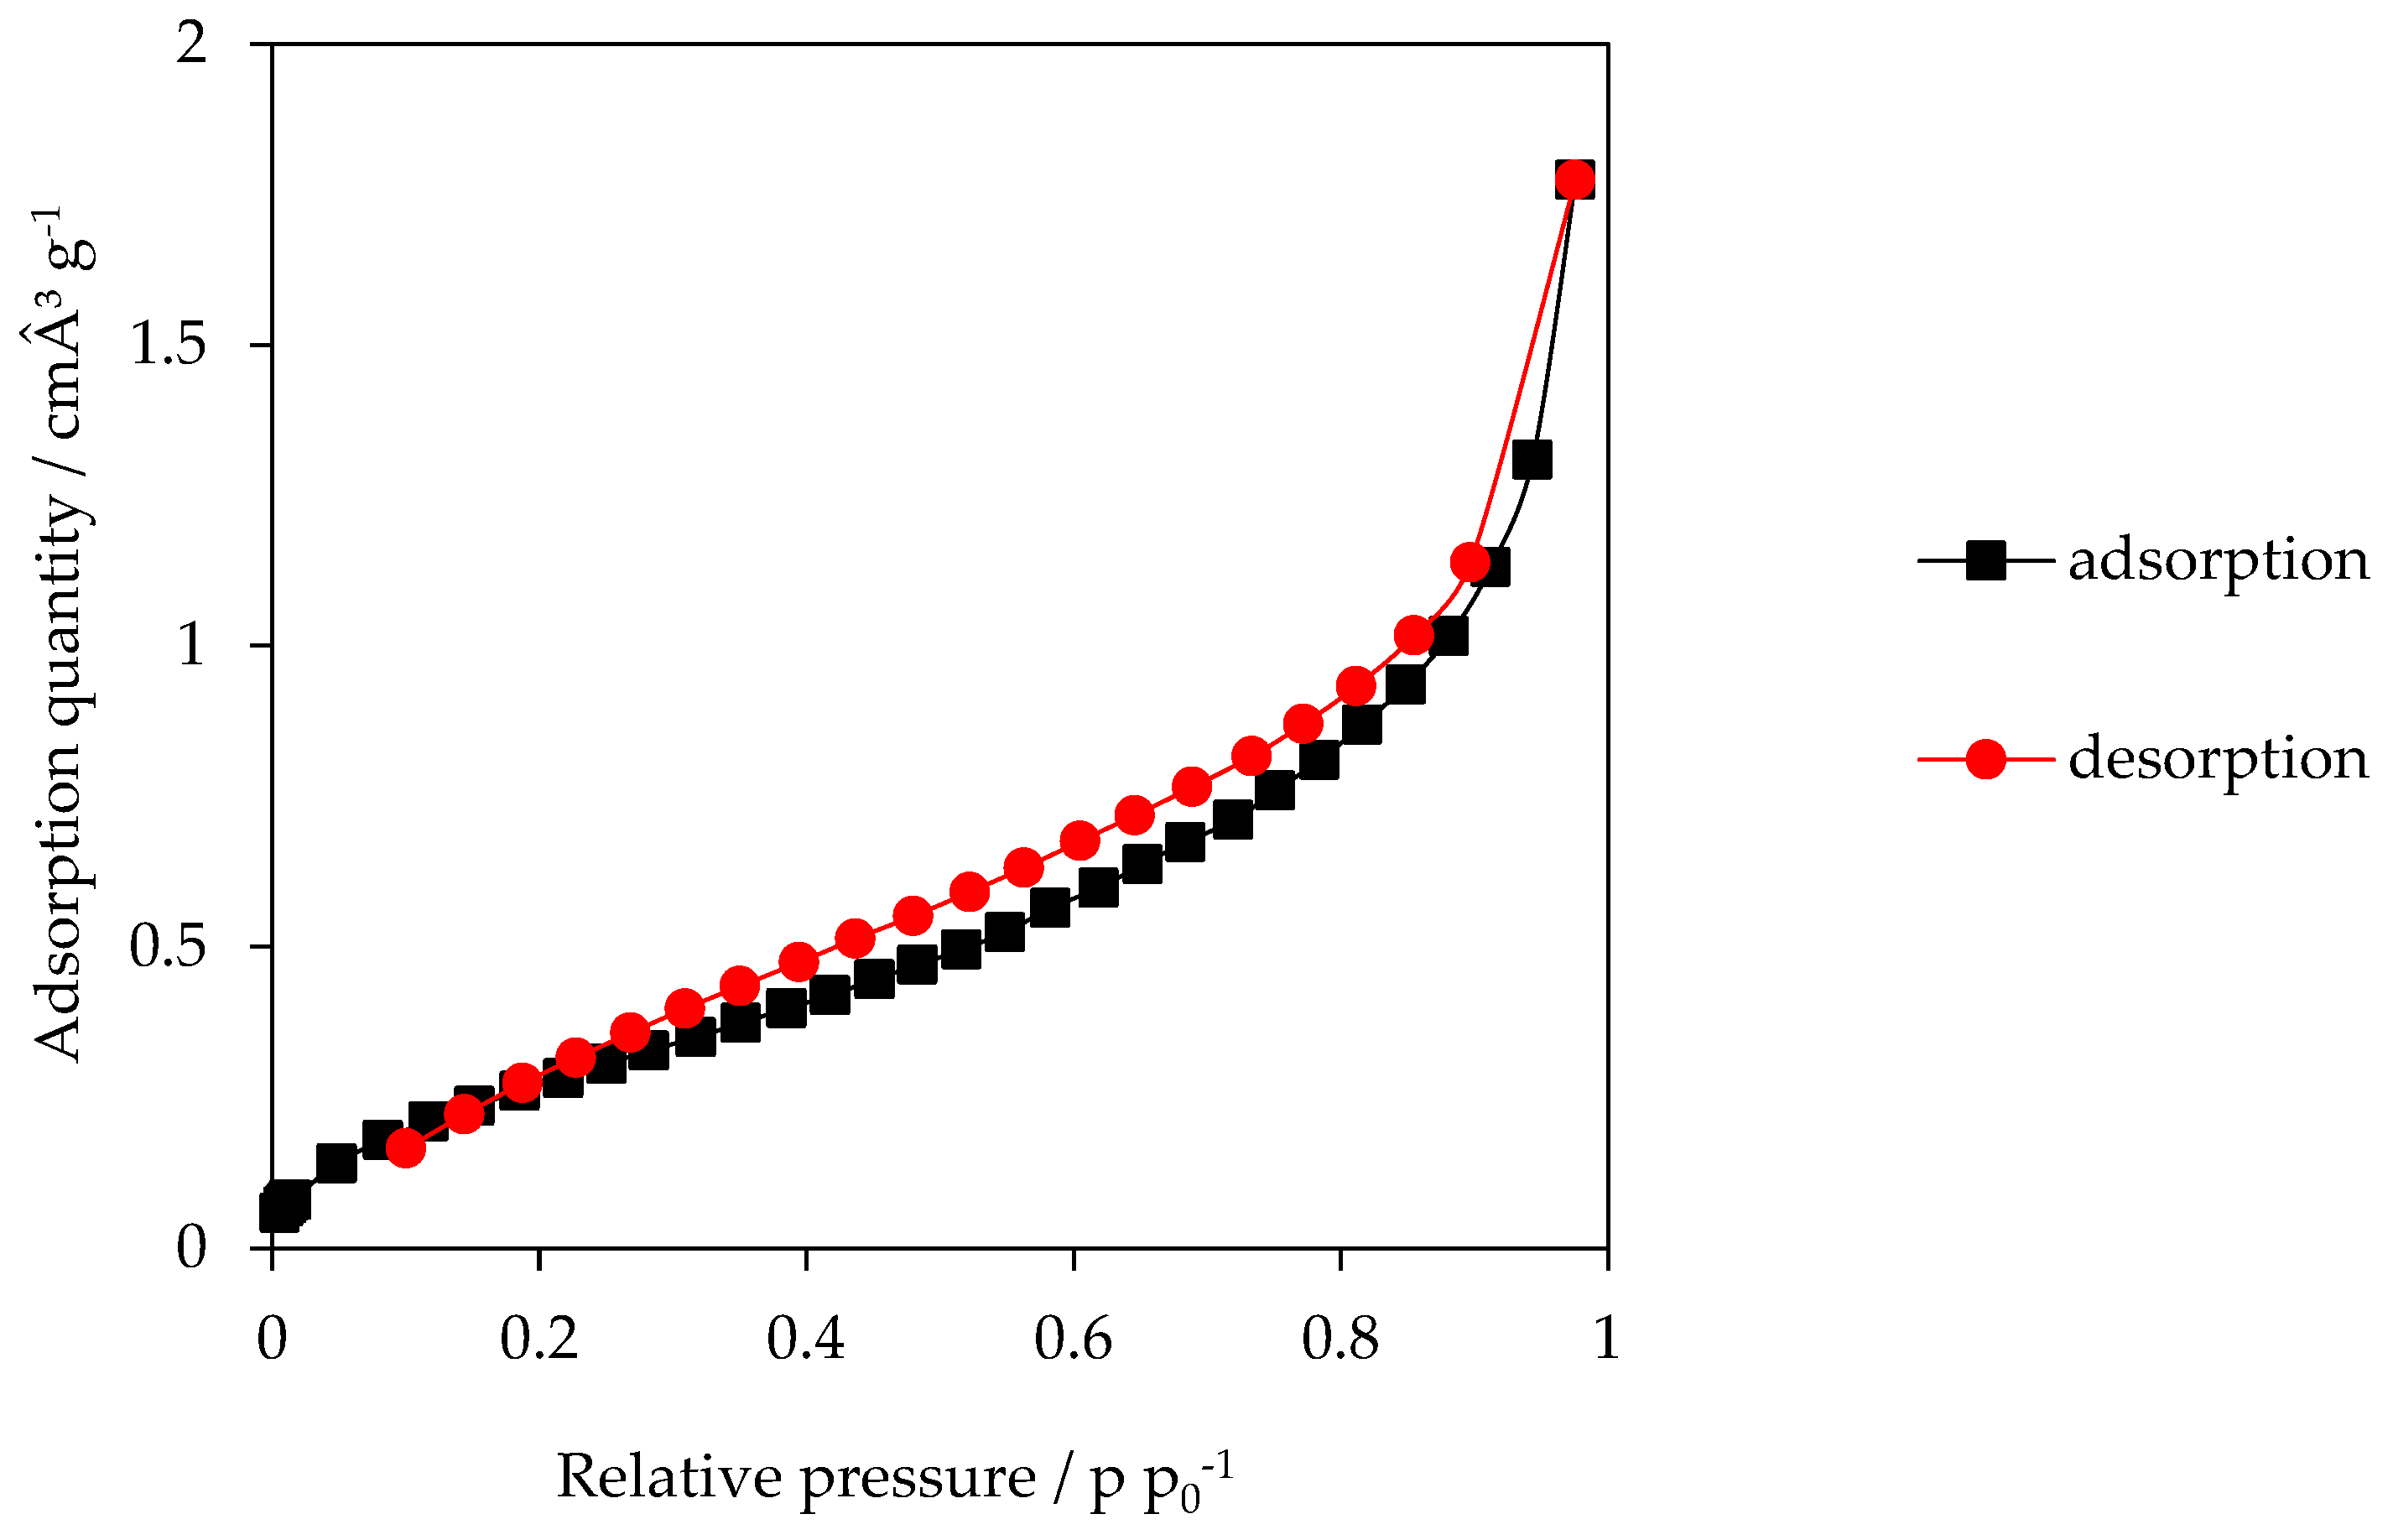
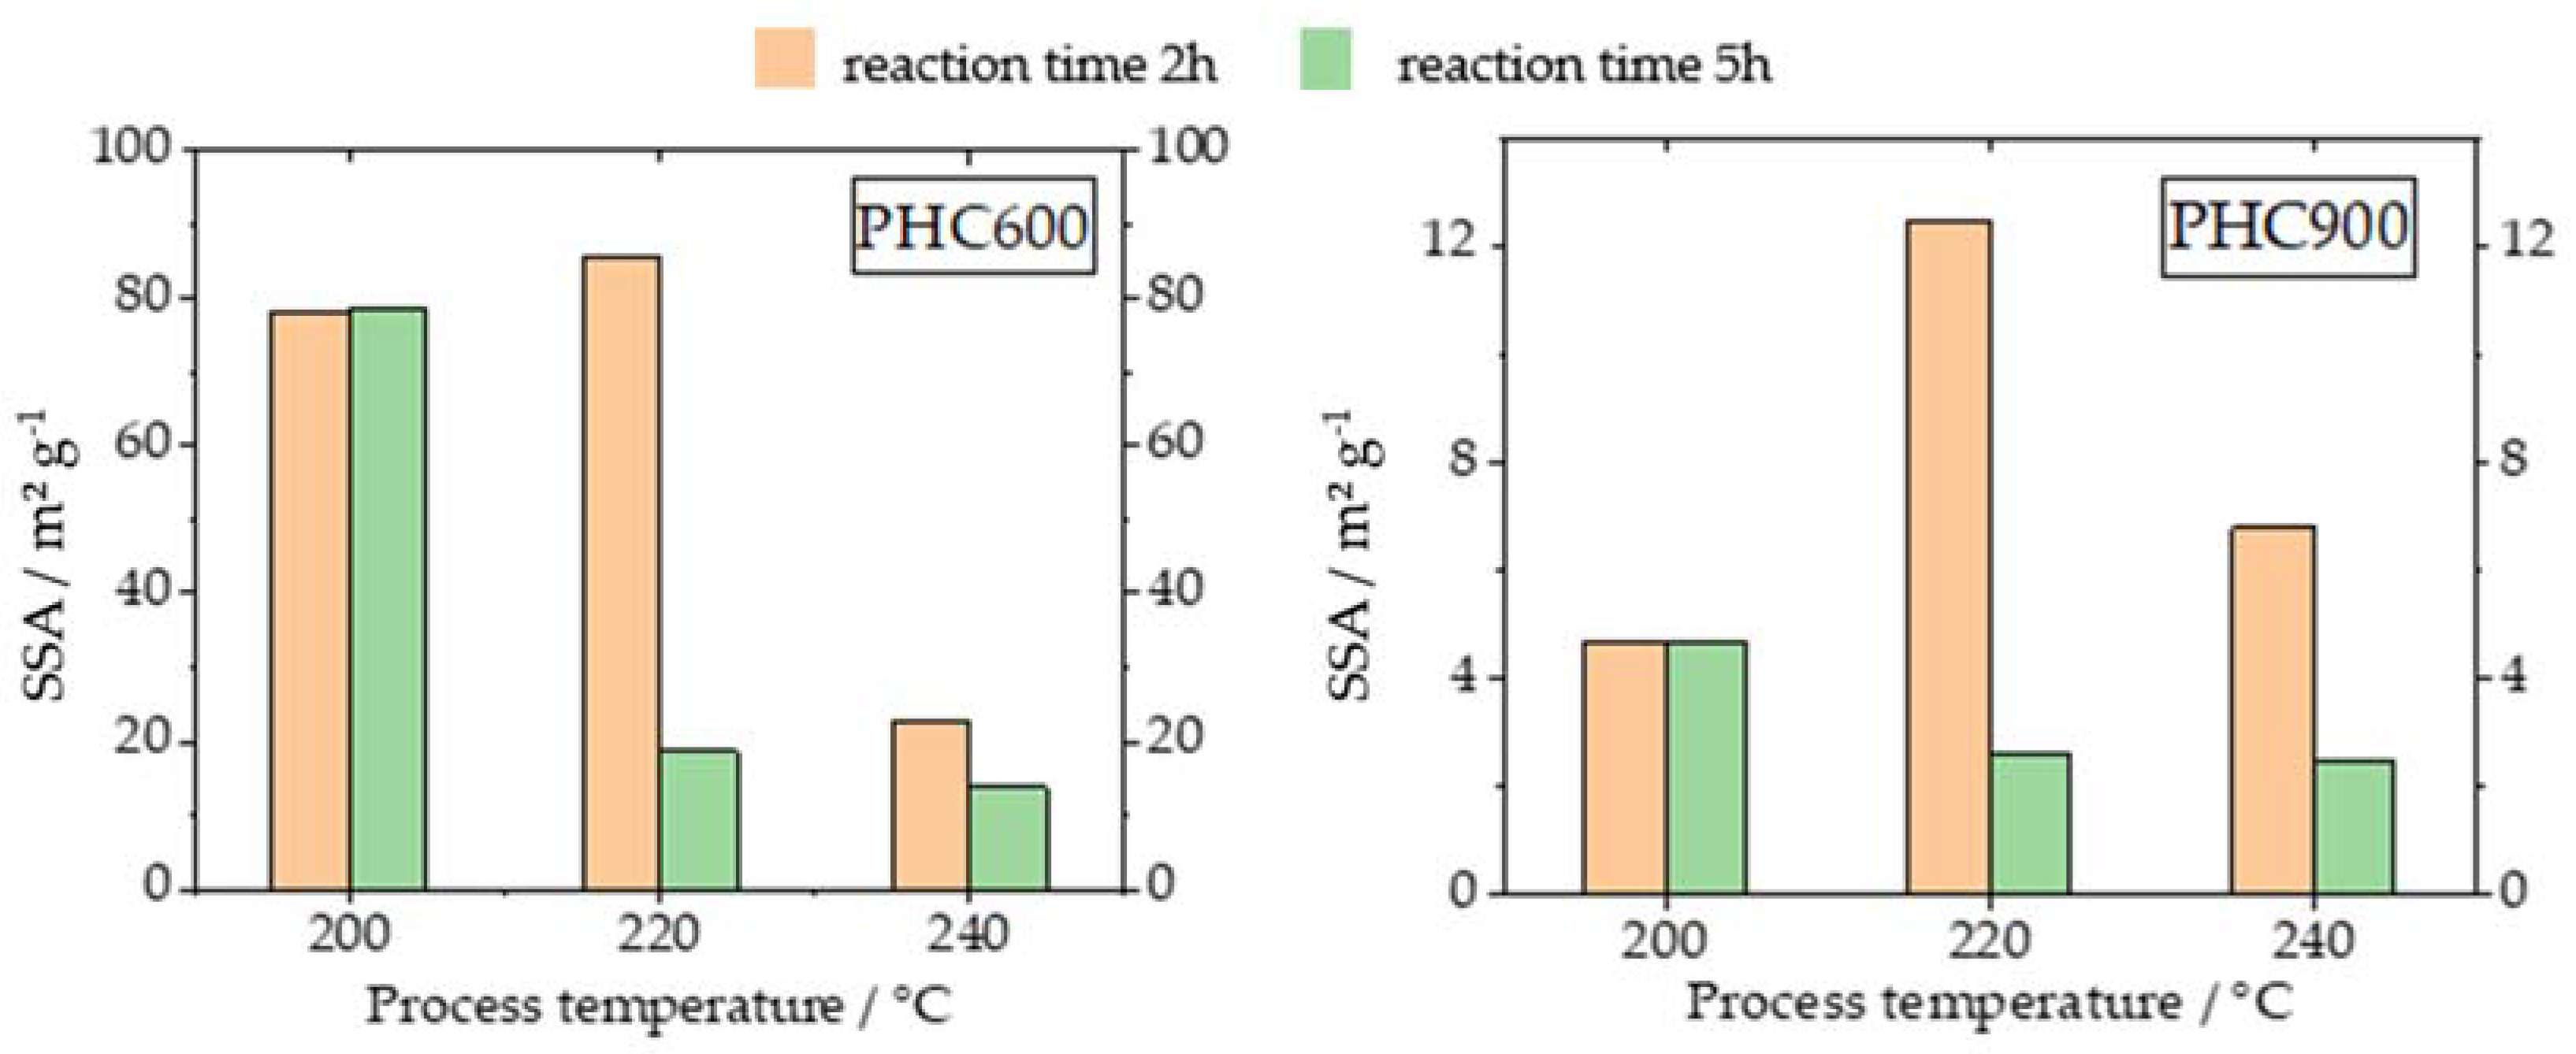
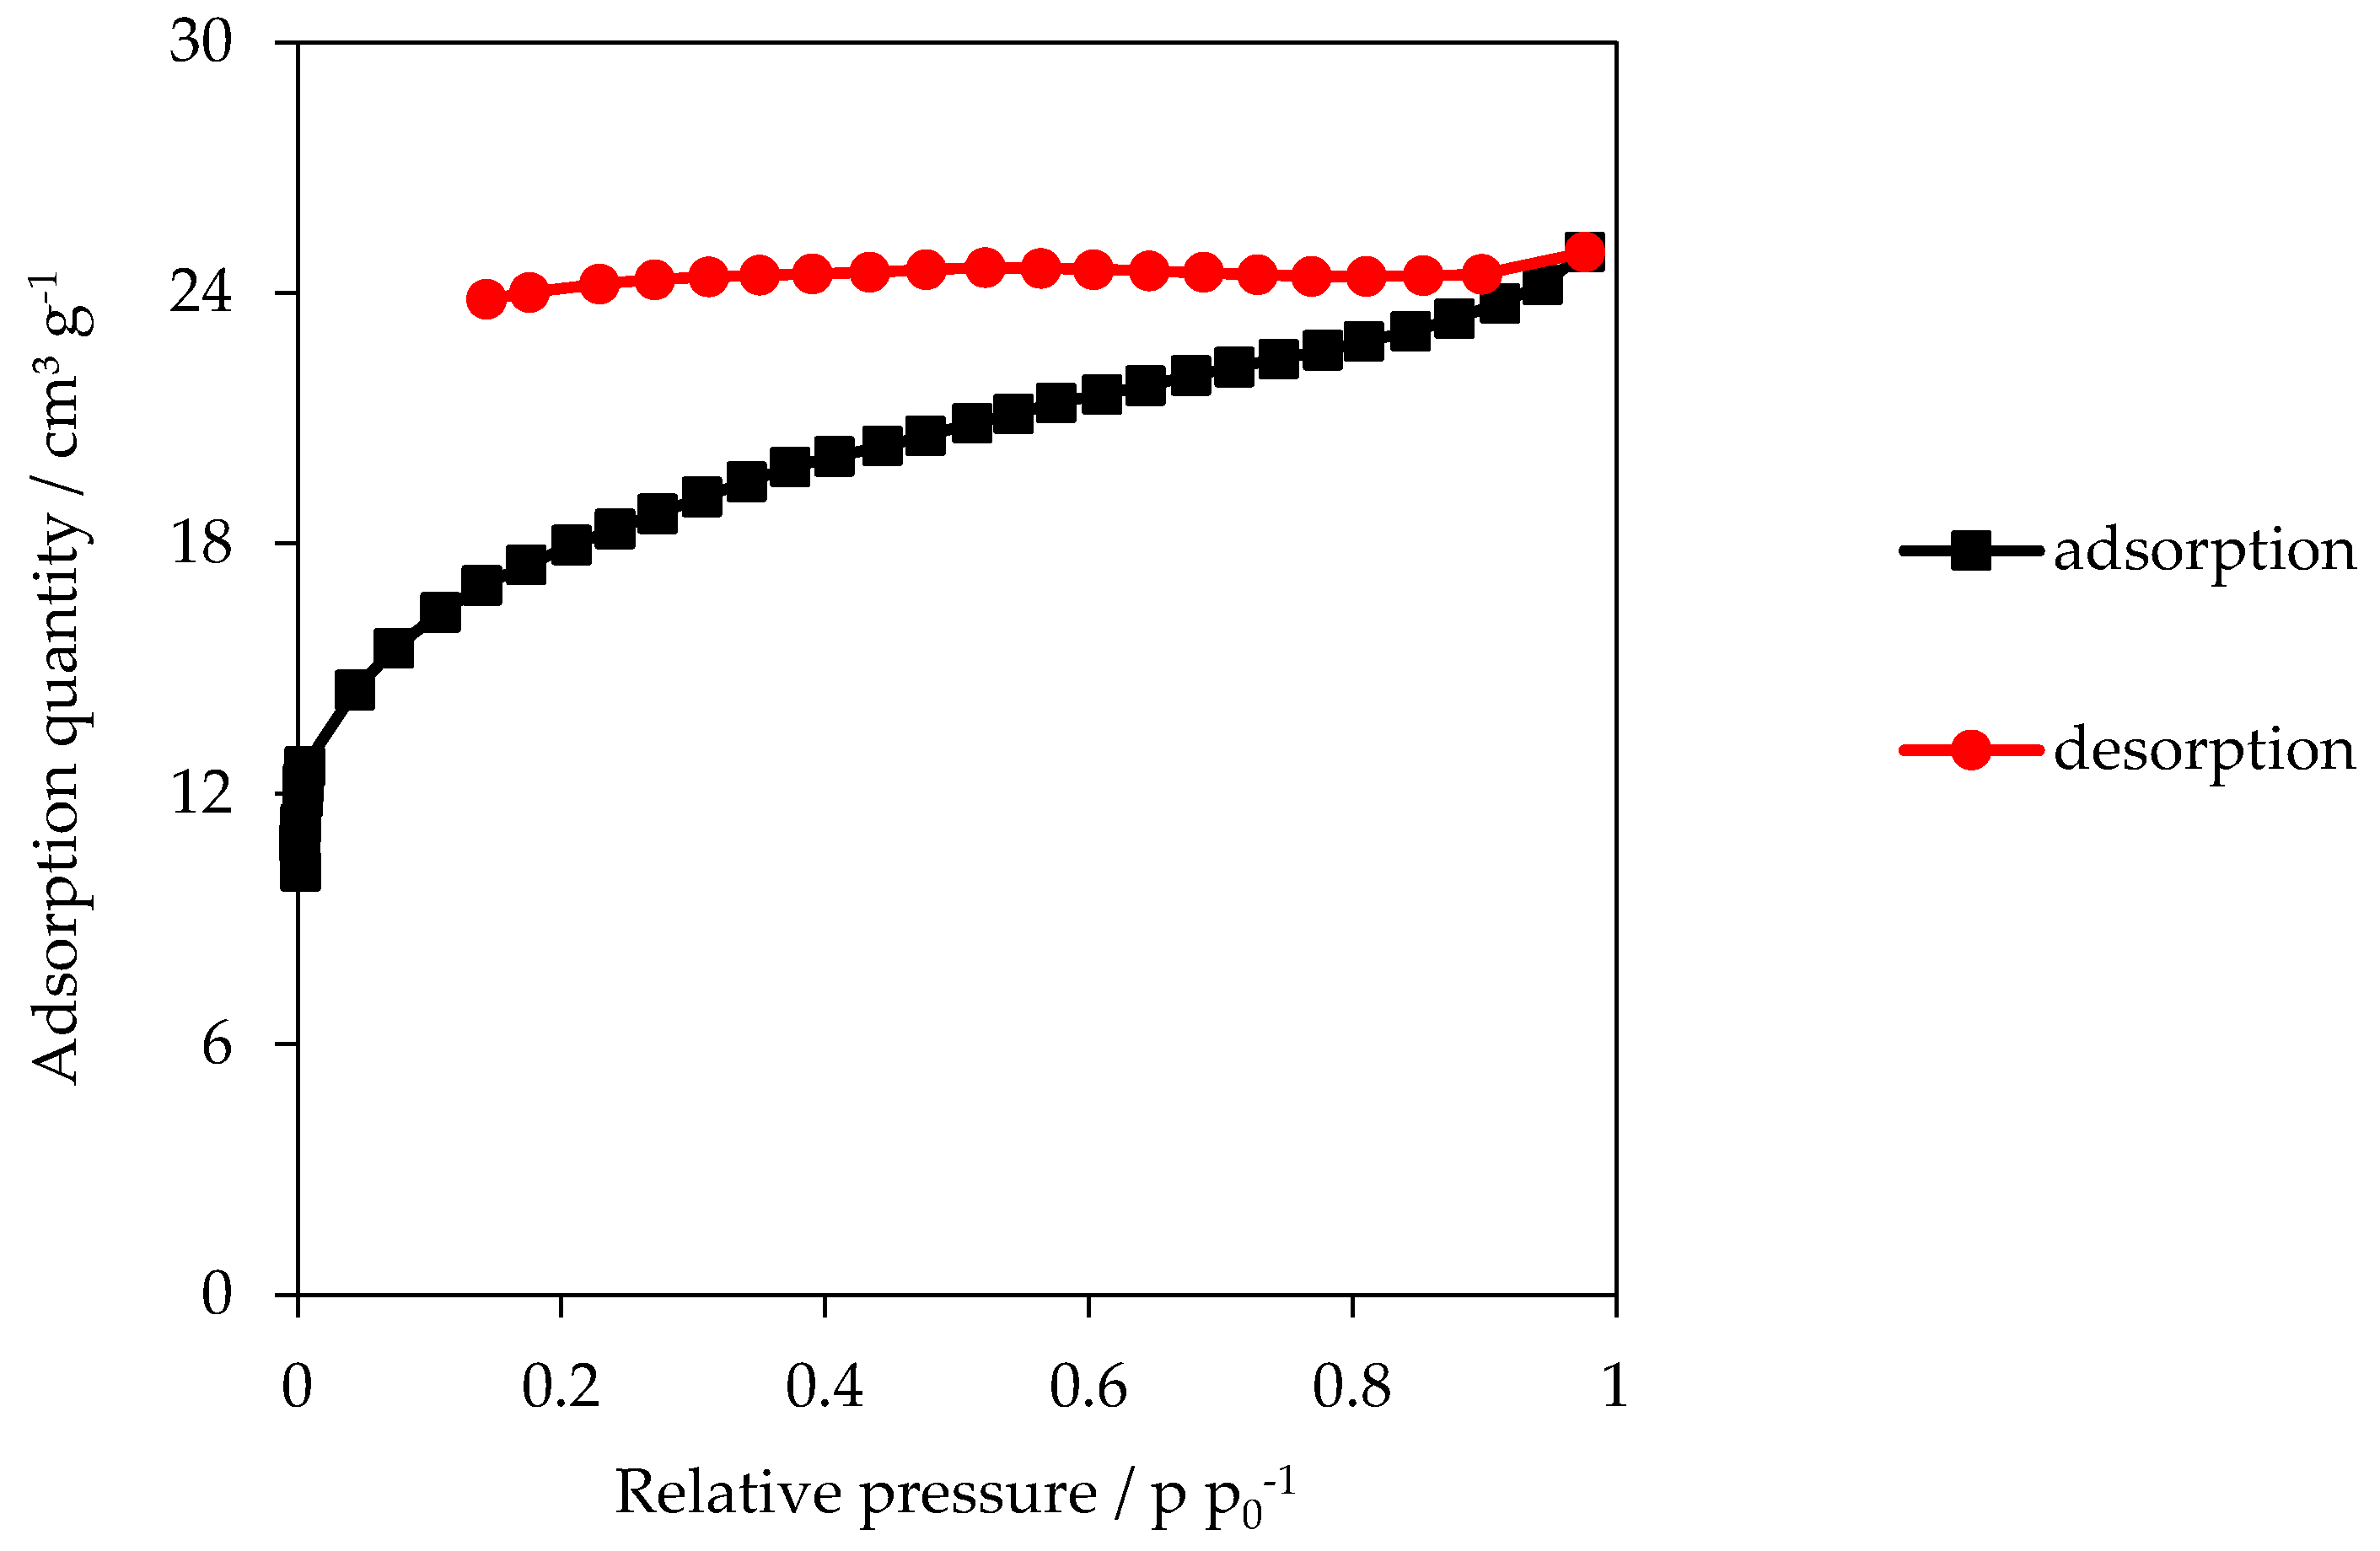
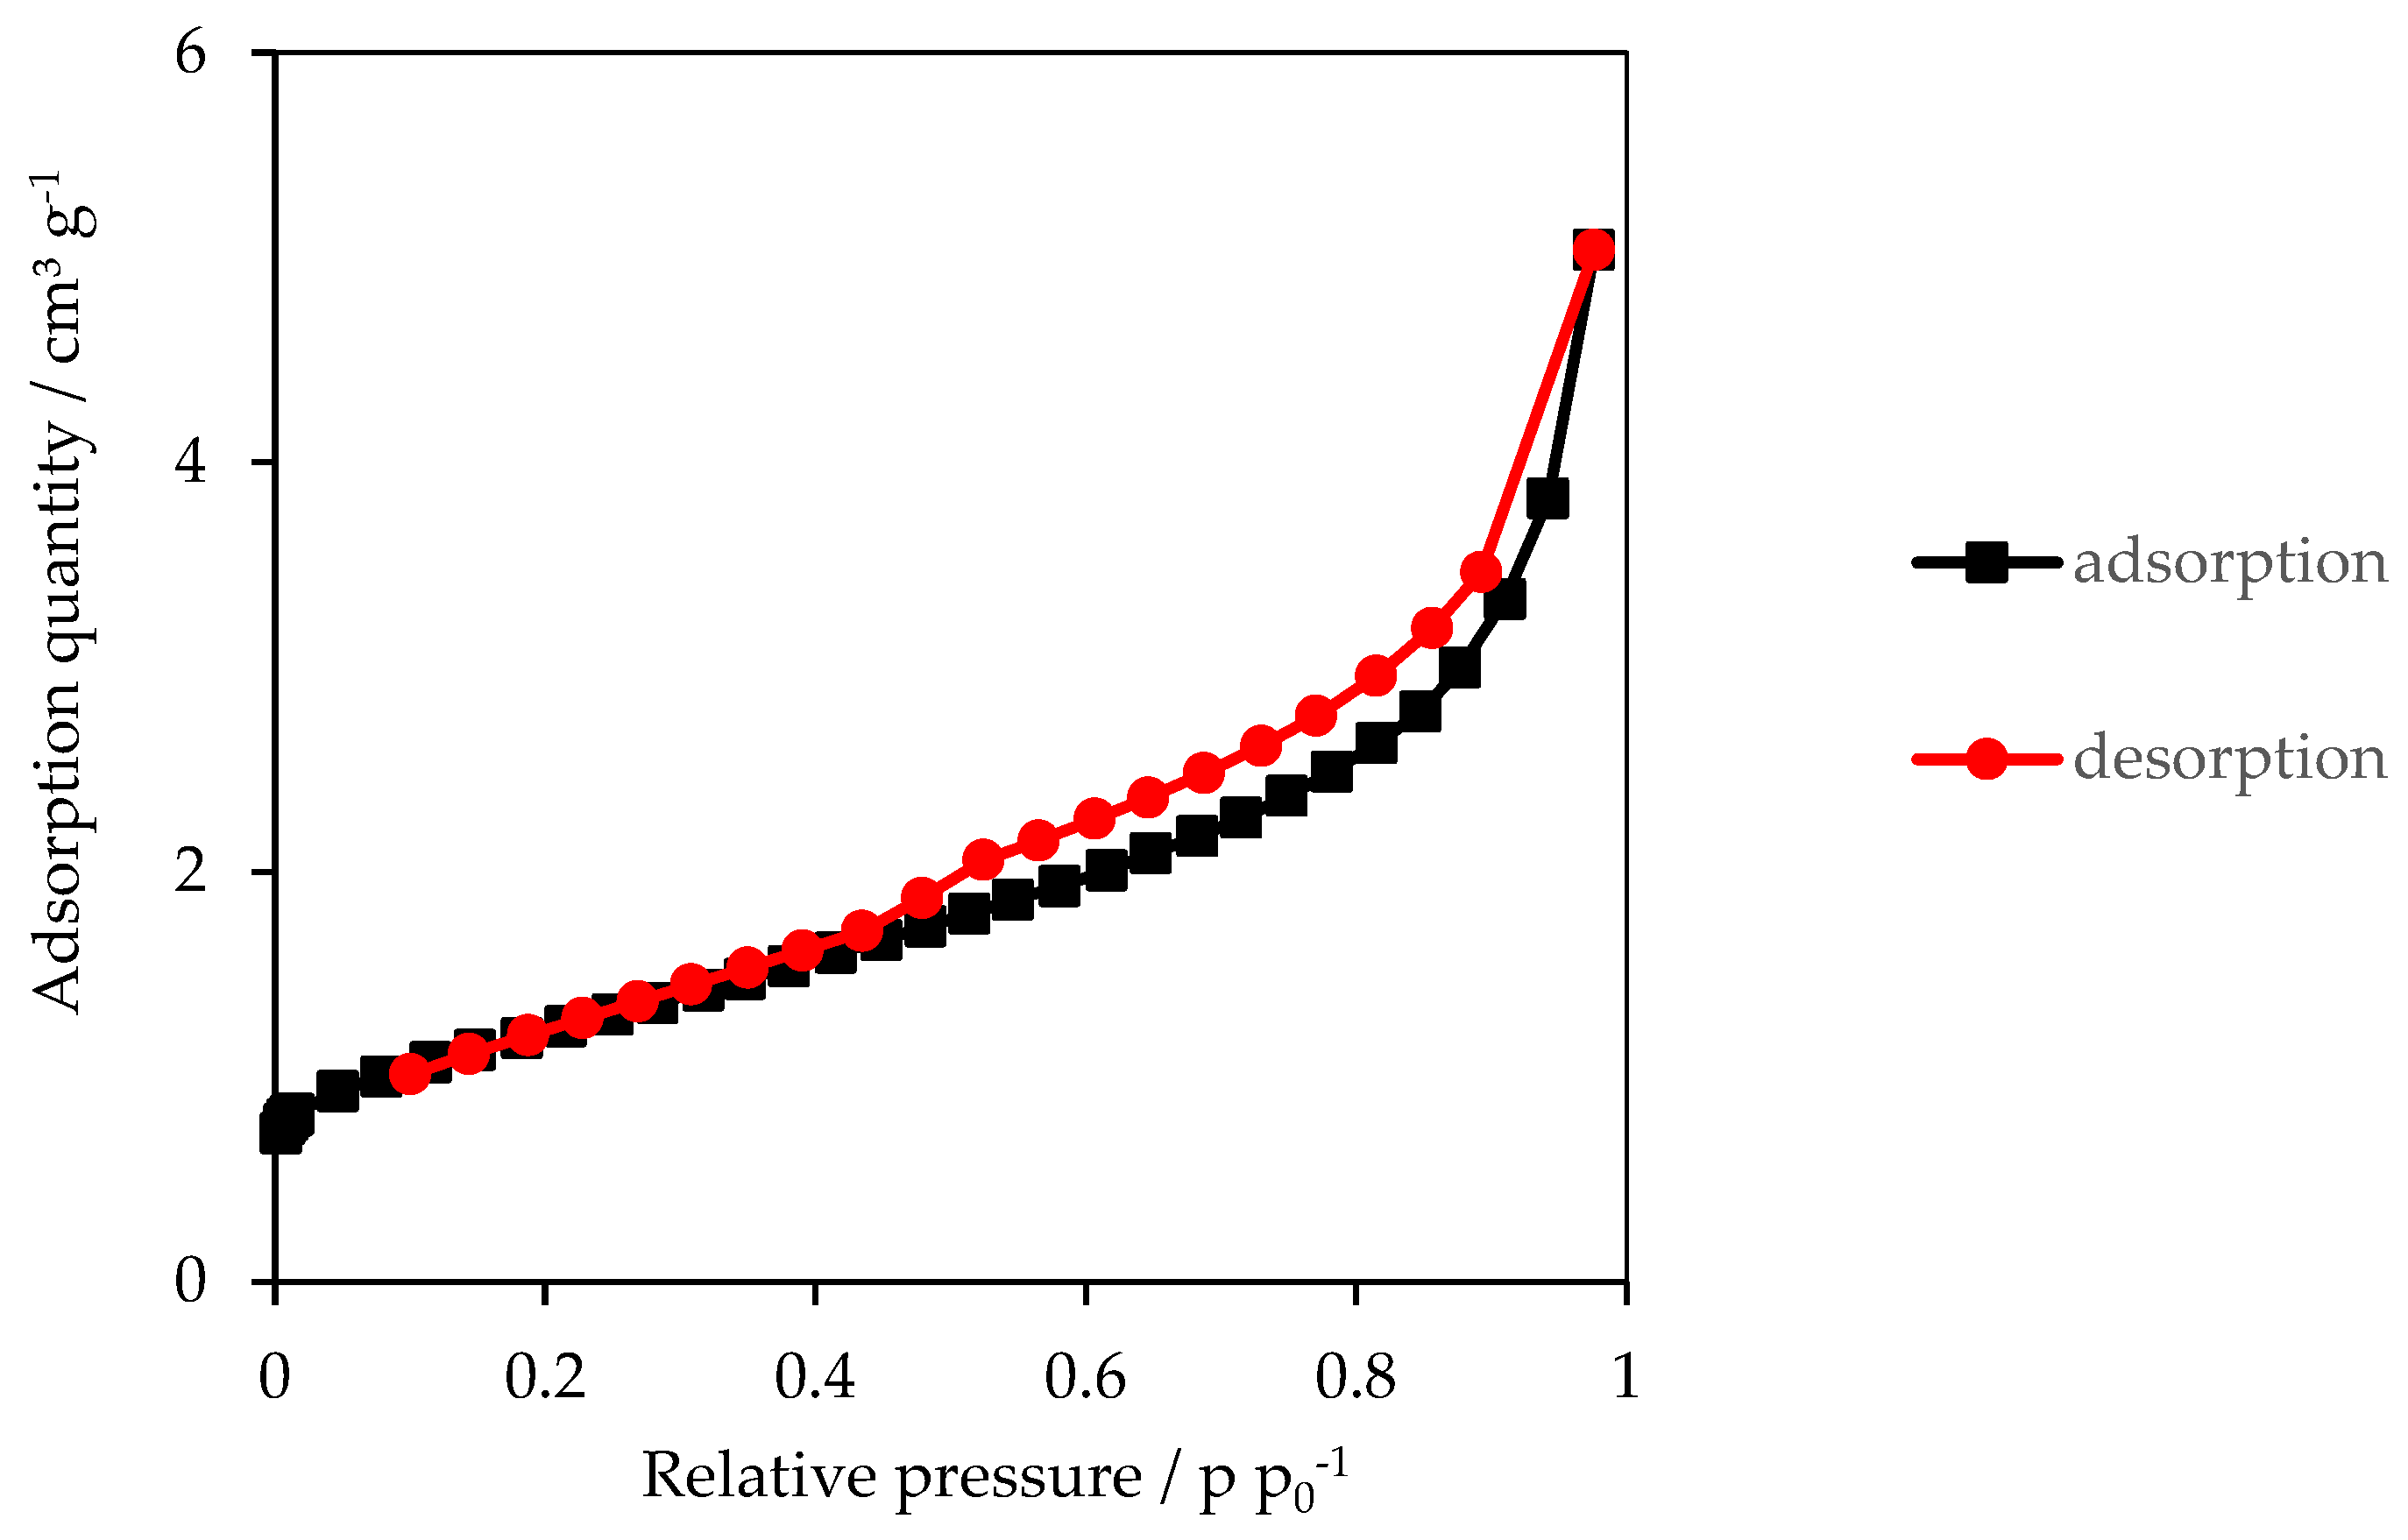
3.2. Specific Surface Area (SSA)

All HCs show very low SSA values between 1–2 m2 g−1 with the tendency that higher HTC temperatures lead to HCs with smaller SSA values.
According to the International Union of Pure and Applied Chemistry, the isotherm of the HTC-200-5 shown in Figure 3 is classified as TYPE IIb due to its course. At the beginning of the measurement at a low pressure the isotherm runs concave until it then changes into a linear form in the middle pressure range and finally behaves convex in the highest pressure range [36]. The isotherm of HTC-200-5 shown below can be seen as representative for all other HC samples.
For both the P600 and the P900 carbons, Table 2 shows that SSA values obtained from measurements with nitrogen decrease with increasing residence time. However, this effect only occurs at higher HTC temperatures and mainly at the temperature of 220 °C (see Figure 4).
The PHC600 samples have SSA values between 13–85 m2 g−1, and are therefore significantly higher than the HC’s.
In the case of PHCs produced via pyrolysis of HCs obtained from five-hour HTC, it can be observed that the surface of the PHC decreases with increasing temperature of the HTC. Furthermore, the surfaces of the PHC600 made of two-hour HCs are significantly higher than those of the corresponding HCs with the longer residence time of five hours (Figure 4).
The adsorption isotherm behaves similar to that one of HC samples. However, it is noticeable that the desorption does not follow the adsorption, represented by the open hysteresis, suggesting a pore condensation in the mesopores [36]. The isotherm of P600-200-5 shown below (Figure 5) is representative for all other isotherms of PHC600 samples.
The SSA values of PHC900 samples are only slightly higher than those of HCs and significantly lower than those of the other PHC samples. According to IUPAC, the course of the isotherm can be classified as TYPE IIb. Adsorption and desorption are not completely reversible in the higher pressure range. The isotherm below is representative for all PHC900 samples (Figure 6).
The observed open hysteresis for PHC600 and the irregularities in the adsorption–desorption process of PHC900 indicate that the pores were not accessed properly by the adsorption gas nitrogen. Therefore, the SSA of selected samples was also assessed with CO2 as adsorption gas; the results are listed in Table 2.
The highest SSA values were measured for PHC600, which was produced with the mildest HTC conditions. Both the P600-200-2 and the P600-220-2 show a SSA of 293 m2 g−1 and 290 m2 g−1, respectively. The residence time has a significant influence on the SSA: within the carbons with two hours residence time, the PHC600 shows no change with higher temperature, for the carbons with five hours residence time, however, a decline of SSA with increasing temperature of HTC is observed. Comparing PC600 with PHC600, the PC has only a slightly smaller SSA with 273 m2 g−1.
With a wide range from 89 m2 g−1 to 330 m2 g−1, the SSA of PHC900 partly ranks below and partly above the PHC600 chars. The carbon with the highest SSA is P900-200-5 with 330 m2 g−1.
The influence of reaction time on SSA for the PHC900 samples is exactly inverse to the effect observed for the PHC600 samples. Here, the carbon with the longer residence time has a higher SSA than the corresponding sample with the two hours residence time. In the test series of the PHC900 with the two hours residence time of HTC, the influence of the rising HTC temperature can be seen very clearly. At an increase of 20 °C, SSA already decreases by more than two thirds. This negative influence of the rising HTC temperature on the SSA has already been observed to a smaller degree for the PHC600. The PC900 has a much lower SSA of 2.3 m2 g−1.
PHC600, the sample with the highest EC also shows the highest bulk density and the largest SSA within the pyrolyzed chars (Table 2). This leads to the conclusion that pyrolysis has a positive influence on SSA and increases the bulk density. In addition, the higher bulk density and the higher SSA increase the EC. The higher bulk density shows that the total contact area between the carbon particles is increased, which favors the electron flow and thus confirms the theory of Holm et al. [25] and the results of other studies with bio-based carbon powders [13,14].
It is worth noting that the PC600 has almost the same EC as the sample within the PHC600 series with the highest EC. However, the bulk density is twice as high as that of the PHC600. The same applies to the PC900 and PHC900. However, the EC of PC900 remains far below the EC of PHC900. This is most likely due to the higher ash content of PC900, which results from the higher mass loss and the higher pyrolysis temperature. In addition, the PC900 has a high elemental O content and a higher atomic ratio of O/C. The presence of O indicates the presence of functional groups which additionally hinder the electron flow [37] and thus in combination with the high ash content lead to a poor EC. In addition, the PC900 with 2.3 m2 g−1 also has an extremely low SSA, which confirms the assumption that a higher SSA is favoring a high EC due to better particle contact.
In contrast to PC900, PHC900 shows a higher SSA and better EC values. The increase of EC with increasing pyrolysis temperature is due to the higher degree of graphitization with increasing temperature accompanied by changing from an amorphous to a crystalline structure [4]. This can also be deduced from the decreasing atomic ratios H/C and O/C. The carbon atoms are increasingly converted from their current sp3-hybridisation into sp2-hybridisation state, or in other words from aliphatic to aromatic [38].
Comparing the different EC values of PHC600 and PHC900 (Table 2), the lower EC of PHC600 is assumed to be the consequence of the oxygen groups remaining in the PHC600, which reduce the electron flow. Thus, the higher O/C ratio associated with the polymerisation of HMF is also considered to be the reason why PHCs in general have a higher EC than their corresponding PCs. During the HTC, aromatic systems are already formed, connected to each other [39] and then poly-condensate during pyrolysis. Pyrolytic carbon materials, which underwent the HTC as pre-treatment, have scattered accumulations of π bonds in their molecular structure. This leads to a higher EC compared to the corresponding PCs, which were not pre-treated and thus do not contain these pre-ordered structures.
Based on the results of SSA and EC measurements, it is assumed that at a moderate pyrolysis temperature (600 °C) of HTC carbons with the shortest residence time and moderate HTC temperature (220 °C) lead to the best results concerning EC.
Regarding PHC900 series, it is emphasized that at a high pyrolysis temperature such as 900 °C of HTC carbons produced via the most intense HTC conditions lead to the best EC values. It is assumed that the HTC carbons, which are thermally more stable due to more severe reaction conditions are better graphitizable at the high pyrolysis temperature [17].
Considering the course of EC for PHC900 and PHC600 with increasing compression, an increase in EC is observed which again supports Holm’s contact theory. However, it can also be concluded from the course of the graphs that intrinsic EC is the determining factor for total EC and not the compression rate [14]. This is confirmed by the fact that no graph cuts the other at one specific compression level. The compression just increases EC and leads to an approximation to the intrinsic EC value. Concerning EC and bulk density of the PC600, the sample with the highest EC also has the highest bulk density and, accordingly, the char with the lowest EC has the lowest bulk density. Similar results were obtained by Sánchez-Gonzáles et al. and Hoffman et al. [13,17].
Regarding bulk density, a decreasing tendency with increasing temperature and residence time was observed for the HTC chars. This trend is due to the fact that with the increasing severity of the reaction parameters, more volatile substances are being gasified, resulting in a higher porosity of the carbon [40].
Regarding SSA and pore size distributions of the carbons, the isotherms of the HTC carbons have been classified as type II B. This means that the pores are not accessible for the adsorption gas or that the material contains mainly micropores with a diameter of more than 50 nm [41]. Based on the course of the isotherm, it can be concluded that according to Sing, K.S.W. et al. the adsorption gas diffuses into the micropores in the low-pressure range and forms a first mono-layer on the pore surface. With increasing pressure, the nitrogen molecules also diffuse into the meso- and macropores and form multilayers on the carbon surface. The transition point from concave to linear is also called the transition point from single-layer to multi-layer deposition [41].
The isotherms of PHC600 carbons have an open hysteresis (Figure 5). Open hysteresis can occur in carbon-rich materials with a multilayer physisorption and indicates condensation of the adsorption gas in the pores. If the forces between adsorbent and adsorptive are rather weak, instability will occur above a certain thickness of the multi-layer. As soon as the intramolecular forces between the adsorptive particles become stronger than those attaching molecules to the adsorbent, the multilayer is not preferred anymore and a condensate phase is formed. The adsorption continues until the pore is completely filled and full desorption is not possible anymore [36,42]. This results in adsorption and desorption isotherms with an open hysteresis, as seen very well for the PHC600 samples. The turning point from the concave to the linear course is also called the transition point from single to multilayer formation. Since the transition point is rather moderately pronounced, it is concluded that the formation of monolayer and multilayer are overlapping [38]. The desorption takes place with great delay and an open hysteresis occurs, indicating the presence of bottle pores. Since the hysteresis has a very weak slope, it is concluded that the pores are mostly irregular [36,42].
The isotherms of the PHC900 were classified between type II B and type 3 (Figure 6). This indicates that the forces between adsorbate and adsorbent are very weak and the adsorbed molecules are distributed unevenly in clusters over the surface of the material, indicating a macro-porous to non-porous carbon structure [36,43]. Due to the open hysteresis for PHC600 and the uneven course of adsorption and desorption for PHC900, a certain amount of micropores in these materials is assumed, which was confirmed by SSA analysis with CO2.
The obtained SSA results with CO2 as adsorptive are much higher than those of the measurement with N2 (Figure 4), because CO2 measurements are carried out at room temperature and therefore the molecules can access much smaller pores than N2 at the temperature of liquid nitrogen (due to a kinetic inhibition) [41,42]. For PHC600 the results are up to 10 times higher and SSA of PHC900 increases up to 82 times. That is why a large proportion of micropores is suspected in both PHC600 and PHC900 [42,44]. It can also be concluded from these results that PHC600 has a higher proportion of macro- and meso-pores than PHC900, because higher SSAs were measured in the nitrogen surface measurement for PHC600. This leads to the conclusion that a high pyrolysis temperature of HTC chars leads to a microporous structure. The highest increase in SSA was measured with CO2 for the sample P900-200-5. Due to the pyrolysis, remaining volatile substances in the HTC-200-5 were volatilized and a microporous structure could be generated. This has already been observed by Hoffmann, Jung et al. for bio-based carbons from vineyard residues [14].
The content of volatile components in the HTC chars can be estimated based on FT-IR results. The first peak at wavenumber of 800 cm−1 is assigned to aromatic C-H bonds, which bend out of a planar like a kind of shear [45]. The next peak is a large peak with several small intermediate peaks. This ranges from 950 to 1470 cm−1 and indicates the presence of stretching C-O compounds of a hydroxyl, ester or ether group. In addition, bending O-H connections are also assumed in this wave number range [46]. The large peak at 1600 cm−1 together with the peak at 1450 cm−1 indicates the presence of aromatic ring structures due to the vibrating aromatic C=C bond [46]. Another peak can be found at wave number 1710 cm−1. Here C=O bonds from carbonyl, ester, or ether groups are assumed [46]. Furthermore, the double peak at 2340 and 2360 cm−1 is interpreted as C=N bond [36] and the peak at 2920 cm−1 is associated with stretched aliphatic C-H compounds [47,48,49].
Last but not least, the large broad peak, which begins at 3000 cm−1 and then changes from 3400 cm−1 into narrower peaks indicate oxygen groups in the form of stretching O-H groups from hydroxyl- or carboxyl groups [47].
Each sample, except P900-200-2, of the PHC900 series has a more or less strong double peak at wave number 2360 cm−1 and 2330 cm−1. This double peak is attributed to a stretched C=C or C=N bond. This assumption is supported by the elementary share of nitrogen of 3–4%. Additionally, due to the mentioned C=C double bonds a certain degree of graphitization is assumed [47,50].
Regarding the PHC600 samples, P600-200-2 and P600-200-5 show a peak at 1070 cm−1. This is interpreted as C-O bond of a secondary alcohol [49]. With increasing temperature, many small peaks in the range of wavenumbers 1700 cm−1 to 2200 cm−1 are detected in this sample series. Most likely, this is a signal by H2O molecules due to the moisture content in the material [48,49].

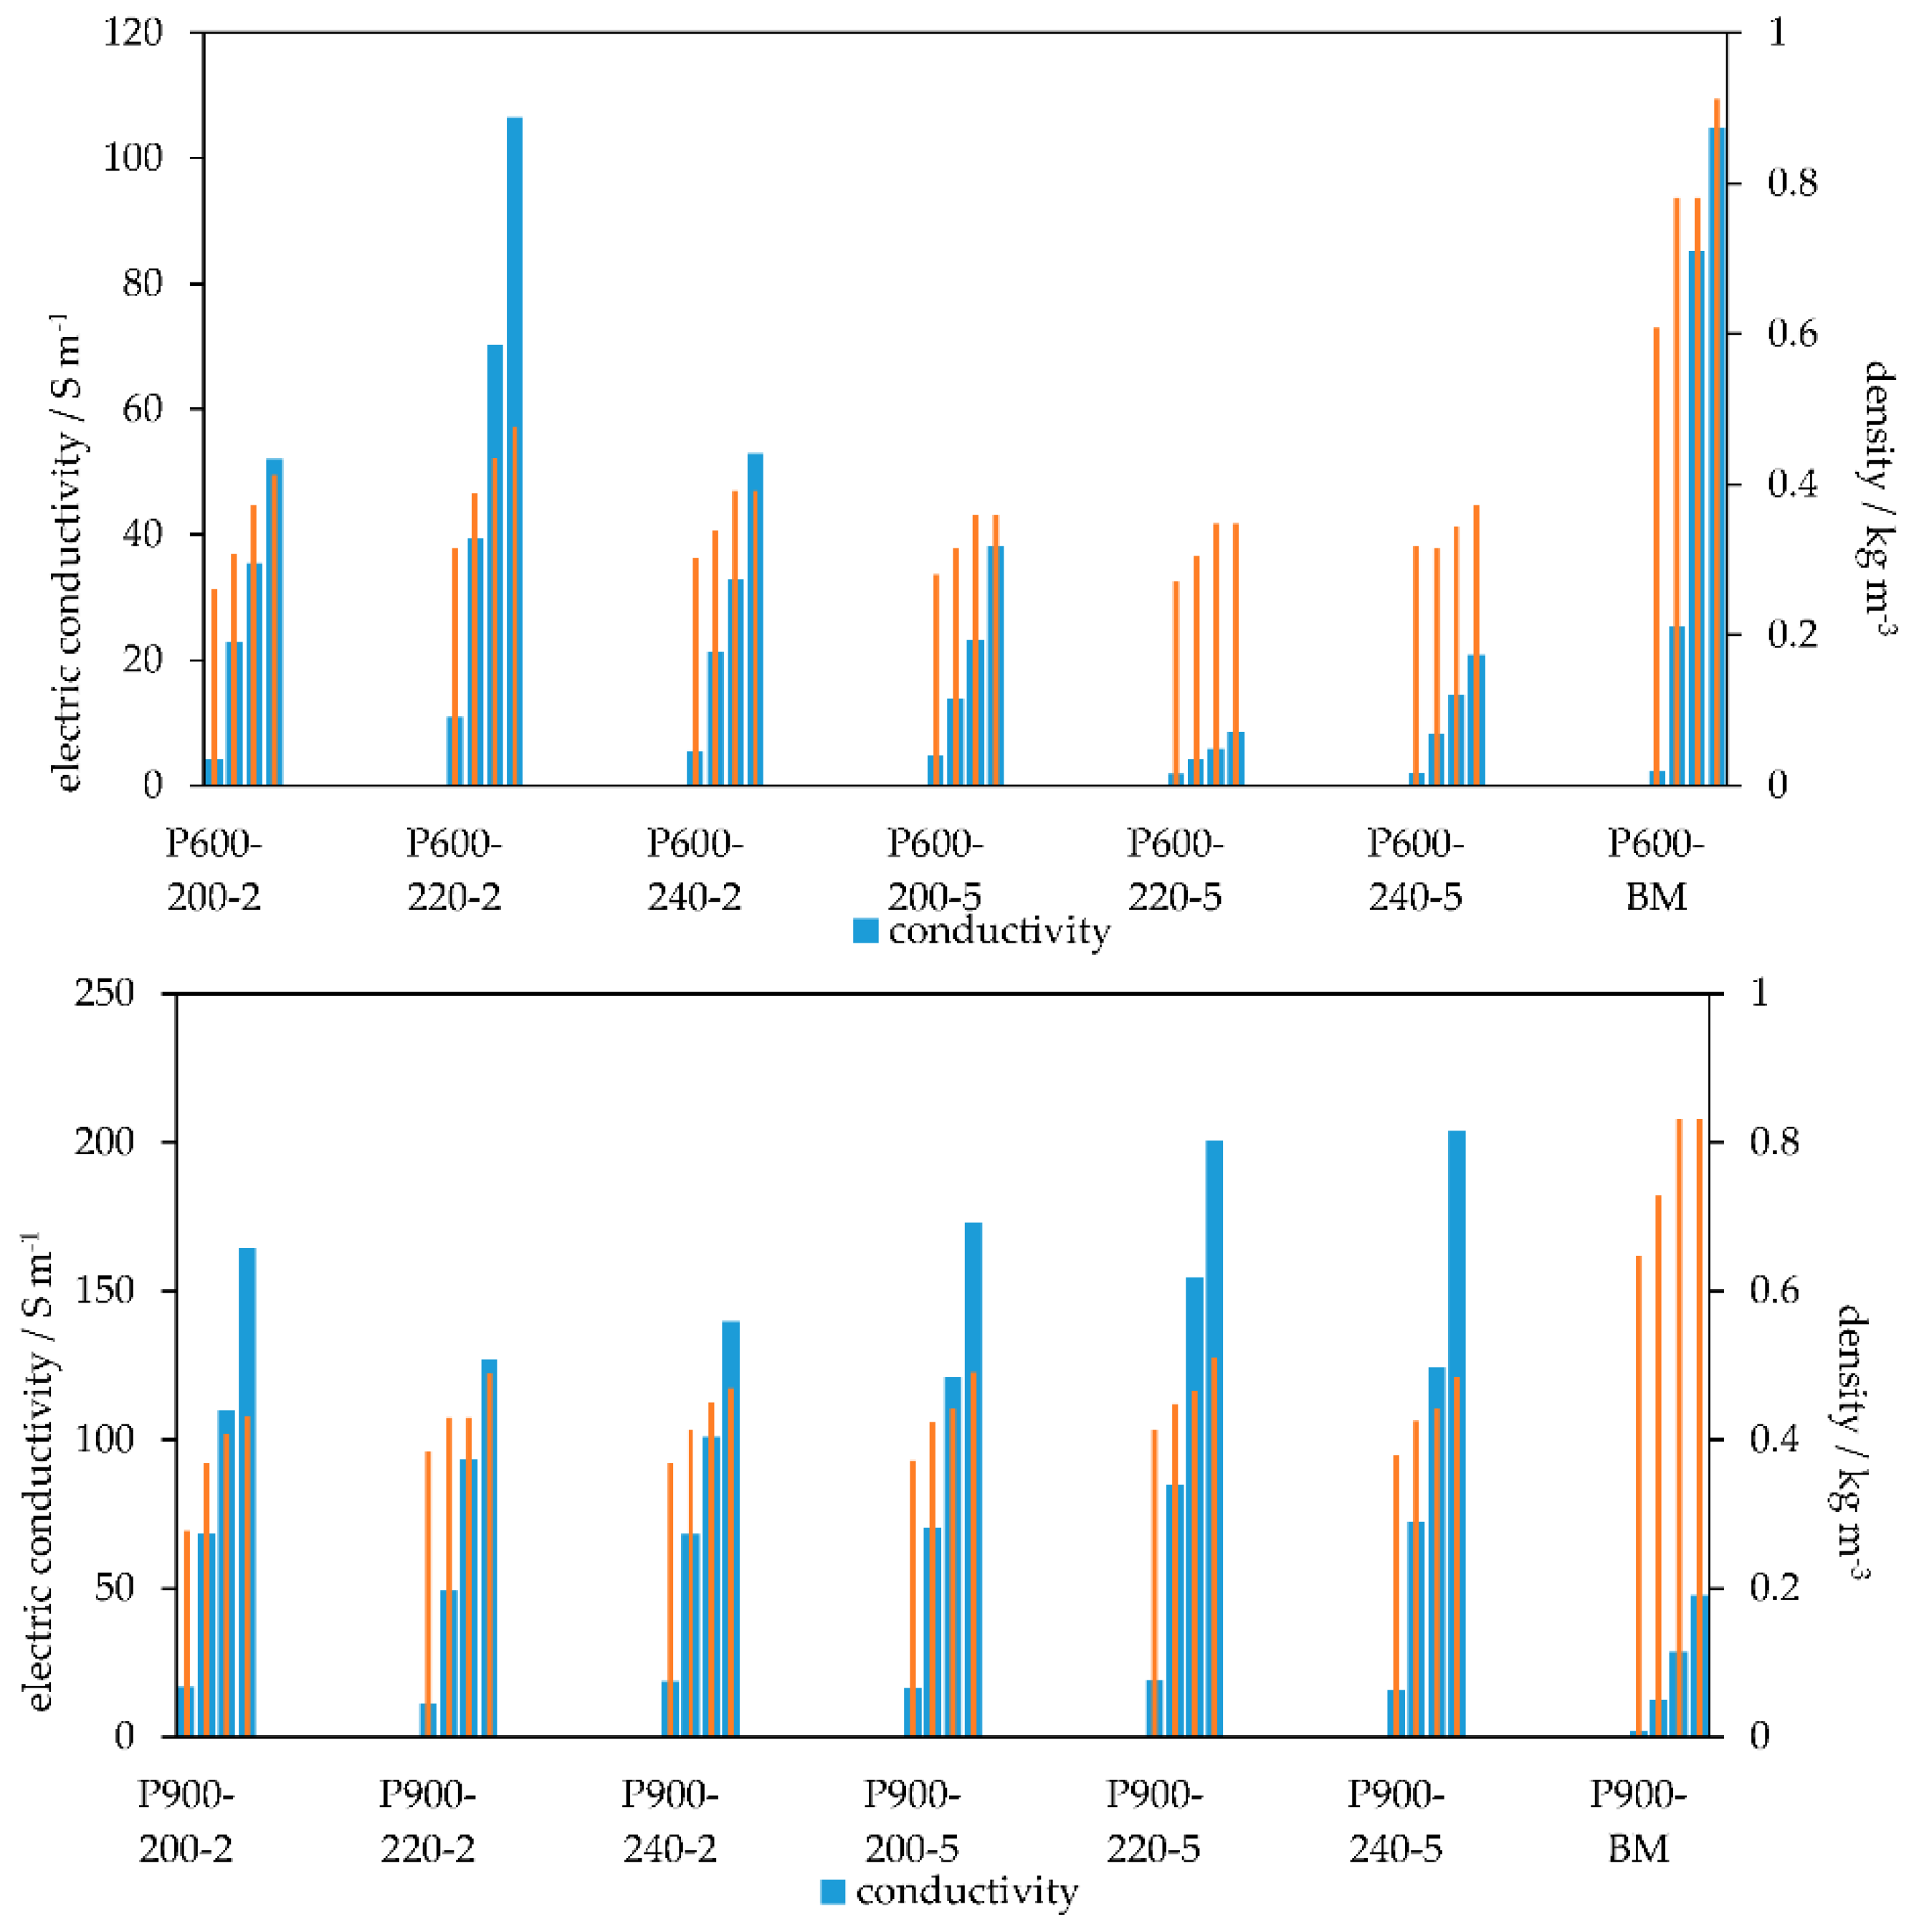
3.3. Electric Conductivity and Bulk Density

HTC chars show no EC due to their high electric resistance. PHC600, PHC900, and PCs show EC values between 8–203 S m−1 and thus belong to the group of semiconductors, characterized by EC values between 104 S cm−1 and 10−8 S cm−1 [51].
For HTC chars, the bulk density decreases with increasing reaction temperatures at both residence times. Nevertheless, reaction time also has an influence on bulk density: HTCs with the same reaction temperature and different reaction times show the effect of decreased bulk densities with increasing reaction temperature.
The highest EC for the two-hours HTC series is measured for the sample obtained via pyrolysis of HTC-220-2. PHC600 samples obtained of HTCs with 200 °C or 240 °C show only EC values half as high.
Within the five-hours HTC series, an inverse trend is observed. The lowest EC is measured for the PHC600 obtained from HTC-220-5, whereas the PHCs obtained from HTCs with 200 °C and 240 °C show significantly higher EC values, but still lower than the EC values of the PHCs obtained from two-hours HTCs.
However, the trend in both test series (two-hours and five-hours HTC) is that bulk density and EC of PHC600 correlate. Within the PHC600 samples, the char with the highest EC also shows the highest bulk density.
By comparing PC600 with PHC600 samples, it is worth noting that EC of PC600 with 104 S m−1 is almost as high as that one of the best PHC600. At the same time, PHC600 has a much higher density than the P600-220-2: with 0.91 kg m−3 it is almost twice as high as 0.48 kg m−3.
EC of PHC900 is even higher than EC of PHC600. Here, results between 126 and 203 S m−1 are achieved. The highest EC within all PHC900 samples is 203 S m−1, which is 100 S m−1 higher and almost twice as high as the highest EC of all PHC600 samples.
In this test series, it can be observed that the length of the residence time of the HTC has a positive influence on the EC of PHC900. This has already been observed within the PHC600 samples. Within PHC900 samples, PHCs obtained via HTCs of lower residence times always have lower EC values than the corresponding PHCs of HTCs with the same reaction temperature but a longer residence time of five hours. In addition, in the PHC900 series, the EC increases with increasing temperature of HTC. In contrast to PHC600 samples, no correlation between density and EC is observed within the PHC900 samples.
In view of the PC900 the significantly higher density compared to the corresponding PHC should be mentioned, as was already the case with the PC600. At 0.83, this is at least 40% higher than that of the PC. However, the electrical conductivity of the PC900 with 47 S m−1 is far below the maximum electrical conductivity of the PC900 of 203 S m−1. Figure 7 shows that both the bulk density and EC increase with higher applied pressures.
Figure 8 shows the course of the EC for the assessed carbons depending on the applied pressure. With the exception of P600-220-2, the EC graphs of the PHC600 samples have only a slight gradient and are approaching an upper limit. The EC graph of PC600 also indicates that it has reached its peak at maximum compaction and that no further increase is to be expected. The EC graph of P600-220-2, on the other hand, has a much greater gradient and it can be assumed from the open course of the graph that EC would still increase at higher compression.
According to Holm et. al, the intrinsic resistance of a carbon particle and the total size of the contact area between the carbon particles [27] are decisive for the EC of carbon powder. To assess the intrinsic EC in detail, the elemental composition, molecular structure and nature of the atomic in the carbon are important indicators. According to Bandosz et al., biomass usually contains sp3 hybridized C atoms which are connected via σ bonds [52]. Due to the absence of π-electrons, which are present e.g., in aromatic C=C bonds, there is no EC.
In the hydrochars π bond exists, because the carbon atoms in HTC chars are sp2 hybridized and thus connected via C=C double bonds. In addition, the free electrons of the oxygen in the furanic-ring contributes to the Π-system. In fact, the furanic-ring has 6 Π-electrons delocalized in a ring and is a pseudo-aromatic compound. On the other hand, the π orbitals are not linked with each other. As a result, there is no large delocalized π electron system that would promote electron transport [14].
Due to the high proportion of O, H, and N in the HTC chars (Table 1), a rich surface chemistry is expected. This is also confirmed by the FT-IR spectrum and indicates the presence of functional groups (Figure 9). The low SSA of the HTC char can also be seen as an indicator in this context [14]. The presence of functional groups also counteracts EC, as they “localize” the electrons and inhibit good conductivity between particles attached to each other. HTC carbons are thus classified as insulators with an EC lower than 10−8 S cm−1 [51] (Table 2).
The bulk densities of HTC chars decrease with increasing intensity of HTC temperature at both residence times (Figure 7), because here the carbon materials begin to change from a disordered amorphous structure to a more crystalline one. HMF polymerizes into long chains and facilitates an ordered structure [9].

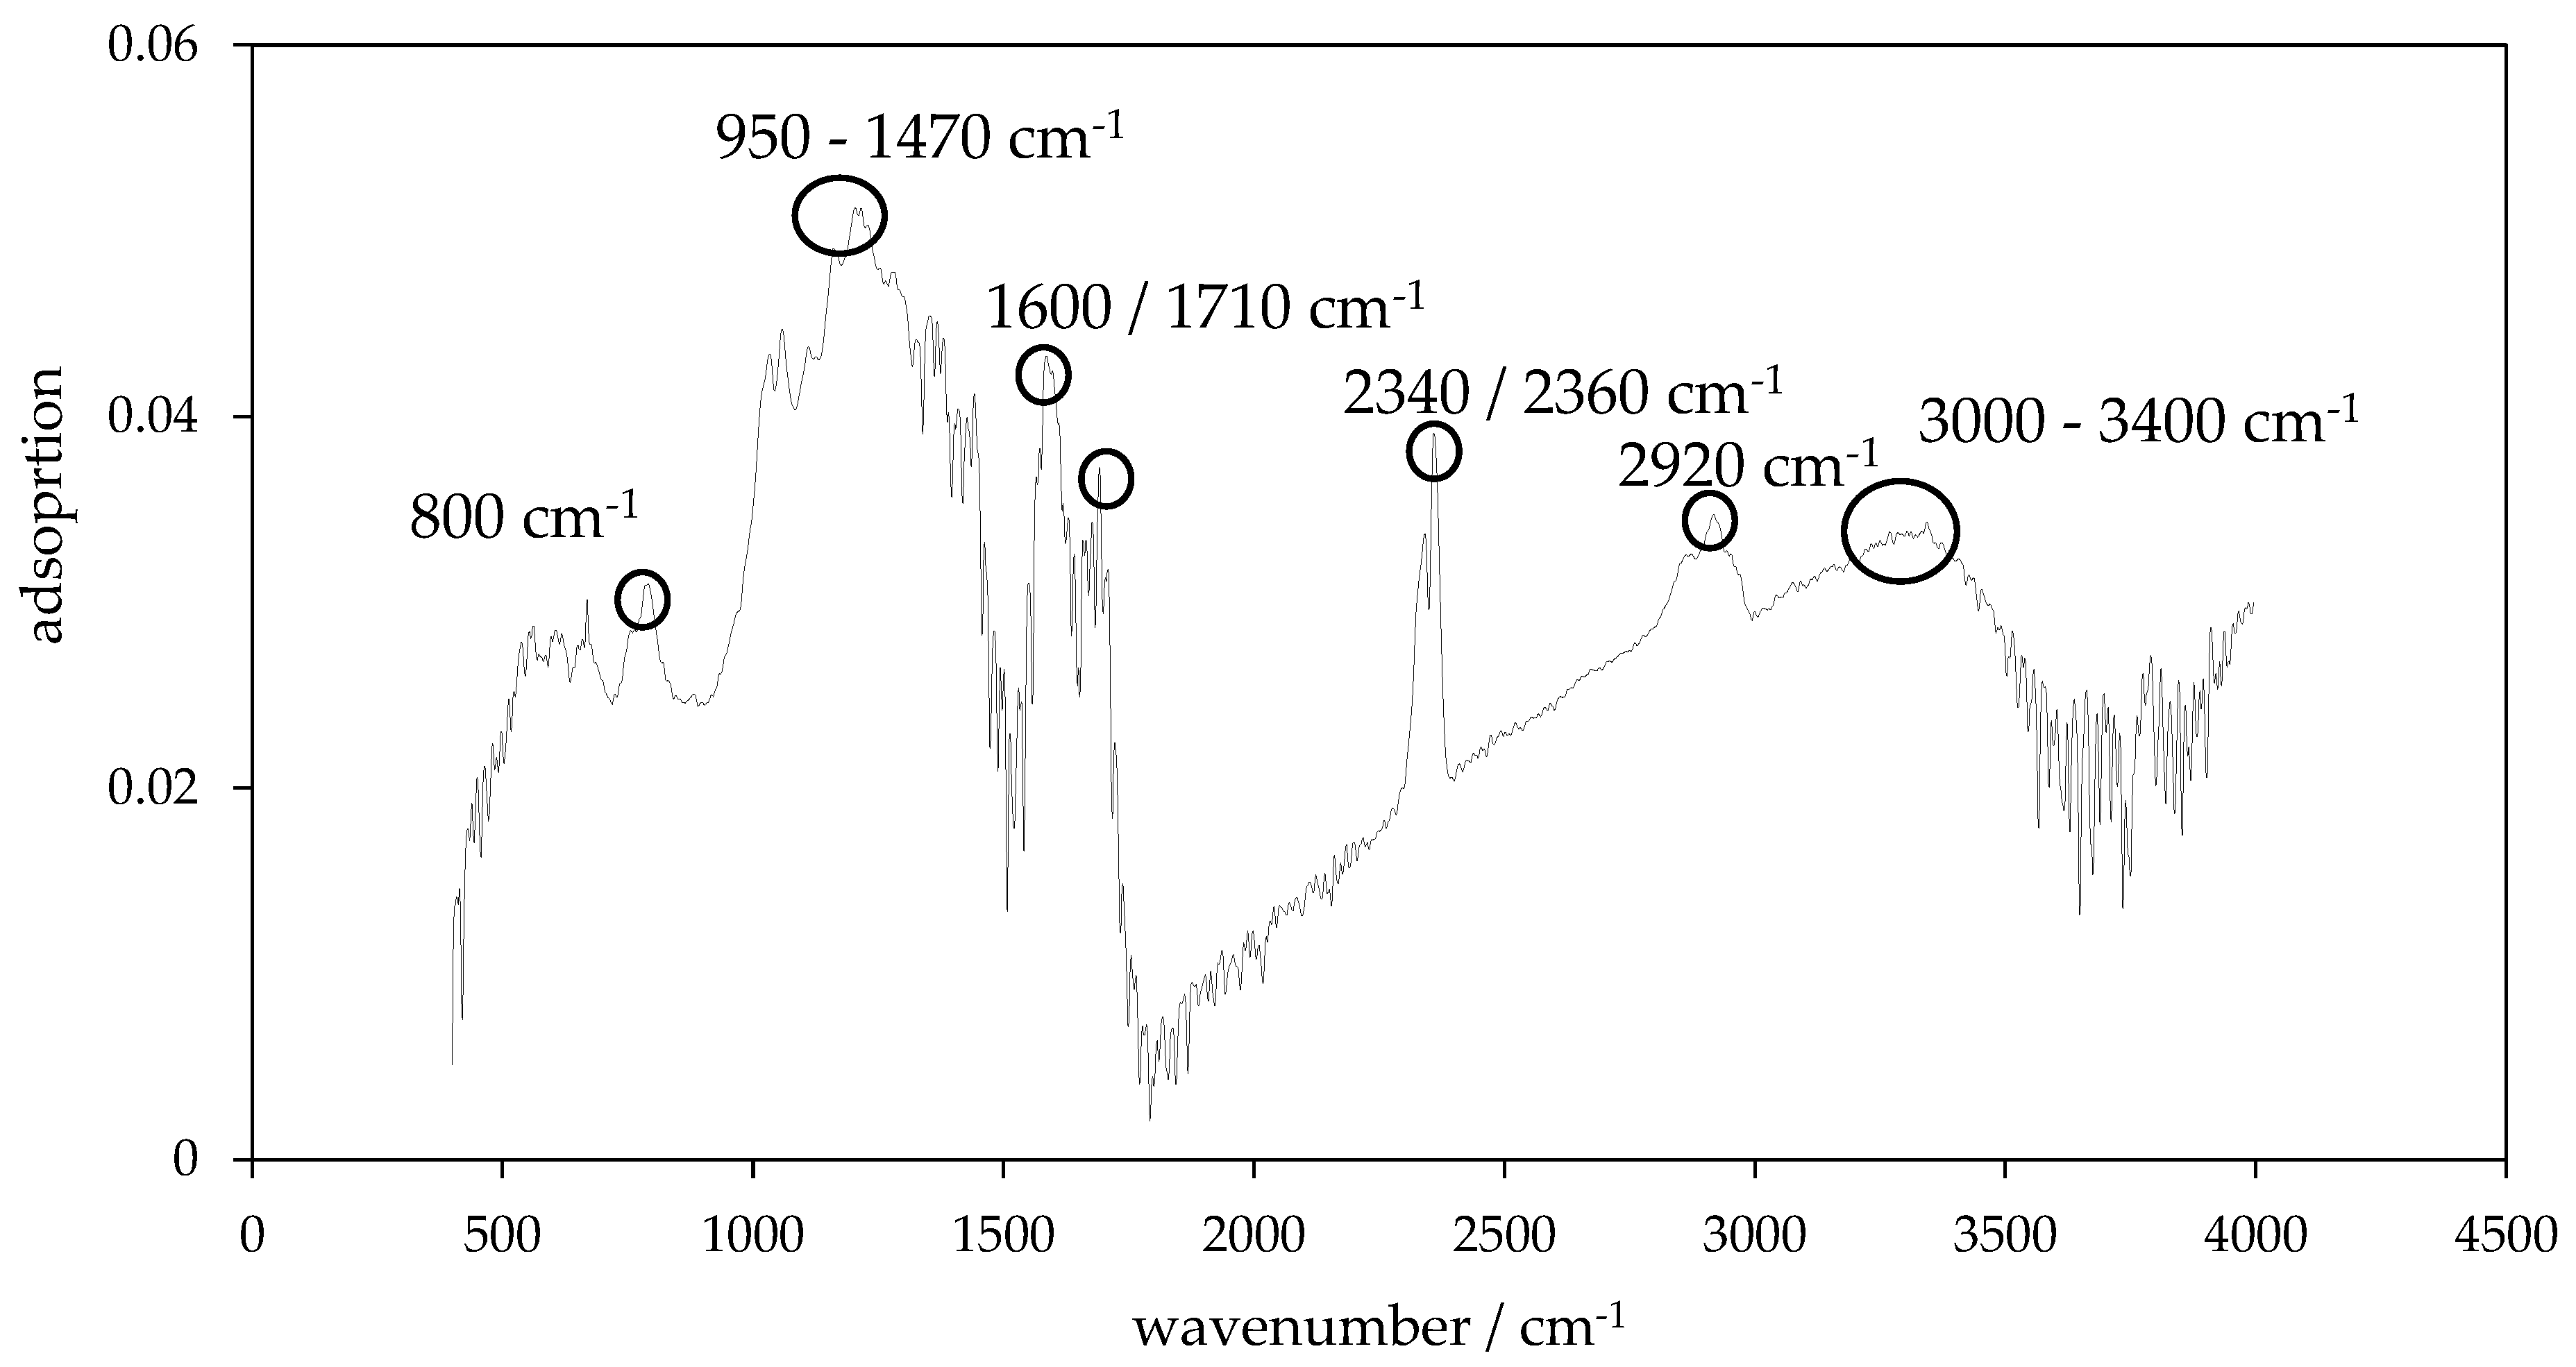
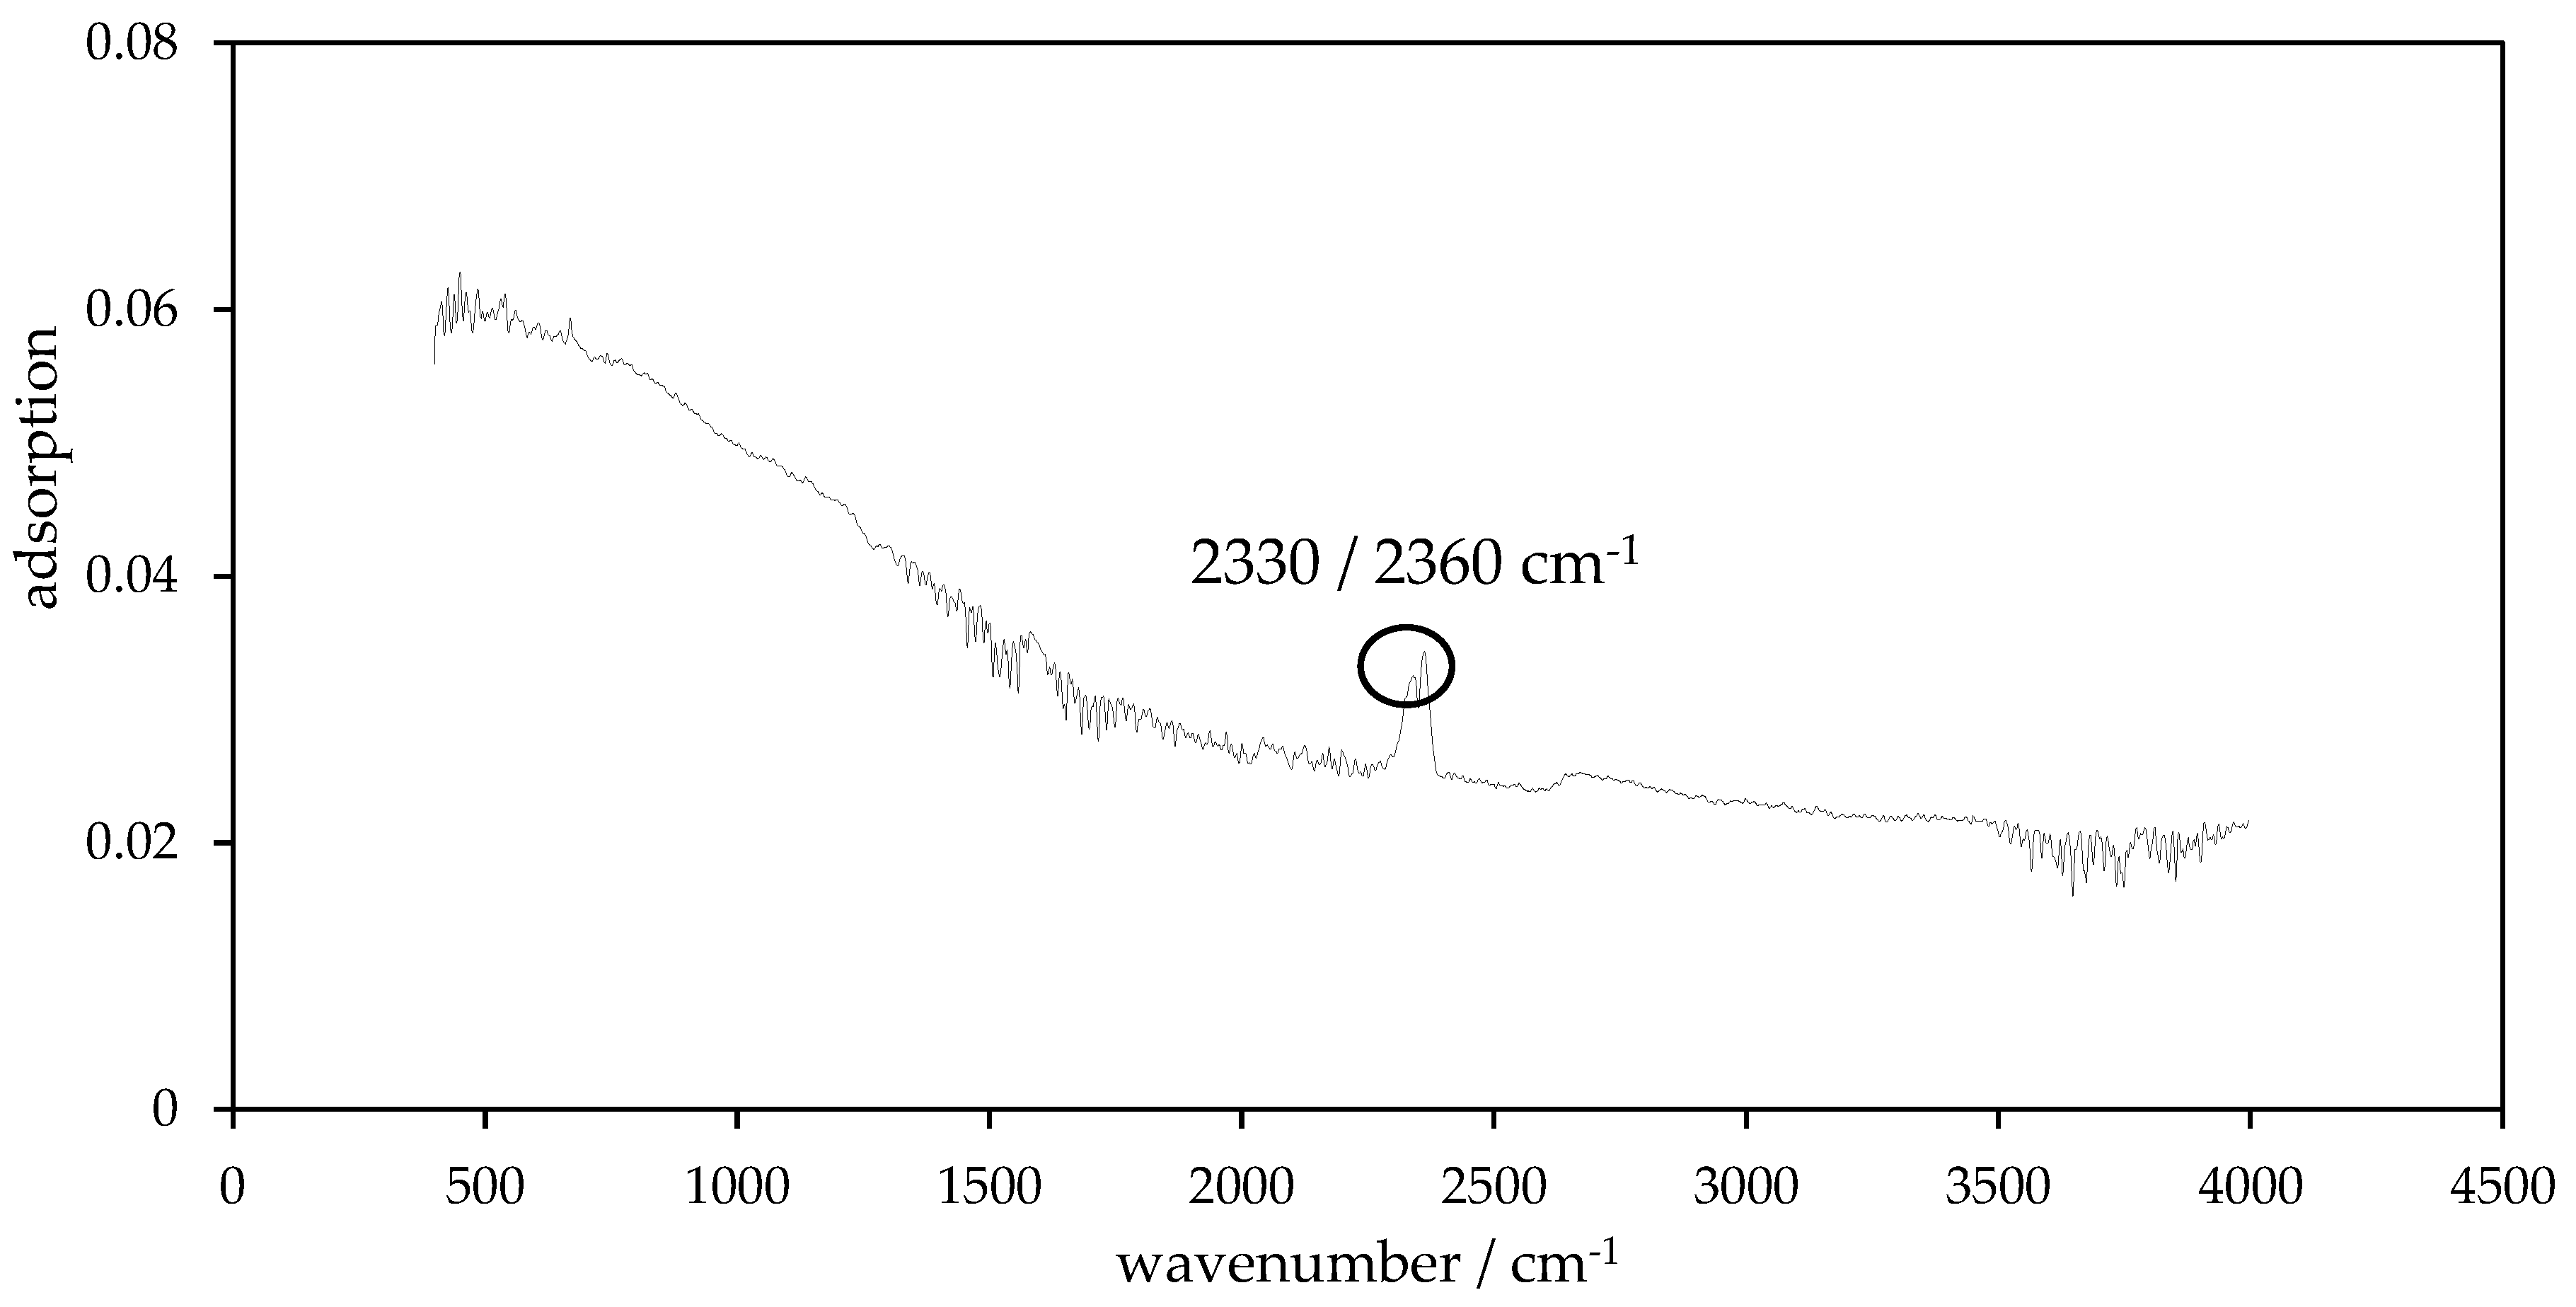
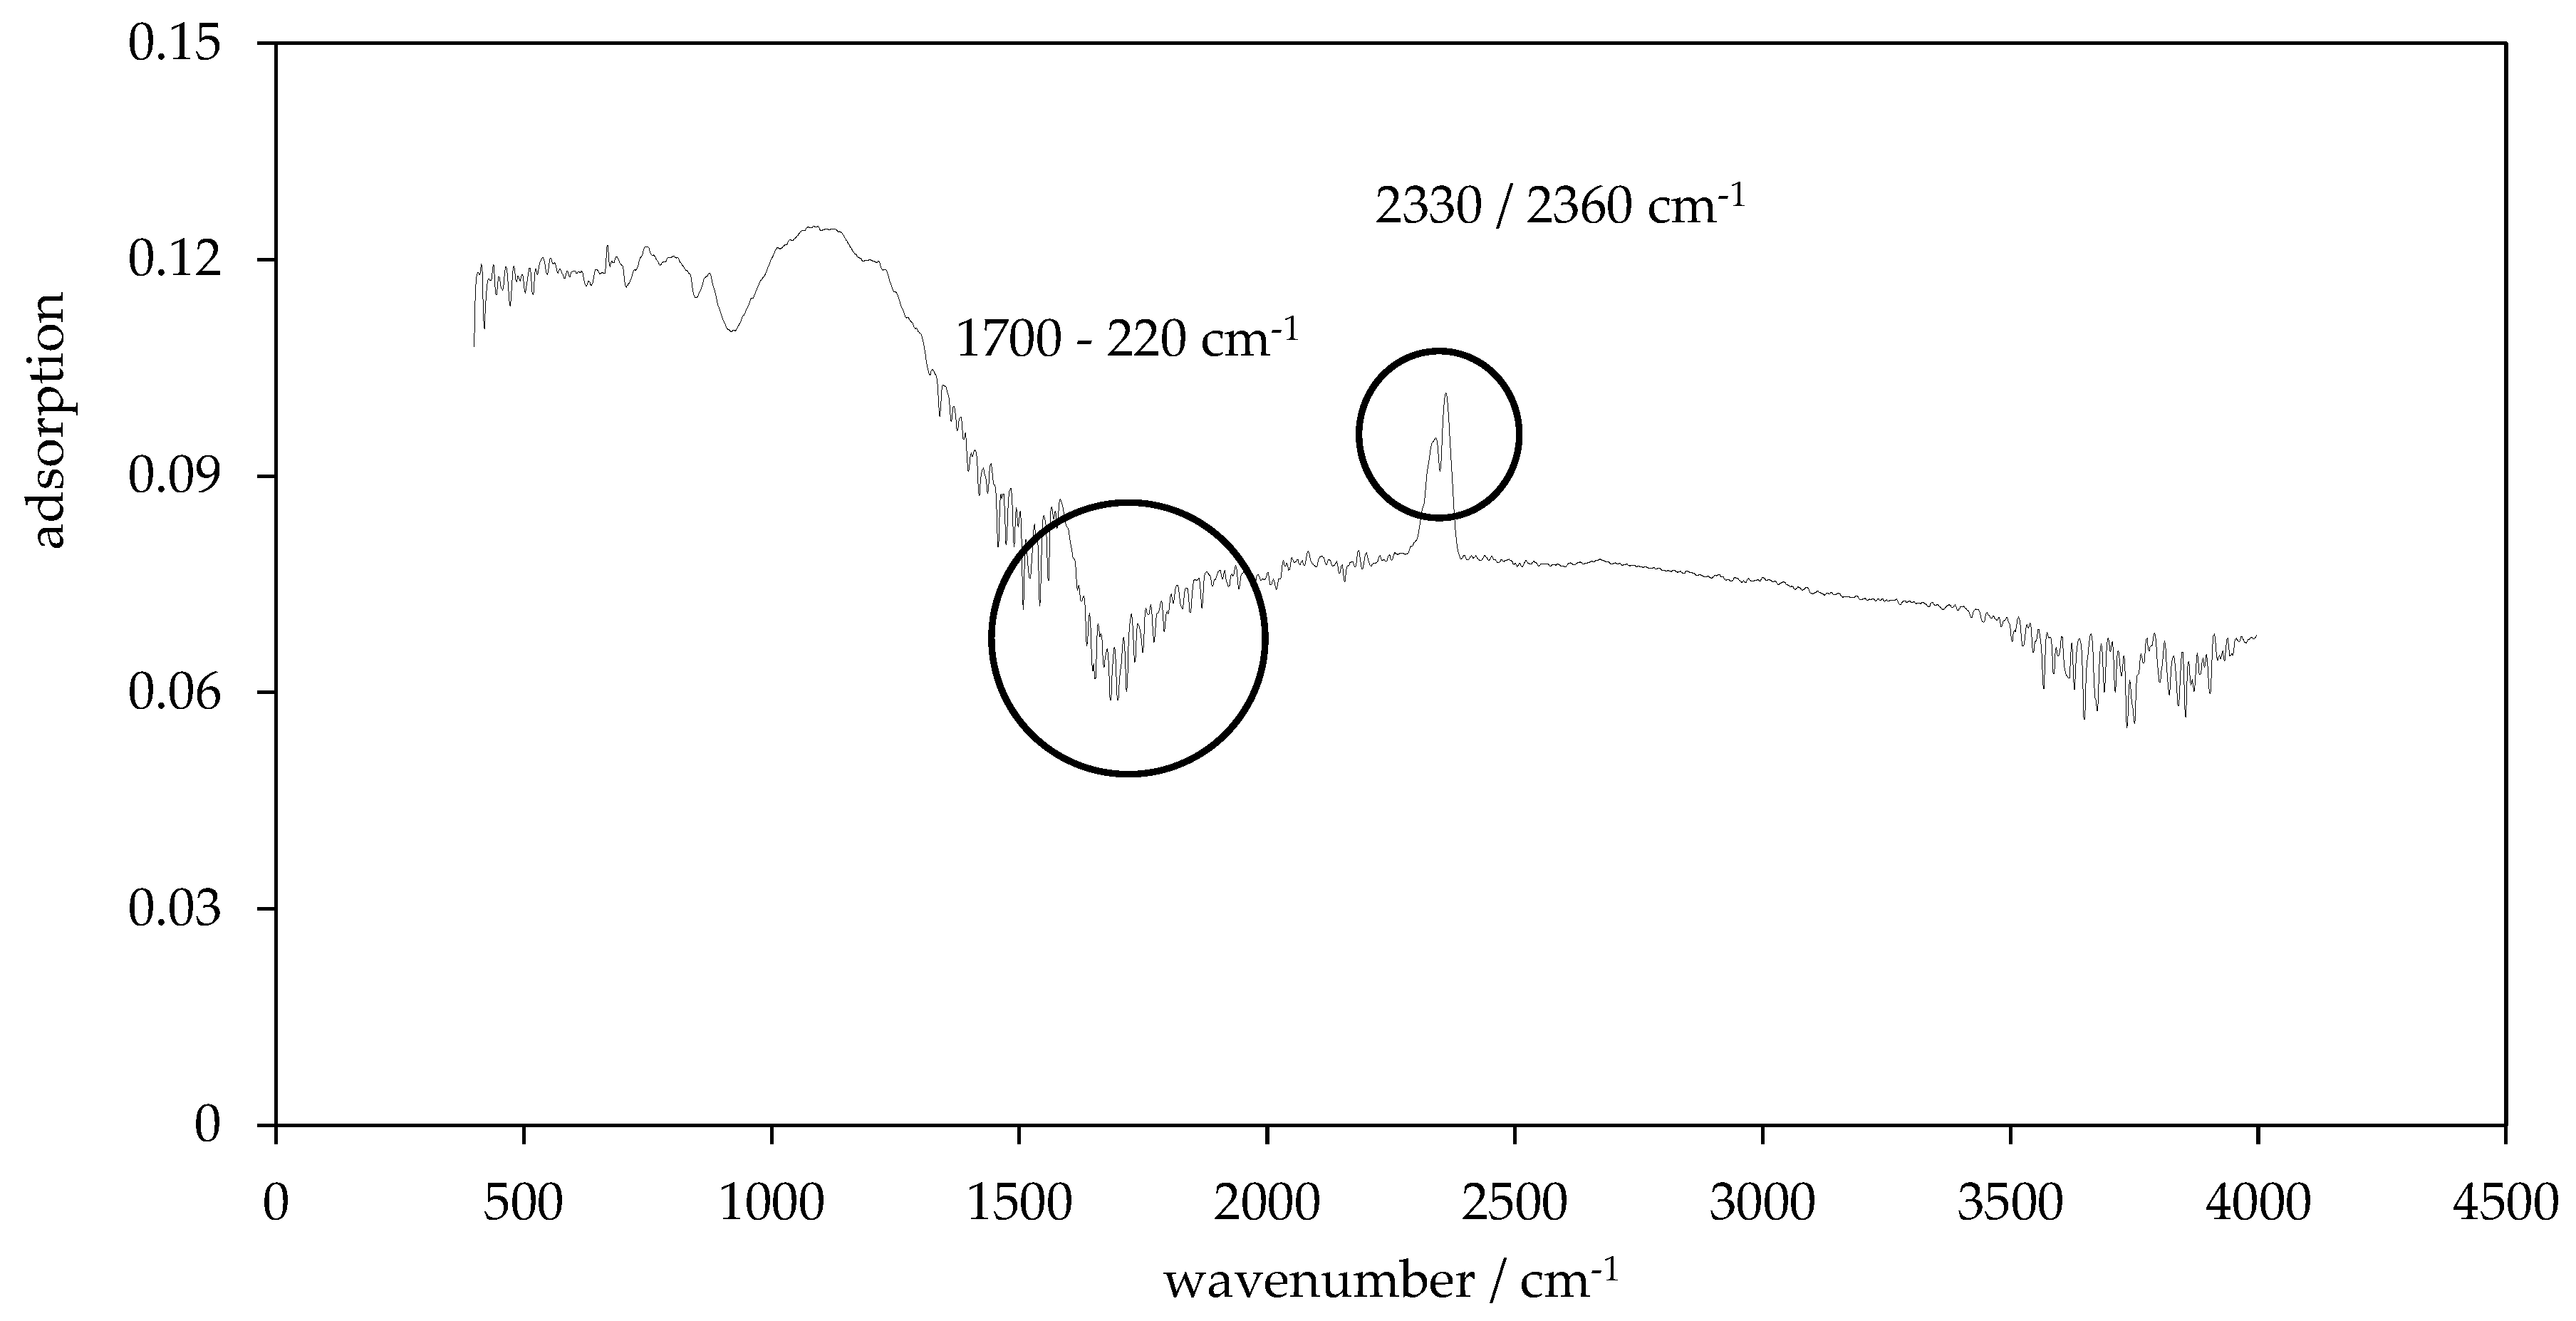
3.4. Surface Functionality
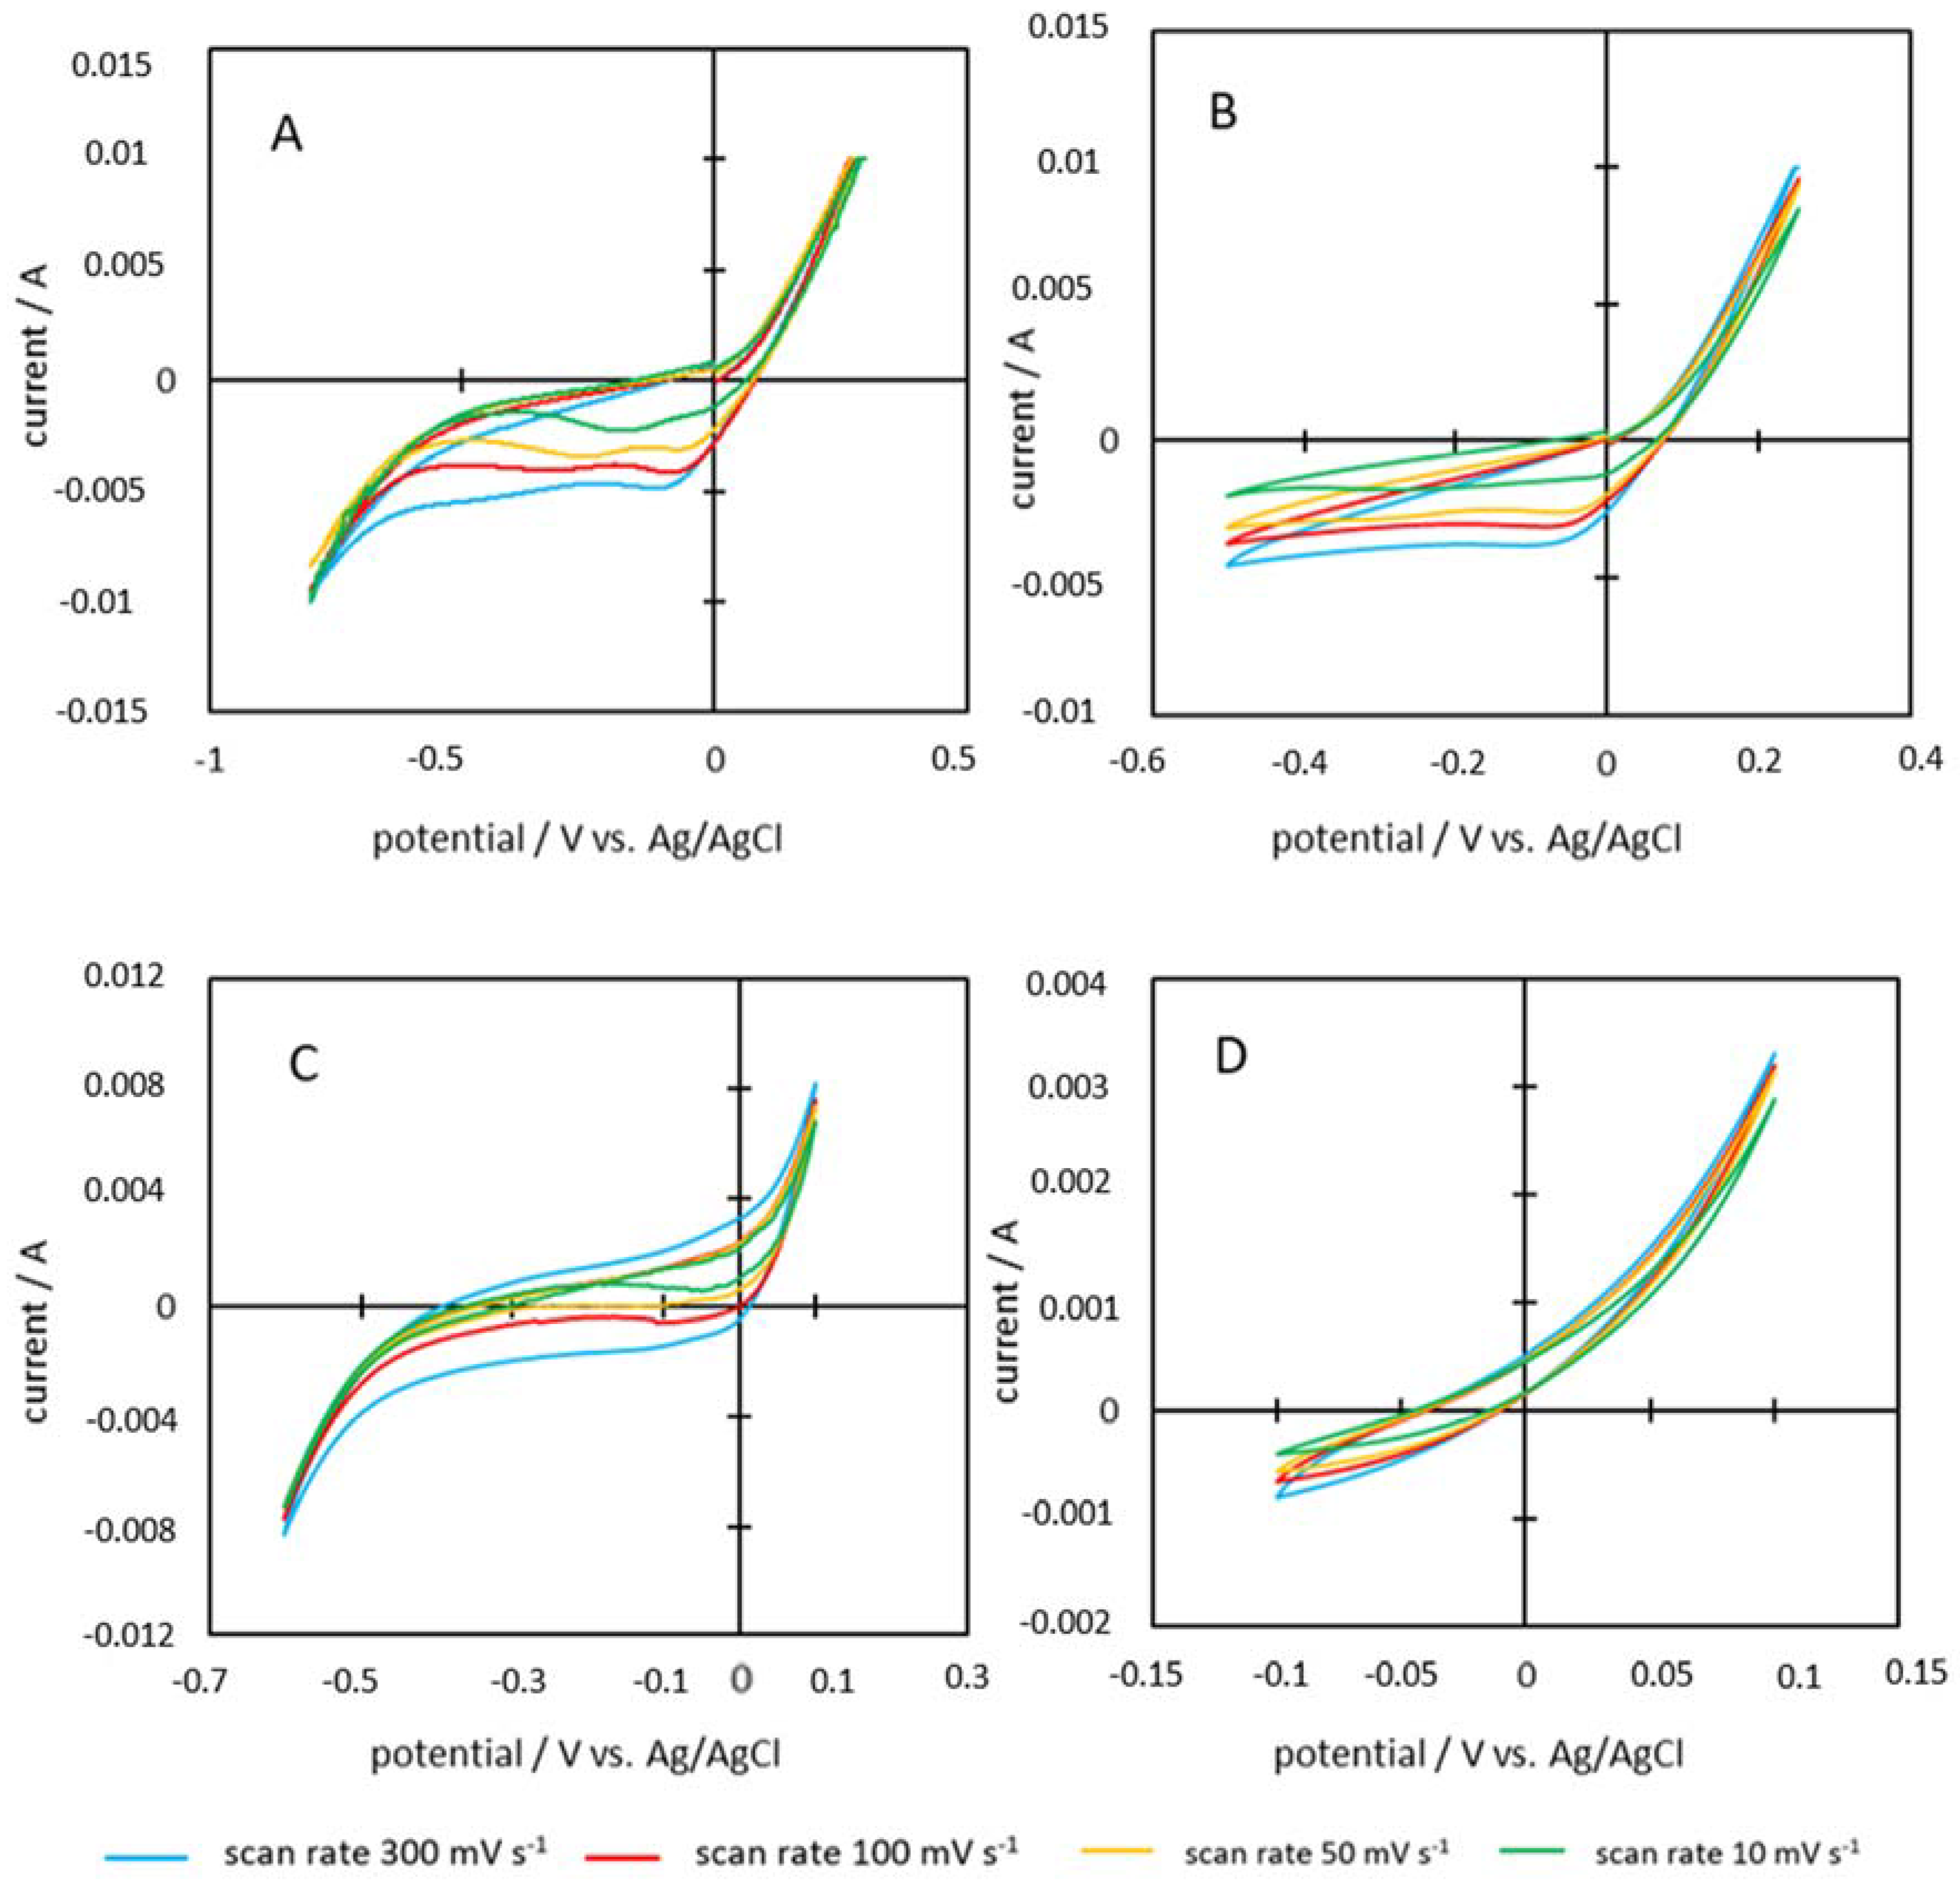
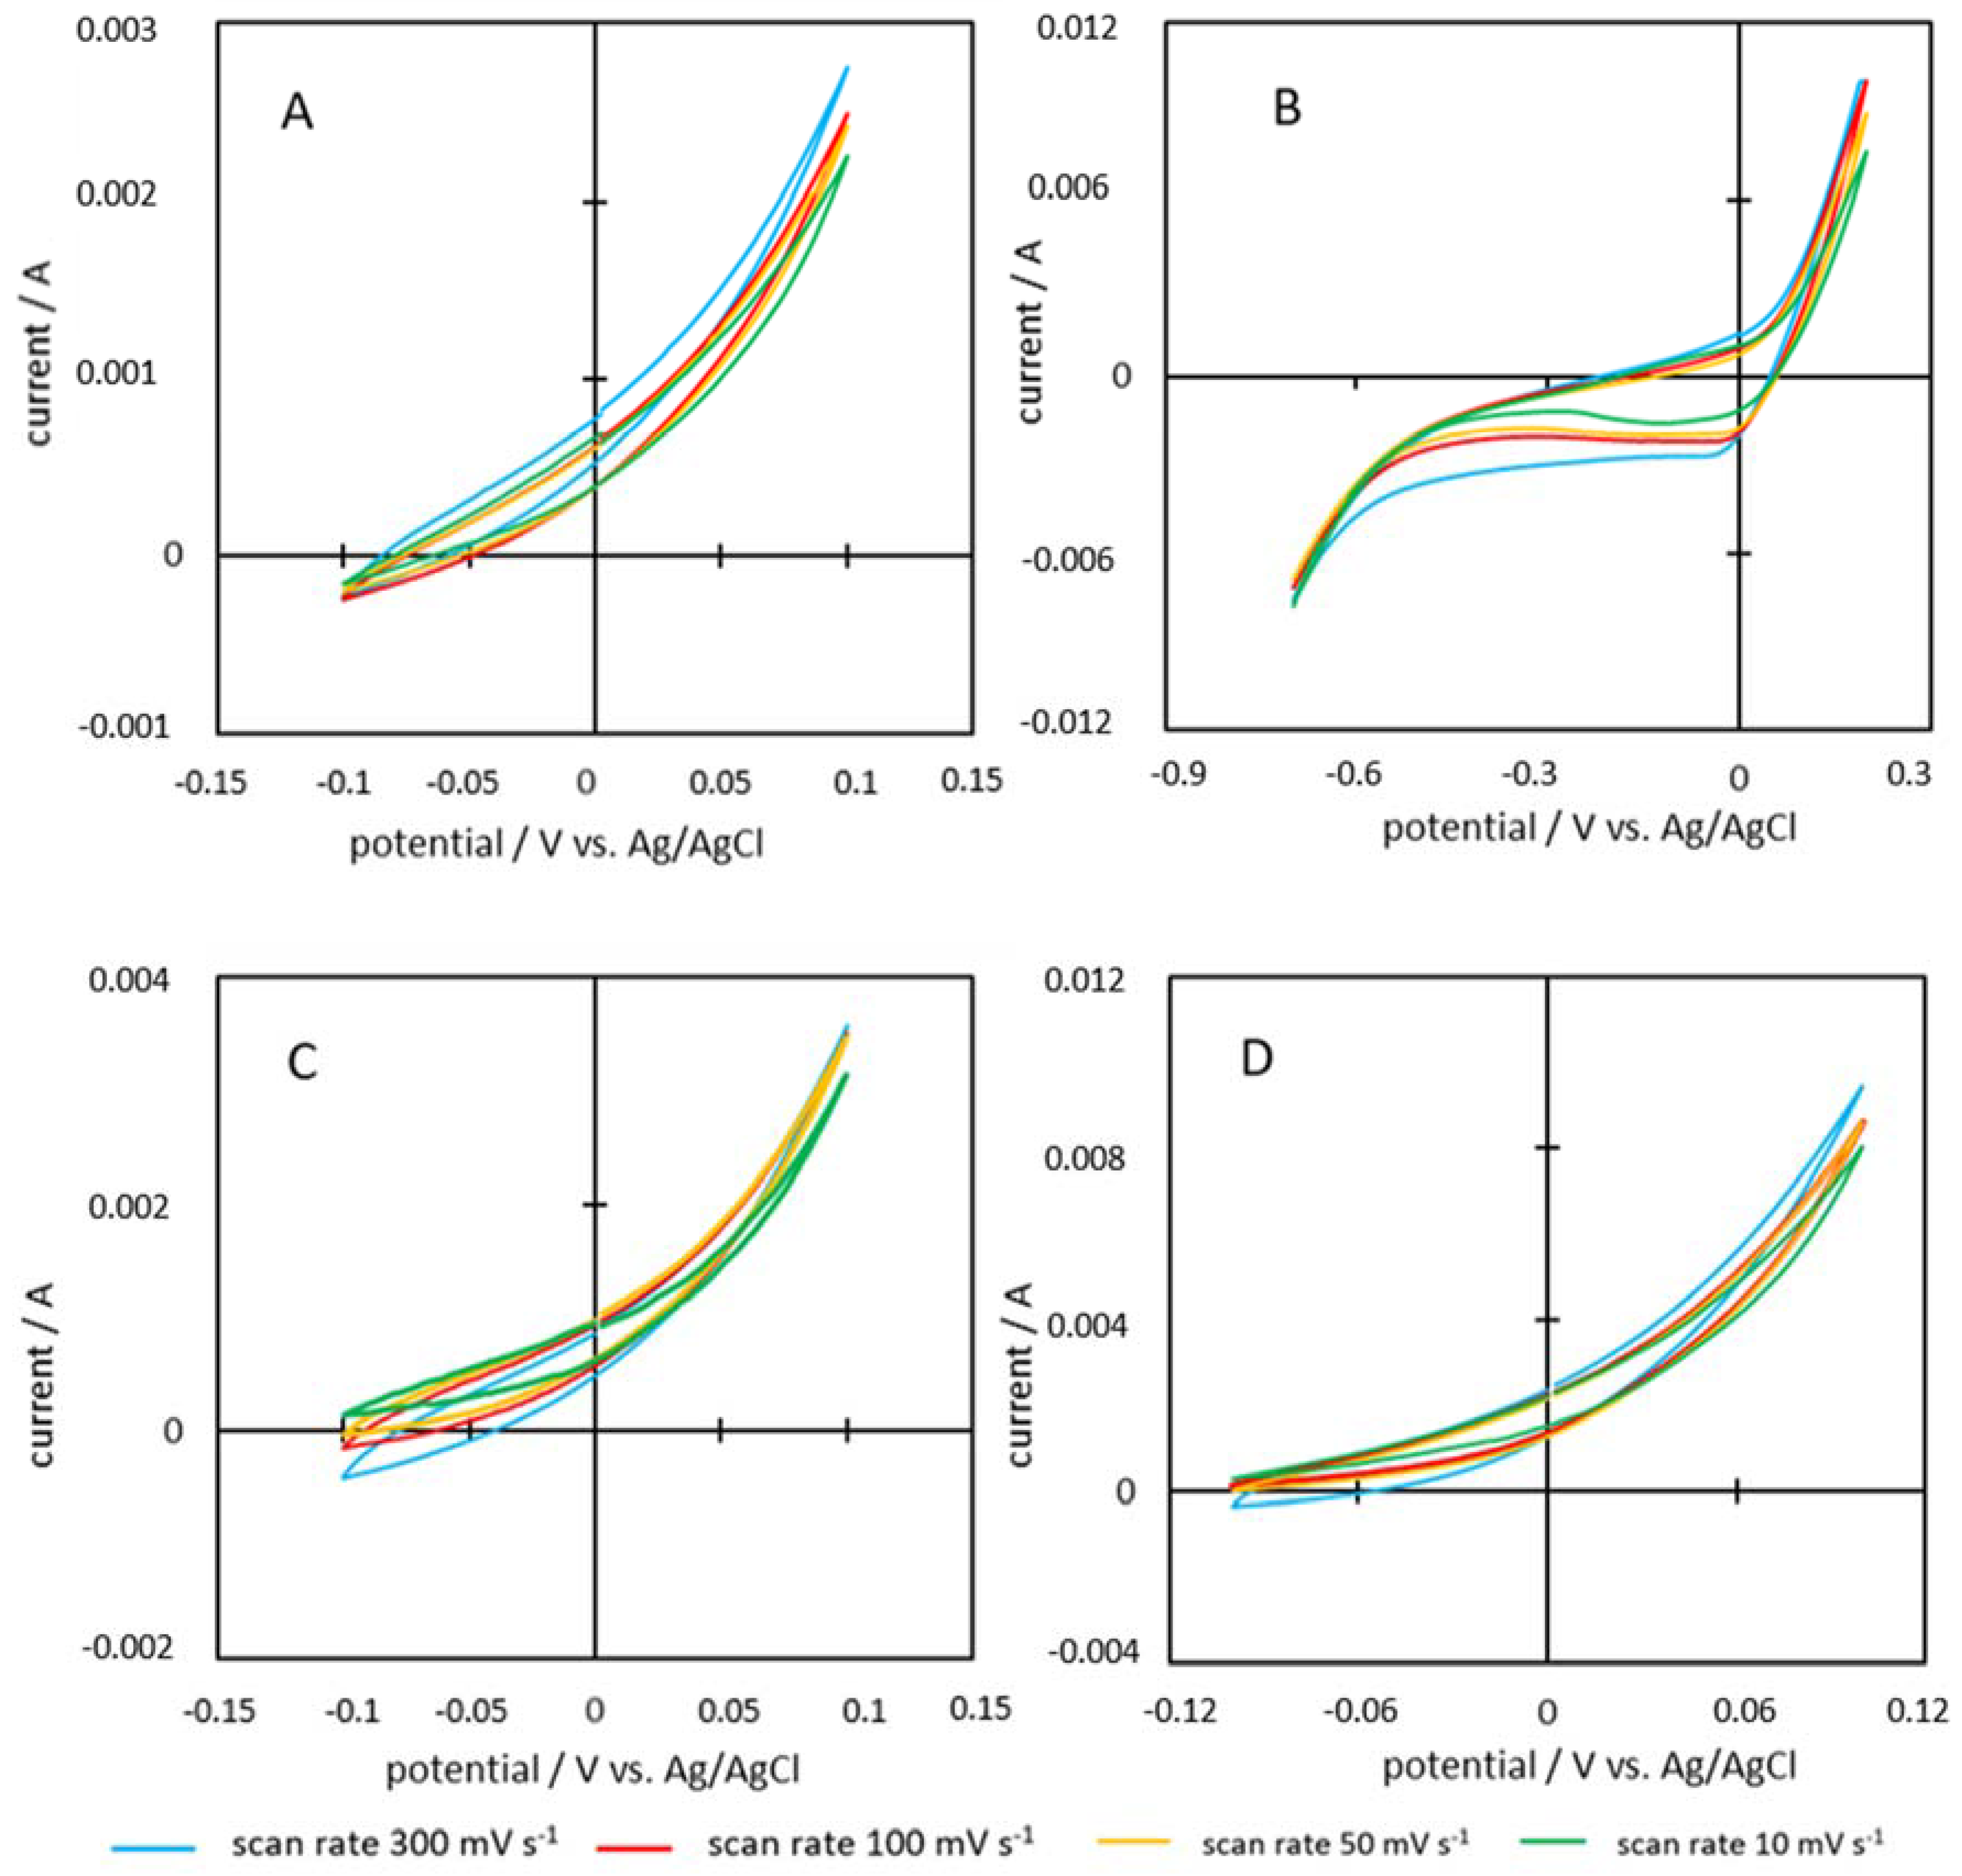
Regarding the results of FT-IR measurements, the HTC chars all show an identical spectrum (Figure 9). The first evaluable peak is recorded at a wavenumber of 800 cm−1. The next peak is a large peak with several small intermediate peaks. This ranges from 950 to 1470 cm−1, followed by a high peak at 1600 cm−1 and is associated with the peak at 1450 cm−1. Another peak is found at the wave number 1710 cm−1 and is also included in the evaluation, as it is the double peak at 2340 cm−1 and 2360 cm−1. The peak at 2920 cm−1 is also discussed, as it is the last broad peak, which begins at 3000 cm−1 and then merges into narrower peaks, closely aligned from 3400 cm−1.
Concerning PHC900 samples (Figure 10), from the wave number 1700 cm−1 to 2230 cm−1, many small peaks are closely lined up, which are not included in the discussion. These peaks can only be found in the spectra of P900-HTC-240-2. Each sample, except P900-200-2, of PHC900 series has a more or less strong double peak at the wave number 2360 cm−1 and 2330 cm−1. It should be noted that the size of this double peak increases with increasing synthesis temperature for PHC900 samples obtained via two-hours HTC. The PHC900 obtained via five-hours HTC does not show this trend. Here the peak of all chars is comparatively very small but still visible. PC900 showed no evaluable peaks in its spectrum.
Within the PHC600 series, only the PHCs with the mildest reaction conditions, P600-200-2 and the P600-200-5, have one peak at 1070 cm−1. With increasing temperature, many small peaks in the range of wave numbers 1700 cm−1−2200 cm−1 are detected in this sample series. It should be noted that the peaks in the five-hour series are always more pronounced than those in the two-hour series. What the two test series with the different residence times have in common is that the PHC from the HTC with the lowest temperature (200 °C) has no double peak at 2360 cm−1 and 2330 cm−1 (see Figure 11), which, in turn, can be found in both PHC series obtained via HTC at 220 °C. No peaks are detected for PC600.

3.5. Capacitance

The results of CV measurements are shown in Table 3. The highest specific capacity of 134.15 F g−1 was measured for PHC600-220-5. For both PHC900 and PHC600 series it can be observed that the lower the scan rate, the higher the capacity.
A closer look at the PHC900 series shows, that the capacity also increases with increasing HTC temperature. Within the PHC600 samples, this is only observed in the sample series with the five-hour HTC reaction time. The extremely low capacity of the P600-220-2 is particularly noticeable.
The qualitative analysis of the cyclovoltamograms of PHC600 samples (Figure 12 and Figure 13) show that all graphs except the one of P600-220-5 show parallelogram shapes with rounded corners. In addition, all cyclovoltamograms of this form show clear peaks. However, these peaks become increasingly unclear as the scan rate increases and are most clearly visible at the lowest scan rate. P600-220-5 cyclovoltamogram differs from the others since no rectangular shape is visible here.
The cyclovoltamograms of the PHC900 series show a similar picture. Clear peaks are also identified here, and the shape can also be described as compressed parallelograms with rounded corners.
Specific capacities between 0.15 and 134.15 F g−1 were measured for PHC600 samples (Table 3). It is noticeable that all graphs, with the exception of P600-220-5, are only slightly rectangular in shape (Figure 12 and Figure 13). The rectangular shape would be a clear indicator for double layer capacity [7]. Several peaks can be detected during the charging and discharging process of the electrode, which indicate redox reactions at the interface between the electrode surface and the ions of the electrolyte due to functional groups on the carbon electrode material (described in the section before). Since the redox reactions are kinetically slower than the forming of a double-layer on the electrodes surface, the corresponding faradaic charge flow occurs with a small time delay. Therefore, these current flows arise at the limits of the voltage range and the cyclovoltamogram becomes horizontal afterwards [11]. These measured faradaic currents or pseudo-capacitive effects increase the total capacity. The fact that slower scan rates lead to higher capacities indicates that the total capacity of PHC600 is mainly influenced by pseudo-capacitive effects. Due to the slow voltage change at the lowest scan rate, the ions have more time to access the micropores of the electrode and react with the functional groups located in the smaller pores. This finding is further confirmed by the fact that with an increasing scan rate the peaks in the cyclovoltamogram disappear and thus less redox reactions can take place due to a lack of time.
The cyclovoltamograms of the PHC900 samples are very atypical. All cyclovoltamograms, except P900-200-5, show the same shape. Based on this shape it is assumed that ion deposition on the electrode surface was hindered. Since sulphuric acid is a common electrolyte for CV analysis in literature [12,24], the poor performance is attributed to the properties of the tested samples. In the hypothesis by Sánchez-González et al. [17] and Barroso-Bogeat et al. [37], a good EC of a carbon powder together with good SSA values should favor the electron transfer processes resulting in a complete charging of the electrode and thus lead to a good performance in CV measurements. PHC900 samples show good EC values within the range of 126–203 S m−1. However, the EC measurements were carried out under compression, in contrast to the electrode material, which has been mixed with insulating binder and was uncompressed at the time of CV analysis. It is therefore assumed that the resistance of the electrode material was too high. Although the electrode material was pressed onto the electrode foil during electrode manufacturing, it still decompresses as soon as the pressure is removed. This observation was made during EC analysis, because EC decreased as soon as the applied pressure was removed.
Furthermore, the shape of the cyclovoltamogram could be related to the so-called ion-sieving effect, which has already been observed several times in literature [53,54,55,56]. The large proportion of micropores found (less than 2 nm) [42] plays a decisive role here. Due to the very small pore size, larger ions have difficulties penetrating into the pores and attaching to the surface. This can be described as a kind of steric hindrance. Since the smaller pores are therefore not available for ion deposition, the actual area used for ion deposition is much smaller than assumed and thus explains the shape of the graphs. In addition, the ions that were able to access the pores partly get tracked due to the narrowness, which explains the above-mentioned delayed deposition processes.
In the hypothesis of Iro et al. [57] and Wei et al. [58] it is stated that a high SSA is decisive for good capacitive performance. This is neither denied nor confirmed by the results presented here. In relation to the literature, the surfaces of up to 330 m2 g−1 are still relatively small. Moreover, with a range of 200–330 m2 g−1 the variety is relatively poor. As a result, the differences are not large enough to detect significant differences in the measurement results and to attribute them to the size of the specific surface.
Nevertheless, it is remarkable that almost all PHC600 samples and the P900-200-5 show pseudocapacities whereas this is not found for most of the PHC900 carbons. In literature the hypotheses can be found that pseudocapacities are attributed to the elementary content of oxygen and nitrogen [59,60]. However, it is important in this context, in which form these two elements appear. The nitrogen content in PHC900 and PHC600 samples is mostly the same and amounts to 3–4 wt.%, regardless of the respective char and the applied HTC conditions. However, since pseudocapacity is not measured for the PHC900 samples, but can be observed for the PHC600 samples, it is concluded that nitrogen has no influence on the formation of pseudocapacity in this case. This is probably due to the fact that nitrogen does not appear in functional groups on the surface of the material, but is found in solid heterocyclic ring structures inside the carbon matrix, for example in the form of pyridine. This hypothesis is supported by the results of FT-IR spectroscopy which shows the presence of C=N bonds such as pyridine.
Based on literature [4,7,8,23,61] the pseudocapacity can be traced back to the oxygen content. This can be explained by the fact that all PHC600 carbons except P600-220-5 have an oxygen content of more than 10 wt.% and show pseudocapacities in their cyclovoltamorams. The only char of the PHC600 series, which shows no pseudocapacity, the P600-220-5, has an oxygen content of less than 10 wt.%. Again, the only PHC900 sample with pseudocapacity is the P900-200-5, which also has an oxygen content of above 10 wt.%, whereas the other PHC900 chars have a significantly lower oxygen content. It is interesting to note that Okajima et al. was able to measure similar capacities for a carbon with 10 wt.% oxygen content [61], which supports the stated explanation. Furthermore, the comparison with commercial activated carbons with high SSA values such as Maxsorb (SSA of > 3.000 m2 g−1) and a specific capacity of 190 F g−1 shows that pseudocapacitive effects due to the high heteroatom content contribute to a higher extent to the overall capacity than the pure double-layer capacity does. Thus, the obtained O-rich carbons (e.g., P-600-220-5) reaches with 134.15 F g−1 relatively high capacities despite its low SSA of 202 m2 g−1. Similar observations were made by Raymundo-Piñero et al. for bio-based O-rich carbon from seaweed [62].
A high amount of oxygen groups on the surface of an electrode material has numerous advantages. Oxygen groups can increase the wettability of the material for the electrolyte and they enable the ions to be more easily attached to the surface by adhesion and cohesion due to intermolecular interactions with the electrolyte [63]. In addition, oxygen is a very good oxidizing agent, which is reduced when a redox reaction occurs [64]. As already explained above, this allows the double layer capacity to be extended by pseudocapacity, if redox reactions occur leading to a faradaic current and improving the overall performance of the supercapacitor [6,64].
On the other hand, oxygen functional groups can hinder electron transport and increase the resistivity of carbon powders which has a negative impact on the overall capacitance. However, this decreasing effect can be overlaid by other effects such as the increase of double layer capacity due to physical properties such as a higher SSA [4,17]. Since these interactions between the physical and chemical properties of the carbon powder, the macroscopic parameters such as electrode preparation method and the electrochemical performance (e.g., as specific capacity) are highly complex and partly not fully understood, the fine-tuning of the carbon materials is such a difficult process. Table 4 summarizes the main interdependencies and relates them to the carbon samples studied in this work. For the sake of clarity, the table only includes the heteroatom oxygen, even though different interdependencies also exist for hydrogen- or nitrogen functionalities.

4. Conclusions

With regard to the application in supercapacitors, the presented results generated new insights into the influence of production parameters on final carbon properties of bio-based electrode materials from potato waste.
HTC (220 °C, 5 h) with downstream pyrolysis (600 °C) produces the chars with the highest carbon content and the best electrochemical performance of up to 134.15 F g−1. This relatively high capacity is explained by pseudocapacitive effects due to the high O-content in the carbon (8.9 wt.%). Regarding the pyrolysis temperature, higher temperatures lead to the highest carbon contents and electric conductivity, but the pyrolysis also has a negative effect on the oxygen content. This influence is clearly observed when comparing the EC of PHC900 samples compared to the PHC600 chars and is illustrated by the occurrence of pseudocapacitance for PHC600, while the high capacity of PHC900 chars (up to 118.7 F g−1) can be mainly attributed to double-layer capacitance caused by the higher SSA. Since the nitrogen content of PHC600 and PHC900 chars is very similar, but the electrochemical performance of the samples is very different, the influence of nitrogen is without significance here.
Concluding, high-purity electrode materials with a high carbon content are best obtained by upstream HTC with long reaction times and subsequent pyrolysis at lower temperatures when pseudocapacitance is an objective and higher temperatures for double-layer capacitance. Thus, via these conversion processes, an application-specific designing of bio-based carbon materials is possible which is a decisive advantage compared to fossil-based carbons. However, the process has to be further adapted and tested with different biomasses in order to fully understand the complex correlation between the different parameters and create a basis for up-scaling the biomass conversion processes.

Author Contributions

Conceptualization, V.H. and D.J.; Methodology, V.H.; Software, V.H.; Validation, V.H., D.J. and M.J.A.; Formal Analysis, V.H. and D.J.; Investigation, V.H. and D.J.; Resources, V.H. and D.J.; Data Curation, V.H., D.J. and M.J.A.; Writing-Original Draft Preparation, V.H., D.J., M.J.A. and L.M.; Writing-Review & Editing, V.H., D.J., M.J.A., L.M. and A.K.; Visualization, V.H., D.J., M.J.A. and L.M.; Supervision, V.H. and A.K.; Project Administration, V.H.; Funding Acquisition, V.H. and A.K.”, please turn to the CRediT taxonomy for the term explanation. Authorship must be limited to those who have contributed substantially to the work reported. All authors have read and agreed to the published version of the manuscript.

Funding

This research was funded by the Ministry of Science, Research and and the Arts Baden-Württemberg, grant number 7533-10-5-187. Financial support by the Ministry of Science, Research, and the Arts of Baden-Württemberg by means of a LGF grant for V. Hoffmann is gratefully acknowledged.

Conflicts of Interest

The authors declare no conflict of interest.

Appendix A

Table A1. Statistical analysis of the HTC processes.
HTC Yield %
SampleRep1Rep2MeanSTD
HTC-200-242.140.741.40.700
HTC-220-241.141.741.40.300
HTC-240-237.437.637.50.120
HTC-200-542.843.143.00.140
HTC-220-538.638.538.60.080
HTC-240-536.636.636.60.020
Average Standard Deviation 0.227
Rep1 = First measurement; Rep2 = Second measurement; Mean = Mean value of Rep1 and Rep2 as displayed in the manuscript; STD = Standard deviation of Rep1 and Rep2.
Table A2. Statistical analysis of the Elementary Analysis.
Nitrogen % Carbon % Hydrogen %
SampleRep1Rep2MeanSTDRep1Rep2MeanSTDRep1Rep2MeanSTD
Potatoe1.891.871.880.01240.0540.0140.030.0216.206.076.130.062
HTC-200-23.343.453.390.05963.3364.9664.150.8165.165.185.170.010
HTC220-23.373.403.390.01564.3264.1264.220.1004.845.004.920.079
HTC240-23.513.533.520.00767.8067.9067.850.0495.075.175.120.051
HTC-200-53.313.303.300.00465.1265.1665.140.0205.295.075.180.110
HTC-220-53.433.483.450.02865.9667.3366.650.6875.335.275.300.031
HTC-240-53.713.713.710.00272.0771.6371.850.2215.555.545.550.004
BM-P6002.692.662.670.01569.2169.0469.130.0841.541.401.470.069
BM-P9002.502.482.490.01167.1166.8766.990.1201.001.221.110.111
P600-200-23.853.883.870.01675.3877.6876.531.1491.261.391.320.067
P600-220-24.024.014.020.00677.9378.8178.370.4391.231.491.360.127
P600-240-23.623.993.800.18673.0681.2377.144.0871.301.541.420.120
P600-200-53.953.993.970.02278.1977.5977.890.3001.311.491.400.090
P600-220-53.693.893.790.10481.1081.0481.070.0312.041.821.930.107
P600-240-54.034.014.020.00880.6780.0080.330.3341.581.631.600.025
P900-200-23.483.503.490.01185.2285.4785.340.1220.370.210.290.084
P900-220-23.653.783.710.06584.3886.2585.320.9350.370.270.320.051
P900-240-23.753.743.750.00486.9687.0086.980.0180.290.200.240.045
P900-200-53.393.363.380.01581.1580.7980.970.1790.440.360.400.038
P900-220-53.533.513.520.00882.6482.7582.690.0530.310.300.310.005
P900-240-53.513.533.520.01083.6483.9183.770.1340.450.390.420.032
Average Standard Deviation 0.029 0.471 0.063
Rep1 = First measurement; Rep2 = Second measurement; Mean = Mean value of Rep1 and Rep2 as displayed in the manuscript; STD = Standard deviation of Rep1 and Rep2.

References

  1. Tititrici, M.-M. Sustainable Carbon Materials from Hydrothermal Processes; John Wiley & Sons, Ltd.: London, UK, 2013. [Google Scholar]
  2. Reif, K.; Noreikat, K.-E.; Borgeest, K. Kraftfahrzeug-Hybridantriebe; Vieweg+Teubner Verlag: Wiesbaden, Germany, 2012. [Google Scholar]
  3. Mahon, P.J.; Drummond, C.J. Essay: Supercapacitors—Nanostructured materials and nanoscale processes contributing to the next mobile generation. Aust. J. Chem. 2001, 54, 473. [Google Scholar] [CrossRef]
  4. Pandolfo, A.G.; Hollenkamp, A. Carbon properties and their role in supercapacitors. J. Power Sources 2006, 157, 11–27. [Google Scholar] [CrossRef]
  5. Shukla, A.K.; Sampath, S.; Vijayamohanan, K. Electrochemical supercapacitors: Energy storage beyond batteries. Curr. Sci. 2000, 79, 1656–1661. [Google Scholar]
  6. Frackowiak, E. Electrode materials with pseudocapacitive properties. In Supercapacitors; Wiley-VCH Verlag GmbH & Co. KGaA: Weinheim, Germany, 2013; pp. 207–237. [Google Scholar]
  7. Frackowiak, E.; Beguin, F. Carbon materials for the electrochemical storage of energy in capacitors. Carbon 2001, 39, 937–950. [Google Scholar] [CrossRef]
  8. Hsieh, C.-T.; Teng, H. Influence of oxygen treatment on electric double-layer capacitance of activated carbon fabrics. Carbon 2002, 40, 667–674. [Google Scholar] [CrossRef]
  9. Jung, D.; Zimmermann, M.; Kruse, A. Hydrothermal carbonization of fructose: Growth mechanism and kinetic model. ACS Sustain. Chem. Eng. 2018, 6, 13877–13887. [Google Scholar] [CrossRef]
  10. Inyang, M.; Gao, B.; Pullammanappallil, P.; Ding, W.; Zimmerman, A.R. Biochar from anaerobically digested sugarcane bagasse. Bioresour. Technol. 2010, 101, 8868–8872. [Google Scholar] [CrossRef] [PubMed]
  11. Chen, X.; Ma, X.; Peng, X.; Lin, Y.; Yao, Z. Conversion of sweet potato waste to solid fuel via hydrothermal carbonization. Bioresour. Technol. 2018, 249, 900–907. [Google Scholar] [CrossRef] [PubMed]
  12. Suwelack, K.; Wüst, D.; Zeller, M.; Kruse, A.; Krümpel, J. Hydrothermal carbonization of wheat straw—Prediction of product mass yields and degree of carbonization by severity parameter. Biomass Convers. Biorefin. 2015, 6, 347–354. [Google Scholar] [CrossRef]
  13. Hoffmann, V.; Correa, C.R.; Sautter, D.; Maringolo, E.; Kruse, A.; Hoffman, V. Study of the electrical conductivity of biobased carbonaceous powder materials under moderate pressure for the application as electrode materials in energy storage technologies. GCB Bioenergy 2018, 11, 230–248. [Google Scholar] [CrossRef] [Green Version]
  14. Hoffmann, V.; Jung, D.; Zimmermann, J.; Correa, C.R.; Elleuch, A.; Halouani, K.; Kruse, A. Conductive carbon materials from the hydrothermal carbonization of vineyard residues for the application in electrochemical double-layer capacitors (EDLCs) and direct carbon fuel cells (DCFCs). Materials 2019, 12, 1703. [Google Scholar] [CrossRef] [PubMed] [Green Version]
  15. Han, S.-W.; Jung, D.-W.; Jeong, J.-H.; Oh, E.-S. Effect of pyrolysis temperature on carbon obtained from green tea biomass for superior lithium ion battery anodes. Chem. Eng. J. 2014, 254, 597–604. [Google Scholar] [CrossRef]
  16. Lozano-Castello, D.; Marco-Lozar, J.P.; Bleda-Martínez, M.J.; Montilla, F.; Morallòn, E.; Linares-Solano, A.; Cazorla-Amorós, D. Relevance of porosity and surface chemistry of superactivated carbons in capacitors. Carbon N. Y. 2013, 57, 539. [Google Scholar] [CrossRef] [Green Version]
  17. Sanchez-Gonzalez, J.; Macias-Garcia, A.; Franco, M.A.; Gómez-Serrano, V. Electrical conductivity of carbon blacks under compression. Carbon 2005, 43, 741–747. [Google Scholar] [CrossRef]
  18. Hoffmann, V.; Alhnidi, M.J.; Correa, C.R.; Kruse, A. In-Situ functionalizing of HTC chars for the production of biobased electrode materials for electromobility. In Proceedings of the 2nd International Symposium on Hydrothermal Carbonization, Berlin, Germany, 14–16 May 2019; p. 160. [Google Scholar]
  19. Priyanga, K.; Reji, A.; Bhagat, J.k.; Anbuselvi, S. Production of organic manure from potato peel waste. Int. J. Chem.Tech. Res. 2016, 9, 845–847. [Google Scholar]
  20. Brendel, F. Kleine Makel-Grosse Folgen: Nahrungsmittelverschwendung am Beispiel Kartoffel; WWF Deutschland: Frankfurt am Main, Germany, 2017. [Google Scholar]
  21. Willersinn, C.; Mack, G.; Mouron, P.; Keiser, A.; Siegrist, M. Quantity and quality of food losses along the Swiss potato supply chain: Stepwise investigation and the influence of quality standards on losses. Waste Manag. 2015, 46, 120–132. [Google Scholar] [CrossRef]
  22. Bächtle, C.; Winkler, P.; Stellbrink, B. Eine frage der richtigen stärke. Chem. Unserer Zeit 2011, 45, 250–255. [Google Scholar] [CrossRef]
  23. Bleda-Martínez, M.; Maciá-Agulló, J.; Lozano-Castello, D.; Morallón, E.; Cazorla-Amorós, D.; Linares-Solano, A. Role of surface chemistry on electric double layer capacitance of carbon materials. Carbon 2005, 43, 2677–2684. [Google Scholar] [CrossRef] [Green Version]
  24. Brunauer, S.; Emmett, P.H.; Teller, E. Adsorption of gases in multimolecular layers. J. Am. Chem. Soc. 1938, 60, 309–319. [Google Scholar] [CrossRef]
  25. Holm, R. Elektrische Kontakte/Electric Contacts Handbook; Springer: Berlin/Heidelberg, Germany, 1958. [Google Scholar]
  26. Celzard, A.; Marêché, J.; Payot, F.; Furdin, G. Electrical conductivity of carbonaceous powders. Carbon 2002, 40, 2801–2815. [Google Scholar] [CrossRef]
  27. Heinze, J. Cyclovoltammetrie—Die ”Spektroskopie” des Elektrochemikers. Angew. Chem. 1984, 96, 823–840. [Google Scholar] [CrossRef]
  28. Pröbstle, H.; Wiener, M.; Fricke, J. Carbon aerogels for electrochemical double layer capacitors. J. Porous Mater. 2003, 10, 213–222. [Google Scholar] [CrossRef]
  29. Choi, J.-H. Fabrication of a carbon electrode using activated carbon powder and application to the capacitive deionization process. Sep. Purif. Technol. 2010, 70, 362–366. [Google Scholar] [CrossRef]
  30. Falco, C.; Baccile, N.; Titirici, M.-M. Morphological and structural differences between glucose, cellulose and lignocellulosic biomass derived hydrothermal carbons. Green Chem. 2011, 13, 3273. [Google Scholar] [CrossRef] [Green Version]
  31. Karayıldırım, T.; Sınağ, A.; Kruse, A. Char and coke formation as unwanted side reaction of the hydrothermal biomass gasification. Chem. Eng. Technol. 2008, 31, 1561–1568. [Google Scholar] [CrossRef]
  32. Correa, C.R.; Kruse, A. Biobased functional carbon materials: Production, characterization, and applications—A review. Materials 2018, 11, 1568. [Google Scholar] [CrossRef] [Green Version]
  33. Antal, M.J.; Mok, W.S.; Richards, G.N. Mechanism of formation of 5-(hydroxymethyl)-2-furaldehyde from d-fructose and sucrose. Carbohydr. Res. 1990, 199, 91–109. [Google Scholar] [CrossRef]
  34. Kruse, A.; Badoux, F.; Grandl, R.; Wüst, D. Hydrothermal carbonization: 2. kinetics of draff conversion. Chem. Ing. Tech. 2012, 84, 509–512. [Google Scholar] [CrossRef]
  35. Yu, Q.-Z.; Brage, C.; Chen, G.-X.; Sjöström, K. The fate of fuel-nitrogen during gasification of biomass in a pressurised fluidised bed gasifier. Fuel 2007, 86, 611–618. [Google Scholar] [CrossRef]
  36. Thommes, M.; Kaneko, K.; Neimark, A.V.; Olivier, J.P.; Rodriguez-Reinoso, F.; Rouquerol, J.; Sing, K.S. Physisorption of gases, with special reference to the evaluation of surface area and pore size distribution (IUPAC Technical Report). Pure Appl. Chem. 2015, 87, 1051–1069. [Google Scholar] [CrossRef] [Green Version]
  37. Barroso-Bogeat, A.; Franco, M.A.; Fernández-González, C.; Macias-Garcia, A.; Gómez-Serrano, V. Electrical conductivity of activated carbon–metal oxide nanocomposites under compression: A comparison study. Phys. Chem. Chem. Phys. 2014, 16, 25161–25175. [Google Scholar] [CrossRef] [PubMed]
  38. Pakuła, M.; Swiatkowski, A.; Biniak, S. Electrochemical behaviour of modified activated carbons in aqueous and nonaqueous solutions. J. Appl. Electrochem. 1995, 25, 1038–1044. [Google Scholar] [CrossRef]
  39. Sevilla, M.; Fuertes, A.B. The production of carbon materials by hydrothermal carbonization of cellulose. Carbon 2009, 47, 2281–2289. [Google Scholar] [CrossRef] [Green Version]
  40. Garlapalli, R.K.; Wirth, B.; Reza, M.T. Pyrolysis of hydrochar from digestate: Effect of hydrothermal carbonization and pyrolysis temperatures on pyrochar formation. Bioresour. Technol. 2016, 220, 168–174. [Google Scholar] [CrossRef]
  41. Sing, K.S.W. Reporting physisorption data for gas/solid systems with special reference to the determination of surface area and porosity (Recommendations 1984). Pure Appl. Chem. 1985, 57, 603–619. [Google Scholar] [CrossRef]
  42. Rouquerol, F.; Rouquerol, J.; Sing, K. Adsorption by Powders and Porous Solids: Principles, Methodology and Applications; Academic Press: London, 1999. [Google Scholar]
  43. Thommes, M. Physical adsorption characterization of nanoporous materials. Chem. Ing. Tech. 2010, 82, 1059–1073. [Google Scholar] [CrossRef]
  44. Dieguez-Alonso, A.; Funke, A.; Anca-Couce, A.; Rombola’, A.G.; Ojeda, G.; Bachmann, J.; Behrendt, F. Towards biochar and hydrochar engineering—Influence of process conditions on surface physical and chemical properties, thermal stability, nutrient availability, toxicity and wettability. Energies 2018, 11, 496. [Google Scholar] [CrossRef] [Green Version]
  45. Lua, A.C.; Yang, T. Effect of activation temperature on the textural and chemical properties ofpotassium hydroxide activated carbon prepared from pistachio-nut shell. J. Colloid Interface Sci. 2004, 274, 594–601. [Google Scholar] [CrossRef]
  46. Sun, X.; Li, Y. Colloidal carbon spheres and their core/shell structures with noble-metal nanoparticles. Angew. Chem. 2004, 43, 597–601. [Google Scholar] [CrossRef]
  47. Günzler, H.; Gremlich, H.U. IR-Spektroskopie: Eine Einführung; Wiley: Weinheim, Germany, 2012. [Google Scholar]
  48. Araujo-Andrade, C.; Ruiz, F.; Martínez-Mendoza, J.; Terrones, H. Infrared and Raman spectra, conformational stability, ab initio calculations of structure, and vibrational assignment of α and β glucose. J. Mol. Struct. THEOCHEM 2005, 714, 143–146. [Google Scholar] [CrossRef]
  49. Ibarra, J.; Muñoz, E.; Moliner, R. FTIR study of the evolution of coal structure during the coalification process. Org. Geochem. 1996, 24, 725–735. [Google Scholar] [CrossRef]
  50. Biniak, S.; Swiatkowski, A.; Pakula, M.; Radovic, R. Chemistry and Physics of Carbon; Marcel Dekker: New York, NY, USA; Basel, Switzerland, 2017; Volume 27. [Google Scholar]
  51. Stiny, L. Aktive Elektronische Bauelemente Aufbau, Struktur, Wirkungsweise, Eigenschaften und Praktischer Einsatz Diskreter und Integrierter Halbleiter-Bauteile; Springer: Heidelberg, Germany, 2016. [Google Scholar]
  52. Bandosz, T.; Ania, C. Chapter 4 surface chemistry of activated carbons and its characterization. In Interface Science and Technology; Academic Press Inc.: San Diego, CA, USA, 2006; Volume 7, pp. 159–229. [Google Scholar]
  53. Kötz, R.; Carlen, M. Principles and applications of electrochemical capacitors. Electrochim. Acta 2000, 45, 2483–2498. [Google Scholar] [CrossRef]
  54. Lozano-Castello, D.; Cazorla-Amorós, D.; Linares-Solano, A.; Shiraishi, S.; Kurihara, H.; Oya, A. Influence of pore structure and surface chemistry on electric double layer capacitance in non-aqueous electrolyte. Carbon 2003, 41, 1765–1775. [Google Scholar] [CrossRef]
  55. Salitra, G.; Soffer, A.; Eliad, L.; Cohen, Y.; Aurbach, D. Carbon electrodes for double-layer capacitors I. Relations between ion and pore dimensions. J. Electrochem. Soc. 2000, 147, 2486–2493. [Google Scholar] [CrossRef]
  56. Qu, D.; Shi, H. Studies of activated carbons used in double-layer capacitors. J. Power Sources 1998, 74, 99–107. [Google Scholar] [CrossRef]
  57. Iro, Z.S. A brief review on electrode materials for supercapacitor. Int. J. Electrochem. Sci. 2016, 11, 10628–10643. [Google Scholar] [CrossRef]
  58. Wei, L.; Sevilla, M.; Fuertes, A.B.; Mokaya, R.; Yushin, G. Hydrothermal carbonization of abundant renewable natural organic chemicals for high-performance supercapacitor electrodes. Adv. Energy Mater. 2011, 1, 356–361. [Google Scholar] [CrossRef] [Green Version]
  59. Hulicova-Jurcakova, D.; Kodama, M.; Shiraishi, S.; Hatori, H.; Zhu, Z.; Lu, G. Nitrogen-enriched nonporous carbon electrodes with extraordinary supercapacitance. Adv. Funct. Mater. 2009, 19, 1800–1809. [Google Scholar] [CrossRef]
  60. Yan, L.; Yu, J.; Houston, J.; Flores, N.; Luo, H. Biomass derived porous nitrogen doped carbon for electrochemical devices. Green Energy Environ. 2017, 2, 84–99. [Google Scholar] [CrossRef]
  61. Okajima, K.; Ohta, K.; Sudoh, M. Capacitance behavior of activated carbon fibers with oxygen-plasma treatment. Electrochim. Acta 2005, 50, 2227–2231. [Google Scholar] [CrossRef]
  62. Raymundo-Piñero, E.; Čadek, M.; Beguin, F. Tuning carbon materials for supercapacitors by direct pyrolysis of seaweeds. Adv. Funct. Mater. 2009, 19, 1032–1039. [Google Scholar] [CrossRef]
  63. Rafiee, J.; Mi, X.; Gullapalli, H.; Thomas, A.V.; Yavari, F.; Shi, Y.; Ajayan, P.M.; Koratkar, N.A. Wetting transparency of graphene. Nat. Mater. 2012, 11, 217–222. [Google Scholar] [CrossRef] [PubMed]
  64. Benedix, R. Redoxreaktionen—Grundlagen der elektrochemie. In Bauchemie; Vieweg+Teubner: Wiesbaden, Germany, 2008; pp. 206–230. [Google Scholar]
Figure 1. Van Krevelen diagram of the biomass and the chars.
Energies 13 02406 g001
Figure 2. Van Krevelen diagram of pyrochars and pyrolyzed hydrochars.
Energies 13 02406 g002
Figure 3. Sorption isotherm of sample HTC-200-5. Adsorptive gas: nitrogen.
Energies 13 02406 g003
Figure 4. Specific surface areas of BET measurements with nitrogen for PHC600 and PHC900.
Energies 13 02406 g004
Figure 5. Adsorption isotherm P600-200-5. Adsorptive: nitrogen.
Energies 13 02406 g005
Figure 6. Adsorption isotherm of P900-200-2 (adsorption gas: nitrogen).
Energies 13 02406 g006
Figure 7. Electric conductivity (±max. 10 S m−1) and bulk density (standard deviation 0.01 g cm−3) of the PHC600 (top) and the PHC900 (bottom) samples. For each char, four levels of compression with the weights 0.199 kg; 2.199 kg; 5.199 kg, and 10.199 kg (from left to right) are shown.
Energies 13 02406 g007
Figure 8. Electrical conductivity of PHC600 and PC600 (top) and PHC900 and PC900 (bottom) with increasing compression (± max. 10 S m−1).
Energies 13 02406 g008
Figure 9. Fourier transform infrared spectroscopy (FTIR) spectrum of hydrochar HTC-220-5.
Energies 13 02406 g009
Figure 10. FTIR spectrum of char P900-240-2.
Energies 13 02406 g010
Figure 11. FTIR spectrum of char P600-240-5.
Energies 13 02406 g011
Figure 12. Cyclovoltamograms of the samples (A) P600-200-2, (B) P600-200-5, (C) P600-220-2, and (D) P600-220-5.
Energies 13 02406 g012
Figure 13. Cyclovoltamograms of the samples (A) P900-200-2, (B) P900-200-5, (C) P900-220-2, and (D) P900-220-5.
Energies 13 02406 g013
Table 1. Yield, Carbon Yield of HTC and Pyrolysis and elemental composition, and ash content of all coals and biomass. Yield is always related to its direct precursor. In the case of hydrochars (HC) and pyrochars (PC) it is related to the amount of biomass, whereas pyrolyzed hydrochars (PHC) yield is related to amount HC.
SampleHTCPyrolysisYieldC 1HNOCarbon Yield 2Carbon Yield 3Ash
°Ch°Cwt.%wt.%wt.%wt.%wt.%wt.%wt.%wt.%
Potato 40.0 (42)6.11.947.4 4.4
HTC-200-22002-41.464.1 (66)5.23.424.5 66.32.7
HTC-220-22202-41.464.2 (66)4.93.424.3 66.43.1
HTC-240-22402-37.567.9 (70)5.13.520.8 63.52.7
HTC-200-52005-43.065.1 (67)5.23.322.9 69.93.4
HTC-220-52205-38.666.6 (68)5.33.522.0 64.22.5
HTC-240-52405-36.671.9 (73)5.53.716.8 65.72.1
P600-200-2200260050.476.5 (82)1.33.912.160.239.96.1
P600-220-2220260051.078.4 (83)1.44.011.162.241.35.1
P600-240-2240260060.677.1 (80)1.43.813.568.943.74.1
P600-200-5200560051.577.9 (83)1.44.010.961.643.15.8
P600-220-5220560059.581.1 (85)1.93.88.972.446.54.3
P600-240-5240560060.680.3 (83)1.64.010.767.844.53.3
P900-200-2200290048.785.3 (91)0.33.54.964.742.95.8
P900-220-2220290050.785.3 (89)0.33.76.167.444.84.5
P900-240-2240290053.487.0 (90)0.23.75.568.543.53.5
P900-200-5200590049.081.0 (86)0.43.49.660.942.65.6
P900-220-5220590052.882.7 (87)0.33.59.065.542.04.5
P900-240-5240590053.083.8 (88)0.43.57.161.840.65.1
P600 60026.569.1 (83)1.52.710.3 45.816.3
P900 90027.167.0 (81)1.12.512.2 45.417.2
1 the ash-free carbon content is displayed in parentheses; 2 related to Hydrochar; 3 related to Biomass.
Table 2. Results of the specific surfaces measured with nitrogen and carbon dioxide and the electrical conductivity and bulk density.
SampleN2CO2ECBulk Density
(m2 g−1)(m2 g−1)(S m−1)(kg m−3)
HTC-220-21.8-00.55
HTC-220-21.3-00.41
HTC-240-21.6-00.33
HTC-200-52.0-00.34
HTC-220-51.7-00.32
HTC-240-51.4-00.31
P600-200-278293520.41
P600-220-2862941060.48
P600-240-223-530.39
P600-200-579290380.36
P600-220-51920290.35
P600-240-514-210.37
P600 2741050.91
P900-200-24.72881650.43
P900-220-212.5891270.49
P900-240-26.8-1400.47
P900-200-54.73301730.49
P900-220-52.6-2000.51
P900-240-52.5-2040.48
P900 2.3480.83
Table 3. Conditions and results of cyclovoltametric measurements.
FeedstockScan Rate
[Vs−1]
Voltage Range
[∆V]
Charge Measured Q
[As]
Capacity C
[Fg−1]
P600-200-20.31.10.010342.16
0.11.10.007484.68
0.051.10.005697.11
0.011.10.0043026.86
P600-220-20.30.70.002640.92
0.10.70.001521.58
0.050.70.000370.77
0.010.70.000010.15
P600-200-50.30.750.003091.84
0.10.750.002033.62
0.050.750.000822.93
0.010.750.0013023.18
P600-220-50.30.20.000774.70
0.10.20.0007513.76
0.050.20.0007627.85
0.010.20.00073134.15
P900-200-20.30.20.001041.28
0.10.20.000863.19
0.050.20.000846.22
0.010.20.0008531.49
P900-220-20.30.20.001191.46
0.10.20.001274.67
0.050.20.001349.84
0.010.20.0012947.28
P900-200-50.30.90.005931.46
0.10.90.004584.67
0.050.90.004979.84
0.010.90.0041434.25
P900-220-50.30.20.003284.15
0.10.20.0031511.94
0.050.20.0030823.40
0.010.20.00313118.70
Table 4. Interdependencies between selected physico-chemical and electrochemical properties of advanced carbon materials from biomass (− = negative impact, + = positive impact, +/− = no specific impact or impact of minor importance or interaction not fully understood yet) *.
Electrochemical PropertiesExamples
Electric ConductivitySpecific Capacity
physico-chemical propertiesmicroscopichigh content of carbon-oxygen complexesacidic surface oxides (carboxylic, lactonic, phenolic), formation between 200 and 700 °C, low stability (−)
O-containing surface functionalities increase the barrier for electron transfer leading to higher equivalent series resistance (ESR)
(−)
higher ESR leads to decreased capacity(+)
high content of O-functionalities lead to pseudcapacitive effects, better wettability = improved pore access and surface utilization
−P-600-220-5:
high O-content on carbon surface → low EC, high specific capacity due to pseudocapacitive effects
−P-900-220-5:
lower O-content on surface due to higher temperature treatment, O incorporated in C-lattice and graphitized structure → higher EC values, higher SSA → specific capacity value due to double-layer capacitance
basic surface oxides, chemisorption during high temperature treatment, higher stability
neutral surface-oxides, chemisorption during high temperature treatment higher stability
high specific surface areamicroporous(+/−)
influence of SSA on EC is overshadowed by other factors such as intrinsic EC of carbon particles and particle contact
macroporous
macroscopicelectrode productionbinder type and content, other additives, type of current collector etc.(−)
if high binder content
(+)
if low binder content and conductive additive
(+/−)
depending on interfacial electrical resistance between carbon and collector, binder content etc.
* Based on [4].

