A Modified Bursting Energy Index for Evaluating Coal Burst Proneness and Its Application in Ordos Coalfield, China


Abstract
:1. Introduction
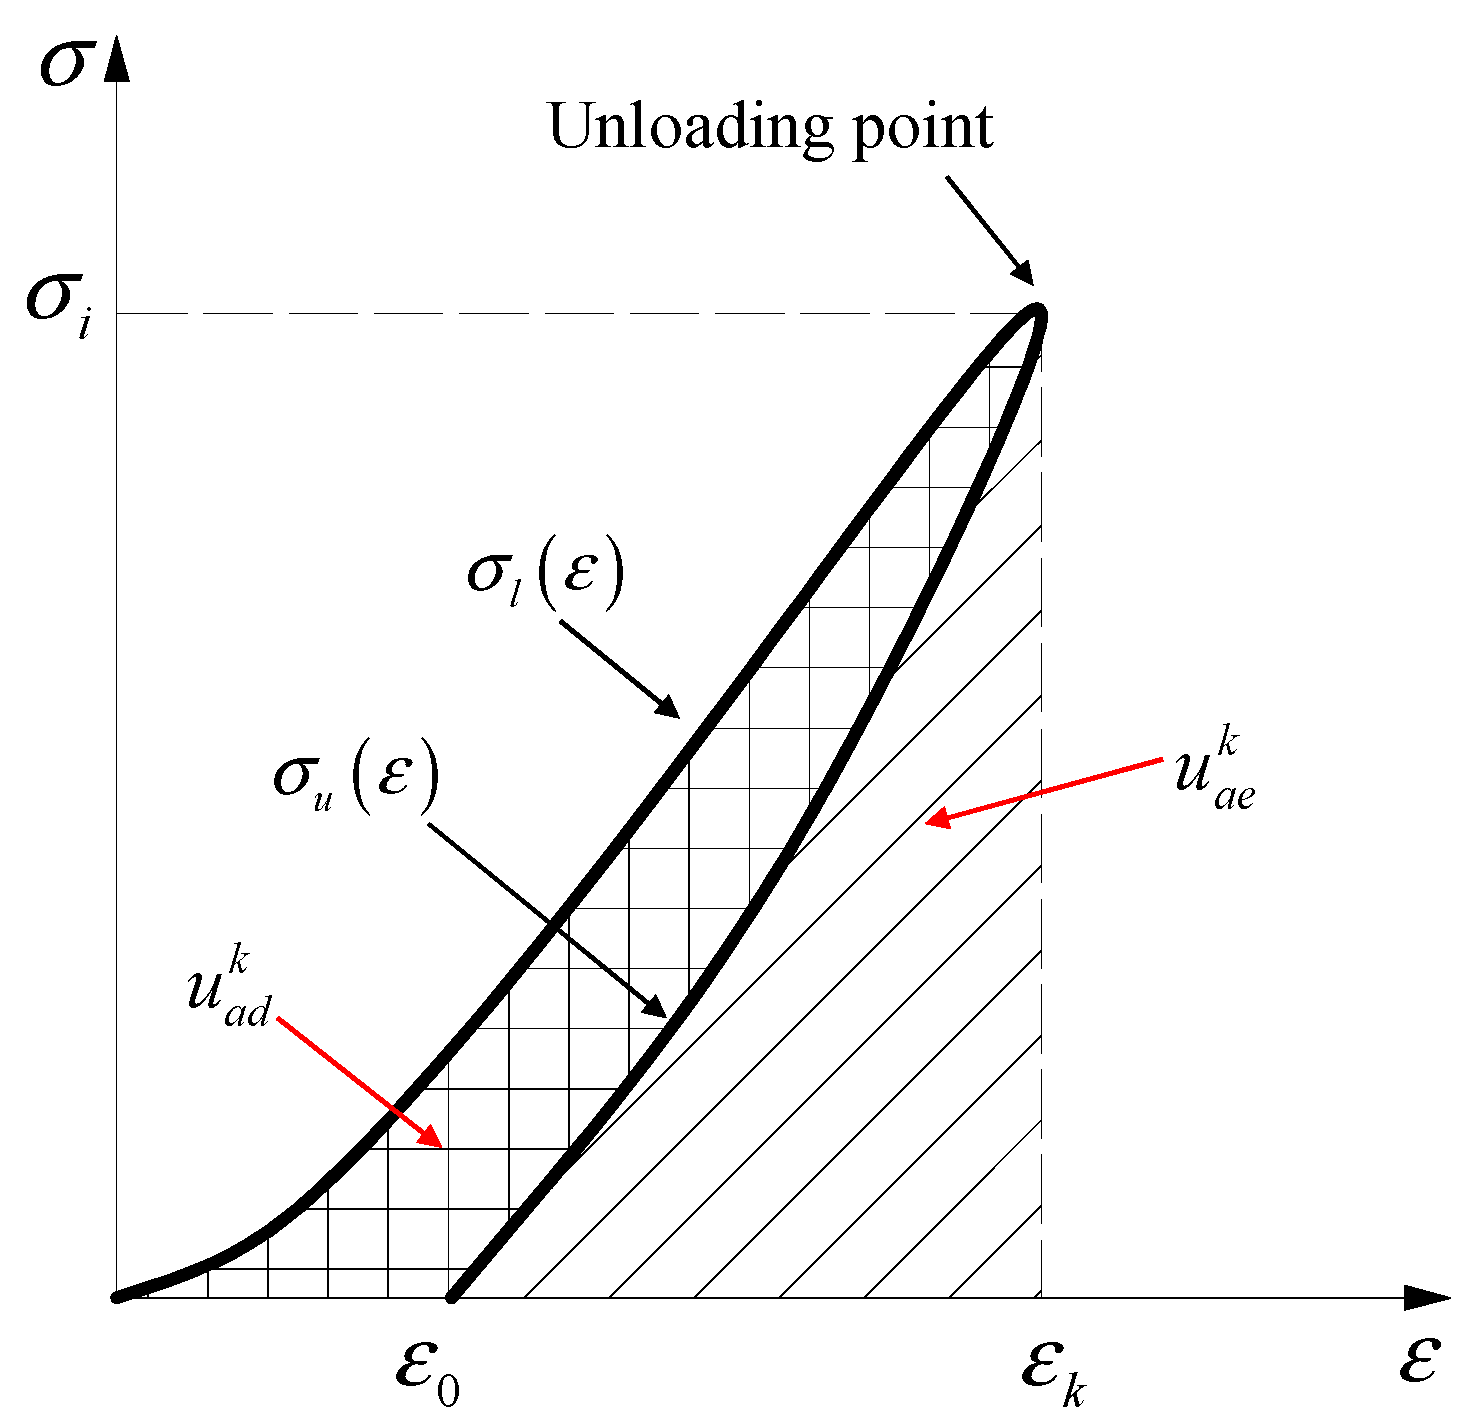
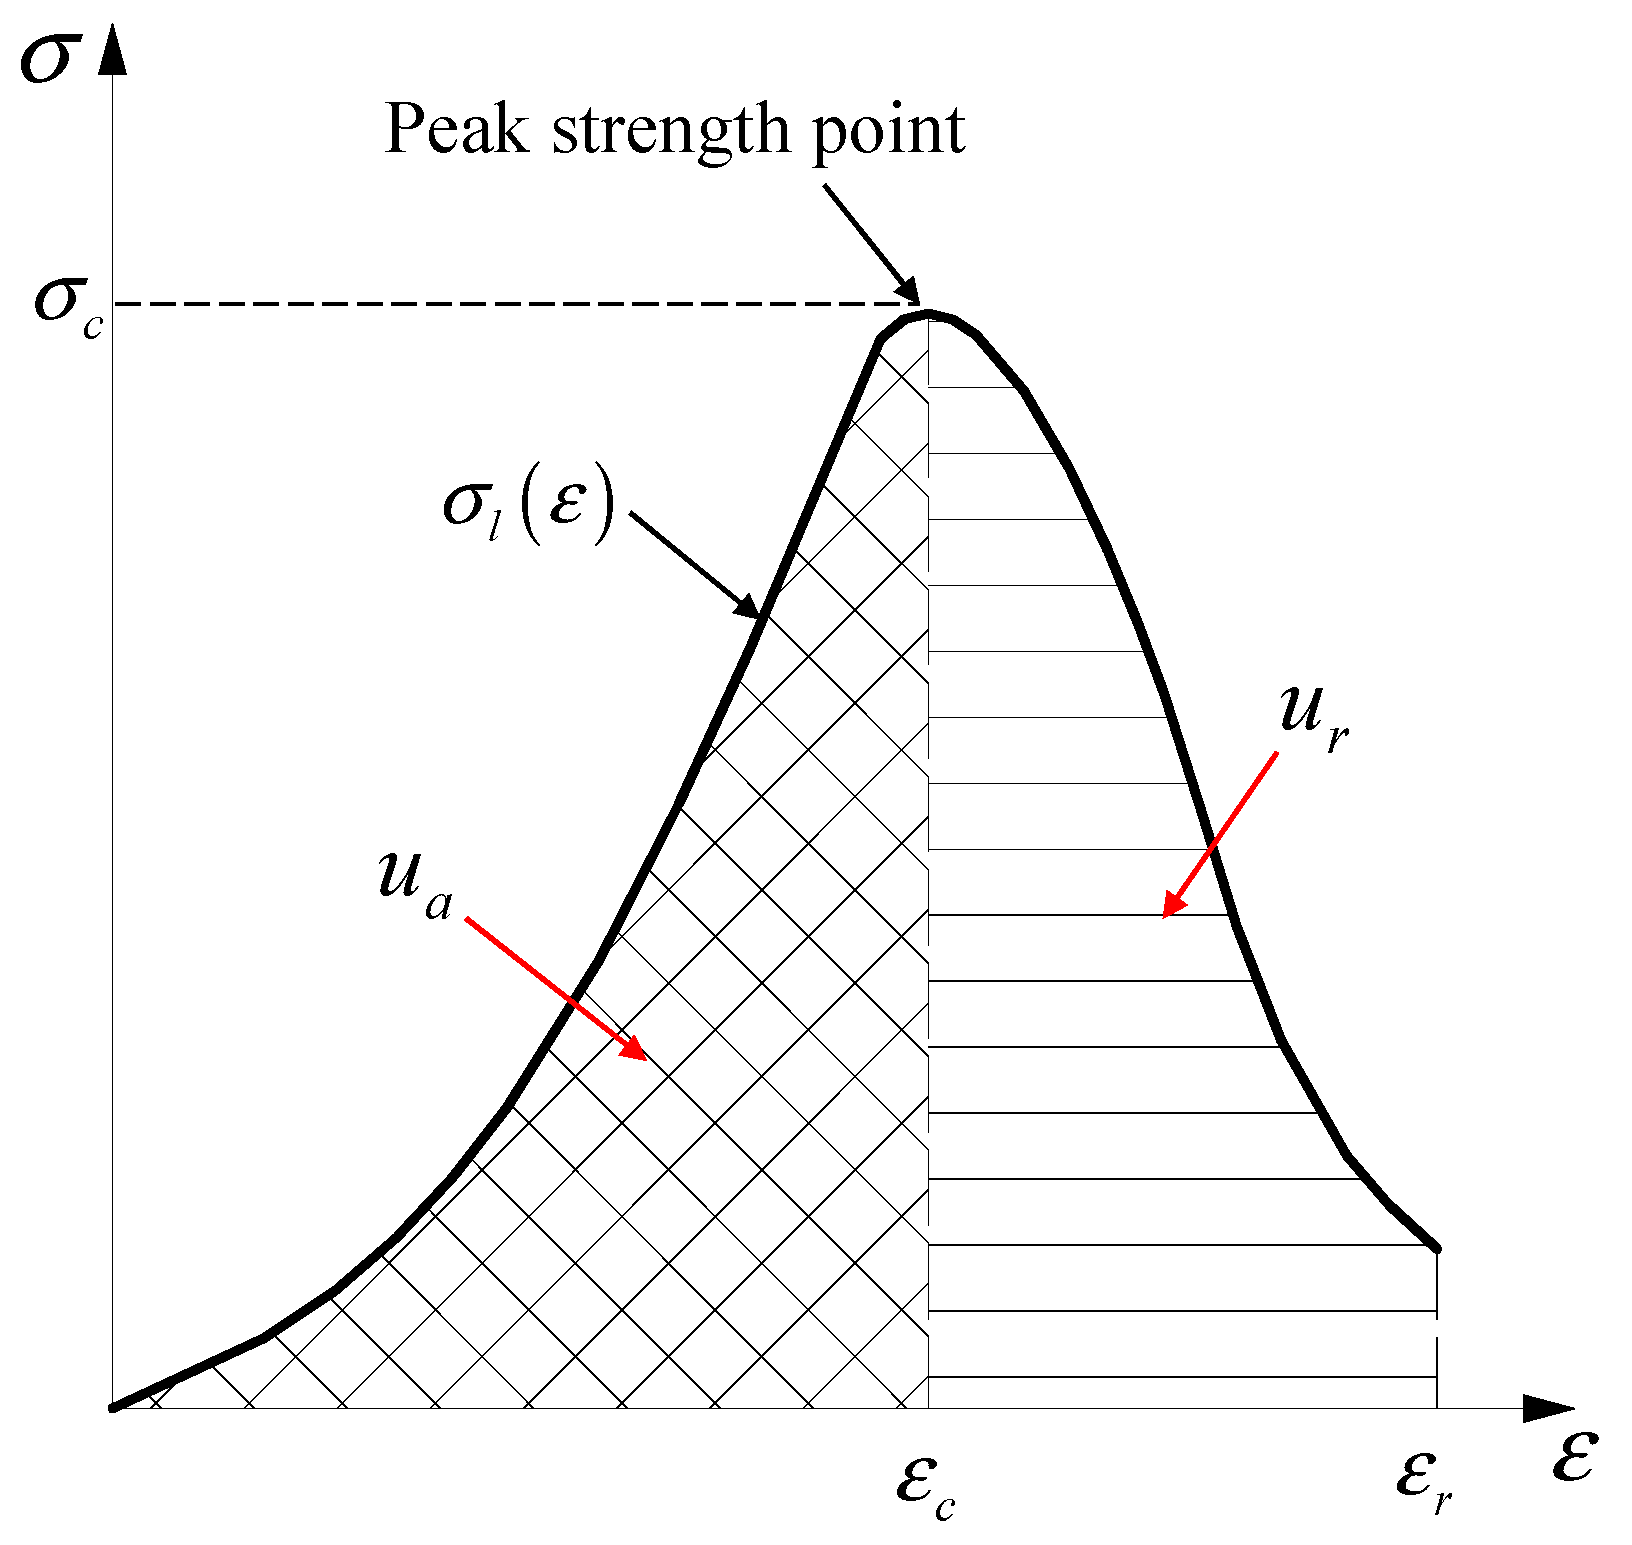
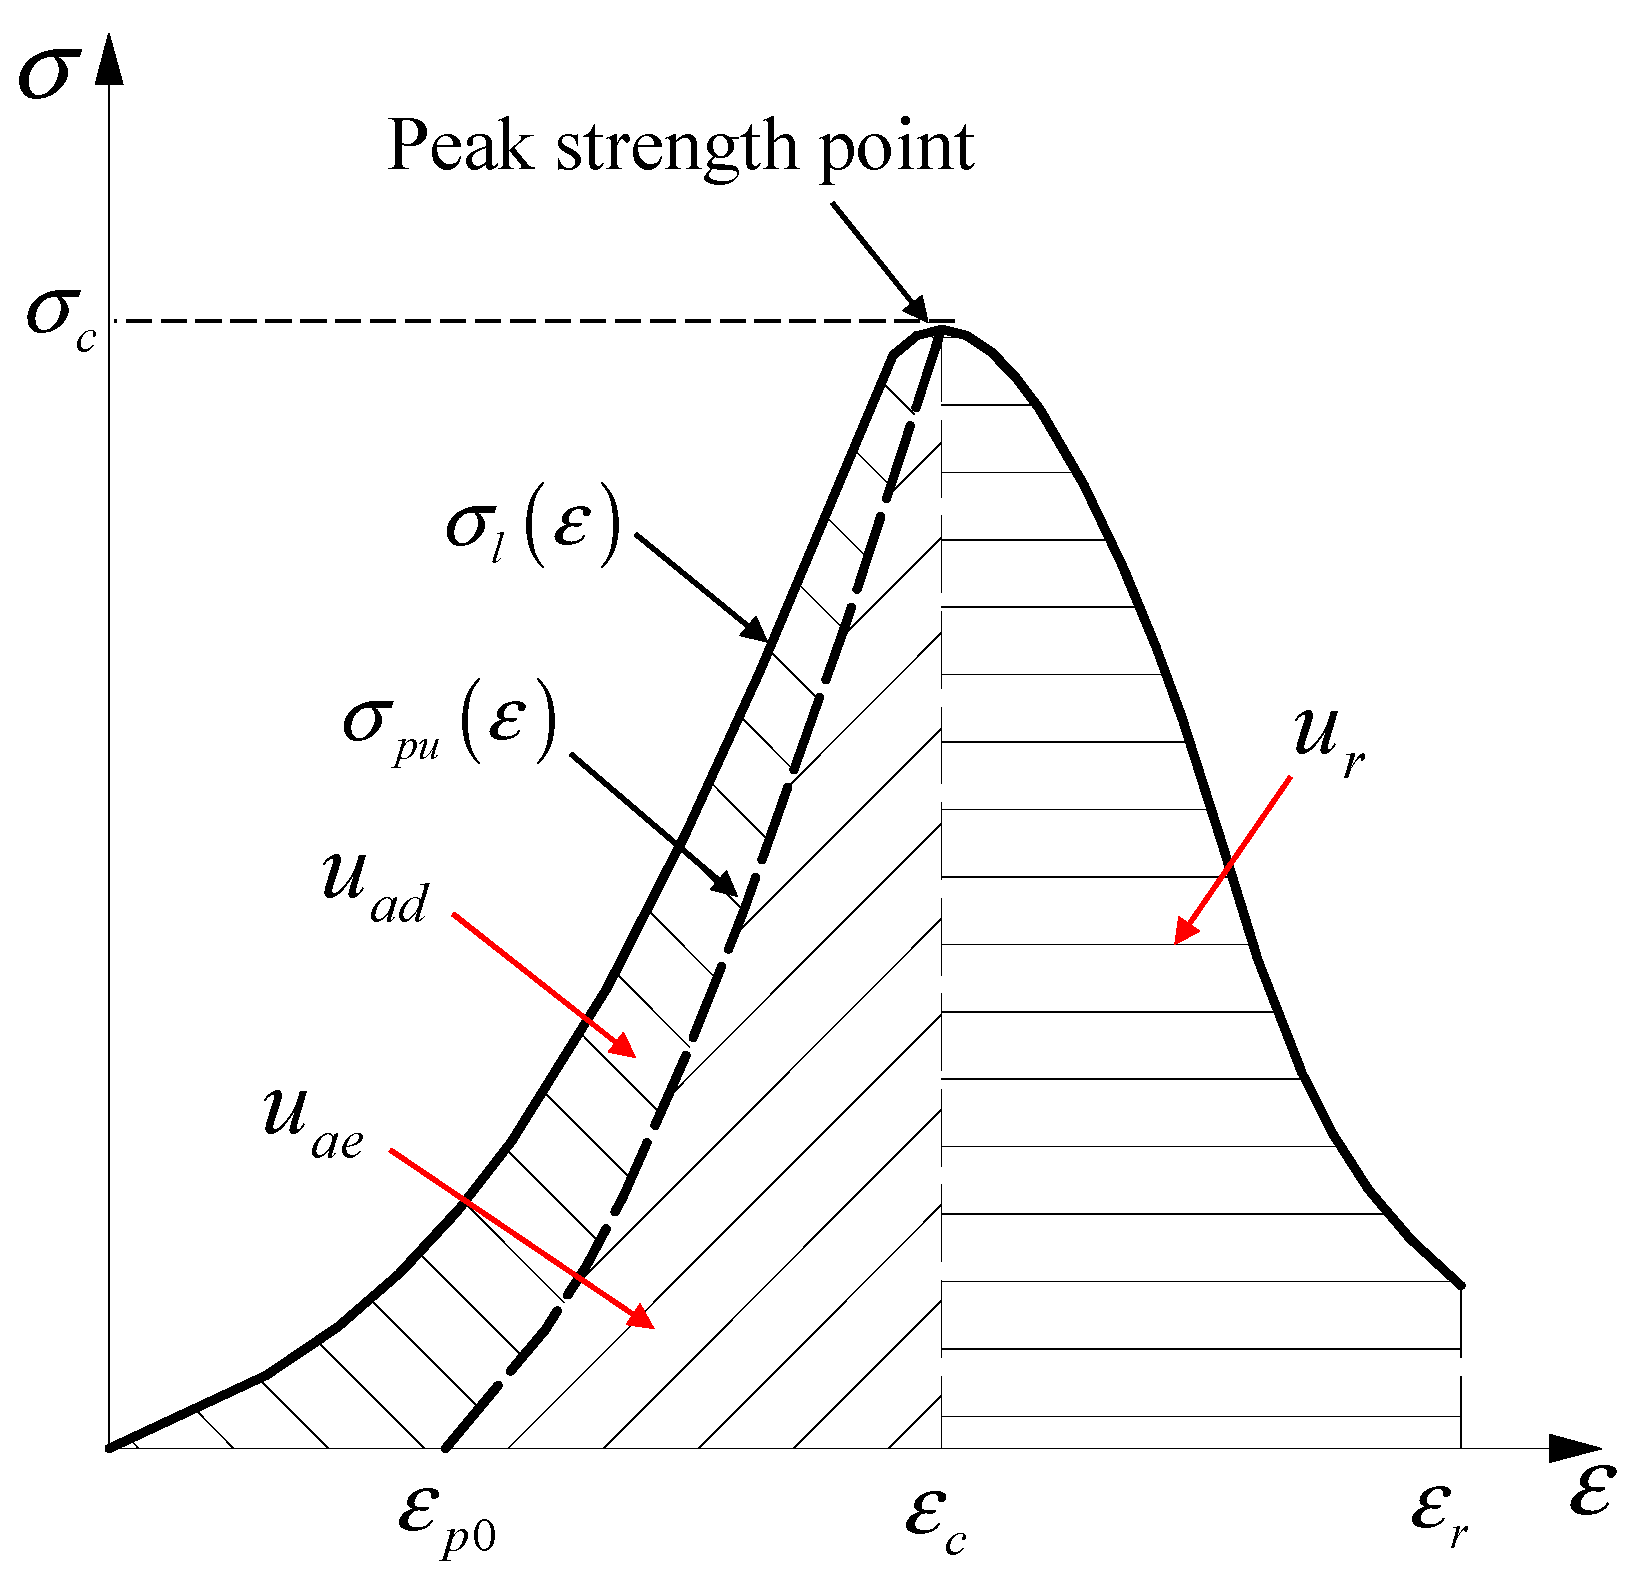
2. Brief Descriptions of Coal Burst Proneness Indexes
3. Modified Bursting Energy Index
3.1. Definition of the Modified Index
3.2. Calculation Method for Index
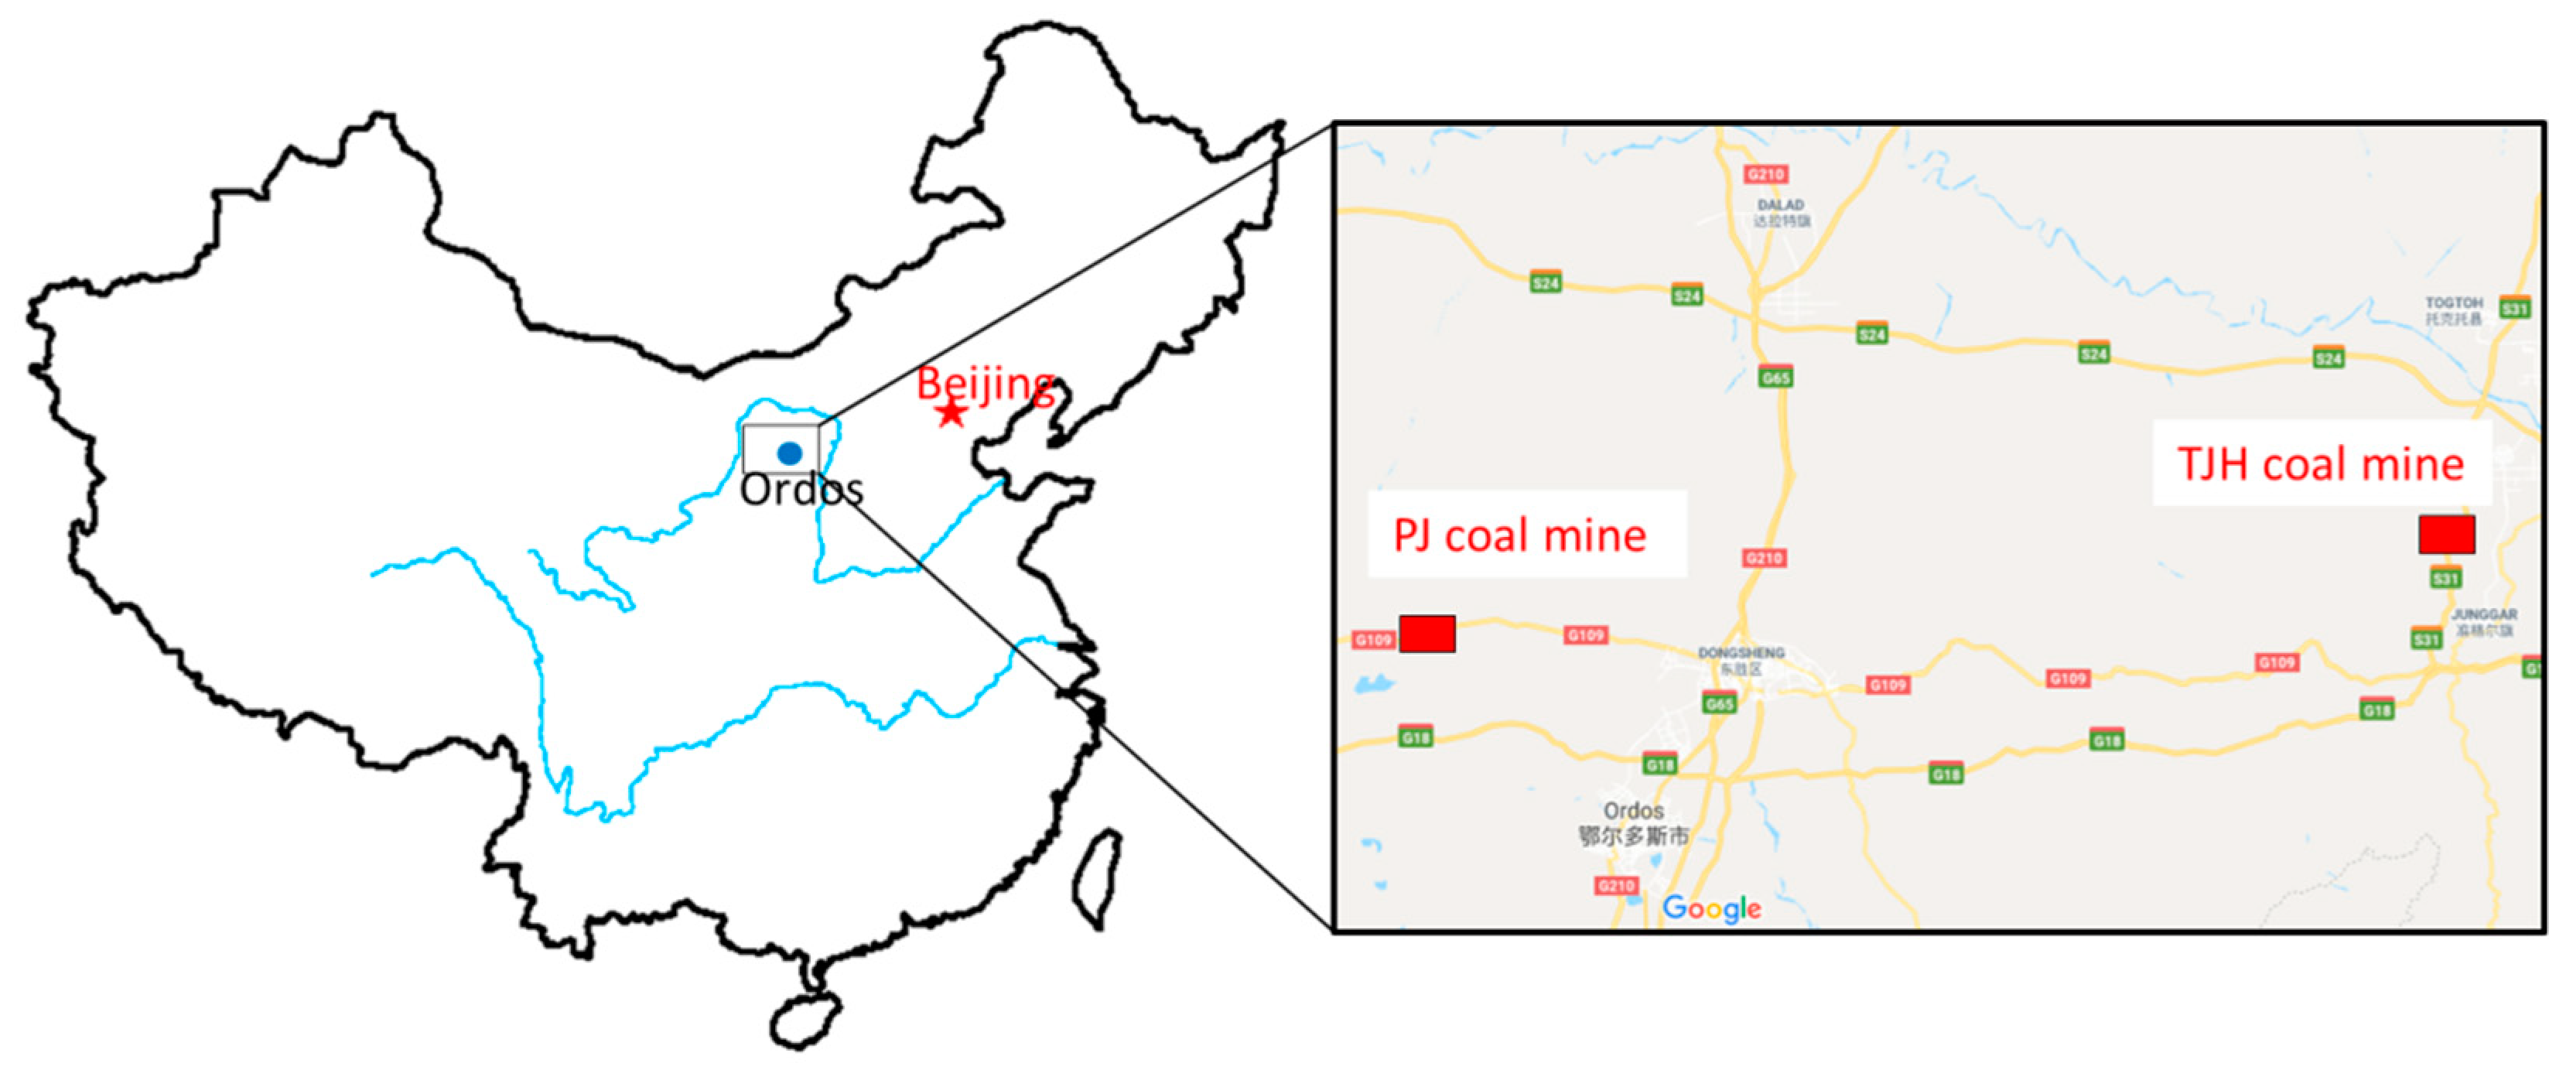
4. Coal Burst Proneness Evaluation in Coal Mines
4.1. PJ Coal Mine
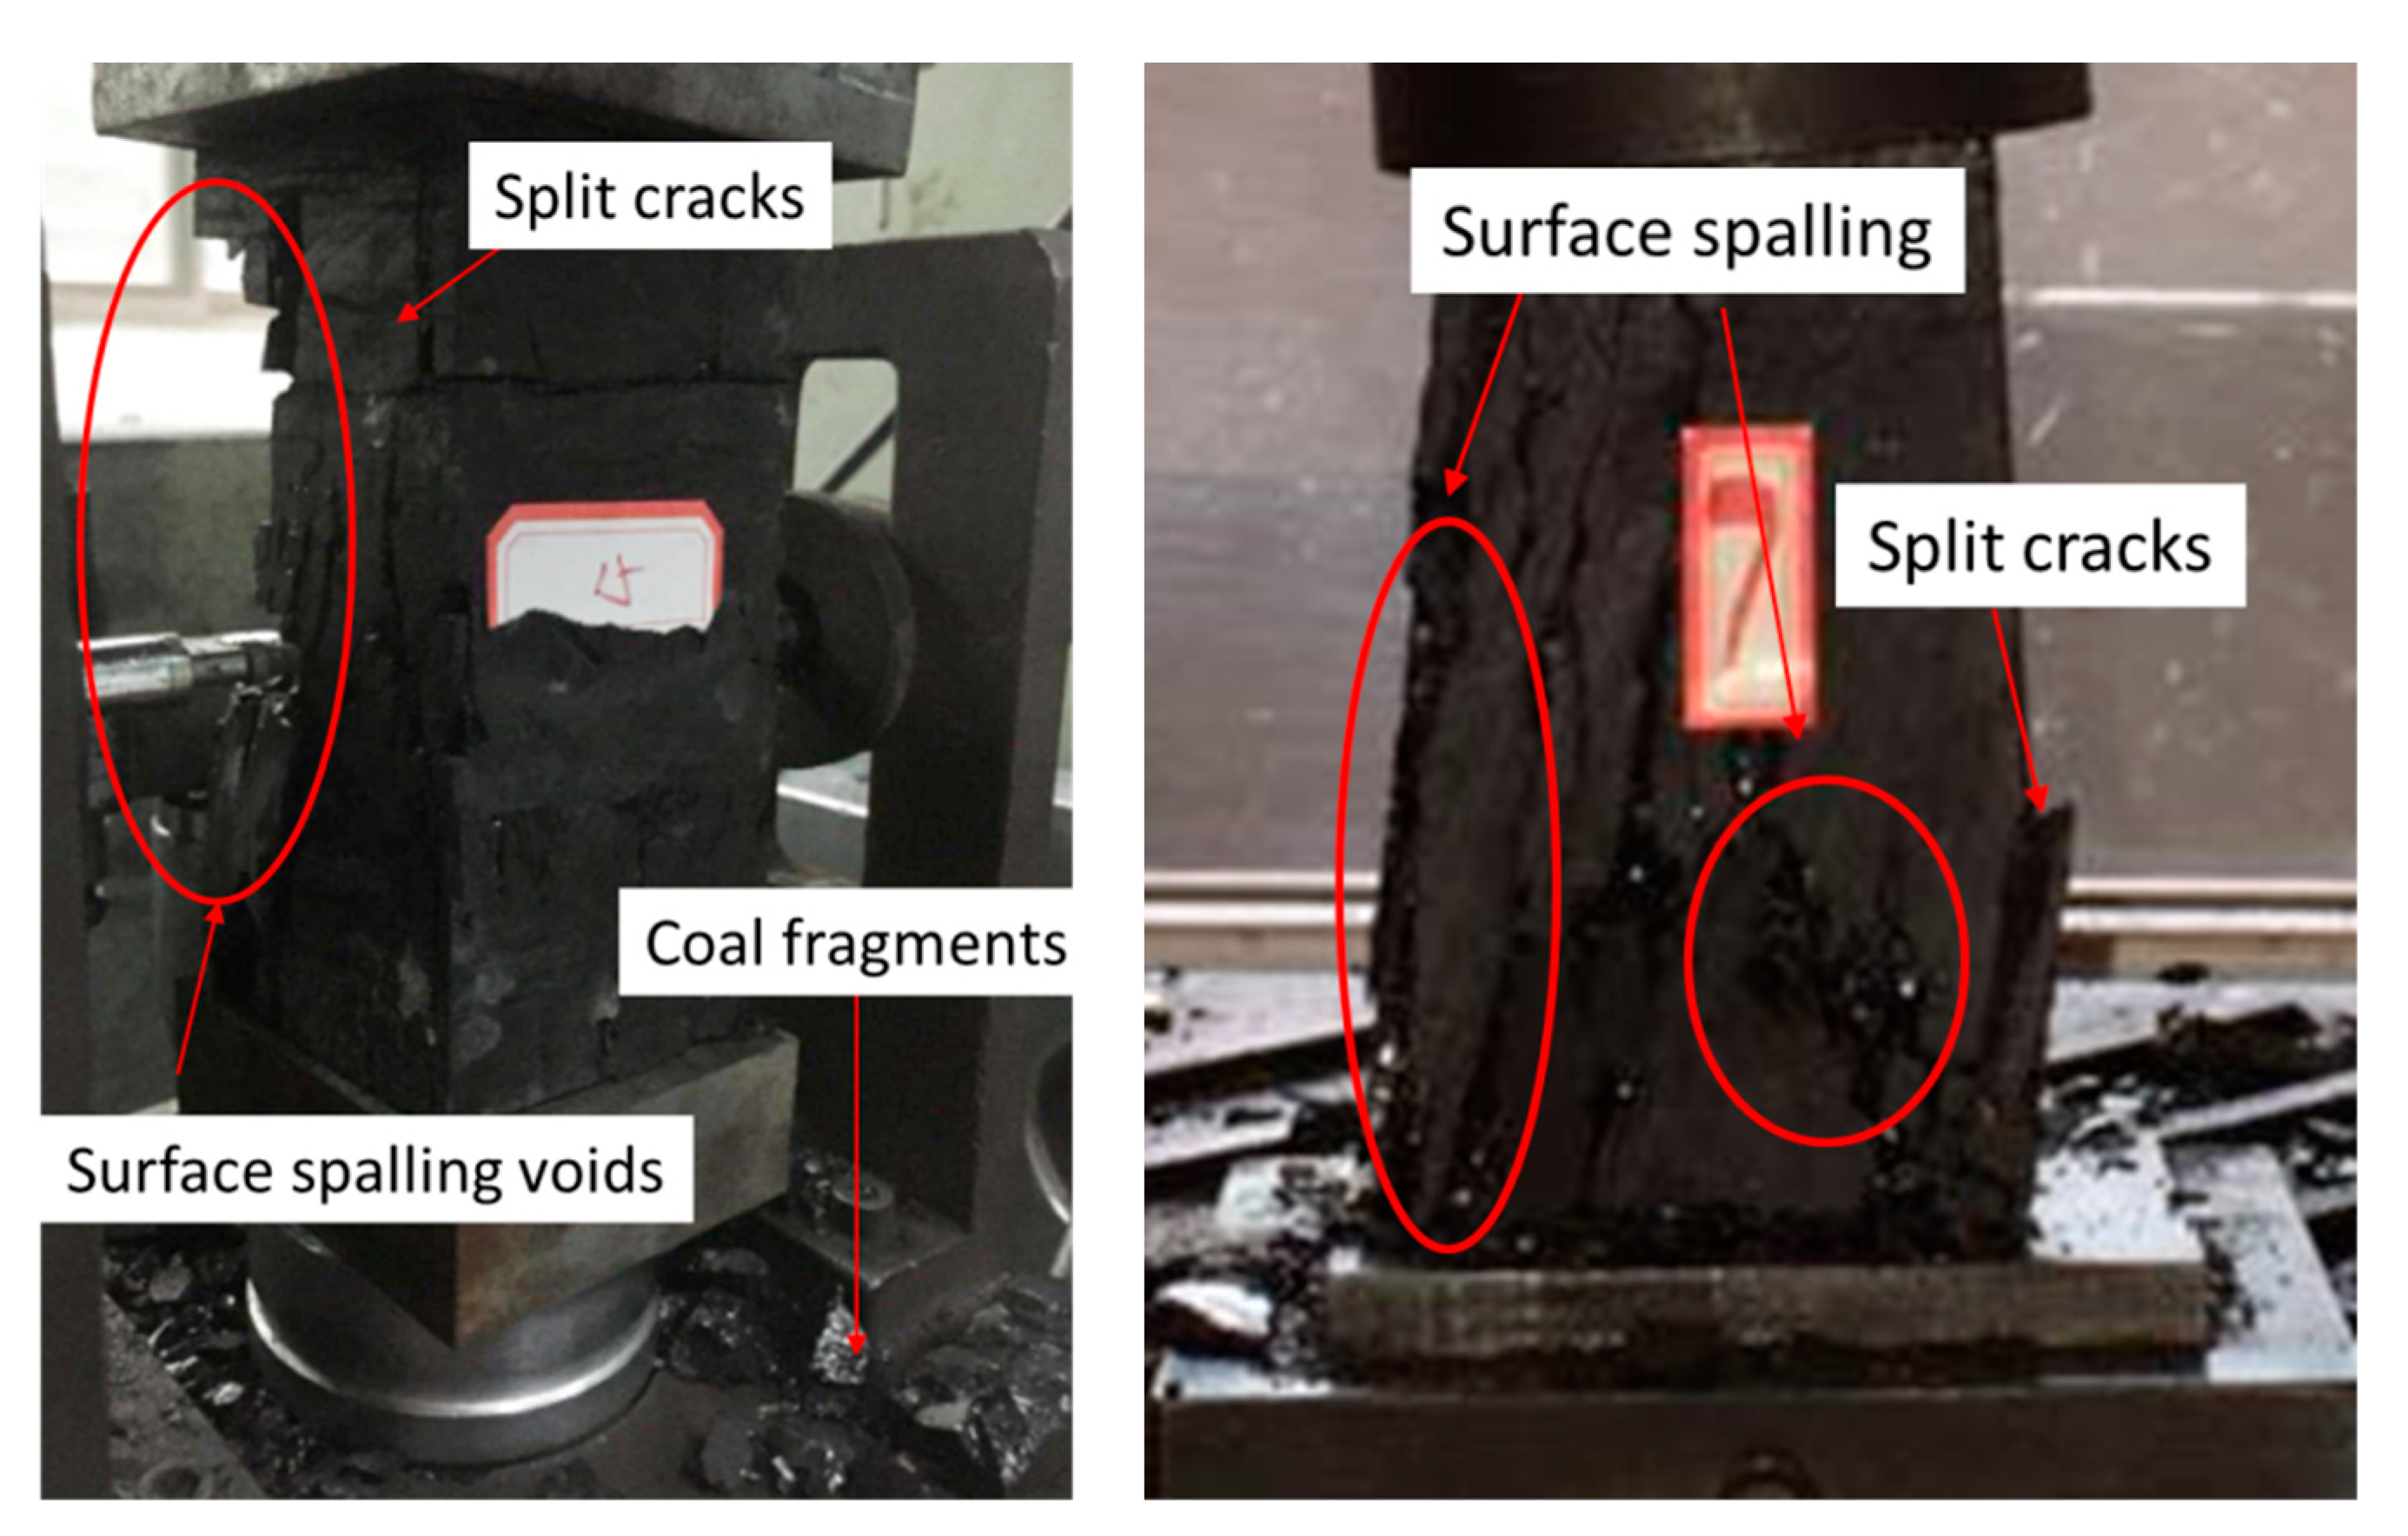
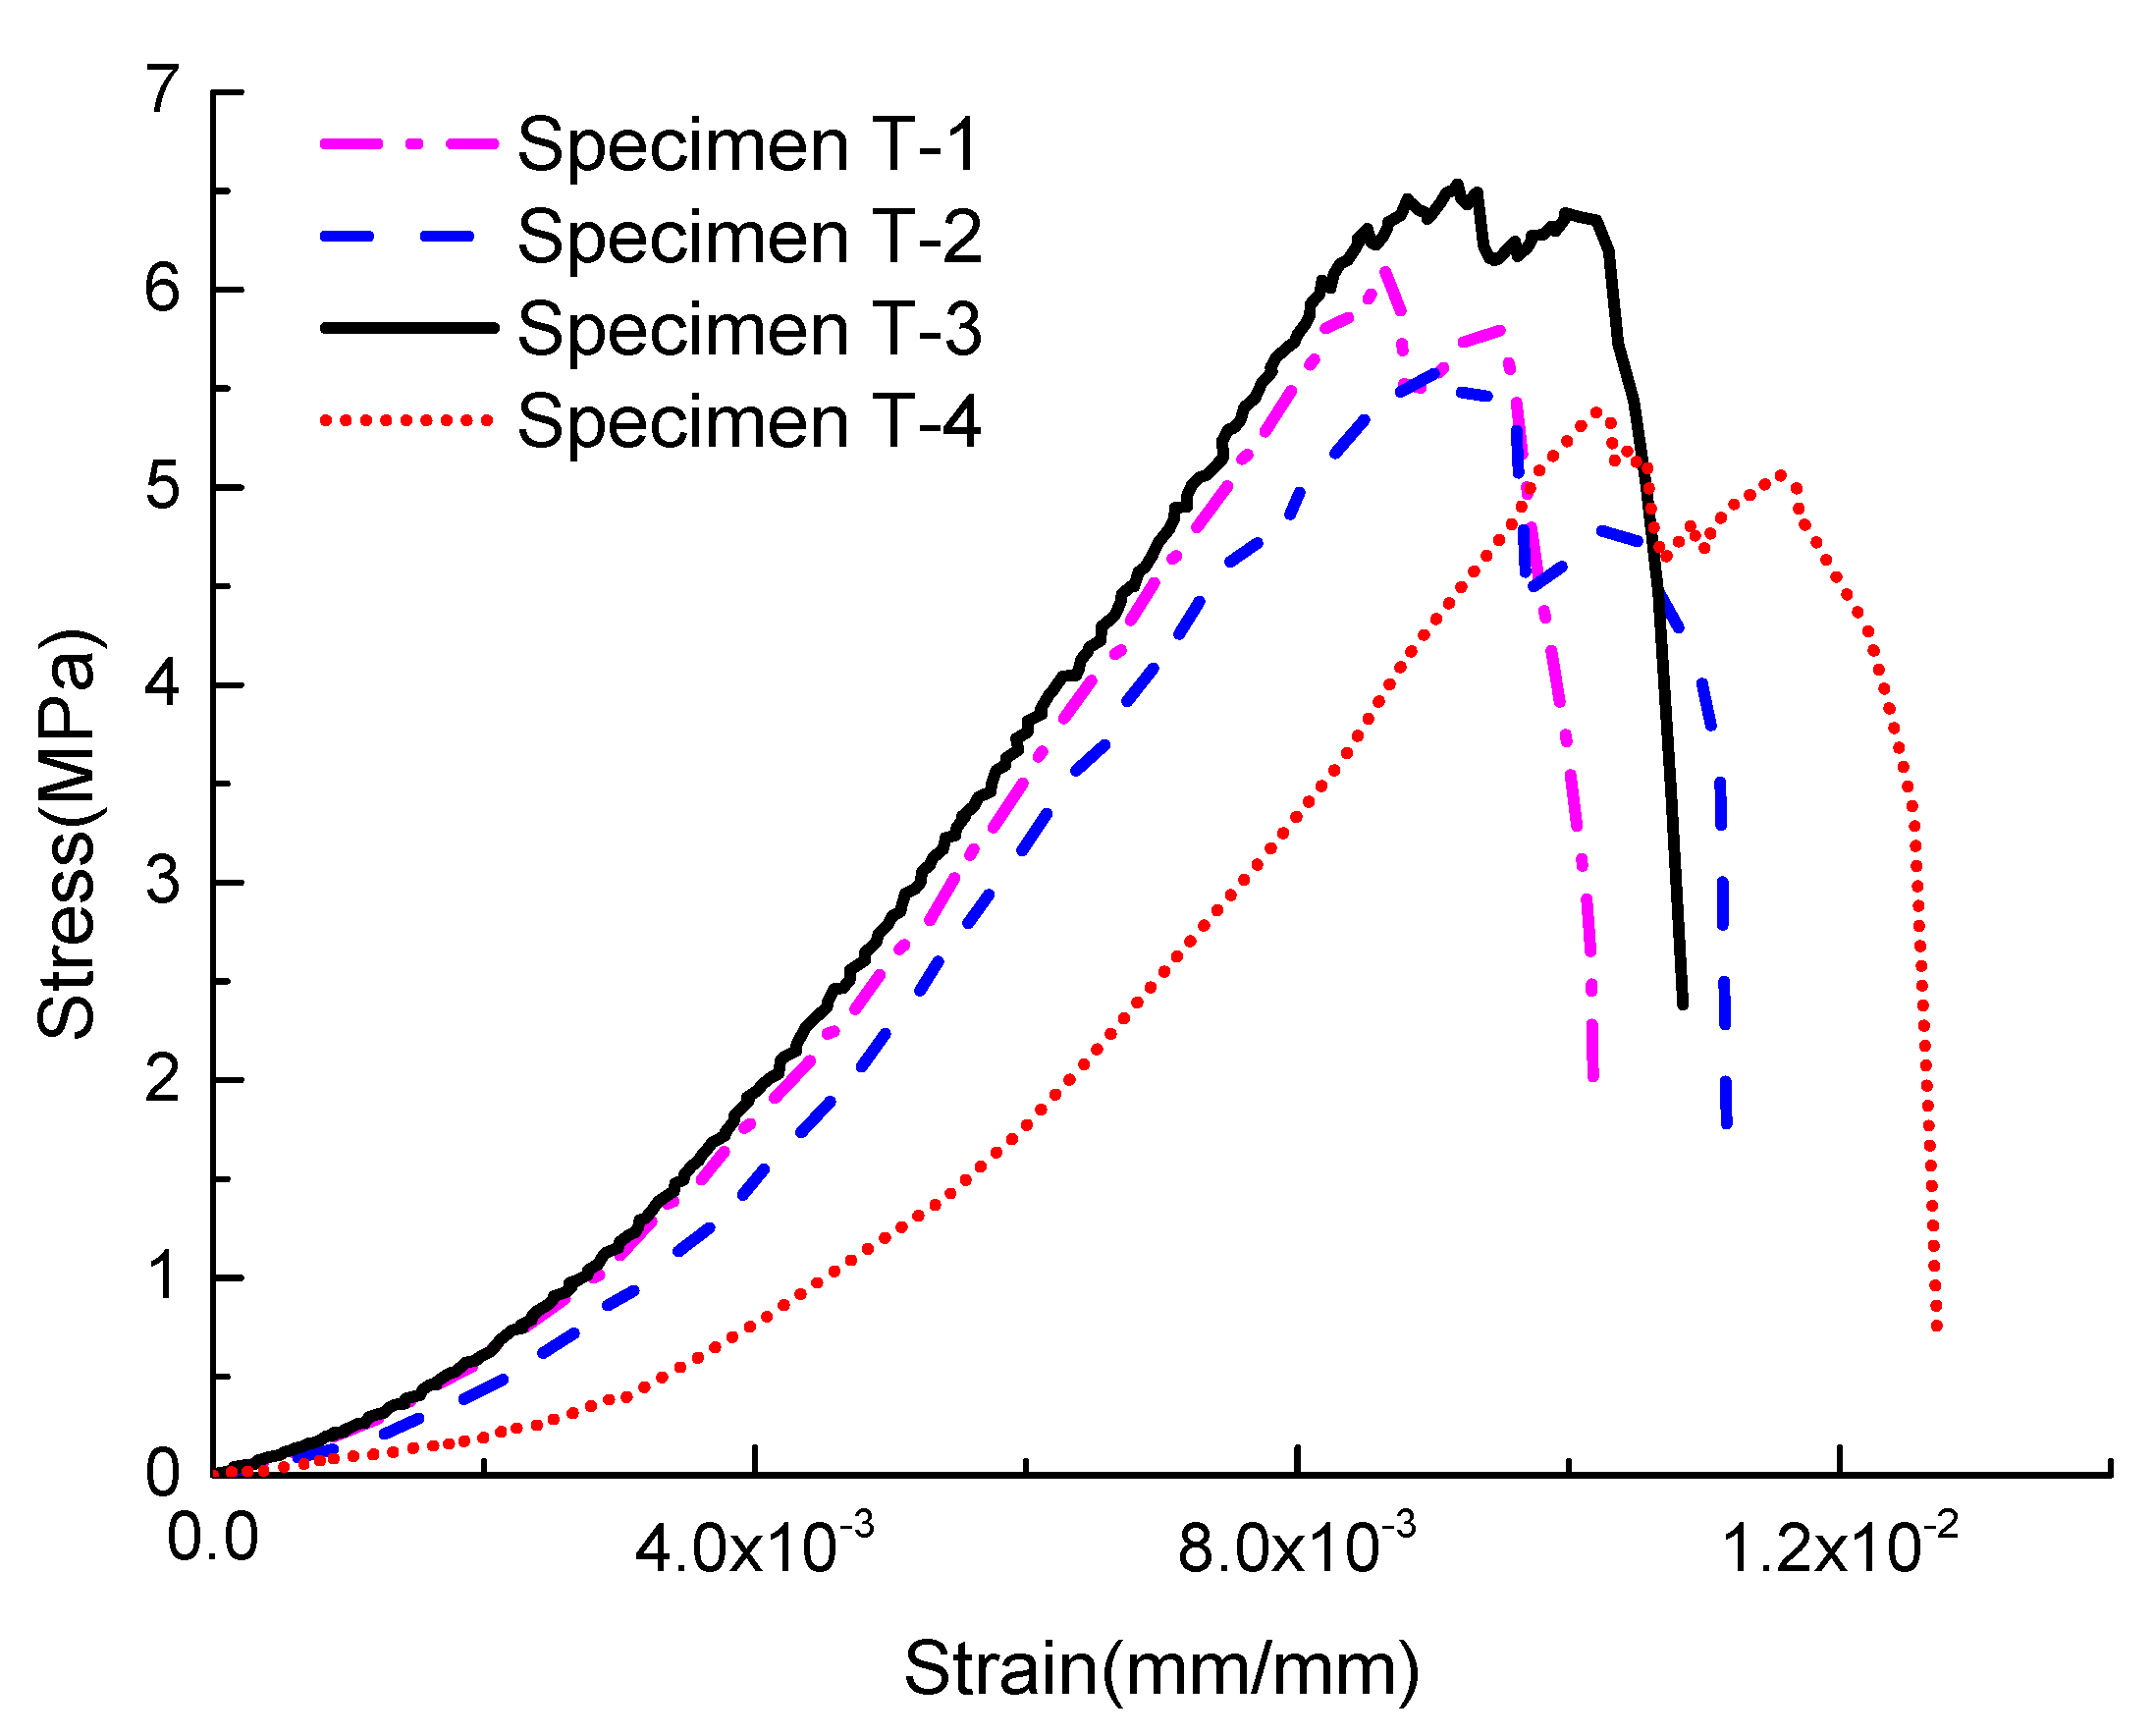
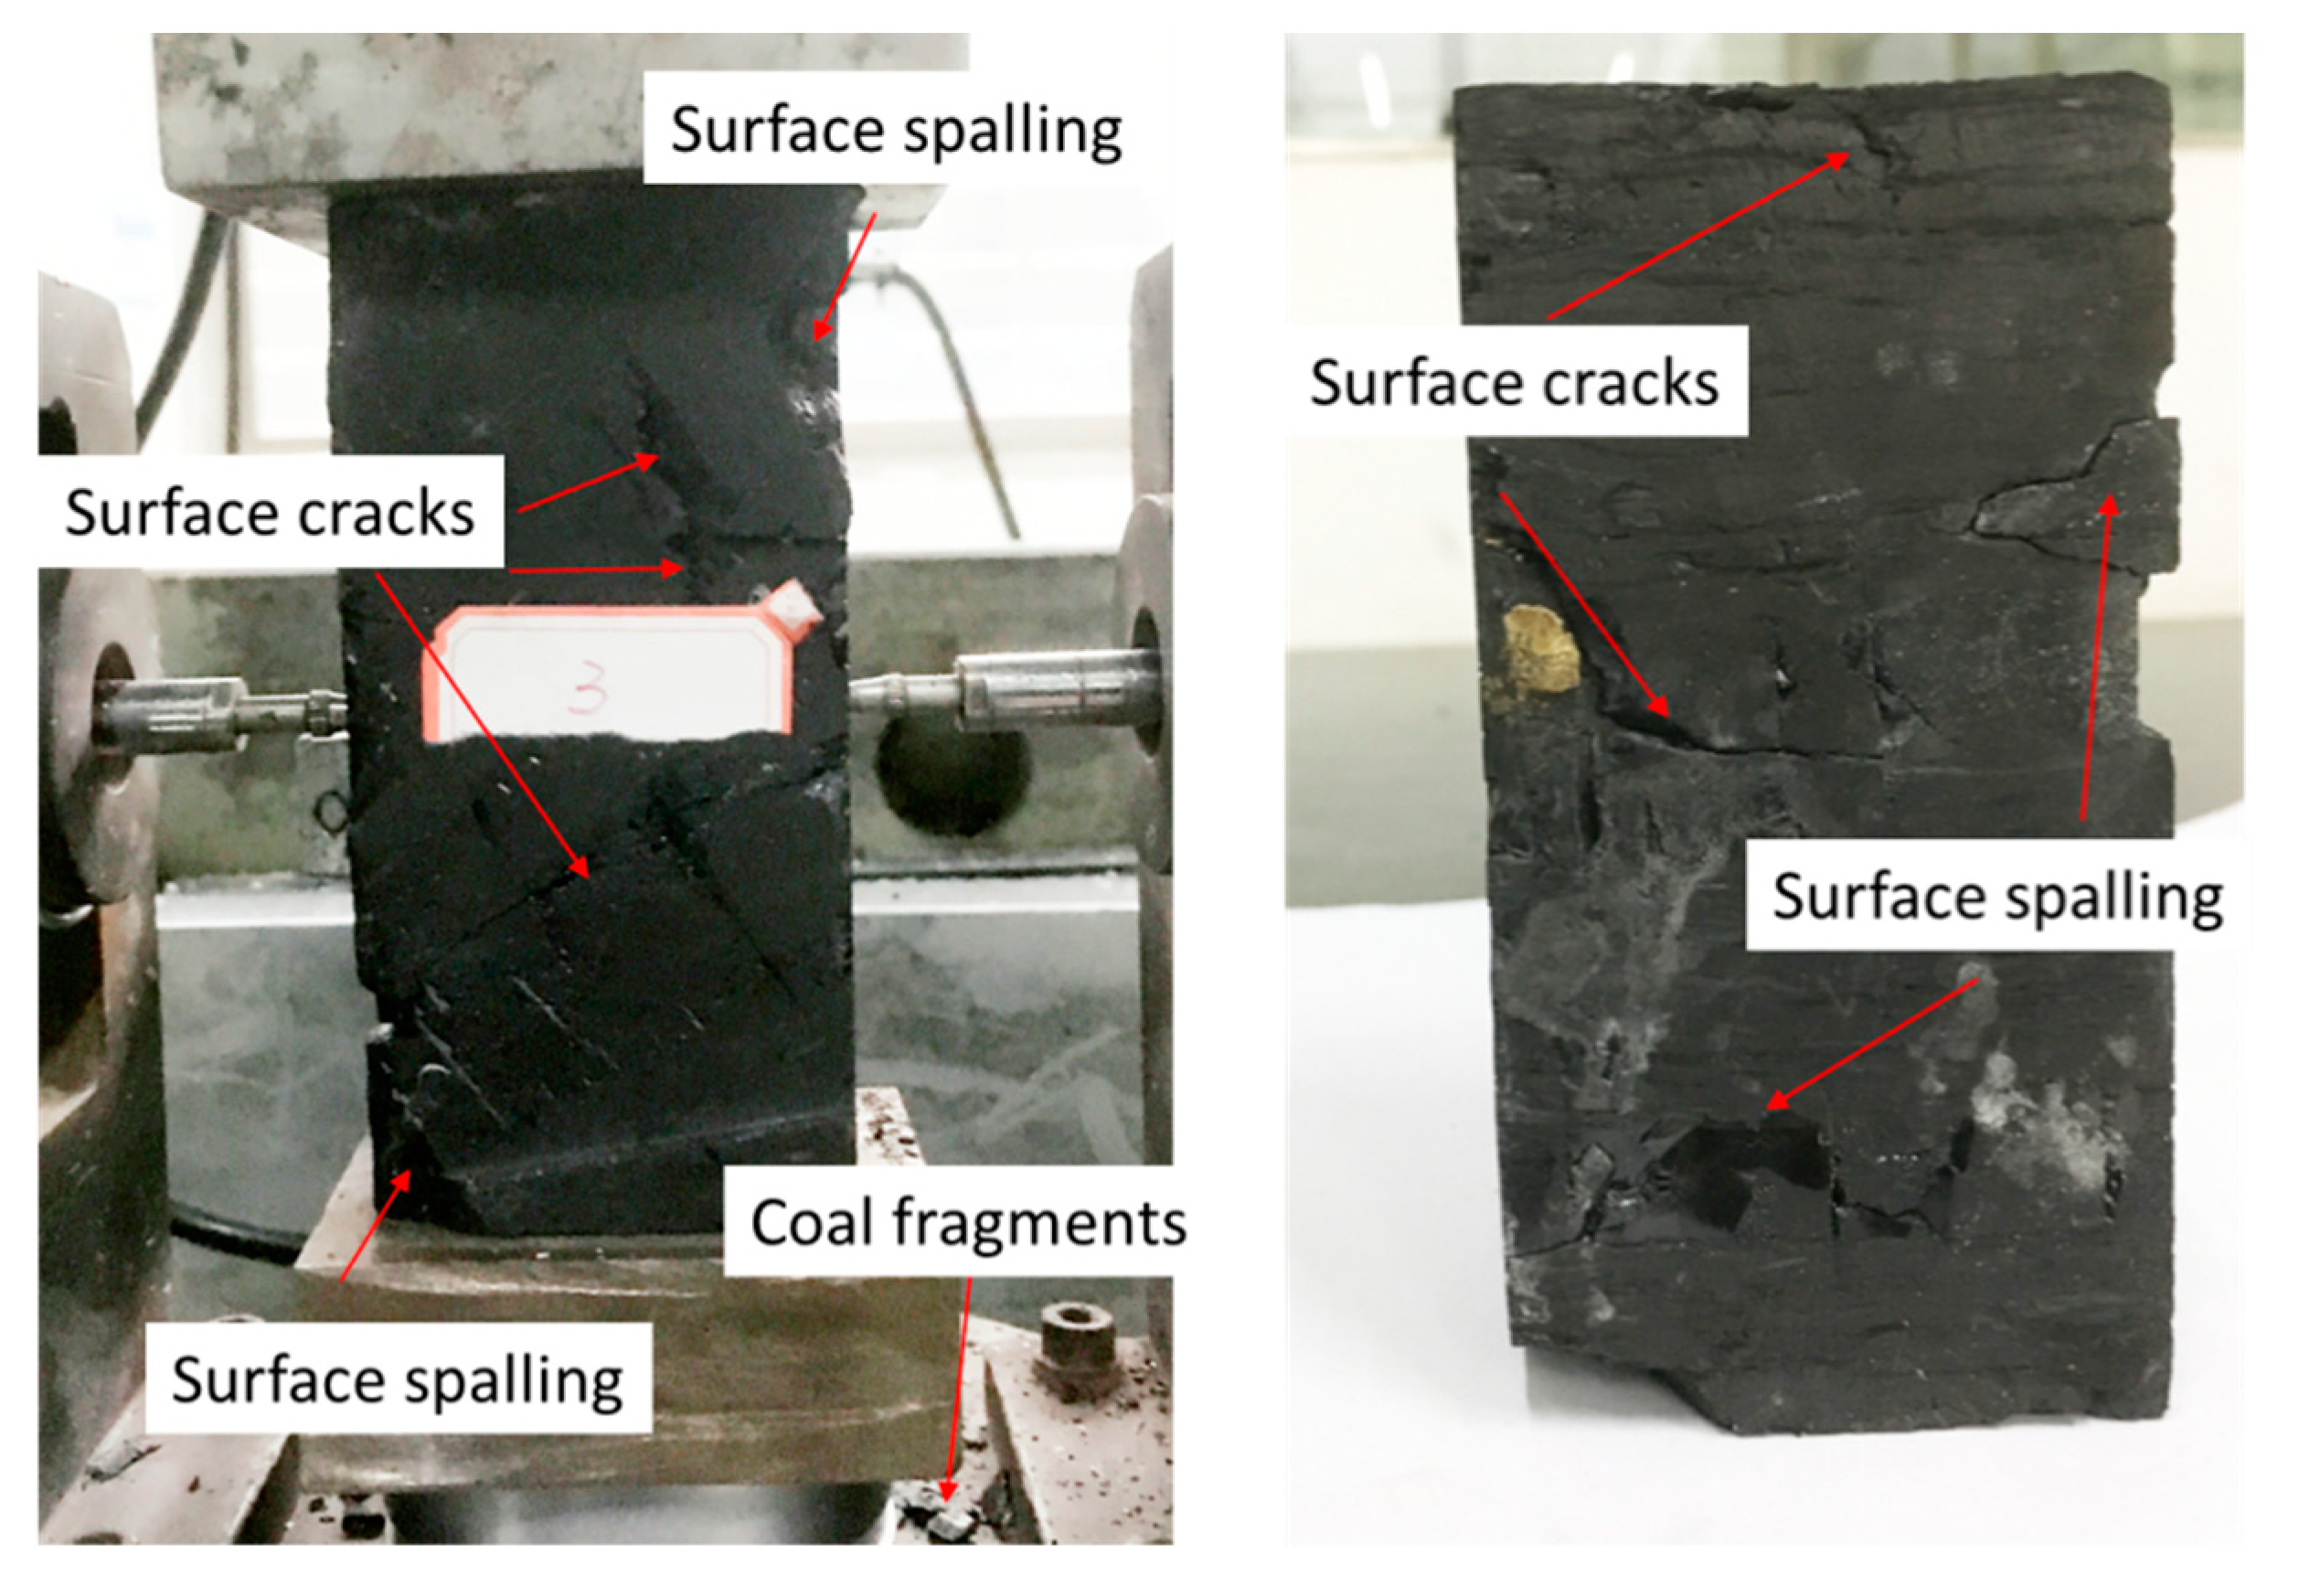
4.2. TJH Coal Mine
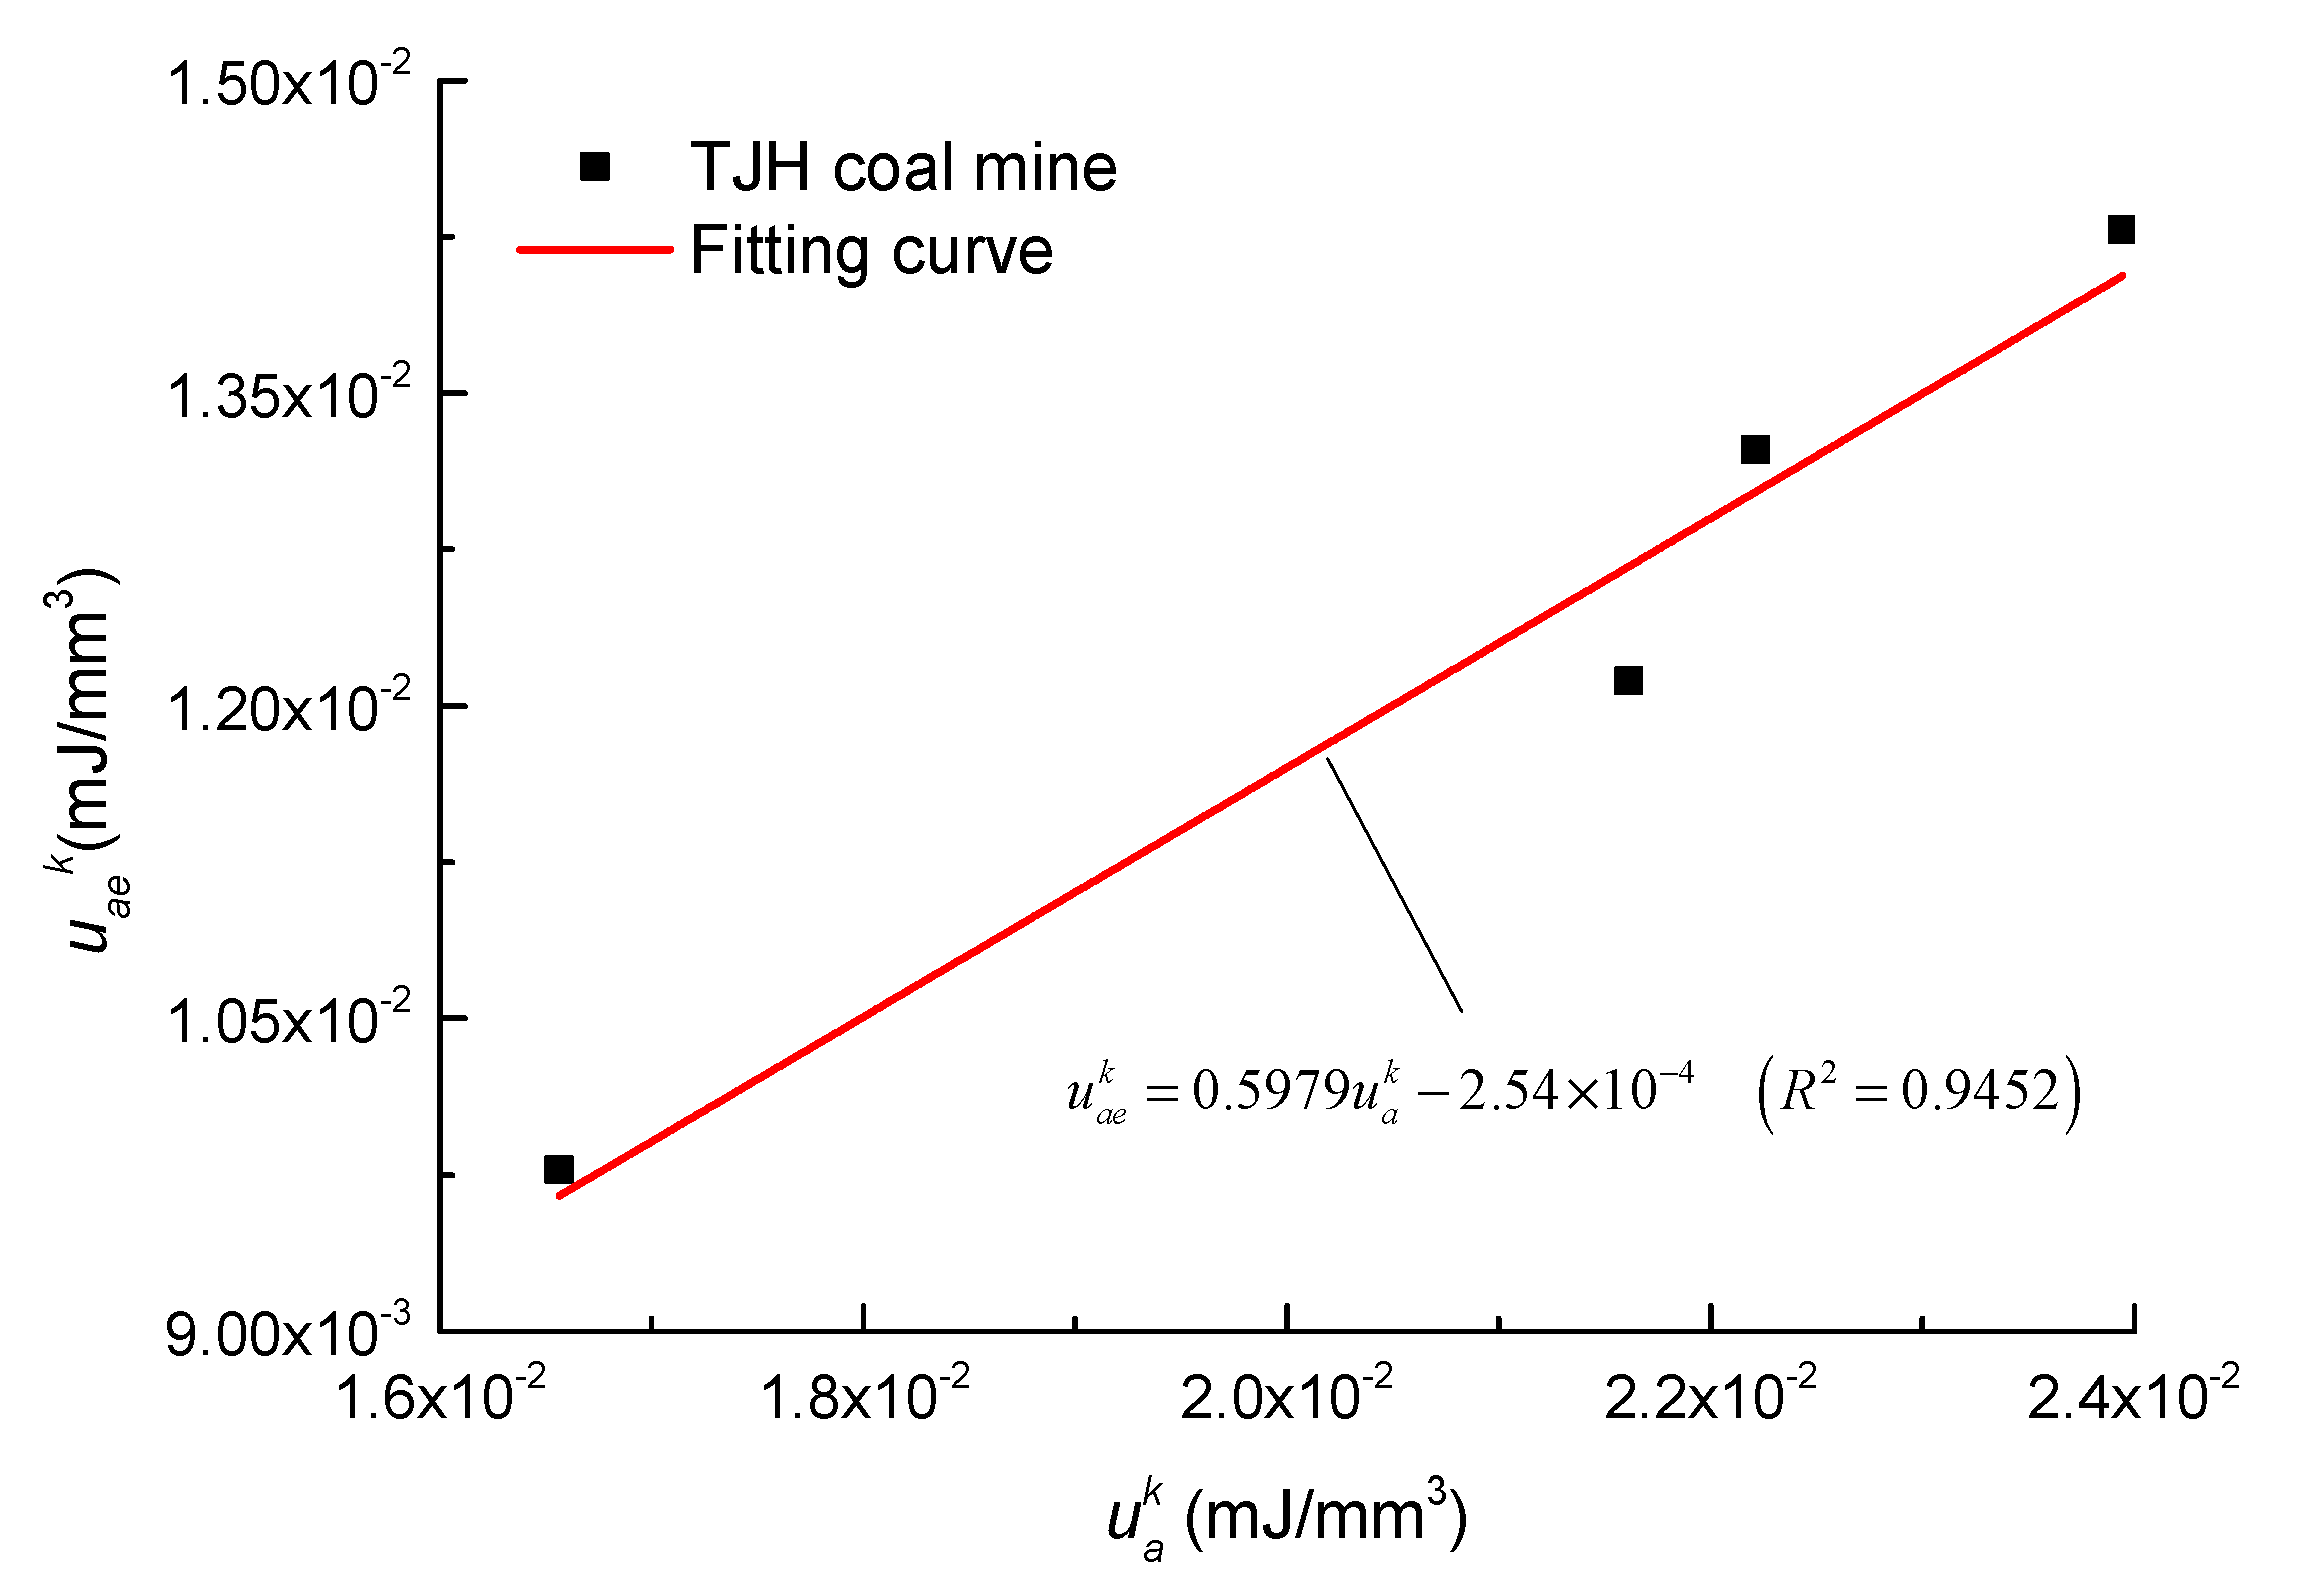
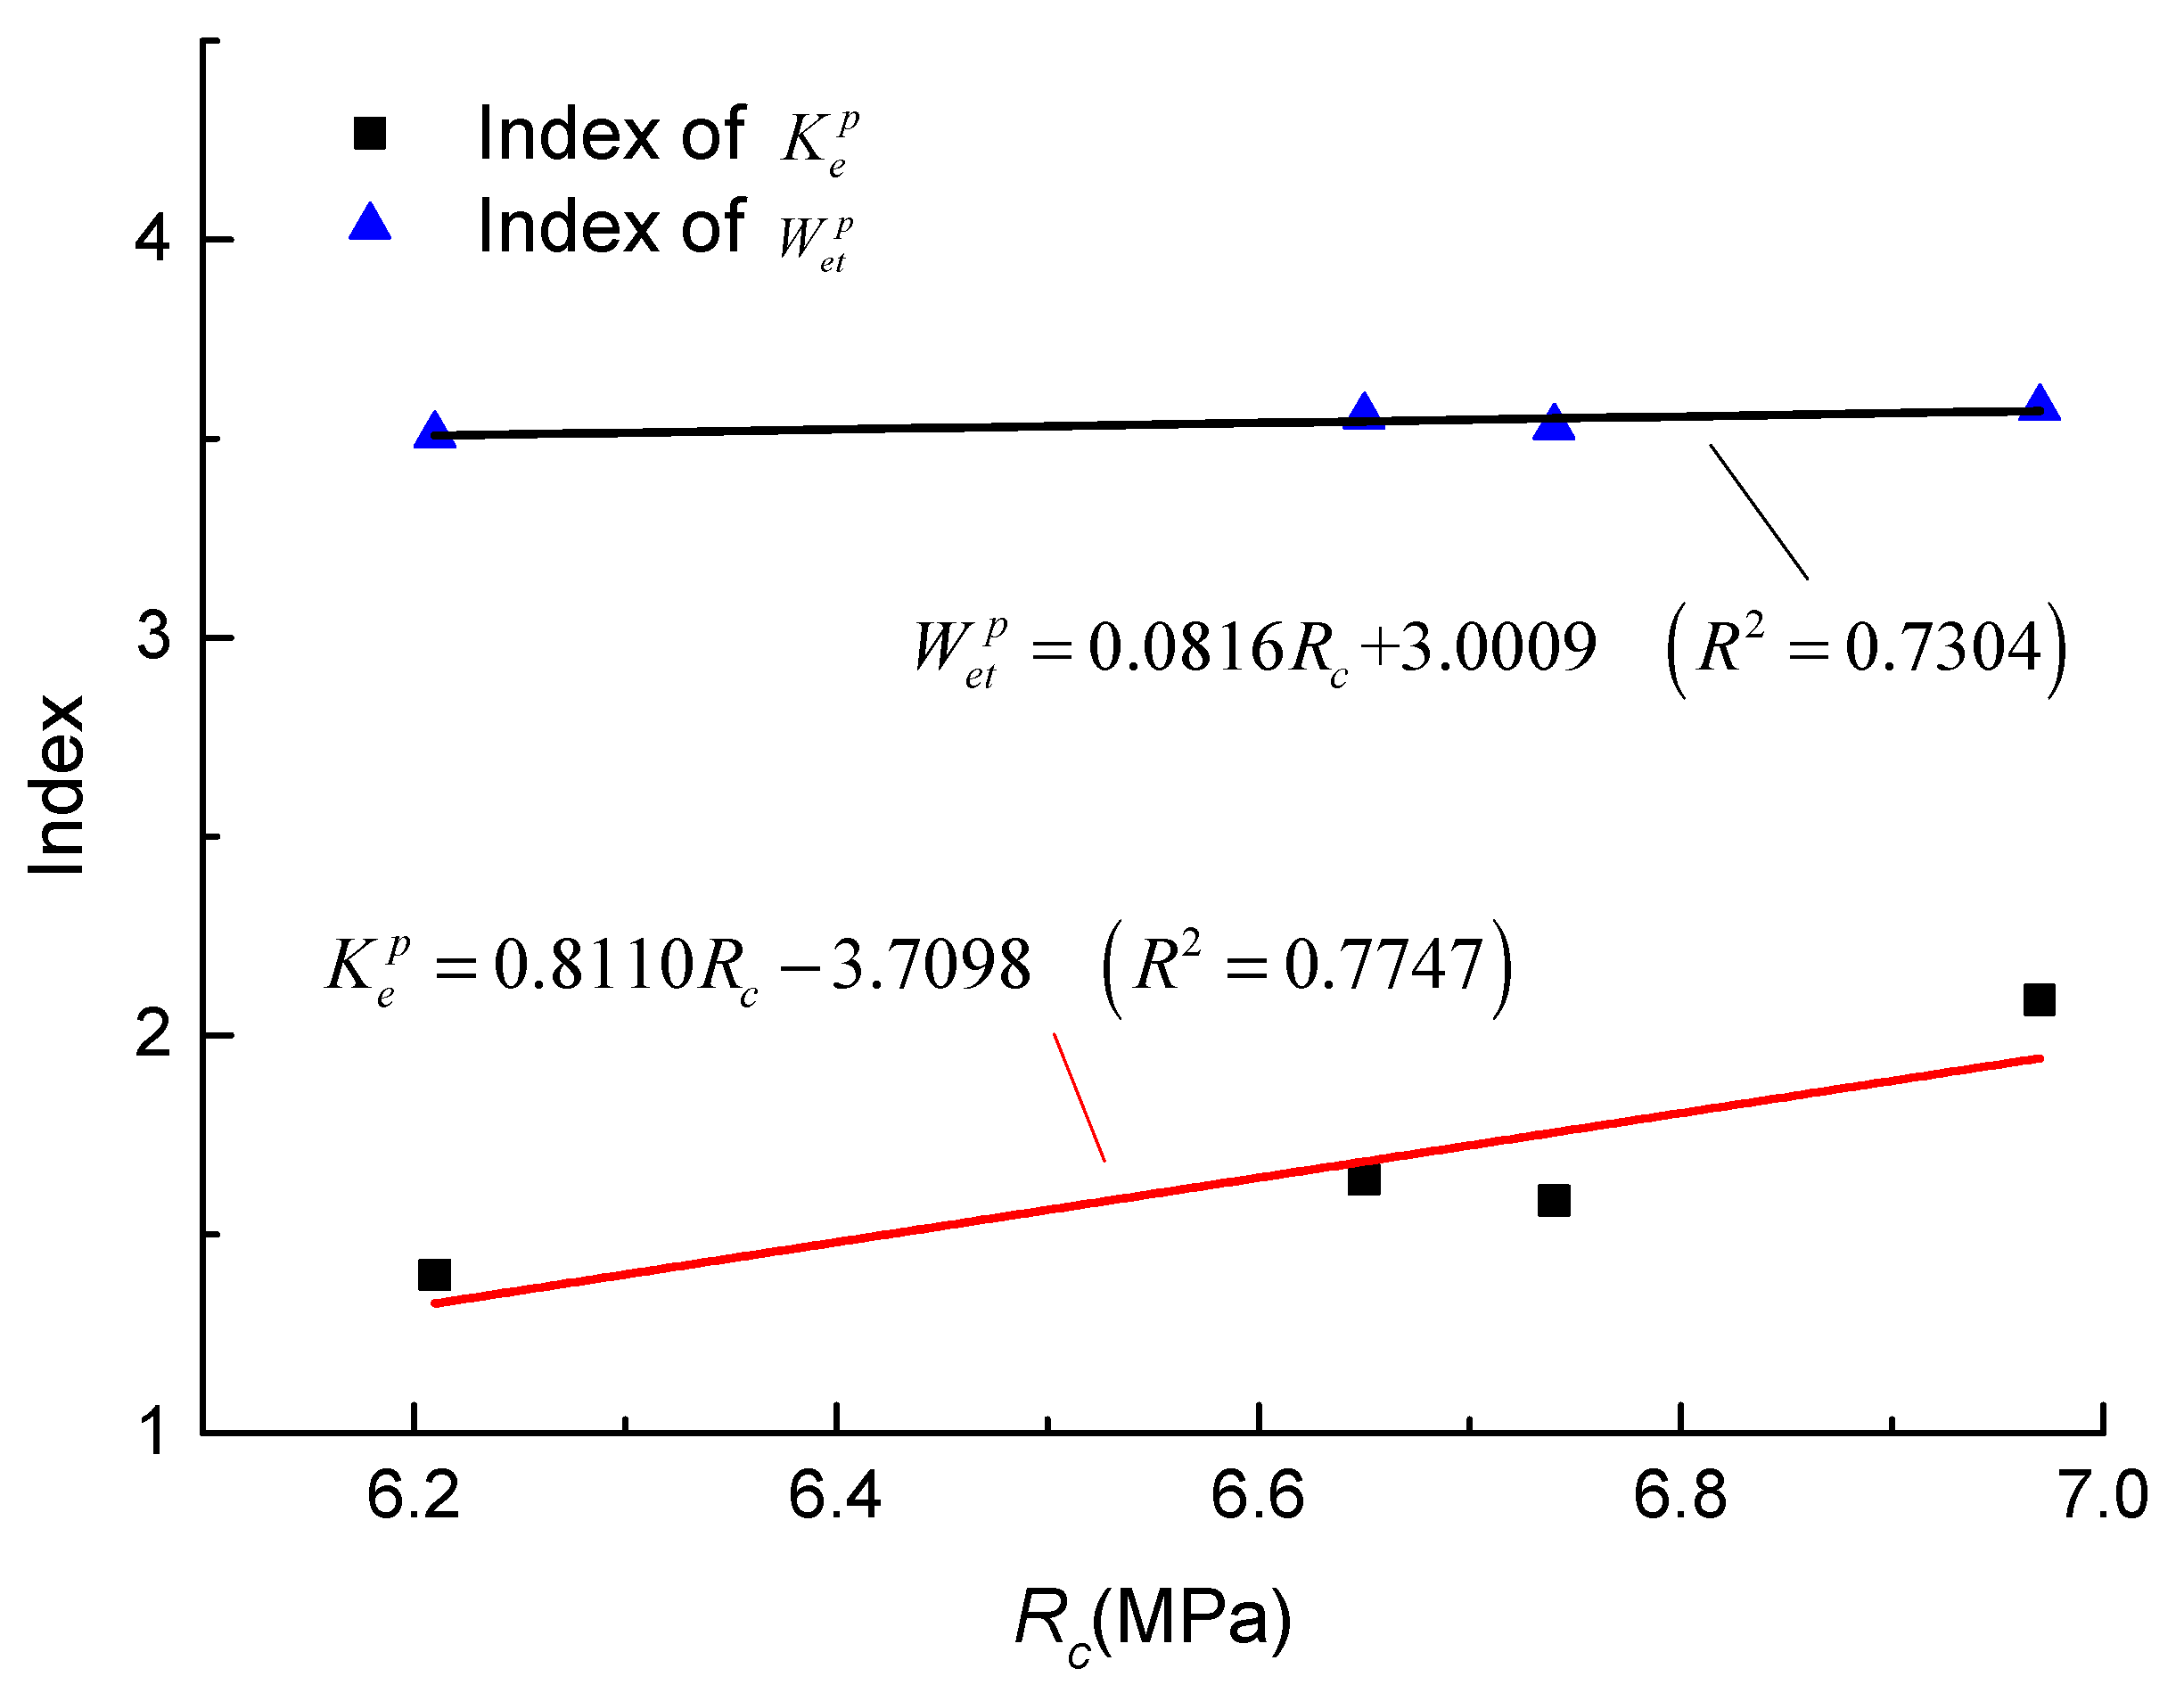
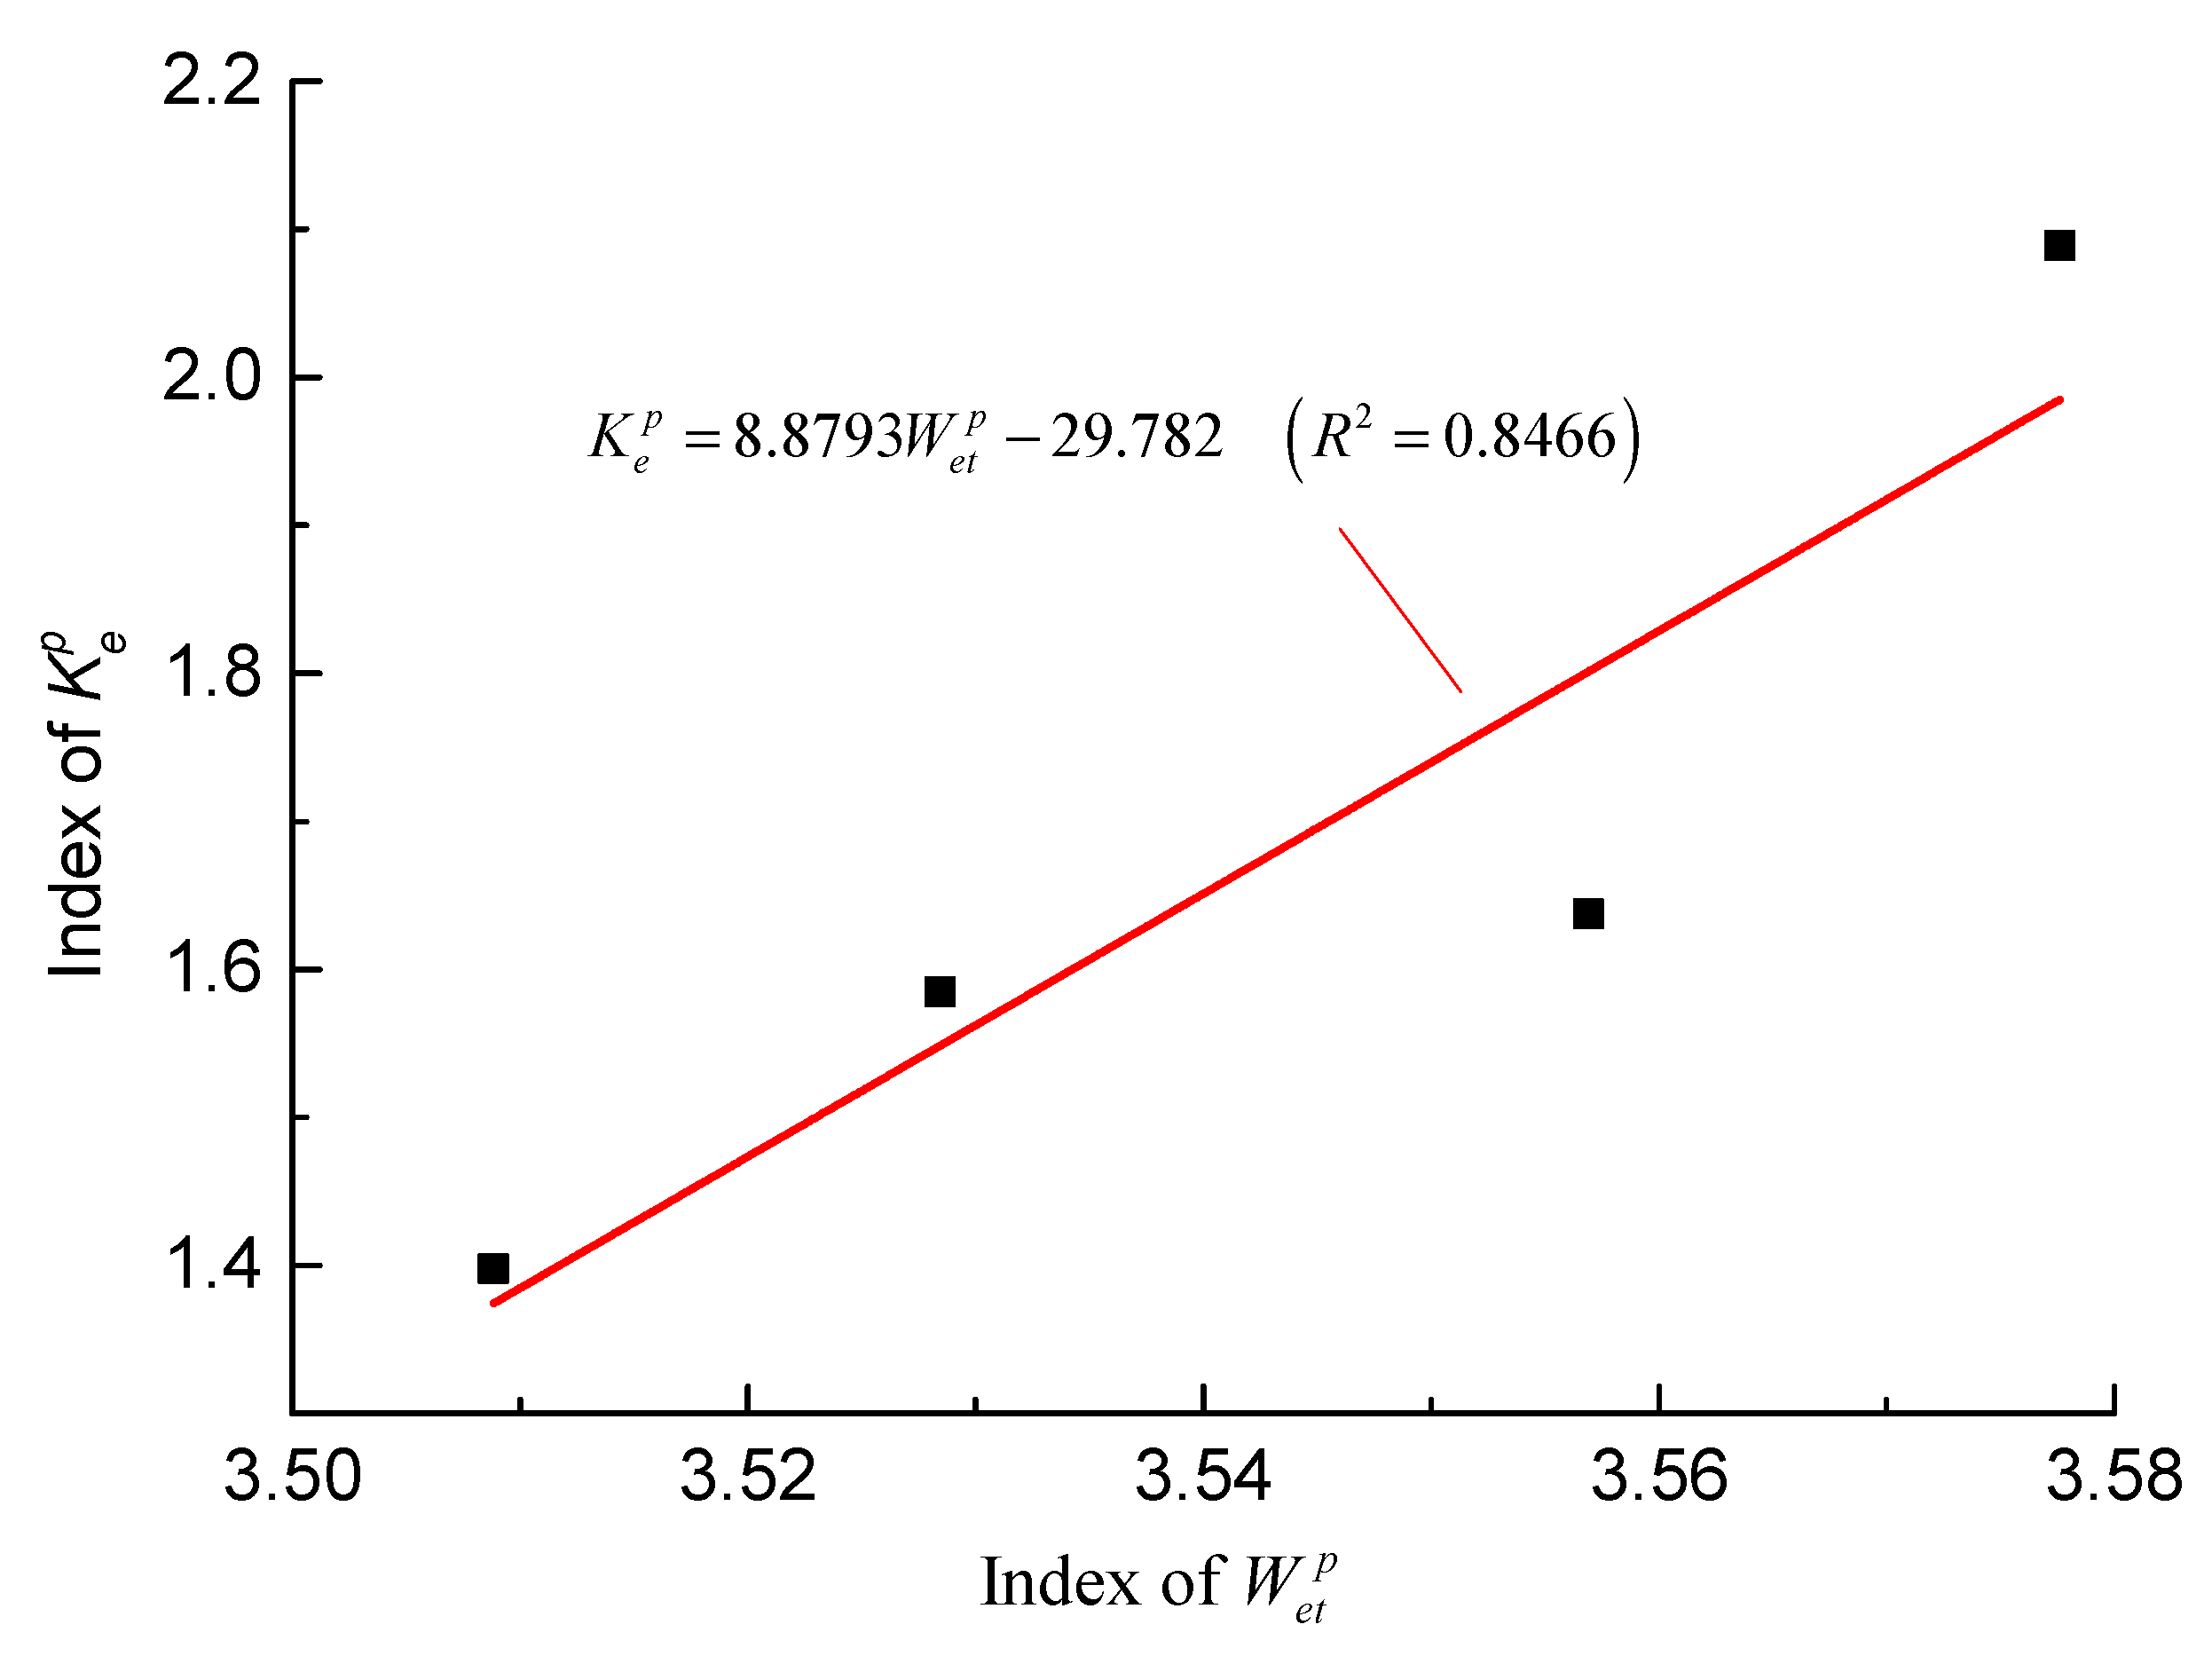
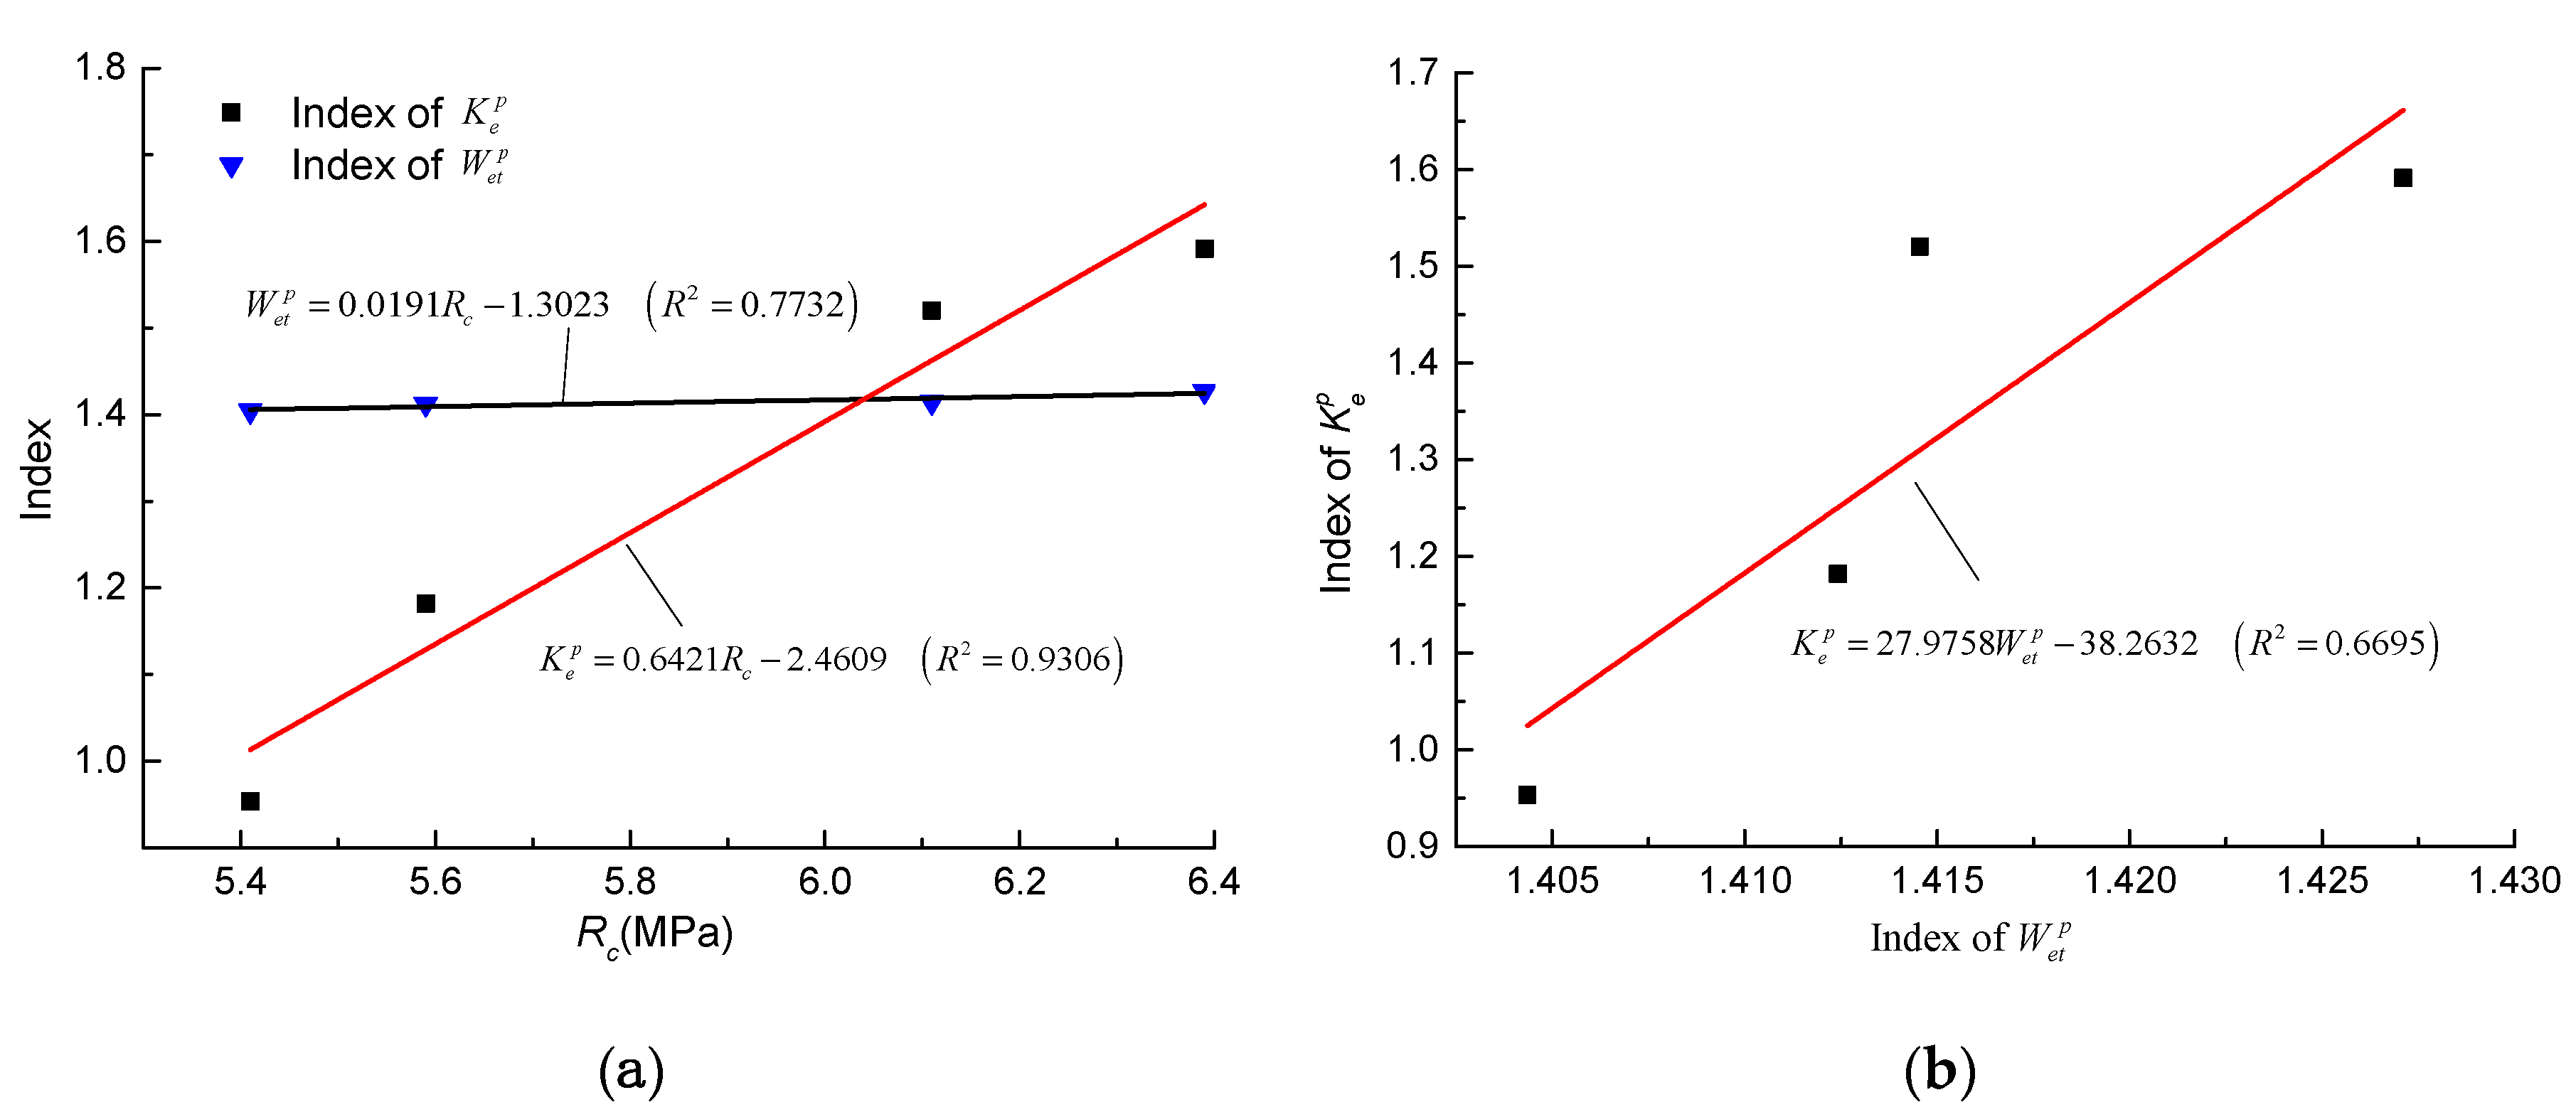
4.3. Relationship between Different Parameters
5. Conclusions
- (1)
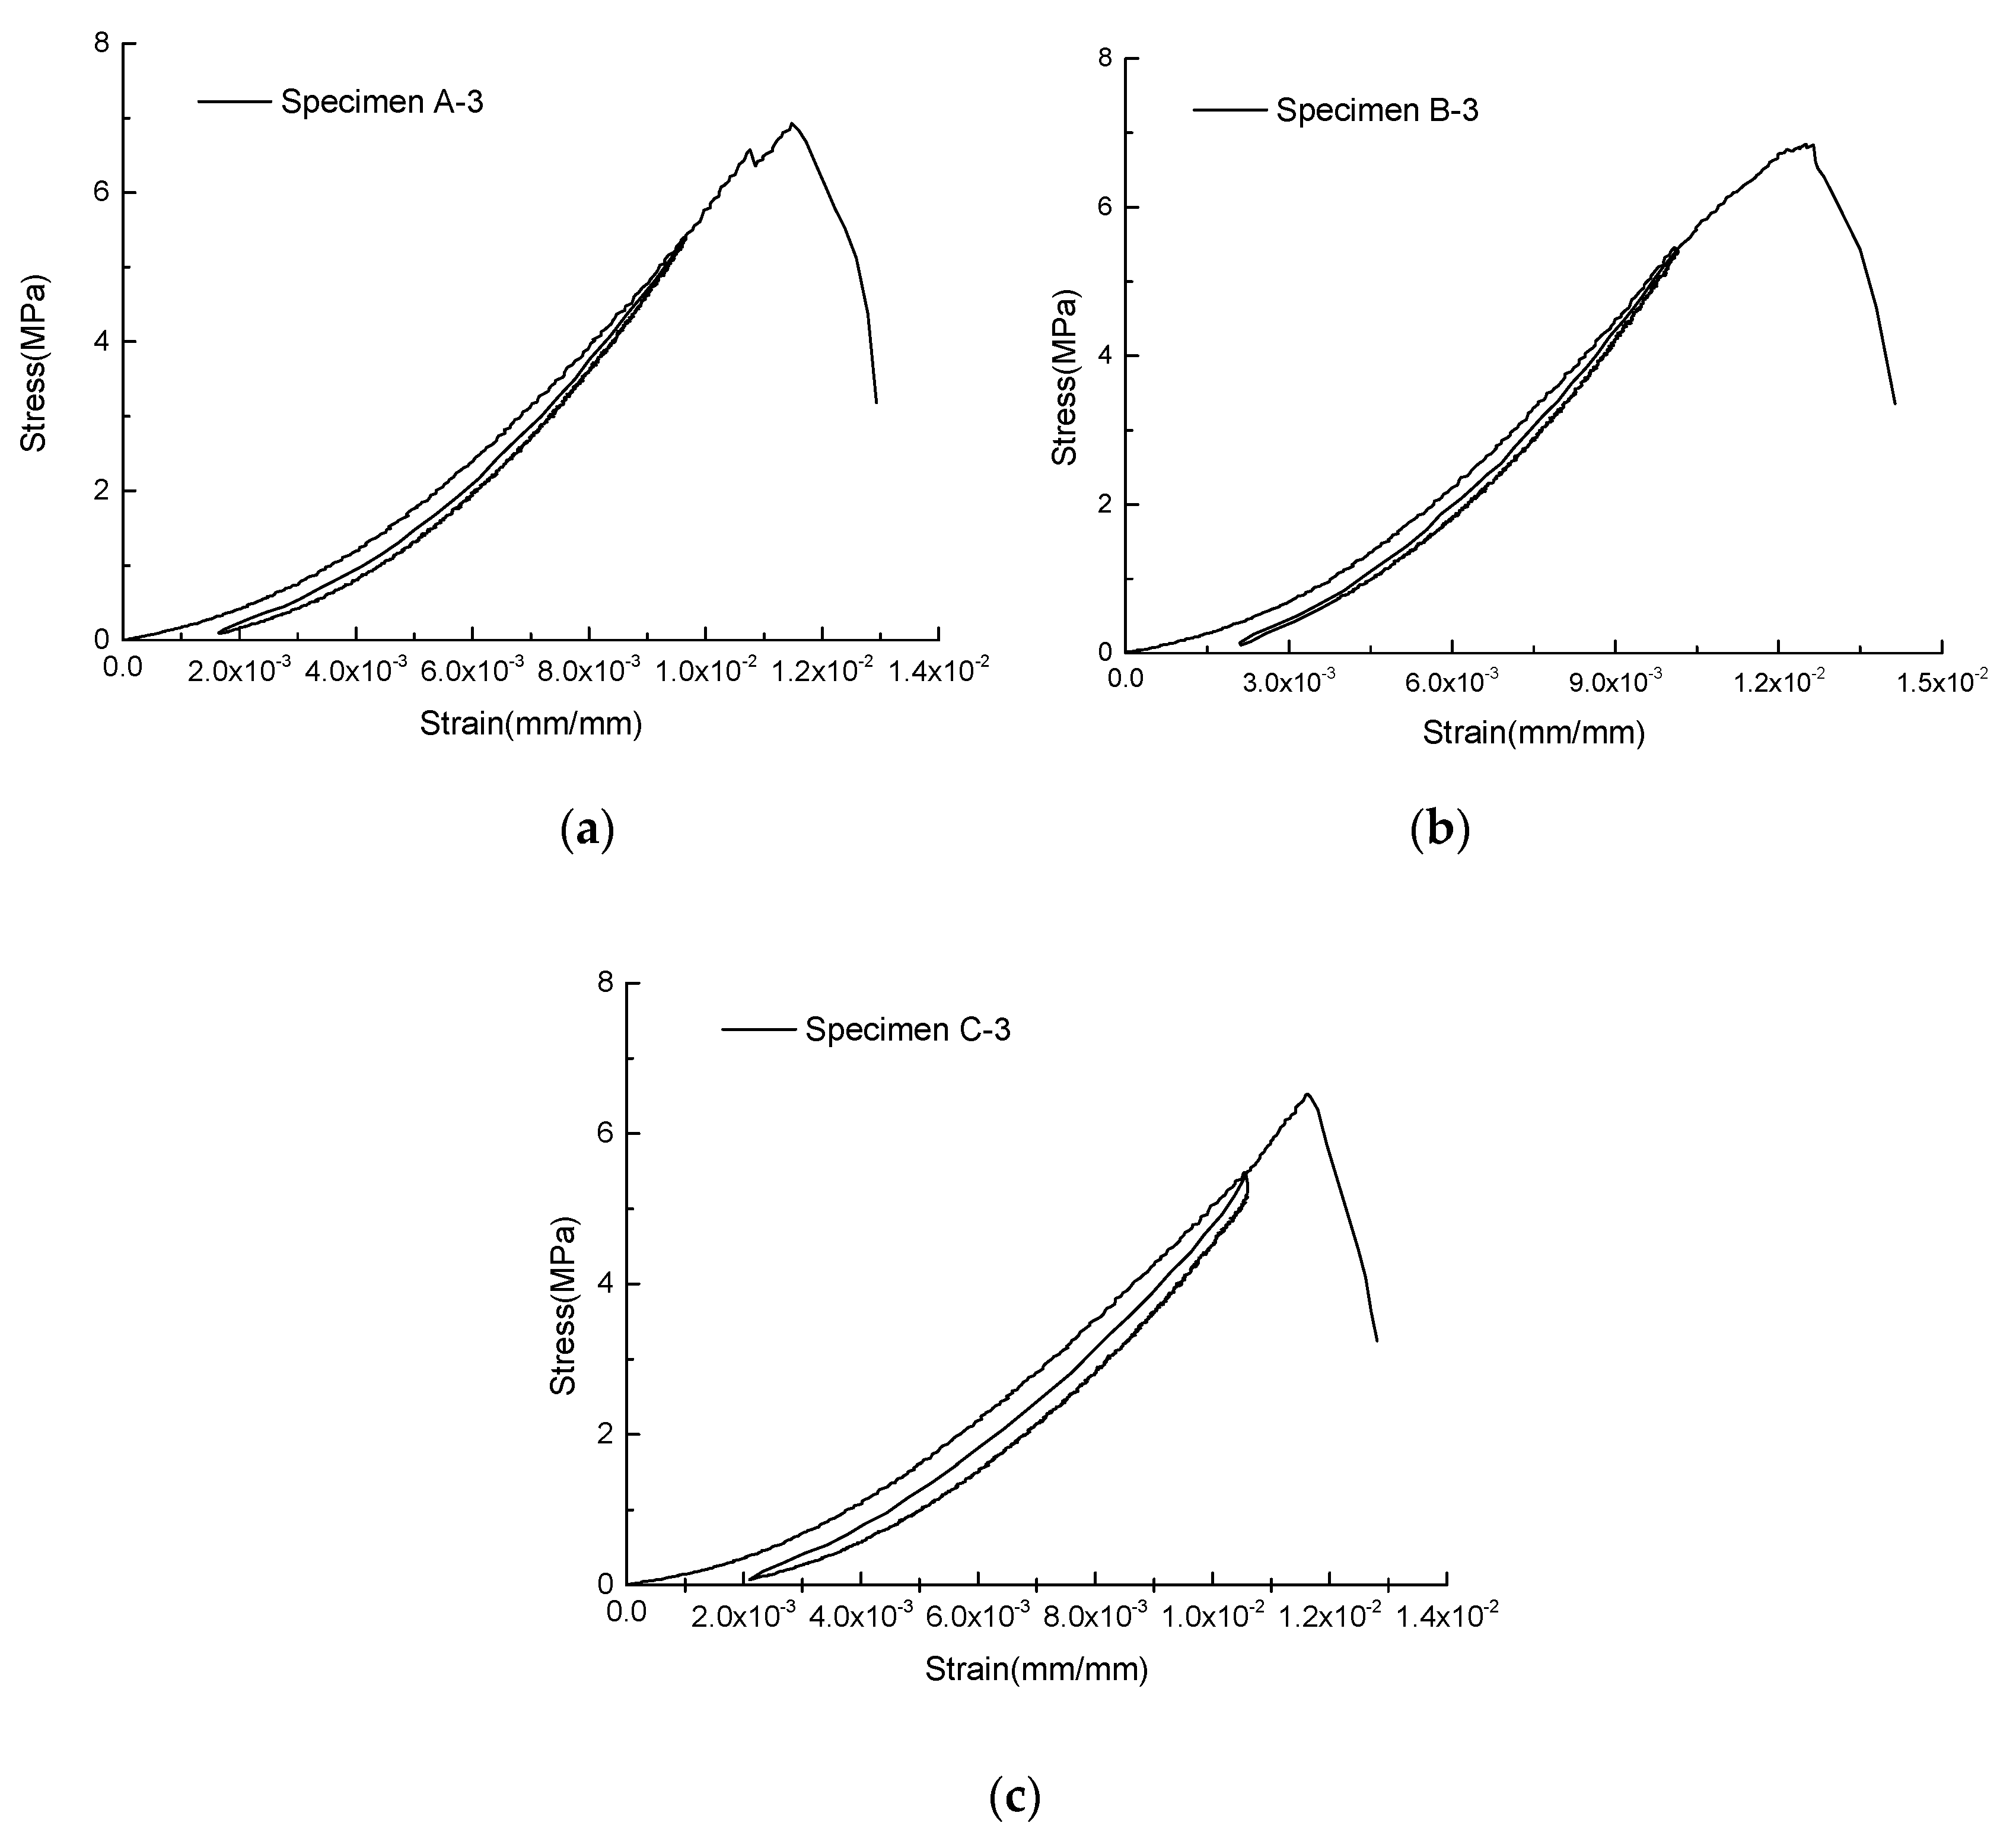
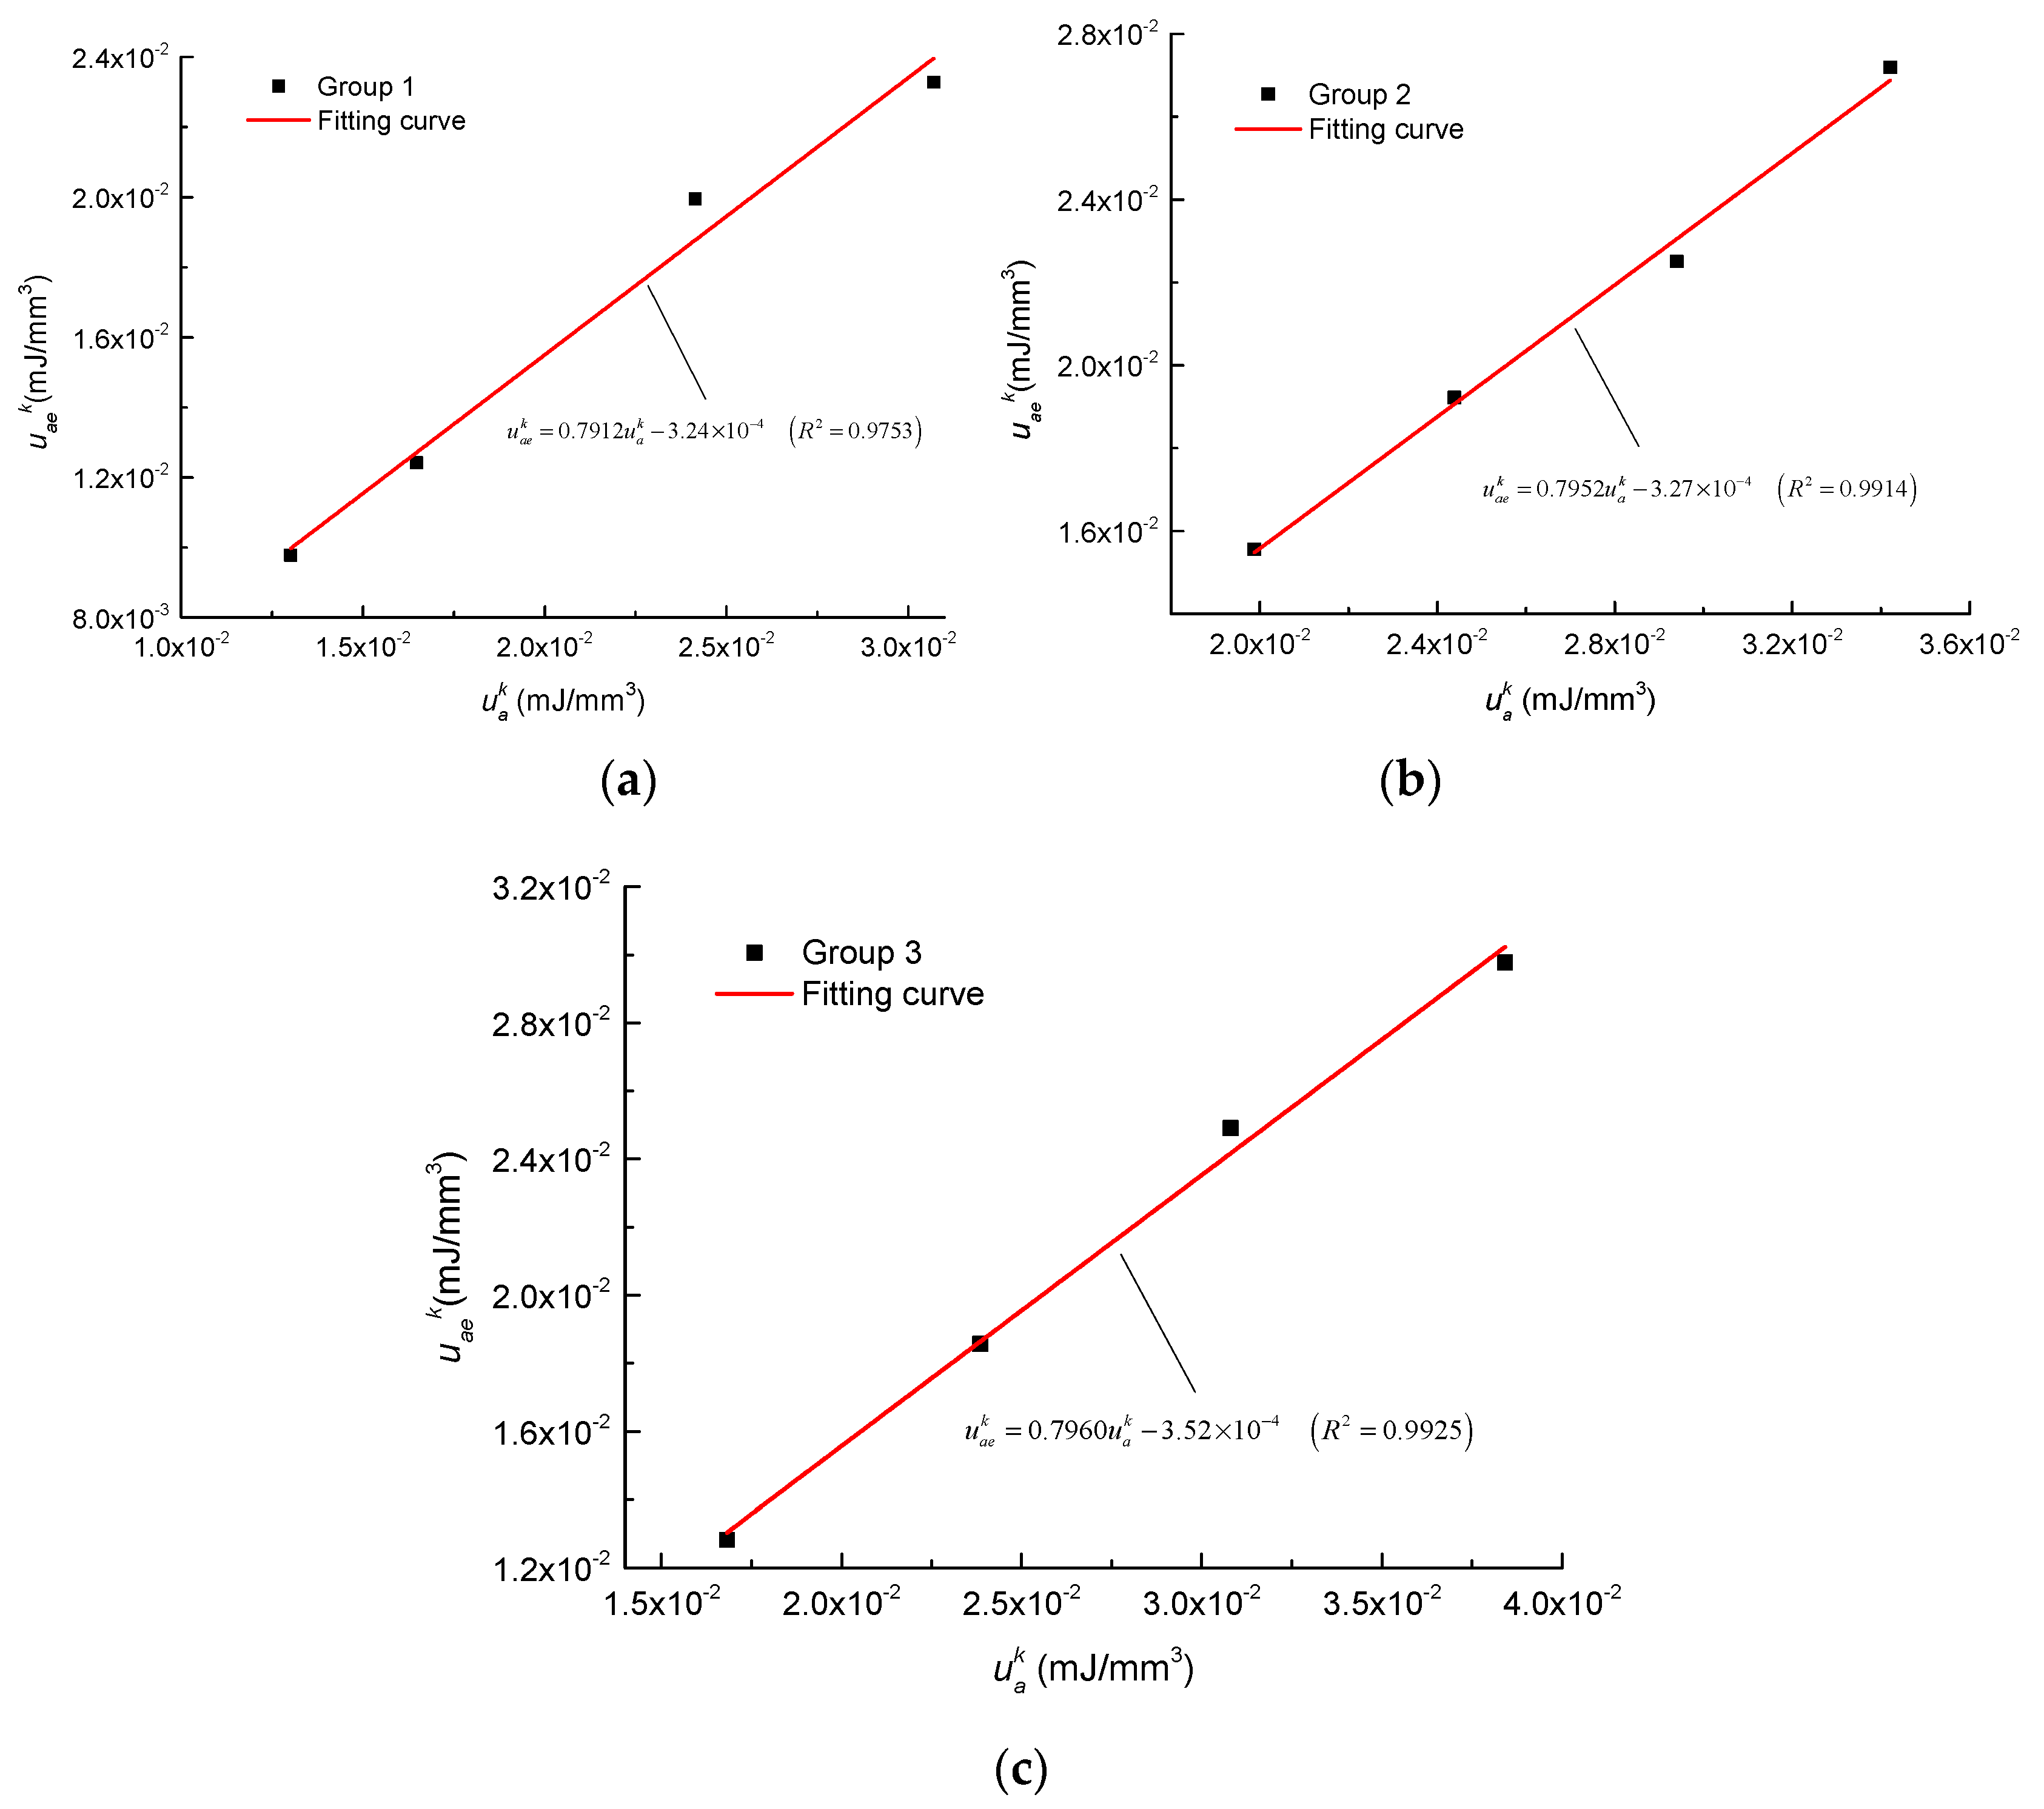
- Three groups of single cyclic loading-unloading uniaxial compression tests for PJ coal mine specimens showed that the relationship between and is linear and parameters A and B can be considered as constant for a type of coal specimen.
- (2)
- The experimental results revealed that both the indexes of and increase linearly as UCS increases. The difference is that the UCS has a more significant effect on index of than that of because of the different increasing rates. Besides, the linear relationship between indexes and was also observed.
- (3)
- The liner fitting parameter A has a significant effect on index . A large value of parameter A means more elastic strain energy before the peak strength while a small value indicates most of input energy was dissipated. When index remains constant, the index increases with the increase of parameter A.
- (4)
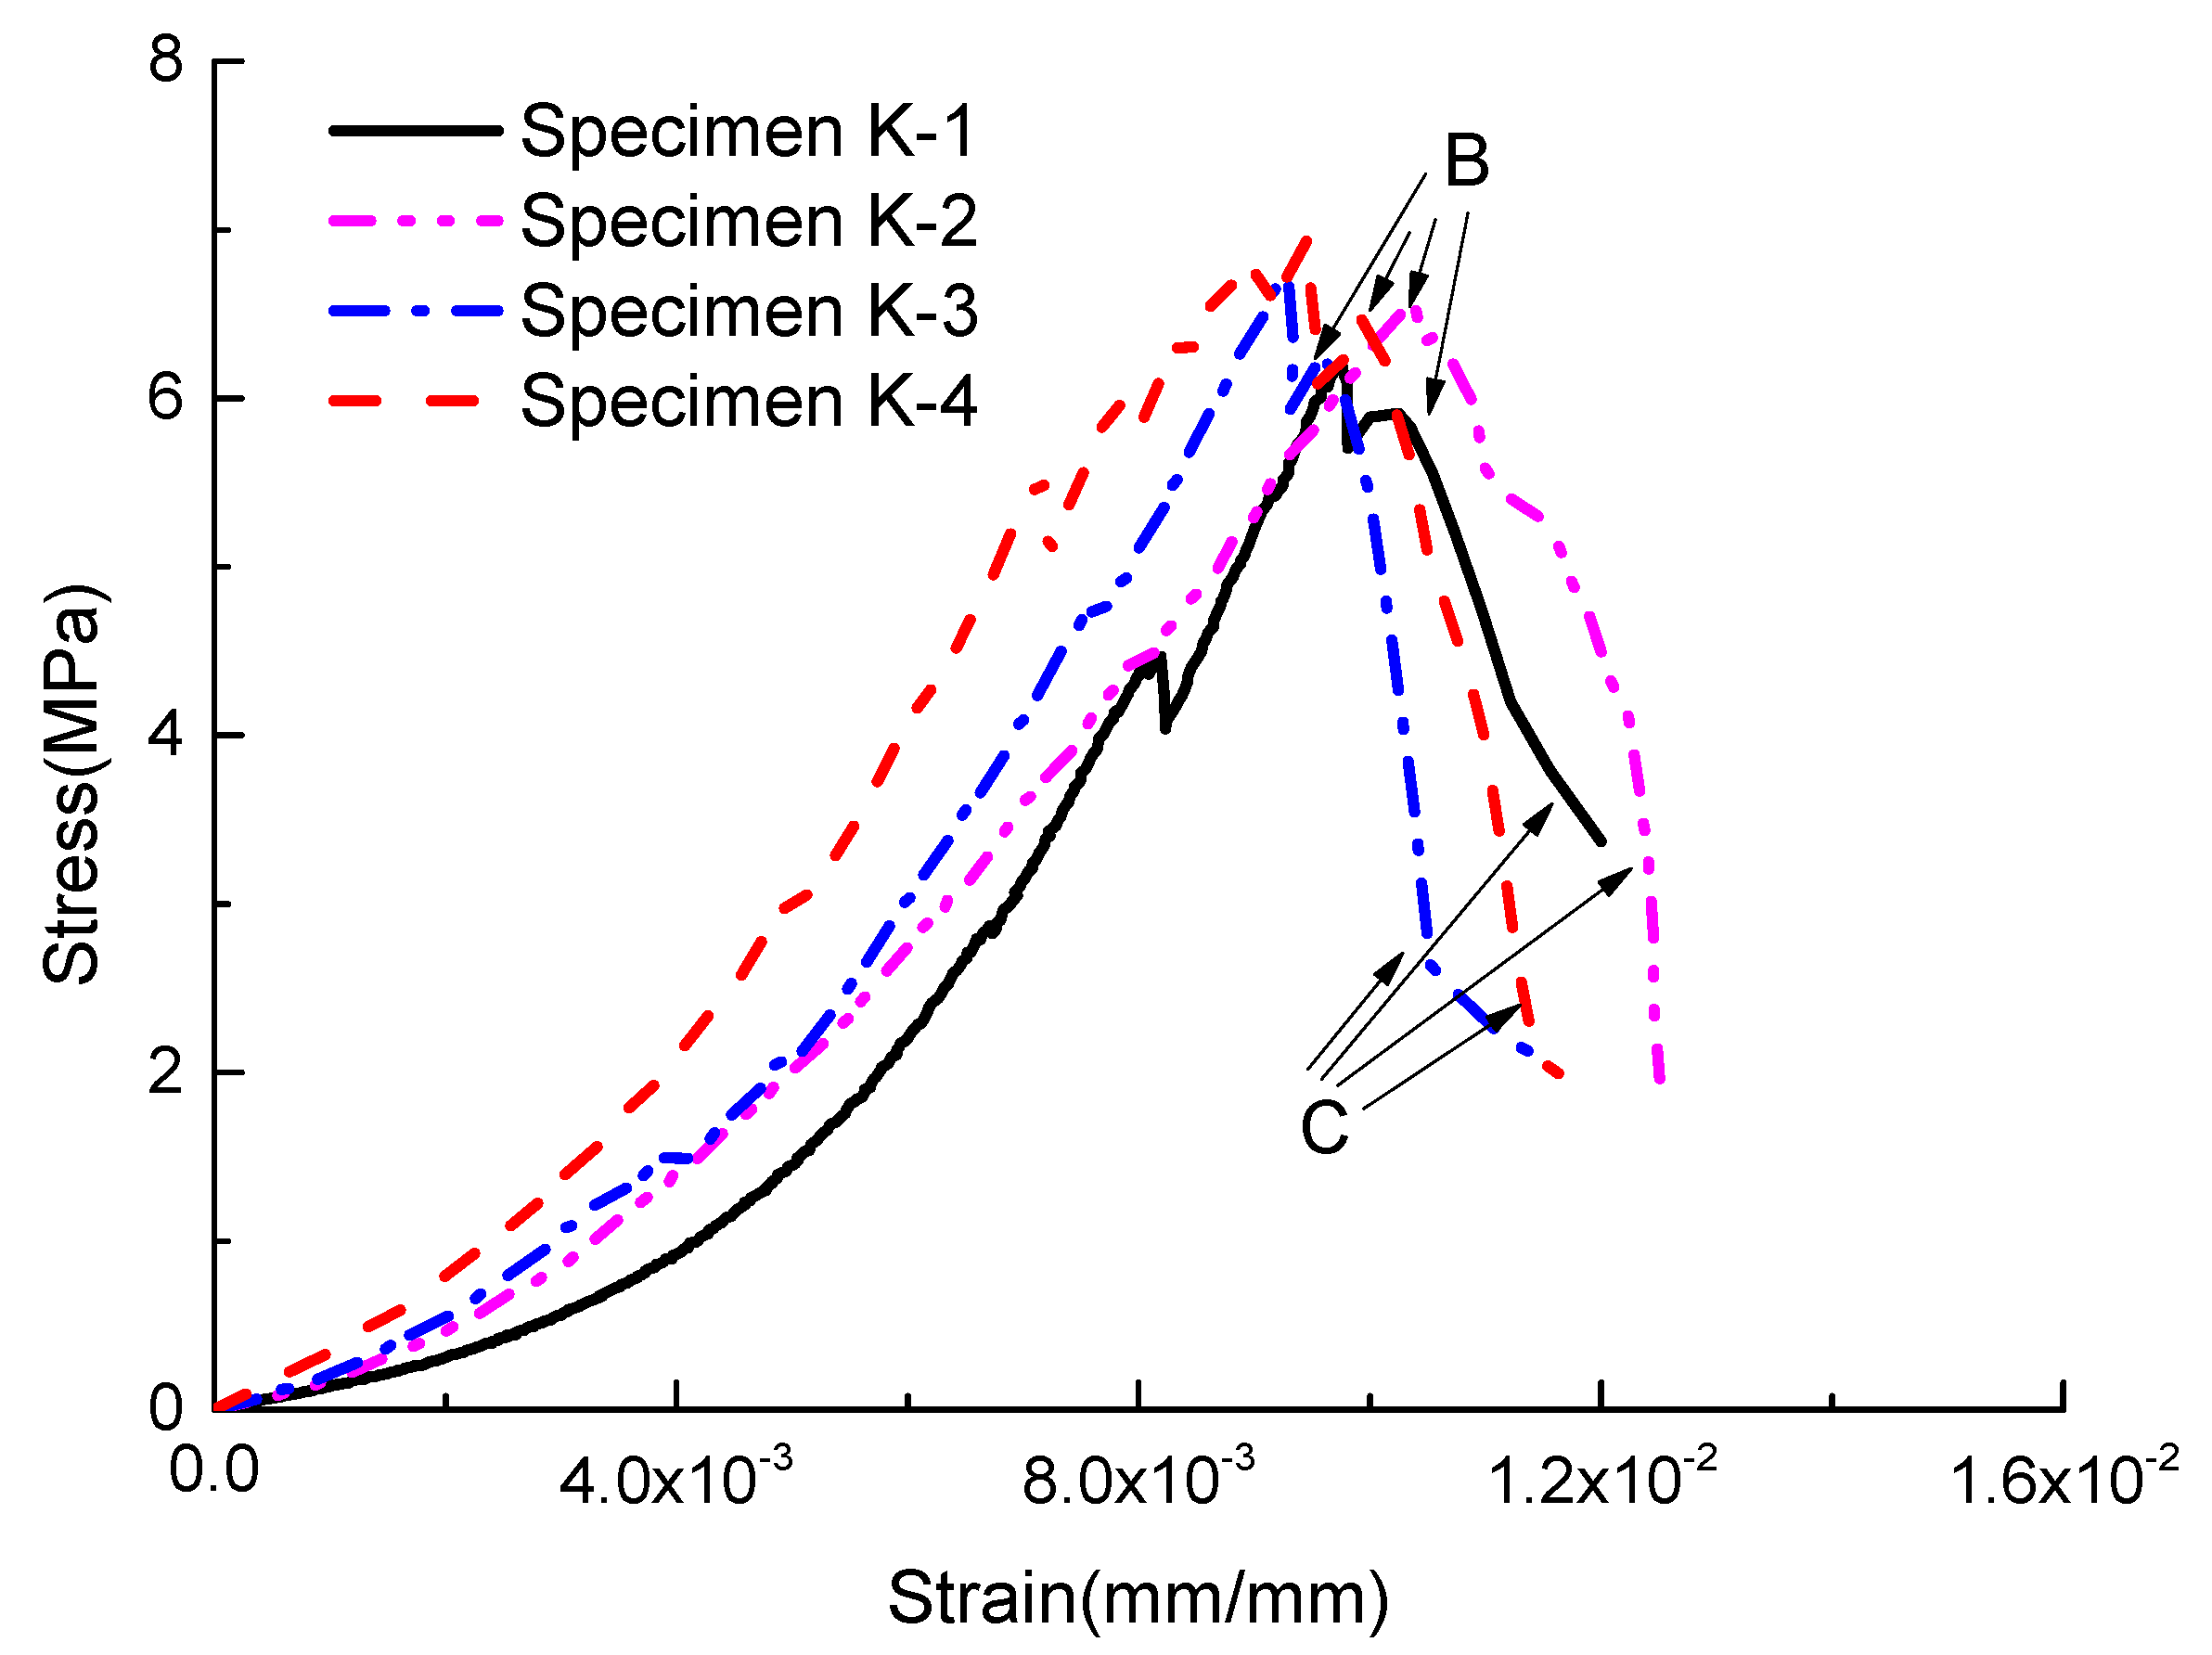
- For the PJ coal mine, the average values of indexes and are 2.1502 and 1.6772. Both indexes indicate a low coal burst proneness, which is consistent with the results of index and tests. However, for TJH coal mine, the average value of index was 2.24 and indicates a low coal burst proneness. All of other indexes, including indexes and , indicate no coal burst proneness, which agrees well with the test results. The results indicate that the modified index is more reasonable than index for coal burst proneness evaluation because it removed the dissipated strain energy from the total input strain energy density
Author Contributions
Funding
Acknowledgments
Conflicts of Interest
References
- Mark, C. Coal bursts in the deep longwall mines of the United States. Int. J. Coal Sci. Technol. 2016, 3, 1–9. [Google Scholar] [CrossRef] [Green Version]
- MacNeill, P. International Mining Fatality Database; NSW Department of Primary Industries: Sydney, Australia, 2018.
- Jiang, Y.; Pan, Y.; Jiang, F.; Dou, L.; Ju, Y. State of the art review on mechanism and prevention of coal bumps in China. J. China Coal Soc. 2014, 39, 205–213. [Google Scholar]
- Lu, C.-P.; Liu, G.-J.; Liu, Y.; Zhang, H. Mechanisms of Rockburst Triggered by Slip and Fracture of Coal–Parting–Coal Structure Discontinuities. Rock Mech. Rock Eng. 2019, 52, 3279–3292. [Google Scholar] [CrossRef]
- Cui, F.; Zhang, T.; Lai, X.; Jia, C.; Shan, P. Study on the Evolution Law of Overburden Breaking Angle under Repeated Mining and the Application of Roof Pressure Relief. Energies 2019, 12, 4513. [Google Scholar] [CrossRef] [Green Version]
- Tan, Y.-L.; Yin, Y.; Gu, S.; Tian, Z. Multi-Index Monitoring and Evaluation on Rock Burst in Yangcheng Mine. Shock. Vib. 2015, 2015, 1–5. [Google Scholar] [CrossRef]
- Abdul-Wahed, M.K.; Al Heib, M.; Senfaute, G. Mining-induced seismicity: Seismic measurement using multiplet approach and numerical modeling. Int. J. Coal Geol. 2006, 66, 137–147. [Google Scholar] [CrossRef]
- Xu, X.; Dou, L.; Lu, C.; Zhang, Y. Frequency spectrum analysis on micro-seismic signal of rock bursts induced by dynamic disturbance. Min. Sci. Technol. (China) 2010, 20, 682–685. [Google Scholar] [CrossRef]
- Lu, C.-P.; Dou, L.-M.; Cao, A.-Y.; Wu, X.-R. Research on microseismic activity rules in Sanhejian Coal Mine. J. Coal Sci. Eng. (China) 2008, 14, 373–377. [Google Scholar] [CrossRef]
- Yu, Y.; Chen, B.-R.; Xu, C.-J.; Diao, X.-H.; Tong, L.; Shi, Y.-F. Analysis for Microseismic Energy of Immediate Rockbursts in Deep Tunnels with Different Excavation Methods. Int. J. Géoméch. 2017, 17, 04016119. [Google Scholar] [CrossRef]
- Ding, Y.; Dou, L.; Cai, W.; Chen, J.; Kong, Y.; Su, Z.; Li, Z. Signal characteristics of coal and rock dynamics with micro-seismic monitoring technique. Int. J. Min. Sci. Technol. 2016, 26, 683–690. [Google Scholar] [CrossRef]
- Zhang, H.; Chen, L.; Chen, S.; Sun, J.; Yang, J. The Spatiotemporal Distribution Law of Microseismic Events and Rockburst Characteristics of the Deeply Buried Tunnel Group. Energies 2018, 11, 3257. [Google Scholar] [CrossRef] [Green Version]
- Cao, A.-Y.; Dou, L.-M.; Wang, C.-B.; Yao, X.-X.; Dong, J.-Y.; Gu, Y. Microseismic Precursory Characteristics of Rock Burst Hazard in Mining Areas Near a Large Residual Coal Pillar: A Case Study from Xuzhuang Coal Mine, Xuzhou, China. Rock Mech. Rock Eng. 2016, 49, 4407–4422. [Google Scholar] [CrossRef]
- Wang, E.; He, X.; Wei, J.; Nie, B.; Song, D. Electromagnetic emission graded warning model and its applications against coal rock dynamic collapses. Int. J. Rock Mech. Min. Sci. 2011, 48, 556–564. [Google Scholar] [CrossRef]
- Wang, E.; He, X.; Liu, X.; Li, Z.; Wang, C.; Xiao, N. A non-contact mine pressure evaluation method by electromagnetic radiation. J. Appl. Geophys. 2011, 75, 338–344. [Google Scholar] [CrossRef]
- Song, D.; Wang, E.; Li, Z.; Qiu, L.; Xu, Z. EMR: An effective method for monitoring and warning of rock burst hazard. Géoméch. Eng. 2017, 12, 53–69. [Google Scholar] [CrossRef]
- Wang, E.; He, X.; Liu, X.; Xu, W. Comprehensive monitoring technique based on electromagnetic radiation and its applications to mine pressure. Saf. Sci. 2012, 50, 885–893. [Google Scholar] [CrossRef]
- Li, X.; Wang, E.; Li, Z.; Liu, Z.; Song, D.; Qiu, L. Rock Burst Monitoring by Integrated Microseismic and Electromagnetic Radiation Methods. Rock Mech. Rock Eng. 2016, 49, 4393–4406. [Google Scholar] [CrossRef]
- Wei, C.; Zhang, C.; Canbulat, I.; Cao, A.; Dou, L. Evaluation of current coal burst control techniques and development of a coal burst management framework. Tunn. Undergr. Space Technol. 2018, 81, 129–143. [Google Scholar] [CrossRef]
- Hendon, G. Gateroad pillar extraction experience at Jim Walter Resources. In Proceedings of the 17th International Conference on Ground Control in Mining, Morgantown, WV, USA, 4–6 August 1998; pp. 1–10. [Google Scholar]
- Mark, C.; Gauna, M. Evaluating the risk of coal bursts in underground coal mines. Int. J. Min. Sci. Technol. 2016, 26, 47–52. [Google Scholar] [CrossRef]
- Koehler, J.; DeMarco, M.; Wuest, W. Critical pillar concept in yield-pillar-based longwall gate-road design. Min. Eng. 1996, 48, 73–78. [Google Scholar]
- Iannacchione, A.; Tadolini, S.C. Coal mine burst prevention controls. In Proceedings of the 27th International Conference on Ground Control in Mining, Morgantown, WV, USA, 29–31 July 2008; pp. 20–28. [Google Scholar]
- Pan, J.; Ning, Y.; Du, T.; Zhang, Y.; Liu, J.; Xia, Y.; Wei, X. The theory and system for preventing rock burst in large-scale areas. J. China Coal Soc. 2012, 37, 1803–1809. [Google Scholar]
- Kaiser, P.K.; Cai, M. Design of rock support system under rockburst condition. J. Rock Mech. Geotech. Eng. 2012, 4, 215–227. [Google Scholar] [CrossRef] [Green Version]
- Fan, J.; Dou, L.; He, H.; Du, T.; Zhang, S.; Gui, B.; Sun, X. Directional hydraulic fracturing to control hard-roof rockburst in coal mines. Int. J. Min. Sci. Technol. 2012, 22, 177–181. [Google Scholar] [CrossRef]
- He, M.; Xia, H.; Jia, X.; Gong, W.; Zhao, F.; Liang, K. Studies on classification, criteria and control of rockbursts. J. Rock Mech. Geotech. Eng. 2012, 4, 97–114. [Google Scholar] [CrossRef] [Green Version]
- He, H.; Dou, L.; Fan, J.; Du, T.; Sun, X. Deep-hole directional fracturing of thick hard roof for rockburst prevention. Tunn. Undergr. Space Technol. 2012, 32, 34–43. [Google Scholar] [CrossRef]
- Dai, S.; Wang, X.; Pan, Y. Experimental study on the evaluation of coal burst tendency utilizing modulus index. J. China Coal Soc. 2019, 44, 1726–1731. [Google Scholar]
- Xu, J.; Jiang, J.; Xu, N.; Liu, Q.; Gao, Y. A new energy index for evaluating the tendency of rockburst and its engineering application. Eng. Geol. 2017, 230, 46–54. [Google Scholar] [CrossRef]
- Gong, F.; Yan, J.; Li, X.; Luo, S. A peak-strength strain energy storage index for rock burst proneness of rock materials. Int. J. Rock Mech. Min. Sci. 2019, 117, 76–89. [Google Scholar] [CrossRef]
- Wang, J.-A.; Park, H. Comprehensive prediction of rockburst based on analysis of strain energy in rocks. Tunn. Undergr. Space Technol. 2001, 16, 49–57. [Google Scholar] [CrossRef]
- Yang, X.; Ren, T.; Tan, L.; Remennikov, A.; He, X. Developing coal burst propensity index method for Australian coal mines. Int. J. Min. Sci. Technol. 2018, 28, 783–790. [Google Scholar] [CrossRef]
- Su, C.D.; Yuan, R.F.; Zhai, X.X. Experimental research bursting liability index of coal samples of Chengjiao coal mine. Chin. J. Rock Mech. Eng. 2013, 32, 3692–3704. [Google Scholar]
- Classification and Laboratory Test Method on Bursting Liability of Coal; GB/T 25217.2-2010; Standards Press of China: Beijing, China, 2010.
- Zhang, C.Q.; Lu, J.J.; Chen, J.; Zhou, H.; Yang, F.J. Discussion on rock burst proneness indexes and their relation. Rock Soil Mech. 2017, 38, 1397–1404. [Google Scholar]
- Gong, F.; Yan, J.; Luo, S.; Li, X. Investigation on the Linear Energy Storage and Dissipation Laws of Rock Materials Under Uniaxial Compression. Rock Mech. Rock Eng. 2019, 52, 4237–4255. [Google Scholar] [CrossRef]
- Fairhurst, C.E.; Hudson, J.A. Draft ISRM suggested method for the complete stress-strain curve for intact rock in uniaxial compression. Int. J. Rock Mech. Min. Sci. 1999, 36, 281–289. [Google Scholar]
- Liang, C.Y.; Zhang, Q.B.; Li, X.; Xin, P. The effect of specimen shape and strain rate on uniaxial compressive behavior of rock material. Bull. Int. Assoc. Eng. Geol. 2015, 75, 1669–1681. [Google Scholar] [CrossRef]
- Zhai, S.; Su, G.; Yin, S.; Zhao, B.; Yan, L. Rockburst characteristics of several hard brittle rocks: A true triaxial experimental study. J. Rock Mech. Geotech. Eng. 2020. [Google Scholar] [CrossRef]
- Li, D.; Sun, Z.; Xie, T.; Li, X.; Ranjith, P. Energy evolution characteristics of hard rock during triaxial failure with different loading and unloading paths. Eng. Geol. 2017, 228, 270–281. [Google Scholar] [CrossRef]


| Burst Proneness | None | Low | High | |
|---|---|---|---|---|
| Index | DT (ms) | DT > 500 | 50 < DT ≤ 500 | DT ≤ 50 |
| Wet | Wet < 2 | 2 ≤ Wet < 5 | Wet ≥ 5 | |
| Ke | Ke < 1.5 | 1.5 ≤ Ke < 5 | Ke ≥ 5 | |
| Rc (MPa) | Rc < 7 | 7 ≤ Rc < 14 | Rc ≥ 14 | |
| Group No. | Specimen No. | Stress Level k | (mJ/mm3) | (mJ/mm3) | (mJ/mm3) | Wet |
|---|---|---|---|---|---|---|
| Group 1 | A-1 | 52% | 0.0130 | 0.0098 | 0.0032 | 3.02 |
| A-2 | 63% | 0.0165 | 0.0124 | 0.0041 | 3.06 | |
| A-3 | 79% | 0.0241 | 0.0199 | 0.0042 | 4.76 | |
| A-4 | 86% | 0.0307 | 0.0233 | 0.0074 | 3.14 | |
| Group 2 | B-1 | 62% | 0.0199 | 0.0156 | 0.0043 | 3.60 |
| B-2 | 73% | 0.0244 | 0.0192 | 0.0052 | 3.72 | |
| B-3 | 84% | 0.0294 | 0.0225 | 0.0069 | 3.27 | |
| B-4 | 93% | 0.0342 | 0.0272 | 0.0070 | 3.87 | |
| Group 3 | C-1 | 51% | 0.0168 | 0.0128 | 0.0040 | 3.21 |
| C-2 | 67% | 0.0239 | 0.0186 | 0.0053 | 3.51 | |
| C-3 | 78% | 0.0308 | 0.0249 | 0.0059 | 4.23 | |
| C-4 | 86% | 0.0384 | 0.0298 | 0.0086 | 3.44 |
| Group No. | A | Average Value of A | Percentage Error (%) | B (×10−4) | Average Value of B | Percentage Error (%) |
|---|---|---|---|---|---|---|
| Group 1 | 0.7912 | 0.7491 | 0.365 | –3.24 | –3.43 × 10⁻⁴ | 5.539 |
| Group 2 | 0.7952 | 0.139 | –3.27 | 4.665 | ||
| Group 3 | 0.7960 | 0.239 | –3.52 | 2.624 |
| Specimen No. | (MPa) | (mJ/mm3) | (mJ/mm3) | (mJ/mm3) | (mJ/mm3) | (mJ/mm3) | |||
|---|---|---|---|---|---|---|---|---|---|
| K-1 | 6.21 | 0.0336 | 0.0216 | 0.0168 | 0.0048 | 0.0120 | 1.7962 | 3.509 | 1.3978 |
| K-2 | 6.65 | 0.0374 | 0.0253 | 0.0198 | 0.0056 | 0.0121 | 2.0978 | 3.557 | 1.6374 |
| K-3 | 6.74 | 0.0343 | 0.0230 | 0.0179 | 0.0051 | 0.0113 | 2.0336 | 3.528 | 1.5846 |
| K-4 | 6.97 | 0.0375 | 0.0273 | 0.0214 | 0.0060 | 0.0102 | 2.6732 | 3.578 | 2.0892 |
| Index | DT (ms) | Wet | Ke | Rc (MPa) |
|---|---|---|---|---|
| Test results | 1850 | 4.76 | 1.80 | 6.21 |
| 752 | 3.27 | 2.10 | 6.65 | |
| 2002 | 4.32 | 2.03 | 6.74 | |
| 503 | 4.59 | 2.67 | 6.97 | |
| Average | 1276.8 | 4.24 | 2.15 | 6.64 |
| Burst proneness | None | Low | Low | None |
| Group No. | Specimen No. | Stress Level k | (mJ/mm3) | (mJ/mm3) | (mJ/mm3) | Wet |
|---|---|---|---|---|---|---|
| Group 1 | D-1 | 51% | 0.0149 | 0.0088 | 0.0061 | 1.44 |
| D-2 | 66% | 0.0195 | 0.0109 | 0.0085 | 1.28 | |
| D-3 | 81% | 0.0200 | 0.0119 | 0.0081 | 1.47 | |
| D-4 | 89% | 0.0216 | 0.0129 | 0.0087 | 1.48 |
| Specimen No. | (MPa) | (mJ/mm3) | (mJ/mm3) | (mJ/mm3) | (mJ/mm3) | (mJ/mm3) | |||
|---|---|---|---|---|---|---|---|---|---|
| T-1 | 6.11 | 0.02919 | 0.02107 | 0.0123 | 0.0087 | 0.0081 | 2.5948 | 1.415 | 1.5202 |
| T-2 | 5.59 | 0.03058 | 0.02045 | 0.0120 | 0.0085 | 0.0101 | 2.0188 | 1.412 | 1.1819 |
| T-3 | 6.39 | 0.03509 | 0.025623 | 0.0151 | 0.0106 | 0.0095 | 2.7066 | 1.427 | 1.5914 |
| T-4 | 5.41 | 0.02966 | 0.01839 | 0.0107 | 0.0076 | 0.0113 | 1.6318 | 1.404 | 0.9531 |
| Index | DT (ms) | Wet | Ke | Rc (MPa) |
|---|---|---|---|---|
| Test results | 3039 | 1.47 | 2.59 | 6.11 |
| 3508 | 1.36 | 2.02 | 5.59 | |
| 2692 | 1.58 | 2.71 | 6.39 | |
| 4056 | 1.24 | 1.63 | 5.41 | |
| Average | 3323.8 | 1.41 | 2.24 | 5.88 |
| Burst proneness | None | None | Low | None |
© 2020 by the authors. Licensee MDPI, Basel, Switzerland. This article is an open access article distributed under the terms and conditions of the Creative Commons Attribution (CC BY) license (http://creativecommons.org/licenses/by/4.0/).
Share and Cite
Liu, X.; Liu, Q.; Liu, B.; Kang, Y. A Modified Bursting Energy Index for Evaluating Coal Burst Proneness and Its Application in Ordos Coalfield, China. Energies 2020, 13, 1729. https://doi.org/10.3390/en13071729
Liu X, Liu Q, Liu B, Kang Y. A Modified Bursting Energy Index for Evaluating Coal Burst Proneness and Its Application in Ordos Coalfield, China. Energies. 2020; 13(7):1729. https://doi.org/10.3390/en13071729
Chicago/Turabian StyleLiu, Xuewei, Quansheng Liu, Bin Liu, and Yongshui Kang. 2020. "A Modified Bursting Energy Index for Evaluating Coal Burst Proneness and Its Application in Ordos Coalfield, China" Energies 13, no. 7: 1729. https://doi.org/10.3390/en13071729