Article

Vehicle-to-Grid in Standard and Fast Electric Vehicle Charging: Comparison of Renewable Energy Source Utilization and Charging Costs

1
Maritime Department, University of Dubrovnik, 20000 Dubrovnik, Croatia
2
Faculty of Mechanical Engineering and Naval Architecture, University of Zagreb, 10000 Zagreb, Croatia
*
Author to whom correspondence should be addressed.
Energies 2020, 13(6), 1510; https://doi.org/10.3390/en13061510
Submission received: 4 February 2020 / Revised: 6 March 2020 / Accepted: 19 March 2020 / Published: 22 March 2020
(This article belongs to the Special Issue Impact of Electric Vehicles on the Power System)

Abstract

:
Croatia aims to achieve 10% of its energy production from the renewable energy sources in the total energy consumption in the transport sector. One of the ways to achieve this goal is by the use of electric vehicles. This work comparatively analyses the financial and social aspects of vehicle-to-grid charging in standard and fast charging mode, their impact on the renewable electricity production and the total electricity consumption regulated through variable electricity prices. Data were taken for the wider urban area of the Dubrovnik region. The assumption is that the Dubrovnik region will be self-sufficient by the year 2050 with 100% renewable electricity production and that all conventional vehicles will be replaced by electric vehicles. This work aims to show that the fast charging based on 10 min time steps offers more opportunities for flexibility and utilization of renewable generation in the energy system than the standard charging based on hourly time step. The results of this work showed the opposite, where in most of the scenarios standard charging provided better results. Replacement of the existing two tariff model in electricity prices with variable electricity prices contributes to the stability of the energy system, providing better regulation of charging and higher opportunities for renewable electricity utilization in standard and fast charging and reduction of charging costs. According to the financial aspects, fast charging is shown to be more expensive, but for the social aspects, it provides electric vehicles with more opportunities for better competition in the market.

1. Introduction

The usage of conventional fuels is causing an increase in greenhouse gas emissions (GHG) in the atmosphere which in recent years has been causing an increase in a global air temperature (global warming). The energy production and transport sectors use large amounts of conventional fuels. In the European Union, the transport sector has 20% a share of the total greenhouse gas emissions and a 31.7% share in final energy consumption [1]. The world is seeking sustainable solutions that will result in a decrease in GHG emissions by replacing conventional fuels with alternative fuels. One way to achieve that goal is the replacement of conventional fuels in transport and energy production, using electric vehicles (EV) and renewable energy sources (RES). EVs can affect the decrease of the global GHG emissions from 10% to 24% when compared with conventional vehicles (CV) [2]. The Republic of Croatia has a great potential in usage of RES in energy production. Being part of the European Union (EU), Croatia has accepted the Directive 2009/30/EC of the European Parliament and of the Council which requires that each member state achieve a minimum share of RES in the final energy consumption in transport by 10% by the year 2020 [3]. Croatia has published its own energy strategy according to the EU Directive. A strategy goal is to achieve the increase in usage of RES in energy production in order to decrease the usage of conventional fuels and air pollution. The share of energy sectors in Croatia in the total GHG emissions is approximately 75%. Energy consumption projections show a global increase of about 50% until 2030, which indicates the need for new sources of energy in the future and sustainable development. According to those facts, Croatia has set a goal in achieving 20% of RES in the final energy consumption and maintaining the level of 35% of a share of electricity generation from RES in overall electricity consumption until 2020, both including large hydropower plants [4].
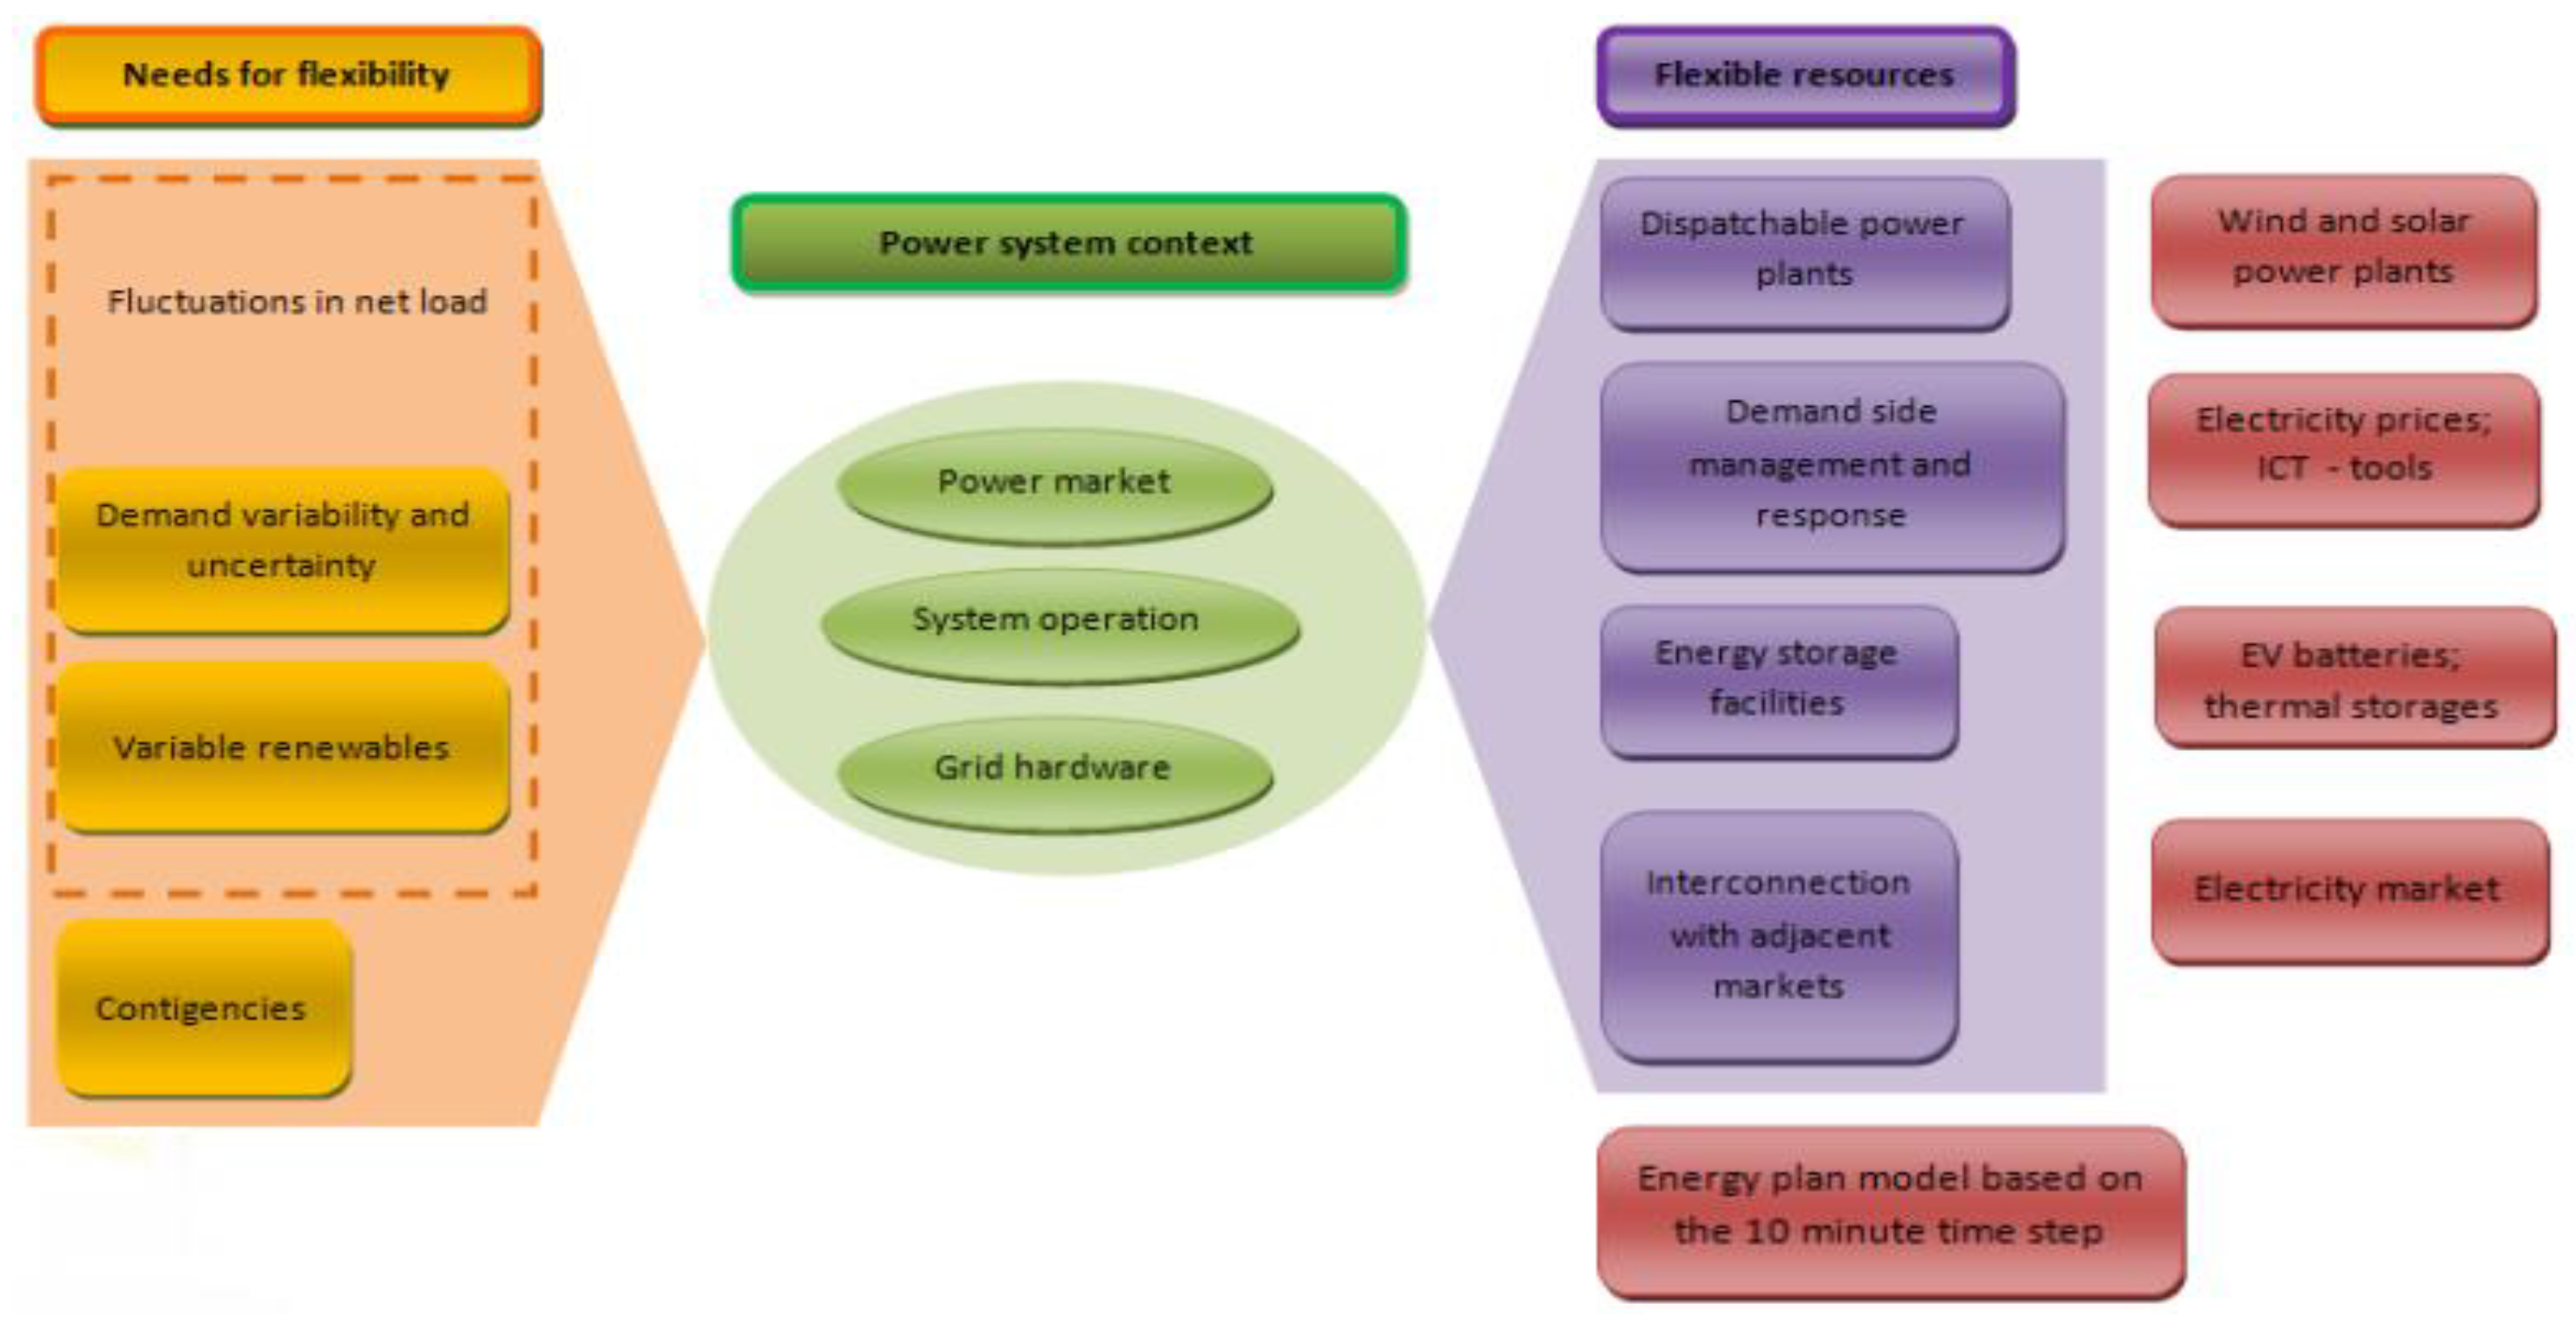
Encouraging the production of electricity from RES leads to an increasing share of RES in energy production. It is possible to expect very high shares of the RES in the future, for example up to 100% share in 2050. However, such systems have high demands for flexibility due to the intermittent nature of energy production from RES which depends on the weather conditions. For example, wind and sun potential, can suffer from an excess or a lack of production, resulting in overloading of the power grid system. Such energy systems can be sustainable only by using advanced planning and smart energy system approach. Study [5] done for Croatia suggests that, with assumed future costs of fuels and technology, a certain level of conventional energy sources will have to remain in the energy system to take into the account unfavorable weather conditions and to cover heating demand. A study done for the Dubrovnik region in Croatia analyzed such a system. The future projections till 2050 included 100% RES share in energy production and replacement of all CVs with EVs [1]. The calculations of the study indicated a high critical excess of electricity production (CEEP) amount. Although EVs are shown to encourage integration of RES into the power system, the results showed that additional sources of flexibility in the system are required. Some of the solutions could be additional thermal storage through heating and cooling, integration of the electricity market and the use of information and communication technology (ICT) tools. Integration of the electricity market can be used to regulate electricity flows using electricity prices and ICT tools can ensure communication between all the participants of the energy system. The calculations for this study have been done in a 1 h time step through the whole year. Charging and discharging of EVs is considered to require 5 h to charge the full battery.
Since the science is progressing rapidly, today we have the examples of EV fast charging in 10 min time steps and energy markets working on a short-term scale. Examples are the Brazilian short-term electricity market [6] and the Central Western European region, including the Belgian, French, German, and Dutch market zones [7]. According to that progress, a short-term scale analyses should be applied in future energy planning studies. Studies [8] and [9] analyzed short-term electricity markets in order to enhance RES integration into the power system. Many studies are done dealing with energy planning on 1 h time scales for different energy systems. Examples are the studies done for the Dubrovnik region [1], Croatia [10], Serbia [11], Macedonia [12] and Portugal [13], but not much is done on a short-term scale. Maybe there is a possibility for energy planning, based on a short-term scale, to provide the additional flexibility needed to ensure the stability of future energy systems. The assumption is based on the fact that fast EV charging requires a 30 time higher power density from the grid in 10 min than 1 h of the standard EV charging, which takes 5 h to charge the whole battery. We assume that the fast EV charging will provide better integration of intermittent RES electricity production, utilizing higher power density from the grid as well as providing higher power density to the grid when required. In this way, fast EV charging could provide better flexibility to the power system in comparison to standard EV charging. This possibility is analyzed within this work and a comparison is done between standard and fast EV charging on hourly and 10 min term scales, respectively. When doing our literature search, we haven’t found any previous study analyzing this possibility and using a similar approach as used in this study. Previous studies did comparisons according to the battery characteristics, battery life cycle, time needed to recharge the battery and financial aspects like installation costs for charging stations. Further analyses are needed to investigate this possibility and one of them will be presented within this work as well as in our future work.
Our previous study [14] provided results of the comparison of statistically processed data on 1 h and 10 min time scales. The study performed correlation analyses of the wind speed, solar radiation, electricity demand and air temperature data for the selected Dubrovnik region. Correlations are done in between the selected parameters for the long and short-term period, analyzing the complementarity of the potential of RES with the electricity demand and air temperature as well as the complementarity between the RES potentials. Correlation results of the linear regression and correlation between the selected parameters for the 10 min time step indicate a decrease in the correlation coefficient values according to the long-term time step. The study indicated the need for future work. In order to ensure the stability of power systems with a high share of RES in the system, a short-term forecasting of wind and solar energy resources and generation will be needed, as shown in the literature [15,16].
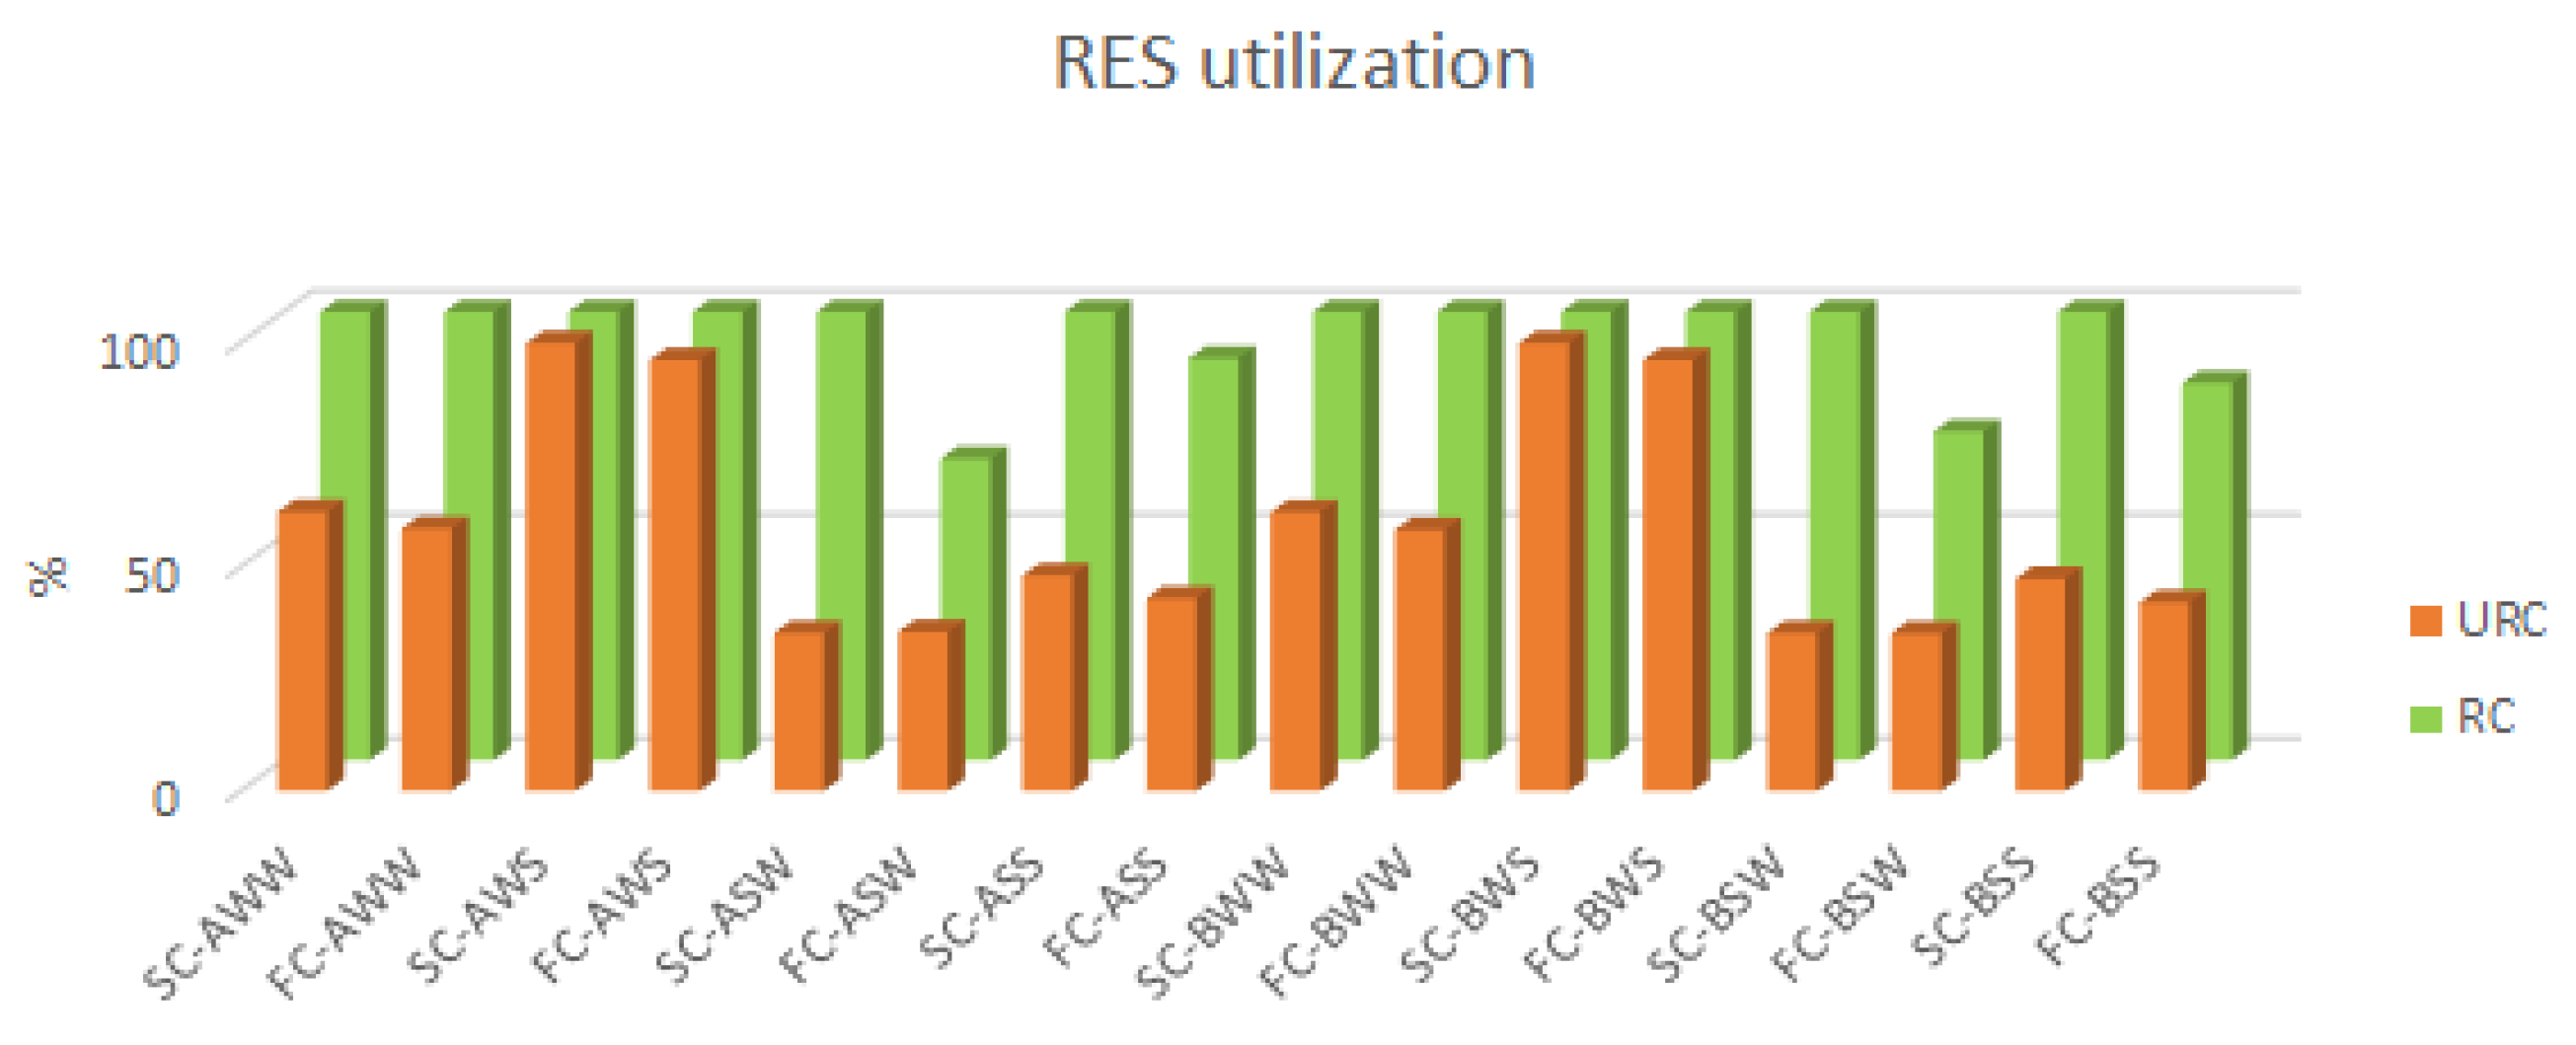
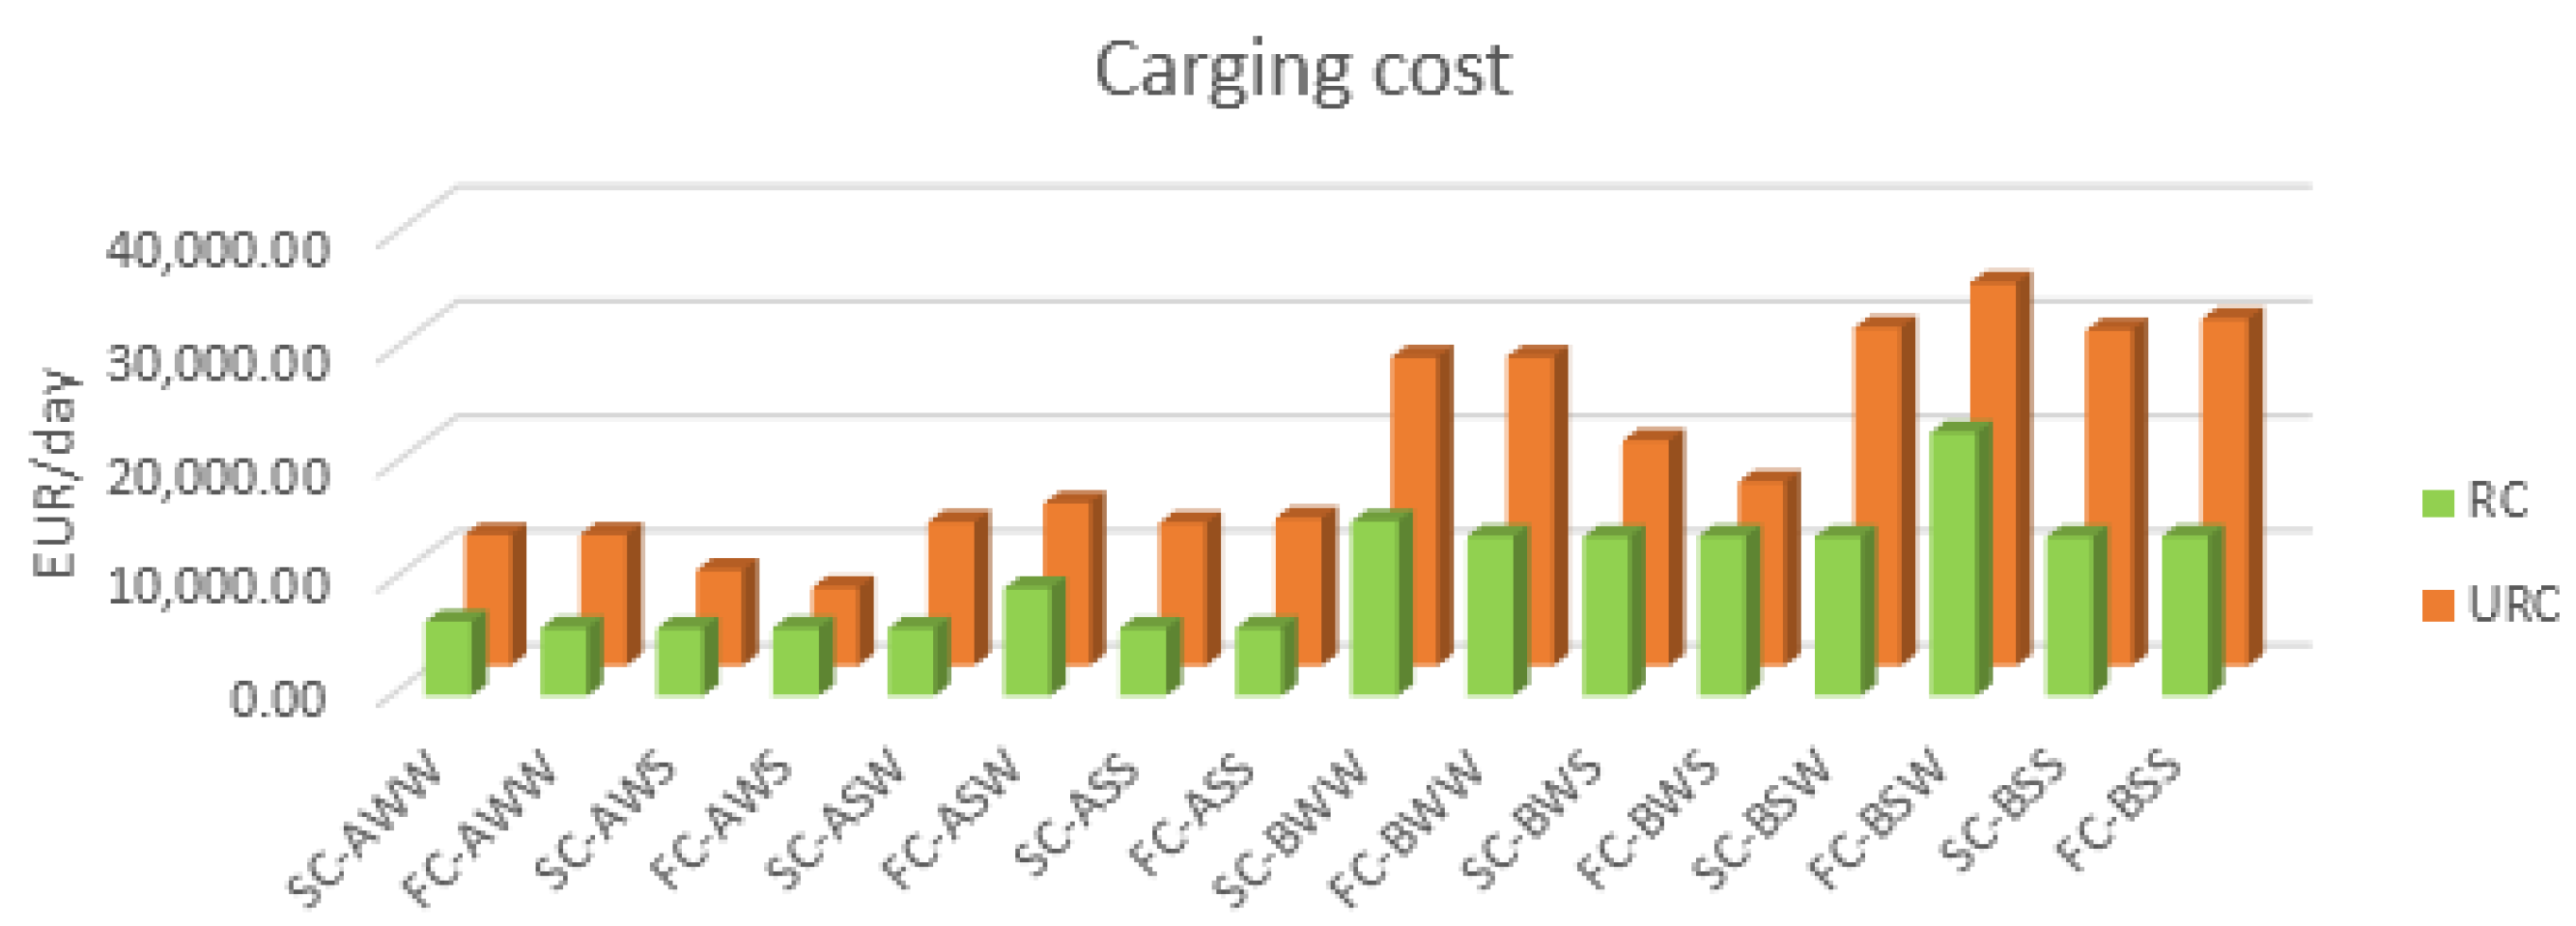
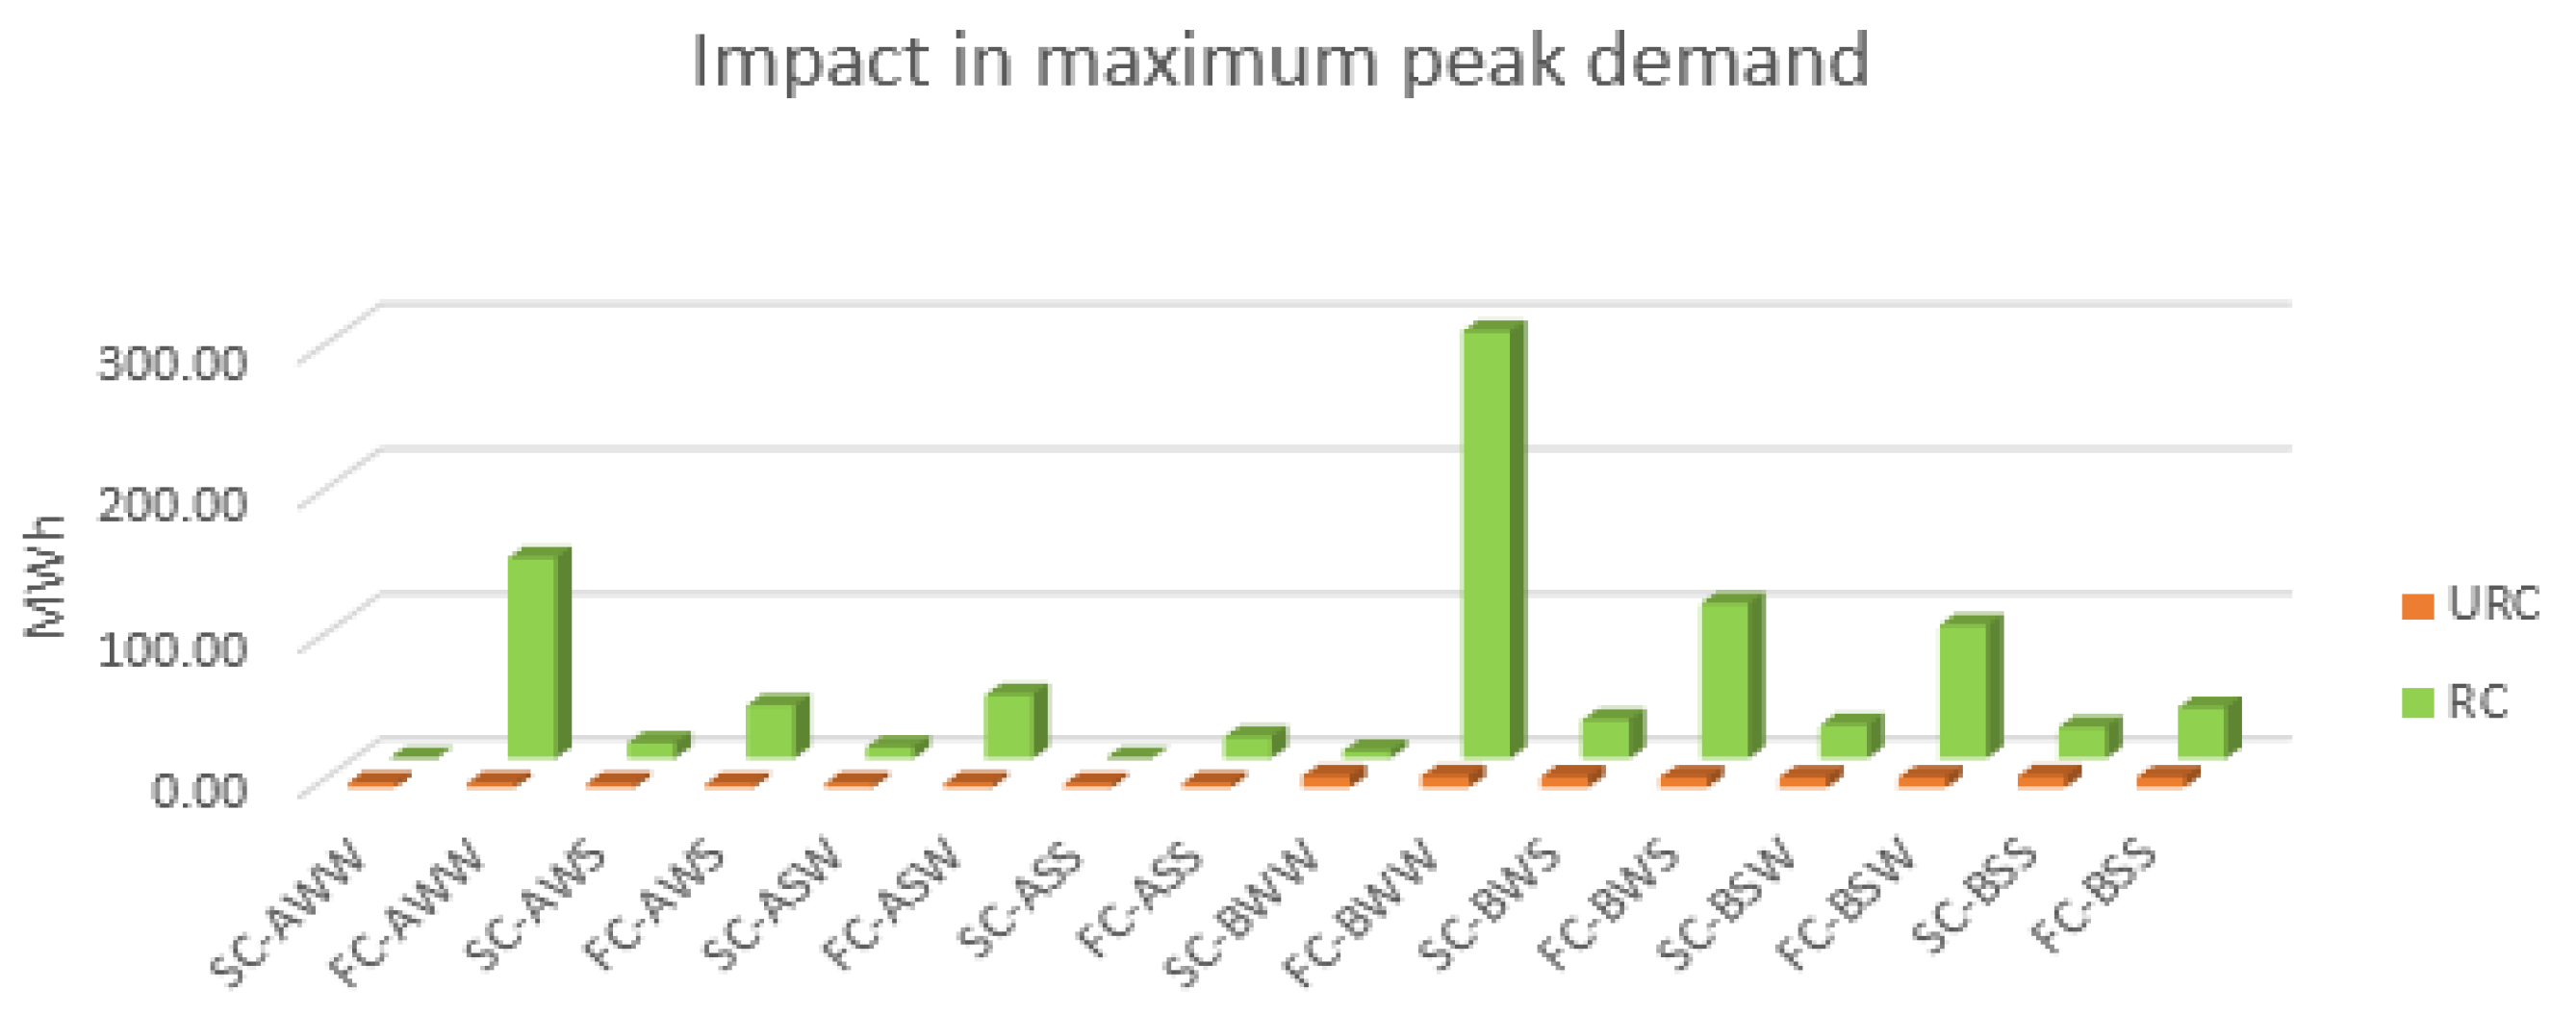
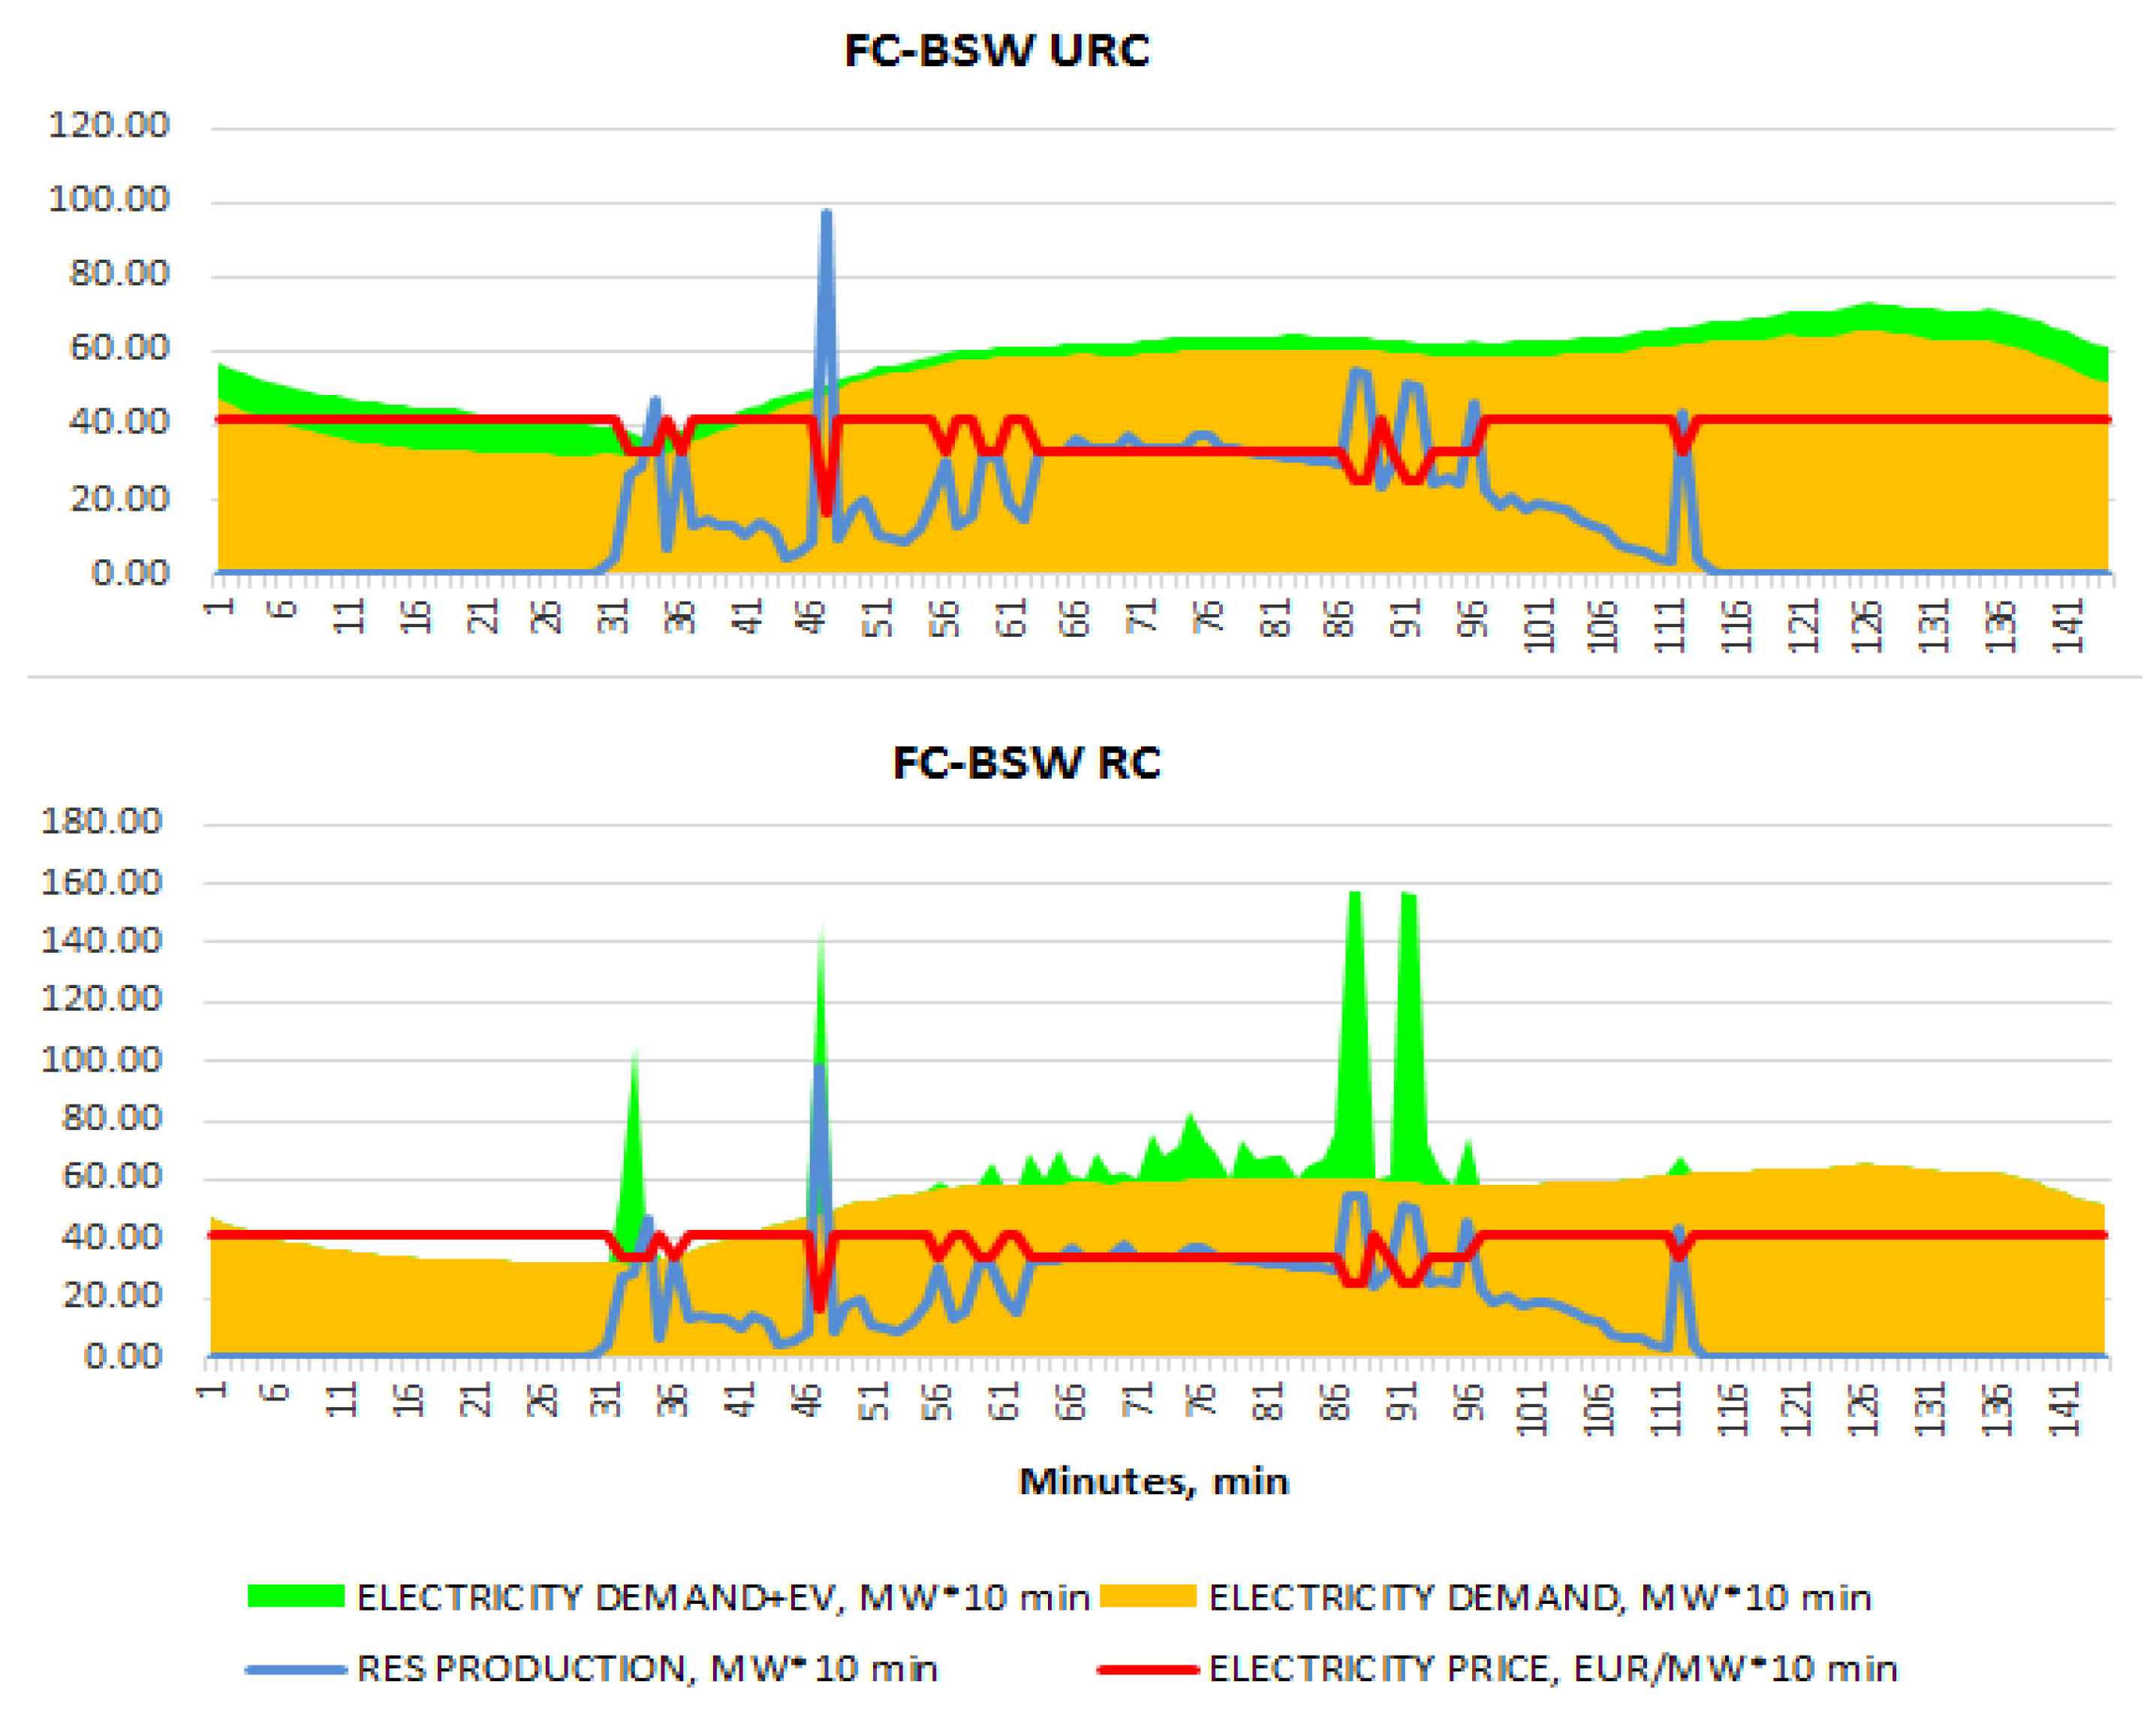
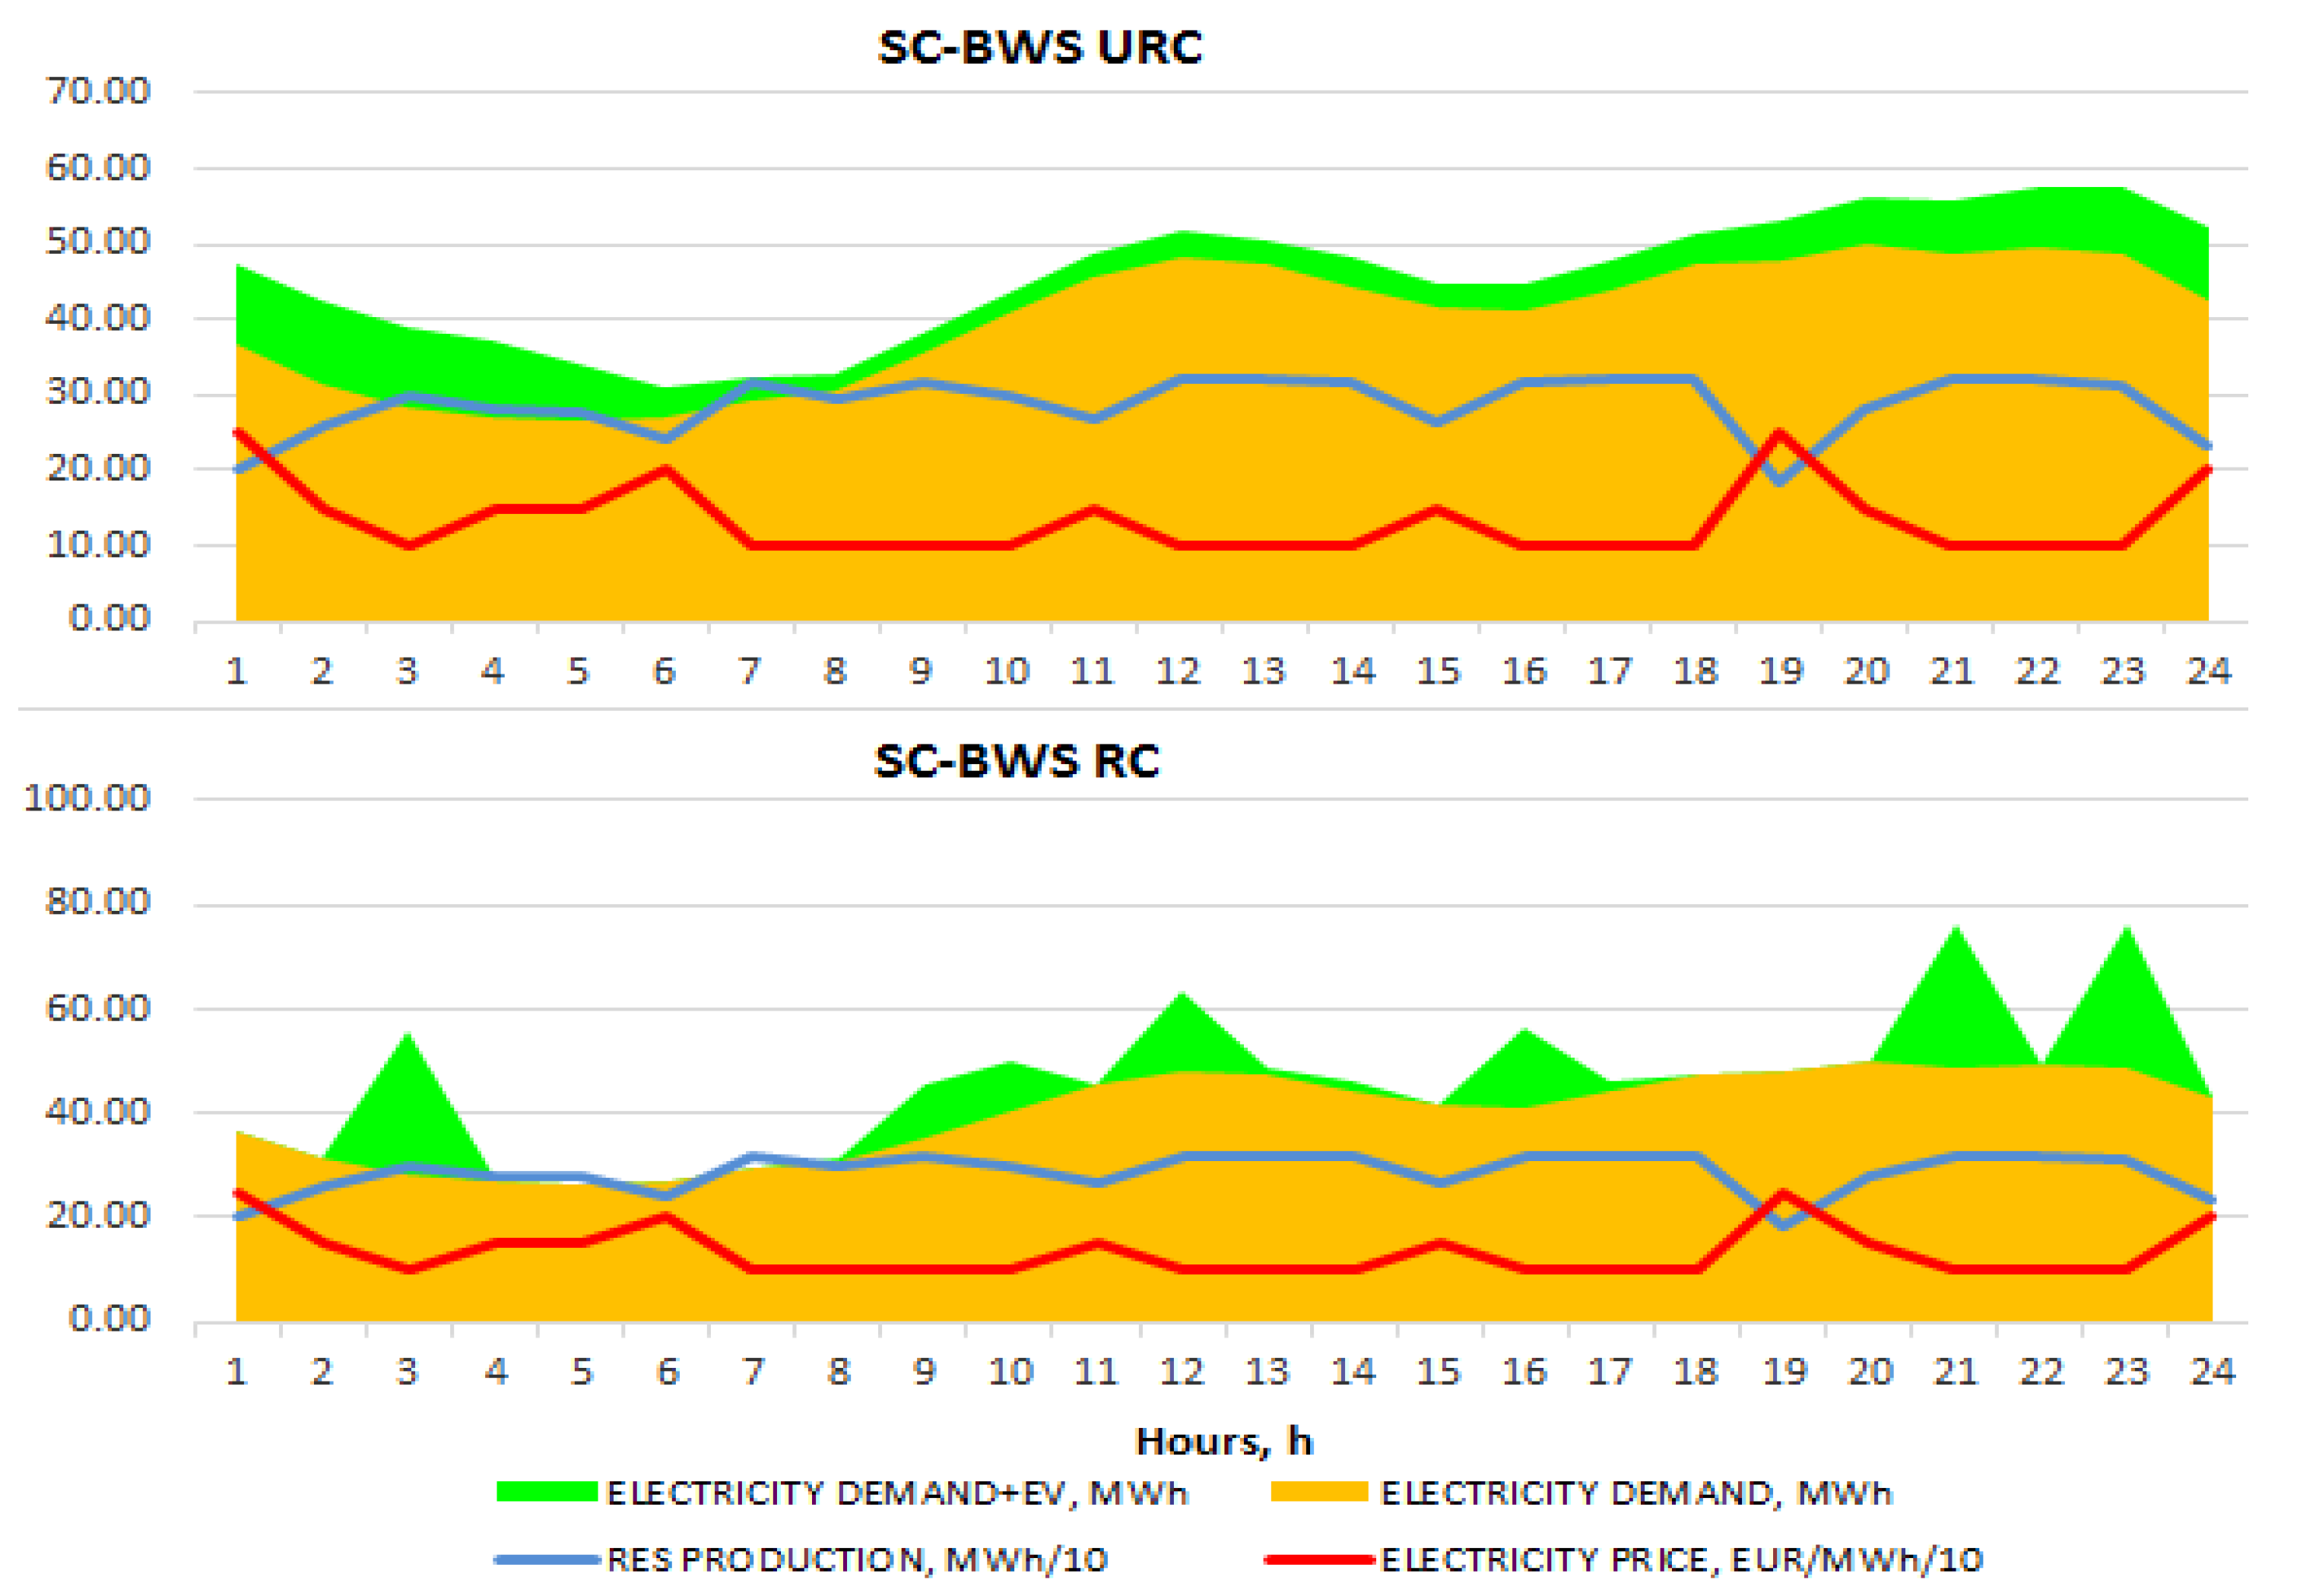
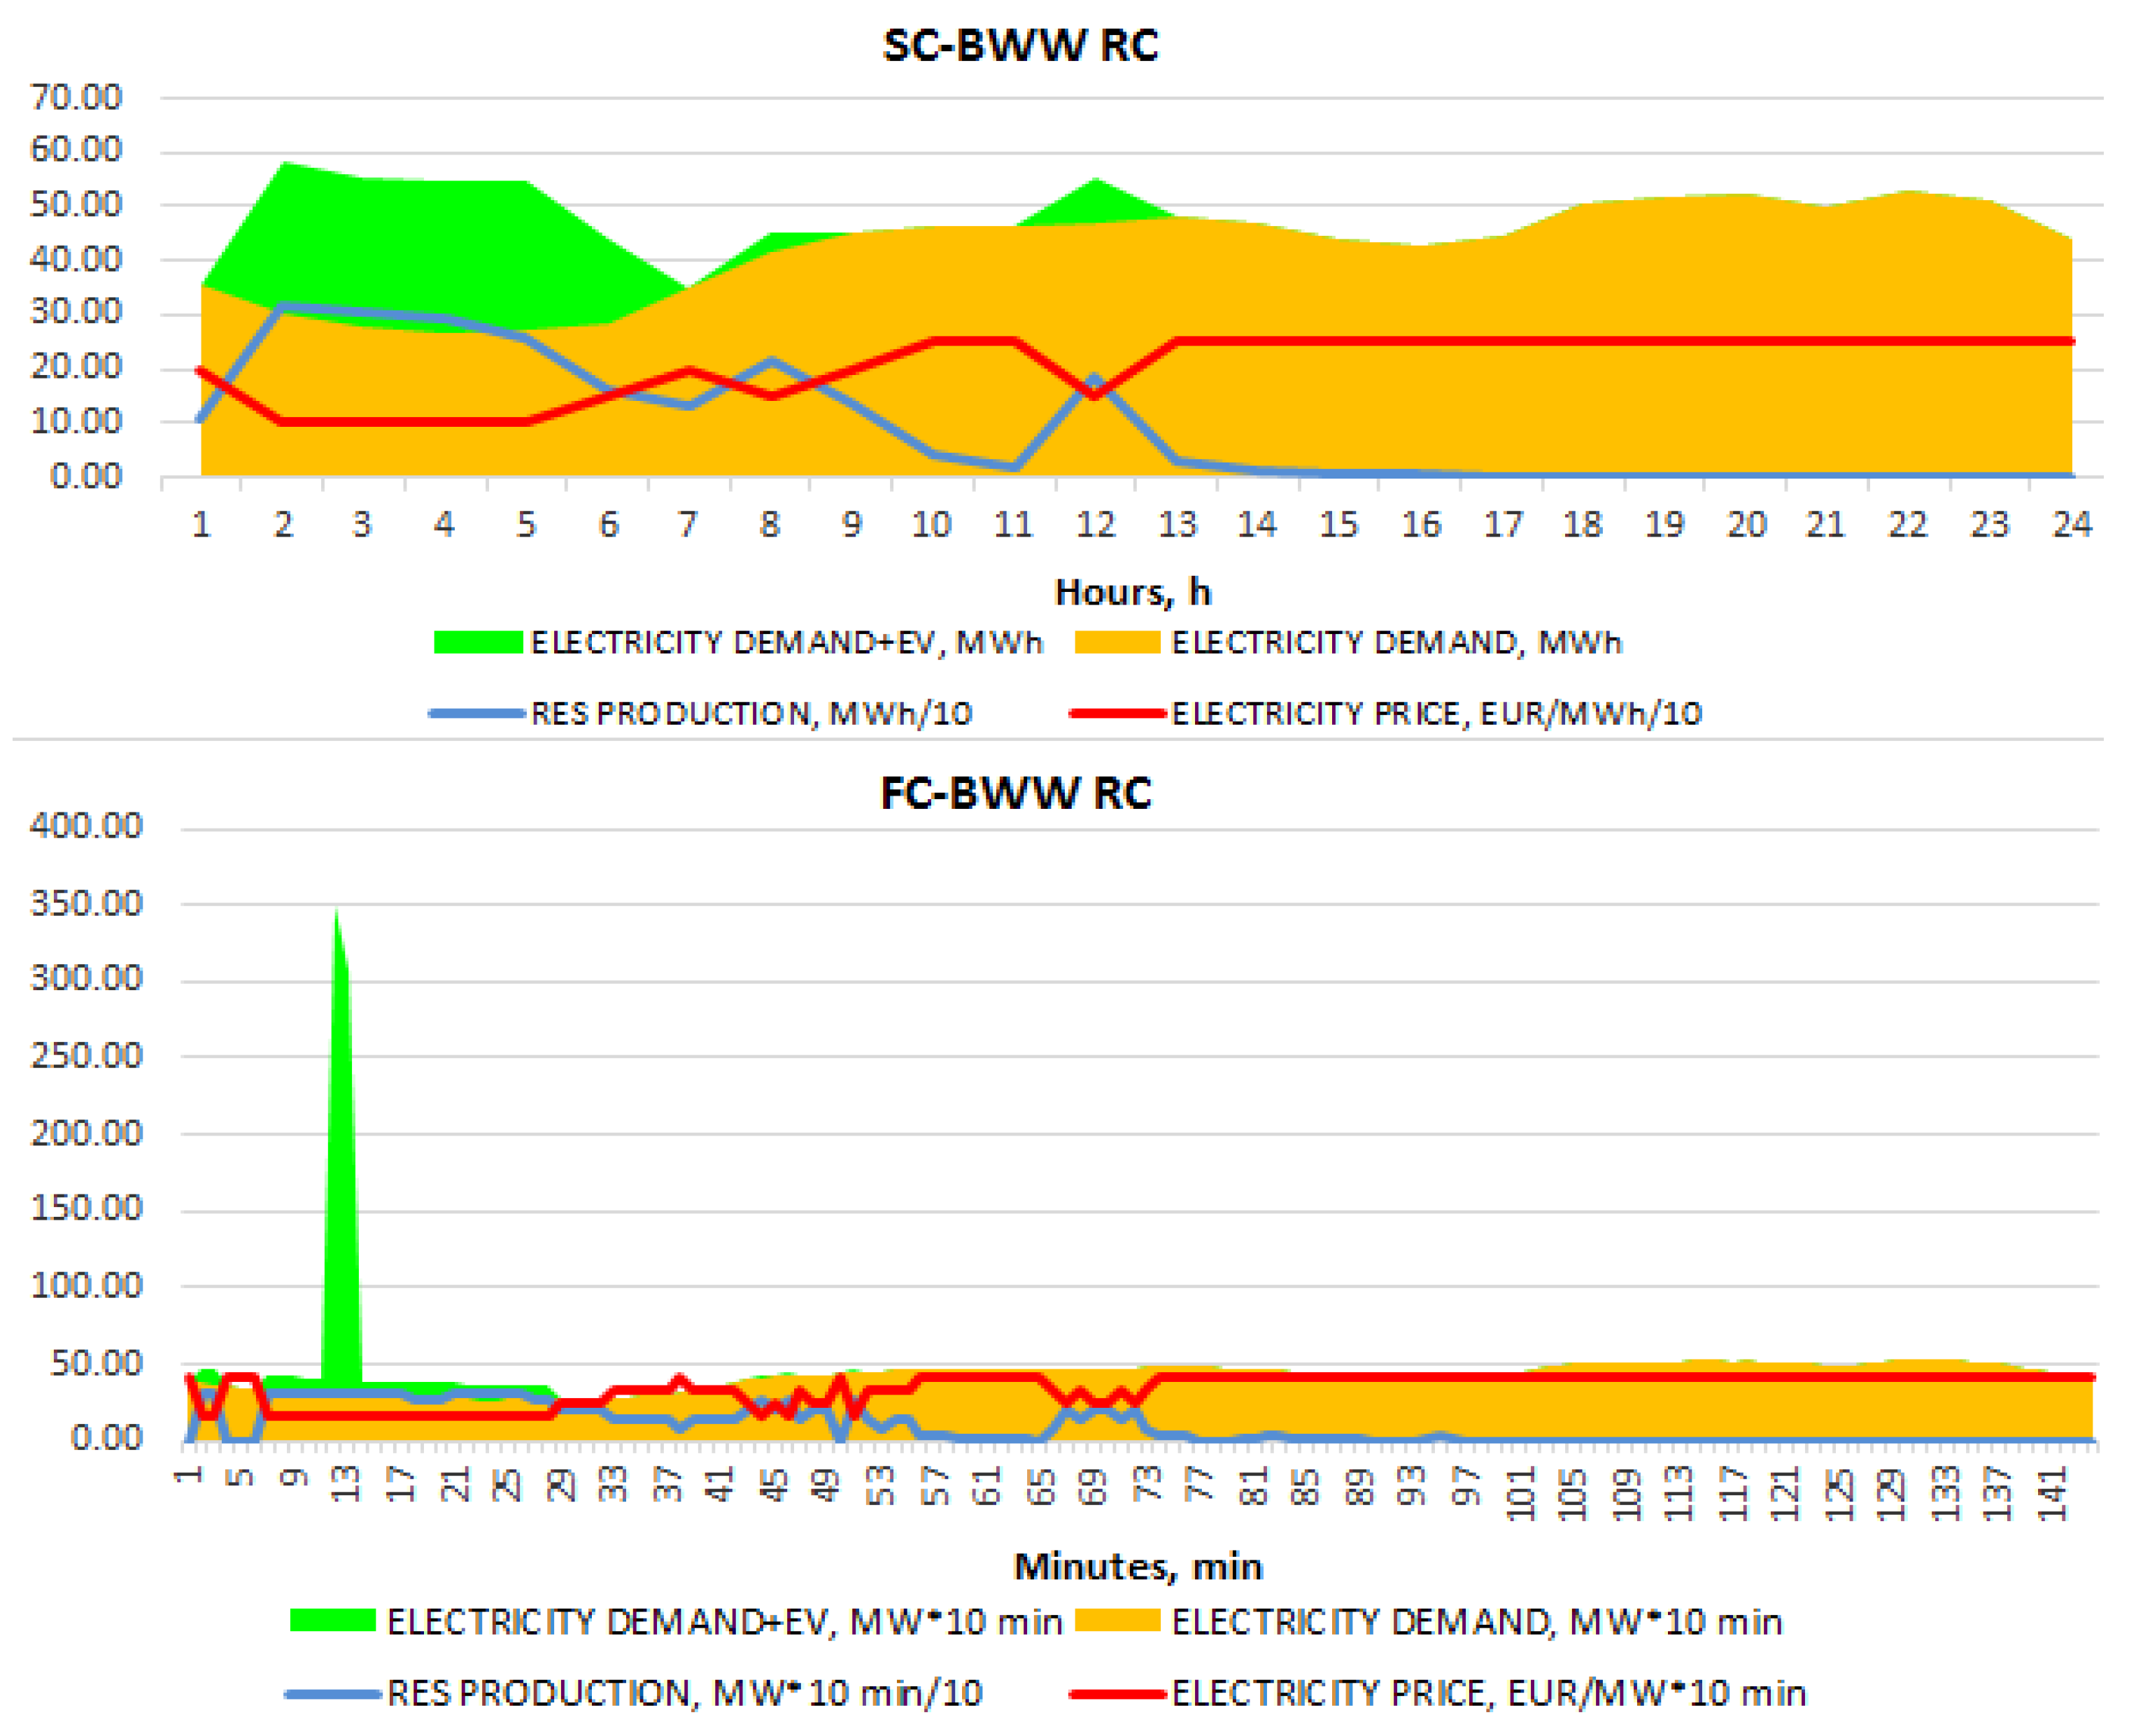
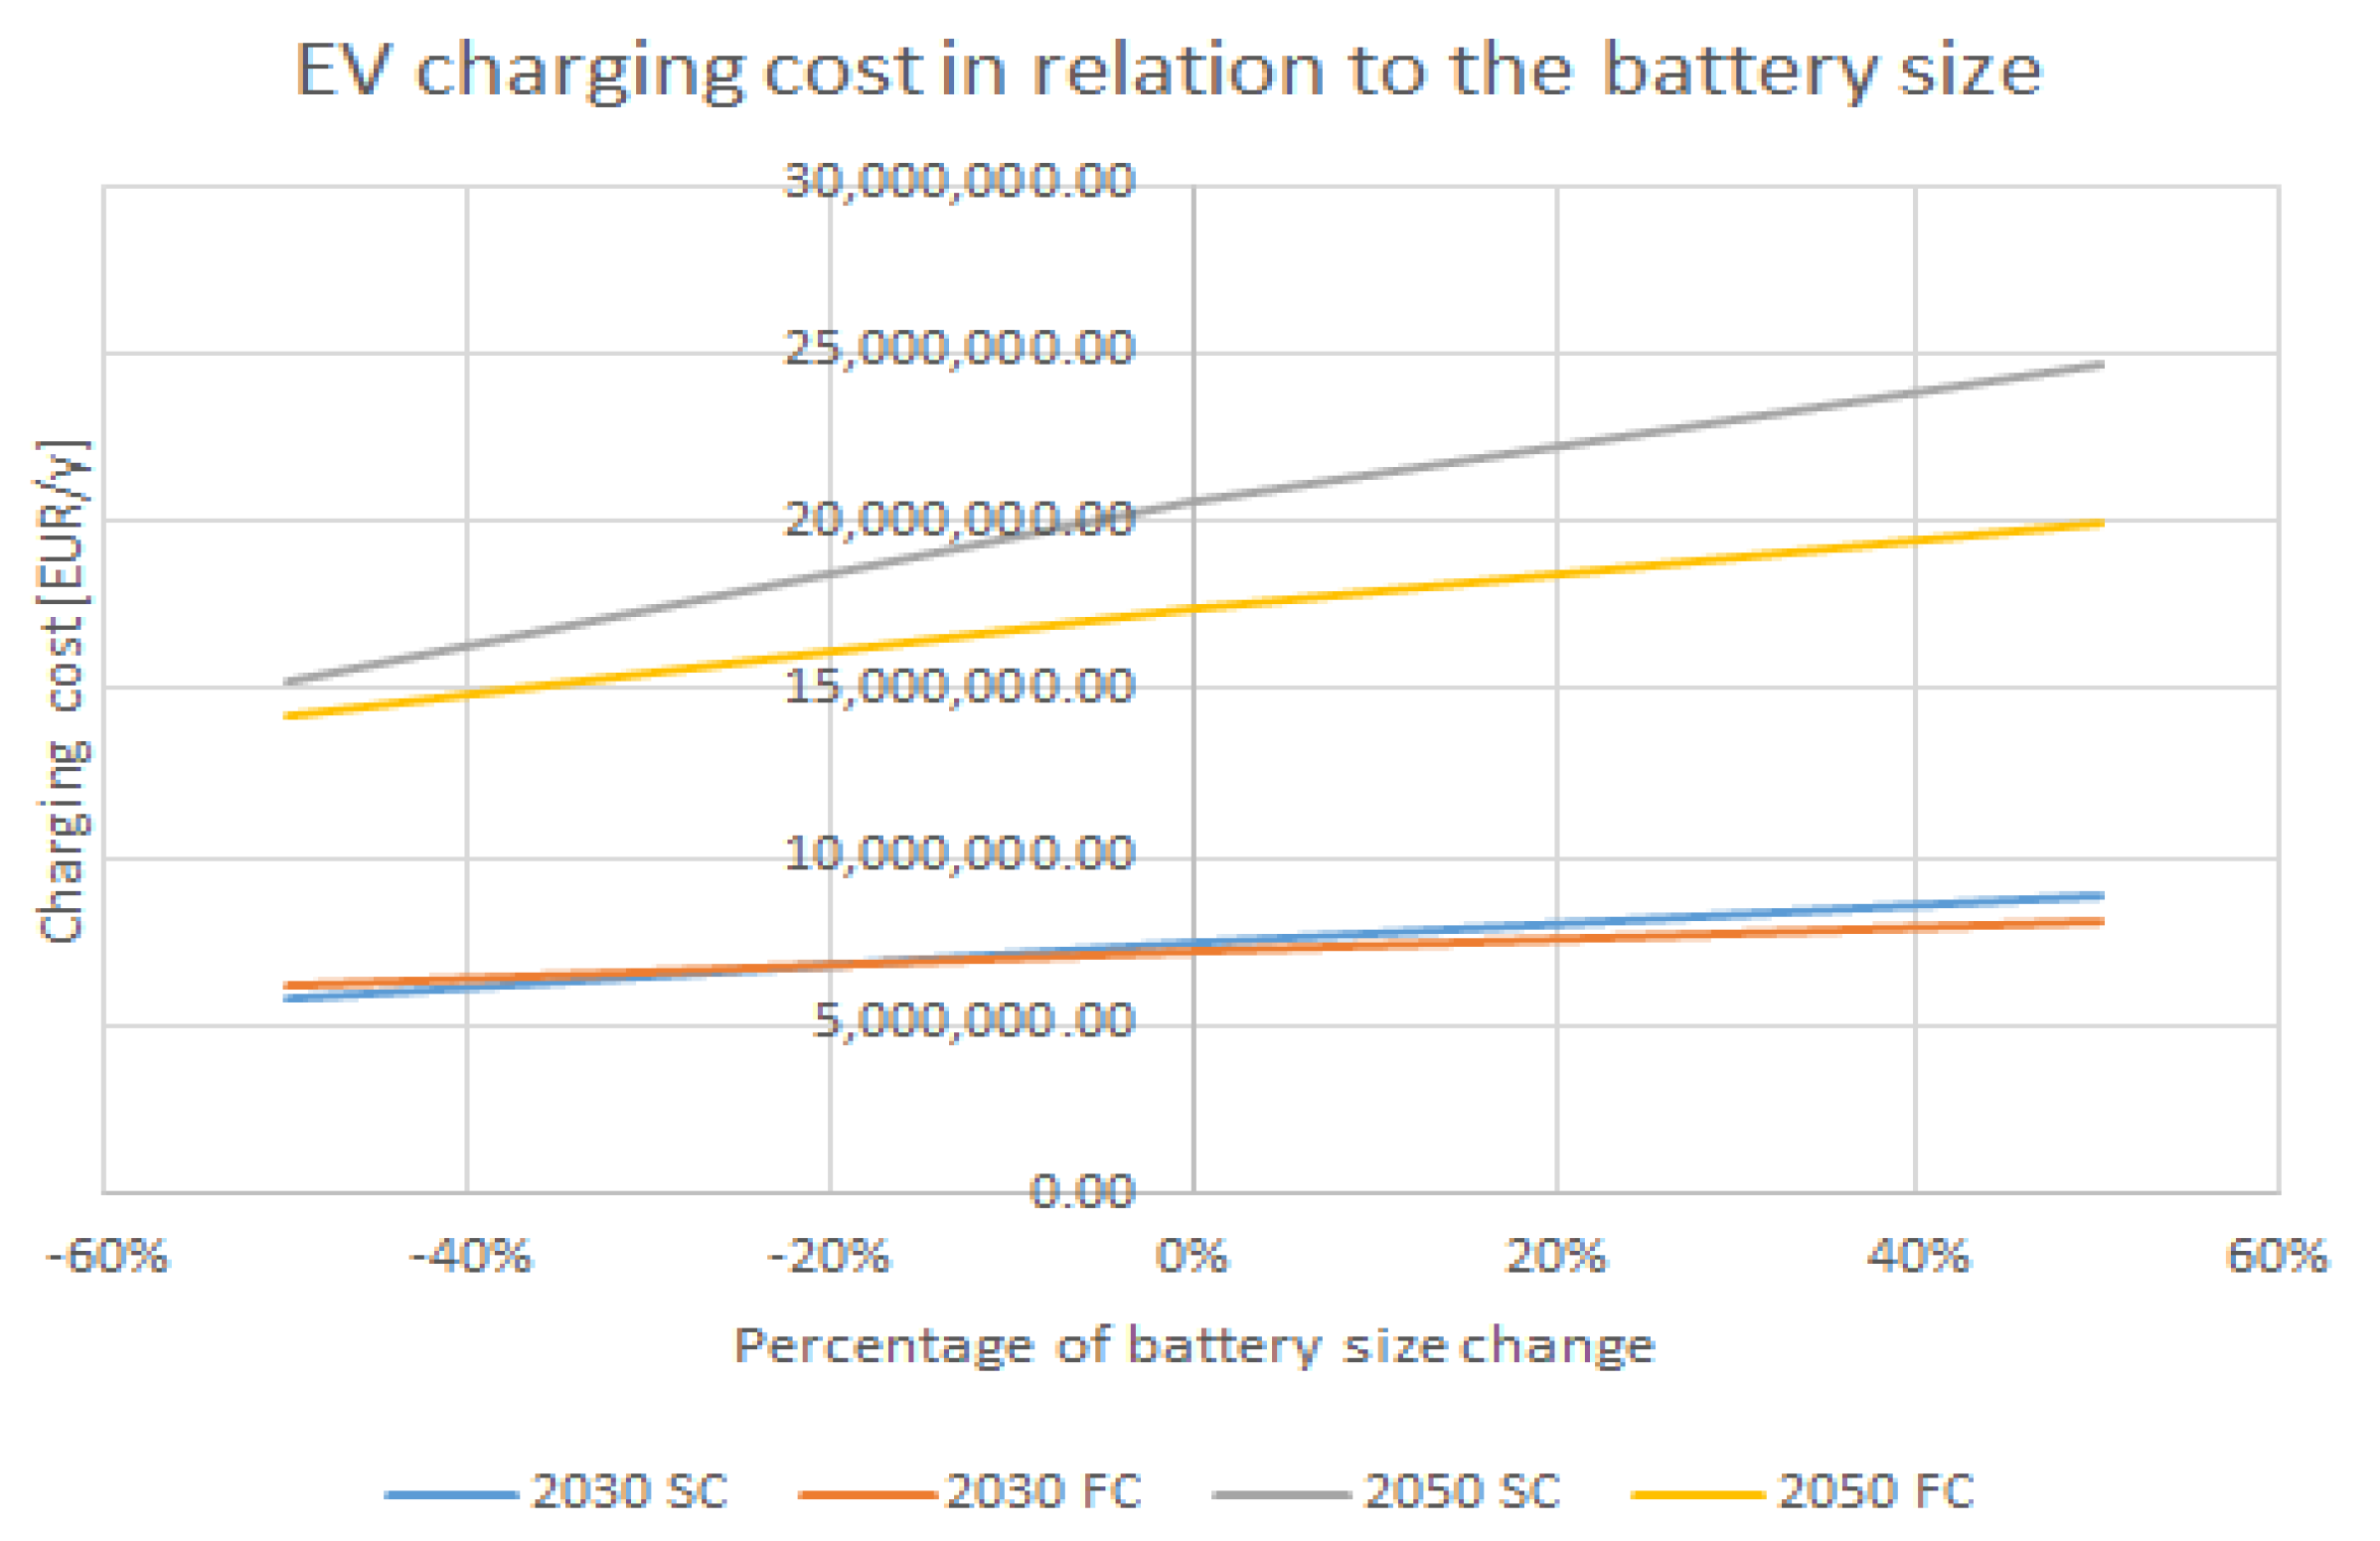
This work analyses the impact of fast and standard EV charging on RES production and electricity demand. The comparison was done in the field of financial and social aspects and regulation of EV charging through electricity pricing. The prices are based on the RES production. We observed different scenarios with projections till 2030 and 2050 for the Dubrovnik region based on 2014 as a reference year. The calculations are done in 1 h and 10 min time steps. We provided two set of results in two approaches. The first approach included EV charging only and its impact on the electricity demand, RES production and charging costs. We compared unregulated (URC) and regulated charging (RC) through the electricity prices between standard (SC) and fast charging (FC) options. The other approach included a comparison of vehicle-to-grid (V2G) technology between the EV SC and FC scenarios. We assumed that the FC will provide higher opportunities for flexibility in the power system but the results showed the opposite. According to the results, FC showed weaker results in the ability of RES electricity utilization.

1.1. EV Adaption

Although the powertrain of EVs is shown to be more efficient than that of CVs [17] and the operation costs are lower, they have been very expensive to purchase until now [18]. EV SC takes several hours to recharge the battery which, together with the price of the EV, has a negative impact on the adoption of EVs in the transport sector. More recent technology, known as FC, can recharge a battery in less than 15 min [17]. FC can improve EV adoption and make them competitive with CVs. Today’s current 50 kW fast charging stations (FCS) can charge a battery to 70% of its capacity in less than 30 min [19]. The lower state of charge (SOC) limit, 10%, is assumed to avoid consumer range anxiety, and the higher one, 80%, is assumed to mitigate accelerated aging and safety concerns during fast charging. There are examples of FC lasting 8 to 10 min, also known as extremely fast charging (XFC) [20]. Today’s EV charging technology distinguishes three levels of EV battery charging. Levels 1 and 2 use alternating current (AC) chargers, which are mostly used at home and can take 6 to 8 h to recharge the battery. Level 3 uses direct current (DC) chargers and they are used for FC lasting less than 30 min with the ability to charge a battery to 80% SOC [21]. One study [22] analyzed the relationship between daily driving distance and SC and FC. The results showed that fast chargers are more influential. They enable usage of EVs on journeys above their single-charge range which can make EVs more attractive to future users. The results show that there is a vital need for policy support to accelerate the development of FC networks.
EV charging has environmental and economic benefits. A negative impact on the existing network operation can occur if EVs are fast charged in low voltage distribution network during peak load conditions. Some studies provide solutions for this problem. One of them is a bi-directional DC FCS. It has a novel control topology proposed to solve the voltage drop problem. DC FCS maintains the DC-link voltage at 800 V. It provides reactive power compensation to regulate the network bus voltage at the steady-state voltage or rated voltage (one per unit) [23]. Other studies propose a solution in the form of energy storage technologies. They aim to perform a peak shaving process, enabling the simultaneous charging of several EVs without having to incur into excessive power availability charges [2]. The evaluation of the size and the location of fast chargers is also analyzed [22]. In order to enable and encourage the adoption of EVs and FCS, a comprehensive study have to be done in the field of planning a fast charging infrastructure. Some of the studies provide the analyses of the future infrastructure. They identify preferable charging places such as public authority buildings, medical centers, or recreational facilities, workplaces and gas stations. Study [24] provided information about desired locations for charging stations doing questionnaire for vehicle owners. Analyzes are done for FCS infrastructure for a case study of South Carolina [25], the island of Ireland [26] and the road network around Washington, D.C., New York City and Boston [27].
Reference [28] provides the results of the comparison of business model costs for CVs and EVs. The results show that the total costs for installing one private home CS are about 84.5% lower than the ones for CVs, as shown in Table 1. Values of vehicle purchase price for three countries has been examined: Spain, Germany and The Netherlands, and a results show that the price for EVs is 16.4% to 45.5% higher than the price for comparable CVs, as shown in Table 1. When comparing costs for fast charging infrastructure and standard home charging, there is advantage for the latter, as shown in Table 1 [29]. Investment cost of the FCS can increase the existing network cost up to 15% to provide sufficient power supply if high penetration level of EVs are included into the power grid [23]. The minimum charger power, needed to achieve 80% of SOC, non-linearly increases from 77 kW for a 60 min charge to 461 kW for a 10 min charge. As a result, the cell cost is shown to increase sharply to 196 USD/kWh. The incremental cost of reducing the charging time from 55 to 10 min is 126 USD/kWh [20]. Table 1 also provides details of DCFC costs and charging characteristics and their comparison to XFC given in study [30]. Comparison shows that the cost for XFC are much higher. This analysis also shows that both XFC vehicle and fuel costs will have to decrease in order for them to be competitive to CVs or HEVs. Value of travel time (VTTS) saving also has to be taken into a consideration, since XFC takes less time to charge the vehicle in comparison to BEV-DCFC. The weighted average VTTS is estimated to be 16.00 USD per hour. The XFC-BEV would spend about a 900 h less for EV charging than the BEV-DCFC, accounting for about 15,000 USD in VTTS [30]. Study [31] provides a comparison between different levels of EV charging going from home charging station to ‘super-fast’ DC public charging. Results show that a home charging station has lowest total investment cost, but a highest charging time, while ‘super-fast’ DC public charging station has the highest investment costs, but the lowest charging time.
The one of the problems with FC and XFC is their effect on durability, reliability, and safety of FC and XFC-enabled battery packs because of the temperature increase that occurs during charging. Studies [20,32] have investigated the performance of different EV batteries during the FC and XCF process. Lithium-ion batteries are shown to have the best performance according to their higher energy efficiency of up to 99.5% [32], power density, compact and lighter weight [33] and are used in applications that need high energy or power densities [20]. Lithium-ion batteries for EVs have achieved significant reductions in costs in the past 10 years with some 2016 battery pack costs near or below 200 USD/kWh [30].
Other different solutions are also provided in literature to encourage EV adaption. Some of them are different energy storage technologies. Study [2] assesses the use of FCS for EVs in conjunction with Vanadium Redox Flow Batteries (VRFBs) and study [18] analyzes a microgrid system with FCS composed of a photovoltaic (PV) system and a Li-ion battery energy storage system. Additional studies with battery storage systems are provided in [34] for EV charging and in [35] for electric bus FC. Results in [36] and [37] showed that the battery storage system can enhance peak-load shifting. Other technologies are also provided like EV charging while driving [38,39], substitution of empty EV batteries [40] and EV charging through vehicle-to-vehicle (V2V) technology [33].

1.2. RES integration through EV Fast Charging

Intermittent RES, like wind and solar energy sources, demand additional flexibility in the power system in order to encourage their integration. Results of some studies [17,33,41,42] have showed that the EV FC can encourage integration of RES using additional energy storage facilities. These studies analyzed small energy systems like microgrids [18] and buildings [43,44], but there are no studies done for the larger energy systems.
This study analyses the integration of RES through EV FC and their comparison with SC, as well as using V2G model. The study is done for the wider urban region of the selected Dubrovnik region, but it can be used for other regions, too. Regulation of the V2G and EV SC and FC is done through electricity prices that vary according to the RES electricity production. The study shows that the EV charging, regulated through electricity prices, provides more and better ways for RES integration in to the power system, as well as lower charging costs. We assumed that the EV and V2G FC will provide better results according to the RES utilization when compared to SC, but results gained within this study showed the opposite. Previous study [45] showed that drivers’ behavior can be regulated by electricity prices in a way that drivers will chose to charge their EVs during a period of lower electricity prices. Future energy planning and development of such systems will have to be supported using ICT tools [17,36] and smart grids [33] in order to provide communication in between all the participants of the energy system [31].

2. Methods

Alternative sources of energy production have been proposed in order to replace conventional fuels and reduce GHG emissions. According to that, future power systems will utilize a high share of RES in energy production and a high share of EVs in transport sector. Such systems have higher requirements for flexibility in the system due to the intermittent nature of energy production from RES. Figure 1 shows that the needs for flexibility in the power system come from variable RES and a high share of EVs with a variable demand. Flexibility can be provided through dispatchable RES power plants, ICT tools, different storage technologies, interconnection with adjacent markets and electricity prices and energy plan model based on a short-term scale. This work is aiming to provide results showing that energy planning in time step of 10 min can achieve better integration of RES and decrease EV charging costs in compare to a SC and URC. This could be achieved with the adoption of EV FC and V2G technology regulated through variable electricity prices set according to the production of RES and connected to electricity market. An energy plan model done for the Dubrovnik region in 1 h time step till the year 2050, showed that even slight variability in electricity prices of the existing two tariff model can affect the decrease in CEEP and impact of EV charging on maximum peak demand [1].
Results of this work are based on energy plan calculations aiming to show the benefits of EV FC for the integration of RES into the power system of a wider urban area in comparison to the SC. Based case scenario is taken for the year 2014 as a reference year according to which are done the projections till 2030 and 2050. Input data included electricity demand, wind and solar potential and a number of personal vehicles. Electricity demand, RES production and EV penetration and charging demand projections are derived based on the input data. Comparison of SC and FC model of future scenarios is done base on RES utilization, increase in maximum peak demand and EV charging cost. EV SC and FC and V2G are regulated through variable electricity prices depending on the RES production. The results are based on two models. The first model included only EV charging and the second V2G technology. Specific days of the summer and winter period are selected to do the calculations for each scenario for the first model. Study [46] analyzed the difference in charging rates in different seasons (winter and summer) to measure the effect of electric vehicle battery temperature (influenced by surrounding temperature) on the charging rate. Results showed that the charging rate during summer was higher than that during winter. Our study did not take into a consideration the impact of temperature to the charging rate. The third Wednesday and Sunday in January and third Wednesday and Sunday in July were selected as an example of one working day and one weekend day. The second model included calculations through the whole year. SC is done in 1 h time steps and FC in 10 min time steps.

2.1. Input Data

Input data are selected for the base case scenario for the year 2014. The data of electricity demand, wind and solar potential and number of personal vehicles are collected for the year 2014. Based on the initial data we modelled distribution curves of electricity production and demand and their projections till 2030 and 2050 on the hourly and 10 min time steps.

2.1.1. Electricity Demand, E D ,   [ kWh ;   kW · 10   min ]

Input data of electricity demand were obtained from the distribution system operator Elektrojug Dubrovnik – HEP ODS d.o.o. in 15 min time steps measured for the year 2014. Demand distribution based on 1 h time steps was obtained as a mean value of 15 min data for each hour. Demand distribution based on 10 min time steps was obtained by interpolation between 15 min data through the whole year. Table 2 shows the data validation of the electricity demand based on the maximum demand and the total demand for 10 min time steps and 1 h time steps according to the originally measured 15 min time step data.

2.1.2. Electricity Production from RES, E R E S ,   [ kWh ;   kW · 10   min ]

Measured data of solar radiation and wind speed for every 10 min were taken from the Croatian Meteorological and Hydrological Service for the year 2014 for the Dubrovnik region. Missing data were filled in by combining with data from the year 2013. Electricity production from wind and Sun was derived from the measured data in 10 min time steps. The projections are done till 2030 and 2050 based on the previous study done for the Dubrovnik region [1] and shown in Table 3. An hourly distribution curve of electricity production was obtained as the mean value of 10 min data for each hour. Maximum solar radiation for 2014 was 703 J / cm 2 and maximum wind speed was 21.3 m/s.

2.1.3. EV Charging Demand, E E V ,   [ kWh ;   kW · 10   min ]

The number of personal vehicles on the Dubrovnik region territory are taken for the year 2014 and provided by the Ministry of the Interior, Dubrovnik. EV penetration for the Dubrovnik region by 2050 was obtained from the previous study done for the Dubrovnik region [1]. The data for that study were taken for the year 2010 which does not differ much from number of vehicles in 2014, as shown in Table 4. The number of EVs in 2030 is assumed to be 7922 and in 2050 18,635. It is assumed that by 2050, all of the CVs will be replaced with EVs. Three different sizes of EV battery are considered to be equally represented in the total number of EVs. Batteries of EVs are assumed to be lithium ion batteries since they are shown to have best performances during FC, as mentioned in the previous text. Their characteristics are given in the Table 5 for SC and FC [1,47]. Average daily driving range of an EV is taken to be 45 km/h [1]. Number of charges per day for each size of EV is given in Table 6. Daily EV charging demand is obtained according to the average daily driving range, number of EVs of each size and their battery characteristics for SC and FC as shown in Equation (1). Index s stands for three different sizes of EVs. Daily EV charging demand was distributed based on the hourly inverted curve of the known data of the hourly traffic load curve for 2010. Daily EV charging demand based on the 10 min time steps was obtained using interpolation between the hourly data of the inverted curve and calculated according to Equation (2). One specific day of SC and FC distribution curve is assumed to be the same through the whole year. Time to charge the whole battery for SC is t S C = 5   h and for FC is t F C = 10   min :
E E V = N C h , s · P S C , s · t S C  
E E V = N C h , s · P F C , s · t F C  
According to the literature review, current fast chargers are able to charge a battery to 80% SOC in 10 min. This study assumes that the performance of fast chargers will improve in the future and that they will be able to charge a battery to 100% SOC in 10 min. Reference [20] mentions a supercharge ion battery (SCiB) that uses Toshibas’ proprietary lithium titanate oxide to make long-life cells. This battery can go through 6000 charging cycles which is about 2.5 times more than regular lithium ion batteries. The battery pack can do a rapid 80% recharge in just 15 min and is capable of operating at temperatures as low as minus 30 °C. A SCiB 20Ah cell charged with an 80 A current will reach 80% of its capacity in 15 min and 95% in an additional 3 min.

2.1.4. Electricity Prices, P E ,   [ EUR / kWh ;   EUR / kW · 10   min ]

Electricity prices for households in Croatia and the Dubrovnik region are based on the two tariff model. A higher tariff is set during the daytime hours when electricity demand is high, and a lower tariff during the night when electricity demand is low. Electricity prices in this study are set according to the production from RES. When the production from RES is the highest the electricity price is the lowest and when the production is the lowest the price is the highest. The prices are set as shown in the Table 7, and for SC and FC they are assumed to be the same. The values of the electricity prices are assumed by authors according to the current electricity prices in Croatia and Europe [29,39,44]. Study [44] used a similar approach in price setting. The results of [31] showed that a difference in profits between time of use (TOU) and flat rate pricing which indicates that pricing with temporal price discrimination should be preferred over flat tariffs by a charging system operator. On the other hand, simpler tariff structures are likely to be better understood and elicit more positive reactions from consumers than variable prices such as TOU. A satisfying option would be to offer at least two tariff model with a sufficient spread as it is shown in previous study done for the Dubrovnik region [1]. Several level II public charging stations in Germany in 2011 used night rates at below 0.2 EUR/kWh and daytime rates at around 0.24 EUR/kWh, which appear too low and not sufficiently differentiated [31]. Electricity prices in this work are set to four tariff levels for the final consumers. They are obtained according to the RES electricity production and are not formatted according to the prices on the wholesale market. First model of this study considered only EV charging which is regulated through a set of electricity prices according to Table 7. Comparison is done between RC and URC of EV SC and FC on daily basis. Second model considered V2G technology regulated by the same electricity prices from Table 7, but the system is connected to electricity market and comparison is done between SC and FC on the yearly basis. Croatia is connected to the western European market through Slovenia and the future work could consider possible connection to the regional wholesale electricity market of the Central Easter Europe along with Czech Republic, Hungary, Poland, Romania, Slovakia together with Slovenia [48].
Calculations for this work are done based on two models, EV charging only and V2G. In the first model we analyzed the difference in total daily EV charging cost, RES utilization and impact in maximum peak demand for different scenarios. Scenarios are based on SC and FC when EV charging is unregulated and regulated according to the electricity price. URC means that EVs are charged according to the daily distribution curve of EV charging demand which is based on the known data of traffic load curve. RC is obtained by electricity prices in order to charge EVs when the price is low and the total daily charging cost is set to minimum. The assumption for RC is that the drivers’ behavior will change according to the electricity price and that the drivers will aim to charge their EVs when the price is low. This concept is assumed to be applied in the future energy systems with a high penetration of RES and EVs in the energy system. The system will be controlled and supported by ICT tools in order to ensure communication in between all the participants of the power system. Results of the previous study [49] showed that regulated charging and discharging have better operation economics than the autonomous charging mode. The second model considers V2G technology comparing SC and FC based on RES utilization, import, export and charging costs with results on the yearly basis.

3. Calculations

3.1. EV Charging

Input data for future scenarios for the year 2030 and 2050 are arranged in hourly time steps for SC and 10 min time steps for FC. Results of SC and FC are compared according to CEEP, E C E E P , i , [kWh; kW∙10 min], Equation (3), impact on maximum peak demand E M A X   P E A K , i , [kWh; kW∙10 min], Equation (4), and total EV charging cost, C E , [EUR/day], Equation (5). Index i stands for the hourly time step or 10 min time step for one day.
i = 1 24 ; 144 E C E E P , i = E R E S , i E E V , i  
E M A X   P E A K , i = ( E E V , i + E D , i ) m a x E D , i , m a x  
i = 1 24 ; 144 C E , i = P E , i ·   E E V , i  
The regulation of EV charging is done in order that the total daily charging cost, C E , is set to a minimum. Distribution of regulated daily EV charging is obtained for SC and FC according to the set electricity prices. Some constraints have to be satisfied in order to do the calculations. Equations (6)–(9) are written for SC, but the same thing can be done for FC just in time steps of 10 min.
E E V , i   0  
E E V , i   E E V m a x , t S C  
E E V m a x , t S C =   N E V , s · P S C , s
i = 1 24 E E V , i =   const .  

3.2. Vehicle-to-Grid

The model is done using Visual Basic for Applications on a microgrid on an hourly and intra-hour level. A mathematical model of the interaction between electricity production units, electricity demand, electricity storage and electricity imports is described with the boundaries of system keeping the variable RES production and storage units “inside” the system. The model is created for two time frames: with 1 h as the basic unit of time and with 10 min period as a basic unit of time. The model aims to cover the electricity demand and the demand for electricity for transport (as separate values) from solar PV and wind power (variable RES) and using the batteries of EVs. In principle, the main division of the modelled conditions addresses the circumstances of the weather or not the variable RES produce more in a unit of time compared to electricity demand in the same time frame. Available batteries of EVs are being charged in case the production surpasses the demand. After EV batteries are charged to the maximum of available capacity in particular time frame, the remainder of the energy is exported. In the case where RES production is lower than electricity demand, EV batteries are employed first, to cover the remaining portion of demand. If they are insufficient, energy is imported. Import needed by the system is calculated as sum of electricity demand (ELdem), EV demand (EVdem) and EV charge (EVcharge) as positive values and production from wind (W), production from solar PV (S) and EV discharge (EVdisch) as negative values, in the following equation:
Import = ELdem + EVdem − W − S − EVdisch + EVcharge [MWh]
For SC, with time frame of 1 h, it is taken into account that the EV battery cannot be fully charged during a single time unit, so the equation for SC is given as:
EV charge = E V b a t t _ m a x 5
For FC, chargers are assumed to be available and of significantly higher connecting power then needed to charge the EV batteries up to 100% SOC. In 2030 and 2050, chargers have 6 times higher charging power then needed in the respective time unit:
  • 2030 battery storage capacity: 171 MWh, charging power 1030 MW
  • 2050 battery storage capacity: 403 MWh, charging power 2423 MW
For this reason, in all time steps, it is possible to fill the battery up to 100% SOC. The algorithm is provided in Appendix A.

4. Results and Discussion

The results of this work present a comparison of two models, EV charging and V2G, for SC and FC of EVs and URC and RC obtained through electricity prices. Calculations are done for future scenarios till 2030 and 2050. The comparison is done according to the impact of EV charging demand on RES production (CEEP), maximum peak in electricity demand and total charging cost. Calculations for the EV charging model are done for one working day and a weekend day for the summer and winter period and for V2G calculations they are done on the yearly basis. Previous studies also analyzed different ways in which SC and FC are compared, but approach in this study is a novelty. The comparison in this study provides results based on which we can see what type of EV charging provides better flexibility to the power system and better utilization of RES electricity production.

4.1. EV Charging

Table 8 provides total daily EV charging demand for 2030 and 2050 and maximum demand for SC and FC if all the vehicles are connected to the grid at the same time. Results of the calculations for future scenarios are given in the table in Appendix B and shown in Figure 2, Figure 3 and Figure 4.
RES production is higher in the winter period than in the summer period. The reason is the installed capacity of wind turbines which is assumed to be much higher than the one for PV. Since the Dubrovnik region has a higher demand during the summer period, it would probably be better to focus its production on PV, as solar potential is higher during summer period and wind potential is lower. The percentage of RES utilization is given in Figure 2 and it presents the amount of daily EV demand for charging, given in the Table 8, which has been supplied with the electricity produced by RES. The amount of total daily EV charging demand is the maximum amount of energy that can be utilized by EVs, rest of it goes to CEEP. Regulation of EV charging leads to a higher RES utilization in all scenarios, when compared to URC, although, in scenarios FC-AWS, -ASS, -BSW, -BSS, RES utilization did not reach 100%, meaning that the rest of the EV demand should be supplied by imported electricity. This can mean that the RC FC has less opportunities to utilize electricity from RES, when compared to RC SC, but we can see that this happens in summertime when RES electricity production is lower and most of it comes from the Sun which intermittency is not that high as the one from wind. The diagrams in Figure 5 show the comparison of URC and RC for FC scenario. The results also show that in the scenarios SC-AWS and SC-BWS the entire EV charging demand is supplied by RES in the case of URC and RC. There is also little difference in the scenarios for FC. The reason for that is a high and constant production from RES during the day. This leads to a mostly constant electricity price during the day resulting in no difference between URC and RC, as shown in Figure 6.
Even though the RES utilization is the same for URC and RC, the charging cost is reduced almost by half in RC in comparison to the URC, not only in these scenarios but in all of them, as shown in Figure 3. It can be concluded that a regulation of EV charging, according to the electricity prices, provides better opportunities for the integration of intermittent RES into the energy system. It also provides more possibilities for EV owners to reduce their charging costs in the system with variable electricity prices and save a higher amount of money if charging their vehicles during the time of low electricity prices.
RC for FC shows a high increase in the maximum peak demand for all scenarios, as seen in Figure 4. We can say that these results were expected because of the high variability of RES production causing variability of electricity prices as shown in Figure 7. The impact on the maximum peak demand for SC and FC does not show any significant difference between the models in the case where there is no regulation of EV charging in the system.
RC of the FC model results in a higher total cost for EV charging, when compared to the SC model, in all scenarios except for AWW RC and BWW RC. The reason for such a result is a high production from RES during the night causing high EV charging demand during the night when the electricity price is low, as shown in Figure 7. The highest difference in total costs between FC and SC can be seen in the BSW scenario, where FC has much higher total cost. The reason for that is lower RES electricity production which is mostly constant during the day due to the higher production from PV, as shown in Figure 5. The rest of the scenarios do not differ much between total costs.

4.2. Vehicle-to-Grid

The V2G model aims to cover the electricity demand and the demand for electricity for transport (as separate values) from electricity produced by RES, using the batteries of EVs. The results of the calculations are given in Table 9. We assumed that the results will go in favor of FC, the same as for model of EV charge. Our assumption is based on the ability of EV batteries to utilize higher amount of energy produced by RES in just 10 min, but the results obtained in this study showed the opposite. As we can see from Table 9, FC scenarios have lower amounts of EV charging and discharging than the SC scenario ones. This means that the vehicles have lower ability to utilize RES electricity production. Export and import for FC is also increased. Charging costs are slightly reduced. EV discharge for FC in 2030 is reduced by 30.8% and in 2050 by 46.03%. Export for FC is increased due to lower amount of RES production utilized by EV batteries through EV charging. Charging cost for FC are reduced in 2030 by 3.6% and in 2050 by 15.6%, but since the EV charging is also reduced, in 2030 by 11.27% and in 2050 by 24.03%, we cannot say that FC provides lower charging costs since it is obvious from the results of EV charging demand.
The most relevant parameter for the sensitivity analysis is the battery storage capacity, which is described by elaboration of Equations (10) and (11). Battery storage capacity is chosen because the model response is more complex than in the case of electricity price, where the model response is proportional. Changes in the storage capacity are analyzed for the range of −50% storage capacity (smaller batteries or less availability) to +50% of storage capacities. Results of the analysis regarding the cost of EV charging is given in Figure 8. It can be noted that in 2050 the cost of EV charging diverges more sharply between SC and FC in comparison to the scenarios for 2030, due to the higher share of RES in more time frames.
Imports and exports are also analyzed in a relation to the same parameter, but the results, given in Figure 9, suggest that there is only slightly higher divergence between SC and FC scenarios in 2050 than in 2030 in the case of export, with the SC reaching lower values as the battery storage capacity is increased.
In the case of charging and discharging, the results given in Figure 10 show that the charge in 2050 diverges more significantly than the discharge between the SC and FC scenarios, while in 2030 this difference is less emphasized.

5. Conclusions

This study analyzed V2G in SC and FC of EVs according to the integration of a high share of RES electricity production in the energy system of a wider urban area for the selected Dubrovnik region. The Dubrovnik region was selected because of its’ high Sun and wind power potential. The authors assumed a much higher amount of the installed wind capacity than the one for Sun. Since Dubrovnik is a well known tourist destination, mostly during summer period, it has a higher electricity demand during summer. The results of the study showed a higher RES production during winter that doesn’t match the requirements of the demand. This is why the Dubrovnik region should consider in focusing its’ RES production on Sun potential.
Comparison of SC and FC with URC and RC for EV charging model resulted in higher utilization of RES for RC. This means that RC provides more opportunities for better integration of a high share of intermittent RES in the energy system as well as reduction of CEEP. Although we expected that the RC for FC will provide better utilization of RES in the system based on short-term time step, the results showed the opposite. This happens only in the summer period scenarios. In this period electricity production from the Sun is higher than the one from wind and the total daily RES electricity production is lower than in the winter. This can lead to a conclusion that the regulation of FC provides better results in RES utilization when there is higher amount of wind electricity production in the system. This possibility will be analyzed in our future work.
Combination of FC and RC resulted in expected high impact in maximum peak demand because of the high variability of RES production leading to a high variability in electricity prices. This could cause problems in the form of grid overloading in the future energy system. Recent studies have dealt with this issue presenting fast chargers voltages as high as 1000 V. FC is aiming for higher cost in order to ensure the stability of the grid. FCs are shown to have higher total costs than the ones for SC, but for the same amount of time they are able to charge a higher number of EVs providing much more power from the grid. FC can enable longer trips because of low time needed to recharge the battery what can have good effect on users and their anxiety to buy and use EVs. Decreases in the prices of EV equipment in the future and the use of FC is needed in order to enhance EVs’ competitiveness in the market according to CVs. This study showed that, for the same tariff models in electricity prices, FC results in a higher total EV charging cost when compared to SC in most of the scenarios. When applying regulation of EV charging in the system, costs for SC and FC model are cut in half. The assumption of this study, what some previous studies have already confirmed, is that drivers are about to change their charging behavior if stimulated by favorable electricity prices. This also leads to drivers’ high cost savings in the system with variable electricity prices. This study assumed that all the EVs are charged when empty till they are full. In the reality, drivers could choose to charge their EVs on different levels of SOC in order to save money. The only question here is, how it would affect battery performances and lifetime. Besides personal vehicles, future studies could consider the replacement of conventional fuels in public transport, like buses, taxis and ships in order to enhance the integration of RES and reduce CEEP.
According to the results from V2G model of four different scenarios, we can conclude that the total RES utilization is lower for FC scenarios. FC has higher export and import levels as well as lower EV charging and discharging in comparison to SC scenarios. Due to the lower EV charging demand for FC, it is obvious that the costs will be lower, which is why we cannot conclude that FC is effecting a charging cost reduction. Sensitivity analysis done for the battery storage capacity showed that in 2050 the cost of EV charging diverges more sharply between SC and FC in comparison to the scenarios for 2030, due to the higher share of RES in more time frames. Results for exports and imports showed that there is only a slightly higher divergence between SC and FC scenarios in 2050 than in 2030 in the case of exports, with the SC reaching lower values as the battery storage capacity is increased. In the case of charging and discharging, the charge in 2050 diverges more significantly than the discharge between the SC and FC scenarios, while in 2030 this difference is less emphasized.
A wider urban region has higher requirements for flexibility in the system than the energy system of a state or connected systems of several regions or states. This is why future studies should consider different flexibility sources like connection to adjacent markets, additional storages, dispatchable power plants and combination of different charging models with different tariffs in order to regulate energy flows. Future energy system will be able to function only with the application of ICT tools in order to provide needed communication in between all the participants of the energy system.

Author Contributions

Conceptualization, A.F.; Data curation, A.F. and A.P.; Formal analysis, A.F. and A.P.; Methodology, A.F. and A.P.; Software, A.P.; Supervision, G.K.; Validation, A.F.; Visualization, A.F.; Writing—original draft, A.F. and A.P.; Writing—review & editing, A.F. All authors have read and agreed to the published version of the manuscript.

Funding

The publication of this research was funded by the Process and Energy Engineering doctoral study module, Faculty of Mechanical Engineering and Naval Architecture, University of Zagreb, Croatia.

Acknowledgments

Authors would like to thank Croatian Meteorological and Hydrological Service and Elektrojug Dubrovnik—HEP ODS d.o.o. for providing data for this work.

Conflicts of Interest

The authors declare no conflict of interest. The funders had no role in the design of the study; in the collection, analyses, or interpretation of data; in the writing of the manuscript, or in the decision to publish the results.

Appendix A

Algorithm:
Function MeritOrder()
′Dim demand As Integer
′Dim wind As Integer
′Dim solar As Integer
 
i = 3
j = 3
 
demand = 0
wind = 0
solar = 0
EV = 0
EV_next = 0
EV_battery = 0
EV_battery_max = 171
EV_charge = 0
EV_discharge = 0
Import = 0
k = 2
l = 0
El_price = 0
Storage_price = 0
Charge_price = 0
 
Sheets (“1h_2030”).Select
EV_battery = Cells(1, 14)
El_price = Cells(1, 10)
Storage_price = Cells(1, 12)
For i = 3 To 52562
′Sheets (“1h_2030”).Select
Sheets (“10min_2050”).Select
demand = Cells (i, j)
wind = Cells (i, j + 1)
solar = Cells (i, j + 2)
EV = Cells (i, j + 3)
EV_next = Cells(i + 1, j + 3)
EV_battery = EV_battery - EV
′If EV_battery < EV_battery_max Then
 
 If (wind + solar) > (demand + EV) Then
 If (wind + solar - demand + EV_battery) < EV_battery_max Then
 EV_charge = wind + solar - demand
 ′If EV_charge < (EV_battery_max / 5) Then
 ′EV_battery = EV_battery + EV_charge
 ′Else: EV_charge = EV_battery_max / 5
 EV_battery = EV_battery + EV_charge
 ′End If
 EV_discharge = 0
 Else
 EV_charge = EV_battery_max - EV_battery
 ′If EV_charge < (EV_battery_max / 5) Then
 ′EV_battery = EV_battery + EV_charge
 ′Else: EV_charge = (EV_battery_max / 5)
 EV_battery = EV_battery + EV_charge
 ′End If
 EV_discharge = 0
 End If
 Else
 If EV_battery > (demand - wind - solar - EV_next) Then
 EV_discharge = (demand - wind - solar - EV - EV_next)
 EV_battery = EV_battery - EV_discharge
 Else
 If EV_battery > EV_next Then
 EV_discharge = EV_battery - EV_next
 EV_charge = 0
 EV_battery = EV_battery - EV_discharge + EV_charge
 Else
 EV_discharge = 0
 EV_charge = EV_next - EV_battery
 ′If EV_charge < (EV_battery_max / 5) Then
 ′EV_battery = EV_battery + EV_charge
 ′Else: EV_charge = (EV_battery_max / 5)
 EV_battery = EV_battery + EV_charge
 ′End If
 End If
 End If
End If
If EV_battery > EV_battery_max Then
EV_battery = EV_battery_max
Else
End If
If EV_discharge < 0 Then
EV_discharge = 0
Else
End If
If EV_charge < 0 Then
EV_charge = 0
Else
End If
Import = demand + EV - wind - solar - EV_discharge + EV_charge
If (wind + solar) ≥0.75 * demand Then
Charge_price = 17
Else
If (wind + solar) ≥ 0.5 * demand Then
Charge_price = 25
Else
If (wind + solar) ≥ 0.25 * demand Then
Charge_price = 33
Else
Charge_price = 42
End If
End If
End If
Sheets ("2050 10 min rez").Select
 
Cells (k, l + 10) = Import
Cells (k, l + 11) = demand
Cells (k, l + 12) = wind + solar
If Import > 0 Then
Cells (k, 1 + 13) = (Import * El_price + EV_discharge * Storage_price) / (demand + EV)
′Cells (k, 1 + 13) = (Import * El_price) / (demand + EV)
Else:
Cells (k, 1 + 13) = (EV_discharge * Storage_price) / (demand + EV)
End If
Cells (k, l + 14) = EV_charge
Cells (k, l + 15) = Charge_price
Cells (k, l + 16) = EV_discharge
Cells (k, l + 17) = EV_battery
Cells (k, l + 18) = EV
k = k + 1
Next
End Function

Appendix B

Results of the scenarios [A—2030, B—2050, period of the year (W—Winter, S—Summer), day (W—Wednesday, S—Sunday)].
ScenariosRES Production, (MWh/day)RES Utilization, (%)
URC
RES Utilization, (%)
RC
Impact in Maximum Peak Demand, (MWh)
URC
Impact in Maximum Peak Demand, (MWh)
RC
Charging Cost, EUR/day URCCharging Cost, EUR/day RC
SC-AWW1114.4262.361003.40011,438.126482.26
FC-AWW58.611003.36138.4811,452.695919.00
SC-AWS3445.551001002.9710.748345.865893.00
FC-AWS96.221002.7136.646813.885919.00
SC-ASW171.4135.311003.087.8512,536.335893.00
FC-ASW35.5567.253.0944.0014,195.789398.50
SC-ASS162.7348.121002.68012,452.685893.00
FC-ASS43.0389.683.0914.9312,857.025919.00
SC-BWW2228.8362.281008.005.0826,903.7115,247.01
FC-BWW58.31007.92294.9726,937.9713,922.33
SC-BWS6891.11001007.6726.519,630.3813,861.00
FC-BWS96.21007.24107.0616,027.0013,922.33
SC-BSW342.8235.261007.2523.1529,486.8213,861,00
FC-BSW35.273.317.2792.0133,390.0322,965.67
SC-BSS325.4647.371008.0021.629,290.0713,861.00
FC-BSS42.1184.177.2734.9230,241.1213,922.33

References

  1. Šare, A.; Krajačić, G.; Pukšec, T.; Duić, N. The integration of renewable energy sources and electric vehicles into the power system of the Dubrovnik region. Energy Sustain. Soc. 2015, 5, 17. [Google Scholar] [CrossRef] [Green Version]
  2. Cunha, Á.; Brito, F.P.; Martins, J.; Rodrigues, N.; Monteiro, V.; Afonso, J.L.; Ferreira, P. Assessment of the use of vanadium redox flow batteries for energy storage and fast charging of electric vehicles in gas stations. Energy 2016, 115, 1478–1494. [Google Scholar] [CrossRef]
  3. European Parliament. Directive 2009/30/EC of the European Parliament and of the Council. Off. J. Eur. Union 2009, 140, 88–112. [Google Scholar]
  4. Sabor, H. Strategija Energetskog Razvoja Republike Hrvatske. Hrvat. Sabor 2009, 53, 1689–1699. [Google Scholar]
  5. Prebeg, P.; Gasparovic, G.; Krajačić, G.; Duić, N. Long-term energy planning of Croatian power system using multi-objective optimization with focus on renewable energy and integration of electric vehicles. Appl. Energy 2016, 184, 1493–1507. [Google Scholar] [CrossRef]
  6. Munhoz, F.C. The necessity of more temporal granularity in the Brazilian short-term electricity market. Sustain. Energy Grids Netw. 2017, 11, 26–33. [Google Scholar] [CrossRef]
  7. Brijs, T.; De Jonghe, C.; Hobbs, B.F.; Belmans, R. Interactions between the design of short-term electricity markets in the CWE region and power system flexibility. Appl. Energy 2017, 195, 36–51. [Google Scholar] [CrossRef] [Green Version]
  8. Hassler, M. Heuristic decision rules for short-term trading of renewable energy with co-located energy storage. Comput. Oper. Res. 2017, 83, 199–213. [Google Scholar] [CrossRef]
  9. Otashu, J.I.; Baldea, M. Grid-level “battery” operation of chemical processes and demand-side participation in short-term electricity markets. Appl. Energy 2018, 220, 562–575. [Google Scholar] [CrossRef]
  10. Krajačić, G.; Duić, N.; Zmijarević, Z.; Mathiesen, B.V.; Vučinić, A.A.; Carvalho, M.D.G. Planning for a 100% independent energy system based on smart energy storage for integration of renewables and CO2 emissions reduction. Appl. Therm. Eng. 2011, 31, 2073–2083. [Google Scholar] [CrossRef] [Green Version]
  11. Bjelic, I.B.; Rajaković, N.; Ćosić, B.; Duić, N. Increasing wind power penetration into the existing Serbian energy system. Energy 2013, 57, 30–37. [Google Scholar] [CrossRef] [Green Version]
  12. Ćosić, B.; Krajačić, G.; Duić, N. A 100% renewable energy system in the year 2050: The case of Macedonia. Energy 2012, 48, 80–87. [Google Scholar] [CrossRef] [Green Version]
  13. Krajačić, G.; Duić, N.; Carvalho, M.D.G. How to achieve a 100% RES electricity supply for Portugal? Appl. Energy 2011, 88, 508–517. [Google Scholar] [CrossRef]
  14. Falkoni, A.; Krajačić, G. Linear correlation and regression between the meteorological data and the electricity demand of the Dubrovnik region in a short-term scale. Therm. Sci. 2016, 20, 1073–1889. [Google Scholar] [CrossRef] [Green Version]
  15. Kim, D.; Hur, J. Short-term probabilistic forecasting of wind energy resources using the enhanced ensemble method. Energy 2018, 157, 211–226. [Google Scholar] [CrossRef]
  16. Bugała, A.; Zaborowicz, M.; Boniecki, P.; Janczak, D.; Koszela, K.; Czekała, W.; Lewicki, A. Short-term forecast of generation of electric energy in photovoltaic systems. Renew. Sustain. Energy Rev. 2018, 81, 306–312. [Google Scholar] [CrossRef]
  17. Johnson, J.; Chowdhury, M.; He, Y.; Taiber, J. Utilizing real-time information transferring potentials to vehicles to improve the fast-charging process in electric vehicles. Transp. Res. Part C: Emerg. Technol. 2013, 26, 352–366. [Google Scholar] [CrossRef]
  18. Garcia-Trivino, P.; Torreglosa, J.P.; Fernández-Ramírez, L.M.; Jurado, F. Control and operation of power sources in a medium-voltage direct-current microgrid for an electric vehicle fast charging station with a photovoltaic and a battery energy storage system. Energy 2016, 115, 38–48. [Google Scholar] [CrossRef]
  19. Philipsen, R.; Schmidt, T.; Ziefle, M. A Charging Place to Be-Users’ Evaluation Criteria for the Positioning of Fast-charging Infrastructure for Electro Mobility. Procedia Manuf. 2015, 3, 2792–2799. [Google Scholar] [CrossRef] [Green Version]
  20. Ahmed, S.; Bloom, I.; Jansen, A.N.; Tanim, T.; Dufek, E.J.; Pesaran, A.; Burnham, A.; Carlson, R.B.; Dias, F.; Hardy, K.; et al. Enabling fast charging—A battery technology gap assessment. J. Power Sources 2017, 367, 250–262. [Google Scholar] [CrossRef]
  21. Motoaki, Y.; Shirk, M.G. Consumer behavioral adaption in EV fast charging through pricing. Energy Policy 2017, 108, 178–183. [Google Scholar] [CrossRef]
  22. Neaimeh, M.; Salisbury, S.D.; Hill, G.A.; Blythe, P.; Scoffield, D.R.; Francfort, J.E. Analysing the usage and evidencing the importance of fast chargers for the adoption of battery electric vehicles. Energy Policy 2017, 108, 474–486. [Google Scholar] [CrossRef]
  23. Yong, J.Y.; Ramachandaramurthy, V.; Tan, K.M.; Mithulananthan, N. Bi-directional electric vehicle fast charging station with novel reactive power compensation for voltage regulation. Int. J. Electr. Power Energy Syst. 2015, 64, 300–310. [Google Scholar] [CrossRef]
  24. Philipsen, R.; Schmidt, T.; Van Heek, J.; Ziefle, M. Fast-charging station here, please! User criteria for electric vehicle fast-charging locations. Transp. Res. Part F Traffic Psychol. Behav. 2016, 40, 119–129. [Google Scholar] [CrossRef]
  25. Li, S.; Huang, Y.; Mason, S. A multi-period optimization model for the deployment of public electric vehicle charging stations on network. Transp. Res. Part C Emerg. Technol. 2016, 65, 128–143. [Google Scholar] [CrossRef]
  26. Morrissey, P.; Weldon, P.; O’Mahony, M. Future standard and fast charging infrastructure planning: An analysis of electric vehicle charging behaviour. Energy Policy 2016, 89, 257–270. [Google Scholar] [CrossRef]
  27. Zhang, A.; Kang, J.E.; Kwon, C. Incorporating demand dynamics in multi-period capacitated fast-charging location planning for electric vehicles. Transp. Res. Part B Methodol. 2017, 103, 5–29. [Google Scholar] [CrossRef]
  28. Madina, C.; Zamora, I.; Zabala, E. Methodology for assessing electric vehicle charging infrastructure business models. Energy Policy 2016, 89, 284–293. [Google Scholar] [CrossRef] [Green Version]
  29. Schroeder, A.; Traber, T. The economics of fast charging infrastructure for electric vehicles. Energy Policy 2012, 43, 136–144. [Google Scholar] [CrossRef]
  30. Burnham, A.; Dufek, E.J.; Stephens, T.; Francfort, J.; Michelbacher, C.; Carlson, R.B.; Zhang, J.; Vijayagopal, R.; Dias, F.; Mohanpurkar, M.; et al. Enabling fast charging—Infrastructure and economic considerations. J. Power Sources 2017, 367, 237–249. [Google Scholar] [CrossRef]
  31. Roman, T.G.S.; Momber, I.; Abbad, M.R.; Miralles, A.S. Regulatory framework and business models for charging plug-in electric vehicles: Infrastructure, agents, and commercial relationships. Energy Policy 2011, 39, 6360–6375. [Google Scholar] [CrossRef]
  32. Keyser, M.; Pesaran, A.; Li, Q.; Santhanagopalan, S.; Smith, K.; Wood, E.; Ahmed, S.; Bloom, I.; Dufek, E.; Shirk, M.; et al. Enabling fast charging—Battery thermal considerations. J. Power Sources 2017, 367, 228–236. [Google Scholar] [CrossRef]
  33. Bhatti, A.R.; Chin, V.J.; Aziz, M.J.A.; Yee, K.P.; Ashique, R. Electric vehicles charging using photovoltaic: Status and technological review. Renew. Sustain. Energy Rev. 2016, 54, 34–47. [Google Scholar] [CrossRef]
  34. Capasso, C.; Veneri, O. Experimental study of a DC charging station for full electric and plug in hybrid vehicles. Appl. Energy 2015, 152, 131–142. [Google Scholar] [CrossRef]
  35. Ding, H.; Hu, Z.; Song, Y. Value of the energy storage system in an electric bus fast charging station. Appl. Energy 2015, 157, 630–639. [Google Scholar] [CrossRef]
  36. Sbordone, D.; Bertini, I.; Di Pietra, B.; Falvo, M.C.; Genovese, A.; Martirano, L. EV fast charging stations and energy storage technologies: A real implementation in the smart micro grid paradigm. Electr. Power Syst. Res. 2015, 120, 96–108. [Google Scholar] [CrossRef]
  37. Aziz, M.; Oda, T.; Mitani, T.; Watanabe, Y.; Kashiwagi, T. Utilization of Electric Vehicles and Their Used Batteries for Peak-Load Shifting. Energies 2015, 8, 3720–3738. [Google Scholar] [CrossRef] [Green Version]
  38. Deflorio, F.; Guglielmi, P.; Pinna, I.; Castello, L.; Marfull, S. Modeling and Analysis of Wireless “Charge While Driving” Operations for Fully Electric Vehicles. Transp. Res. Procedia 2015, 5, 161–174. [Google Scholar] [CrossRef] [Green Version]
  39. Chen, Z.; Liu, W.; Yin, Y. Deployment of stationary and dynamic charging infrastructure for electric vehicles along traffic corridors. Transp. Res. Part C Emerg. Technol. 2017, 77, 185–206. [Google Scholar] [CrossRef] [Green Version]
  40. Mirchandani, P.; Adler, J.; Madsen, O.B. New Logistical Issues in Using Electric Vehicle Fleets with Battery Exchange Infrastructure. Procedia-Soc. Behav. Sci. 2014, 108, 3–14. [Google Scholar] [CrossRef] [Green Version]
  41. Ashique, R.; Salam, Z.; Aziz, M.J.A.; Bhatti, A.R. Integrated photovoltaic-grid dc fast charging system for electric vehicle: A review of the architecture and control. Renew. Sustain. Energy Rev. 2017, 69, 1243–1257. [Google Scholar] [CrossRef]
  42. Sujitha, N.; Krithiga, S. RES based EV battery charging system: A review. Renew. Sustain. Energy Rev. 2017, 75, 978–988. [Google Scholar] [CrossRef]
  43. Sehar, F.; Pipattanasomporn, M.; Rahman, S. Demand management to mitigate impacts of plug-in electric vehicle fast charge in buildings with renewables. Energy 2017, 120, 642–651. [Google Scholar] [CrossRef] [Green Version]
  44. Flores, R.J.; Shaffer, B.P.; Brouwer, J. Electricity costs for a Level 3 electric vehicle fueling station integrated with a building. Appl. Energy 2017, 191, 367–384. [Google Scholar] [CrossRef] [Green Version]
  45. Langbroek, J.H.; Franklin, J.P.; Susilo, Y.O. When do you charge your electric vehicle? A stated adaptation approach. Energy Policy 2017, 108, 565–573. [Google Scholar] [CrossRef]
  46. Aziz, M.; Oda, T.; Ito, M. Battery-assisted charging system for simultaneous charging of electric vehicles. Energy 2016, 100, 82–90. [Google Scholar] [CrossRef]
  47. Perujo, A.; Ciuffo, B. Potential Impact of Electric Vehicles on the Electric Supply System: A case study for the Province of Milano, Italy; OPOCE: Milan, Italy, 2009; pp. 1–25.
  48. Markets, E.E. Quarterly report on European electricity markets. Market Observatory for Energy. Energy 2015, 8, 1–37. [Google Scholar]
  49. Liu, H.; Ji, Y.; Zhuang, H.; Wu, H. Multi-Objective Dynamic Economic Dispatch of Microgrid Systems Including Vehicle-to-Grid. Energies 2015, 8, 4476–4495. [Google Scholar] [CrossRef]
Figure 1. Flexibility in the power system.
Energies 13 01510 g001
Figure 2. Results of the scenarios [A—2030, B—2050, period of the year (W—Winter, S—Summer), day (W—Wednesday, S—Sunday)]; RES utilization.
Energies 13 01510 g002
Figure 3. Results of the scenarios [A—2030, B—2050, period of the year (W—Winter, S—Summer), day (W—Wednesday, S—Sunday)]; Charging cost.
Energies 13 01510 g003
Figure 4. Results of the scenarios [A—2030, B—2050, period of the year (W—Winter, S—Summer), day (W—Wednesday, S—Sunday)]; Impact in maximum peak demand.
Energies 13 01510 g004
Figure 5. Comparison of RC and URC for FC model of one specific Wednesday in the summer period for the year 2050.
Energies 13 01510 g005
Figure 6. Comparison of RC and URC for SC model of one specific Sunday in the winter period for the year 2050.
Energies 13 01510 g006
Figure 7. Comparison of SC and FC model with RC of EVs for one specific Wednesday in the winter period for the year 2050.
Energies 13 01510 g007
Figure 8. EV charging cost in relation to the EV battery size.
Energies 13 01510 g008
Figure 9. Import/Export in relation to the EV battery size for: (a) 2030 and (b) 2050.
Energies 13 01510 g009
Figure 10. EV battery charge/discharge in relation to the battery size for: (a) 2030 and (b) 2050.
Energies 13 01510 g010
Table 1. Comparison of CV and different types of EV charging based on the financial and technical aspects according to the previous studies.
Financial and Technical AspectsCVEV
Installation cost for CS 30,225 EUR4675 EUR (home CS)
Vehicle price 12,000–18,550 EUR16,500–27,150 EUR
FCSHome CS
Investment cost1370–1800 EUR/kW
Charging ability 75 EVs/day (1500 kWh)4 EVs/day (86 kWh)
‘Super-fast’ DC public CSHome CS
20 kWh; 20–80% SOC
Investment cost125,000 EUR1000 EUR
Charging time5 min5.6 h
DCFC
Cost for 111 DCFC installations22,600 USD
Transformer installation and purchase cost18,000 USD
Dual-port hardware for 50–60 kW charger 20,000–36,000 USD
Charging power145 kW (Tesla)–225 kW (Porsche)
DCFCXFC
Installation cost32,600–34,700 USD40,300–42,000 USD
Equipment cost30,000 USD245,000 USD
Fuel cost6000 USD less than CV; 1000 USD less than HEV3000 USD more than CV
Table 2. Electricity demand data validation.
Electricity Demand, 2014
Time step10 min15 min1 h
Maximum demand, kWh/h54,086.666754,09653,984
Data validation0.017% 0.207%
Total demand, MWh249,433.7673249,432.610249,432.610
Data validation0.00046% 0%
Table 3. Projections of future RES electricity production capacity, data from [1].
Wind ProductionSolar Production
Time step10 min1 h10 min1 h
Maximum production in 2030, MWh/h16016021.218.7
Data validation 0% 11.37%
Installed capacity for 2030, MW16018
Installed capacity for 2050, MW32032
Table 4. Number of personal vehicles for the based case scenario, data from [1].
Number of Personal Vehicles
20102014Data validation
16,61716,7470.78%
Table 5. EV battery characteristics, data from [47].
Power Required to the Grid (kW)
CarsCapacity (kWh)Range (km)Consumption (kWh/100 km)Standard Charging (5 h), P S C , s Fast Charging (10 min), P F C , s
Small10100102.266.7
Mid-size2013015.384.4133.3
Large3518019.447.8233.3
Table 6. Number of charges per day, data from [1].
Number of EVsNumber of EVs for Charging per Day, NEVNumber of Charging per Day, NCh
Scenarios2030205020302050
Small26416212118827950.450
Mid-size2641621291421500.346
Large2641621266015530.250
Table 7. Electricity prices set according to the RES electricity production.
Electricity Production from RES, (kWh) E R E S , m a x E R E S , 0.75 E R E S , 0.75 E R E S , 0.5 E R E S , 0.5 E R E S , 0.25 E R E S , 0.25 E R E S , m i n
Electricity prices for SC, (EUR/kWh)0.10.150.20.25
Electricity prices for FC, (EUR/kW∙10 min)0.0170.0250.0330.042
Table 8. Total and maximum daily EV charging demand for SC and FC model of 2030 and 2050.
YearTotal Daily EV Charging Demand [MWh/day]Maximum Daily Demand for SC [MWh]Maximum Daily Demand for FC [MW∙10 min]
203058.9311.78355.14
2050138.6127.72835.34
Table 9. Results of V2G model of SC and FC for 2030 and 2050.
2030_SC2030_FC2050_SC2050_FC
RES production, [MWh/y]167,236.18334,472.6
EV demand, [MWh/y]21,509.8150,593.44
EV Demand MAX, [MWh/h]34.2137.09680.6293.36
EV charge, [MWh/y]43,938.8638,985.55122,115.4392,775.46
EV discharge, [MWh/y]13,597.099410.5530,973.6416,715.73
Import, [MWh/y]267,359.6279,127.4328,884.8343,978
Export, [MWh/y]55,414.2367,852.42140,838.92170,789,46
EV charging cost, [EUR/y]7,511,444.217,241,969.2620,560,930.5417,353,776.83

