Article

Life Cycle Environmental Costs of Buildings

1
School of Civil Engineering, Beijing Jiaotong University, Beijing 100044, China
2
College of Architecture and Civil Engineering, Beijing University of Technology, Beijing 100124, China
3
China Academy of Building Research, Beijing 100013, China
*
Author to whom correspondence should be addressed.
Energies 2020, 13(6), 1353; https://doi.org/10.3390/en13061353
Submission received: 21 February 2020 / Revised: 9 March 2020 / Accepted: 12 March 2020 / Published: 14 March 2020
(This article belongs to the Special Issue Life Cycle & Technoeconomic Modeling)

Abstract

:
Energy consumption and pollutant emissions from buildings have caused serious impacts on the environment. Currently, research on building environmental costs is quite insufficient. Based on life cycle inventory of building materials, fossil fuel and electricity power, a calculating model for environmental costs during different stages is presented. A single-objective optimization model is generated by converting environmental impact into environmental cost, with the same unit with direct cost. Two residential buildings, one located in Beijing and another in Xiamen, China, are taken as the case studies and analyzed to test the proposed model. Moreover, data uncertainty and sensitivity analysis of key parameters, including the discount rate and the unit virtual abatement costs of pollutants, are also conducted. The analysis results show that the environmental cost accounts for about 16% of direct cost. The environmental degradation cost accounts for about 70% of the total environmental cost. According to the probabilistic uncertainty analysis results, the coefficient of variation of material production stage is the largest. The sensitivity analysis results indicate that the unit virtual abatement cost of CO2 has the largest influence on the final environmental cost.

Graphical Abstract

1. Introduction

With the rapid development of economy, China overtook the US as the world’s biggest energy consumer and greenhouse gas (GHG) emitter. About 1.6–2.0 billion m2 of buildings are constructed every year in China [1], accounting for about 40% of the world’s total new buildings [2]. A large amount of GHG will be emitted during the life cycle of buildings, especially in construction and operation stages. In order to achieve the sustainable development of construction, there is a great need to clearly know both the costs and the environment costs of buildings.
At present, there is no common understanding of the concept of environmental cost in the academic circle, and there are still some differences among different research fields. According to United States Environmental Protection Agency (USEPA) [3], how environmental costs are defined depends on how the information is used. Whether a cost can be defined as environmental cost is not absolute but needs to be considered according to specific research purpose. The definition of environmental costs is more representative in the System of Integrated Environmental and Economic Accounting (SEEA) published by the United Nations Statistics Division (UNSD) in 1993 [4]. According to the definition, environmental costs consist of two levels: (1) the use and loss value of natural resources in output and final consumption; (2) the impact value of pollution generated by output and consumption activities on environment. In addition, the United States Council on Environmental Quality divides environmental costs into four parts: environmental loss costs, environmental protection costs, environmental affairs costs and environmental pollution elimination costs.
In China, the Research Group on Integrated Environmental and Economic Accounting (Green GDP) proposed in its technical guidance that environmental costs are composed of pollution control costs and environmental degradation costs, among which pollution control costs can be divided into actual pollution control costs and virtual pollution control costs. Based on the definition, the Research Group has conducted a study on China’s green national economic accounts and published a number of studies on China’s environmental economic accounts [5,6,7].
The relationship between environmental performance and economic performance is critical for environmental cost analysis. Several methodologies have been proposed to reveal the relationship, such as life cycle cost analysis (LCCA), whole life cost, eco-cost and eco-efficiency. Usually, the LCCA term implies that environmental costs are not included, as is the case in the similar whole life cost. Eco-efficiency has been proposed as one of the main tools to facilitate the transformation from unsustainable developments to sustainable developments [8]. It is based on the concept of increasing productivity and reducing economic and environmental performance at the same time [9,10]. Eco-efficiency refers to the ratio between the added value of a product (e.g., GDP) and the environmental impacts of the product or service (e.g., SO2 emissions) [9,11]. It has significant implications for environmental management accounting (EMA) system as well as environmental accounting [10,12].
Additionally, the environmental costs or eco-cost indicators are used to assess the environmental costs. Eco-costs are a measure to prevent the burden of products by expressing the amount of environmental burden. Vogtländer et al. [13] used “eco-costs 2007”, an indicator for assessing ecosystem deterioration and human health problems, to compare the environmental impact of bamboo materials with commonly used materials such as timber. Baeza-Brotons et al. [14] applied eco-costs to evaluate the environmental impacts of cement with and without addition of sewage sludge ash. Kravanja and Čuček [11] presented a novel indicator called eco-profit, which was defined as the sum of eco-benefit (positive impact of environmental unburdens) and eco-cost (negative impact of environmental burdens).
For the application of environmental cost in civil engineering, only handful of studies can be found. Kendall et al. [15] proposed an integrated life cycle assessment (LCA) and LCCA model to assess and compare traditional concrete bridges with cement-based composite bridges. The LCCA they calculated includes construction, consumer and environmental costs, reflecting the loss caused by air pollution. Chen [16] established a life cycle environmental impact cost analysis index system of bridges based on LCCA, calculating life cycle environmental costs of bridges at different stages. The results show that, among all stages, the environmental cost of the material production stage is higher than that of any other stages. A method translating the environmental impact into monetary units was composed by Carreras et al. [17]. The approach used eco-cost indicators to quantify the cost to prevent a given amount of environmental burden. However, the eco-costs only considered the material consumption and energy consumption. Chou and Yeh [18] developed a CO2 emissions evaluation system and an environmental cost calculation method to compare the difference of environmental performance between fully prefabricated and cast-in-situ construction. In their study, CO2 emissions were simply converted into environmental costs by referencing the profit-seeking enterprise income tax in Taiwan, and the progressive tax rate was used to transform the simulated total CO2 emissions into environmental cost.
Through literature review, studies of building environmental costs, especially the life cycle environmental costs, are still quite insufficient. At present, several existing issues could complicate these efforts in research on environmental cost in civil engineering. For instance, environmental costs are always underestimated. Additionally, lack of adequate measuring and managing systems of environmental costs is another obstacle [19]. To overcome this gap, a calculating model for environmental costs of a building throughout life cycle is presented in this paper to obtain total energy consumption and pollutant emission costs of buildings.
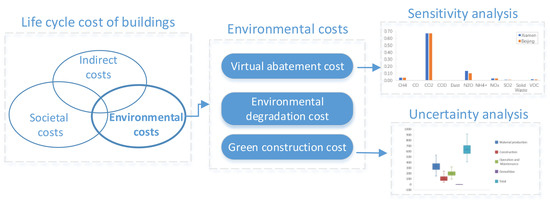
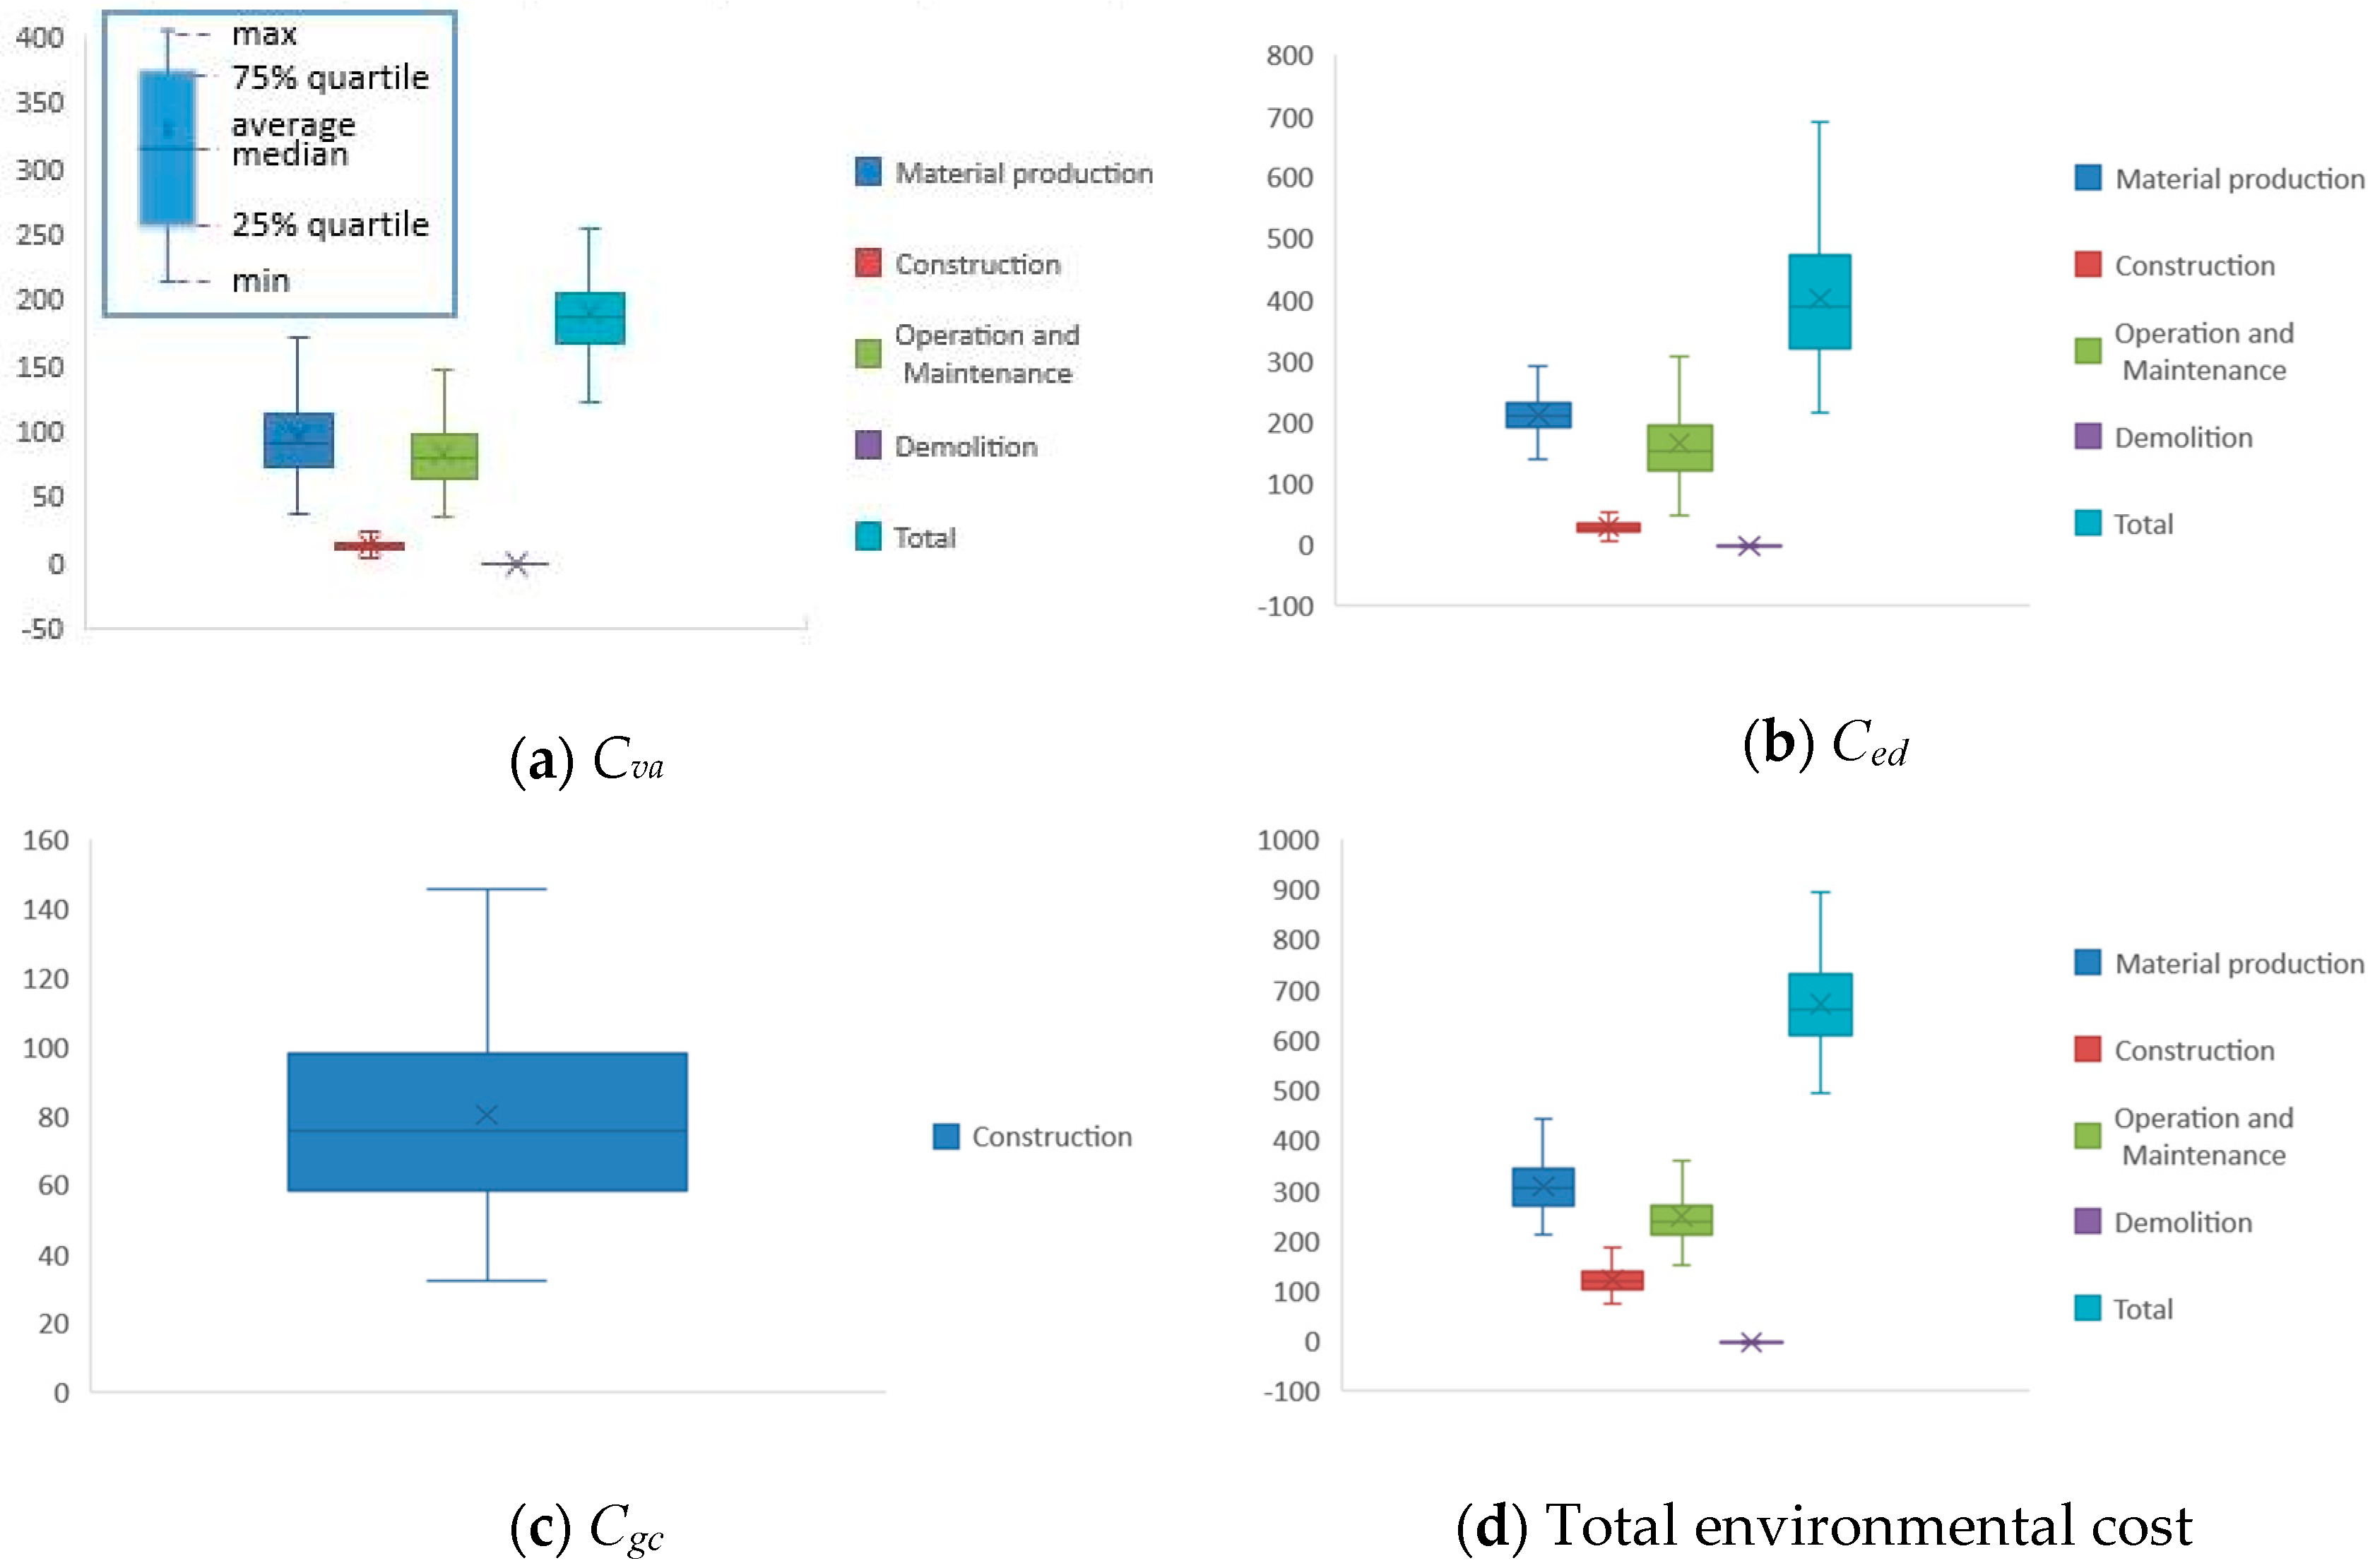
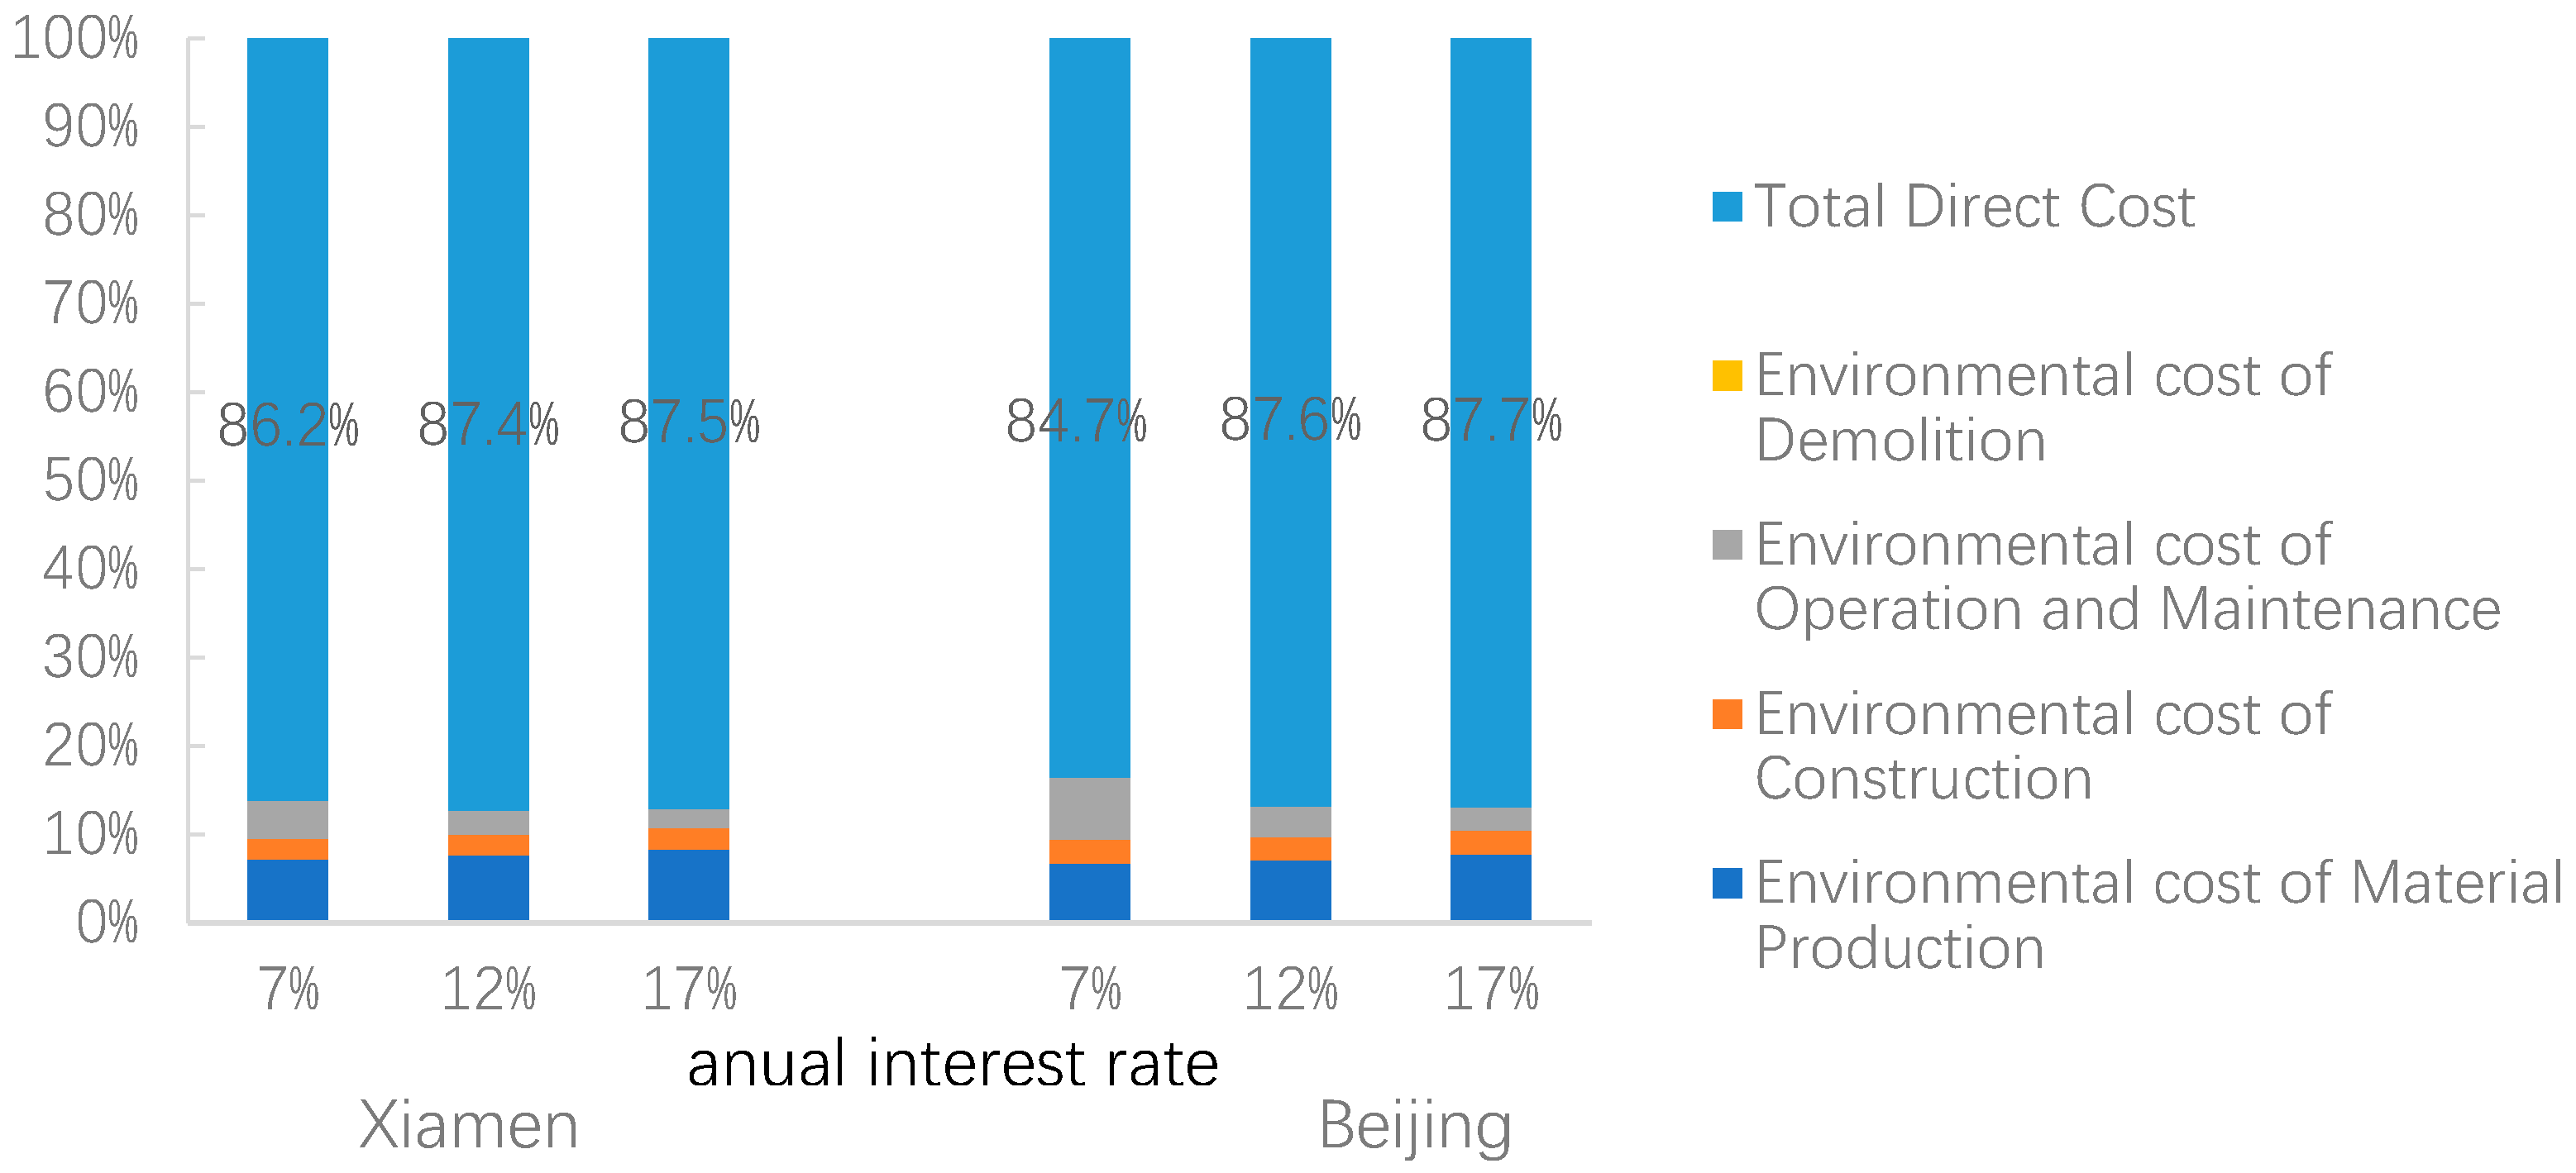
The aim of this paper is to establish a single-objective optimization model by converting environmental impact into environmental cost, with the same unit of direct cost. The following investigations are conducted: (1) Firstly, this study builds an LCA model with all processes; (2) A virtual abatement cost of pollutants and environmental degradation cost according to macroscopic data of environmental economic accounting in China is calculated; (3) The green construction measures fee is incorporated into the environmental cost for the characteristics of building construction; (4) In order to analyze the differences in northern and southern parts of China, two residential buildings, one located in Beijing and the other in Xiamen, China, are taken as case studies; (5) Uncertainty analysis is carried out, including model and data uncertainties to evaluate how these sources of uncertainty may affect the environmental cost results; (6) Finally, sensitivity analysis of the environmental costs is conducted to identify major input variables, including the discount rate and the unit virtual abatement costs of pollutants.

2. Methods

According to the Guideline for Chinese Environmental and Economic Accounting [5] and the characteristics of construction engineering, the environmental costs of buildings are divided into three parts: (1) green construction measures cost, which refers to the practical costs of protecting the environment during construction stage; (2) virtual abatement costs, which are used to control the emissions of pollutants in the life cycle of buildings, including water pollutants, air pollutants and solid waste pollutants, and where Cva1, Cva2 and Cva3 are the virtual abatement costs of air pollution, water pollution and solid waste pollution, respectively; (3) environmental degradation cost, which is the environmental loss cost caused by the emission and pollution of buildings, where Ced1, Ced2 and Ced3 are the environmental degradation costs of air pollution, water pollution and solid waste pollution, respectively.
The flowchart of the model is demonstrated in Figure 1. Based on the collected project inventory, three types of environmental pollution including air, water and solid waste pollution will be quantified. Based on the quantified results and the methods proposed in this paper, the virtual abatement costs and environmental degradation costs of the three types of environmental pollution can be obtained. Finally, the total environmental costs of a building will be obtained by adding green construction measures costs of subengineering fees including construction, decoration and erection works.

2.1. Green Construction Measures Cost

The Chinese government has proposed to levy green construction measures costs to improve the energy efficiency of construction. Green construction measures cost (Cgc) refers to environmental protection fees, which are used to reduce the negative impact of construction and consumption of resources under the condition of ensuring engineering quality and safety. The ratio of green construction measure costs to subengineering fees of an actual engineering project is shown in Table 1.

2.2. Virtual Abatement Costs

The virtual abatement cost represents the cost of curbing untreated environmental pollutants. Three pollutants categories are included: water pollutants (including COD and ammonia), air pollutants (including SO2, dust, fine particulate matter and NOx) and solid waste pollutants (including household waste in operation stage and building material waste in demolition stage). The virtual abatement cost is calculated based on the quantity of pollutant emissions, i.e., the results of life cycle inventory, and virtual abatement costs of per unit pollutant, which is in accordance with the Guideline for Chinese Environmental and Economic Accounting.

2.2.1. Life Cycle Inventory

The framework selected in this study is in the light of the standards of ISO [20] and the Society of Environmental Toxicology and Chemistry (SETAC) [21]. The functional unit is considered as floor area (m2). The cut-off principle of this study is in reference to previous research [22]: sorting all the building materials according to their mass, with the cumulative quality accounting for more than 80% of the building materials being taken into consideration.
As the two case studies are located in China, a local LCI database, Chinese Life Cycle Database (CLCD), is preferred. Although the life cycle inventory (LCI) has achieved remarkable process since last decade, the local LCI database is not able to cover all the material. Therefore, the Europe Life Cycle Database (ELCD) [23] is used to complete the case studies (see Table 2).
● Material production stage
Pollutant emissions produced in this stage can be calculated based on the bill of material quantities and the life cycle inventory. A proper material loss rate has been considered in the bill of quantities, which references the Quota of Beijing Construction Project [24].
● Construction stage
The two main sources of pollutant emissions produced in this stage are construction machines and material transportation. Gasoline, diesel and electricity consumed by construction machines are calculated based on National Unified Construction Machinery Quota [25]. In the light of 2013 Statistical Yearbook of China, the average transportation distance is 181 km [2]. It is assumed that building materials are transported by trucks. The average fuel consumption level is about 101.78 L/(kt·km) [13]. The diesel consumption can be calculated as follows:
Q = i m i × L i × q m i
where Q is the diesel consumption; mi is the mass of i -th material; Li is the transportation distance of i -th material, assumed to be 181 km; qmi is the average fuel consumption for transporting per unit material, assumed to be 101.78 L/(kt·km).
● Operation stage
Energy consumption during this stage implicates the energy and resources, including electricity, natural gas and water consumption. Since the two case buildings just completed construction, there are no actual maintenance monitoring data. Consequently, the water consumption, electricity consumption and domestic waste production for each person can only be estimated based on the local statistical yearbook [26,27], assuming that each family consists of three people. The number of apartments in the two case study buildings is 78 for Xiamen and 100 for Beijing.
Additionally, the pollutant emissions also include household waste, which can be estimated based on household waste of similar commercial buildings per unit time. For residential buildings, the energy consumption and household waste amount are influenced by per capita consumption and living habits, which can be estimated in the light of the statistical yearbook. For regions in northern China, the environmental costs caused by the consumption of coal for heating cannot be ignored.
● Demolition stage
The data about energy consumption of China’s construction in the demolition stage are very scarce. The percentages of landfill, incineration and recycling in this paper are based on the data provided by Fabre [28], Zeng [29] and Lei et al. [30], who collected the current inventory data of construction waste recycle and landfill, mainly considering the resource consumption during recycle and landfill. The inventory data of construction waste is shown in Table 3.

2.2.2. Virtual Abatement Costs of Pollutants

The virtual abatement costs (Cva) generated by the air and water pollution generated during the building life cycle can be quantified based on the bill of quantities and life cycle inventory. The formula is as follows:
C v a 1 + C v a 2 = Q 1 × c v a 1 + Q 2 × c v a 2
where Q1 is the amount of air pollutants, based on LCI; Q2 is the amount of water pollutants, based on LCI; cva1 is the unit virtual abatement costs of air pollution (see Table 4); cva2 is the unit virtual abatement costs of water pollution (see Table 5).

2.2.3. Virtual Abatement Costs of Solid Waste

The solid waste produced in the building life cycle is composed of building solid waste and household waste.
● Building solid waste
The recycle rate of building material in China is considerable low. Most of building solid waste is simply treated by depositing or burying in the suburb, which will cause severe environmental pollution during transportation and deposition [31]. The abatement costs of building solid waste can be calculated as follows:
C v a 31 = Q 31 × c v a 31
where Cva31 is the virtual abatement costs of building solid waste; Q31 is the total amount of building solid waste; cva31 is the virtual abatement cost per unit building solid waste. According to the results of pollution loss survey data and System of Integrated Environmental and Economic Accounting (SEEA) of pilot provinces, the general industrial solid waste per unit virtual management cost is 22 CNY/t [5].
● Household waste
With the development of China’s urbanization, most of household waste is disposed after harmless treatment, instead of directly drained off into the natural environment. The definition of harmless disposal is when advanced technology and scientific technology are used in the treatment of municipal solid waste to reduce the environmental impact of solid waste [32]. There are mainly three kinds of garbage harmless treatments: landfill, compost and incineration.
With the promotion of household waste treatment technology, some cities have achieved 100% harmless treatment. In this study, it is assumed that no harm will be caused by household waste after harmless treatment, and the environmental degradation costs can be ignored. The virtual abatement costs of household waste can be calculated as:
C v a 32 = Q 32 × c v a 32 + k = 1 n Q k × c v a k
where Cva32 is the virtual abatement costs of household waste; Q32 is the total amount of household waste; cva32 is the transportation costs of household waste; Qk is the amount of household waste treated by different technologies; cvak is the unit virtual abatement costs of each treatment (shown in Table 6).
By summing up Cva1, Cva2 and Cva3, the total virtual abatement costs of building can be calculated as follows:
Cva = Cva1 + Cva2 + Cva31 + Cva32

2.3. Environmental Degradation Costs

Environmental degradation cost (Ced) indicates the economic value loss caused by the degradation of environmental functions. The environmental degradation cost is calculated by the pollution loss cost method. The pollution loss cost method requires a specific technical approach to conduct a special survey of pollution losses to determine the monetary value of the impact of pollution emissions on local environmental quality. After quantifying these influences, the environmental degradation costs caused by pollution can be determined.
The Chinese government published the Chinese Environmental and Economic Accounting Report 2004 [6]. As some local governments firmly opposed publishing the report, after 2008, there are no updated data that can be used to estimate environmental degradation costs.
In order to estimate the environmental degradation costs, a formula was established in the light of the ratio of environmental degradation costs to virtual abatement costs, shown as:
C e d = C v a i × r i
where Ced is the total environmental degradation costs; Cvai is the virtual abatement costs of air pollution if i = 1, or water pollution if i = 2, or solid waste pollution if i = 3; ri is the average ratio of environmental degradation costs to virtual abatement costs, according to the Chinese Environmental and Economic Accounting Report 2004 (see Table 7), r1 = 2.25, r2 = 1.32, r3 = 0.31.
Based the discussion above, the total life cycle environmental costs can be calculated as:
C e = C g c + C v a + C e d
where Ce is the total life cycle environmental costs; Cgc is the green construction measures costs; Cva is the virtual abatement costs; Ced is the environmental degradation costs.
Since the time value of money concerns the effect of time and interest rate on monetary amounts, this effect must be given primary consideration in environmental cost [33]. Present value, also known as present discounted value, is the value of an expected income stream determined at the valuation date. The present value is always less than or equal to the future value due to the potential of interest-earning, which referred to as the time value of money. The most commonly applied model of present valuation uses compound interest.
The present value of the total environmental costs of a building can be expressed as:
C e p v = C e p + C e c t 1 × ( P | A , r , t 1 ) + C e o × ( P | A , r , t 2 ) × ( P | A , r , t 1 ) + C e d e m ( 1 + r ) ( t 1 + t 2 )
where Cepv is the present value of the total environmental costs; Cep is the environmental cost of the material production stage; Cec is the environmental cost of the construction stage; Ceo is the environmental cost of the operation stage; Cedem is the environmental cost of the demolition stage; t1 is the number of annual interest periods during construction stage, assumed to be 2 years; t2 is the number of annual interest periods during operation stage, assumed to be 50 years; r is the discount rate, assumed to be 7%; A is the equal annual payment; (P|A, r, ti) is the equal-payment-series present-worth factor at time ti, calculated as ( P | A , r , t i ) = A [ ( 1 + r ) t i 1 ) / r ( 1 + r ) t i ] .

3. Case Study and Results

3.1. Case Description

To compare the environmental cost of residential buildings during the operational stage, two sites were selected as case study buildings. One is in Beijing, and the other is in Xiamen, which represent two different climate zones in China. According to the construction organization flow chart, the construction period is 2 years. The major construction materials include concrete, rebar, steel tube, cement mortar, wood, aluminum, glass and alkyd paint. The specific information and corresponding direct costs of the two case buildings are shown in Table 8.
Data and specifications required for this study are obtained from the structural drawings of the buildings, acceptable LCI database and other archived literature. The materials used for construction are specified in the bill of quantities and can be obtained from the contractors.

3.2. Results Analysis

Based on the calculation method mentioned above, per capita energy consumption level of residents in Xiamen and Beijing were calculated based on China’s Yearbook. The environmental costs of the two case studies are shown in Figure 2, Figure 3, Figure 4 and Figure 5.
Most of the input data used in this case study comes from actual utility bills. However, due to the inevitable limitations of the input data, corresponding assumptions were made during the analysis. Considering the variability of critical input variables, sensitivity analysis of key parameters was conducted. Sensitivity analysis is the measurement of changes in one or more uncertainties to determine the extent to which changes in each factor affect the expected objective [34]. In this paper, the single-factor sensitivity analysis method is used to quantitatively describe the importance degree of input variables when only one parameter changes by 1%. The calculation formula is as shown in Equation (9).
E i = Δ C e i / Δ F i
where Ei is the sensitivity parameter of the variable Fi; ∆Cei is the corresponding rate of change in environmental costs (%); ∆Fi is the rate of change of the variable Fi, taken as 1%.
To find the critical input variables, the sensitivity analysis results are shown in Figure 2. For both of the case study buildings, the sensitivity coefficient of the unit virtual abatement cost of CO2 is the largest, equaling 0.67, which means that CO2 has the largest influence on the final environmental cost. Additionally, the unit virtual abatement cost of N2O, CH4 and NOx are also key parameters that may lead to significant changes in the outcome, with values of 0.12, 0.45 and 0.32 respectively. The environmental cost results are not sensitive to the unit virtual abatement cost of CO, COD, dust, NH4+, SO2, solid waste and VOC.
Additionally, the data quality indicators (DQI) method [35] (see Table 9) and Monte Carlo simulation were used in this case study to analyze the LCA data quality and uncertainty of the results. The engineering quantity data are all from the engineering quantity list, and the emission factor data are from a database. According to the standard deviation provided in Eco-invent [36], the distribution type of the LCI data is selected as lognormal distribution, and the uncertainty is shown in Table 10. Using the Monte Carlo simulation, the variability of environmental scores associated with the ratio of green construction measures cost to each subengineering fees, transportation distance and the average fuel consumption for each vehicle can be estimated. The selected variables are assumed to be uniform distribution or lognormal distribution (see Table 10), and 10,000 iterations were carried out based on previous studies [37].
Figure 3 and Figure 4 show that the added variability did not significantly change the average values nor did it change the ranking of the four stages in terms of Cva, Ced and Cgc. The minimum, average and maximum total environmental costs are 412, 616 and 827 CNY/m2, respectively, in the Xiamen case study building, while they are 489, 673 and 899 CNY/m2, respectively, in the Beijing case study building. The coefficient of variation of the material production stage is the largest, followed by the operation and maintenance stage, while that of the demolition stage is the smallest.
The average value of the case study building in Xiamen is shown in Figure 3, where the total environmental cost is 616.29 CNY/m2, of which the biggest contributor to environmental cost is material production stage reaching 330.96 CNY/m2, followed by operation stage, 199.40 CNY/m2. The environmental cost of demolition stage is negative, which indicates that the recycled material can bring positive environmental benefit. For the case study building in Beijing (shown in Figure 4), the total environmental cost is 672.80 CNY/m2. The environmental cost of material production stage is 307.42 CNY/m2, followed by operation stage, 247.07 CNY/m2, which is slightly higher than that of the Xiamen case building’s operation stage. This is possibly because energy consumption of heating is excluded for the case study building in Xiamen, which is located in a hot-summer and warm-winter zone where heating in the winter is not necessary. For the both case study buildings, construction stage is the third largest contributor to the environmental cost of the life cycle. During this stage, the green construction cost accounts for the largest percentage of the total environmental cost, about 65%. Demolition stage has the minimum environmental cost. For the both case study buildings, Ced accounts for about 69% of the total environmental cost during material production stage, operation stage and demolition stage.
According to the results of both case studies (see Figure 5), a default discount rate was selected as 7%; the environmental cost in life cycle achieves an indispensable 14% share of the direct cost. However, the existing direct cost of the life cycle often neglects environmental cost, resulting in a great warp between calculation results and actual results. In some research, environmental costs are roughly assumed as 10% of direct costs. Since the percentage adopted is less than the result of this case study, this would lead to an error. In order to consider the variability of discount rate, therefore, this study assumes discount rates of 7%, 12% and 17%. The uncertainty analysis of the two cases shows that the ratio of environmental cost to direct life cycle cost decreases as the discount rate increases, but the change does not exceed 5%.

4. Conclusions and Limitations

4.1. Conclusions

Different from the previous LCCA studies which neglect or roughly estimate environmental cost, this study calculates environmental cost based on life cycle inventory. Besides, this study presents a basic method to improve the calculation of LCCA of a building during its life cycle. Furthermore, a single-objective optimization model is generated by converting environmental impact into environmental cost, which has the same unit as LCC and can help the decision makers to obtain a single optimum design solution. Finally, a quantitative analysis of case study of residential buildings in Xiamen and Beijing has been conducted. Based on the above research, the following conclusions can be drawn:
  • The environmental costs of residential buildings in Beijing and Xiamen are 679 CNY/m2 and 640 CNY/m2 respectively, of which the biggest contributor is material production, followed by operation stage, construction stage and demolition stage.
  • For both of the two case study buildings, the environmental degradation cost accounts for about 70% of the total environmental cost, and environmental cost accounts for about 16% of direct cost.
  • The sensitivity analysis results show that the unit virtual abatement cost of CO2 has the largest influence on the final environmental cost, followed by N2O, CH4 and NOx. The environmental cost results are not sensitive to the unit virtual abatement cost of CO, COD, dust, NH 4 + , SO2, solid waste and VOC.
  • The coefficient of variation of the material production stage is the largest, followed by operation and maintenance stage, while the demolition stage is the most robust.
  • The uncertainty analysis of the two cases shows that the ratio of the environmental cost to the direct life cycle cost decreases as the discount rate increases, but the change does not exceed 5% when the discount rate varies from 7% to 17%.

4.2. Limitations

  • The total environmental cost of the case study building in Xiamen is 50 CNY/m2 lower than that of case building in Beijing. However, due to the lack of actual operation data, energy consumption data is analyzed based on the reference of the local yearbook, which represents the general operational energy cost of all buildings, including public buildings and residential buildings. Further research should focus on using specific operation data to increase the reliability and accuracy of the estimation results.
  • The theoretical approach proposed in this study is based on the SEEA, which is an incomplete green GDP accounting method. For example, it does not consider the loss caused by ecological damage, groundwater pollution and soil pollution. Further research will refine the methodology based on a new ISO standard [38] proposed in 2019.
  • Due to the lack of data on construction waste disposal in China, this paper uses the recycle rate of building materials from foreign data. Localization of data for construction waste disposal is still required for in-depth study to obtain accurate values.

Author Contributions

Y.W. provided the idea and led the research work. B.P., X.Z. and J.W. conceptualized the problem, performed the proposed methodology and the case study and prepared original draft. Y.L., C.S. and S.Z. reviewed and edited the original draft. All authors discussed the results and contributed to the final manuscript. All authors have read and agreed to the published version of the manuscript.

Funding

This research has been supported by the National Key Research and Development Plan of China (grant number 2016YFC0701806) and China Railway Construction Real Estate Group North Co. LTD (grant number C19L01450).

Conflicts of Interest

The authors declare no conflicts of interest.

Nomenclature

CeTotal life cycle environmental costs
CgcGreen construction measures costs
Cva1Virtual abatement costs of air pollution
Cva2Virtual abatement costs of water pollution
Cva3Virtual abatement costs of solid waste pollution
Cva31Virtual abatement costs of building solid waste
Cva32Virtual abatement costs of household waste
Ced1Environmental degradation cost of air pollution
Ced2Environmental degradation cost of water pollution
Ced3Environmental degradation cost of waste pollution
CepvPresent value of the total environmental costs
CepEnvironmental cost of material production stage
CecEnvironmental cost of construction stage
CeoEnvironmental cost of operation stage
CedemEnvironmental cost of demolition stage
QDiesel consumption
Q1Amount of air pollutants
Q2Amount of water pollutants
Q31Total amount of building solid waste
Q32Total amount of household waste
QkAmount of household waste treated by different technologies
cva1Unit virtual abatement costs of air pollution
cva2Unit virtual abatement costs of water pollution
cva31Virtual abatement cost of per unit building solid waste
cva32Transportation costs of household waste
cvakUnit virtual abatement costs of each treatment
miMass of i-th material
LiTransportation distance of i-th material, assumed to be 181 km
qmiAverage fuel consumption for transporting per unit material, assumed to be 101.78L/(kt·km)
riAverage ratio of environmental degradation costs to virtual abatement costs
t1Number of annual interest periods during construction stage, assumed to be 2 years
t2Number of annual interest periods during operation stage, assumed to be 50 years
rDiscount rate, assumed to be 7%
AEqual annual payment
ΔCeiCorresponding rate of change in environmental costs (%)
ΔFiRate of change of the variable Fi, taken as 1%
FiSensitivity parameter of the variable Fi

References

  1. Ministry of Housing and Urban-Rural Development of the People’s Republic of China. Statistical Bulletin on Urban and Rural Construction in 2014; Ministry of Housing and Urban-rural Development: Beijing, China, 2015.
  2. National Bureau of Statistics. China Statistical Yearbook; China Statistics Press: Beijing, China, 2014.
  3. United States; Environmental Protection Agency; Office of Pollution Prevention; ICF Incorporated. An Introduction to Environmental Accounting as a Business Management Tool: Key Concepts and Terms; Office of Pollution Prevention and Toxics Press: New York, NY, USA, 1995.
  4. United Kingdom (UK). System of National Accounts; China Statistics Press: Beijing, China, 1995. [Google Scholar]
  5. Yu, F.; Wang, J.N.; Cao, D. Guidelines for Chinese Environmental and Economic Accounting; China Environmental Science Press: Beijing, China, 2009. [Google Scholar]
  6. Yu, F.; Wang, J.N.; Cao, D. Chinese Environmental and Economic Accounting Report 2004; China Environmental Science Press: Beijing, China, 2009. [Google Scholar]
  7. Yu, F.; Wang, J.N.; Cao, D. Chinese Environmental and Economic Accounting Report 2007–2008; China Environmental Science Press: Beijing, China, 2012. [Google Scholar]
  8. Yu, Y.; Chen, D.; Zhu, B. Eco-efficiency trends in China, 1978–2010: Decoupling environmental pressure from economic growth. Ecol. Indic. 2013, 24, 177–184. [Google Scholar] [CrossRef]
  9. Lehman, G. Global accountability and sustainability: Research prospects. Account. Forum 2002, 26, 219–232. [Google Scholar] [CrossRef]
  10. Traverso, M.; Asdrubali, F.; Francia, A.; Finkbeiner, M. Towards life cycle sustainability assessment: An implementation to photovoltaic modules. Int. J. Life Cycle Assess. 2012, 17, 1068–1079. [Google Scholar] [CrossRef]
  11. Kravanja, Z.; Čuček, L. Multi-objective optimization for generating sustainable solutions considering total effects on the environment. Appl. Energy 2013, 101, 67–80. [Google Scholar] [CrossRef]
  12. Burnett, R.D.; Hansen, D.R. Ecoefficiency: Defining a role for environmental cost management. Account. Org. Soc. 2008, 33, 551–581. [Google Scholar] [CrossRef]
  13. Vogtländer, J.; Van der Lugt, P.; Brezet, H. The sustainability of bamboo products for local and Western European applications. LCAs and land-use. J. Clean. Prod. 2010, 18, 1260–1269. [Google Scholar] [CrossRef]
  14. Baeza-Brotons, F.; Garcés, P.; Payá, J.; Saval, J.M. Portland cement systems with addition of sewage sludge ash. application in concretes for the manufacture of blocks. J. Clean. Prod. 2014, 82, 112–124. [Google Scholar] [CrossRef] [Green Version]
  15. Kendall, A.; Keoleian, G.A.; Helfand, G.E. Integrated life-cycle assessment and life-cycle cost analysis model for concrete bridge deck applications. J. Infrastruct. Syst. 2008, 14, 214–222. [Google Scholar] [CrossRef]
  16. Chen, F.F. Life Cycle Environmental Costs of Bridge Engineering. Ph.D. Thesis, Wuhan University of Technology, Hubei, China, 2011. [Google Scholar]
  17. Carreras, J.; Boer, D.; Cabeza, L.F.; Jiménez, L.; Guillén-Gosálbez, G. Eco-costs evaluation for the optimal design of buildings with lower environmental impact. Energy Build. 2016, 119, 189–199. [Google Scholar] [CrossRef] [Green Version]
  18. Chou, J.S.; Yeh, K.C. Life cycle carbon dioxide emissions simulation and environmental cost analysis for building construction. J. Clean. Prod. 2015, 101, 137–147. [Google Scholar] [CrossRef]
  19. Epstein, M.; Flamholtz, E.; McDonough, J. Corporate social accounting in the United States of America: State of the art and future prospects. Account. Organ. Soc. 1976, 1, 23–42. [Google Scholar] [CrossRef]
  20. International Organization for Standardization, 14044. Environmental Management–Life Cycle Assessment—Requirements and Guidelines; I.S.O.: Geneva, Switzerland, 2006. [Google Scholar]
  21. Society of Environmental Toxicology and Chemistry. Guidelines for Life-Cycle Assessment: A “Code of Practice”; SETAC: Brussels, Belgium, 1993. [Google Scholar]
  22. Surahyo, M.A. Environmental and social cost modeling of highway projects. Ph.D. Thesis, University of Toronto, Toronto, ON, Canada, 2005. [Google Scholar]
  23. European Reference Life Cycle Database (ELCD). Available online: http://lca.jrc.ec.europa.eu/lcainfohub/datasetCategories.vm (accessed on 12 May 2012).
  24. Beijing Municipal Commission of Housing and Urban-Rural Development (BMCHUD). Quota of Beijing Construction Project; China Construction Industry Press: Beijing, China, 2012.
  25. Ministry of Construction of the People’s Republic of China. National Unified Construction Machinery Quota; China Planning Press: Beijing, China, 2014.
  26. Beijing Statistics Bureau. Yearbook of Beijing; Chinese Statistic Press: Beijing, China, 2016.
  27. Xiamen Statistics Bureau. Yearbook of Xiamen; Chinese Statistic Press: Xiamen, China, 2016.
  28. The Low-Carbon Buildings Method 3.0. Available online: www.lcbmethod.com (accessed on 14 May 2017).
  29. Zeng, H. Life cycle assessment of environmental impacts on construction waste disposal. Eco-Economic 2013, 23, 132–135. [Google Scholar]
  30. Lei, Y.J.; Yao, J.; Zhao, F.; Li, Z.S. Environmental impact assessment of two kinds of treatment methods of municipal solid waste in Chengdu. Saf. Environ. Eng. 2014, 21, 75–79. [Google Scholar]
  31. Xiao, J.Z. Recycled Concrete; China Building Industry Press: Beijing, China, 2008. [Google Scholar]
  32. Zhu, H.; Xiu, L.I.; Liu, L.; Wang, C. The harmless disposal of urban domestic waste and sustainable development. Environ. Sci. Technol. 2002, 25, 22–26. [Google Scholar]
  33. Thuesen, G.J.; Fabrycky, W.J. Engineering Economy; Pearson Education Asia Limited and Tsinghua University Press: Beijing, China, 2004. [Google Scholar]
  34. Ardente, F.; Beccali, G.; Cellura, M.; Brano, V.L. Life cycle assessment of a solar thermal collector: Sensitivity analysis, energy and environmental balances. Renew. Energy 2005, 30, 109–130. [Google Scholar] [CrossRef]
  35. Kennedy, D. The Diet Quality Index-International (DQI-I) provides an effective tool for cross-national comparison of diet quality as illustrated by China and the United States. J. Nutr. 2003, 133, 3476–3484. [Google Scholar]
  36. Weidema, B.P.; Bauer, C.; Hischier, R.; Mutel, C.; Nemecek, T.; Reinhard, J.; Vadenbo, C.O.; Wernet, G. Overview and Methodology: Data Quality Guideline for the Ecoinvent Database Version 3; Swiss Centre for Life Cycle Inventories: Swiss, Switzerland, 2013. [Google Scholar]
  37. Tatari, O.; Nazzal, M.; Kucukvar, M. Comparative sustainability assessment of warm-mix asphalts: A thermodynamic based hybrid life cycle analysis. Resour. Conserv. Recycl. 2012, 58, 18–24. [Google Scholar] [CrossRef]
  38. International Organization for Standardization, 14008. Monetary Valuation of Environmental Impacts and Related Environmental Aspects; I.S.O.: Geneva, Switzerland, 2019. [Google Scholar]
Figure 1. The flowchart of the model.
Energies 13 01353 g001
Figure 2. Sensitivity coefficients of the unit virtual abatement costs.
Energies 13 01353 g002
Figure 3. Environmental cost of case study building in Xiamen (unit: CNY/m2).
Energies 13 01353 g003
Figure 4. Environmental cost of case study building in Beijing (unit: CNY/m2).
Energies 13 01353 g004
Figure 5. Ratio of environmental cost to direct cost considering different discount rate.
Energies 13 01353 g005
Table 1. Ratio of green construction measures cost to subengineering fees.
-Construction Work (%)Decoration Work (%)Erection Work (%)
Resource conservation0.202.052.25
Environmental protection0.100.861.75
Health and safety0.292.278.25
Total0.595.1812.25
Table 2. Data sources of the study.
Life Cycle StageSubprocessData Origin
Material productionConcrete C20ELCD
-Concrete C25ELCD
-Concrete C30CLCD
-Concrete C35ELCD
-Concrete C50CLCD
-RebarCLCD
-Rolled section steel CLCD
-Steel tubeCLCD
-Cement mortarELCD
-Wood doorELCD
-Aluminum doorELCD
-Window frame, AluminumELCD
-Alkyd paintELCD
-Glass curtain wallCLCD
ConstructionDieselCLCD
-GasolineCLCD
-ElectricityCLCD
Operation WaterCLCD
-ElectricityCLCD
-Natural gasCLCD
Table 3. The inventory data of construction waste (unit: g/t).
-OilCoalIronLimestone
Recycle3931394105119
Reuse4588460180204
Landfill23422341517
Table 4. Unit virtual abatement costs of air pollution (unit: CNY/t).
-CO2COCH4SO2NOxDustN2OVOC
Unit virtual costs140.0713.342561.26650303014047,437.0413,073.2
Table 5. Unit virtual abatement costs of water pollution (CNY/kg).
IndustrySteel Manufacturing IndustryElectricityFuel Gas
COD1.48.415.32.8
NH4+2.2910.0390.5162.001
Table 6. Unit virtual abatement cost of household waste.
TransportationSanitary LandfillInnocent TreatmentSimple Landfill
2535608
Table 7. The accounting result of environmental costs in China from 2004–2008.
Air Pollution (Unit: Hundred Million Yuan)
YearAbatement CostsEnvironmental Degradation CostsRatioMean
2004922.321982.381.93
20051610.928691.78
20061821.530511.67
20072104.83616.71.71
20082227.74725.62.12
Water Pollution (Unit: Hundred Million Yuan)
YearAbatement CostsEnvironmental Degradation CostsRatioMean
20041808.72862.81.581.33
200520842484.71.19
20062143.82705.81.26
20072121.12774.81.31
20082672.63457.11.29
Solid Waste Pollution (Unit: Hundred Million Yuan)
YearAbatement CostsEnvironmental Degradation CostsRatioMean
2004143.526.50.180.31
2005148.729.60.20
2006147.329.60.20
2007129.865.10.50
2008142.963.60.45
Table 8. Comparison of the case study buildings in Beijing and Xiamen.
Case Study BuildingGross Floor AreaClimate ZoneNumber of ApartmentsDirect Costs
In Beijing63,627 m2North temperate subhumid continental monsoon climate100266,784.3 thousand CNY
In Xiamen12,595 m2Subtropical marine monsoon climate7839,794.76 thousand CNY
Table 9. Data quality indicators (DQI) and uncertainty.
Indicator Score12345
ReliabilityVerified data based on measurement (0.0)Verified data party based on assumptions or nonverified data based on measurements (0.025)Nonverified data partly based on qualified estimates (0.05)Qualified estimate (e.g., by industrial expert) (0.1)Nonqualified estimate (0.2)
CompletenessRepresentative data from all sites relevant to the market considered over an adequate period to balance normal fluctuations (0.0)Representative data from >50% of the sites relevant to the market considered over an adequate period to balance normal fluctuations (0.01)Representative data from only some sites (<<50%) relevant to the market considered or >50% of the sites but from shorter periods (0.025)Representative data from only one site relevant to the market considered or some sites but from shorter periods (0.05)Representativeness unknown or data from a small number of sites and from shorter periods (0.1)
Temporal correlationLess than 3 years of time difference from the dataset (0.0)Less than 6 years of time difference from the dataset (0.025)Less than 10 years of time difference from the dataset (0.1)Less than 15 years of time difference from the dataset (0.2)Age of data unknown or more than 15 years of time difference from the dataset (0.35)
Geographical correlationData from area under study (0.0)Average data from larger area in which the area under study is included (0.015)Data from area with similar production conditions (0.05)Data from area with slightly similar production conditions (0.1)Data from unknown or distinctly different area (0.2)
Further technological correlationData from enterprises, processes and materials being studied (0.0)Data from processes and materials being studied (i.e., identical technology) but from different enterprises (0.005)Data from processes and materials being studied but from different technology (0.01)Data on related processes or markets (0.025)Data on related processes on laboratory scale or from different technology (0.05)
Table 10. Data uncertainty of each parameter in the calculation.
ParameterVariabilityDistributionIteration Times
Material quantity0.035Lognormal10,000
Data quality indicator0.0433Lognormal10,000
Transportation distance20–40Uniform10,000
Average fuel consumption10–15Uniform10,000
Ratio of green construction measures cost to construction fees0.59%Lognormal10,000
Ratio of green construction measures cost to decoration fees5.18%Lognormal10,000
Ratio of green construction measures cost to erection fees12.25%Lognormal10,000

