Article

Fault Investigation in Cascaded H-Bridge Multilevel Inverter through Fast Fourier Transform and Artificial Neural Network Approach

1
School of Electrical Engineering, VIT Vellore, Tamil Nadu 632014, India
2
Department of Electrical and Electronics Engineering, Sree Vidyanikethan Engineering College, Tirupati 517102, India
3
Center for Bioenergy and Green Engineering, Department of Energy Technology, Aalborg University, 6700 Esbjerg, Denmark
4
Department of Energy Technology, Aalborg University, 9220 Aalborg, Denmark
*
Authors to whom correspondence should be addressed.
Energies 2020, 13(6), 1299; https://doi.org/10.3390/en13061299
Submission received: 24 December 2019 / Revised: 6 March 2020 / Accepted: 7 March 2020 / Published: 11 March 2020
(This article belongs to the Special Issue Design and Control of Power Converters 2020)

Abstract

:
In recent times, multilevel inverters are used as a high priority in many sizeable industrial drive applications. However, the reliability and performance of multilevel inverters are affected by the failure of power electronic switches. In this paper, the failure of power electronic switches of multilevel inverters is identified with the help of a high-performance diagnostic system during the open switch and low condition. Experimental and simulation analysis was carried out on five levels cascaded h-bridge multilevel inverter, and its output voltage waveforms were synthesized at different switch fault cases and different modulation index parameter values. Salient frequency-domain features of the output voltage signal were extracted using a Fast Fourier Transform decomposition technique. The real-time work of the proposed fault diagnostic system was implemented through the LabVIEW software. The Offline Artificial neural network was trained using the MATLAB software, and the overall system parameters were transferred to the LabVIEW real-time system. With the proposed method, it is possible to identify the individual faulty switch of multilevel inverters successfully.

Graphical Abstract

1. Introduction

In recent years, multilevel inverters are drawing intense interest in the research of solid industrial electric drives organizes in the direction of attaining the high power demands necessary with them. The foremost merits of Multilevel Inverters (MLIs) are minimization of harmonic deformation of the output voltage waveform by way of raising incapacity of levels as well as litheness for the usage of battery sets or fuel for in-between periods [1,2,3].
Although MLIs are effectively used in engineering applications employing a confirmed technology, the collapse of power electronic switches and its fault investigation is until now a recent research issue for researchers. In engineering applications, it is implemented to examine the state of power switches which is available in inverters. The extent of levels in the inverter changes, the number of power also switches varied, which can raise the chance of collapse of any one of the switches; hence, any such fault should be acknowledged at the initial stage so that the process of drive and motor during anomalous conditions is not affected [4,5,6,7,8,9,10]. The different modes of the collapse of power semiconductor switches, an open-switch as well as the short-switch fault, directs to current harmonics and generates troubles in the gate driving circuits. Therefore, it reduces the system’s concert. Several researchers used the inverter output current and voltage for constructing that fault identification arrangement [11,12]. Surin Khomfoi et al. [13], created an open-switch fault analytic coordination of an MLI created based on that output voltage with Fast Fourier Transform (FFT) model as well as five parallel neural networks employing 40 contribution neurons for every system. While the range of that neural network is extremely complex because of 40 input neurons, inside of a new paper, Surin Khomfoi et al. projected a different method that contains a mixture of FFT principal constituent analysis, genetic algorithm as well as neural network technology for identifying the fault category as well as fault location in an inverter [14].
Recognition of faulty switches of MLIs is still an emerging research area, and numerous researchers are steadily working on the way to identify the faults precisely. On the other hand, information about the actual instance implementation of high concert fault investigation system for cascaded H-bridge multilevel inverter is inadequate. With that consideration, Multilevel Inverter (MLI) output voltages are measured as a significant constraint to identifying faulty switches. Real-time implementation of overall fault analytic schemes has been executed in National Instruments (NI)—LabVIEW software with a version of DAQmx 19.1; it has been a complicated apparatus designed for rising as well as operating actual instant submission. LabVIEW makes use of graphical encoding language formed by National Instruments and is also successfully applied for data attaining, instrumentation control, as well as in automotive industries. ANN is a useful tool in the classification of patterns in the course of learning as well as nonlinear mapping. Together, LabVIEW and ANN are arranged to measure. It is essential as an additional test for obtaining research work. Therefore, the actual instant fault detection method is programmed at some stage in LabVIEW with the help of ANN [15,16,17].

2. Structure of H-Bridge Multilevel Inverter

The H-Bridge inverter modules with separate DC sources are connected in series to form a cascaded multilevel inverter. Figure 1 illustrates a typical three-phase cascaded MLI using 3 H-bridge modules within every phase associated with a three-phase asynchronous motor load. The number of output voltage levels can be calculated with the formula 2S+1; here, ‘S’ is the number of H-Bridge modules utilized for it. The 3 phase MLI structure is generally used for industrialized applications. In current work, the single-phase MLI is used because that projected fault analytic scheme has the capability of expanding in favour of three-phase applications.
Figure 2 illustrates the representation of the single-phase five levels cascaded H-bridge inverter utilized; it contains 2 H-Bridge modules, as well as 8 number of powers, switches Insulated-Gate Bipolar Transistors (IGBTs). Every IGBT switch is named following its module location like S1A, S2A, S3B, S4B, etc. The cascaded inverter has been linked along with a dynamic load like 1ψ, 0.5 HP, 50 Hz asynchronous motor. The Sinusoidal Pulse Width Modulation (SPWM) technique has been applied for generating the necessary switching signals for IGBTs. In this SPWM, higher frequency contained triangular carrier waves are used along with a sinusoidal reference wave. Figure 3 shows that production of switching sequence corresponding to module A at a carrier wave frequency value (fc) of 3 kHz as well as a modulation index value (m) of sinusoidal wave 0.85. Now in this work, the modulation index is deferred in-between sort of values 0.8 to 0.95.

3. Fault Analysis of Output Voltage and Current

Simulation fault analysis was carried out with the help of Matlab/Simulink (R2019b) to realize the output load voltage, as well as output, load current waveform earlier than as well as later than the fault commencement of the MLI. Foremost, the open circuit fault occurs at 1 s on switch S1A of module A. Figure 4 shows the actual load voltage of the inverter, its exaggerated outlook as well as current wave earlier and later of that faulty condition of single-phase cascaded H-Bridge MLI associated employing the induction motor load. The voltage, as well as current patterns, were exampled for 20 kHz. Likewise, Figure 5 shows the output load voltage, as well as the output, load current waveforms later than the fault creation of open-circuit fault in switch S2A of Module A.

4. Concept of Fast Fourier Transform and Feature Extraction Process

In the Fast Fourier Transform method, the output voltage waveform features are extracted. In order to generate a powerful fault analysis method, it is essential on the way to execute frequency domain analyses for the output load voltage patterns. The FFT method has been used for pulling out different parameters of the output voltage signal. As seen, signals of output parameters are not easy to be measured as a significant attribute to categorizing a faulty assumption. Consequently, the signal conversion method is required. A proper choice of that characteristic extractor is to give sufficient important information about the neural network in the example set; thus, that was the maximum amount of precision within that neural network concert that was attained. Single probable method of execution with Digital Signal Processing (DSP) microchip is executed with the help of FFT [9]. Initiating through Discrete Fourier Transform in Equation (1), after that FFT technique is with a combination of decimation within time decomposition algorithm has been represented in Equations (2) and (3):
F k = n = 0 N 1 f n W N n k       for       k   =   0 ,   ,   N 1
where W N = e j 2 π N
F k = G k + W N k H k       for       k = 0 ,   , N 2 1
F k + N 2 = G k W N k H k       for       k = 0 ,   , N 2 1
Gk is to be on behalf of even-numbered essentials of fn, while Hk is to be on behalf of odd-number essentials of fn. Gk, Z as well as Hk, are to be evaluated as exposed in Equations (4) and (5).
G k = n = 0 N 2 1 f 2 n W N 2 n k
H k = n = 0 N 2 1 f 2 n + 1 W N 2 n k
Figure 6 shows the schematic diagram representation of that fault analysis system implemented on behalf of the recognition of the failures in power electronic switches using those features extracted from the FFT technique. The inverter load voltage wave has been deliberated and using FFT technique, essential functions of the voltage signal, i.e., Total Harmonic Distortion (THD) (%), harmonic/fundamental ratio (%) values up to 11th harmonics are extracted. Hence, the RMS value analysis is also simultaneously carried out in the output voltage signal, and the extracted 12 features are specified as input for that the Artificial Neural Network. Figure 6 illustrates the feature 100/50 representing the ratio of the second harmonic to fundamental; feature 150/50 represents the ratio of third harmonic/fundamental and so on. The output of the trained patterns of the ANN with LabVIEW software identifies the faulty switch of the multilevel inverter. Therefore, the FFT method is useful for every load voltage waveform underneath the open circuit fault condition as well as short circuit fault conditions with corresponding harmonic level variations, Vrms, and THD values. Figure 7 illustrates the FFT frequency plot of output voltage during a healthy and open-circuit fault condition. Figure 8 illustrates different features of the load voltage wave obtained from the FFT technique on various open switch faulty cases from second harmonic ratios to 11th Harmonic ratios. Figure 9 illustrates the features of the load voltage wave obtained from the FFT technique on various short switch faulty cases for different harmonic ratio values. Figure 10 shows THD of the output voltage waveform obtained from the FFT technique on various faulty cases as well as on various values of modulation index at different switches. Figure 11 illustrates the RMS values of the output voltage waveform obtained on various faulty cases as well as on various values of modulation index at different switches. Extracting the distinct features from the waveform of load voltage will automate the fault analysis process.

5. Structure of Fault Diagnostic System

Figure 12 shows the schematic diagram of the overall fault diagnosis scheme built to recognize the power electronic switch failure in MLI. The hardware arrangement contains a DC Source, MLI, Induction Motor, as well as A-Data Fetching System.
Primarily, extracting the voltage wave features as well as various modulation index values using FFT harmonic analysis in Matlab/Simulink (R2019b), the various fault conditions have been created in both practical setting and simulation. The obtained features were given to ANN offline training with Matlab. This trained model contains both weight values, as well as bias values of ANN, are fed on the way to graphical programming language LabVIEW used for fault analysis. For actual instant submission, outputs of voltage sensors are specified toward NI Universal Serial Bus data acquisition system that has been attached with PC. Voltage information is operated in LabVIEW FFT attribute, taking out an examination as well as compared by way of that offline trained example. After that, the LabVIEW GUI indicates fault switches in the MLI that helps maintain the system’s reliability.
Figure 13 shows the laboratory experiment arrangement worn to gather load voltage waveforms of MLI on behalf of various switch faulty situation. To obtain five-level output voltages, the cascaded arrangement of PWM modules triggered 2 H-bridge inverters must be created. IGBTs having the specifications of 600 V, 25 A are chosen as switches. PWM module containing the reference as well as carrier signal selecting, modulation index as well as switching frequency modification are worn for sending necessary gate signals to IGBTs.
Figure 14a,b show the data acquisition system interfacing to LabVIEW software in the computer on behalf of actual instant submissions. National Instruments (NI) USB-6251 (1.25 MSa/Sec) are worn as data fetching arrangement that are interfaced with the computer to record as well as facilitate the new process for obtaining signals.
The total arrangement can measure the 16 analogue signals as well as 16 bits. The Digital Storage Oscilloscope (DSO) and Agilent (1 GSa/Sec), are worn as well for visualizing load voltage waves. Open circuit and short circuit faulty conditions are formed on every switching device, and consequent output voltage waves are stored. A voltage sensor has been utilized for collecting the signals at the output and is directly interfaced to NI USB-6251. The output signals are extracted from inverter for variety of indexed modularity values, and FFT harmonic analysis is also conceded. A significant characteristic of that voltage sensor is to extract the energy substance of that signal at various levels of dissolution.

5.1. Simulation Results at open circuit Fault

Firstly, an open circuit faulty condition is subjected to switch S1A, and then the resulting load voltage waveform recorded. Likewise, open circuit faulty condition is formed on the remaining switches of H-Bridge A as well as H-Bridge B. The resulting output voltage waveforms are recorded for an advanced characteristic of pulling out progression. Figure 15 shows the distinctive output waveforms attained when open circuit switch faulty condition on H-Bridge A. For assessment, that output voltage waveform when in the no-fault situation has also been included in Figure 15. These output voltage waveform patterns illustrate to find variations between healthy as well as faulty conditions effortlessly.

5.2. Simulation Results at short circuit Fault

During this condition, short circuit fault has been formed on every one switch of H-Bridge A and H-Bridge B, one after one as well as that resulting output voltage waveforms are also recorded on behalf of supplementary characteristic pulling out method. Figure 16 shows that characteristic output voltage waves attained when normal conditions as well as short- switch faulty circumstances of H-Bridge B. by observing that the countable dissimilarity has been there in every output voltage waves of short circuit unsatisfactory situation while comparing with the reasonable condition. FFT method has been used for every output voltage wave underneath short circuit fault circumstance, and then consequent FFT harmonic analysis is evaluated.

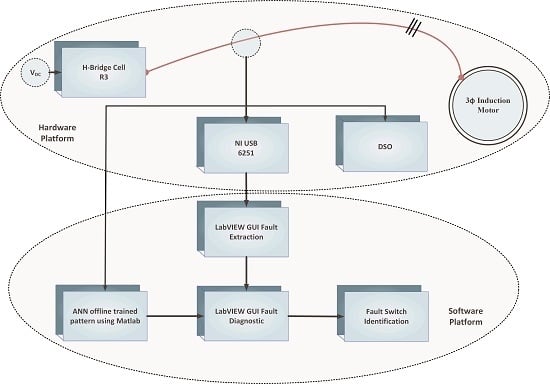
6. Experimental Validation

6.1. Feature Extraction Analysis Using LabVIEW

The whole faulty diagnosis system has implemented with National Instruments (NI) - LabVIEW software with a version of DAQmx 19.1. Figure 17 shows the implemented LabVIEW frontage panels containing the output voltage imprison as well as examination unit before identifying the fault switch. It shows the initial Data Acquisition capture settings in terms of max and min value, sampling frequency, number of samples per channel, multi-factor value, the magnitude of RMS voltage in max and min and time scale parameters. The GUI improved within LabVIEW displayed the fetched output waveform of voltage have frontage on the side panel of that programming algorithm. Their front side panel behaves similar to a UI someplace the user be able to set up as well as pull out information. Formerly that NI USB gadget has correctly interfacing to that LabVIEW front side panel; the piece of equipment contact indicates in green colour blinking. The front side panel has had power over parameters of output signal like the scale of time as well as magnitude, sampling frequency as well as no. of samples of every indication.
Moreover, with the help of acquisition setting the no. of sample signal capturing is also controlled for a particular time. Separate sub VI has power over frequency domain investigation of that output voltage signal. Because of the NI Data Acquisition System (DAS) as well as LabVIEW software’s has the capability to capturing as well as analyzing the data set on a precise instant. Signals are capturing endlessly as well as recorded in the computer on behalf of supplementary dispensation. This front panel also shows the variations in the RMS value of the output voltage signal concerning time which helps in understanding the trend analysis of the Vrms parameter. Figure 18 shows that front end side panel of LabVIEW intended to examination frequency domain of the output voltage signals using FFT technique. This unit contains the have power over choosing the signals for FFT analysis purpose. Within this unit, control also provided for tracking of individual FFT plot of the voltage signal. Peak values of the harmonic frequencies are used to evaluate the harmonic ratios concerning fundamental frequencies. The Fast Fourier Transform frequency domain harmonic examination of the front panel is improved within the research work as well as it shows in Figure 19. This has been deliberated on the way toward the observation of various harmonic/fundamental ratios, and THD value of the output voltage signal of multilevel inverter and Figure 20 shows that VI front panel of MLI faulty switch analysis. In that screen, that is shown the possibility of tracking the harmonic scheme for each separate output voltage signals. This software module is developed in such a way to evaluate up to 11th harmonic ratio. Trend analysis of THD value and harmonic ratios is possible in this front panel and the faulty.
The switch must be identified and Figure 21 illustrates the output voltage pattern that relates to MLI under various faulty switch conditions at real-time implementation.

6.2. Real-Time Fault Diagnosis Results from LabVIEW-ANN Approach

On the way towards the mechanize the development that of fault analysis in MLI, a multilayer feed-forward network, as well as a backpropagation learning algorithm was utilized [15].
Figure 22 shows the ANN schematic diagram. It has a structure containing an input layer, one forbidden layer, and one output layer. The targeted and input vectors are primarily fed with some values for a training network. Exercising the arrangement is completed by altering the weight as well as the bias of the unit depends among the significant fault. Backpropagation training algorithm contains a frontward pass as well as toward the back pass is conceded out in anticipation of the Mean Square Error (MSE) has been evaluated up to the lowest value. The collected data is achieved at what time error between them calculated as well as the preferred amount produced, which is a lesser amount of that set value.
Here MSE, that has been meaning of the number of errors for every set of input as well as resulting output, been evaluated with Equation (6):
M S E = 1 m k m ( S k Y k ) 2
Here Sk, as well as Yk are, correspondingly, the preferred, as well as measured output on behalf of kth input set and m, is the whole quantity of their output parameters [15]. Here information of the revised neural network is utilized and is displayed in Table 1.
Within the proposed work, 12 parameters (10 harmonic ratios, THD and Vrms) obtained as features from the FFT technique of a faulty conditioned output voltage signals are fed to the input of the neural network. There is a total of 9 produced neurons for classifying that fault as that of no-fault, S1A fault up to S4B fault are shown in Table 2.
It is shown that the ANN training sequence approaches various switches faults in MLI. In the exercise sequence, each neuron in that output layer of the neural network is assigned to particular faults and then trained for a binary value of 1 or 0, as shown in Table 2. For example, in the case of the no-fault condition, the first neuron in the output layer has been assigned a value of 1, and all other neurons are trained for a value of 0. Similarly, for different fault cases, the output layer neurons are trained for different binary training patterns. For the offline training of the neural network, 200 training sets were used, and the weight matrix of the trained pattern is given as an input to the LabVIEW GUI module for testing purposes with 150 test inputs.
Figure 23 shows the performance of the network at various iterations. The training of the current system reaches the junction criterion after close to 3800 iterations. It is proved that 3800 iterations were enough to know the successful training of that revised neural network. Consequently, a concert of that back PNN is known by way of 24 forbidden layer neurons maintained that worth of that learning rate is 0.1, and the number of iterations is 3800.
In general, it is noticed that the neural network accurately predicts the no-fault case at all tested numbers of forbidden layer neurons. Since that network convergence has not been reached within the specified revised neural network parameters in such cases of 15 or 20 forbidden layer neurons, then the accuracy of identification tempo is affected. It has identified their concert of the neural network been enhanced on behalf of 24 forbidden layer neurons while comparing employing further situations. The average recognition tempo on behalf of every faulty case is 100% in the considered case, as well as the neural network, has capable of discovering that fault in all faulty cases effectively. Table 3 gives a detailed analysis of the identification rate, and Figure 24 illustrates the evaluation of neural network means the square error of various numbers of forbidden layer neurons.
Real-time implementation of LabVIEW is dependent on the trail of the fault analysis of MLI with load voltage characteristics like FFT harmonic analysis showing the possibilities of determining the switch failure in a particular position in an MLI. When comparing with other techniques mentioned in previous publications [13,14], the projected technique considerably decreases the number of inputs to ANN network as well as analyzes the occurrence of faulty conditions in 10 msec, and it can find the faulty condition of an exact switch (OC fault or SC fault) in the MLI. Also, the projected method gives a 100% detection rate among no-fault as well as fault conditions of a switch. Therefore, on one occasion, the switch fault is analyzed that has helped operate and carry out precautionary safeguarding.

7. Conclusions

This paper’s proposed H-bridge cascaded five level multilevel inverters associated through a load of induction motor with faulty switch analysis is carried out. First, the significant attributes of load voltage output waveform are examined with simulation as well as experimental analysis on dissimilar open-switch and short-switch faulty conditions. Meanwhile, the existing problems are further examined. Furthermore, essential features like harmonic analysis with FFT technique are specified to be input to that backpropagation trained ANN along with an evaluation of the mean square error at the different number of hidden layer neurons; to make the neural network offline the Matlab software is utilized. The actual instance function of that anticipated fault diagnosis scheme is executed with the LabVIEW software. This projected fault diagnosis scheme has the potential to accurately recognize each separate fault switch of the cascaded multilevel inverter. It can categorize 100% precisely typical as well as fault situations. Therefore, in this instance, the faulty switch conditions were recognized immediately, and implementing this system will help the operator in performing protective maintaining work.

Author Contributions

G.K.K., and E.P., have developed the proposed research concept, and they both are involved in studying the execution and implementation with statistical software by collecting information from the real environment and developed the simulation model for the same. D.E., P.S., F.L., J.B.H.-N. shared their expertise and validation examinations to confirm the concept theoretically with the obtained numerical results for its validation of the proposal. All authors are to frame the final version of the manuscript as a full. Moreover, all authors involved in validating and to make the article error-free technical outcome for the set investigation work. All authors contributed to the research investigation equally and presented in the current version of the full article. All authors have read and agreed to the published version of the manuscript.

Funding

No source of funding for this research activities.

Conflicts of Interest

The authors declare no conflict of interest.

References

  1. Zheng, Z.; Wang, K.; Xu, L.; Li, Y. A hybrid cascaded multilevel converter for battery energy management applied in electric vehicles. IEEE Trans. Power Electron. 2014, 29, 3537–3546. [Google Scholar] [CrossRef]
  2. Javad, G.; Reza, N. Analysis of Cascaded H-Bridge Multilevel Inverter in DTC-SVM Induction Motor Drive for FCEV. J. Electr. Eng. Technol. 2013, 8, 304–315. [Google Scholar]
  3. Banaei, M.R.; Salary, E. A New Family of Cascaded Transformer Six Switch Sub-Multilevel Inverter with Several Advantages. J. Electr. Eng. Technol. 2013, 8, 1078–1085. [Google Scholar] [CrossRef] [Green Version]
  4. Ui-Min, C.; Lee, K.-B.; Frede, B. Diagnosis and tolerant strategy of an open-switch fault for T-type three-level inverter systems. IEEE Trans. Ind. Appl. 2014, 50, 495–508. [Google Scholar] [CrossRef]
  5. Chen, A.; Hu, L.; Chen, L.; Deng, Y.; He, X. A multilevel converter topology with fault-tolerant ability. IEEE Trans. Power Electron. 2005, 20, 405–415. [Google Scholar] [CrossRef]
  6. Pablo, L.; Josep, P.A.; Thierry, M.; Jose, R.; Salvador, C.; Frédéric, R. Survey on fault operation on multilevel inverter. IEEE Trans. Ind. Electron. 2010, 57, 2207–2218. [Google Scholar]
  7. Ma, M.; Hu, L.; Chen, A.; He, X. Reconfiguration of carrier-based modulation strategy for fault-tolerant multilevel inverters. IEEE Trans. Power Electron. 2007, 22, 2050–2060. [Google Scholar] [CrossRef]
  8. Diallo, D.; Benbouzid, M.H.; Hamad, D.; Pierre, X. Fault detection and diagnosis in an induction machine drive—A pattern recognition approach based on concordia stator mean current vector. IEEE Trans. Energy Conv. 2005, 20, 512–519. [Google Scholar] [CrossRef] [Green Version]
  9. Estima, J.; Cardoso, A.M. A new algorithm for real-time multiple open-circuit fault diagnosis in voltage-fed PWM motor drives by the reference current errors. IEEE Trans. Ind. Electron. 2013, 60, 3496–3505. [Google Scholar] [CrossRef]
  10. Khan, M.A.S.K.; Rahman, M.A. Development and implementation of a novel fault diagnostic and protection technique for IPM motor drives. IEEE Trans. Ind. Electron. 2009, 56, 85–92. [Google Scholar] [CrossRef]
  11. Lezana, P.; Aguilera, R.; Rodriguez, J. Fault detection on multicell converter based on output voltage frequency analysis. IEEE Trans. Ind. Electron. 2009, 56, 2275–2283. [Google Scholar] [CrossRef] [Green Version]
  12. Masrur, M.A.; Chen, Z.; Murphey, Y. Intelligent diagnosis of open and short circuit faults in electric drive inverters for real-time applications. IET Power Electron. 2010, 3, 279–291. [Google Scholar] [CrossRef]
  13. Surin Khomfoi, S.; Tolbert, L.M. Fault diagnostic system for a multilevel inverter using a neural network. IEEE Trans. Power Electron. 2007, 22, 1062–1069. [Google Scholar] [CrossRef]
  14. Surin Khomfoi, S.; Tolbert, L.M. Fault diagnosis and reconfiguration for multilevel inverter drive using AI-based techniques. IEEE Trans. Ind. Electron. 2007, 54, 2954–2968. [Google Scholar] [CrossRef]
  15. Sivakumar, M.; Parvathi, R.M.S. Diagnostic Study of Short-Switch Fault of Cascaded H-Bridge Multilevel Inverter using Discrete Wavelet Transform and Neural Networks. Int. J. Appl. Eng. Res. 2014, 9, 10087–10106. [Google Scholar]
  16. Hochgraf, C.; Lasseter, R.; Divan, D.; Lipo, T.A. Comparison of multilevel inverters for static VAR compensation. In Proceedings of the Conference Record of the IEEE Industry Application Society Annual Meeting, Denver, CO, USA, 2–6 October 1994; pp. 921–928. [Google Scholar]
  17. Kastha, D.K.; Bose, B.K. Investigation of fault modes of voltage-fed inverter system for induction motor drive. IEEE Trans. Ind. Appl. 1994, 30, 1028–1038. [Google Scholar] [CrossRef]
Figure 1. Representation of a three-phase H-bridge cascaded multilevel inverter fed induction motor.
Energies 13 01299 g001
Figure 2. Simulink model of 1-Φ cascaded H-Bridge 5-level inverter fed with Induction Motor load.
Energies 13 01299 g002
Figure 3. Sinusoidal Pulse Width Modulation cell A switching patterns created with a carrier wave frequency of 3 kHz and modulation index value of 0.85.
Energies 13 01299 g003
Figure 4. Load current and voltage waveform analysis of Bridge—A of S1A during an open-circuit fault.
Energies 13 01299 g004
Figure 5. Load current and voltage waveform analysis of Bridge—A of S2A during an open-circuit fault.
Energies 13 01299 g005
Figure 6. LabVIEW based fault investigative system using FFT features.
Energies 13 01299 g006
Figure 7. Frequency plot of the output voltage. (a) Normal condition; (b) S1B open circuit fault.
Energies 13 01299 g007
Figure 8. Features of the output voltage waveform acquired from FFT technique at distinct open switch fault cases from 2nd harmonic ratios to 11th harmonic ratios.
Energies 13 01299 g008aEnergies 13 01299 g008b
Figure 9. Features of the voltage waveform acquired from the FFT technique at distinct short switch fault cases (a) 4th harmonic ratio, (b) 5th harmonic ratio, (c) 11th harmonic ratio.
Energies 13 01299 g009
Figure 10. THD value of the output voltage waveform obtained from the FFT technique at different fault cases and different modulation index values.
Energies 13 01299 g010
Figure 11. Output voltage waveforms attained at distinct modulation index values at various fault conditions.
Energies 13 01299 g011
Figure 12. Implementation of the overall fault analytical system.
Energies 13 01299 g012
Figure 13. Laboratory experimental arrangement.
Energies 13 01299 g013
Figure 14. (a) Data acquisition system interfaced with LabVIEW software in PC (b) NI USB-6251 hardware.
Energies 13 01299 g014
Figure 15. Fault condition output voltage waveforms.
Energies 13 01299 g015
Figure 16. Short Circuit fault condition output voltage waveforms.
Energies 13 01299 g016
Figure 17. LabVIEW output Voltage imprisons in the front panel and analysis of multilevel inverter.
Energies 13 01299 g017
Figure 18. LabVIEW FFT based frequency domain analysis in the front panel.
Energies 13 01299 g018
Figure 19. The front panel of FFT based THD and Harmonic analysis.
Energies 13 01299 g019
Figure 20. The front panel of MLI faulty switch analysis.
Energies 13 01299 g020
Figure 21. Voltage waveforms acquired at different open circuit and short circuit switch fault situations.
Energies 13 01299 g021aEnergies 13 01299 g021b
Figure 22. Schematic diagram of an Artificial Neural Network.
Energies 13 01299 g022
Figure 23. Variations occurred in MSE of the ANN during training pattern concerning an increase in the number of iterations.
Energies 13 01299 g023
Figure 24. Evaluation of the mean square error of the neural network at different numbers of hidden layer neurons.
Energies 13 01299 g024
Table 1. Specifications of FFT—ANN-Lab VIEW Approach.
No. of Inputs12
No. of Neurons in Hidden Layer24
No. of Neurons in Output Layer9
Learning Rate (η)0.1
No. of Iterations3800
No. of Training Sets200
No. of Test Input Sets150
Convergence Criteria0.01
Table 2. Training pattern of Neural Network.
Classification of FaultPosition of NeuronOutput Pattern
No fault1[ 1 0 0 0 0 0 0 0 0 ]
S1A fault2[ 0 1 0 0 0 0 0 0 0 ]
S1B fault3[ 0 0 1 0 0 0 0 0 0 ]
S2A fault4[ 0 0 0 1 0 0 0 0 0 ]
S2B fault5[ 0 0 0 0 1 0 0 0 0 ]
S3A fault6[ 0 0 0 0 0 1 0 0 0 ]
S3B fault7[ 0 0 0 0 0 0 1 0 0 ]
S4A fault8[ 0 0 0 0 0 0 0 1 0 ]
S4B fault9[ 0 0 0 0 0 0 0 0 1 ]
Table 3. Overall Identification rates of FFT-ANN-LabVIEW approach.
Classification of FaultIdentification Rate (%) at Different Number of Hidden Layer Neurons
152024
No fault100100100
S1A fault9192100
S1B fault9395100
S2A fault9295100
S2B fault9192100
S3A fault9595100
S3B fault9296100
S4A fault9395100
S4B fault9294100

