Article

Matching Characteristic Research of Building Renewable Energy System Based on Virtual Energy Storage of Air Conditioning Load

1
Department of Electrical Engineering, Energy Internet Research Institute, Tsinghua University, Beijing 100085, China
2
Key Laboratory of Efficient Utilization of Low and Medium Grade Energy, Tianjin University, Tianjin 300350, China
3
Luneng Group Co., Ltd., Beijing 100020, China
4
School of Electrical Engineering and Telecommunications, University of New South Wales, Sydney 2052, Australia
5
School of Civil Engineering, Hebei University of Science & Technology, Shijiazhuang 050018, China
*
Author to whom correspondence should be addressed.
Energies 2020, 13(5), 1269; https://doi.org/10.3390/en13051269
Submission received: 4 February 2020 / Revised: 22 February 2020 / Accepted: 3 March 2020 / Published: 9 March 2020

Abstract

:
Considering the huge power consumption, rapid response and the short-term heat reserving capacity of the air conditioning load in the building’s energy system, the air conditioning load and its system can be equivalent to the virtual energy storage device for the power grid. Therefore, to obtain a high matching building renewable energy system, a virtual energy storage system of the air conditioning load, accompanied by a storage battery, was built in the paper. Then, operating strategies for the virtual energy storage of the air conditioning load and storage battery were designed. Further, to quantize the contribution of the virtual energy storage to the improvement of matching characteristics, two indicators of the demand side and supply side in the energy system were adopted, including on-site energy fraction (OEFr) and on-site energy matching (OEMr). Lastly, matching characteristic research of the building’s renewable energy system based on virtual energy storage of the air conditioning load was established and analyzed by TRNSYS and MATLAB in Tianjin, China. The results revealed that a better matching characteristic performance of the building’s renewable energy systems driven by virtual energy storage was obtained. In the condition set out in the paper, compared with that without virtual energy storage, the average values of OEFr and OEMr after virtual energy storage were 0.66 and 0.77, which increased by 8.19% and 8.45% respectively. Simultaneously, the battery operation performance in the building renewable system was improved when the virtual energy storage was working. The times of charge and discharge cycles decreased after virtual energy storage, and the depth of discharge of the battery reduced by 23.37% on a specific day.

1. Introduction

With the growing use of electrical appliances and digital devices, the electricity consumption of buildings is increasing, and the difference of a building’s electricity consumption between peak and valley values is more and more obvious [1]. Simultaneously, numerous fluctuating renewable energy sources such as solar and wind energy have been developed and utilized in the supply side of the energy system [2]. Take solar energy as an example; on the one hand, through solar tracking and concentration, research has been conducted to provide consistent PV energy. For example, during cloudy periods, Kelly et al. [3] described measurements of the solar irradiance, in order to improve the amount of solar energy captured during such periods; Quinn et al. [4] derived a simple formula for directly calculating the optimal tilt angle of a two-axis time-position tracking PV array under varying sky conditions. From the f-theta distortion profile, Furkan et al. [5] presented the optical design of a compact, high-resolution equidistant fisheye lens with low deviation. The lens can be integrated with a commercial image sensor array to form a low-cost whole sky camera, which can provide accurate tracking in solar energy generation systems. On the other hand, due to the natural instability of renewable energy, the request of “cut peaks and fill valleys” is significant for the smart and tough power grid [6]. In other words, in order to improve the friendliness characteristic of buildings to the power grid, it is necessary to find ways to improve the flexibility of the building’s energy consumption.
In recent years, on the one hand, considering the proportion of air conditioning load in the peak load can reach 30% to 50% of the building’s energy consumption [7], the rapid growth of the air conditioning load has become the important element of the electricity consumption for the power grid [8]; on the other hand, it has rapid response advantages to power [9,10]. Simultaneously, because of the heat capacity of buildings, during the air conditioning cooling or heating process, there is a delay in the inner temperature changes when the power changes, and also a range of comfortable temperatures for the human body. Therefore, it is of great significance to be able to adjust the air conditioning load characteristic to change the building power load curve and realize the power grid load shifting [11].
In conclusion, considering the large power consumption, rapid response and the short-term heat reserve capacity of the air conditioning load in a building’s energy system, air conditioning load and its system can be equivalent to the virtual energy storage (VES) device to help the grid to cut peaks and fill valleys. Research is paying more attention to analyze the mechanism and effect of VES on the power grid and building energy systems in different scenarios, quantitatively. For example, by changing the set temperature value of air conditioning to stabilize wind power fluctuations, Ai et al. [12] established an air conditioning load thermodynamic model and proposed the concept of VES. Wang et al. [13] proposed a hierarchical dispatch strategy to coordinate multiple groups of virtual energy storage systems and achieve voltage regulation. Chen et al. [14] proposed an optimal control model for microgrid tie-line power fluctuation mitigation based on the synergistic operation of VES and battery energy storage. Sun et al. [15] proposed a fuzzy control strategy to distribute power energy to batteries and VES by using air conditioning, which could alleviate the power fluctuation in the microgrid tie lines. In addition, two popular air conditioning load control methods of VES: changing the compressor start–stop, changing the temperature setting value and the duty cycle are compared in the paper [16]. Dan et al. [17] studied the coordinated control between virtual energy storage and energy storage batteries. Through careful consideration of influences of indoor and outdoor disturbances on the thermal process, Ge et al. [18] established an elaborate building VES model by using the indoor air and building envelope as the main parts of heat transfer subject. Yin et al. [19] proposed an optimal bidding and scheduling strategy combining day–ahead decision-making with realtime adjustment of VES, and the improved column–and–constraint generation algorithm to solve the problem. In conclusion, the preliminary results of the above research revealed that it is necessary to analyze the load characteristics of building energy systems and seek appropriate control methods, which could improve the demand response potential of VES to the building energy system and even the power grid.
However, the matching ability of VES between the capacity of renewable energy production and the consumption of total energy in the building has not been studied sufficiently, which could affect the reliability and resilience of the building energy system. Matching ability refers to the degree of matching between building load and renewable energy supply. It is a significant technical parameter for examining the performance of building energy systems and increasing the proportion of renewable energy applications, which has become a research hotspot in recent years [20], for example, the matching characteristics of building loads and energy supply systems in the building has become one of the research points in IEA research [11]. The Italian National Institute of Advanced Energy Technology adopted matching indicators to building energy systems for optimizing its energy system’s performance [21]. In response to evolving utility incentives for residential buildings that employ renewable energy sources and energy storage, Georges [22] presented a general methodology for assessing opportunities associated with optimal load management. Cao et al. [23] conducted a matching analysis for a microcogeneration energy system in a single-family house. Its matching indices and evolved criteria were comprehensively assessed from both electrical and thermal heat matching aspects, and on-site energy fraction index (OEF) and the on-site energy matching index (OEM) investigated the matching of PV production and household energy demand.
After reviewing previous research, this paper proposes building a renewable energy system with a control strategy based on the virtual energy storage of the air conditioning load and optimizes the matching characteristic of the system from the perspective of demand-side management. Firstly, a power generation model, a load forecasting model, and a building renewable energy system were established by using MATLAB and TRNSYS software. Then, the annual simulated calculations of the building renewable energy system in Tianjin, China, were performed. The hour was chosen as the time scale in a typical specific day. Lastly, by using the modified matching parameters as an indicator, the matching characteristics of building renewable systems before and after using virtual energy storage of the air conditioning load were analyzed and compared.

2. System Specification of the Building Renewable Energy System

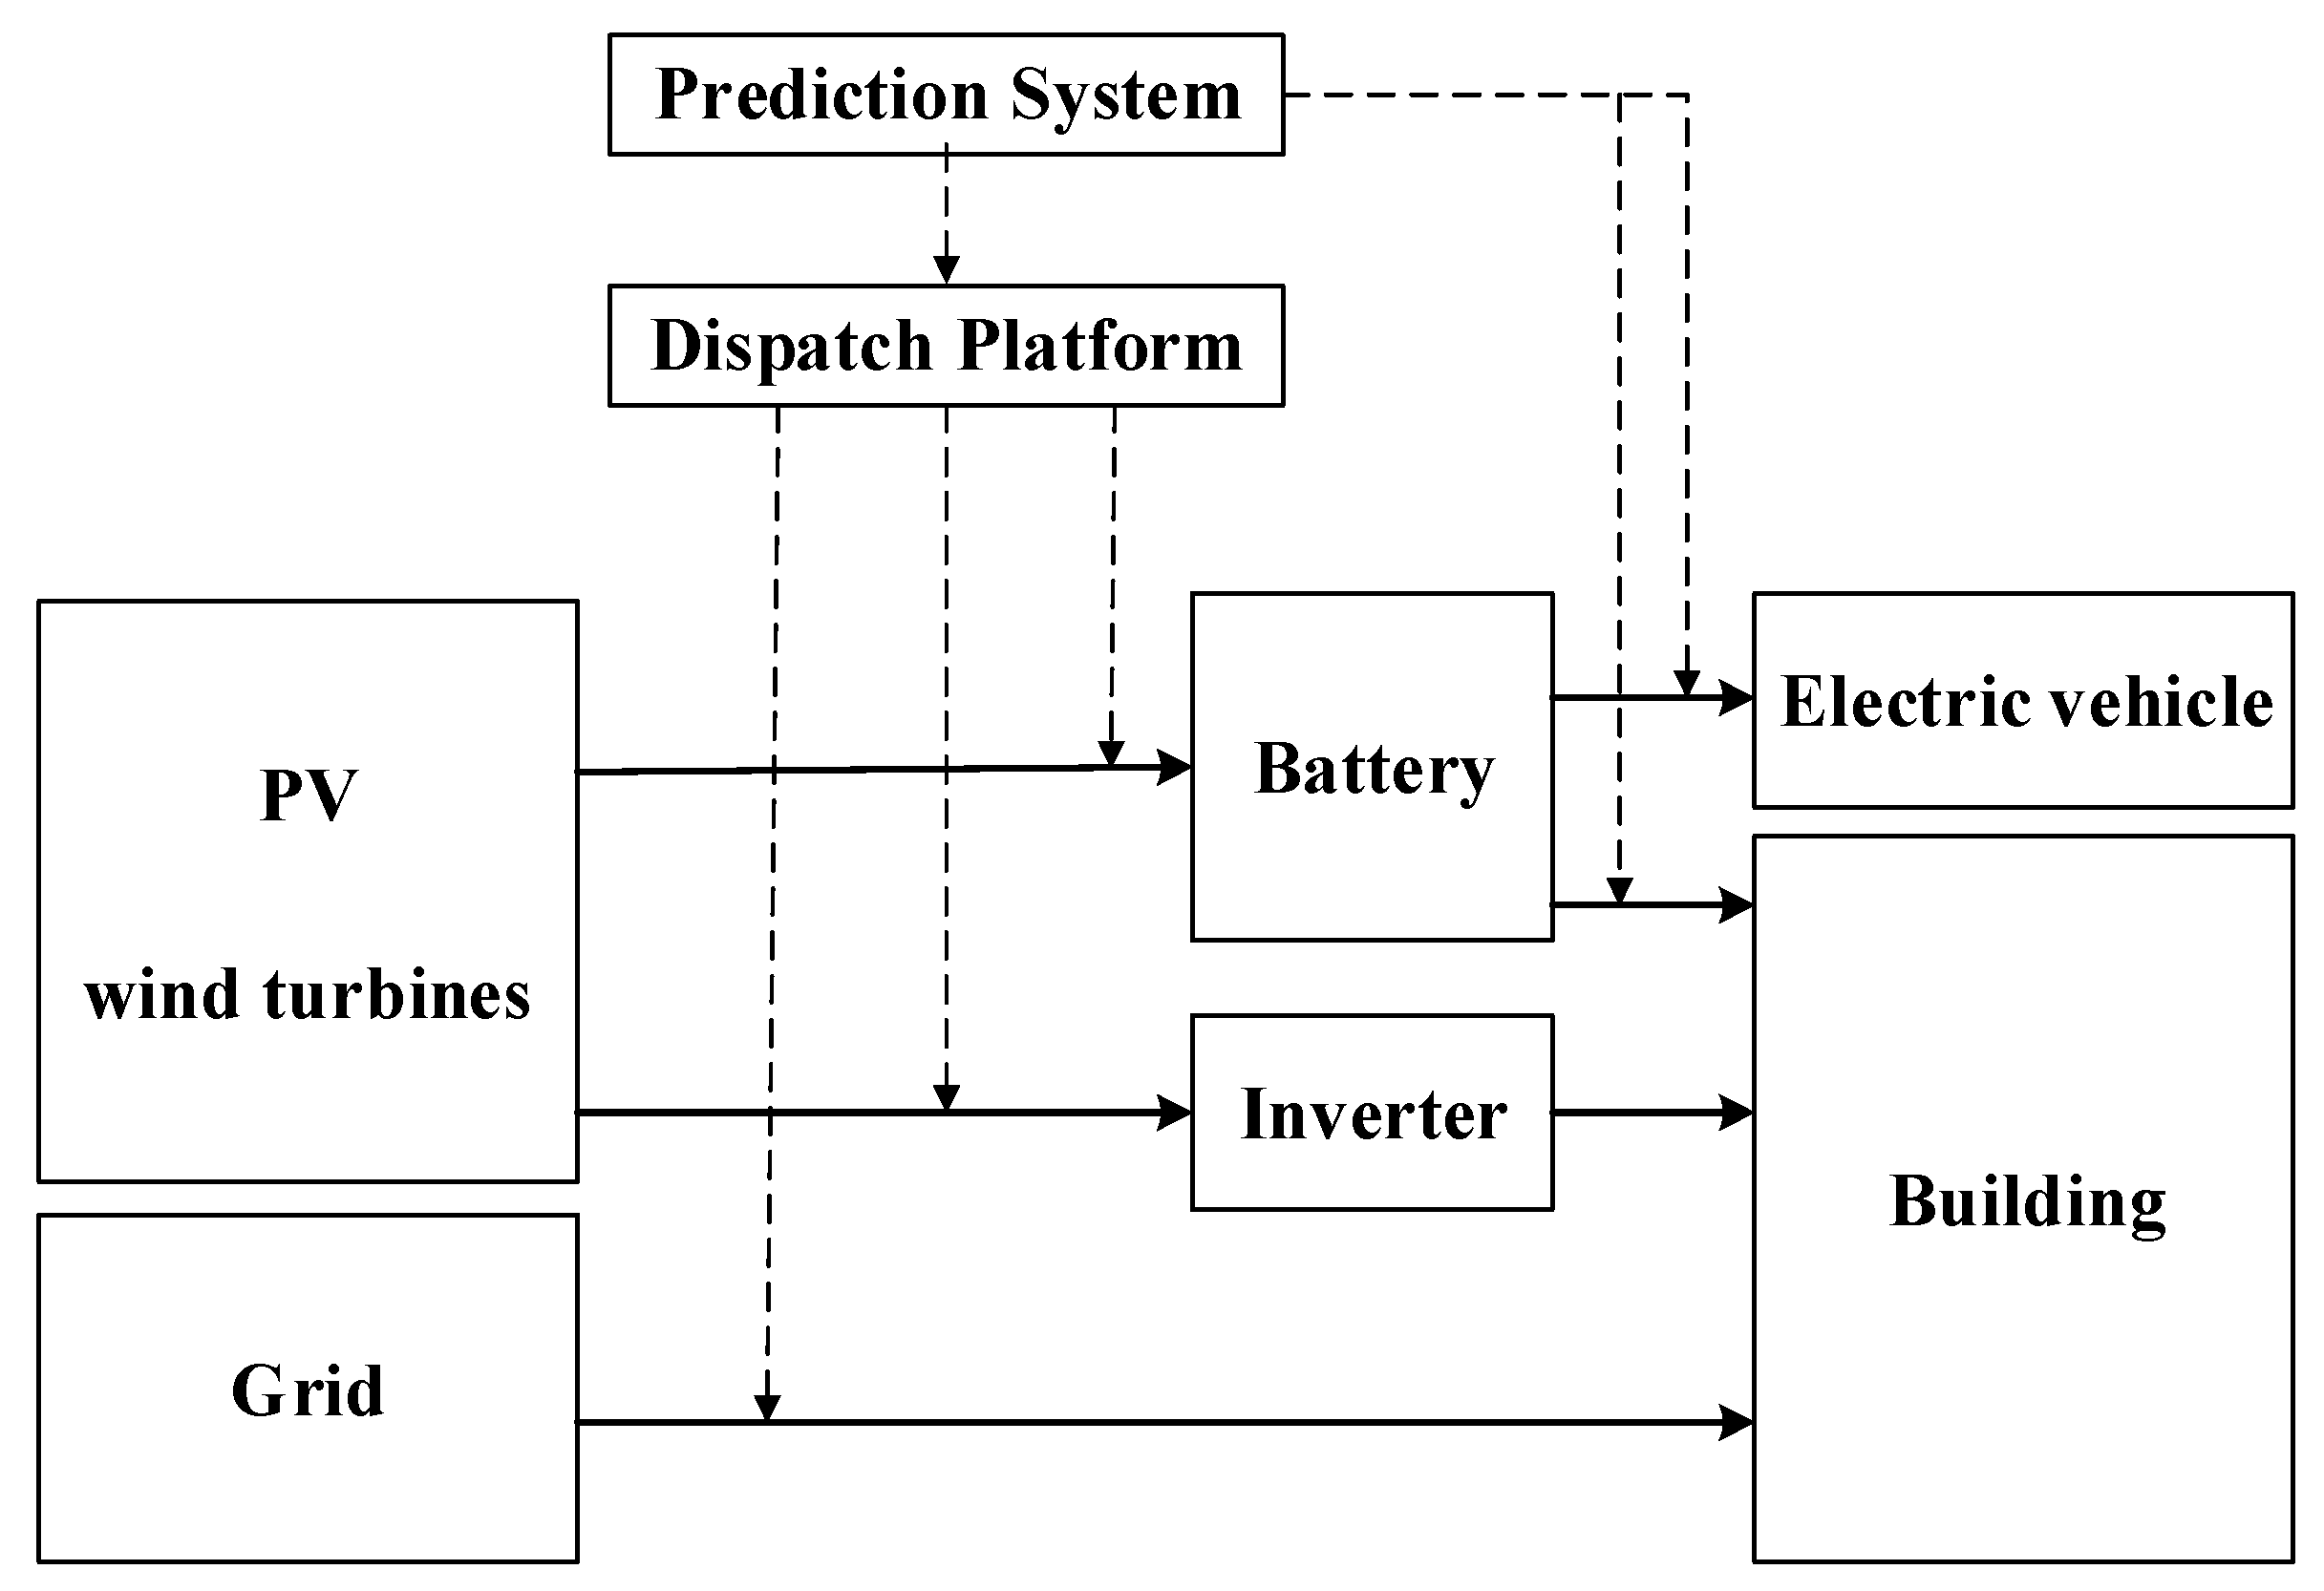
2.1. System Composition of the Building Renewable Energy System

As shown in Figure 1, the renewable energy system for residential buildings is mainly composed of the supply side, demand side, forecasting system and dispatching platform. The specific composition of the system is shown in Table 1. The building model was a three-story family residential building in Tianjin, China, and its total building area was 270 m2 (90 m2 per floor). Tianjin features a four-season, monsoon-influenced climate, typical of East Asia, with cold, windy, severe dry winters, and hot, humid summers. Passive design parameters such as building window–to–wall ratio, the envelope structure and seepage are designed through the Tianjin Residential Building Energy Efficiency Design Standards [24]. The air conditioning system operation time was from 18:00 p.m. to 08:00 a.m. on workdays, and 24 h at the weekend.

2.2. Renewable Energy System Model

The topology of the building renewable energy system in TRNSYS-MATLAB is shown in Figure 2. Correspondingly, equipment codes of building renewable energy systems in TRNSYS are listed in Table 2. Photovoltaic and wind turbine power generation, the forecast of system power consumption were performed in MATLAB. According to the operating strategy, 0 or 1 signal is generated and input into TRNSYS. For the specific mathematical model, details can be found in the TRNSYS instruction manual. It is noted that the on-off strategy of the air source heat pump was based on its time and temperature, where Type 14 in TRNSYS is used for time controlling and Type 14 in TRNSYS is used for temperature control. Transient systems simulation program (TRNSYS) is a simulation program primarily used in the fields of renewable energy engineering and building simulation. The TRNSYS library includes lots of the common components, which can found in thermal and electrical energy systems, as well as component routines to handle the input of weather data or other time-dependent forcing functions and output of simulation results [25,26].
The cooling and heating load of the building was furnished by the electric-driven air conditioner. The power consumption of the conditioner, domestic air blower and other household appliances was furnished by photovoltaics, wind power, batteries and the grid. The system operation date of the heating season and cooling season were from 15 November to 15 March, and 28 May to 9 September. According to the paper [27,28], the rated heating power of the selected unit was 6 kW, the inverter capacity was 12 kVA, and the battery capacity was 2000 Ah. The roof area of the building was 90 m2, but the installation area of the photovoltaic array should be 80 m2. Regarding the installation area of the wind turbine and the passage, the photovoltaic capacity was 7.2 kW, and the wind turbine capacity was 5 kW.

3. Virtual Energy Storage Model of Air Conditioning Load

The virtual energy storage (VES) is driven by air conditioners and buildings. When adjusting the objective temperature of air conditioners, the speed of the compressor of air conditioners will be changed, then the power consumption of air conditioners will be affected as well. It is noted that the air conditioner built in this paper adopted the fixed frequency model; namely, the cooling or heating capacity of air conditioners can be adjusted by turning on and off the compressor constantly. Meanwhile, due to heat reserving characteristics of the building thermal storage system, its temperature change has a certain lag compared with the transient power consumption of air conditioners. Therefore, the power consumption of the air conditioner can be changed by adjusting the set temperature of the air conditioner. The cooling capacity or heating capacity of the air conditioner can be stored in the building in a short time. In other words, on the premise of ensuring comfort, the air conditioning system is equivalent to the VES, which can realize the power grid load transfer function [29].
The thermodynamic process of building an energy system can be represented by a first-order equivalent thermal parameter model. The differential Equation (1) is shown as follows [30];
d T r ( t ) d t = Q ac ( t ) C + ( T out ( t ) T r ( t ) ) R C
where Tr(t) is indoor temperature, °C; Tout(t) is outdoor temperature, °C; Qac(t) is the cooling capacity of air conditioning system, W; R is building equivalent thermal resistance, °C/W; C is the equivalent heat capacity of the building, J/C.
The relationship between power consumption and cooling capacity of the air conditioner is shown below,
P ac = Q ac ( t ) η
where Pac(t) is the power consumption of the air conditioner, W; η is the thermoelectric conversion coefficient of the air conditioner.

3.1. The Principle of Virtual Energy Storage

During the refrigeration condition, when the building renewable energy system is in a steady-state, the cooling capacity of the air conditioning is equal to the heat transfer between the building and environment. When the setting temperature of air conditioning is changed, the system will change to the transient state, and Pac, Qac will change as well. The system will change to the steady-state until the heat is rebalanced.
In steady-state, the power consumption of air conditioners is calculated as follows;
P ac _ 0 ( t ) = Q s ( t ) η = T out ( t ) T r ( t ) η R
where Qs(t) is the heat transfer power capacity of the building.
In the transient state, the power consumption of air conditioners is calculated as follows;
P ac _ s ( t ) = { 0 , P rated , T set ( t ) > T r ( t ) T set ( t ) < T r ( t )
where Prated is the specified power of air conditioners; Tset is the setting temperature of air conditioners.
From the above analysis, it can be seen that when Tset increases, Pac decreases to zero under refrigeration condition, it can be equivalent to the discharge of VES. When Tset decreases, the air conditioner power increases from steady-state power to the rated power, it can be equivalent to the charge of VES.

3.2. The Characteristic Parameters of Virtual Energy Storage

When Tr increases or decreases from Tset0 to Tset, the system absorbs or emits heat, Q, it can be calculated as
Q = C ( T set T set 0 )
When Tr increases to the maximum temperature, Tmax, VES reaches the maximum discharge state. The remaining power is 0 at this time. The capacity of VES, E(t), and the rated capacity, EN, are calculated as
E ( t ) = C ( T max T r ( t ) ) η
E N = C ( T max T min ) η
When the air conditioner participates in the system regulation, power of VES, Pves, is equal to the difference between transient power and steady-state power
P ves ( t ) = P ac _ s ( t ) P ac _ 0 ( t )
According to Equations (3), (4) and (8), the power expression of VES can be obtained as follows;
P ves ( t ) = { T out ( t ) T r ( t ) η R , T set ( t ) > T r ( t ) P rated T out ( t ) T r ( t ) η R , T set ( t ) < T r ( t )

3.3. Charge and Discharge Constraints in Virtual Energy Storage

When adjusting the temperature of the air conditioning, thermal comfort for the human body will be affected, and the most important influencing factor is the indoor temperature [20]. According to The Air Conditioning Design Standard of Buildings in China, the most comfortable temperature of the human body is 24–28 °C in summer, and 18–22 °C in winter. In addition, the influence of the outdoor temperature should be considered. When the outdoor temperature is lower than 24 °C in summer or higher than 22 °C in winter, the setting temperature of air conditioners should not be adjusted. In other cases, the setting temperature of air conditioners will be adjusted as follows:
In the summer,
{ 24 < T set ( t ) < T out ( t ) , 24 < T set ( t ) < 28 , 24 < T out ( t ) < 28 T out ( t ) > 28
In the winter,
{ 18 < T set ( t ) < 22 , 18 < T set ( t ) < T out ( t ) , T out ( t ) < 18 18 < T out ( t ) < 22

4. Operational Strategy and Evaluation Indicators of the System

4.1. Basic Energy Balance Model of the Building Energy System

The foundation of the stable operation in the building energy system is maintaining the balance between energy supply and demand in the system [31,32]. The relationship between the system energy supply and demand side is shown in Equation (12).
G pv + G wind + G grid + W bat = L bldg + L EV + D dump
Gpv is the amount of photovoltaic power generation, Gwind is the amount of wind turbine power generation, Ggrid is the amount of electricity purchased from the grid, Wbat is the amount of electricity charged or discharged from the battery, Lbldg is the power consumption of the building, such as air source heat pumps, domestic air blowers and other households electrical appliances power consumption; LEV is the amount of electricity charged into the rechargeable battery of electric vehicles, and Ddump is the excess waste electricity generated by photovoltaic and wind turbine.

4.2. Control Strategy of the Building Energy System

4.2.1. Basic Control Strategy

Considering the peak and valley electricity prices, the system power supply approach was adjusted by judging the relationship between the predicted values of photovoltaic, wind turbine power generation Gren, pre and the predicted value of building load power consumption Lbldg, pre. The specific control strategy is shown in Table 3.

4.2.2. Control Strategies of the Virtual Energy Storage Based on Air Source Heat Pump

The virtual energy storage system of the air conditioning load is greatly affected by the differences of indoor and outdoor temperature. The stored energy must be released as soon as possible to avoid energy dissipation and low utilization efficiency. Therefore, two control strategies of the virtual energy storage system were designed as follows:
(1)
Advance charging strategy: according to the power generation and load forecasting curve, if Gren, pre > Lbldg, pre, before the peak of the load, the set temperature should be decreased; when the load is in the trough, if Gren, pre < Lbldg, pre, the set temperature should be decreased, then the virtual energy storage system is charged.
(2)
Early discharge strategy: Based on the power generation and load forecasting curve, if Gren, pre < Lbldg, pre at the peak load, the set temperature should be increased; if Gren, pre < Lbldg, pre before the loading trough, the set temperature should be increased as well, then the virtual energy storage system is discharged.

4.3. Matching Characteristic Parameter of the Building Energy System

This paper focused on analyzing the matching performance of renewable energy systems between energy supply and demand, then considered energy conversion, energy storage as well as one-way grid connection. In order to facilitate the quantitative study of the energy supply–demand matching relationship, two basic parameters for investigation were set: on-site energy fraction (OEF) in Equation (13) and on-site energy matching (OEM) in Equation (14), details can be founded in [23].
OEF = i = t 1 t 2 Min [ G ( i ) ; L ( i ) ] Δ t i = t 1 t 2 L ( i ) Δ t ; 0 OEF 1
OEM = i = t 1 t 2 Min [ G ( i ) ; L ( i ) ] Δ t i = t 1 t 2 G ( i ) Δ t ; 0 OEM 1
G(i) is the power generation capacity of this site, L(i) is the capacity of load, Δ t is the time step, t1 is the starting time and t2 is the ending time. Considering the renewable energy system and its operating strategy in this paper, combining the energy balance equation above with the basic evaluation index of load matching, the modified indexes of load matching were modified below:
OE F r = i = t 1 t 2 Min [ G ( i ) D ( i ) ; L ( i ) ] Δ t i = t 1 t 2 L ( i ) Δ t ; 0 OE F r 1
OE M r = i = t 1 t 2 Min [ G ( i ) D ( i ) ; L ( i ) ] Δ t i = t 1 t 2 G ( i ) Δ t ; 0 OE M r 1
where D(i) is the amount of the abandoned renewable electricity generation.

4.4. Predictive Model of Building Load and Energy Production

Various factors might influence building load. Most renewable energies also have nonlinear relationships, such as photovoltaic and wind turbine power generation. The artificial neural network has the ability to express arbitrary nonlinear mapping and model nonlinear systems [33]. The photovoltaic power generation forecasting model and wind power generation forecasting model based on the paper [32] were used in this paper. Power consumption of the building was forecast in TRNSYS.

5. Results and Discussion

5.1. The Analysis of the Building Energy Renewable Energy System

The power consumption of buildings mainly includes the power consumption of air conditioners, air blowers and other home appliances, as well as electric vehicle charging power consumption. The consumption of home appliances is based on realtime usage statistics of typical household appliances in China. As shown in Figure 3, the time period of the building power consumption covers 8760 h, which could be obtained through TRNSYS simulation calculations. Obviously, the generating power of the building renewable energy system was 21,973 kWh and consisted of PV and wind turbines, which was less than the consumption power of the building, which was 25,830 kWh. The difference between consumption and supply was 3857 kWh per year; the power consumption of the air conditioner of the building was 11,937 kWh per year and accounted for 46% of the total power consumption of the building, which was the largest part.

5.2. The Analysis of Matching Performance of the Building Renewable Energy System by VES

Based on the control strategy of the virtual storage system, the power consumption feature of the building energy system, the power consumption of the air conditioning and its thermoelectric conversion coefficient (namely, coefficient of performance; COP), the equivalent heat capacity of the building was calculated as 10,589 kJ/C in this paper. When the accepted thermal comfort temperature range of the human body is 4 °C, the thermoelectric conversion coefficient of the air conditioning is assumed to be 3, the rated capacity of the virtual storage device in building energy systems was about 14,118 kJ, namely, 3.92 kWh.
In detail, due to the instability of renewable energy and the increasing requirements of matching accuracy, this paper used the hour as the time scale, based on the control strategy of the virtual energy storage of the air conditioning load, simulating the building’s renewable energy system (see below). Compared with the situation of before and after VES, a typical summer day was selected for analyzing the matching of power generation, power consumption, OEFr and OEMr, as shown in Figure 4, Figure 5, Figure 6 and Figure 7.
Comparing the typical daily power consumption before and after using the virtual energy storage control strategy in Figure 4; Figure 5, the system power generation and consumption curve trends were closer after the regulation. It was found that, when VES came into play, the supply side power generation in the building energy system kept constant, the demand side power consumption in the building energy system changed. For example, on the one hand, the difference between power generation and power consumption before VES was very large, such as at 1 a.m., 5 a.m., 7 a.m., 10 a.m., 12 a.m., 14 p.m., 16 p.m., 17 p.m. and 23 p.m. Further, the difference between power generation and power consumption before VES at 7 a.m. was 6.2 kWh (6.9 kWh − 0.4 kWh, as shown in Figure 4). However, when adopting VES, the difference at 7 a.m. was only 0.5 kWh (1.6 kWh − 1.1 kWh, as shown in Figure 5). Similarly, due to the application of VES, the differences at 1 a.m., 5 a.m., 7 a.m., 10 a.m., 12 a.m., 16 p.m., 17 p.m. and 23 p.m. were changed very little.
Taking the value of power generation and power consumption at 10 a.m. as an example, it can be seen from Figure 5 that power generation was larger than that of power consumption. Therefore, based on the operation strategy of VES driven by the air conditioning load, the setting temperature of the air conditioner was adjusted to be lower before 10 a.m., then more power consumption would be formed. In other words, it could be equivalent to the charging mode of VES. On the contrary, power generation was less than that of power consumption at 20 p.m. Therefore, the setting temperature of the air conditioners was adjusted to be larger before 2 p.m.; namely, the VES was working at the discharge state.
To quantify the change in matching characteristics between power generation and power consumption due to the function of VES, which is shown in Figure 6; Figure 7, OEFr and OEMr are used in Figure 5; Figure 7. From OEFr and OEMr, it can be seen that most of the values after VES were better than that before VES. For example, as shown in Figure 6, OEFr after VES at 8 a.m. was 0.73, which was greater than before VES value 0.61; OEFr after VES at 19 p.m. was 0.75, which was greater than before VES value 0.60. On the other hand, as shown in Figure 7, OEMr after VES at 6 a.m. was 0.99, which was greater than before VES value 0.90; OEMr after VES at 14 p.m. was 0.62, which was greater than before VES value 0.57. On the whole, from Figure 7 and Figure 8, the average values of OEFr and OEMr after VES were 0.66 and 0.77, while before VES values were 0.61(OEFr) and 0.71(OEMr). Namely, compared with OEFr and OEMr values before VES, after VES values were increased by 8.19% and 8.45%. In other words, a better matching characteristic performance of the air conditioning load building energy systems driven by VES was obtained.

5.3. The Influence of VES on the Operation Characteristic of Batteries

In the building energy system of this paper, the times of charge and discharge, as well as the depth of discharge (DOD) of the battery, were affected by the system power generation and its consumption. Further, the deeper the degree of the discharge, as well as the more times charge or discharge occured, the shorter life span the battery will have. Hence, after improving the relationship between power generation and consumption of the building energy system, the life span of the batteries was increased, which could reduce the operation cost of the building energy system.
Take the typical day in summer as an example, as shown in Figure 8, the charge and discharge conditions of the batteries before and after using the virtual energy storage strategy was revealed. It can be seen that, neglecting the tiny charge and discharge states of the battery, the times of charge and discharge cycles before and after VES were 11 and 7 respectively.
The depth of discharge (DOD) is calculated by using the following Equation;
D O D = Q 1 × 1000 U × E 1
In the Equation, Q1 is the total discharge of the battery in a whole day (kW∙h); U is the voltage (V); E1 is the battery capacity (Ah).
It can be calculated that the value of DOD before VES was 51.50%, and after VES value was 28.13%. Compared with the before and after regulation, the discharge depth of the battery on the specific day was reduced by 23.37%, therefore, both the battery life and the system economy were improved.

6. Conclusions

With an air conditioning load virtual energy storage system, a building renewable energy system was built in the paper, which could obtain a high matching characteristic of the demand and supply side. In addition, to quantize the contribution of virtual energy storage to the improvement of matching characteristics, on-site energy fraction and on-site energy matching indicators of the renewable energy system were adopted. Then, based on the virtual energy storage of the air conditioning load, the theoretical model of the building renewable energy system was established and analyzed with the help of TRNSYS and MATLAB in Tianjin, China. Several results and conclusions were formed, as follows:
(1)
From the demand side, due to their huge power consumption, rapid response and the short-term heat reserve capacity, the air conditioning load and its system can be equivalent to the virtual energy storage device of the building renewable energy system.
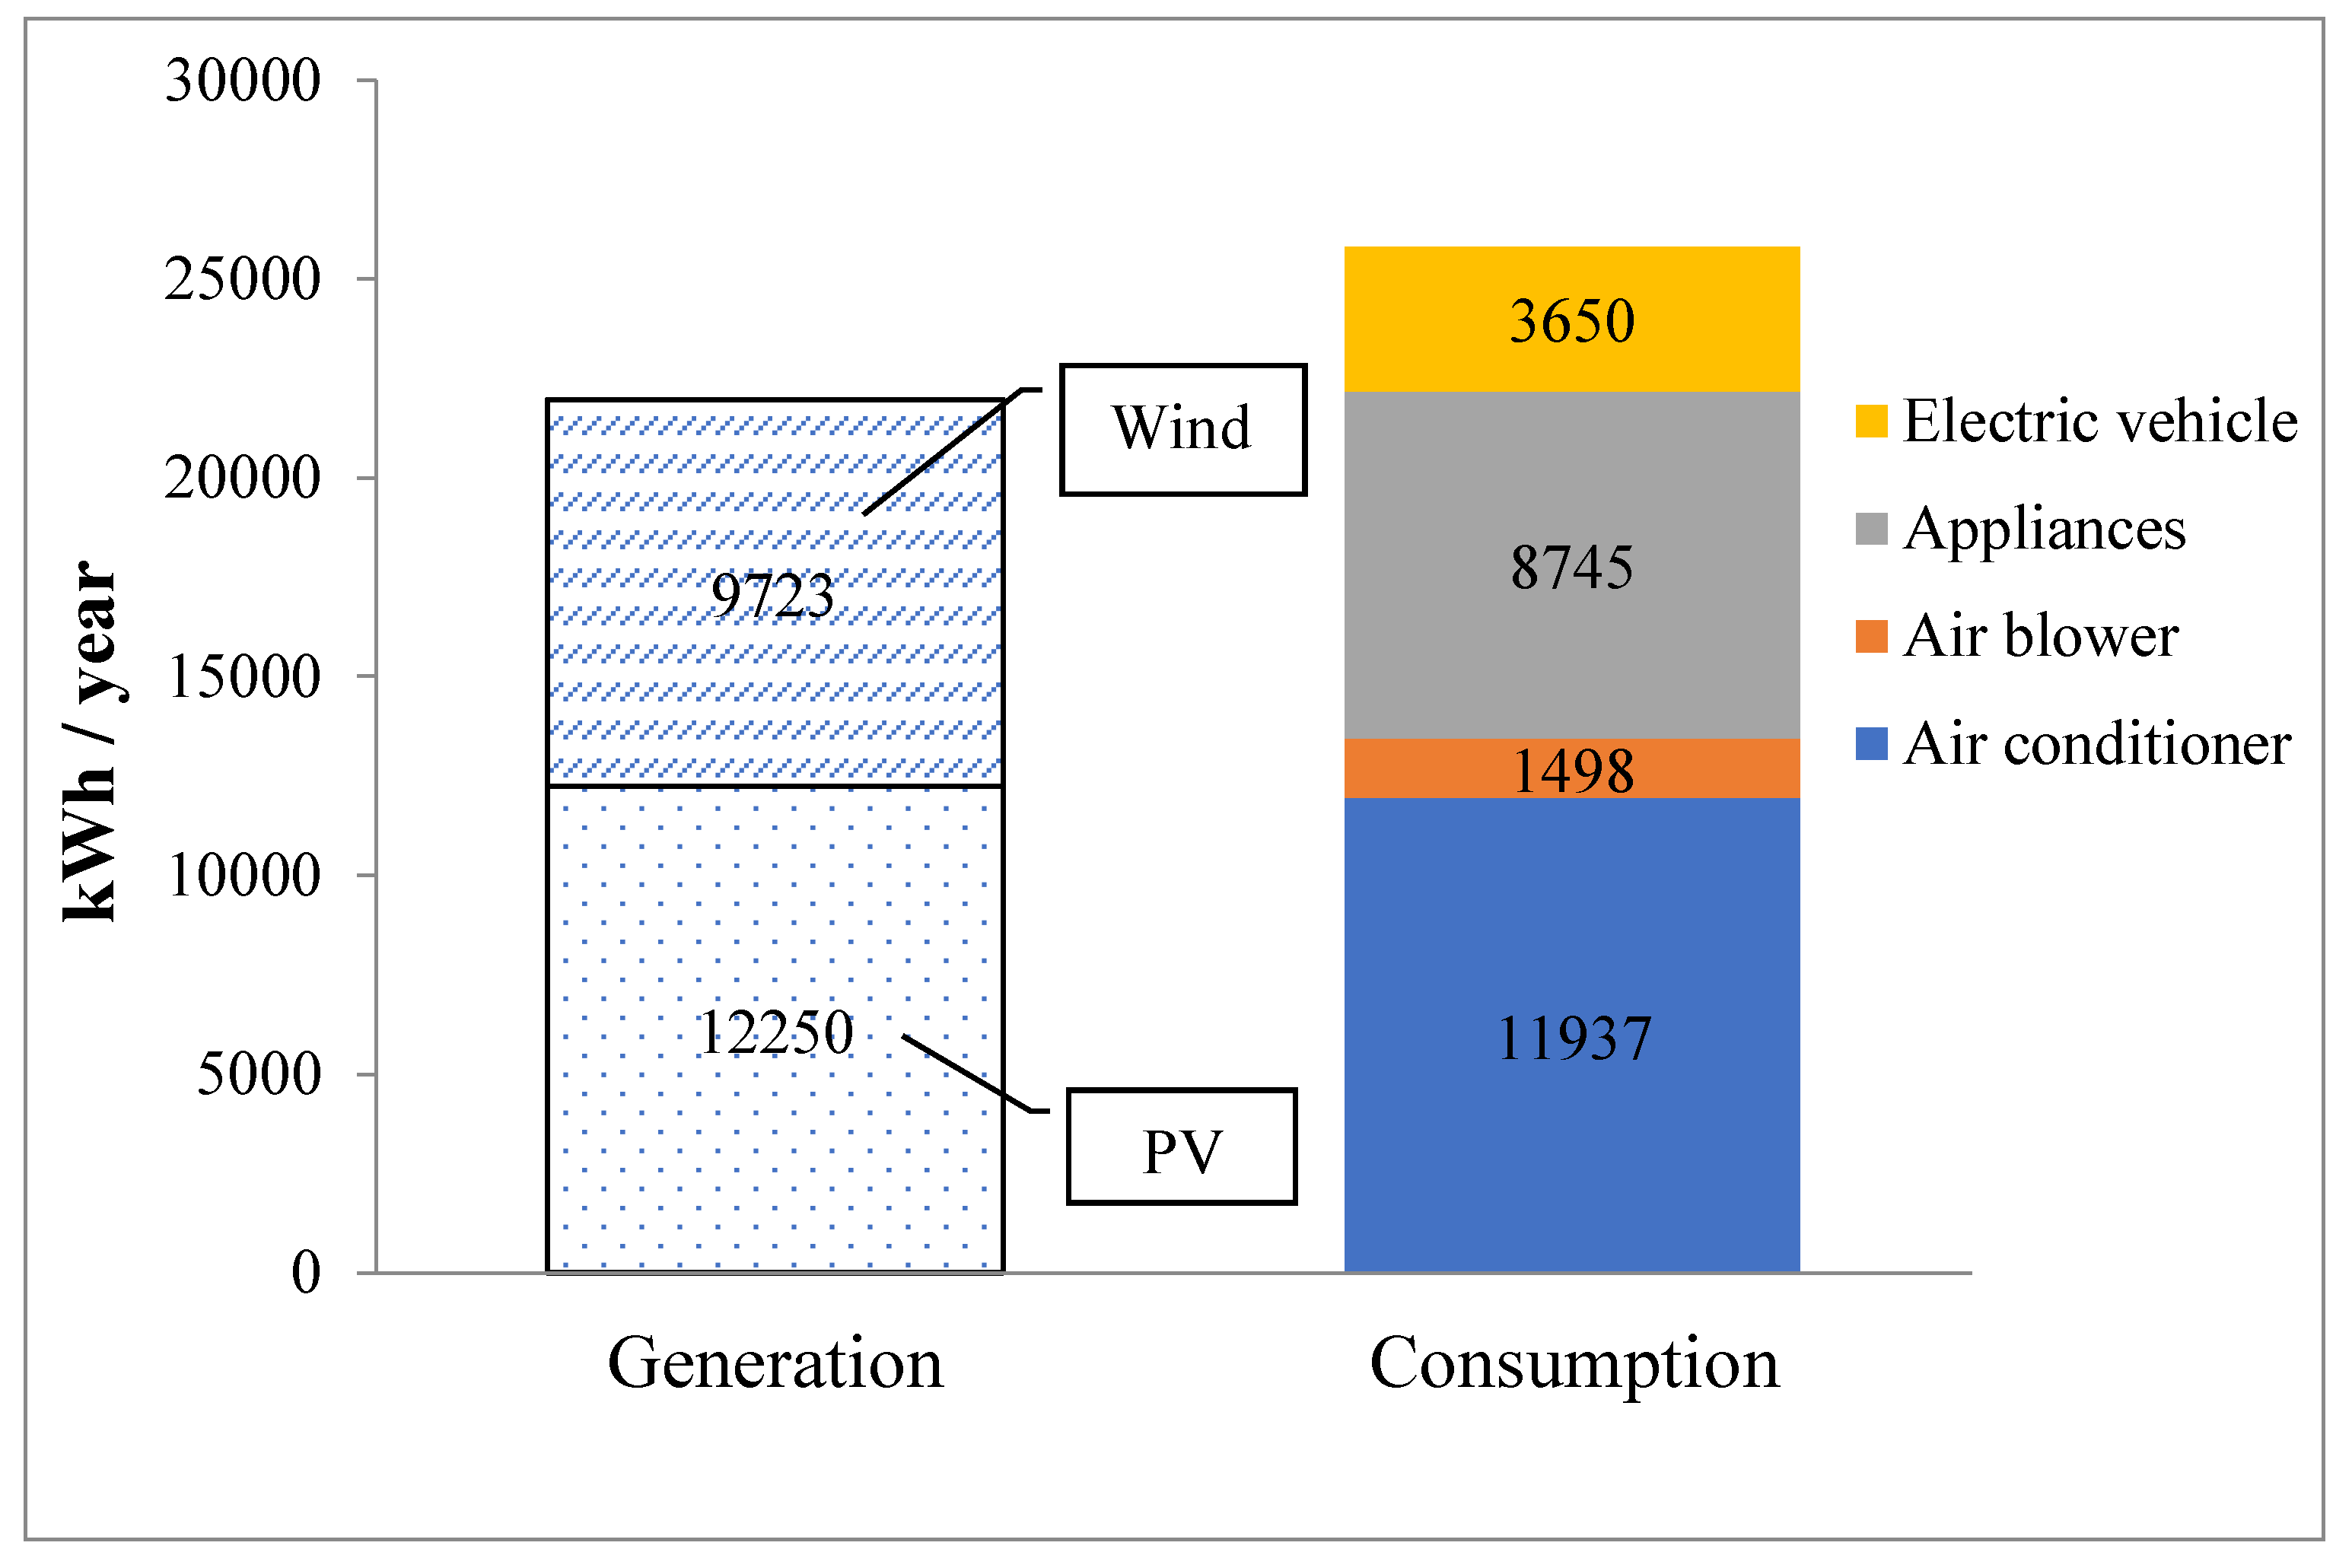
(2)
There is a potential for improving the matching characteristics of the building renewable energy system for the case of Tianjin, China. In other words, the generating power was 21,973 kWh, consisting of PV and wind turbines, which was less than the consumption power of the building (25,830 kWh).
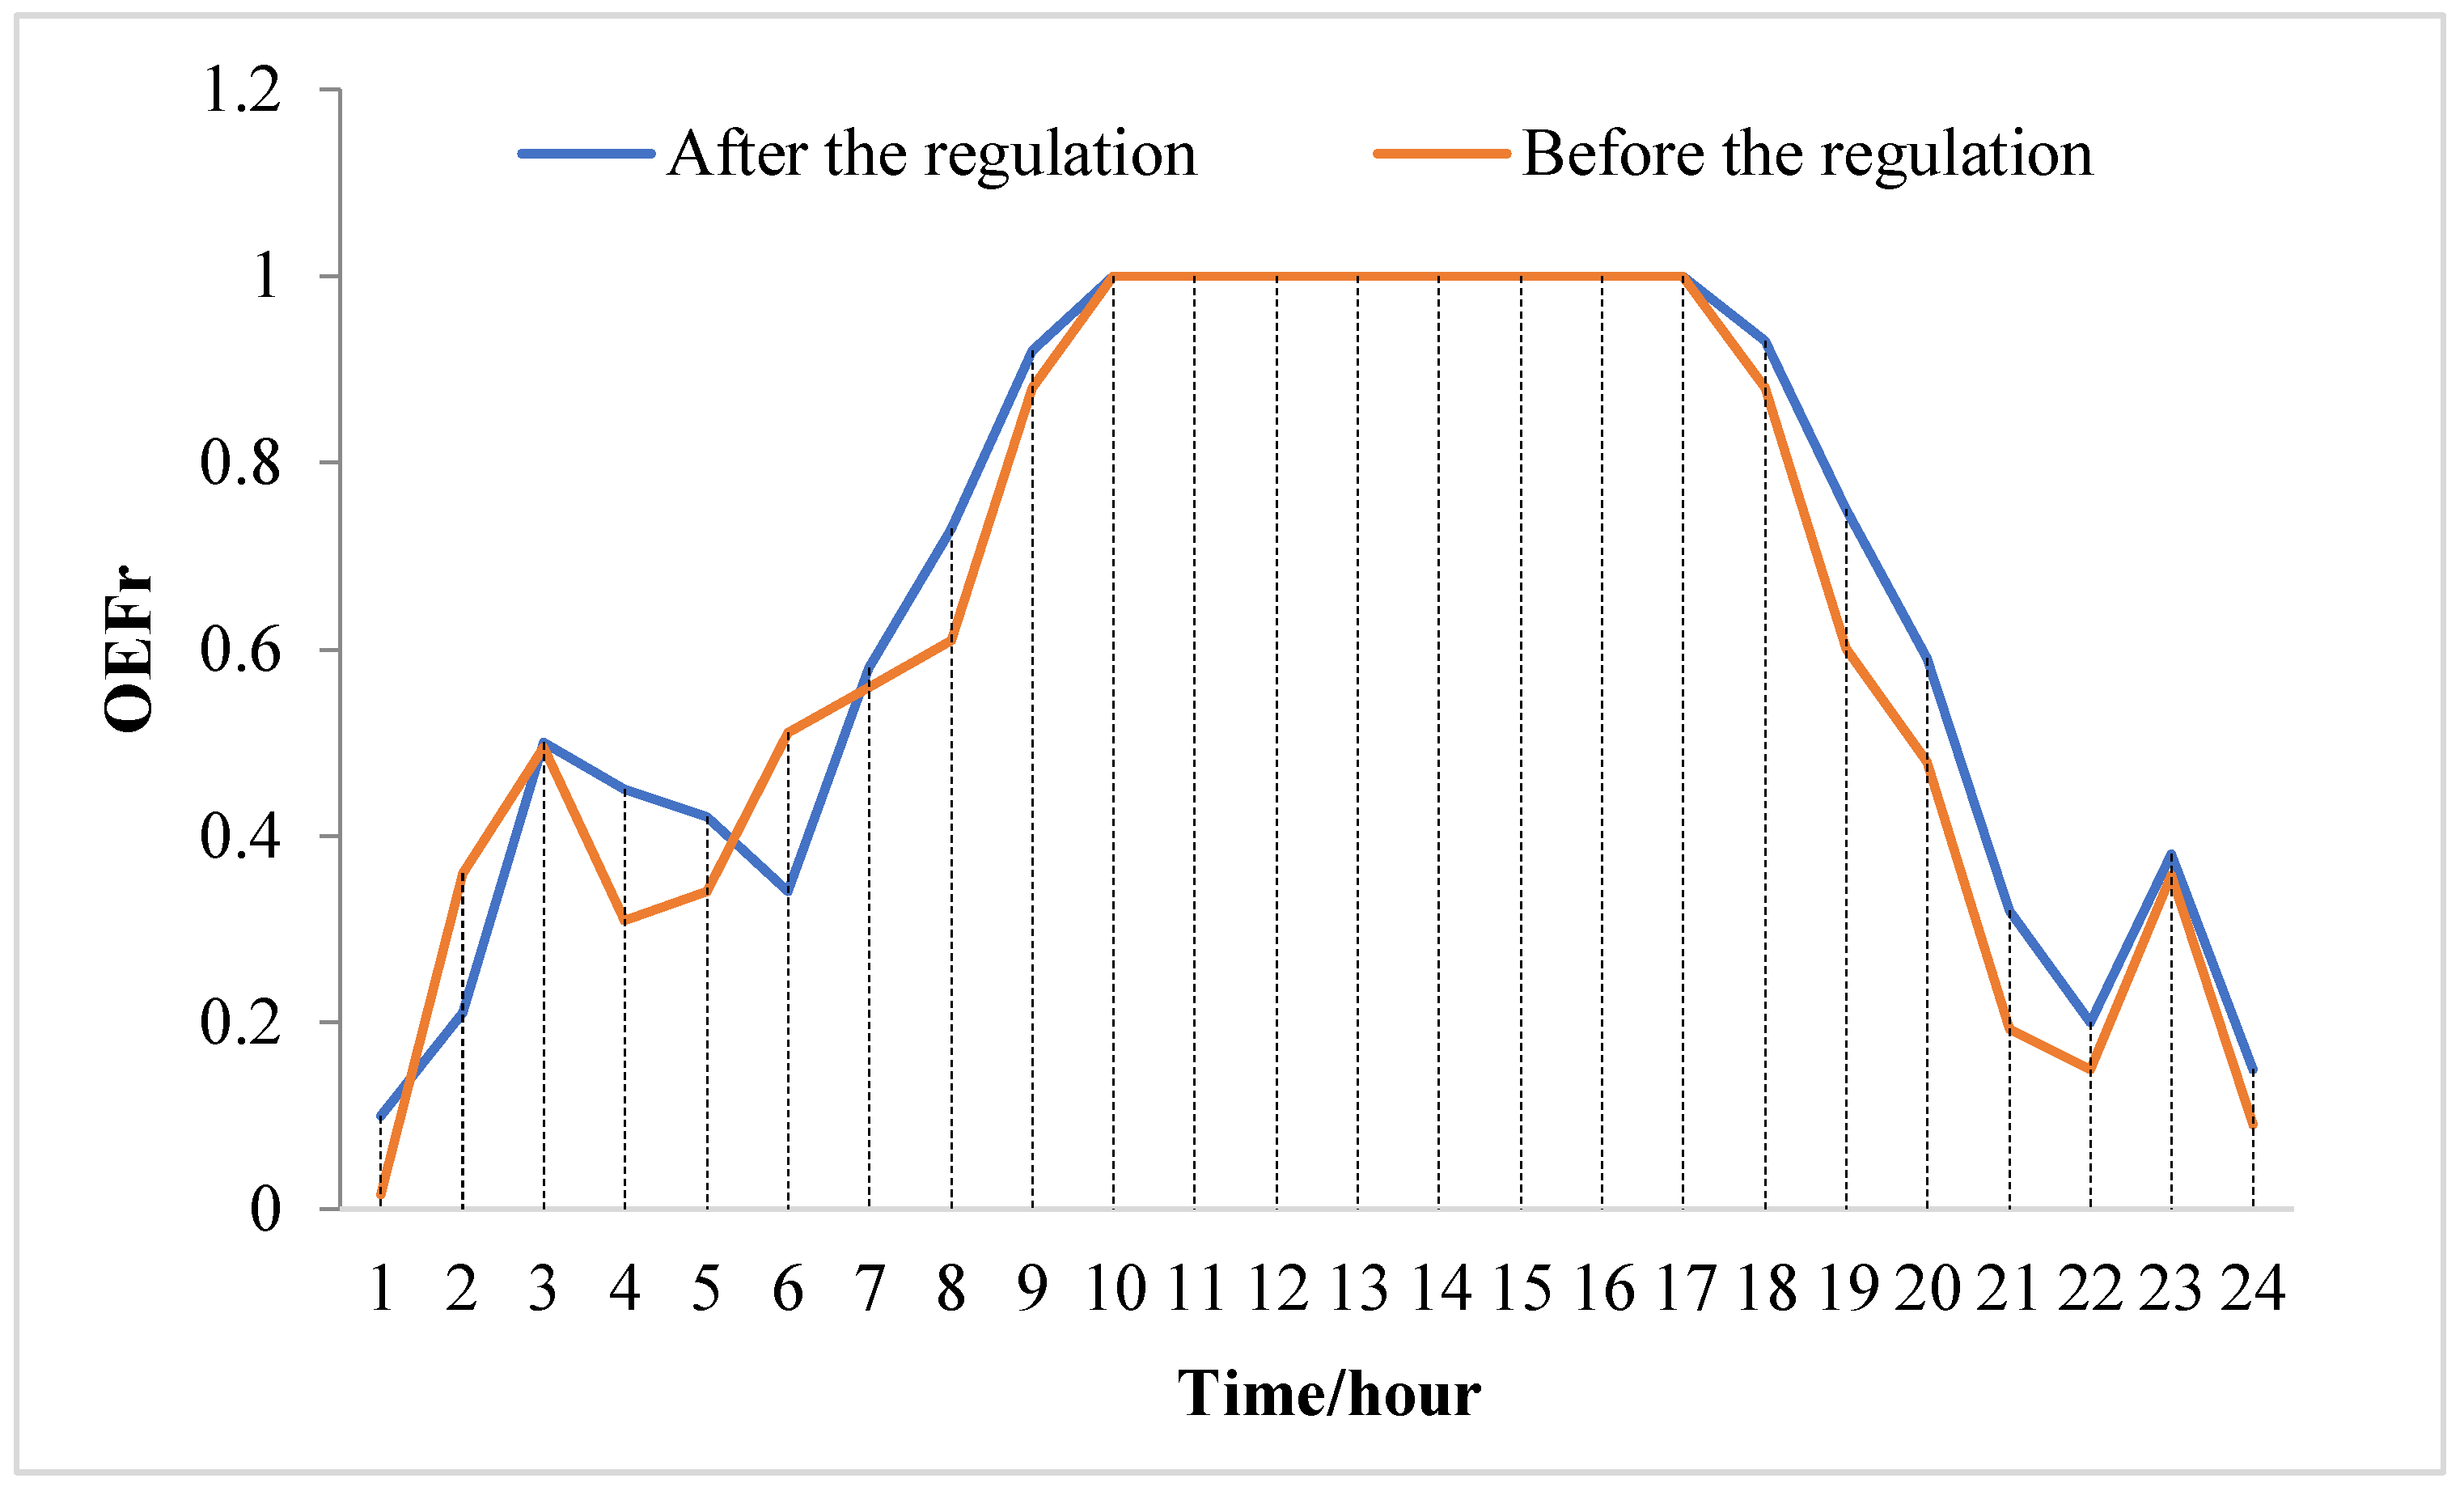
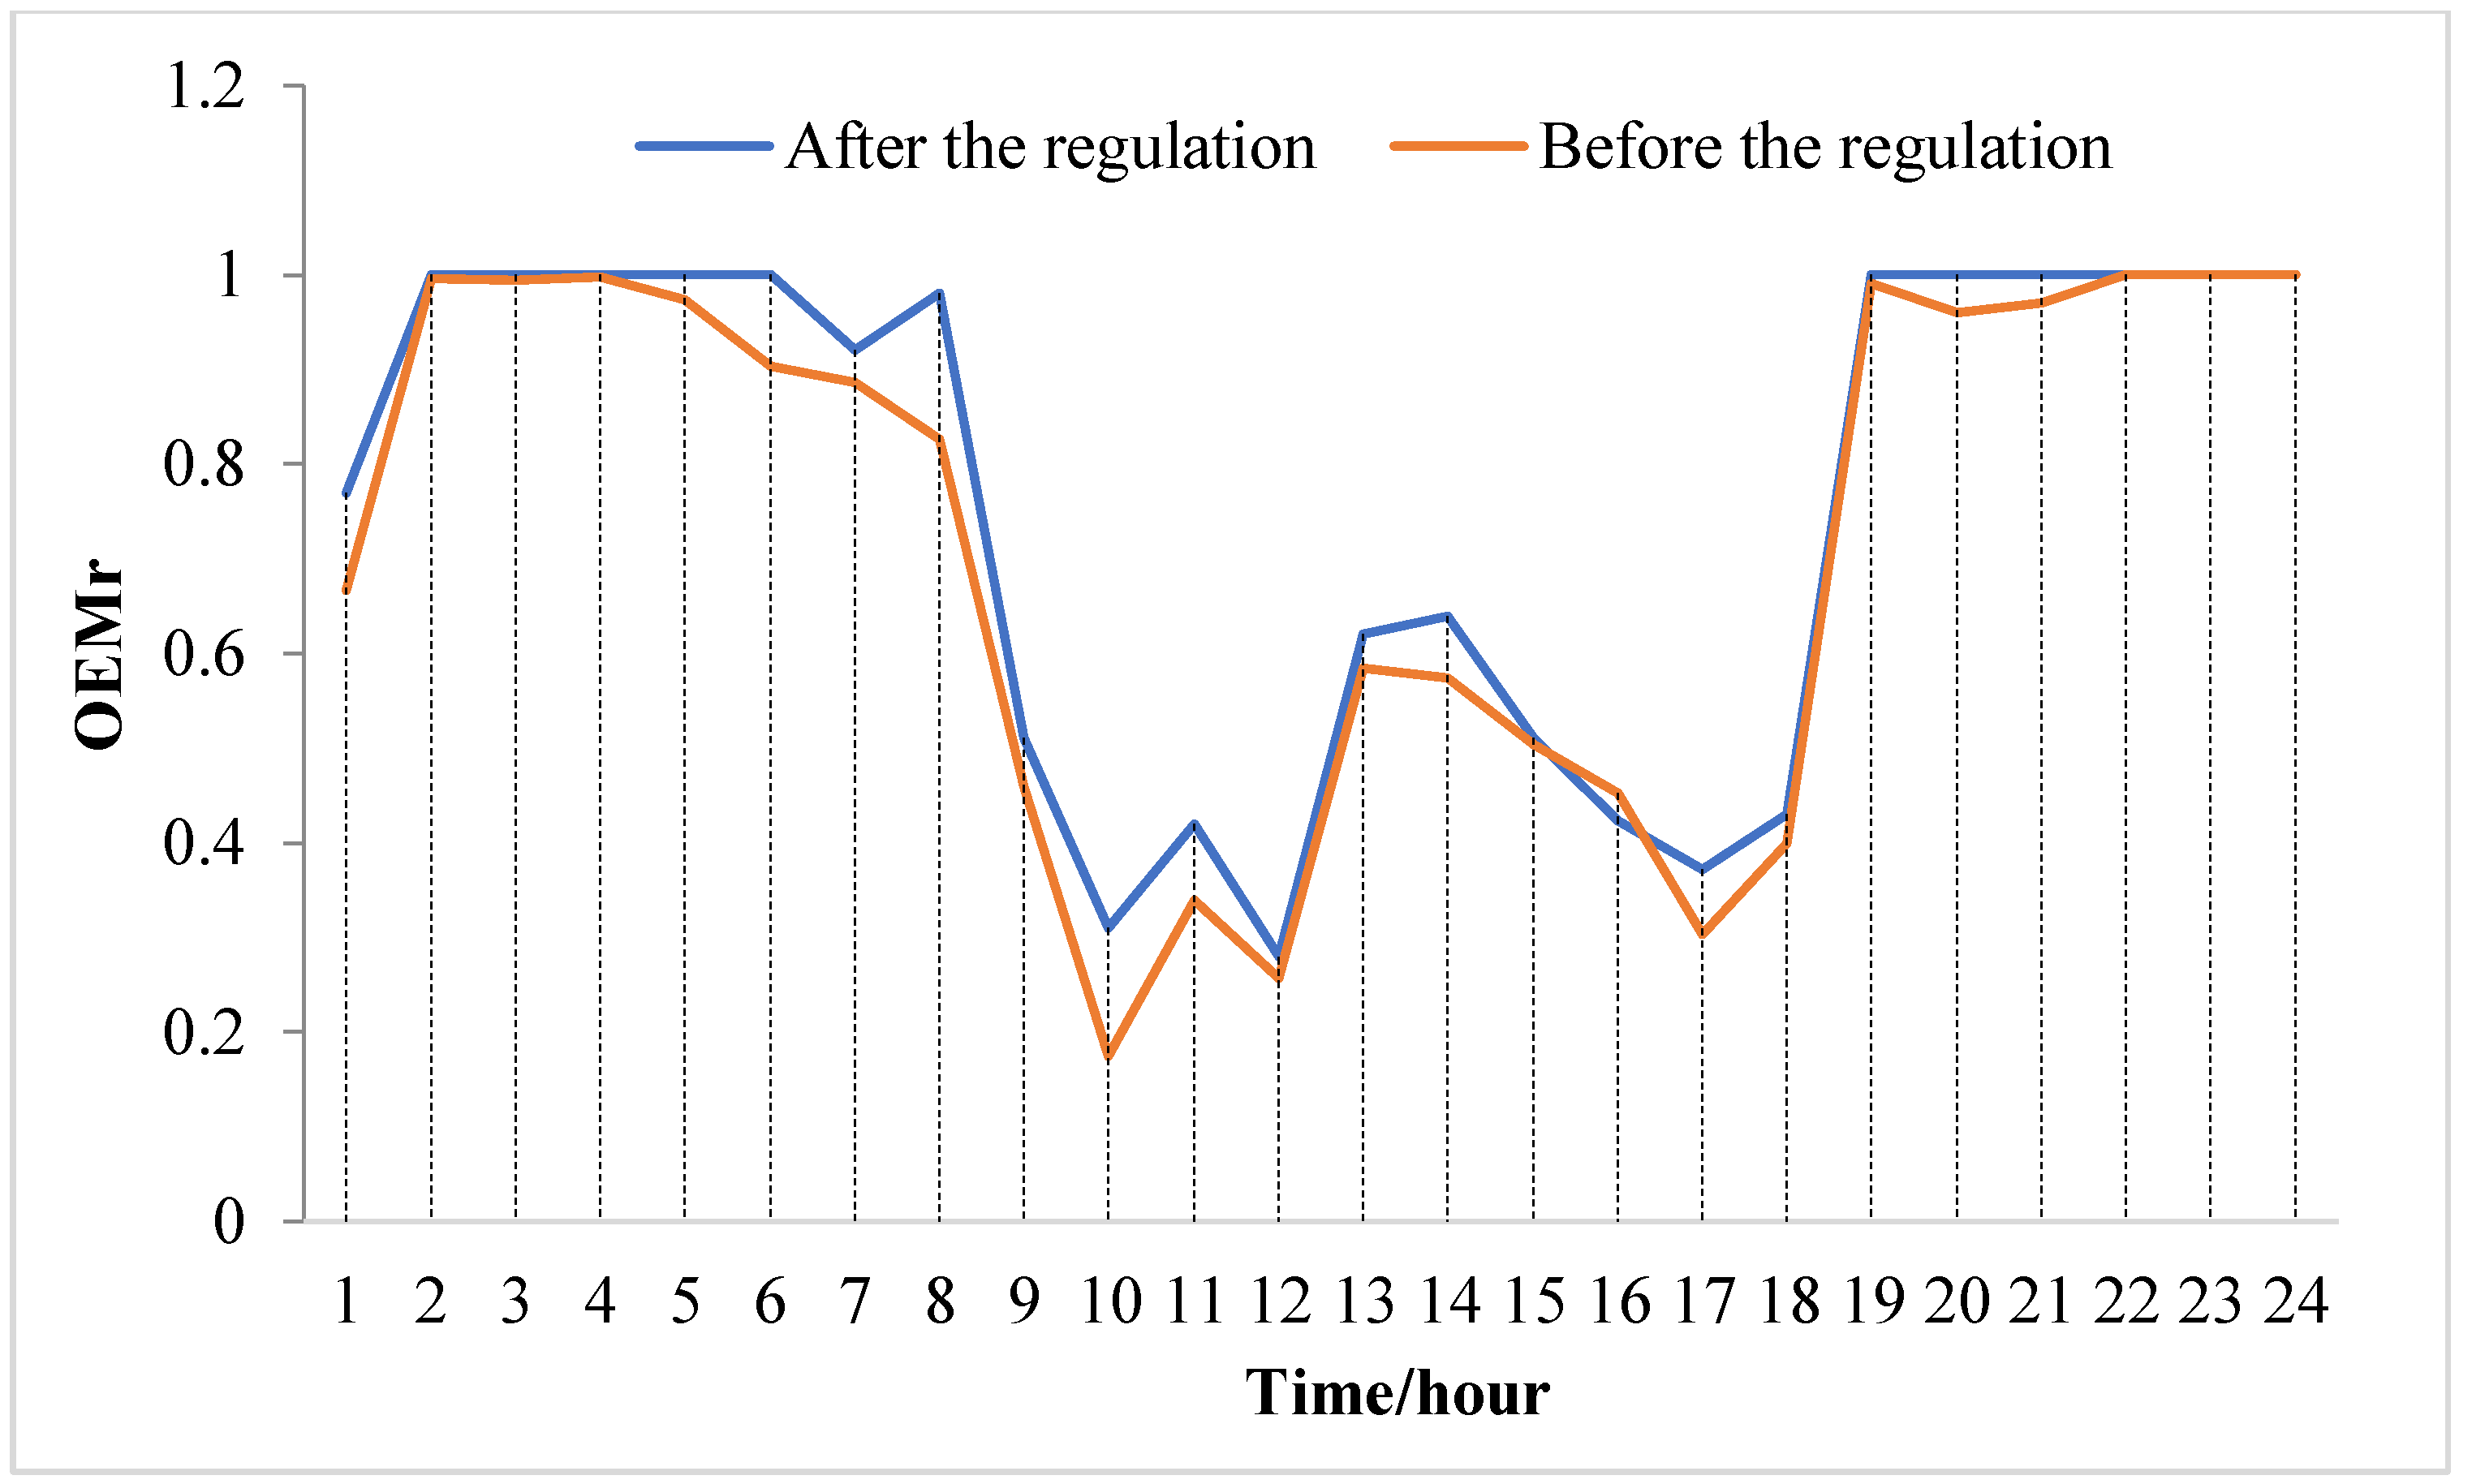
(3)
A better matching characteristic performance of building energy systems driven by VES was obtained. Under the condition of the paper, the average after VES values of OEFr and OEMr were 0.66 and 0.77, while before VES values were 0.61(OEFr) and 0.71(OEMr). Namely, compared with OEFr and OEMr values before VES, after VES values were increased by 8.19% and 8.45%.
(4)
The battery operation performance in the building renewable system was improved when VES was working. The times of charge and discharge cycles decreased after VES, and the depth of discharge of the battery was reduced by 23.37% on the specific day.

Author Contributions

Conceptualization, L.K. and Y.W.; methodology, Y.W.; software, Y.W.; validation, Y.W., C.H. and B.W.; investigation, resources and data curation, J.Z., P.S., and Z.Z.; writing—original draft preparation, Y.W. and L.K.; writing—review and editing, Y.W., J.Z. and L.K. All authors have read and agreed to the published version of the manuscript.

Funding

This research was funded by China Postdoctoral Science Foundation, grant number 2019M660634; China National Key R&D Plan in Transformative Technologies, grant number 2018YFA070220 and Natural Science Foundation of Hebei Province, grant number E2019208191.

Conflicts of Interest

The authors declare no conflict of interest.

Nomenclature

Ddumpthe excess waste electricity generated by photovoltaic and wind turbine, kW·h
D(i)the amount of abandoned renewable energy electricity generation, kW·h
E1the battery capacity, Ah
Ggridthe amount of electricity purchased from the grid, kW·h
G(i)the power generation capacity of this site, kW·h
Gpvthe amount of photovoltaic power generation, kW
Gwindthe amount of wind turbine power generation, kW
Lbldgthe power consumption of the building, kW·h
LEVthe amount of electricity charged into the battery of electric vehicles, kW·h
L(i)the capacity of load, kW·h
Q1the total discharge of the battery in a whole day, kW·h
t1the starting time
t2the ending time
Δ tthe time step, hour
Uthe voltage, V
Wbatthe amount of electricity charged or discharged from the battery, kW·h
OEFron-site energy fraction
OEMron-site energy matching

References

  1. Cabeza, L.F.; Ürge-Vorsatz, D.; McNeil, M.A.; Barreneche, C.; Serrano, S. Investigating greenhouse challenge from growing trends of electricity consumption through home appliances in buildings. Renew. Sustain. Energy Rev. 2014, 36, 188–193. [Google Scholar] [CrossRef]
  2. Xu, Y.; Chen, H.; Liu, J.; Tan, C. Performance analysis on an integrated system of compressed air energy storage and electricity production with wind-solar complementary method. Proc. CSEE 2012, 32, 88–95. [Google Scholar]
  3. Kelly, N.A.; Gibson, T.L. Improved photovoltaic energy output for cloudy conditions with a solar tracking system. Sol. Energy 2009, 83, 2092–2102. [Google Scholar] [CrossRef]
  4. Quinn, S.W. Energy gleaning for extracting additional energy and improving the efficiency of 2-axis time-position tracking photovoltaic arrays under variably cloudy skies. Sol. Energy 2017, 148, 25–35. [Google Scholar] [CrossRef]
  5. Furkan, E. Fisheye lens design for sun tracking cameras and photovoltaic energy systems. J. Photon. Energy 2018. [Google Scholar] [CrossRef]
  6. David, G.; Dominik, M. Curtailing Renewable Feed-In Peaks and Its Impact on Power Grid Extensions in Germany for the Year 2030. Adv. Energy Syst. Optim. 2017. [Google Scholar] [CrossRef]
  7. Yang, J.; Shi, K.; Cui, X.Q.; Gao, C. Peak load reduction method of inverter air-conditioning group under demand response. Autom. Electr. Power Syst. 2018, 42, 44–52. [Google Scholar]
  8. Ai, Z.; Li, T.Y.; Song, C.C. Key Technologies Research of Load Regulation of Central Air-Conditioning Based on the Demand Response. Adv. Mater. Res. 2012, 614, 707–711. [Google Scholar] [CrossRef]
  9. Kiliccote, S.; Sporborg, P.; Sheikh, I.; Huffaker, E.; Piette, M.A. Integrating Renewable Resources in California and the Role of Automated Demand Response; Demand Response Research Center: USA, 2012. [Google Scholar]
  10. Faruqi, A.; H1edik, R.; George, S.; Bode, J.; Mangasarian, P.; Rohmund, I.; Wikler, G.; Ghosh, D.; Yoshida, S. A National Assessment of Demand Response Potential; Washington Federal Energy Regulatory Commission: Washington, DC, USA, 2009. [Google Scholar]
  11. Tong, Y.; You, X.; Wang, Y.; Huang, M. Research on virtual energy storage of air conditioning load. J. Beijing Jiaotong Univ. 2017, 41, 126–131. [Google Scholar]
  12. Ai, X.; Zhao, Y.Q.; Zhou, S.P. Study on virtual energy storage features of air conditioner direct load control. Proc. CSEE 2016, 36, 1596–1603. [Google Scholar]
  13. Wang, D.; Meng, K. Coordinated Dispatch of Virtual Energy Storage Systems in LV Grids for Voltage Regulation. IEEE Trans. Ind. Inf. 2018, 14. [Google Scholar] [CrossRef]
  14. Chen, Z.; Wang, D.; Jia, H.; Wang, W. Optimal smoothing control strategy of virtual energy storage system in microgrid based on continuous state constraints. Power Syst. Technol. 2017, 41, 55–63. [Google Scholar]
  15. Sun, Y.; Tang, X.; Sun, X.; Jia, D.; Zhang, G. Microgrid tie-line power fluctuation mitigation with virtual energy storage. In Proceedings of the 14th IET International Conference on AC and DC Power Transmission, Chengdu, China, 26–29 June 2018; pp. 1001–1004. [Google Scholar]
  16. Deng, Y.X.; Wang, L.; Li, Y.; Tian, J. Direct Load control strategies and optimization scheduling of thermostatically controlled loads. Proc. CSU-EPSA 2015, 27, 18–24. [Google Scholar]
  17. Wang, D.; Ge, S.; Jia, H.; Wang, C.; Zhou, Y.; Lu, N.; Kong, X. A Demand Response and Battery Storage Coordination Algorithm for Providing Microgrid Tie-Line Smoothing Services. IEEE Trans. Sustain. Energy 2014, 5, 476–486. [Google Scholar] [CrossRef]
  18. Ge, S.Y.; Liu, J.Y.; Liu, H.; Wang, Y.; Zhao, C. Economic Dispatch of Energy Station with Building Virtual Energy Storage in Demand Response Mechanism. Autom. Electr. Power Syst. 2020, 44, 35–43. [Google Scholar]
  19. Yin, S.; Ai, Q.; Wang, D.P.; Ding, Y.; Wu, J.; Xie, Y. Day-Ahead Robust Bidding Strategy for Prosumer Considering Virtual Energy Storage of Air-conditioning Load. Autom. Electr. Power Syst. 2020, 44, 24–34. [Google Scholar]
  20. Widén, J.; Wäckelgård, E.; Lund, P. Options for improving the load matching capability of distributed photovoltaics: Methodology and application to high-latitude data. Sol. Energy 2009, 83, 1953–1966. [Google Scholar] [CrossRef]
  21. IEA-SHC. IEA SHC || Task 40. Available online: http://task40.iea-shc.org/ (accessed on 30 June 2016).
  22. Georges, E.; Braun, J.E.; Lemort, V. A general methodology for optimal load management with distributed renewable energy generation and storage in residential housing. J. Build. Perform. Simul. 2016, 10, 1–18. [Google Scholar] [CrossRef] [Green Version]
  23. Cao, S.; Mohamed, A.; Hasan, A.; Sirén, K. Energy matching analysis of on-site micro-cogeneration for a single-family house with thermal and electrical tracking strategies. Energy Build. 2014, 68, 351–363. [Google Scholar] [CrossRef]
  24. Altun, A.F.; Kilic, M. Economic feasibility analysis with the parametric dynamic simulation of a single effect solar absorption cooling system for various climatic regions in Turkey. Renew. Energy 2020, 152, 75–93. [Google Scholar] [CrossRef]
  25. Lyu, W.; Li, X.; Yan, S.; Jiang, S. Utilizing shallow geothermal energy to develop an energy efficient HVAC system. Renew. Energy 2020, 147, 672–682. [Google Scholar] [CrossRef]
  26. China Architectural Design Institute. Technical Specification for PV System of Civil Buildings; Construction Industry Press: Beijing, China, 2010. [Google Scholar]
  27. Ge, B.B.; Xu, L.; Liu, H.; Jiang, X. The Influence of Battery’s Capacity on the Stand-Alone Photovoltaic System with Different Load Profile. Batterychn. Chin. Labat Man. 2013, 3, 126–130. [Google Scholar]
  28. Cao, B. Impact of Climate and Built Environment on Human Thermal Adaptability; Department of Construction Engineering, Tsinghua University: Beijing, China, 2012. [Google Scholar]
  29. Wang, Y.L.; Tong, Y.B.; Huang, M.; Yang, L.; Zhao, H. Research on Virtual Energy Storage Model of Air Conditioning Loads Based on Demand Response. Power Syst. Technol. 2017, 41, 394–401. [Google Scholar]
  30. Castillo-Cagigal, M.; Martin, M.E.C.; Matallanas, E.; Masa-Bote, D.; Gutiérrez, Á.; Monasterio-Huelin, F.; Leube, F.J.J. PV self-consumption optimization with storage and Active DSM for the residential sector. Sol. Energy 2011, 85, 2338–2348. [Google Scholar] [CrossRef] [Green Version]
  31. Salom, J.; Marszal, A.J.; Widen, J.; Candanedo, J.A. Analysis of load match and grid interaction indicators in net zero energy buildings with simulated and monitored data. Appl. Energy 2014, 136, 119–131. [Google Scholar] [CrossRef]
  32. Su, P.W. A Study on Matching Performance of Building Renewable Energy System Based on Forecasting of Power and Load; Tianjin University: Tianjin, China, 2017. [Google Scholar]
  33. Li, G.Y.; Yang, L.J. Neural Fuzzy Predictive Control and Its MATLAB Implementation; Publishing House of Electronics Industry: Beijing, China, 2013. [Google Scholar]
Figure 1. The residential building renewable energy system.
Energies 13 01269 g001
Figure 2. Schematic diagram of building energy system in MATLAB-TRNSYS.
Energies 13 01269 g002
Figure 3. The annual electricity generation and consumption of the building energy system.
Energies 13 01269 g003
Figure 4. The change in power generation and electricity consumption before VES.
Energies 13 01269 g004
Figure 5. The change in power generation and electricity consumption after VES.
Energies 13 01269 g005
Figure 6. Comparison of OEFr before and after VES.
Energies 13 01269 g006
Figure 7. Comparison of OEMr before and after VES.
Energies 13 01269 g007
Figure 8. The charge and discharge of the battery before and after the dispatch.
Energies 13 01269 g008
Table 1. The composition of the building renewable energy system.
ProjectComposition
Supply-sidePV, wind turbine, battery, grid
demand-sideAir conditioner, electric appliance, electric vehicle charging
otherforecasting system, dispatching platform
Table 2. The equipment of building renewable energy system in TRNSYS.
EquipmentCode in TRNSYS
Weather dataType 109
Air conditionerType 665
Temperature controllerType 108
Photovoltaic arrayType 94
Wind driven generatorType 90
Inverter controllerType 48
Storage batteryType 47
Time controlType 14
IntegratorType 24
BuildingType 56
Forced draught blowerType 642
On-off controlType 2b
Table 3. Specific control strategy of building energy system of the renewable energy system.
Peak–Valley PriceForecast ComparisonOperation Strategy
PeakGren, pre > Lbldg, preThe electricity generated by renewable energy supplies to the load. The excess power is used to charge the battery storage, then the car battery.
Gren, pre < Lbldg, preThe electricity generated by renewable energy supplies to the load, batteries and grid supplement.
ValleyλThe grid supplies to the load, the electricity generated by renewable energy is charged into the battery storage, then the car battery.

