1. Introduction
The pressure exerted on mobility systems by rampant climate degradation, the widespread economic crisis or even the growth of the world population motivates the urgent search for more efficient and sustainable alternative forms. The urban circulation in Europe accounts for 40% of total CO
2 emissions. Reversing this trend must be strategically defined at a European level and decisively implemented at a local level [
1].
In Portugal, the guidelines derived from the European strategy were defined with a series of operational programs organized in multiple sectors of society seeking to undertake thematic areas such as social inclusion and employment, human capital, competitiveness and internationalization, sustainability and efficiency in the use of resources [
2].
As a consequence, the development of a national charging network has been put in place, predicting a massive integration of electric vehicles in the car park. In other European countries, there have been similar concerns, and studies have been carried out. In [
3], the authors analyzed the effectiveness of incentives on electric vehicle adoption in Norway. While electric vehicles could provide significant benefits relating to energy diversity, environment and public health, they currently require a purchase premium and lack a robust refueling infrastructure. They have concluded that on a regional level, the number of charging stations had the highest indicative effect, though not necessarily causal, and on the other hand, on a municipal level, personal vehicles were found to be sensitive to median household income while corporate vehicles were sensitive to the number of charging stations.
The authors in [
4] examined the impact of local policy instruments designed to promote the adoption of electric vehicles in Sweden. The adoption rate of electric vehicles in Sweden is relatively slow and varies substantially across municipalities. The results showed that the local policy instrument of public charging infrastructure has a significant and positive impact on the Battery Electric Vehicle (BEV) adoption rate; they also concluded that even though the Swedish policy instruments showed positive effects on the BEV share, the slow adoption rate can be an indication of too weak policy incentives in Sweden.
In [
5], the authors analyzed the charging of electric vehicles in Spain and assessed the current situation in order to propose potential improvements or implementation strategies. They have determined that it was necessary to develop public policies for a structured implementation of charging stations in public places and in common-use areas, such as parking areas and residential areas in order to improve electric mobility in Spain. Moreover, the need to legislate standards for charging electric vehicles was illustrated to maximize their implementation in Spain, with the goal of implementing electric vehicles on a larger scale and ultimately allowing society to benefit from the advantages of this technology.
The creation of an overrun charge to be satisfied by the National Electricity Network is inevitable, making it necessary to study and predict the impacts and consequences of this change on current load diagrams. The national grid, which is suffering a modernization process, such as smart grid campaigns or the penetration of renewable production, can be of great importance in adjusting the load diagrams, delaying high upgrade costs, which may lead to the replacement of some of its most important components, such as cables or power transformers. Electromobility is a key challenge for many actors dealing with energy transition. This phenomenon is caused by the convergence of multiple decisions in international negotiations on climate change (COP 21). At the European level, Electromobility is also a challenge. For instance, EU Commissions proposal for a recast Renewable Energy Directive, with targets for an annual minimum share of renewable energy source based transport fuels including renewable electricity (Article 25) is a proof of the potential impact of electromobility [
6].
Electromobility is one of the major innovations that will take place in the coming years in the mobility, energy and automotive industries. The authors in [
6] stated that electromobility induce two main possible responses by companies: 1) vertical integration strategies toward battery manufacturing and charging infrastructures; 2) reducing the total cost of ownership of the EV by adding new streams of resources in the smart use of their batteries. This solution consists of the creation of new services offered by EV fleets on energy markets and bringing accordingly new possession revenues to the EV owner. The challenges such as ecosystems, composed by car manufacturers, the electricity industry and local and national public actors dealing with clean energy transition, are reviewed and the most promising way of future research in each of these dimensions for the EU actors are highlighted.
In [
7], the authors made an extensive and up-to-date review of the existing literature on e-mobility in Europe, with the main aim of identifying and mapping the motivators and barriers for the diffusion of electric mobility. Results of the analysis identifies that the main barriers are lack of charging infrastructure; economic restrictions and cost concerns; technical and operational restrictions; lack of trust; information and knowledge; limited supply of electricity and raw materials; and practicability concerns. Transport sector accounts for a quarter of Europe greenhouse gas emission, and therefore is a major source of air pollution, contributing to climate change. The electrification of transport (electric mobility) not only significantly reduces energy consumption and greenhouse gas emissions, but also enhances Europe’s energy security. In conclusion, the market acceptance of electric mobility is relatively low. Therefore, there is a strong need for researchers, practitioners and governments alike to take action to strengthen the motivators and eliminate those barriers.
Electromobility can also help to reduce CO
2 emissions, especially if electricity is produced using renewable sources. Some works have already evaluated the impact on the electromobility on CO
2 emissions. In [
8], a large-scale implementation of an electric road system (ERS) was investigated in Norway and Sweden by identifying not only the type of roads but which vehicle types are beneficial to electrify based on an analysis of current road traffic volumes, CO
2 emissions mitigation potential and infrastructure investment costs. All the European (E) and National (N) roads in Norway and Sweden were included, while assuming different degrees of electrification in terms of the fraction of the road length with an ERS, prioritizing roads with high traffic loads. The study concludes that the infrastructure investment cost per vehicle kilometer increases dramatically for roads with a low average daily traffic as expected. Approximately 10 MtCO
2 and 5 MtCO
2 per year are emitted from road traffic (on E- and N-roads) in Sweden and Norway, respectively. Full implementation of ERS would mitigate up to 60% and 70% of the total heavy traffic CO
2 emissions in Norway and Sweden, respectively, and 40% and 45% of the total CO
2 emissions from light traffic, respectively. Thus, electrifying roads with an ERS that just uses heavy vehicles will increase the cost per vehicle kilometer for a road compared to using an ERS for both heavy and light vehicles. When the average daily traffic is less than 500 vehicles per day, the cost increases rapidly.
One article [
9] focused on the development of electric vehicles in Poland and in the European Union, as well as on the impact of these changes on CO
2 emissions and improvement of air quality. Switzerland and Norway were also included in the analysis. From the emission reductions forecast, resulting from the forecasted increase in the number of electric cars, it appears that emissions of 15,219,838 tons of CO
2 will be avoided in Europe by 2030, counting from 2009. The development of electromobility implies new approaches and the need to create new solutions in the field of energy management and vehicle operation management.
The necessity of transport electrification is already undeniable due to, among other facts, greenhouse gas emissions and fossil-fuel dependency. In [
10] a deep classification and analysis of published charging strategies is provided. Additionally, optimal charging strategies must minimize the degradation of the batteries to increase their lifetime, since it is considered that the life of a battery ends when its capacity is reduced by 20% with respect to its nominal capacity. Therefore, an optimal integration of electric vehicles must consider both grid and battery impact. The future of the applicability of different bidirectional services is directly related to the research efforts and improvements in battery degradation. Thus, the development of electric mobility responds mainly to the need to reduce emissions and is linked to a greater penetration of renewable energies sources, in order to respond to the new energy demand in an effective, efficient and as clean as possible way.
This work aims to verify the changes caused by the replacement of the car fleet of a company composed entirely by combustion vehicles, by 100% electric vehicles. The changes in the electrical installation, in its load diagram due to the installation of the battery chargers and the creation of an overrun charge to satisfy, the costs of acquisition and individual use of each car, are some of the topics covered. To understand the influence in the electrical installations of the fleet transition in the campus, several steps were done. Firstly, the consumption profile of the affected grid was recorded with a power analyzer equipment for six months. This procedure allowed to know the load diagram and the power margin available for the EVs charging. Then, an EV car was identified that was able to satisfy the business requirements, and a typical daily charging profile was also measured with a power analyzer equipment. Then, the EV charging profile was added through simulation to the global consumption to perceive its technical and financial consequences to the existing grid. The transition proposal focused on three stages, described below:
During the so-called “pilot phase,” the focus will be on taking full advantage of the various tax benefits and financial incentives provided by government entities with the aim of developing some know-how in the area through the acquisition of four vehicles. In a second phase, the goal is to transition 50% of the fleet (225 vehicles) and start the installation of charging stations within the business campus. After surveying the characteristics of the electrical installation, we intend to understand how it will be affected, considering the technology suggested. In a third phase, the final transition to a 100% electric fleet is performed. The number of charging points can (and should) be increased, because although the minimum car park numbers in the previous phase were guaranteed for such an EVs, this number may be insufficient. Thus, the proposal is to reach the maximum power of the transformer that feeds the affected electrical installation.
The duration of the implementation period of these three phases will certainly depend on several factors such as the continuous level of development of the public charging network (MOBI.E) or the duration of the renting agreements with the rental company.
The rest of the paper is organized as follows: the electric mobility in Portugal is introduced in
Section 2. The type of electric vehicles and their charge mode are described in
Section 3. The analysis of the real impact of the charging in an electrical installation are shown in
Section 4. The framework provided by Instituto Soldadura e Qualidade (ISQ) and that led to the case studies are presented in
Section 5.
Section 6 concludes our study.
2. Electric Mobility in Portugal-Business Framework
The national electric mobility network in Portugal is best known by the name of the company that manages the activity, MOBI.E. From the beginning that the main objectives are to contribute to the development of sustainable mobility and the increase of energy efficiency in transport.
It all began with Council of Ministers Resolution No. 169/2005 of 24 October 2005, which approved the “National Energy Strategy,” linking some of the objectives set by European Directive No. 2006/32/EC from April 5th. This established the obligation of member states to publish an action plan for energy efficiency, opening the door for approval of the National Action Plan for Energy Efficiency (PNAEE)—Portugal Efficiency 2015, with the Resolution No. 80/2008 20 of May [
11].
The PNAEE was created with the institute of converging the Portuguese strategy with the trends of the various EC members, adopting new models for mobility within cities, highly prone to environmental sustainability. The creation of the pilot network leads to the regulation of the activity and the creation of incentives, appearing from the Resolution of Ministers No. 20/2009 of 20 February.
The pilot phase started in 2010 (Law Decree 39/2010) and the first response was not positive, with a small introduction of the number of electric vehicles on the market, resulting in poor use of the infrastructures created for this purpose. With Portugal going through a serious economic and financial crisis, culminating in the request for foreign aid and the arrival of Troika, in 2012 we witnessed the project’s interruption, resulting in the suspension of investment in the public network and the cancellation of incentives to purchase electric vehicles.
In 2014 there was a need to update the initial legal framework to stimulate demand and to ensure project sustainability, leading to Law Decree 90/2014. New target groups were defined, which included new penetration scenarios, main activities were reviewed and, consequently, some functions had to be reorganized, from network management agents to EV users.
The management company of MOBI.E is made up of several entities, where EDP Distribution has the largest stake (51%), with the remainder being dispersed to other public and private entities.
Currently, available information points out for over 500 charging stations, corresponding to 1250 charging points in mainland Portugal and the Autonomous Region of Madeira [
12]. Replacement of the most commonly used slow charging stations is underway and also the creation of electric corridors on the highways, connecting the country from north to south.
2.1. Actors, Rights and Duties
The Office for Electric Mobility in Portugal (GAMEP) was created with the mission of developing the necessary mechanisms to start the pilot phase and define the technical, financial and business management of the program. The actors involved, their responsibilities, rights and duties were defined:
EGME—The entity that manages and monitors the network, namely the management of energy, financial and information flows;
CEME—An entity that holds a license to operate electricity charging and trading points;
OPC—A license holder whose activity is the installation, availability, operation and maintenance of infrastructures that allow the charging of batteries;
DPC—Private access charging point holder integrated in electric mobility network;
UVE—User of the electric mobility network to charge your vehicle’s batteries, establishing a contractual bond with one or more CEMEs.
Regarding matters subject to regulation, the commercial relationship between the various agents, the way in which the electric mobility sector communicates with the electric sector, the protection of UVEs rights and interests in relation to prices and the quantity of services, this important role is played by Entidade Reguladora dos Serviços Energéticos (ERSE).
2.2. Development Vectors
According to many experts, we are at the end of the pilot phase of electric mobility in Portugal, and it is necessary to start structuring the next phase. Opinions converge towards simplifying and deregulating the current model, allowing market players to freely organize. With this, measures and legislations are expected to promote the elimination of barriers, the reduction of infrastructure entry costs, the promotion of innovation and the initiative of the private sector, hence, being more competitive and freer to set prices and access conditions.
The adhesion of municipalities is very important. Contribution with financial or non-financial incentives should foster positive discrimination, such as free or reduced temporary parking, priority in granting parking permits, use of dedicated public transport roads, etc. Basically, measures that can be applied in high traffic areas or historical and central areas, ensuring less pollution and noise.
Outside housing areas, it is imperative to continue to provide Fast Charging Points between regions. Setting up in the interior of the country can mean a differentiating factor when it comes to tourism and a major strengthening of international connections in such a peripheral country.
It is also important to explore the electrification of fleets, whether in car-sharing networks or business vehicles. As used by countless people, the likely good user experience will be widespread and represent another factor of change.
2.3. Charging Station Installation Locations
According to the current technical guide [
13], EV batteries should be charged in dedicated areas and their cable path must be designed in order to not interfere with other electrical installations.
The most common situation is to find charging station in public places that are compulsorily exploited and maintained by licensed charging point operators and connected to the electric mobility network. However, there are already many private places intended for public access, such as the large commercial areas, where the Charging Stations are installed, operated and maintained by licensed operators, and must be connected to the electric mobility network. For situations where the responsibility is by the holders themselves, usually identified in private facilities with private access, it is also possible to opt for the integration of their equipment in the public grid in order to benefit from the supply of electricity for electric mobility or other associated services.
For sizing, the minimum power to be considered for each connection point shall not be less than 3680 VA [
13]. Since the simultaneity factor is 1, the minimum power to be considered in a car park must be obtained by the sum of the powers assigned to each of the parking spaces considered for that purpose. The minimum number of seats (N) to be taken into account shall be obtained according to Equations (1) and (2) that were established by the Portuguese Directorate General of Energy and Geology (DGEG) in the Technical Guide to Electrical Installations for Electrical Vehicles Power Supply [
13]:
For multi-family housing buildings, the number of places can be obtained by:
where
np is the total number of parking spaces in the park, minus the number of directly fed boxes.
For situations not covered by the previous case, where the loading must be done in a dedicated zone, the number of parking spots can be obtained by:
where
n is the total number of parking spaces in the park.
Considering Equation (2), and according to Reference [
13], the number of loading spaces in large car parks (capacity over 400 vehicles) may be limited to 41.
2.4. European Framework
Although much of what has been developed in Portugal follows the guidelines of the European Community standards, which allows us to be well positioned in some sectors, others still need to be improved.
In Portugal, the growth in sales of plug-in vehicles reveals the interest that exists in this market segment. In 2010 only five plug-in hybrid vehicles were sold, significantly improving in 2017 with the sale of 2444 units. In 100% electric vehicles, the growth in 2017 was 117% [
14].
In 2016 and 2017, preference fell on Plug-in Hybrid Electric Vehicle (PHEV), reflecting the latent lack of investment and the breach of public users’ trust. In 2018 the market share for BEV was 1.51%, while for PHEV it was 1.38%. Unexpectedly, these results place Portugal in the top 10 of the 28 Eurozone countries, together with the Netherlands (3.18%) and Austria (1.52%) within the BEV area. Interestingly, these figures, even if provisional, put Portugal in a favorable position compared to other countries where economic indicators are much stronger and optimistic, such as Germany or France. [
14].
The government commitment indicator is evaluated by the relationship between the number of publicly accessible Charging Points and the number of BEV. Although it is an important factor, it is not critical to its development. Take the case of Norway as an example: it has a low Charging Station/BEV ratio because most users have proper conditions for domestic charging. This ranking is dominated by the Netherlands with a ratio above 1, meaning more charging points than BEV. In this matter Portugal has a ratio close to 0.2, while Norway is just below with 0.1 [
14].
2.5. Acquisition Incentives
In Portugal there are several measures aimed at the development of electric mobility [
14], from acquisition incentives to tax benefits; the objective is to lower the acquisition cost of EVs, usually more expensive than combustion vehicles of the same range.
Individuals: for cars, the support is 3000 € for the first 1000 units, excluding amounts over 62,500 €. Motorcycles are 400 € or 20% of the overall cost;
Companies: for up to four cars the subsidy is 2250 € per car. In the past state budget, this measure was for four cars;
Vehicle Tax (ISV): BEVs are excluded from payment, while PHEV pays 25%;
Value Added Tax (VAT): for BEVs up to 62,500 €, for Acquisition or Renting, the amount is deductible. For PHEV you can also deduct them but for values below 50,000 €;
For Autonomous Taxation (TA): PHEV vehicles have rates of 5%, 10% and 17.5% on purchase values up to 25,000 €, or between 25,000 € and 35,000 € or above 35,000 €, respectively.
Table 1 summarizes some of the measures adopted by several European countries aimed at the development of Electric Mobility.
This work identified a disadvantage that penalizes electric mobility, since in the purchase of light commercial vehicles (up to three seats) combustion for companies, their tax environment is similar to an EV, making it more difficult to get any financial advantage.
2.6. Example of Acquisition and Use Costs
Applying the measures identified above, a comparison was made between vehicles of the same range, light commercial and passenger vehicles, in a four-year exercise for an estimated annual route close to 35,000 km, considering the modalities of Definitive acquisition and Renting. The average cost per liter of diesel is what is in effect (1403 €/liter) [
15], as well as the electricity cost (0.16 €/kWh) established by the Portuguese Energy Sector Regulator (ERSE) [
16]. Summarized results can be seen in
Table 2 and
Table 3 and the complete study in
Appendix A.
Due to the amount of incentives and tax benefits that covers electric mobility, the exercise shows that the result at the end of four years is often beneficial in both modalities. The exception is for light commercial vehicles, since they are covered by a similar tax environment, making it more difficult to compensate for the high initial investment in the electric vehicle.
The option for renting tends to be more advantageous because it allows the customer to enjoy the vehicle without becoming an owner of it. The vehicle is allocated for a contracted period upon payment of a monthly rent. This variant allows a few tax savings and frees company employees from fleet management functions, which can only focus on performing tasks that promote more and better production, leaving management to specialized company positions.
2.7. Estimated Acquisition, Installation and Maintenance and Usage Costs of Charging Station
Contrary to Fast Charging Stations, the slow chargers do not yet have any fiscal benefit or financial incentive from the Portuguese government, despite the relatively high investment that the purchase, installation and maintenance of this equipment may require.
In the Portuguese market there are already Charging Posts adaptable to all needs and realities. For this study, an equipment capable of intelligent management was considered, which in a simple and intuitive way gives the user full control of loading.
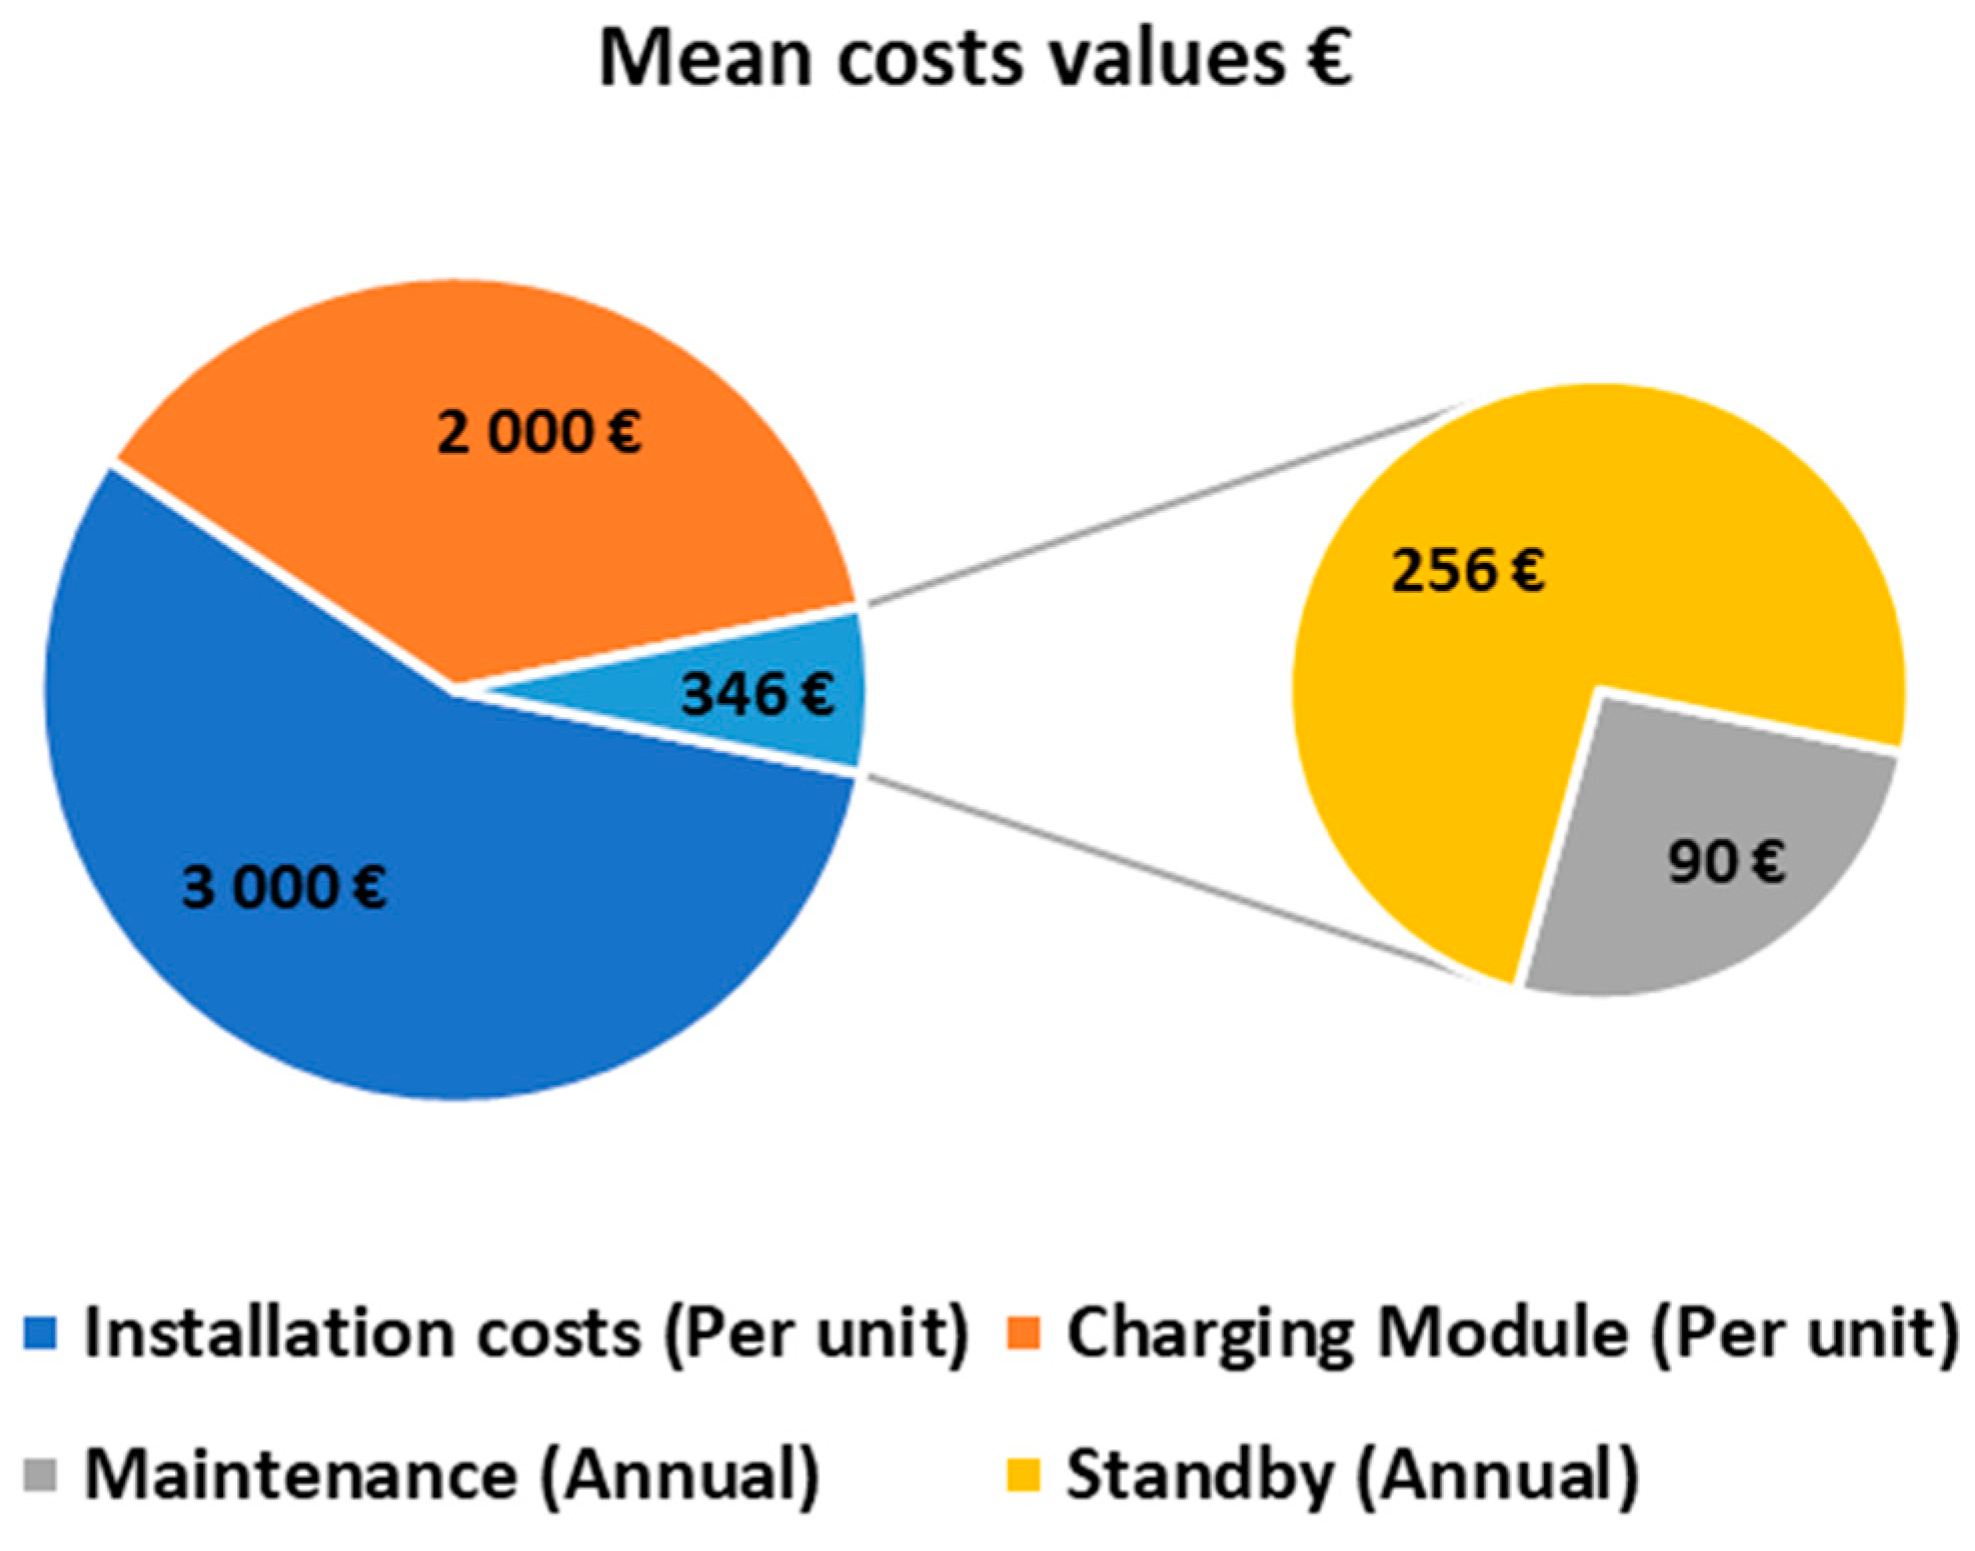
Installation costs for each pole loading post was estimated between 1500 € and 4000 € [
17]. This variation depends on factors such as distance to power source, soil type or even shrimp licensing.
The type of Charging Station suggested for installation would be exterior mounting with a power outlet of 7.2 kW. The average purchase cost of these units ranges from 1800 € to 2500 €.
A semiannual preventive maintenance program has a reference value of 90 €/year for each load point [
17]. The costs associated with theft or vandalism were assumed to be zero as the chargers will be installed within a privately accessed facility.
To determine the cost of electricity, the criterion was the medium voltage count, with average utilization and daily cycle, totaling a maximum annual cost of 25,661 €.
Figure 1 summarizes the mean costs inherent to each charging station.
Standby consumption refers to the electricity consumed by a charging station when it is not in actual operation [
18] but connected to the power supply and ready for use. This consumption came from continuous display operation and charger integrated circuits. Some equipment had fans to mitigate heat or resistors to maintain a minimum operating temperature.
Standby consumption of a typical Charging Station, Efacec model Q45, is recorded in
Table 4.
2.8. Environmental Sustainability
Again, to prove the environmental advantage of electric mobility, two light commercial vehicles were compared, one 100% electric and one combustion. With an identical usage forecast, a similar environmental cost of production was considered, except for the battery in the case of BEV. No costs for fossil fuel production or recycling of traction batteries were considered.
In the case of electricity, in 2018 in Portugal, the emission factor (FE) used for its production is the same as that attributed to residential and small business customers, broken down in any commercial invoice (FE = 268.76 CO
2 g/kWh) [
19]. The EV chosen is the Renault Kangoo ZE 33 kWh model, which features an announced consumption of 15.5 kWh/100 km. Thus, CO
2 emissions can be estimated using the following Equation (3):
Considering that in the manufacture of your battery for each kWh of capacity produced, is emitted 200 kg of carbon dioxide, an initial disadvantage of 6600 kg of CO
2 emissions is created [
20].
The combustion vehicle of the same range has an announced average CO
2 emission of 0.12 kg/km. In this case, in order to identify the moment when electric mobility becomes an environmental advantage, the following formula was used:
where
x is the number of kilometers to be determined:
It was proposed that the vehicles under study present a typical use pattern of a service car, circulating only during the week, covering an average of 130 km per day, totaling about 2860 km per month. With this routine use, the annual mileage will reach close to 35,000 km. For the example presented, EV would need about 2 ½ years to become a true environmental alternative.
It is also possible to quantify the direct emission savings per vehicle that this change will provide:
This represents an average forecast of 1522.56 kg avoided annual CO2 per car. But if we consider a universe of 450 units, with the contribution of the ISQ company alone, around 685 tCO2 of greenhouse gas emissions from employee mobility can be avoided.
3. Electric Vehicle Types and Charging Way
The different charging modes must be adapted to the needs of each user, who must consider the vehicle according to their specificities and the electrical installation into which they will be integrated.
3.1. Eletric Vehicles
There are now several types of electric vehicles capable of meeting most of the needs of any user [
21]. Hybrid vehicles enable charging from an external source (PHEV) by combining the energy of fossil fuels with a variety of electrical sources. This type of car is a good solution for long distance use.
The 100% electric vehicles are typically small and light city vehicles, ideal for short distances, high energy efficiency, noiseless and without direct CO2 emissions. There are some variations of this concept, notably in the luxury segment, where stress for autonomy is countered with large capacity batteries while allowing ultra-fast charging.
Although the batteries that fit current EV models are a relatively new technology, many experts consider it to be stable, though the size problem still needs to be resolved [
22]. Concerning Lithium, the prospect of new exploration projects foresees that 2018 was the last year of a global deficit of this raw material [
23]. Although some ways of extraction have higher costs (Rock Ore) than others (Brine) the average cost of battery production is expected to continue to fall over the next decade [
24]. This is a decisive factor for the sustainability of the industry, which expects to achieve 25% EVs on its assembly lines [
25] by 2025.
There are already some projects that go beyond the traditional way of collecting, treating and recycling, such as the melting and leaching processes usually using chemicals, with the aim of recovering metals. Programs commonly referred to as second life commit to giving the battery a second use after it is no longer able to power a traction source. For example, the use of these batteries to illuminate city streets as a complement to the public grid [
26], or as a back-up power supply system by combining batteries to form an energy storage system [
27] in order to stabilize the national power grid in times of high energy demand.
The technology associated with electric motors, whose solutions most commonly used by EVs (Asynchronous Induction Motors and Permanent Magnet Synchronous Motors) manufacturers may raise some concerns in the medium to long term. When the expected proliferation of EVs occurs, it is estimated that there will not be enough copper for the induction machine winding rotor construction. [
28]. As for the Permanent Magnet Synchronous Machine, they are a very expensive solution, because 80% of the raw material comes from China, and it is not feasible to hold a whole industry hostage. The solution is expected to be Magnetic Reluctance Motors, but, despite all their development potential, they are still not frequently used today [
29].
3.2. Charging Stations
A charging station is the set of all equipment used to supply the EVs, allowing them to charge their batteries [
13]. Depending on the specifics and characteristics of the vehicle and the mode of loading intended, vehicles can be connected to the network in various ways:
• Case A of connection:
The connection (to the Charging Station or dedicated outlet) is via a charging cable, which includes the plug and is permanently connected to the vehicle [
13].
• Case B of connection:
Connection is done by cable but not permanently linked to EV or a Charging Station. The cable at its extremes have the corresponding connectors for a simple and secure connection [
13].
• Case C of connection:
In this case, the charging cable is permanently connected to the Charging Station, including at its extreme the connector for the EV. For safety reasons this connection mode is the only one possible when applying mode 4 (fast charge). The quick charge connector varies by manufacturer. Usually in Europe, the Combined Charging System (CCS) connector is used, while in Asians models the CHAdeMO is used [
13]. Thus, it can be claimed that there is no standard connection and that all requirements of the current standards must be met.
Regarding the different charging modes, each of them determines how to charge the batteries.
• Charge Mode 1:
Characterized by a slow charging mode, where the EV is connected to the power supply through a standardized current outlet lower than 16 A and of a voltage lower than 250 V on single-phase and 480 V on three-phase circuits. The power range covered is from 3.7 kVA to 11 kVA.
• Charge Mode 2:
Characterized by being a slow load mode, in which the connection of the EV to the power is made by means of a standard socket of stipulated current lower than 32 A and a voltage lower than 250 V in single phase and 480 V in three phases circuits. The power range covered is between 3.7 kVA and 22 kVA.
• Charge Mode 3:
Characterized by being a slow, normal or semi-fast charging mode, where the EV is connected to the power through an EV power system. The power range is similar to the last charge mode.
• Charge Mode 4:
Associated with fast charging, the connection of the power infrastructure to the EV is consumed in Direct Current through a fixed external charger. The charging intensity is such that, in many cases, the battery reaches 80% capacity in 30 min. The advantage is that the limitation often imposed by the EVs onboard charger is circumvented. The disadvantage is that high power transfer wears out batteries, accelerating the process of loss of characteristic.
Commercially available chargers type adapts easily to the needs of every EV user. Portable Charging Stations are ideal for those with a multitude of charging locations, or even those who want to travel long distances. The Wallbox Charging Stations are the most comfortable and usual option in private parking or home charging. Finally, the Charging Station in pole is designed for use in public access or outdoor parking lots. The last charging solution is the one with a higher investment cost.
4. Tests and Measurements
In order to analyze the real impact of the charging in an electrical installation, two tests were performed on different models of Charging Station. This will make it easier to understand the evolution of some electrical units that may influence the energy quality of the installation and the possible changes at the load diagram (Peak Consumption, Consumption of Reactive Energy, Power Factor).
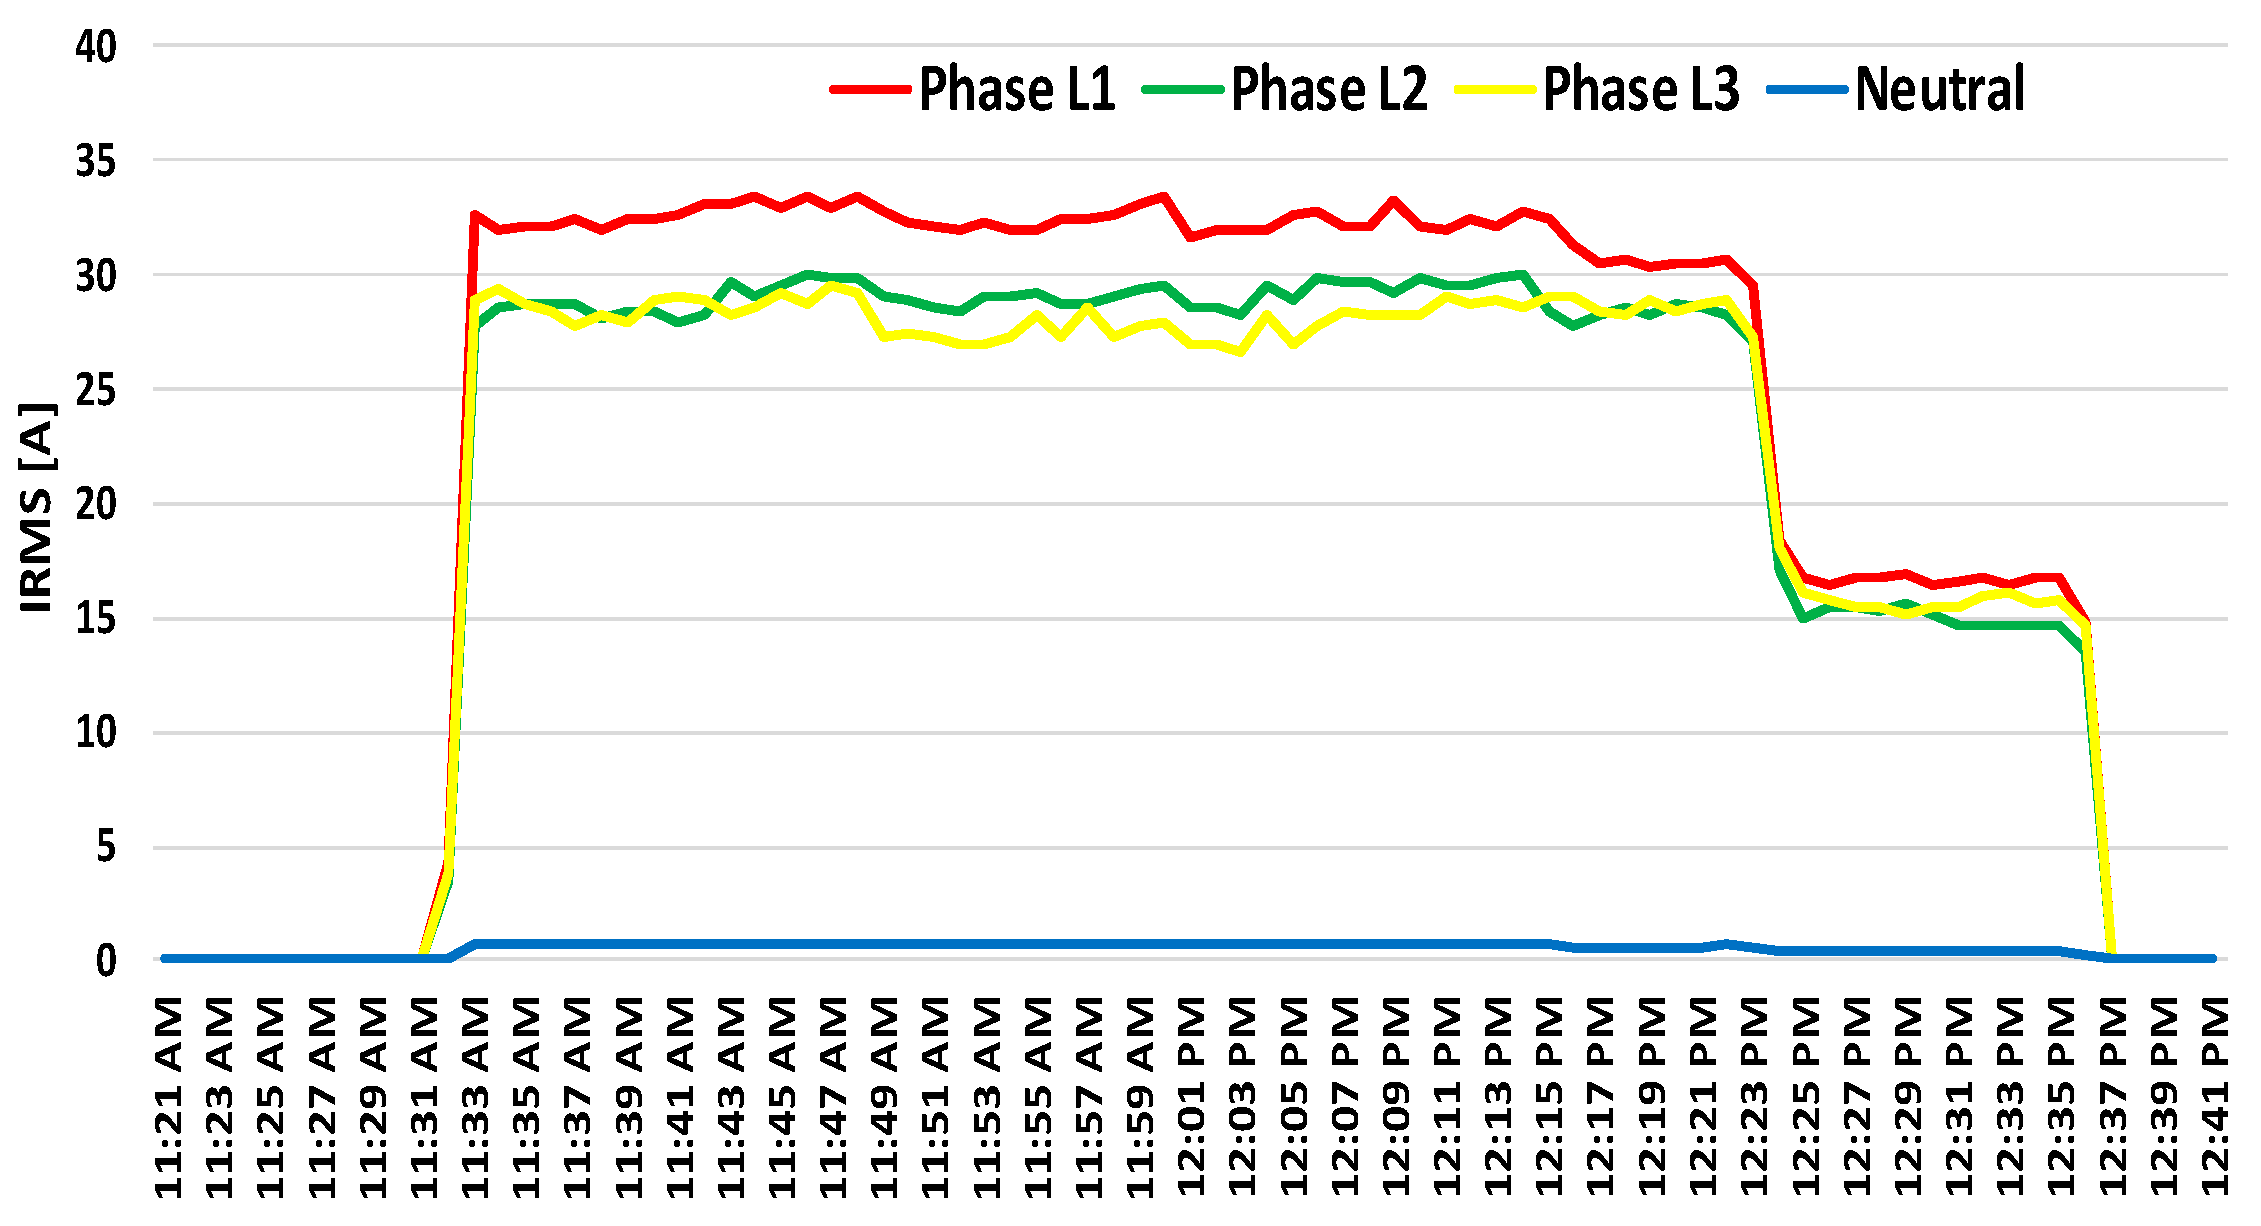
The first measurement was performed while charging a Kangoo Ze with a 33 kW battery using a 20 kW portable quick charger. The vehicle started charging with 45% battery (estimated value considering 130 km per day). Charging lasted about 65 min and the consumption of the active energy recorded was 18.15 kWh.
As can be seen in
Figure 2, the I
RMS value of current in phases very close to the rated value of the equipment (32 A per phase), halving after the battery reaches 94% charge. Moreover, in
Figure 2, phase 1 is slightly higher than phases 2 and 3; this is due to the L1 voltage data source collected from measurements, which are also slightly higher than L2 and L3. However, this unbalance is not significant, since the current in the neutral is never greater than 0.7 A.
This situation is also reflected in
Figure 3. During the maximum Active Energy delivery period,
Figure 3, the charger’s nominal value is reached several times, but the average value is 19,500 W. After the battery reaches 94% charge, the Active Power consumption halves, replicating current behavior.
The second test used a slowest charging station of 7.2 kW, single-phase, with similar charging conditions, and the vehicle started with 45% battery. The charging lasted about 150 min with a total consumption of 18.15 kWh. Despite this option being slower than the previous, it is the most appellative regarding cost/benefit issues. Only on specific occasions, vehicles will need fast charging, as most of the time they can be parked for several hours, thus, this charging option was chosen to be the one to install.
5. Case Study Scenarios
The ISQ, Instituto de Soldadura e Qualidade, provided the framework for the study. As an organization recognized as a research and technology platform, it made sense for them to participate and contribute to the approaching change.
5.1. Car Fleet ISQ
ISQ chose to build its fleet using two modalities: Renting and Definitive acquisition. The car fleets totaled 450 vehicles, where close to 80% of them are light commercial vehicles. All vehicles have an internal combustion engine. The renting agreement covered about 400 units, and the remaining 50 were owned by the company.
5.2. Parking Lot ISQ
In total, the ISQs car park has a capacity of 392 seats, however, next to the main electricity source, there were only 84 spaces available in the transformation post “Formação”, the chosen place for feeding the Charging Station. According to Equation (2) the minimum number of parking places to be equipped with Charging Stations is 41 as shown in Equation (8):.
This work proposes the installation of 7.2 kW equipment, because it is a value that is within the average capacity of onboard chargers of most EVs available in the market. As a result, the minimum of 41 equipped seats is require the available of 303.40 kVA of the electrical installation.
In order to maximize the surplus power that is being provided by the 800 kVA power transformer, a maximum of 100 charging stations could be placed in simultaneous operation without the transformer power limit being exceeded, as can be seen in
Section 5.4.4. However, since there are only 84 seats available, the power required for them only rises up to 604.80 kVA.
5.3. Eletric Instalation ISQ
The ISQ Business Campus electrical installation is made up of seven Transformer Stations, six of which are interconnected, operating at a working voltage of 10 kV.
The description of the network is complemented with the Transformation Post Station OER 4923 (“Formação”). Its proximity to the parking spaces makes it the best solution to feed the charging stations,
Figure 4.
The consumption profile of the affected grid was obtained by means of a network analyzer, which recorded the consumption over a period of six months (February to July 2019), thus obtaining a wide sampling interval, considering that it was representative of the whole year.
Figure 5 represents one week with the mean values obtained from the whole data. Outlining the load profile, it is possible to verify that there was a considerable power gap that can be “diverted” to the Electric Mobility, remembering that the transformer is 800 kVA.
It has been found that the load peak recorded is far from the rated transformer power (800 kVA). In summary,
Table 5 shows the average daily consumption recorded during the period analyzed.
5.4. Charging Prevision
It was important to find a methodology that could ensure that EVs were loaded in a coordinated way. Charging EVs in a randomized and uncontrolled way may cause several unwanted consequences to the power grid, charging parks and end users. Regarding the power grid, consequences were related with an additional load peak in the grid load diagram, extra grid losses and voltage reduction in the nodes [
30,
31]. In charging parks, the reduced utilization and increased operating costs were expected and for end users, it means increased charging costs and duration [
32]. Thus, to reduce or mitigate problems, it was necessary to coordinate and plan the EV charging. In the literature, several contributions can be found addressing the charging coordination, control and optimization with main objective of cost, power and greenhouse gas minimization. For instance, [
33] presented a novel solution based on constrained mixed-integer programming for aggregator-based scheduling of EVs, with the objective of energy cost minimization. The authors included power grid constraints and flexible energy pricing, and the results showed that the approach can successfully reduce the EV charging failure probability and improve the congestion in the distribution network due to the charging. The main purpose of [
34] was to schedule the EVs’ charge in a multi-aggregator market. A bi-objective optimization problem that maximized the number of EVs charging and aggregators profit via distributed offline/online algorithm was developed. The study presented in [
35] developed an optimal charging scheme with the objective of lowering the power fluctuation level, which considers the uncertainty of EVs driver behavior and EV charging demand model. The problem was formulated, and an EV charging scheme based on the genetic algorithm was proposed to solve the problem. The results showed the lowering in the power fluctuation level and in the overall peak demand in the grid system. Another paper [
36] proposed an optimal charging scheduling strategy, based on an integrated grid-to-vehicle (G2V) and vehicle-to-grid (V2G), within a workplace car park. Authors modeled the EVs driving pattern and based on it designed a fuzzy inference system to model the EVs energy requirement. Moreover, a genetic algorithm with heuristic initialization was used for performing the optimal charging scheduling of PEVs. Simulations showed that the strategy can reduce the parking operator daily cost and the network peak load, provide frequency regulation service and prevent overloads in the distribution network. Additionally, regarding V2G technologies, a recent survey can be found in [
37]. More recently, [
38] modeled a three-phase low voltage grid considering realistic electric vehicle fleet routines into account. Different coordinated charging strategies were compared depending from their optimization objectives, cost or greenhouse gas emissions reduction. Authors showed that congestion problems were mitigated by coordinated charging, and costs and greenhouse gas emissions can be reduced by more than 50% and 40%, respectively.
A technological survey to grid-connected charging stations is present in [
39]. The authors systematically reviewed more than 170 papers, focusing in the existing system configurations, optimization and design methods, algorithms and key technologies. However, the revised paper revealed that studies are mostly under development or in an embryonate, conceptual or project phase, and they are not ready for a large-scale practical implementation, and because of this reason their benefits were not considered is this work.
The use of tariffs with different economical times or the sum of extra consumption to the power peaks already identified in the load diagram may result in exceeding the available/installed power and thus lead to premature upgrade of the electrical installation. To avoid that some possibilities were studied and compared.
The construction of these scenarios considered the suggestion of installing the 7.2 kW charging stations as well as the data collected during the assays, assuming the same conditions, the same car, the same percentage of battery to be restored and the same loading time. The excess load will be added to the diagram constructed for the Transformation Post “Formação,” reflecting the expected scenarios.
The costs with the charging of each scenario will be measured, and the energy measurements will be done in Medium Voltage, applying the actual energy prices and legislation as show in
Table 6.
5.4.1. Scenario 1: Simultaneous Charging of 41 EVs in 7.2 kW Stations (Starting 05:00 PM)
Scenario 1 is the one most likely to happen, but less favorable. It assumes that loading begins as soon as users finish their workday, each employee leaves the EV connected and the charging process starts. This scenario will lead to an increased need for energy demand at a critical time with unattractive tariffs,
Figure 6.
Simultaneous charging of the 41 vehicles starts at around 05:00 PM, accounting for a total of 744 kWh of active energy, which translates into an additional daily cost of 84.51 €. The peak load, previously of 141.38 kVA recorded at 06:04 PM, was 429.35 kVA at the same time. A significant increase in the peak value of the load diagram is recorded, roughly half of nominal value of the power transformer.
5.4.2. Scenario 2: Simultaneous Charging of 41 EVs in 7.2 kW Stations (Starting 02:00 AM)
Scenario 2 is more favorable than the previous one, as it takes advantage of the super-empty fare period to make the charging. In this scenario, at the end of the day, each employee leaves the EV connected to charger, and all chargers are scheduled to start in operation at the most favorable off-peak time, 02:00 AM. The new peak energy demand is no longer coincident with the peak power of the load diagram. Scheduled charging requires the user to leave the vehicle connected for it to occur within the desired time period.
Simultaneous charging of the 41 vehicles starts at 02:00 AM, accounting for a total of 744 kWh of active energy resulting in an additional daily cost of 50.44 €. The peak load at normal empty and super empty rate went from 86.88 kVA 10:04 PM) to 334.17 kVA, recorded at 02:23 AM,
Figure 7.
5.4.3. Scenario 3: Charging 41 EVs in Sets of 13-13-15 in 7.2 kW Stations
Scenario 3,
Figure 8, which already includes the possibility of peak shaving, is perhaps the most favorable option. In this scenario, to minimize the load diagram, the chargers were scheduled in groups to start at a specific day time, meaning that EVs will start their charge in consecutive sets (13-13-15) of 150 m each. The excess of energy needs will be accommodated to the load diagram, taking advantage of the most economically priced schedules and minimizing peak demand.
Charging starts at 10:00 PM sequentially in groups. Thus, the first group of 13 starts at 10:00 PM, the second group of 13 starts 150 minutes after, around 12:30 AM and the last group of 15 starts around 03:00 AM. This scenario adds a total of 744 kWh with an additional cost of 64.4 €. The peak load at normal and super-empty has increased from 86.88 kVA to 189 kVA (far below the one recorded in scenario 2), both recorded at 10:04 PM.
5.4.4. Scenario 4: Charging 400 EVs in Four Sets of 100 in 7.2 kW Stations
Scenario 4 seeks to fill the nominal power (800 kVA) of the transformation station “Formação” and evaluates the hypotheses of total substitution of the 400 actual combustion lighter commercial vehicles by electric ones. Thus, 100 vehicles charging in the same conditions of the previous scenarios were considered (45% of battery) at the same time in four blocks of 150 min each, between 10:00 PM and 08:00 AM. The maximum peak of the load diagram is 141.38 kVA, thus, there was plenty of power that can be forwarded to electric mobility. It can be seen in
Figure 9 that it would be possible to install 100 units of charging stations of 7.2 kW with a unitary utilization factor.
Figure 9 shows the simultaneous charging of the 100 vehicles starts at around 05:00 PM, accounting for a total of 7300 kWh of active energy, meaning an additional daily cost of 607 €. The peak load recorded at 06:04 PM, previously 141.38 kVA, is now 776.96 kVA.
5.5. Resume of Charging Scenarios
In order to contribute to a simplified analysis, focusing on the technical and financial aspect, the daily results of the simulated scenarios are summarized in
Table 7.
Scenario 2 was the most economic, because it used the corrected tariff and had the advantage of helping the installed power transformer to operate at a load level that allows a proximity to a maximum performance, even momentarily [
40]. Compared with the combustion solution with 0.0589 €/km, scenario 2 with 0.0091 €/km represented only 15% of the combustion costs.
Scenario 3 took advantage of the two most economical tariffs, costing slightly more than scenario 2, because the load management system was programmed to charge the vehicles sequentially and in groups; thus, this scenario does not allow overloading.
From all scenarios, the first was clearly the most unfavorable: the schedule at which charging sessions took place does not use the most appropriate tariff, which will decisively contribute to the significant increase in electricity expenses. Therefore, the implementation of a cargo management system when it comes to vehicle loading is essential. Overloading the facility was close to a reality in scenario 4; with a very high load regime in permanence during the night period, the mean charging cost by vehicle is the second most favorable.
In order to contribute to a simplified analysis regarding annual costs and savings, the costs/savings between EV vs. Combustion are presented
Figure 10 and
Figure 11. As previously mentioned in
Section 2, the considered diesel price per liter is 1.403 €/liter and CO
2 emissions of 0.12 kg/km for an annual mileage of 35,000 km per vehicle.
6. Conclusions
In accordance with the tax framework and considering all the financial incentives for companies made available by the Environmental Fund, one can state that EVs are the most advantaged option (minimizing costs) when comparing two forms of car acquisition (definitive acquisition and renting options) practiced by the company ISQ. The exception is the Renting option when two light commercial vehicles are compared. Both vehicles are covered by a very similar tax plan, thus, it is more difficult to minimize the high cost of EV acquisition. It can be concluded that all measures that penalize the most polluting vehicles tax, act as a mechanism of positive discrimination, encouraging the acquisition and use of EVs. Relating the definitive acquisition and renting options, the latter shows some advantage, because it is the most economic option and because the risk of battery loss or malfunction is eliminated, as the company does not become the owner of the car. There are also other indirect advantages, such as the management of fleets, which is done by specialized companies freeing the employees of the lessee company to other tasks.
Regarding the acquisition of Charging Station to be installed, factors such as user needs (charging time), or the general characteristics of EVs available in the market (onboard Charger Power) or even the particularities of the business campus car parking, indicate that the suggested 7.2 kW outdoor pole mount charger typology is a viable solution. In any case, the choice should consider other criteria such as acquisition, installation, maintenance and standby costs. During the tests performed in this work, this type of equipment presented results with low harmonic content within the requirements of the standard, regardless of the load regime. This paper accentuates the importance of an efficient charging session management and guidance for use at cheaper tariffs, that seeks to influence the load diagram at lower consumption periods, holding over the upgrade of the electrical installation and saving on billing with the electric power. This paper shows how important it is for companies that seek electrical mobility for their fleets to analyze technically and economically their electrical installations and perform several scenarios to understand how ambitious they can be within the available financial and power resources.
After analyzing the incentive policies and despite all the economic and financial difficulties experienced in Portugal, the numbers show that Electric Mobility has obtained an interesting adhesion in recent years, even compared to other European countries. Despite the differences between realities, it is essential to look and learn on what we consider the “good practices” applied in other technologically more developed countries. The results obtained in Portugal still have a small growth curve because there are still some constraints on access to the public charging network as well as few incentives at the local level. Given the high costs of charging stations acquisition and installation, there is a general feeling that are a lacking incentive in this area of the ecosystem. It would be important for companies to require even more support, as they are extremely importance in the proliferation of Electric Mobility and because they cannot depend on the MOBI.E public network. The only way to ensure that an EV can be a logistically functional working tool is to give more stability at the companies.
As presented in
Section 2.7, the EV charging implementation requires an initial financial effort that must be made by the companies, although the results showed that annual savings resulting from the EV usage can recover the investment in 2 or 3 years. As the results showed, it is important for companies to realize how flexible they can be in the charging schedules, using off-peak hours, resulting in cheaper electricity prices, vital for achieving a quick financial return. The replacement of the entire fleet of light commercial by EV contributes for an estimated annual emission savings in the order of 1685 tCO
2, or in other words, 4213 kgCO
2 per vehicle with cost savings of almost 690,000 € annually. Through the presented results, several scenarios can be easily developed, with more or less charging posts or EVs. Another important term to have in consideration is the cost by kilometer showed in
Table 7, with this value companies can estimate costs regarding their traditional routes.
The importance of the close relationship between Electric Mobility and renewable energies is emphasized, reinforcing that an electrical system with a low CO2 production mix will lead to a faster reaching of the expected “clean” alternative and make a decisive contribution for the idea of “zero emissions” goes out of the figurative sense and becomes increasingly real.


