Article

Estimation of Carbon Dioxide Emissions from a Diesel Engine Powered by Lignocellulose Derived Fuel for Better Management of Fuel Production

1
Department of Production Engineering, Institute of Mechanical Engineering, Warsaw University of Life Sciences, Nowoursynowska Street 164, 02-787 Warsaw, Poland
2
Department of Production Management, Bialystok University of Technology, Wiejska Street 45A, 15-351 Bialystok, Poland
3
Faculty of Mechanical Engineering, Department of Production Computerization and Robotization, Lublin University of Technology, Nadbystrzycka 38 D, 20-618 Lublin, Poland
*
Authors to whom correspondence should be addressed.
Energies 2020, 13(3), 561; https://doi.org/10.3390/en13030561
Submission received: 27 November 2019 / Revised: 19 January 2020 / Accepted: 21 January 2020 / Published: 23 January 2020

Abstract

:
Managing of wastes rich in lignocellulose creates the opportunity to produce biofuels that are in full compliance with the principles of sustainable development. Biomass, as a suitable base for the production of biofuels, does not have to be standardized, and its only important feature is the appropriate content of lignocellulose, which assures great freedom in the selection of input. Biobutanol, obtained from this type of biomass, can be used as fuel for internal combustion engines, including diesel engines. In the era of strict environmental protection regulations, especially concerning atmospheric air, any new fuel, apart from good energetic properties, should also show beneficial ecological effects. This study investigates the carbon dioxide emissions from biobutanol powered diesel engine by means of use of the simulation model. The parameters of a real passenger car powered by a diesel engine were used for simulation carried out accordingly to the WLTP (Worldwide Harmonized Light Vehicle Test Procedure) approval procedure as the current test for newly manufactured cars. The results obtained for biobutanol were compared with simulated exhaust emissions obtained for conventional diesel and with FAME (fatty acid methyl esters)—the most popular biofuel. Biobutanol, in spite of its higher consumption, showed lower direct carbon dioxide emissions than both: the conventional diesel and FAME. In addition, a LCA (life cycle assessment) was carried out for the fuels and vehicles in question using the SimaPro package. Therefore, the implementation of butyl alcohol as a fuel provides favorable environmental effects. This result gives arguments towards biofuel production management indicating that implementation of biobutanol production technology mitigates carbon dioxide emission, as well as promotes lignocellulosic resources rather than edible parts of the plants.

1. Introduction

Due to the vast possibilities of obtaining useful products, utilization of lignocellulose rich waste is being analyzed in the area of natural and technical sciences with growing frequency [1,2]. In the period of deteriorating environmental condition, it is essential that the principles of sustainable development are followed in virtually all sectors of the economy in order to maintain balance between economic growth and concern about the nature around us [3,4]. Progressing climate changes, strictly connected with emission of anthropogenic origin greenhouse gases, constitute an important factor fostering search for state-of-the-art technologies, in particulars in the energy and transport industries [5,6,7]. Research into technologies to increase the energy efficiency of sustainable energy technologies for transport is gradually accelerating. It is important to create greater synergies and consistency between policies, as well as to develop a favorable regulatory, financial, and social environment. In addition, it should be based on global standards, processes and tools to manage safety, environmental protection, and cooperation with local communities.
As part of integrated efforts aimed at climate protection, in the global agreement—the Paris Agreement—the European Union undertook to maintain average global temperature growth on the level of 1.5 °C as compared with the pre-industrial period by limiting carbon dioxide emissions from its area by 40% until 2030 (as compared with 1990) [8,9]. Road transport which, thanks to numerous advantages, is developing dynamically and thus increasing its share in burdening the environment is becoming an increasingly important source of negative emissions [10,11,12,13]. To reduce the consumption of conventional sources as energy media for vehicles, biofuels, and bio-additives are applied, among others in order to replace exhaustible fuels emitting significant quantities of carbon dioxide [14,15]. Pursuant to Directive (EU) 2018/2001 of the European Parliament and of the Council of 11 December 2018 on the promotion of the use of energy from renewable sources, pure vegetal oils, methyl and ethyl esters of fatty or animal acids, mixtures of esters with diesel oil, and co-processed oils may be defined as biofuels suitable for diesel engines [16]. The fuels identified in the Directive, which may be used in the case of diesel engines also include biomass derived alcohols, such as: methanol, ethanol, propanol, and butanol [17,18,19]. Ethanol and methanol are most commonly used as alternative diesel engine fuel, but their different physical and chemical properties, such as: cetane number, flash point, low lubricity, low calorific value, poor miscibility with other substances and high volatility, materially hinder their suitability as diesel engine fuels [20,21]. Butanol seems an interesting alternative, due to its lower flash point, lower volatility, higher calorific value and cetane number, as well as better lubricity than methanol and ethanol [22,23]. What is more, butanol is characterized with better miscibility with conventional diesel fuel, vegetal oils, fatty acid methyl esters (FAME), and lower corrosivity [24,25,26].
Butanol, or butyl alcohol, is a colorless flammable substance produced in the process of anaerobic fermentation of sugar rich matter with the use of Clostridium bacteria, or from solid fuels [27,28,29]. It is a good solvent of petroleum derivative substances, while demonstrating low water solubility [30,31]. It appears as four isomers (iso-butanol, tert-butanol, sec-butanol, n-butanol), differing in terms of hydrocarbon chain structure (branched vs. straight) and hydroxyl group location [32,33]. Butanol is commonly used as paint and lacquer solvent, and as an ingredient of hydraulic oils and brake fluids [34,35]. It finds numerous applications in the textile and cosmetic industries. n-butanol is most frequently used in research on engines, as an additive or independent diesel fuel, because of its favorable physical and chemical properties (enumerated in the preceding paragraph) [36,37]. Butyl alcohol obtained from biomass is referred to as biobutanol [38,39]. Biobutanol may be produced from such plants as sugarcane and sugar beet, corn, grains, as well as derivative organic products obtained from agriculture and forestry, including straw, plant stalks, or wood waste [40,41,42,43].
The comprehensive research results presented in the literature aimed to compare the properties of butanol with those of conventional gasoline and diesel fuel as well as widely used biofuels—i.e., methanol, ethanol, and biodiesel—indicate that butanol has the potential to overcome many aspects of the disadvantages of low-carbon alcohols [44,45,46]. The main advantages of butanol include lower volatility, lower ignition problems, good mutual solubility with diesel without any solvents, more suitable viscosity as a substitute for diesel, and higher heating value [47].
The calorific value of butanol is higher (33.1 MJ/kg) as compared to ethanol (24.8 MJ/kg) and methanol (22.7 MJ/kg). This parameter, in combination with a higher stoichiometric air–fuel ratio, allows the use of higher levels of its share in motor gasoline without changing the engine control systems and distribution network. Oxygen content can improve the combustion process, resulting in less carbon monoxide (CO) and hydrocarbons (HC) emissions. In addition, butanol has a lower heat of vaporization than ethanol, which can reduce problems with fuel atomization and combustion in cold engine start conditions compared to typical ethanol fuels [48,49].
Compared with biodiesel, butanol contains more oxygen, which can reduce soot emissions, and nitric oxide (NOx) emissions can also be reduced due to higher heat of evaporation, resulting in a lower combustion temperature.
Among the major disadvantages of n-butanol should be noted the increased fuel flow due to the lower calorific value compared to gasoline (44.5 MJ/kg) or diesel (44 MJ/kg). In addition, a lower octane number than in the case of low-carbon alcohols inhibits the use of a higher compression ratio in higher efficiency spark ignition engines—and also, as a gasoline substitute—may create a potential problem due to higher viscosity [50].
With respect to the impact of butanol on CO, THC (total hydrocarbon), and NOx emissions, it should be emphasized that they can be reduced or increased depending on the specific engine (i.e., with partial or direct injection), operating conditions (i.e., with or without control of the air-fuel ratio, type of the timing gear), and on the mixture ratio [51].
The results of laboratory investigations on the impact of mixtures of biobutanol with diesel fuel on the combustion and emission characteristics of a four-cylinder diesel engine are presented in [52]. The tested fuels were a mixture of 10% biobutanol and 90% conventional diesel, 20% biobutanol and 80% diesel, and 100% diesel based on weight. The measurements were made at an engine speed of 1500 rpm and 30 Nm and 60 Nm engine load. NOx, CO, and soot emissions were lower than those from diesel under all test conditions, while HC emissions were higher than from diesel.
In addition, as the content of butanol in the mixed fuel increased, the experimental results showed that the ignition delay was longer than the ignition delay for diesel fuel for all studied injection times. The indicated unit fuel consumption of mixed fuels was higher than diesel fuel consumption. However, the exhaust gas temperature was lower than those from diesel fuel at all injection times.
Additionally, the results of studies on the CO, CO2, THC, NOx emissions for various types of cars as a function of fuel composition (e.g., butanol share) are presented in [53,54].
The CO2 emission values resulting from the use of n-butanol mixtures in diesel [55] and gasoline [56] engines in the context of the NEDC (New European Drive Cycle) driving test decrease, depending on the share of butanol in the mixture, by about 1–6% in comparison to pure gasoline or diesel (e.g., The mixing of 20% n-butanol with gasoline reduced CO2 emissions by 5.7%).
Energy recovery of lignocellulosic waste material in the form of liquid fractions can yield alcohol-based fuels such as bioethanol or biobutanol [57].
Physicochemical properties of fuels and their mixtures influencing chemical reactions in the combustion process and, consequently, gas emissions are discussed in detail in [58,59]. When analyzing biofuels, particular attention is paid to autoignition reactions and the rate of heat release [60,61].
Although butanol properties (boiling point, viscosity, octane number) predetermine it for the use in spark ignition engines as a partial substitute for conventional gasoline, a number of studies were carried out using butanol/diesel fuel mixtures in compression ignition engines.
The advantage of butanol is its ability to reduce the viscosity of composite fuels, especially when mixed with FAME or crude vegetable oil [62,63,64,65].
The results of laboratory tests aimed at determining the impact of a mixture of butanol derived from lignocellulosic material and FAME based on animal fat on specific fuel consumption and CO2, CO, NO, HC, and PM emissions of a diesel engine are available in the literature [62,66].
In [62], biobutanol derived from lignocellulose material was tested, which was then used as an additive for diesel engines. Biobutanol was used in fuel mixtures with FAME in the amount of 10%, 30%, and 50% butanol. 100% diesel and 100% FAME were used as reference fuel.
The laboratory tests carried out showed that the use of biobutanol in fuel reduced the production of carbon dioxide (by 15%), nitrogen oxides (by 35%), and PM (by 90%). Moreover, the use of biobutanol as an additive in FAME, especially in oils, significantly reduced the viscosity and density of the fuel.
Also in [67,68], conventional diesel, 30% biodiesel (FAME) and biodiesel with 25% n-butanol in a turbocharged diesel engine were compared. In all cases, the positive effect of butanol in diesel fuel on particulate, NOx and carbon dioxide emissions was found. In addition, a positive effect on smoke emissions has been noted for the n-butanol mixture.
The main disadvantages of FAME include poorer storage and oxidative stability. The high cost of the raw material is also important, especially when using vegetable oil as a raw material [21].
For environmental, logistic, and economic reasons, lignocellulosic biomass is a particularly attractive raw material for biofuel production. When selecting appropriate conversion methods, it is possible to obtain, among others, cellulosic ethanol, synthetic gas (bio-SG), or increasingly appreciated furan fuels (Furanics fuel) [69,70,71]. Furan fuels, i.e., compounds derived from furan, have been identified in the “Roadmap for Biofuels in Transport” prepared by the International Energy Agency (IEA) as future biofuels for which intensive development of production technology is expected by 2050. Currently, work on technologies for obtaining them is only at the stage of research and development.
Lignocellulose rich wood waste is very attractive thanks to a non-food character of the substrate and possibility to obtain second generation biofuel, i.e., fuel not competitive towards food. Poland has significant potential for production of waste wood and wood residues. Towards the end of 2017, the area of Polish forests amounted to 9242 thousand ha, which corresponds with the forest coverage ratio of 29.6% [72,73]. To compare, at the end of 2010 the area of forests was 9121.3 ha, which was equivalent with the forest coverage ratio of 29.2%. Thus, an increase in the country’s forest coverage ratio by 0.4% was recorded [74,75]. In 2017, 42,699 thousand m3 net of thick wood was produced in Poland, including 8607 thousand m3, i.e., 21.2% of all thick wood volume obtained in connection with forest clearing, acquisition of deadwood, wind broken trees, and trees damaged as a result of various weather occurrences and natural processes [76]. Thick wood production of 31,822 m3 was recorded in 2010, including 5686 m3 (17.8% of all thick wood obtained) of wood from forest clearing and ordering processes [77]. The figures do not include information on clearing of greens located along roads, acquisition of wood stock from parks and city green areas, residue from sawmills and wood processing companies; therefore, the quantity of lignocellulose rich matter which may be used for biofuel production is in fact much higher [78]. The choices of directions of technology development, as well as the choices of biofuel production technology are the matter of economic, social, political, and environmental issues. The carbon dioxide emission is one of the factors determining usefulness of particular biofuel production technology. Moreover, the use of edible or nonedible resources is another factor strongly affecting the eventual choice of technology. Consequently, the knowledge and understanding of phenomena occurring during burning of various fuels (including biofuels) in automotive, as well as other types of internal combustion engines, assures possibility of decisions concerning choices of types of biofuels and technologies of their production. All these factors, when established, provide tools for technology management in the area of biofuel production and distribution. This technological knowledge is also needed for undertaking legal decisions concerning allowable content of fuels available on the market.
The life cycle assessment methodology (LCA) [79,80] is increasingly used to maintain the environmental sustainability of biofuels [81,82].
The LCA investigations should be performed at the stage of technological process designing, what could result in more effective controls of environmental issues [83,84].
There are several recognized methods for assessing the life cycle impact, e.g., EPS 2000 (priority strategies for environmental protection), CML (Centrum voor Milieuwetenschappen Leiden), ecological indicator 99, IMPACT 2002+, ReCiPe, MIPS (material intensity per service) [85,86,87,88,89,90]. They are implemented in computer programs used in the LCA investigations, eg SimaPro, GaBi, Umberto [91,92,93]. Based on the results of computer calculations, under specific assumptions, it is possible to estimate the environmental impact of selected products or production processes. Comparing the results obtained, it is possible to indicate a product or production process that will have a minimal impact on the environment.

2. Materials and Methods

Taking into account the potential of obtaining lignocellulosic biomass which may be used for production of biobutanol, properties similar to conventional fuel and mitigation of negative environmental impact, this paper focuses on analyzing the impact of butyl alcohol on diesel engine carbon dioxide emissions.
The test used a simulation model of a contemporary diesel engine, reflecting the predefined work cycle. This allows elimination of hazard to the actual engine which, at the development stage, did not consider being powered with fuel different than conventional [94,95,96], while enabling achievement of complete results in an accessible form and within a short time.

2.1. Materials

The simulation used actual parameters of the Fiat Panda passenger car with a modern diesel 1.3 MultiJet II drive unit, compliant with the Euro 6 norm for exhaust gases [97,98,99]. The vehicle is equipped with the “start–stop” system, aimed at reducing the quantity of consumed fuel and the quantity of emitted exhaust gases [100,101]. The system allows switching the engine off if its operation is not needed at the given moment. In urban traffic, this takes place when the vehicle is not moving, which happens frequently due to the infrastructure and traffic management system. Such solutions enable reduction of exhaust gases and noise which, as fuel is not combusted and the drive unit is not in operation, are not emitted. Development of the engine stopping system while the vehicle is not in motion is caused by increasingly stringent limits governing harmful substance emissions and sound levels. Continuously decreasing acceptable values force engineers to seek additional solutions next to mere engineering modifications in contemporary combustion engines.
Emission limits for newly manufactured vehicles have been in operation since 2009 (the first application of emission limits in 2015). The limits on average carbon dioxide emissions for passenger cars in the European Union will be regular reduced from 130 gCO2/km in 2015 to 65 gCO2/km in 2030 [102,103,104].
The analyzed vehicle is characterized with the maximum power of 75 hp at 4000 rev./min and the maximum torque of 190 Nm at 1500 rev./min. Pursuant to the manufacturer’s data, fuel consumption in the urban cycle is 4.7 l/100 km, in the mixed cycle 3.9 l/100 km, with 3.5 l/100 km outside the city [105].
Table 1 presents basic technical parameters of the engine used in the simulation.
Table 1 gives the factory characteristics of the engine (selected parameters were used in the developed computer simulation) assuming that it is fully technically sound. Based on the characteristics given in the table, the full course of CO2 emissions cannot be determined for changes in load and engine speed. However, additional charts presented in the part of the article “The simulation model” show the course of CO2 changes used for the simulation as a function of rotational speed and engine load for the assumed fuels. These characteristics take into account the chemical composition of the fuel and calorific value, which determine the amount of fuel consumed and, consequently, the amount of CO2 emitted.
The simulation model used in the experiment enables utilization of fuels characterized with different properties. In order to analyze the emission profile, parameters of the following fuels were implemented: conventional diesel oil ON (as reference fuel), fatty acid methyl esters (FAME) (as the most common diesel fuel bio-additive), and butanol (main subject of the analysis). These fuels indisputably differ in terms of elementary composition and properties necessary from the point of view of combustion of the respective fuel. Table 2 compares properties of the fuels used.
The data in Table 2 demonstrate differences among the properties of diesel and alternative fuels. The greatest difference is noticeable in terms of oxygen content, which is absent in classic fuel, but present in biofuels, as well as in terms of carbon content where diesel shows the highest level among the analyzed fuels. Moreover, conventional fuel is characterized with the highest calorific value [106,107,108,109,110].
From the point of view of physicochemical properties and elementary composition, the use of 100% biofuel is not possible; however, highly desirable due to the ecological effects. The vehicle under analysis is certainly not 100% suitable for alternative fuels. Therefore, the authors used computer simulations in their research. The simulation considered both pure fuels and mixtures with diesel.
Table 3 presents particular proportions of fuels used in the model.
Moreover, the simulation takes into consideration operation of the “start–stop” system installed in the vehicle and, therefore, it reflects actual movement of the car in accordance with the predefined test.

2.2. Methods

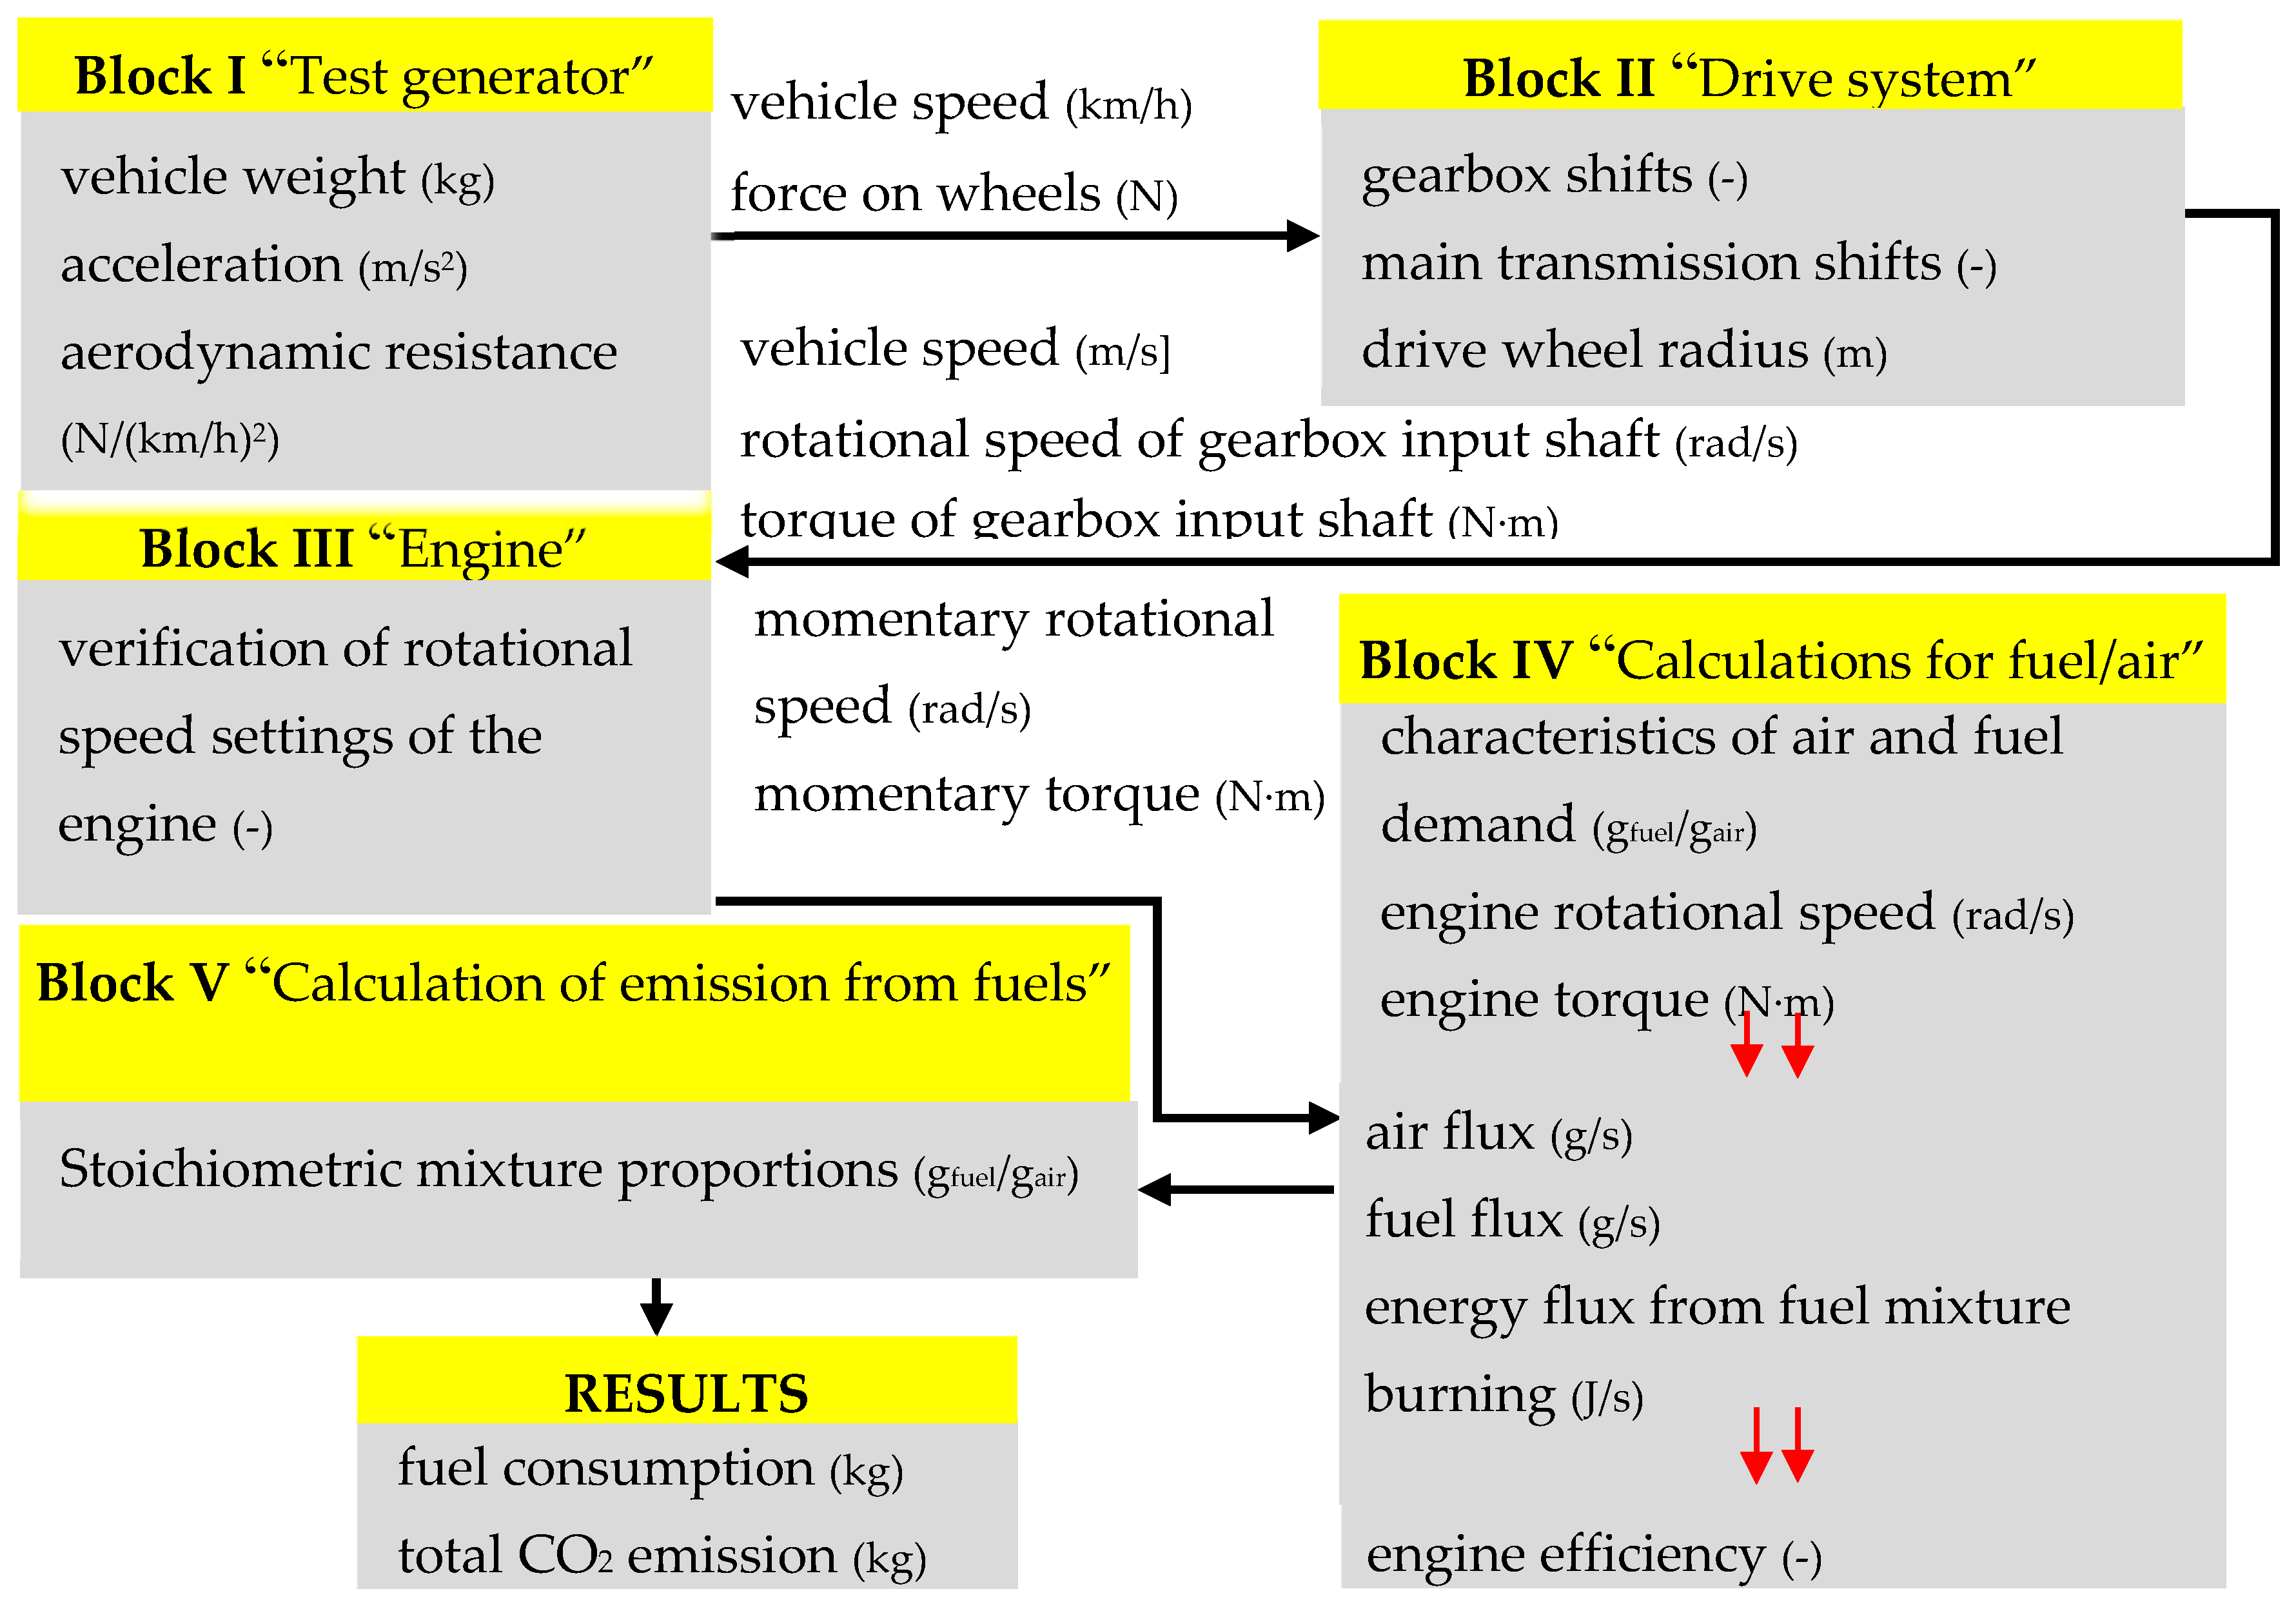
2.2.1. Simulation Model

The simulation model used in the analysis was developed in the Scilab environment, i.e., free of charge scientific software enabling execution of advanced mathematical calculations and algorithms [111]. It allows designing, performance of simulations, combining and recording of projects. Thanks to the possibility to resolve differential equations, linear and nonlinear systems, application of fast Fourier transform, development and optimization of algorithms, is an extremely useful tool in the case of more complex systems [112,113]. The Xcos package was used in connection with this analysis to prepare block diagrams reflecting actual dependencies in the analyzed engine. Graphical presentation of the modeled system, which is simple to use and which minimizes the risk of calculation error, is an indisputable advantage.
To be able to relate to reference emission levels applicable to the analyzed vehicle, the simulation used the WLTP procedure, being the latest homologation test which has covered all newly manufactured vehicles applying for traffic approval in the European Union since 1 September 2018 [114,115]. The previous test procedure was developed in the 1980s and it based on a theoretical driving profile. At the beginning, could be considered reliable, but dynamic technological development may provide additional variables which were not considered therein. A generalized approach to the model driving cycle and identical treatment of all analyzed vehicles rendered numerous irregularities and discrepancies revealed during more detailed tests of specific cars. It therefore became necessary to amend the vehicle testing procedure for cars to be launched on the market [116]. By assumption, the WLTP test reflects the actual vehicle operating conditions, considers the equipment installed in the vehicle, engine versions, as well as gear settings. The new WLTP test cycle takes 10 minutes longer than the previous procedure and the vehicle covers a distance by 12.25 km longer than during the NEDC test. Moreover, the new procedure features as many as four dynamic work phases, with approximately 52% in the urban cycle and the remaining 48% reflecting driving outside the city. The temperature in which testing is performed is also important. In the case of WLTP, it is the range of 14–23 °C, whereas NEDC was carried out in the range of 20–30 °C, which was remote from actual European conditions [106,117,118].
The diagram of the simulation model applied in the test is presented in Figure 1.
The simulation was divided into five blocks, with each one performing a separate function and providing vehicle operation and fuel combustion parameters necessary to carry out the WLTP test procedure and obtain results related to carbon dioxide emission for the analyzed fuels. Presented below.
Block I “Test generator”
The block is responsible for furnishing correct parameters, characteristic for the WLTP driving test, the distance traveled by the vehicle l, including vehicle acceleration a(t), vehicle speed and force generated on the wheels P1 [N] (calculation weight of 1020 kg). In order to determine these values, the module takes advantage of the vehicle’s technical data, such as: vehicle weight, rolling resistance, and aerodynamic resistance.
l = 0 t v ( t ) dt [ m ]
a ( t ) = dv ( t ) dt [ m s 2 ]
where:
  • v(t)—the momentary speed of the vehicle in the test (m/s)
  • t—the end time of simulation (s).
P 1 = F 0 + F 1 v ( t ) + F 2 v ( t ) 2   [ N ]
where:
  • v(t)—the momentary speed of the vehicle in the test (km/h)
  • F0—rolling resistance coefficient (N)
  • F1—linear resistance coefficient (km/h)
  • F2—aerodynamic resistance coefficient (N/(km/h)2).
The vehicle loads resulting from the accelerations acting on it are then calculated using equation:
P 2 = M d v ( t ) d t   [ N ]
where:
  • v(t)—the momentary speed of the vehicle in the test (m/s)
  • M—vehicle calculation weight (kg).
Table 4 presents values adopted for the analyzed vehicle.
Figure 2 below presents results obtained from that simulation block. The graphs illustrate such values as: v—speed of the analyzed vehicle; d—road in kilometers, covered during the test; F—force acting on the vehicle’s wheels; and p—current gear in which the vehicle is driving.
Block II “Drive system”
This block involves calculations related to such signals as the vehicle driving speed, gearbox input shaft torque, its rotational speed for the gearbox. In order to determine these values for the model correctly, data regarding the vehicle wheel radius, drive system ratios for the rotational speed, and drive system ratio for torque were implemented.
M u n = ( P 1 + P 2 ) R R 1   [ N m ]
where:
  • Mun—torque acting on the gear shaft (N·m)
  • P1—momentary force on wheels from resistance to motion (N)
  • P2—momentary force on wheels from inertia (N)
  • R—wheel radius (m)
  • R1—drive system shifts for the torque (-).
ω u n = v ( t ) R R 2 [ r a d s ]
where:
  • ωun—rotational speed of the gear shaft (rads/s)
  • v(t)—the momentary speed of the vehicle in the test (m/s)
  • R—wheel radius (m)
  • R2—drive system shifts for rotational speed (-).
Table 5 identifies the values of those parameters used in the developed model.
Results obtained from this block are presented in Figure 3. The graphs correspond, respectively, for: ωk—vehicle wheel angular velocity; ωp—engine angular velocity; Mk—torque on vehicle wheels; and Mp—torque on engine.
Block III “Engine”
The “Engine” module plays a verification role in the developed model. It is responsible for verification of values obtained from the preceding blocks in terms of presence thereof in the admissible range of engine rotational speed variability. This allows eliminating deviations and distortions in the model, which could lead to incorrect results. If previously obtained rotational speed momentary values (rad/s) and torque values (N·m) are correct, they are passed on to further simulation blocks.
M s i = { M u n ; M u n > 0   N m 0   N m ;   M u n 0   N m   [ N m ]
ω s i = { ω u n ; ω u n > 83.7   rad / s 83.7 rad s ;   ω u n 83.7   rad / s [ r a d s ]
where:
  • Msi—momentary torque on the vehicle’s gear (N·m)
  • ωsi—momentary rotational speed on the vehicle’s gear (rad/s).
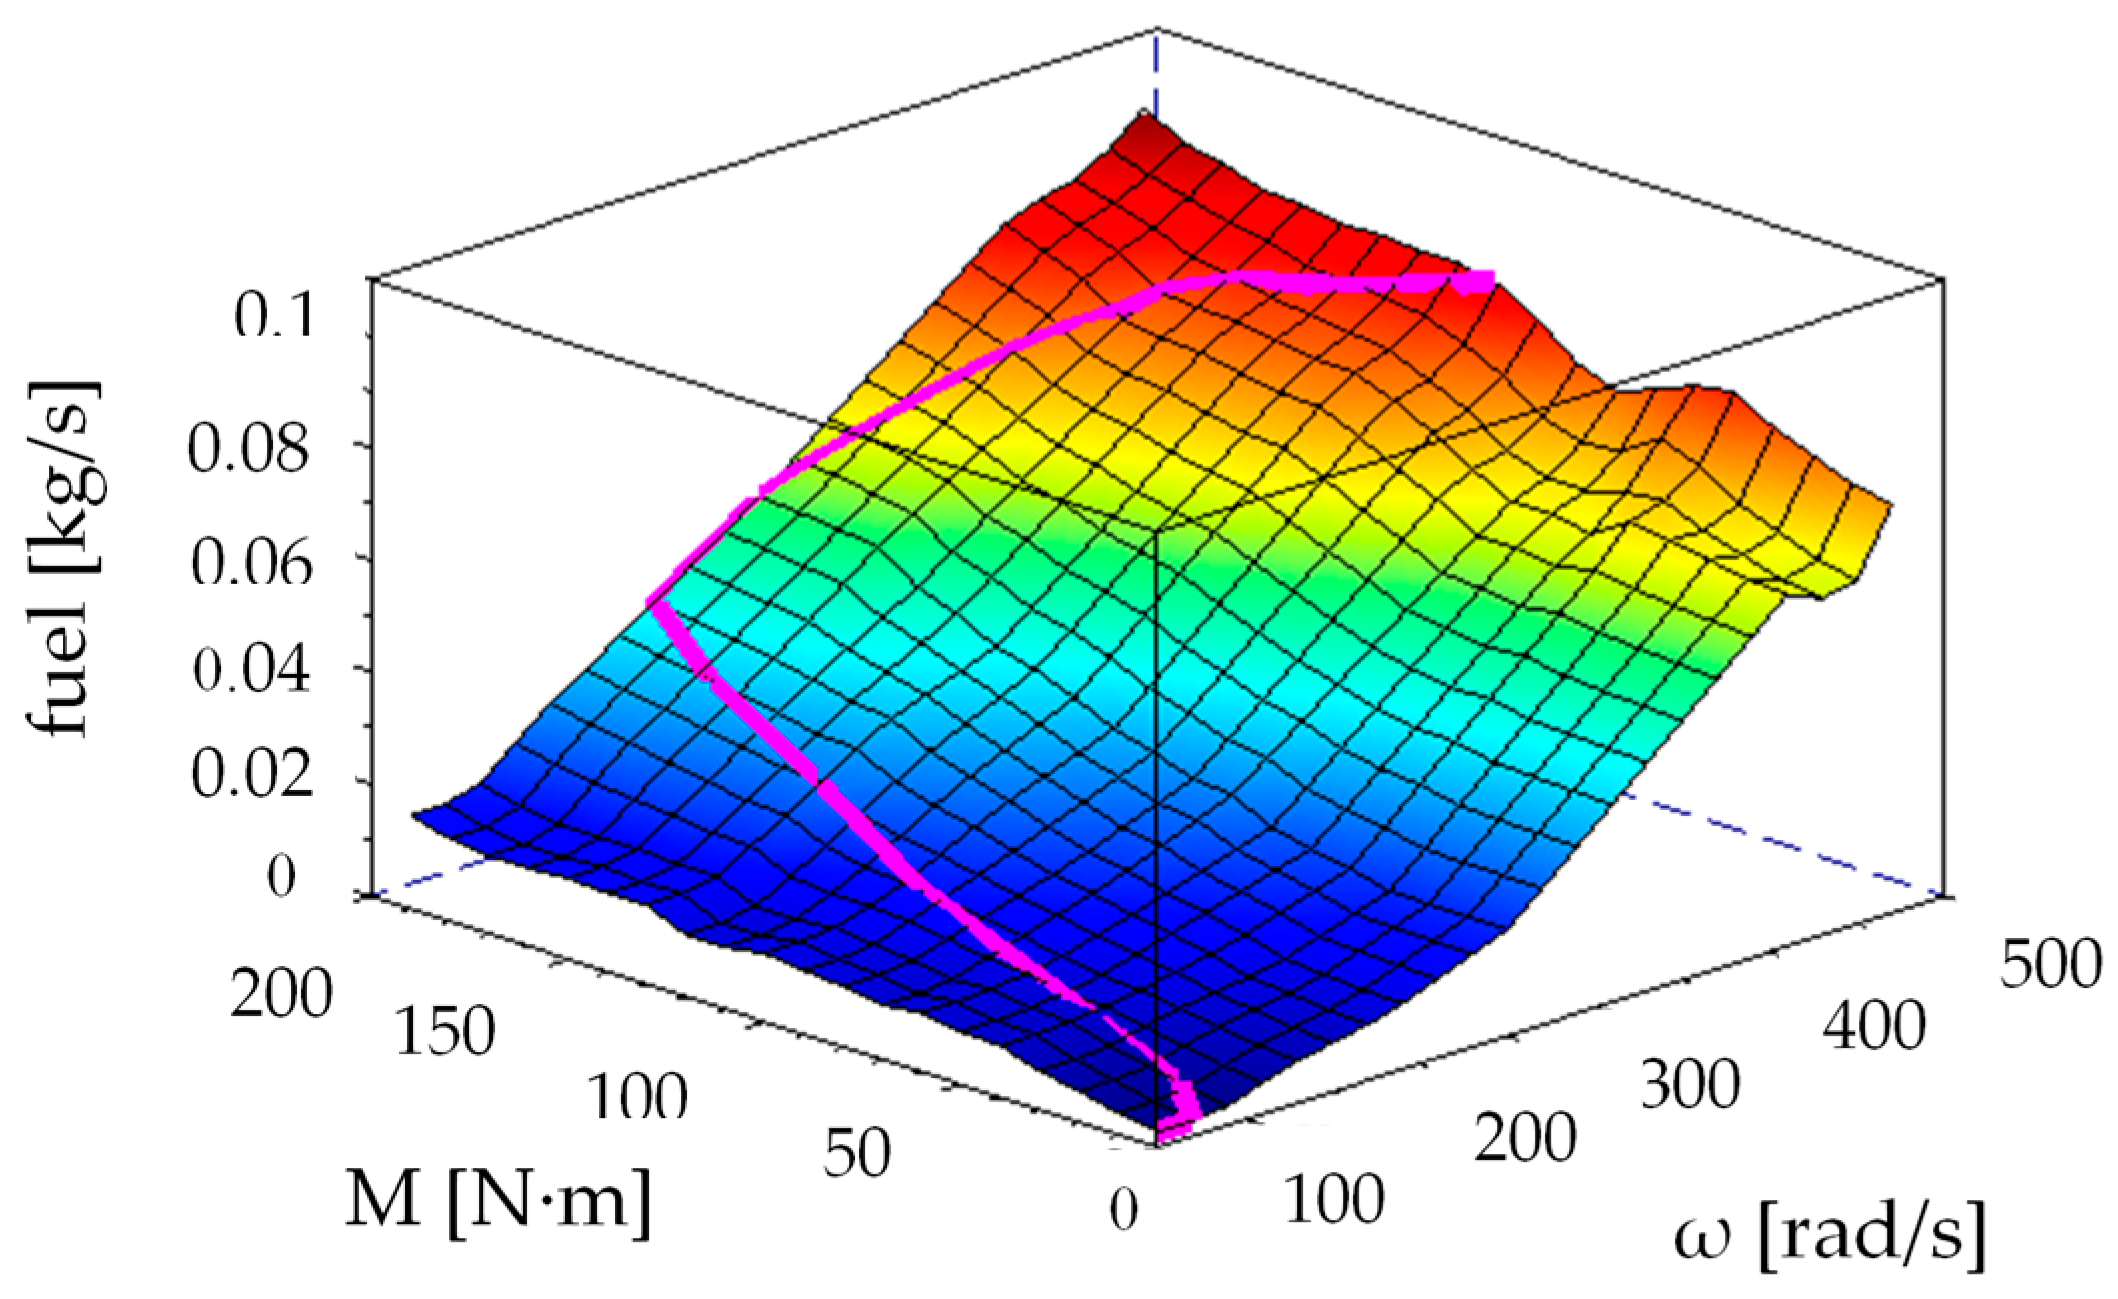
Block IV “Calculations for fuel/air”
“Calculations for fuel/air” is the most structurally developed block, which allows determination of fuel (Figure 4) and air consumption values (Figure 5), necessary for conducting correct fuel combustion in the test and determination of aggregated values of those elements. The module is based on universal fuel and air mixture demand characteristics.
The characteristics used in the simulation were developed on the basis of published experimental studies conducted on the engine test bench. Detailed numerical values from which the spatial distributions were based (Figure 4 and Figure 5) present literature items [98,99].
Figure 4 shows the characteristics of the output of the analyzed fuels per one diesel engine injection as a function of changes in speed and changes in torque produced by the engine.
Diesel fuel is characterized by the lowest values of fuel expenditure per injection as a function of engine speed and torque generated by the engine due to the highest calorific value among the analyzed objects (44 MJ/kg). For the fuel with the lowest calorific value of butanol (33.1 MJ/kg), the characteristic curve of output per fuel cycle for changes of rotational speed and torque takes the highest values. In the case of FAME fuel with calorific value (37 MJ/kg), the fuel flow rate per 1 injection is obtained between fuels with extreme calorific values.
It is seen on Figure 4 that plots shown on the figures are very similar with respect to their shape, only the values of fuel flow at corresponding points are slightly different. The whole plot for butanol is located above the FAME, and diesel fuel occupies the lowest position.
Determination of values related to the fuel flux and required quantity of air, taking into account the fuel calorific value, produces the value of energy flux from burned fuel. That is followed by determination of temporary engine efficiency. With all of the above parameters, based on integrating modules, one can determine values for the fuel and air mixture consumed in the test.
fuel ˙ = ffuel ( ω si ,   Msi )   [ g s ]
air ˙ = fair ( ω si ,   Msi )   [ g s ]
where:
  • fuel ˙ —fuel flux (g/s)
  • ffuel —function of hourly fuel consumption depending on rotational speed and torque (g/s)
  • air ˙ —air flux (g/s)
  • fair —function of hourly air consumption depending on rotational speed and torque (g/s).
The simulation developed provides for the possibility to include or exclude simulation elements accounting for operation of the start–stop system. If the vehicle stops during the driving test simulation performed and the said system is switched on, calculations are performed in accordance with the following dependencies:
o n ˙ s = { o n ˙ ; v ( t )   > 0   m / s   0 ;   v ( t ) = 0   m / s [ g s ]
a i r s ˙ = { a i r ˙ ;   v ( t )   > 0   m / s   0 ;   v ( t ) = 0   m / s [ g s ]
Figure 6 presents graphs of such results as: fuel—fuel consumption; air—air consumption; Fuel—aggregated value of fuel consumed in the test; Air—aggregated value of air consumed in the test.
Block V “Calculation emission from fuels”
The block is responsible for determination of carbon dioxide emission value for the respective fuel. Carbon dioxide emissions per diesel, FAME, and biobutanol injection cycle are shown in Figure 7.
For carbon dioxide emissions per diesel injection cycle, as shown in the diagrams below, there are clearly smaller differences in the characteristics of the speed and torque variations than for the fuel expenditure characteristics shown above. This may be due to the high oxygen content of biofuels that have already been chemically bonded to carbon atoms, which results in a slight increase in carbon dioxide emissions.
Using the engine emission profile, it defines momentary CO2 mass values and aggregated values throughout the test.
C O 2 ˙ = f C O 2 ( ω s ,     M s )   g C O 2   s p a l ˙ / g s p a l [ g s ]
C O 2 ( t ) = 0 t C O 2 ˙ ( t )   d t   [ g ]

2.2.2. LCA Method

The LCA methodology is exists in several variants and interpretations of key concepts. There are two alternative approaches used in LCA—the attributional model and the consequential model. Attributional life cycle assessment (ALCA) estimates the share of global environmental loads that a product belongs to. The consequential LCA (CLCA) gives an estimate of how global environmental loads affect the product production and use. The distinction was created to resolve debates on what input should be used in the LCA and how to deal with allocation problems. ALCA is based on average data, and the allocation is done by sharing the environmental burden of the process between the life cycles supported by this process. CLCA in principle uses marginal data in many parts of the life cycle and avoids allocation through system expansion.
Each of the models is associated with significant parametric and model uncertainty, and estimating the impact of biofuels on the climate requires many subjective choices [119,120,121].
A review of the literature for biofuel modeling shows that the authors use both CLCA [122,123,124,125] and ALCA method [126,127].
It should be emphasized that the intention of the authors of the present paper is not to attempt to disqualify the specific capabilities of any of the LCA analysis models, but to attempt to analyze the behavior of a non-steady state complex system.
The simulation model developed in connection with this analysis provides data on direct carbon dioxide emissions. Emissions originate from elementary composition of the fuels used and characteristics of the combustion process in the respective engine [128,129]. Results are obtained based on differential equations, characterizing the process of fuel burned by the vehicle and resulting quantities of exhaust gases emitted from the exhaust system. The method is in line with vehicle homologation tests; yet, in the context of environmental impact assessment for particular fuels, it may be insufficient. To supplement the analysis, it was extended to cover the LCA analysis, which is considered crucial for accomplishment of the sustainable development policy and a reliable tool for conducting environmental analyses in the context of specific products, including fuels. LCA tools are perceived as a foundation of state-of-the-art management of the environment related and decision processes which have real impact onto various areas of natural economy. Due to their scope and a broader perspective of the respective product, numerous state strategic documents and policies identify LCA analyses as mandatory. The product life cycle considers consumption of materials, energy, and resources, as well as the effects of processing thereof not only at the time of actual use of the product, but also at the stages of production and disposal. The analysis commences from mining of resources necessary for manufacturing the product and includes all energy and material expenditures connected therewith. Subsequently, it focuses on manufacturing of a specific product. Next, it considers the stages connected with using it, to finally take into account the process of disposal or decomposition. It can therefore be seen that it is much more detailed than typical analyses focusing solely on direct use of the item in question. LCA analyses prove extremely useful during decision making processes based on identification of processes or products which will be the least harmful to the environment throughout their life cycle. In combination with knowledge regarding costs, ease of use, and production technologies, one may identify solutions constituting the least burden to the natural environment, which is strictly connected with management in accordance with the ideas of sustainable development and performed more and more often worldwide. Detailed techniques related to process and product life cycle assessment are defined in the ISO 14040 international standard [130]. The document defines the necessary documents required for proper execution of the analysis, including: inventory of the set of material data; environmental impact analysis of elements connected with the identified data; interpretation of results of performed analysis, as well as reference of the impact assessment to the research subjects analyzed.
Life cycle assessment ought to contain an identified objective and scope of analysis, identified data set, assessment of impact onto particular elements, and properly interpreted results.
The LCA analysis of the fuels used was performed in three stages. It was accomplished with the SimaPro ver. 9.0.0.48 software, designed for execution of professional environmental impact analyses both in business and scientific areas. The tool enables the analysis and monitoring of important information from the sustainable development perspective. With the use of that environment, one may perform modeling and analysis of even complex product and process life cycles as well as of their actual environmental impact on each of the stages. What is more, SimaPro is fully compliant with the guidelines identified in the ISO 14040 standard and, as such, it constitutes a source of reliable results which may be used in product related decision-making processes.
The first stage of the analysis involved determination of the impact from production of the fuels in question onto particular elements of the environment. It considered the following areas: “ecosystem quality”, “climate change”, “human health”, and “resources” in the context of carbon dioxide emission during fuel unit production processes. This stage involved use of the IMPACT 2002+ method, which identifies impact of the analyzed product onto the environment and people. The method bases on modern exotoxicity comparative analysis for both environmental elements and those related to human health.
The next stage of analysis involved the Greenhouse Gas Protocol method, based on which information regarding carbon dioxide emission is obtained. The method is based on the greenhouse gas emission protocol and distinguishes four result segregation categories: “Fossil CO2 eq”—carbon dioxide emission from fossil fuel conversion; “Biogenic CO2 eq”—emission caused by plants and trees; “CO2 eq from land transformation”—emission connected with transformation of land; and “CO2 uptake”—that is carbon dioxide value captured during the given process. The analysis relates to the production stage of a specific product. Any information concerning the methods of formation, energy consumption during the processes, and their progress is contained in extensive libraries of the SimaPro software.
The final, third stage utilizes data obtained pursuant to the Greenhouse Gas Protocol method regarding carbon dioxide emission during production of a reference unit of the analyzed fuel. Emission values from the production stage are combined with data obtained from the simulation model, which allowed assessment of the emission rate from the fuels throughout their life cycle, from production to conversion into thermal energy. Table 6 below presents input parameters applied in the LCA analysis of the discussed fuels.
The service of life car was adopted according to the LCA analysis performed for its cars by a leading manufacturer of commercial vehicles [131,132]. In addition, a literature review confirms that the value of 150,000 km is in accordance with ISO 14044 [110,130].
A relatively frequent practice in scientific publications is use of reference emission values published by vehicle manufacturers, which results in generalization of analysis results. One needs to stress that such a value relates solely to powering the vehicle with conventional fuel and, as such, it cannot be taken into consideration in analyses related to alternative fuels. It was, therefore, reasonable to implement in this study direct carbon dioxide results obtained from the developed computer simulation.

3. Results and Discussion

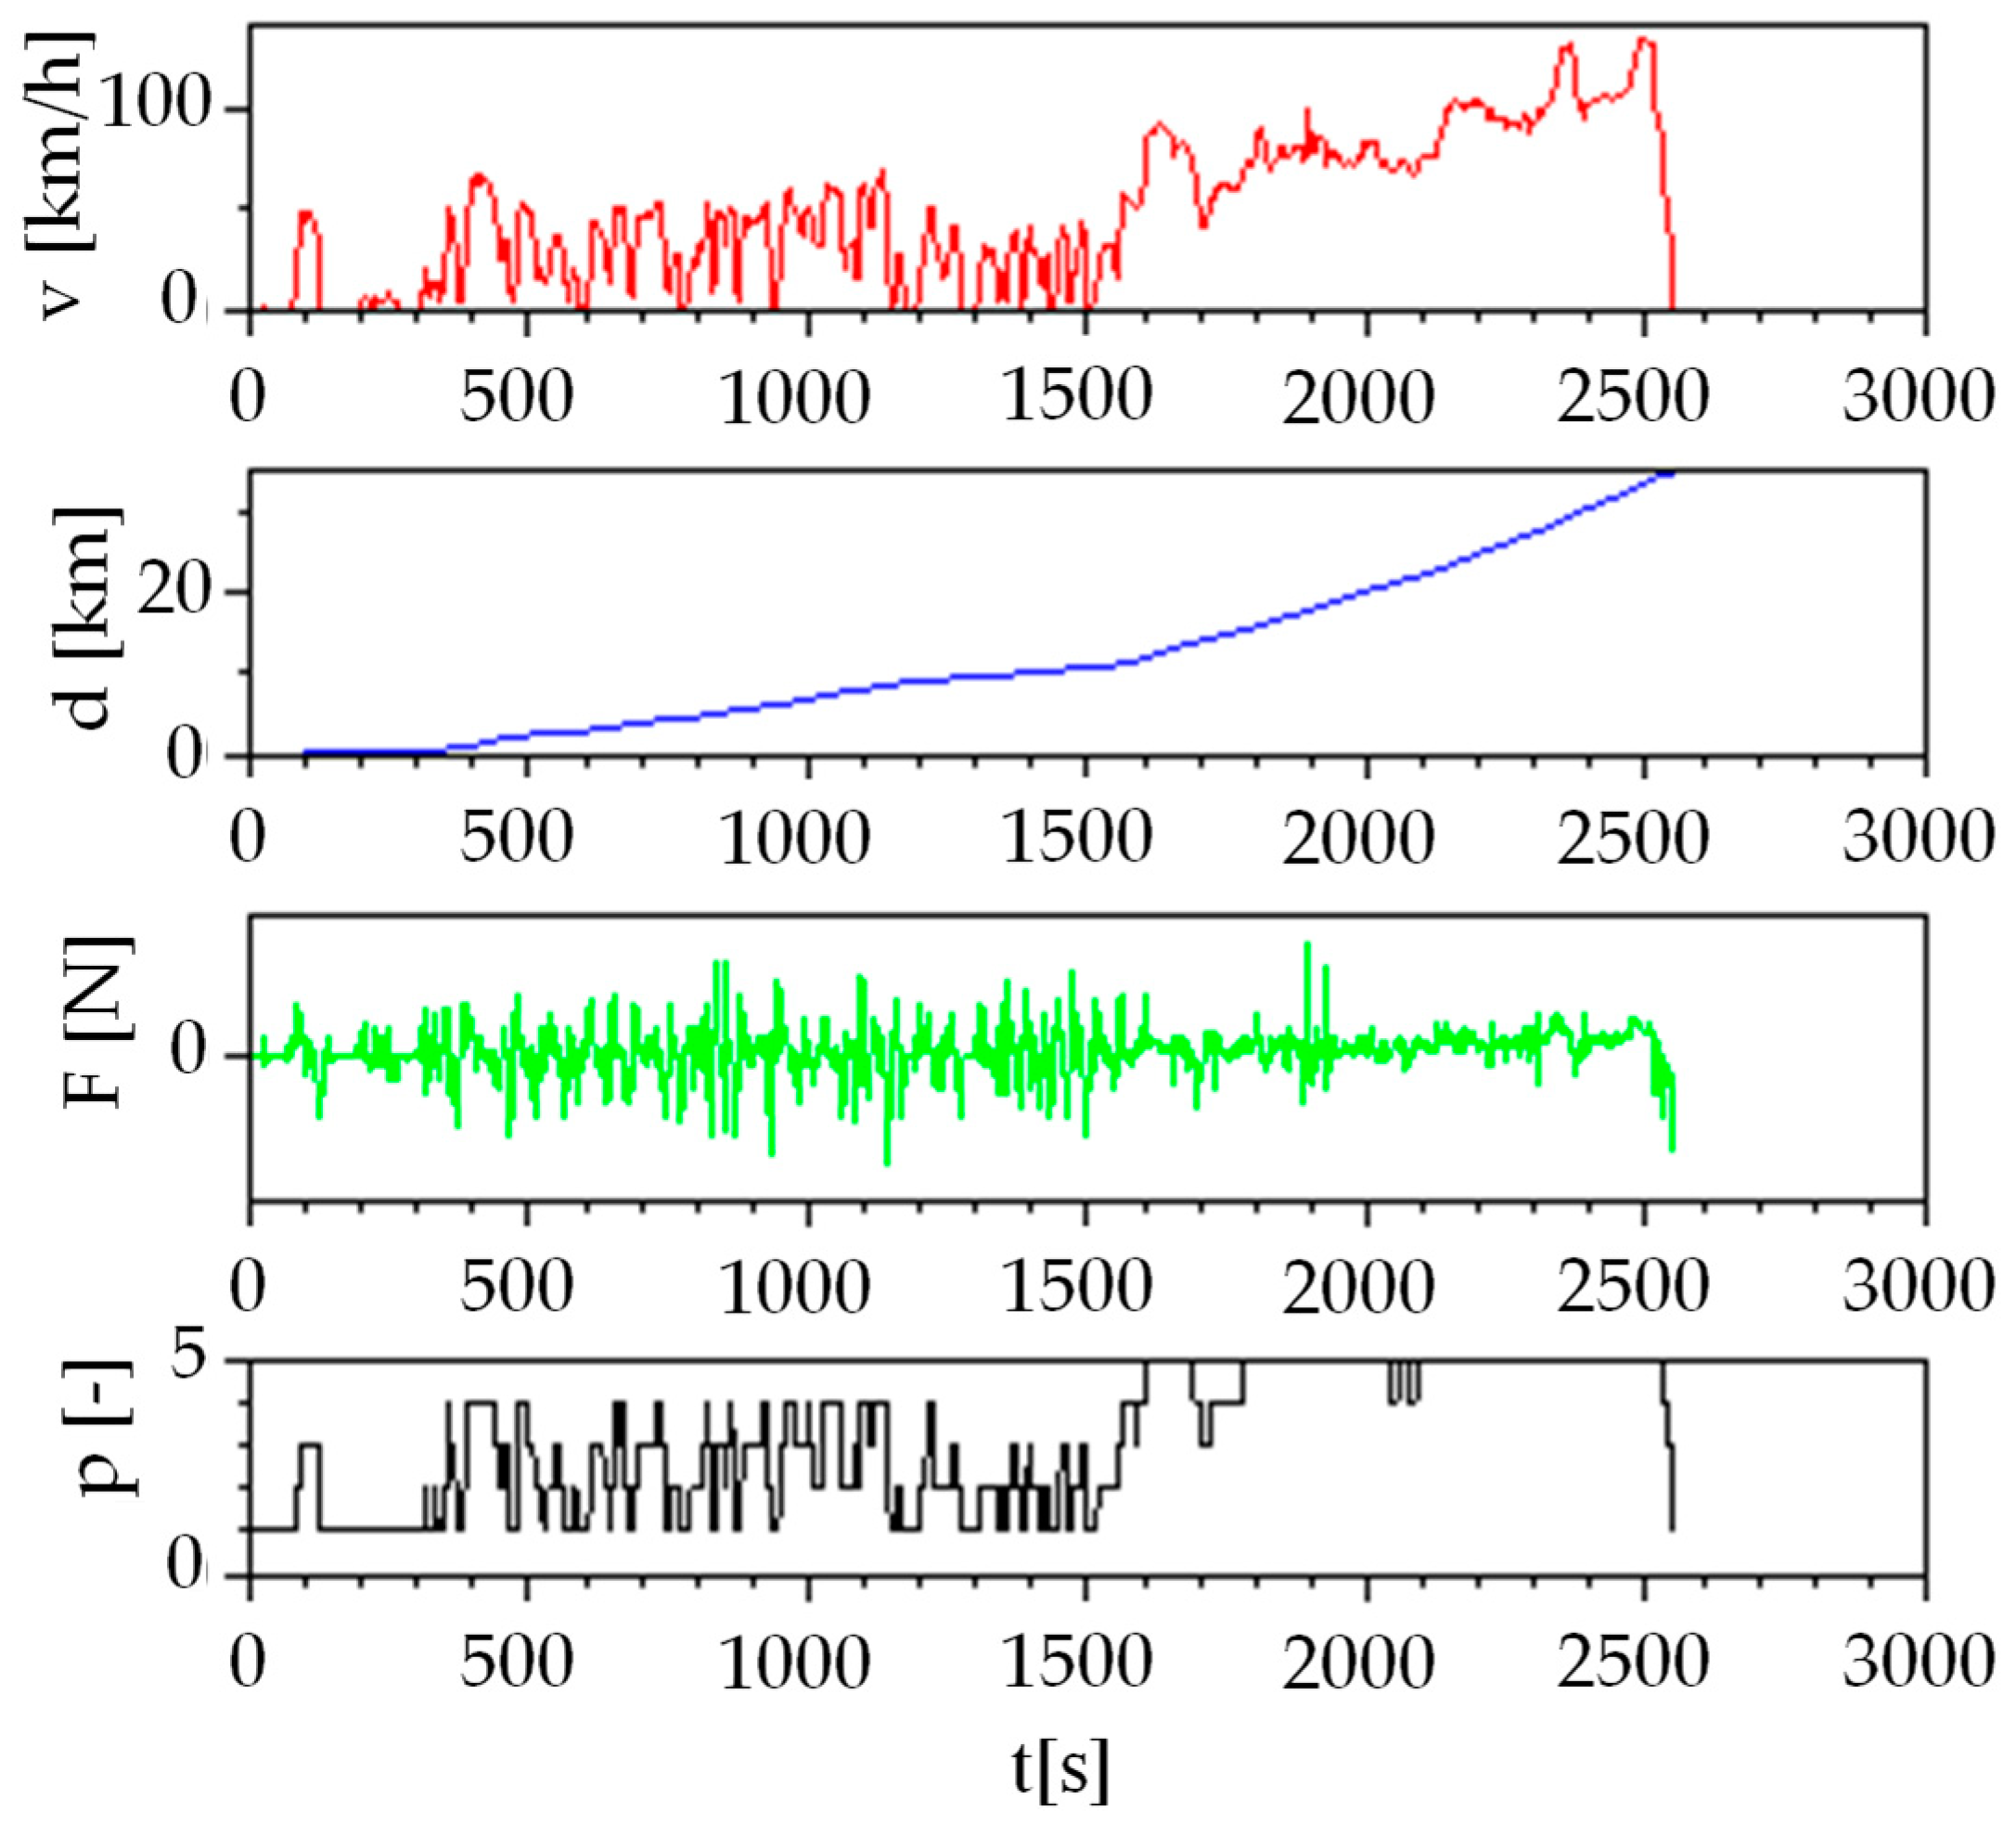
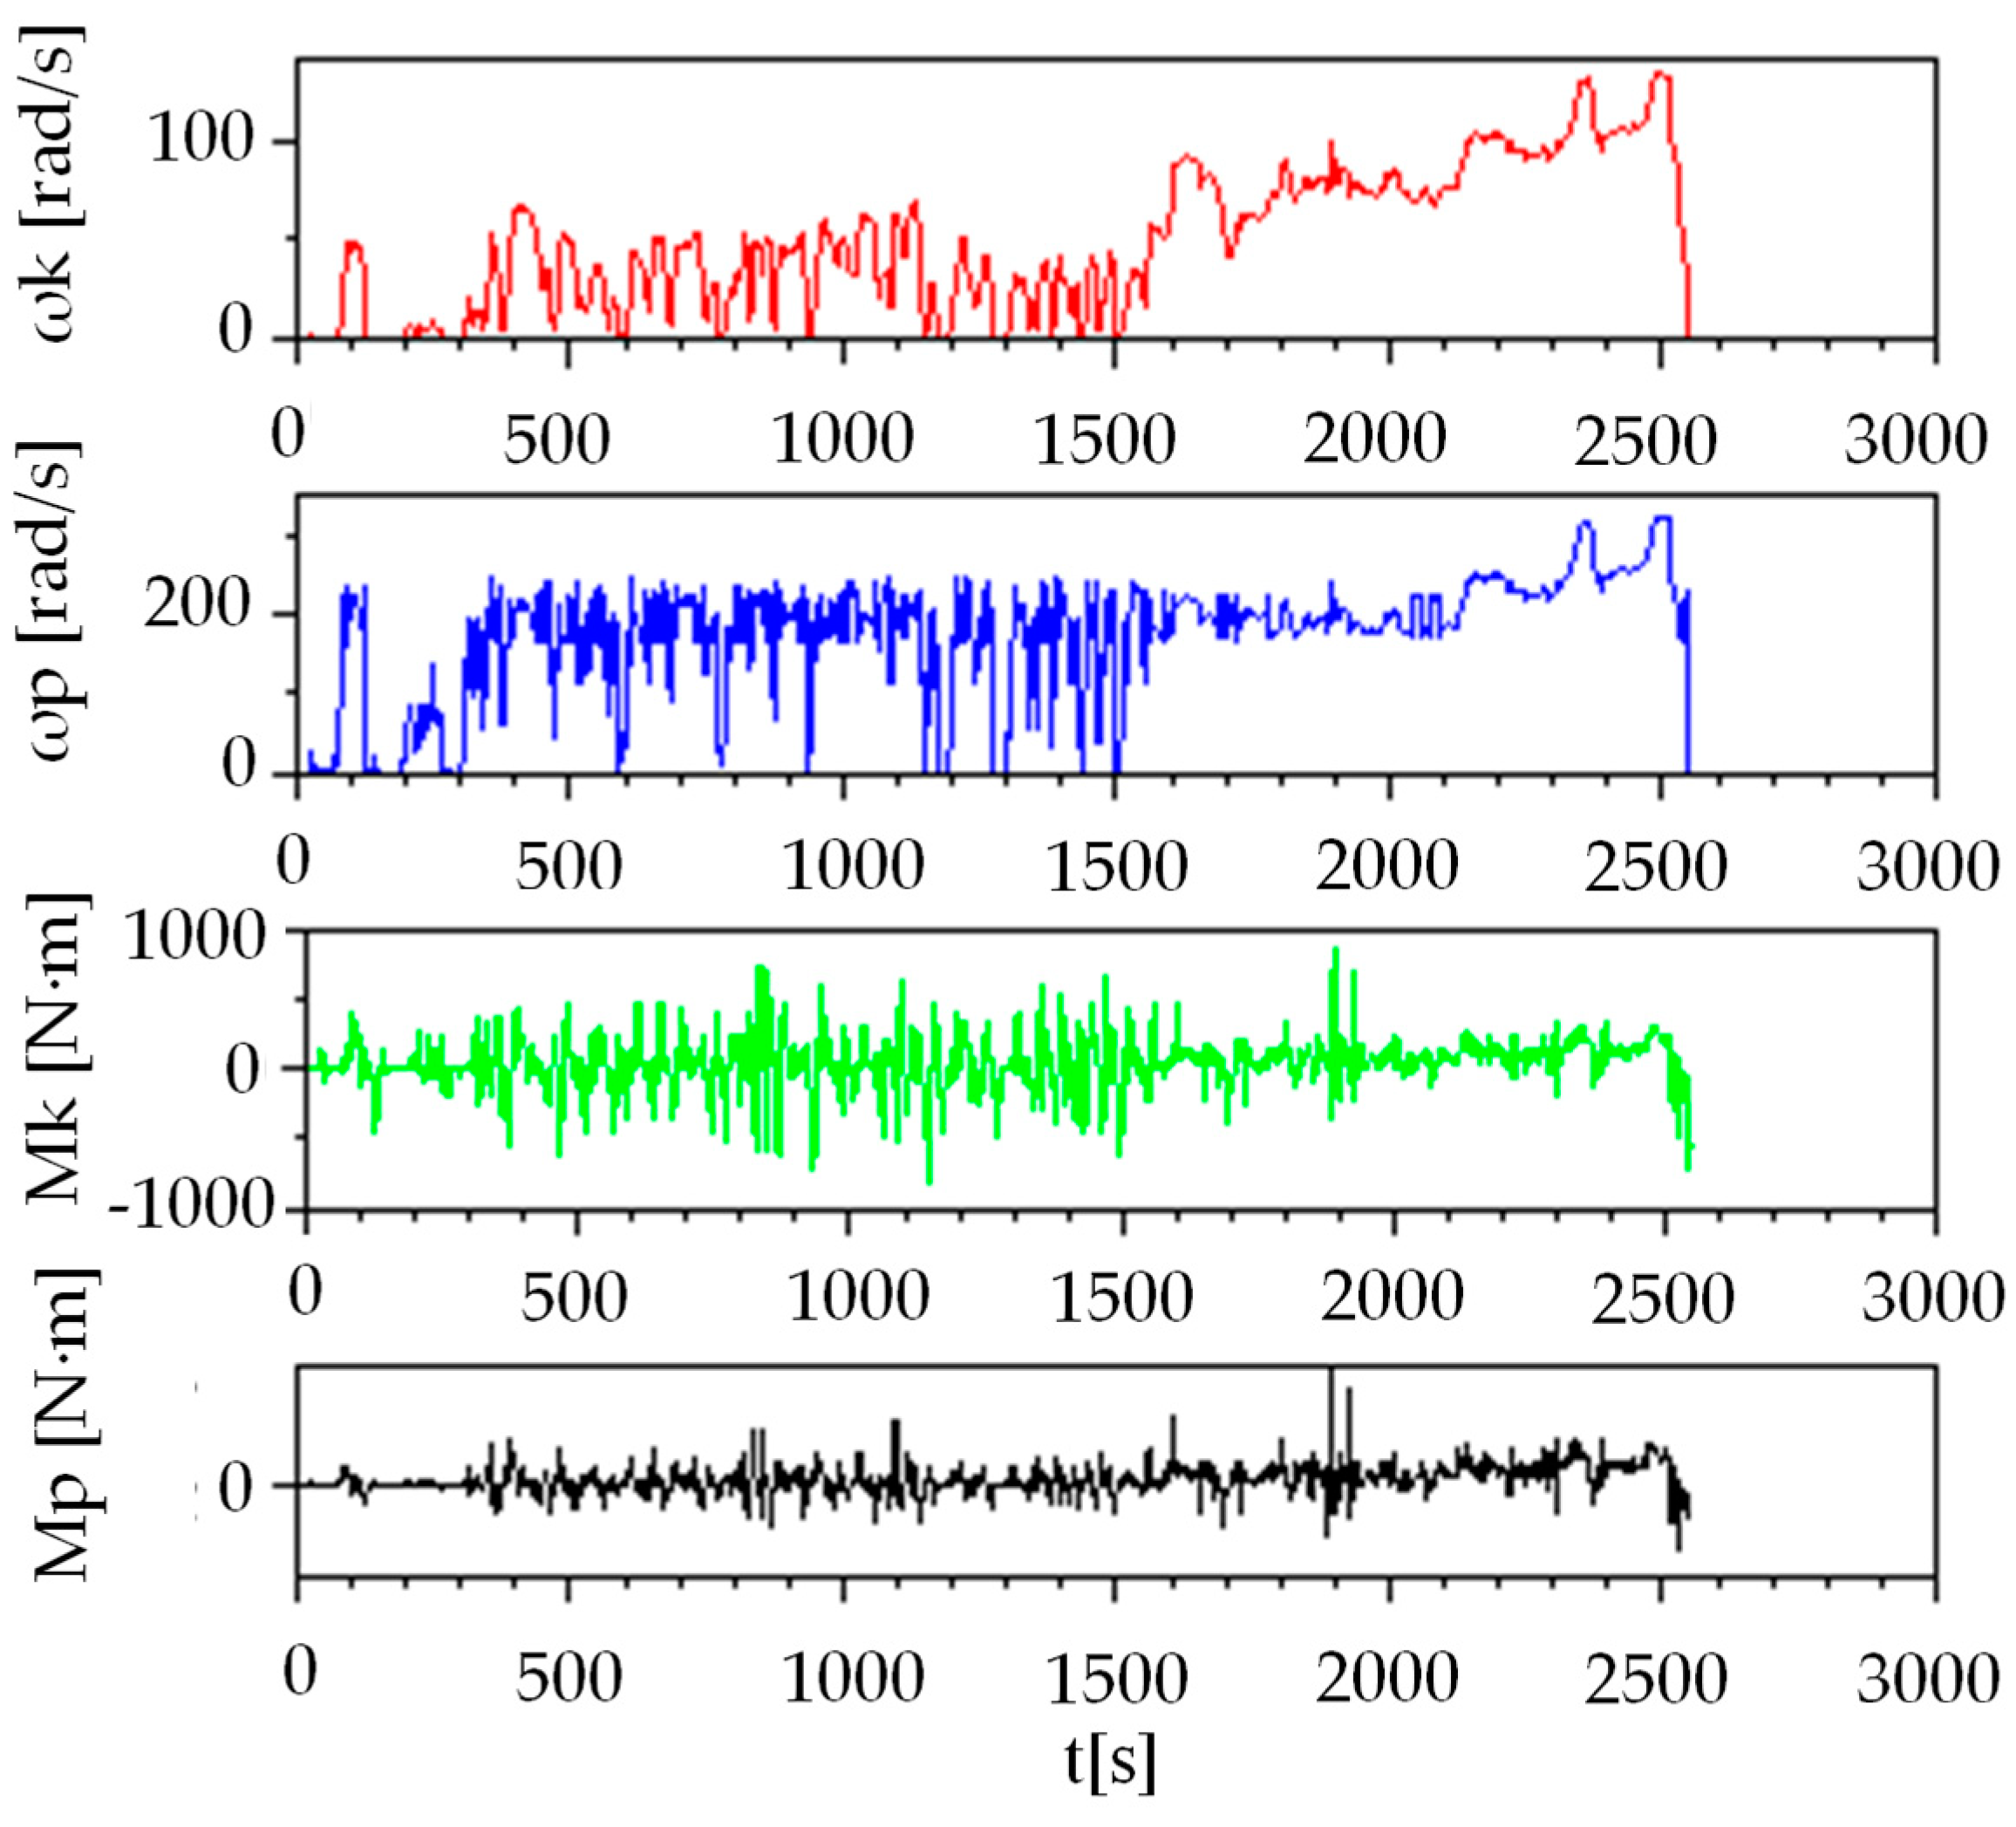
3.1. Result from Simulation

The developed simulation allowed execution of an experiment using different mixtures of fuels with conventional diesel. Figure 8 below presents fuel consumption (value of the end of fuel used during the entire WLTP test) in the function of respective additive content.
Graph A (Figure 8) presents fuel consumption during vehicle operation taking into account the start–stop system, while in graph B (Figure 8) the system is switched off. Stars mark butanol, while circles—FAME fuel. As can be seen, higher fuel consumption for both operation modes is shown by butanol. Moreover, one can generally notice higher consumption of the medium in graph b, which confirms correct operation of the model considering the “start–stop” subsystem.
Figure 9 presents carbon dioxide emission profile graphs in the function of additive content, taking into account operation of the “start–stop” system (final value of CO2 emission during the entire WLTP test).
Pursuant to the above graph, higher carbon dioxide was demonstrated by the FAME fuel. Butanol, along with increasing share of it as an additive in the mixture, reduced carbon dioxide emission. Similarly to fuel consumption, the “start–stop” system (Figure 9) contributed to much lower CO2 emission than in the case of engine operation without it.
Table 7 below presents emission results in the test. Emission corresponds with total weight of carbon dioxide emitted for particular fuels (100% fuel content) after execution of the test cycle. Moreover, the value was recalculated into a comparative unit and compared with the reference value defined in the regulation [70].
The table above shows that analyzed biobutanol is characterized with the lowest total carbon dioxide emission. In terms of emission, conventional diesel fuel turned out second, while the most common biofuel (both as an additive and as fuel itself) was characterized with the highest emission level. This interesting result was verified on the basis of tests published in the literature, being carried out on an engine test bench. Studies confirm that carbon dioxide emissions at individual measuring points are highest when the engine is powered by methyl esters [133,134]. These results are due to the fact that rape oil fatty acid methyl esters (FAME) have a different elementary composition and different physicochemical properties influencing the course of processes occurring in the cylinder.
As seen in Table 8 the stoichiometric content of biobutanol and two examples of methyl esters of fatty acids the butanol has the smallest carbon content, and also the highest content of oxygen. These observations are in agreement with the emissions reported in Table 7.
The increase in carbon dioxide emission in the case of feeding the engine with plant oil esters is compensated for by the fact that, in this case, the carbon dioxide circulates in a closed circuit in the environment. Esters make a renewable fuel obtained from plants which, for production of organic matter in the photosynthesis process, use atmospheric carbon dioxide and release oxygen to the atmosphere.
The fuels in question exceed the admissible carbon dioxide emission level determined in the standard applicable to the specific vehicle. Still, one needs to emphasize that the analyzed vehicle was approved under the NEDC procedure which, as stated above, generalized the data related to movement of the vehicle in actual conditions.

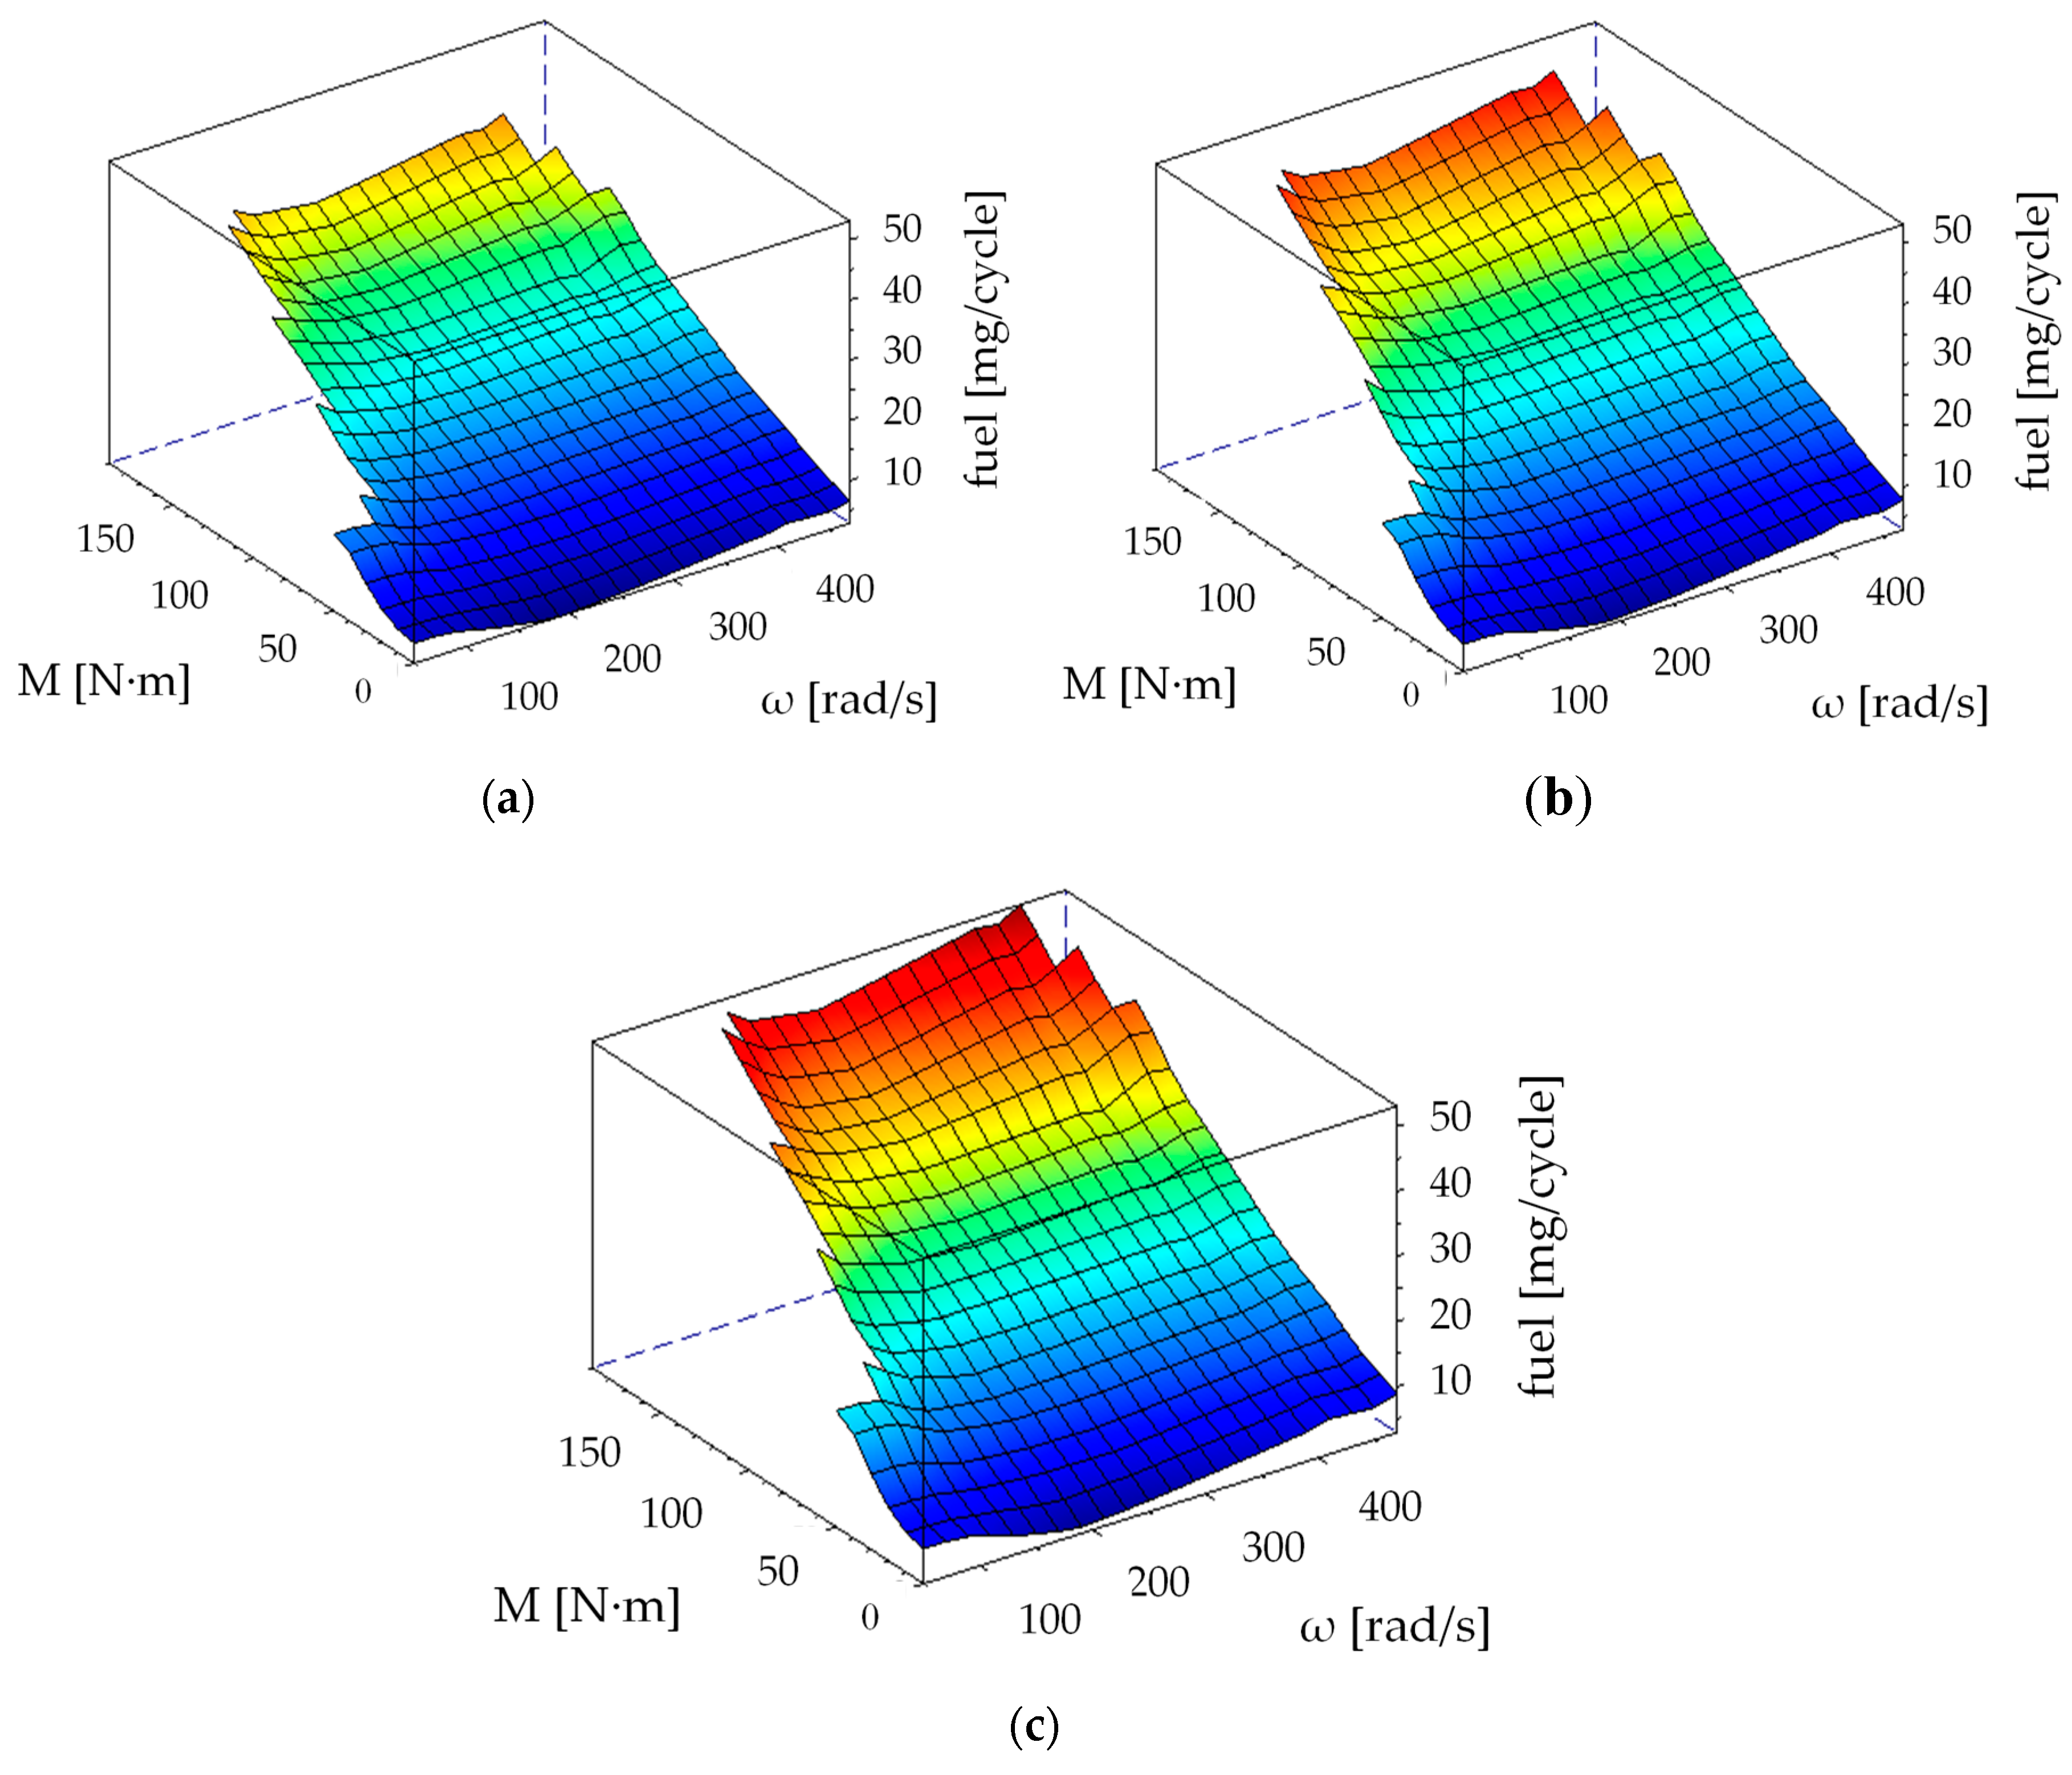
3.2. Result from Simulation

Figure 10 presents analysis results for the analyzed fuels pursuant to the IMPACT 2002+ method. For the sake of graph legibility, presentation of results in the ‘single score’ mode, i.e., aggregated graph, was selected. In this form, results are presented in the mPt unit.
Based on Figure 10, it may be inferred that the fuel characterized with the greatest environmental impact at the production stage are fatty acid methyl esters (FAME). This solution demonstrates significant influence onto ecosystem quality, as the fuel is obtained from oil plants. Cultivation of such plants requires transformation of land in production related purposes, which results in a high value of the coefficient. However, this fuel has beneficial impact onto climate changes, similarly to biobutanol, because—as fuels obtained from organic matter—they have negative environmental impact thanks to natural carbon dioxide absorption. The above results from the life cycle of plants and trees they are obtained from, as an assumption is made regarding balancing of CO2 absorbed during the photosynthesis cycle with carbon dioxide produced at further stages of the fuel’s life. Conventional diesel fuel showed the greatest impact onto natural resources, which is caused by production of the fuel from crude oil.
The next step involved analysis related to production of selected fuels exclusively in terms of carbon dioxide emission. Figure 11 below presents results of the Greenhouse Gas Protocol method.
Based on the results obtained under the GGP method, it may be concluded that FAME is the fuel characterized with the lowest carbon dioxide emission in production processes. Butanol came second, while the highest level of emission was connected with production of diesel fuel. In the case of biofuels, negative emissions result from carbon dioxide absorption by plants used for production of the fuel. This process may also be included in production of butanol from waste biomass. Consequently, considering the whole product life cycle, it may be concluded that industrial fuel production is characterized by greater emissions than acquisition of energy media from organic matter.
The last stage of LCA analyses involved comparison of direct emissions obtained in the simulation with those obtained pursuant to the GGP method. In order to evaluate the whole life cycle of the fuels and their total emissions, the data were aggregated taking into account the assumptions stated in the Methods section. Results from combination of production emissions with those from fuel burning are presented in Table 9.
Based on the above results, it may be concluded taking into account the whole life cycle of the fuel that the medium characterized with the lowest carbon dioxide emission turned out to be FAME. Analyzed biobutanol demonstrated an emission of 12.43 tonnes CO2, which is still half of the emission from conventional diesel fuel characterized with the highest carbon dioxide emission level. In the comparison, influence of the start–stop system installed in the vehicle is also noticeable which, if used, resulted in the exhaust gas emission level lower by—on average—app. 1.66% than if the system was not installed in the vehicle. The greatest influence of the start–stop system was observable for biobutanol. The higher is hydrogen content in the fuel as compared to the carbon content, the lower is the CO2 emissivity 13.4/86.5 (0.1549) ON, 12.0/78.0 (0.1538) FAME, 13.5/64.8 (20.83) biobutanol. It follows that diesel has the highest CO2 emissions, followed by FAME, and biobutanol the lowest.
The results of the analysis of carbon dioxide emissions in the context of the fuel life cycle are shown in Figure 12.
Figure 12 shows that each fuel has different emissions depending on its life cycle. After taking into account the emission data resulting from the fuel life cycle, the final results are summarized in Table 10.
In the case of butanol, total emission is half of that recorded for conventional fuel.
The FAME fuel showed the lowest total emission, reaching more favorable values than both conventional fuel and butanol.

4. Conclusions

Analyses performed based on computer simulation allowed determination of the carbon dioxide emission profile for selected fuels, in accordance with the predefined test procedure and taking into account operation of additional systems in the vehicle (“start–stop” system).
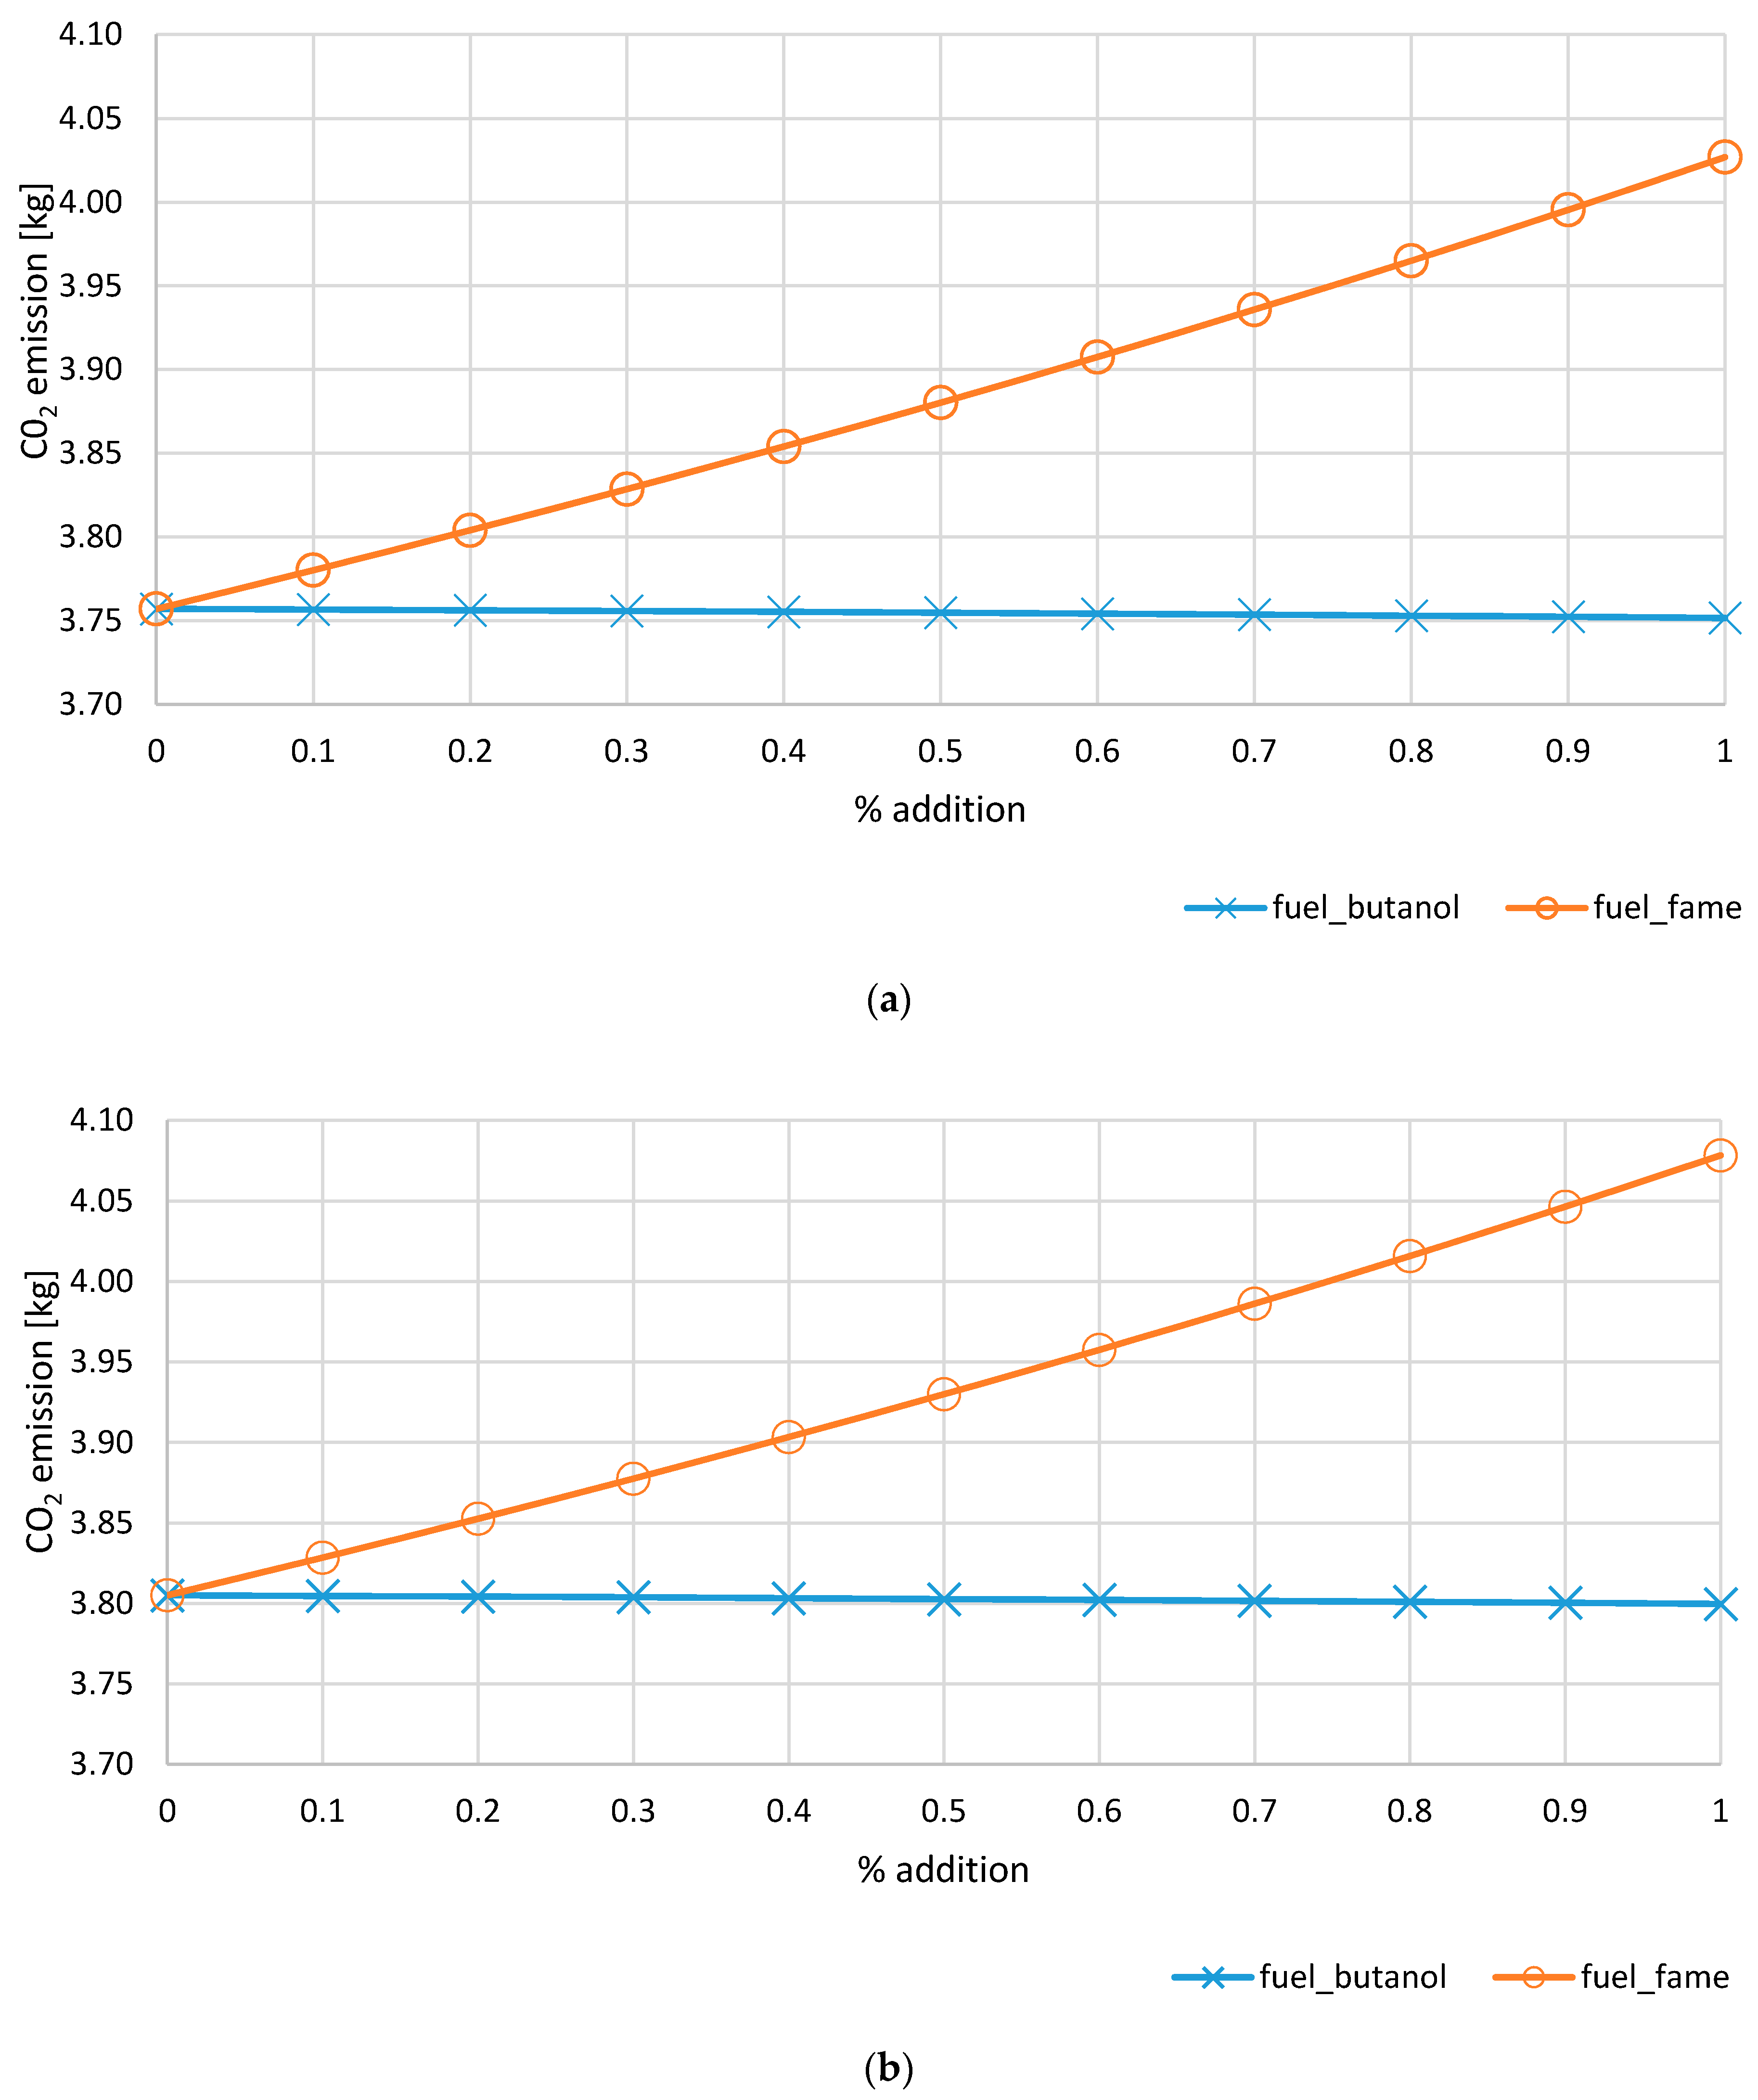
  • Biobutanol turned out to be characterized by the lowest emission levels. Interestingly enough, the trend maintained despite increased consumption of this fuel as compared with FAME. Fatty acid methyl esters demonstrated higher CO2 emission than alcohol-based fuel, despite lower requirements for the medium.
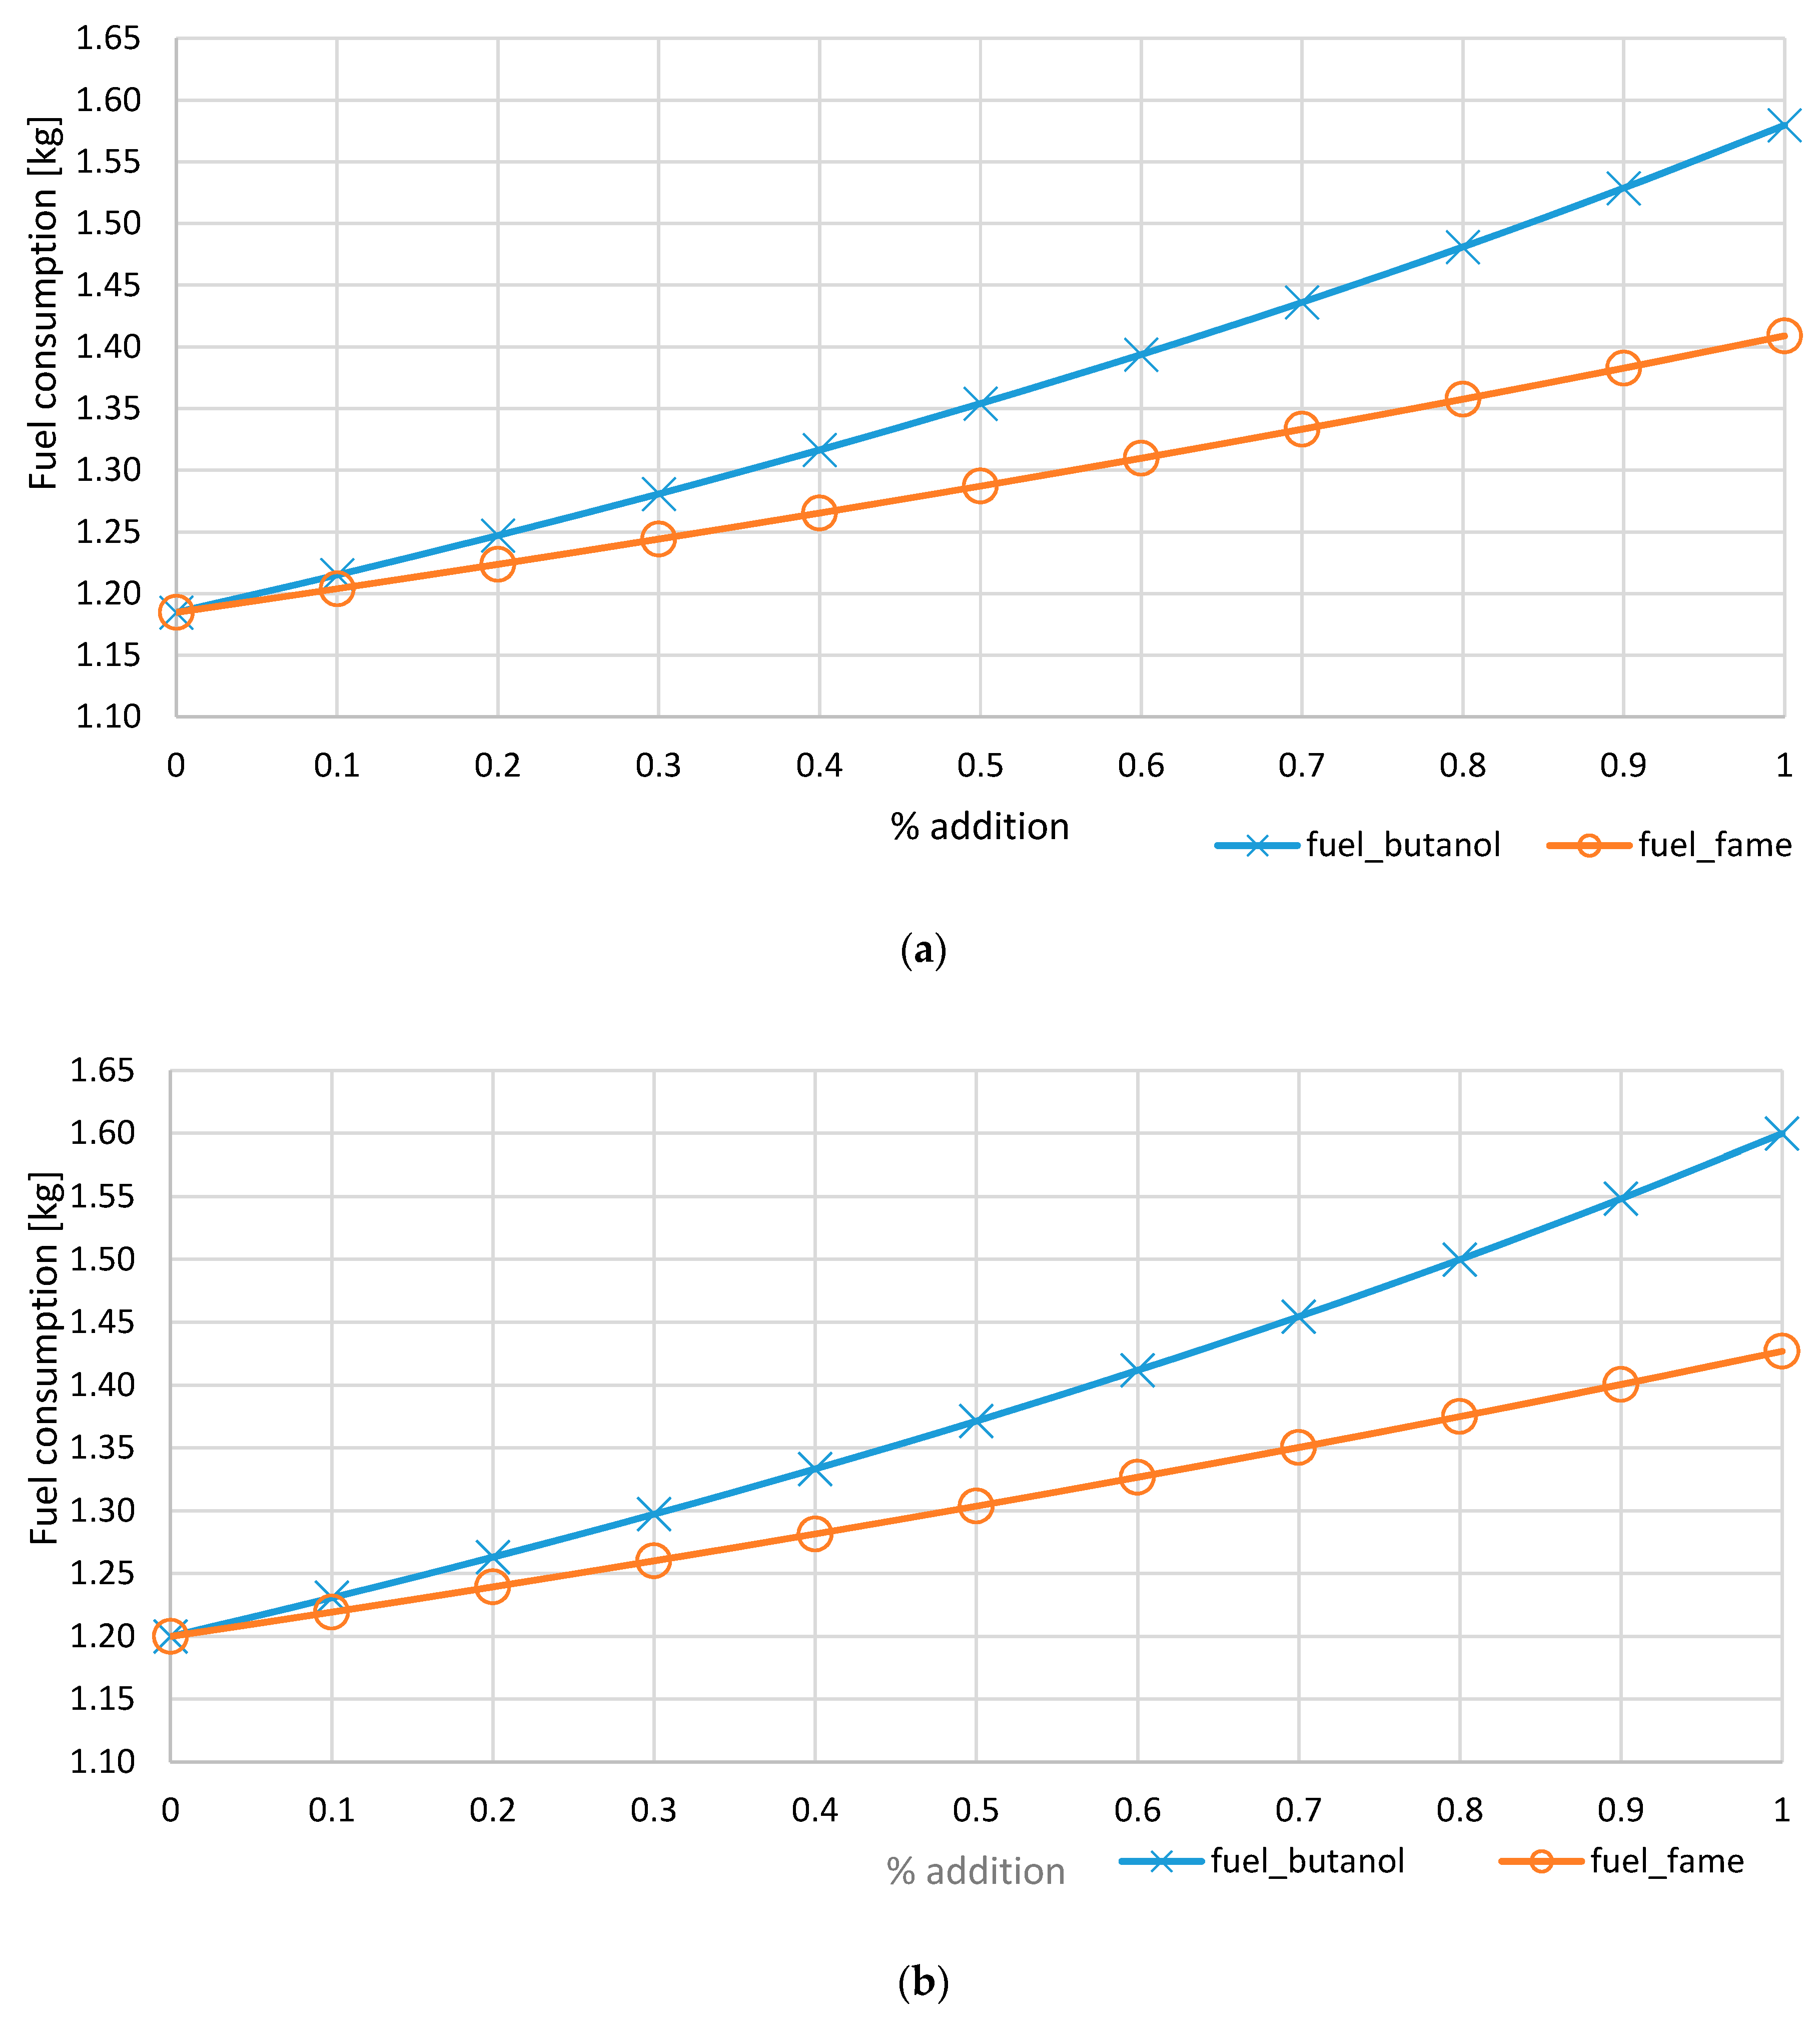
  • Simulation studies have confirmed that using the start–stop system, decreases CO2 emissions and the consumption of the fuel mixtures investigated.
  • Total carbon dioxide emission was lowest in the case of biobutanol (3.80 kg in the test), followed by diesel fuel (3.81 kg in the test), and highest for FAME (4.08 kg in the test). The CO2 emission reduction obtained from the simulations is consistent with the results of the experimental studies referred to in the references review.
  • As compared with the exhaust gas emission standard applicable to the analyzed vehicle, none of the fuels fulfilled the requirements. One ought to emphasize that the said norm was related to the NEDC test procedure, characterized with lower accuracy and, thus, the vehicle was able to fulfil the emission limits on the basis thereof. In connection with the perspective of lowering admissible emission limits for newly manufactured vehicles by 2030 (reduction of the limit by over 40% as compared with the one applicable in 2015), implementation of low emission solutions in all possible aspects will be necessary.
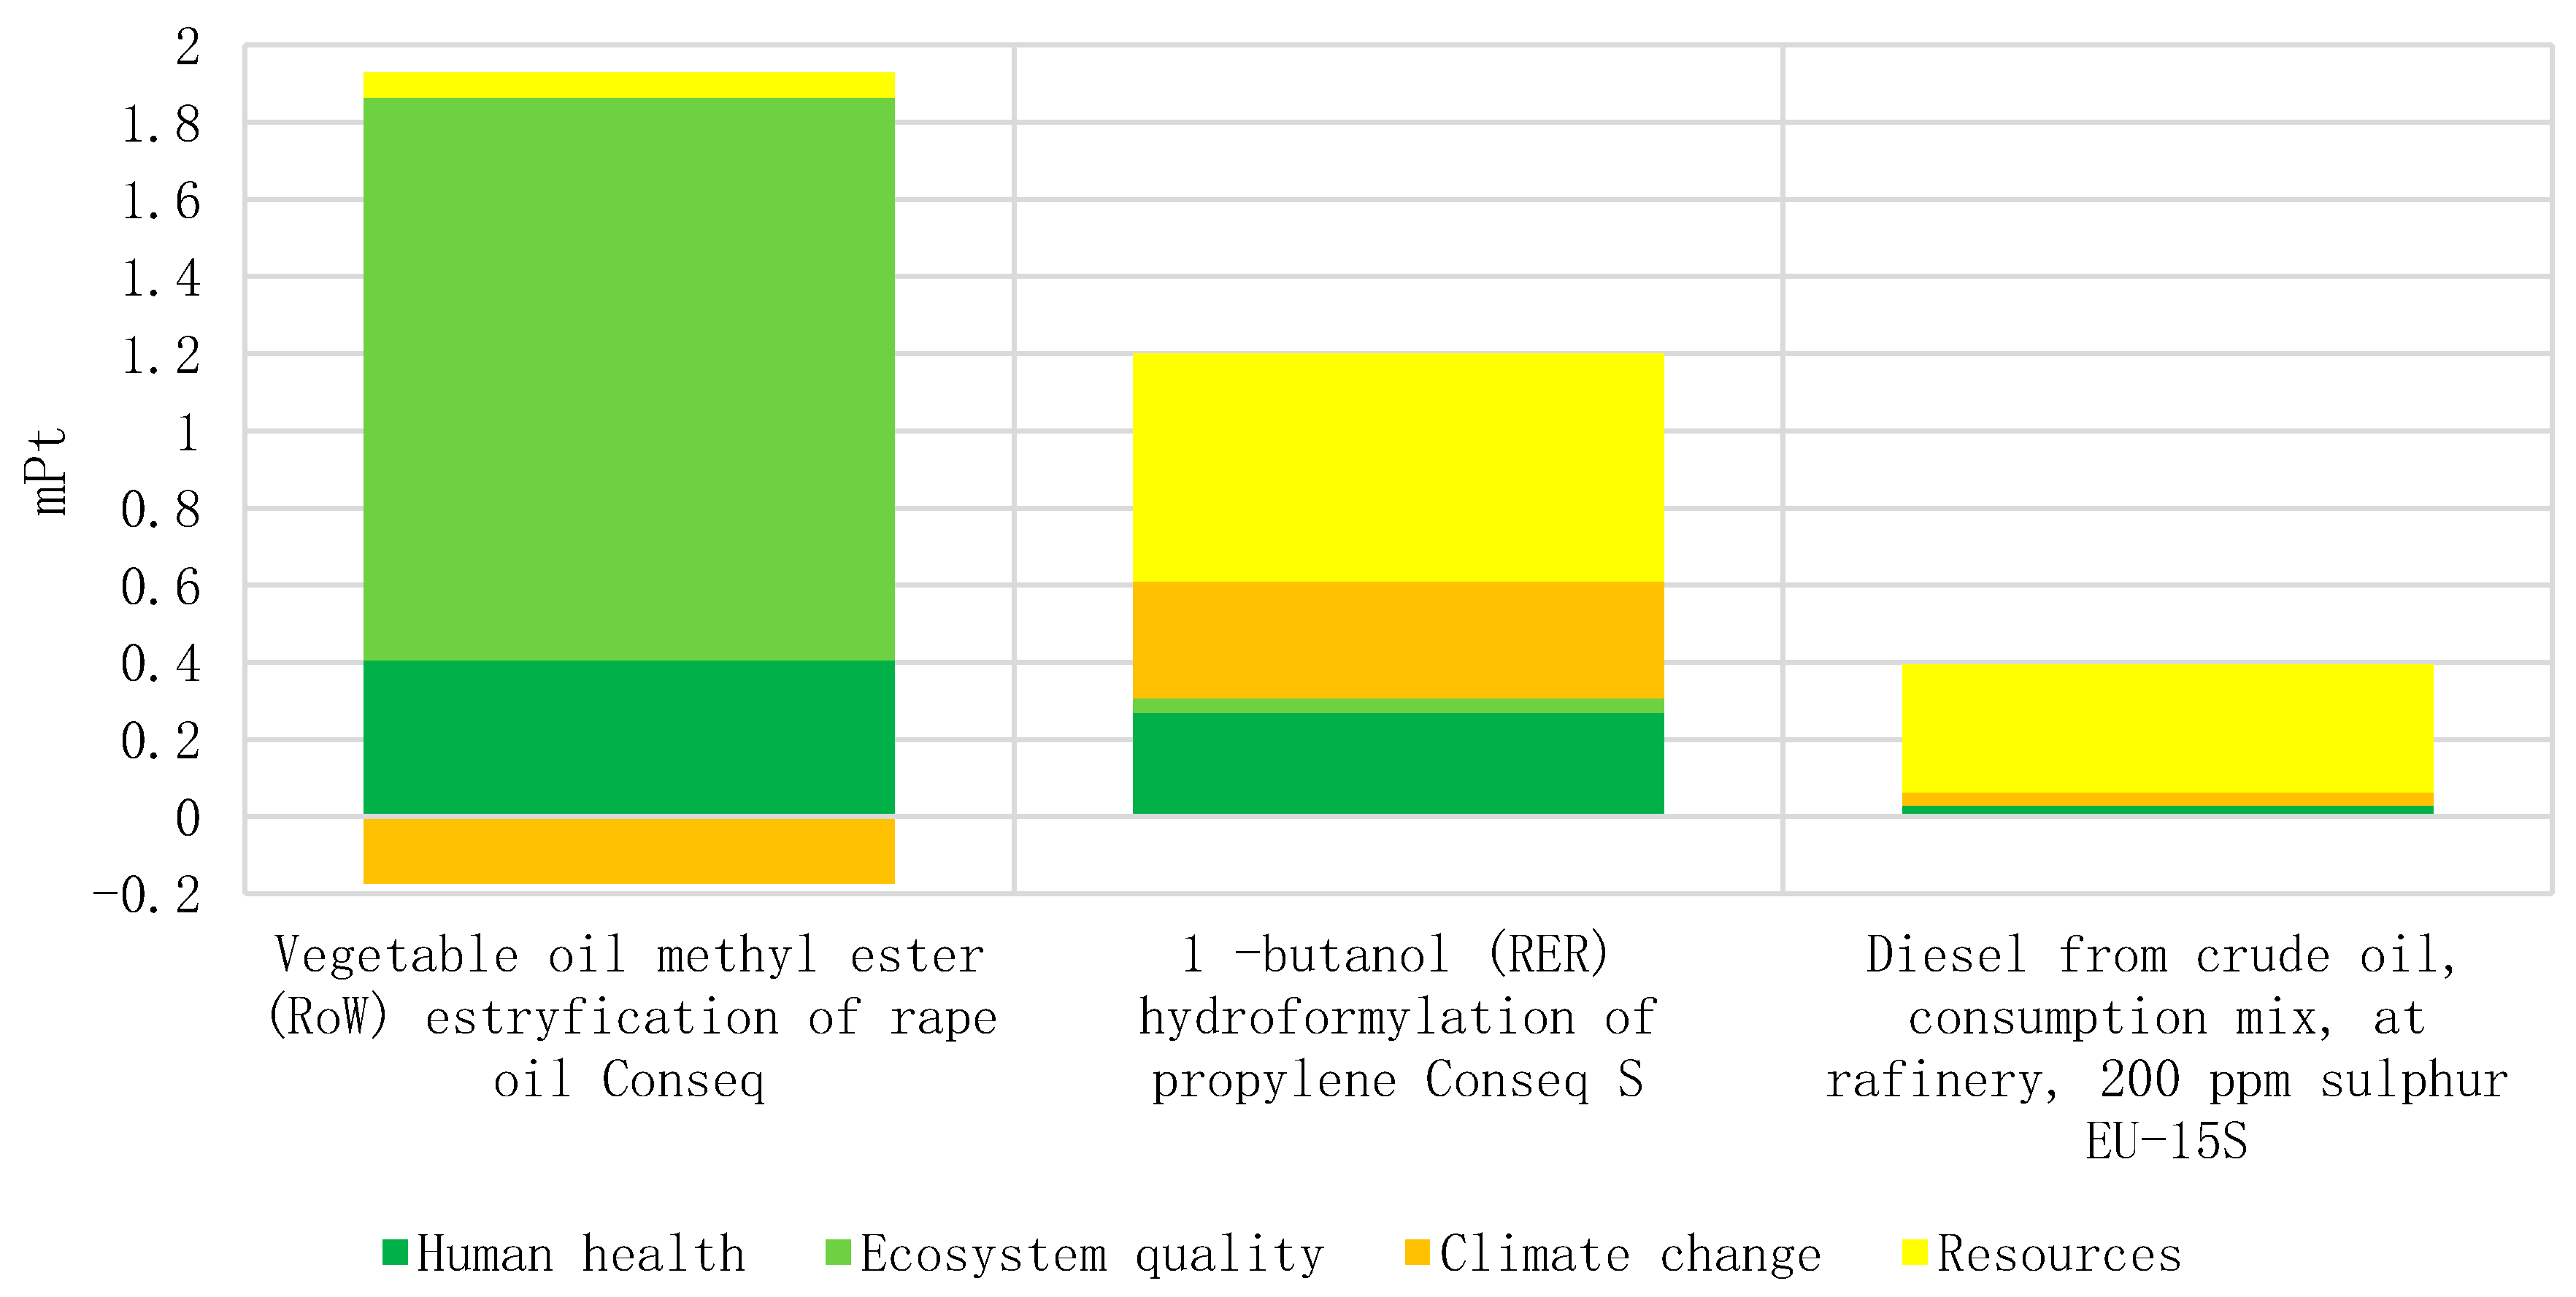
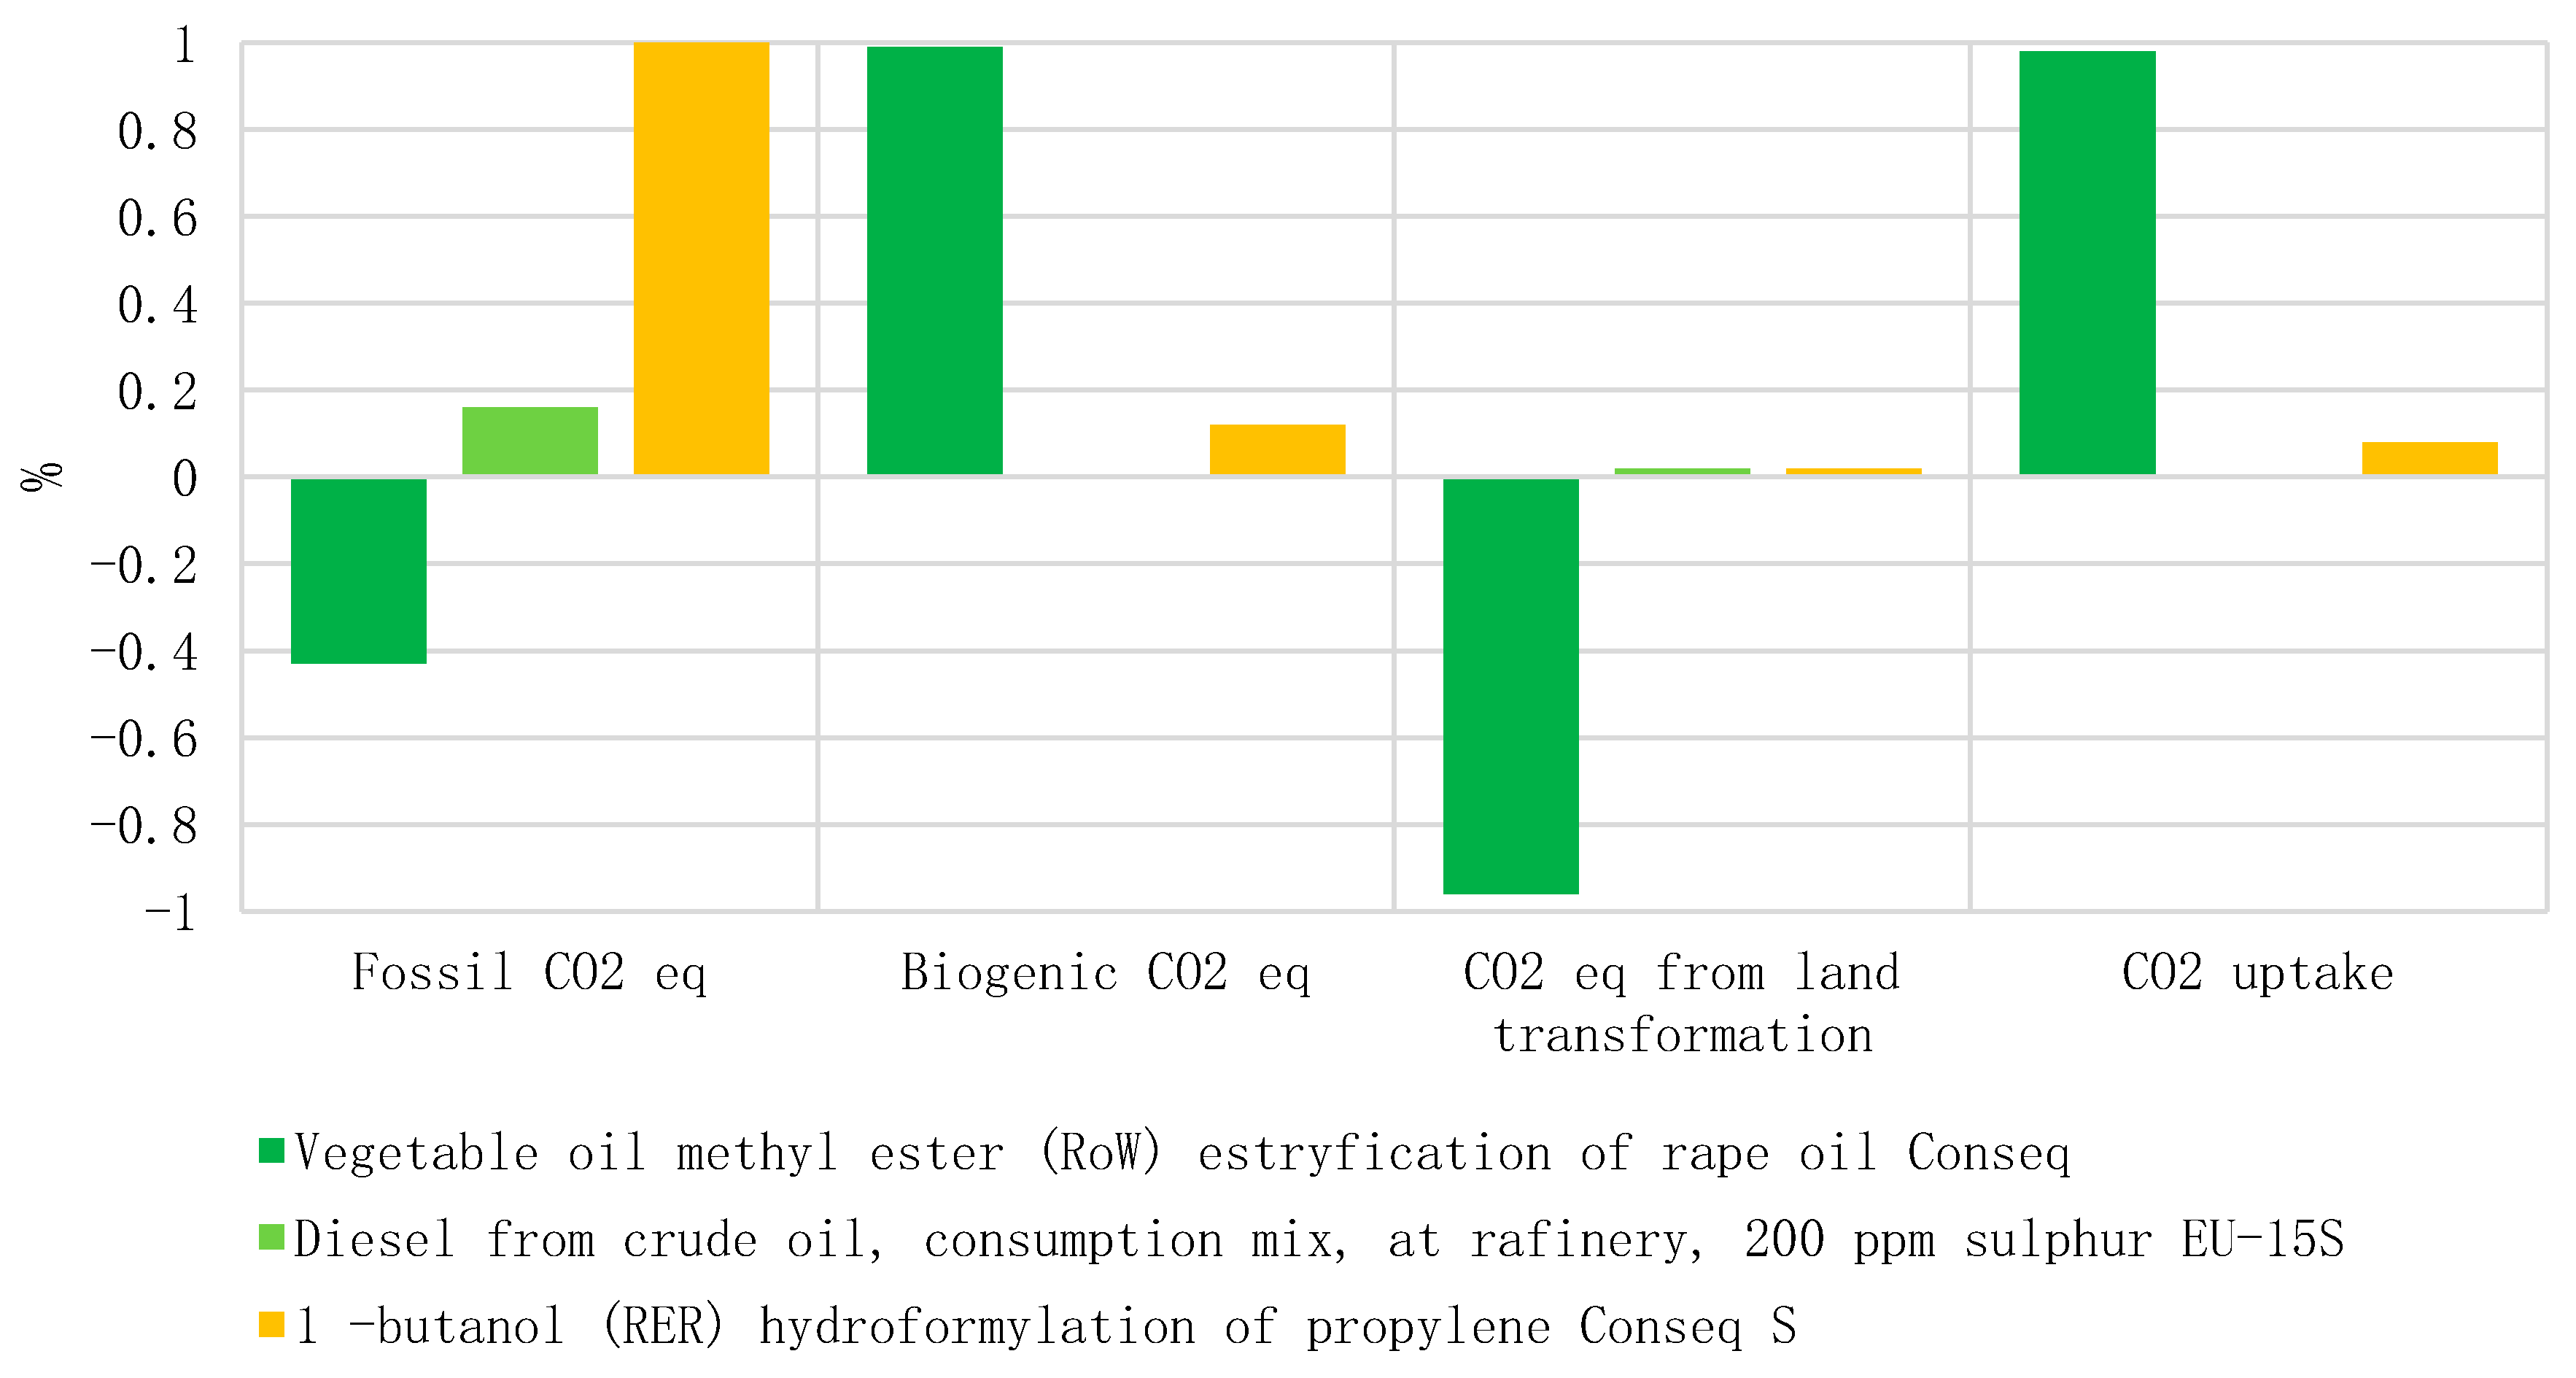
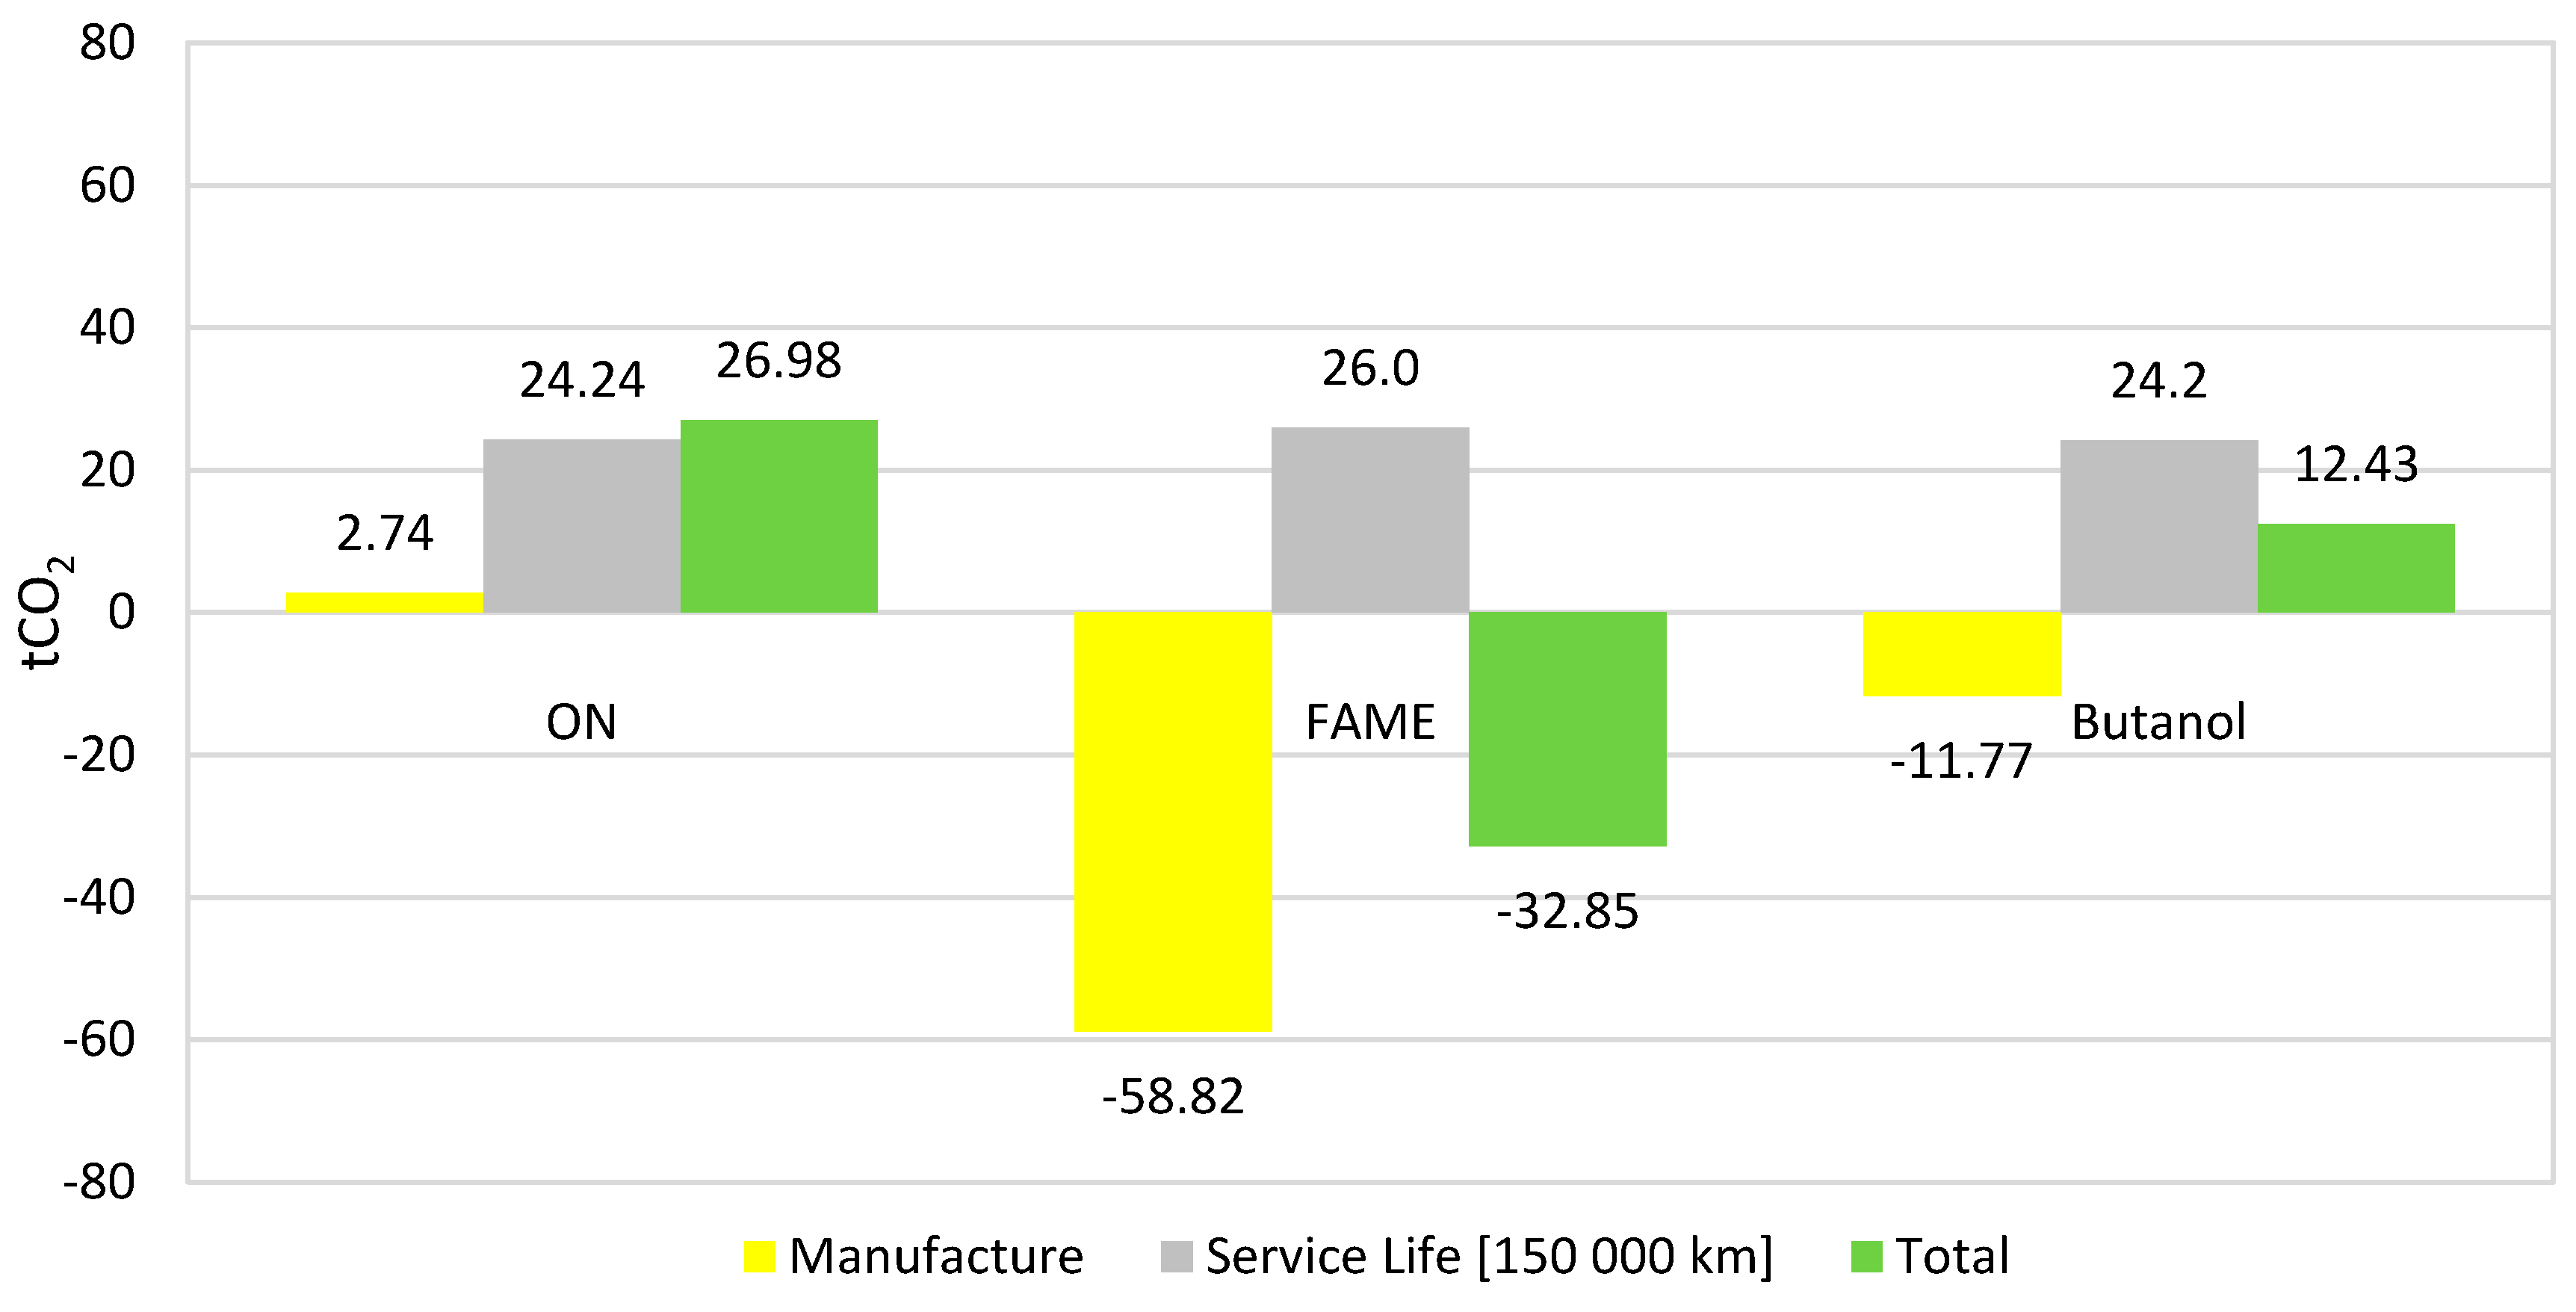
  • According to the LCA analysis, FAME turned out to be the fuel with the lowest total emission. Yet, its production has the greatest environmental impact. It should be noted that production of long chain fatty acid esters from oil plants is competitive towards the food related purpose of such plants. The second place was taken by biobutanol, whose total carbon dioxide emission was nearly by one half lower than that of classical diesel fuel. Diesel fuel demonstrated the highest values of emitted CO2 among all analyzed fuels, including the stage of production process.
  • As fuel based on lignocellulose, biobutanol appears a promising energy medium, whose advantage comes from lower carbon dioxide emission as compared with conventional fuel which, in the light of stringent requirements and high declared CO2 reduction levels, speaks very much to its advantage and encourages deeper theoretical and practical research into commercial application. Moreover, production of biobutanol from waste biomass carries additional possibilities to utilize useless matter.
  • The physical and chemical properties of the biofuel and its percentage share in the fuel mixture have a significant impact on the course of the combustion process, self-ignition reactions and the rate of heat release, and consequently on gas emissions.
  • The developed simulation constitutes a useful tool for initial research or planning of real experiments. It may be an element of a more comprehensive system or an independent system.
  • Basing on the presented results it can also be concluded that decisions taken with respect to the processes of fuel production management should include the biobutanol produced from lignocellulosic biomass as an effective additive to the fuel or even as a fuel itself assuring positive environmental impact.
  • The use of this type of fuel brings also the social effect since the biomass wastes are used for fuel production instead of edible parts of the agricultural crops.
  • All the conclusions mentioned above indicate lignocellulose origin as promising for production of biofuel mitigating the carbon dioxide emission as well as avoiding consumption of edible parts of plants as raw material for biofuel production. This should be accepted as an indication for technology management as well as political decisions.
The available literature did not contain an approach that would link the actual research carried out on the engine for extensive changes in operating parameters. Other authors only presented the results of some tests but did not refer to the WLTP type approval tests, which are the condition for the approval of a given vehicle for use on public roads. The article cites the results of such studies, e.g., [12,13,58,59]. The present paper was aimed towards obtaining the answer whether, based on the operational characteristics of the engine, it is possible to estimate the behavior of the vehicle under the conditions of the WLTP dynamic test. The correctness of the simulation results was verified by reviewing the literature and referring to permissible emission limits. Currently, the authors are preparing a stand to perform full tests as part of driving tests.

Author Contributions

Conceptualization, K.T., R.M., and O.O.; Methodology, O.O., K.T., and R.M.; Validation, A.W. and A.Ś.; Investigation, A.W. and A.Ś.; Writing—original draft preparation, K.T., O.O., and K.B.; Funding acquisition, A.Ś. All authors have read and agreed to the published version of the manuscript.

Funding

The authors wish to express gratitude to Lublin University of Technology for financial support given to the present publication (Antoni Świć). The research was carried out under financial support obtained from the research subsidy of the Faculty of Engineering Management (WIZ) of Bialystok University of Technology. From the grant no. WZ/WIZ/4/2019 (Olga Orynycz, Andrzej Wasiak).

Conflicts of Interest

The authors declare no conflict of interest. The funders had no role in the design of the study; in the collection, analyses, or interpretation of data; in the writing of the manuscript; or in the decision to publish the results.

References

  1. Ferreira, J.A.; Brancoli, P.; Agnihotri, S.; Bolton, K.; Taherzadeh, M.J. A review of integration strategies of lignocelluloses and other wastes in 1st generation bioethanol processes. Process. Biochem. 2018, 75, 173–186. [Google Scholar] [CrossRef]
  2. Kapanji, K.K.; Haigh, K.F.; Görgens, J.F. Techno-economic analysis of chemically catalysed lignocellulose biorefineries at a typical sugar mill: Sorbitol or glucaric acid and electricity co-production. Bioresour. Technol. 2019, 289, 121635. [Google Scholar] [CrossRef] [PubMed]
  3. Tucki, K.; Orynycz, O.; Świć, A.; Mitoraj-Wojtanek, M. The Development of Electromobility in Poland and EU States as a Tool for Management of CO2 Emissions. Energies 2019, 12, 2942. [Google Scholar] [CrossRef] [Green Version]
  4. Chiaramonti, D.; Goumas, T. Impacts on industrial-scale market deployment of advanced biofuels and recycled carbon fuels from the EU Renewable Energy Directive II. Appl. Energy 2019, 251, 113351. [Google Scholar] [CrossRef]
  5. Vanhala, P.; Bergström, I.; Haaspuro, T.; Kortelainen, P.; Holmberg, M.; Forsius, M. Boreal forests can have a remarkable role in reducing greenhouse gas emissions locally: Land use-related and anthropogenic greenhouse gas emissions and sinks at the municipal level. Sci. Total Environ. 2016, 557, 51–57. [Google Scholar] [CrossRef]
  6. Venturi, S.; Tassi, F.; Cabassi, J.; Gioli, B.; Baronti, S.; Vaselli, O.; Caponi, C.; Vagnoli, C.; Picchi, G.; Zaldei, A.; et al. Seasonal and diurnal variations of greenhouse gases in Florence (Italy): Inferring sources and sinks from carbon isotopic ratios. Sci. Total Environ. 2020, 698, 134245. [Google Scholar] [CrossRef]
  7. Krzywonos, M.; Tucki, K.; Wojdalski, J.; Kupczyk, A.; Sikora, M. Analysis of Properties of Synthetic Hydrocarbons Produced Using the ETG Method and Selected Conventional Biofuels Made in Poland in the Context of Environmental Effects Achieved. Rocz. Ochr. Środowiska 2017, 19, 394–410. [Google Scholar]
  8. Schleussner, C.F.; Rogelj, J.; Schaeffer, M.; Lissner, T.; Licker, R.; Fischer, E.M.; Knutti, R.; Levermann, A.; Frieler, K.; Hare, W. Science and policy characteristics of the Paris Agreement temperature goal. Nat. Clim. Chang. 2016, 6, 827–835. [Google Scholar] [CrossRef] [Green Version]
  9. FCCC/CP/2015/L.9/Rev.1. Adoption of the Paris Agreement. Available online: https://undocs.org/ (accessed on 16 November 2019).
  10. Zak, A.; Golisz, E.; Tucki, K.; Borowski, P. Perspectives of biofuel sector development in Poland in comparision to CO2 emission standards. J. Agribus. Rural Dev. 2014, 3, 299–312. [Google Scholar]
  11. Valente, A.; Iribarren, D.; Candelaresi, D.; Spazzafumo, G.; Dufour, J. Using harmonised life-cycle indicators to explore the role of hydrogen in the environmental performance of fuel cell electric vehicles. Int. J. Hydrogen Energy 2019. [Google Scholar] [CrossRef]
  12. Chłopek, Z.; Biedrzycki, J.; Lasocki, J.; Wójcik, P. Pollutant emissions from combustion engine of motor vehicle tested in driving cycles simulating real–world driving conditions. Zesz. Nauk. Inst. Pojazdów Politech. Warsz. 2013, 92, 67–76. [Google Scholar]
  13. Chłopek, Z.; Biedrzycki, J.; Lasocki, J.; Wójcik, P. The correlative studies of the pollutant emission and fuel consumption in type-approval tests. TTS Tech. Transp. Szyn. 2015, 22, 268–271. [Google Scholar]
  14. Kupczyk, A.; Mączyńska, J.; Redlarski, G.; Tucki, K.; Bączyk, A.; Rutkowski, D. Selected Aspects of Biofuels Market and the Electromobility Development in Poland: Current Trends and Forecasting Changes. Appl. Sci. 2019, 9, 254. [Google Scholar] [CrossRef] [Green Version]
  15. Tucki, K.; Mruk, R.; Orynycz, O.; Gola, A. The Effects of Pressure and Temperature on the Process of Auto-Ignition and Combustion of Rape Oil and Its Mixtures. Sustainability 2019, 11, 3451. [Google Scholar] [CrossRef] [Green Version]
  16. PE/48/2018/REV/1 Directive (EU) 2018/2001 of the European Parliament and of the Council of 11 December 2018 on the Promotion of the Use of Energy from Renewable Sources (Text with EEA Relevance). Available online: https://eur-lex.europa.eu/ (accessed on 16 November 2019).
  17. Górski, K.; Olszewski, W.; Lotko, W. Alcohols and ethers as fuels for diesel engines. Czas. Tech. Mech. 2008, 105, 13–24. [Google Scholar]
  18. Bannikov, M.; Gollani, S.E.; Vasilen, I. Effect of alcohol additives on diesel engine performance and emissions. Mater. Methods Technol. 2015, 9, 8–19. [Google Scholar]
  19. Tucki, K.; Mruk, R.; Orynycz, O.; Wasiak, A.; Botwinska, K.; Gola, A. Simulation of the Operation of a Spark Ignition Engine Fueled with Various Biofuels and Its Contribution to Technology Management. Sustainability 2019, 11, 2799. [Google Scholar] [CrossRef] [Green Version]
  20. Rahman, Q.M.; Zhang, B.; Wang, L.; Shahbazi, A. A combined pretreatment, fermentation and ethanol-assisted liquefaction process for production of biofuel from Chlorella sp. Fuel 2019, 257, 116026. [Google Scholar] [CrossRef]
  21. Mączyńska, J.; Krzywonos, M.; Kupczyk, A.; Tucki, K.; Sikora, M.; Pińkowska, H.; Bączyk, A.; Wielewska, I. Production and use of biofuels for transport in Poland and Brazil—The case of bioethanol. Fuel 2019, 241, 989–996. [Google Scholar] [CrossRef]
  22. Lian, X.; Li, Y.; Zhu, J.; Zou, Y.; An, D.; Wang, Q. Fabrication of Au-decorated SnO2 nanoparticles with enhanced n-buthanol gas sensing properties. Mater. Sci. Semicond. Process. 2019, 101, 198–205. [Google Scholar] [CrossRef]
  23. Ayad, S.M.; Belchior, C.R.; Da Silva, G.L.; Lucena, R.S.; Carreira, E.S.; De Miranda, P.E. Analysis of performance parameters of an ethanol fueled spark ignition engine operating with hydrogen enrichment. Int. J. Hydrogen Energy 2019. [Google Scholar] [CrossRef]
  24. Lapuerta, M.; Adrover, J.J.H.; Fernández-Rodríguez, D.; Cova-Bonillo, A. Autoignition of blends of n-butanol and ethanol with diesel or biodiesel fuels in a constant-volume combustion chamber. Energy 2017, 118, 613–621. [Google Scholar] [CrossRef] [Green Version]
  25. Lapuerta, M.; Rodríguez-Fernández, J.; Fernández-Rodríguez, D.; Patiño-Camino, R. Modeling viscosity of butanol and ethanol blends with diesel and biodiesel fuels. Fuel 2017, 199, 332–338. [Google Scholar] [CrossRef]
  26. Kamiński, W.; Tomczak, E.; Górak, A. Biobutanol—Production and purification methods. Ecol. Chem. Eng. S 2011, 18, 31–37. [Google Scholar]
  27. Ezeji, T.C.; Qureshi, N.; Blaschek, H.P. Bioproduction of butanol from biomass: From genes to bioreactors. Curr. Opin. Biotechnol. 2007, 18, 220–227. [Google Scholar] [CrossRef] [PubMed]
  28. Patakova, P.; Maxa, D.; Rychtera, M.; Linhova, M.; Fribert, P.; Muzikova, Z.; Lipovsky, J.; Paulova, L.; Pospisil, M.; Sebor, G.; et al. Perspectives of Biobutanol Production and Use. Available online: https://www.intechopen.com/books/biofuel-s-engineering-process-technology/perspectives-of-biobutanol-production-and-use (accessed on 18 January 2020).
  29. Ramey, D.E.; Yang, S.T. Production of Butyric Acid and Butanol from Biomass. Final Report Number DOE-ER86106. Work Performed Under: Contract No.: DE-F-G02-00ER86106. Available online: https://www.osti.gov/biblio/843183-production-butyric-acid-butanol-from-biomass (accessed on 16 November 2019).
  30. Bringué, R.; Ramírez, E.; Iborra, M.; Tejero, J.; Cunill, F. Esterification of furfuryl alcohol to butyl levulinate over ion-exchange resins. Fuel 2019, 257, 116010. [Google Scholar] [CrossRef]
  31. Orchillés, A.V.; Vercher, E.; Miguel, P.J.; González-Alfaro, V.; Llopis, F.J. Isobaric vapor-liquid equilibria for the extractive distillation of tert-butyl alcohol + water mixtures using 1-ethyl-3-methylimidazolium dicyanamide ionic liquid. J. Chem. Thermodyn. 2019, 139, 105866. [Google Scholar] [CrossRef]
  32. Liu, H.; Wang, G.; Zhang, J. The Promising Fuel-Biobutanol. In Liquid, Gaseous and Solid Biofuels—Conversion Techniques, 1st ed.; Fang, Z., Ed.; IntechOpen: London, UK, 2013; Available online: https://www.intechopen.com/books/liquid-gaseous-and-solid-biofuels-conversion-techniques/the-promising-fuel-biobutanol (accessed on 16 November 2019). [CrossRef] [Green Version]
  33. Mack, J.H.; Schüler, D.; Butt, R.H.; Dibble, R.W. Experimental investigation of butanol isomer combustion in Homogeneous Charge Compression Ignition (HCCI) engines. Appl. Energy 2016, 165, 612–626. [Google Scholar] [CrossRef] [Green Version]
  34. N-Butanol—Safety Data Sheet. Available online: https://www.perstorp.com/~/media/files/perstorp/msds/n-butanol/msds_n-butanol_pol-6694.ashx (accessed on 16 November 2019).
  35. Xiao, H.; Guo, F.; Li, S.; Wang, R.; Yang, X. Combustion performance and emission characteristics of a diesel engine burning biodiesel blended with n-butanol. Fuel 2019, 258, 115887. [Google Scholar] [CrossRef]
  36. Hönig, V.; Kotek, M.; Mařík, J. Use of butanol as a fuel for internal combustion engines. Agron. Res. 2014, 12, 333–340. [Google Scholar]
  37. Liang, X.; Zhong, A.; Sun, Z.; Han, D. Autoignition of n-heptane and butanol isomers blends in a constant volume combustion chamber. Fuel 2019, 254, 115638. [Google Scholar] [CrossRef]
  38. Smerkowska, B. Biobutanol—Production and application in diesel engines. Chemik 2011, 65, 549–556. [Google Scholar]
  39. Huzir, N.M.; Aziz, M.A.; Ismail, S.; Abdullah, B.; Mahmood, N.A.N.; Umor, N.; Muhammad, S.A.F.S. Agro-industrial waste to biobutanol production: Eco-friendly biofuels for next generation. Renew. Sustain. Energy Rev. 2018, 94, 476–485. [Google Scholar] [CrossRef]
  40. Dürre, P. Biobutanol: An attractive biofuel. Biotechnol. J. Healthc. Nutr. Technol. 2007, 2, 1525–1534. [Google Scholar] [CrossRef]
  41. Qureshi, N.; Ezeji, T.C. Butanol, ‘a superior biofuel’ production from agricultural residues (renewable biomass): Recent progress in technology. Biofuels Bioprod. Biorefin. 2008, 2, 319–330. [Google Scholar] [CrossRef]
  42. Van Der Wal, H.; Sperber, B.L.; Houweling-Tan, B.; Bakker, R.R.; Brandenburg, W.; López-Contreras, A.M. Production of acetone, butanol, and ethanol from biomass of the green seaweed Ulva lactuca. Bioresour. Technol. 2013, 128, 431–437. [Google Scholar] [CrossRef]
  43. Figueroa-Torres, G.M.; Mahmood, W.M.A.W.; Pittman, J.K.; Theodoropoulos, C. Microalgal biomass as a biorefinery platform for biobutanol and biodiesel production. Biochem. Eng. J. 2020, 153, 107396. [Google Scholar] [CrossRef]
  44. California Biobutanol Multimedia Evaluation. Tier I. Report. Available online: http://www.arb.ca.gov/fuels/multimedia/020910biobutanoltierI.pdf (accessed on 28 December 2019).
  45. Jin, C.; Yao, M.; Liu, H.; Lee, C.F.F.; Ji, J. Progress in the production and application of n-butanol as a biofuel. Renew. Sustain. Energy Rev. 2011, 15, 4080–4106. [Google Scholar] [CrossRef]
  46. Baustian, J.; Wolf, L. Cold-Start/Warm-Up Vehicle Performance and Driveability Index for Gasolines Containing Isobutanol. SAE Int. J. Fuels Lubr. 2012, 5, 1300–1309. [Google Scholar] [CrossRef]
  47. Pałuchowska, M. Biobutanol produced from biomass. Nafta-Gaz 2015, 7, 502–509. [Google Scholar]
  48. Karavalakis, G.; Short, D.; Vu, D.; Russell, R.L.; Asa-Awuku, A.; Jung, H.; Johnson, K.C.; Durbin, T.D. The impact of ethanol and iso-butanol blends on gaseous and particulate emissions from two passenger cars equipped with spray-guided and wall-guided direct injection SI (spark ignition) engines. Energy 2015, 82, 168–179. [Google Scholar] [CrossRef] [Green Version]
  49. Ugwoha, E.; Andrésen, J.M. Sorption and phase distribution of ethanol and butanol blended gasoline vapours in the vadose zone after release. J. Environ. Sci. 2014, 26, 608–616. [Google Scholar] [CrossRef]
  50. Zhen, X.; Wang, Y.; Liu, D. Bio-butanol as a new generation of clean alternative fuel for SI (spark ignition) and CI (compression ignition) engines. Renew. Energy 2020, 147, 2494–2521. [Google Scholar] [CrossRef]
  51. Karavalakis, G.; Short, D.; Vu, D.; Villela, M.; Asa-Awuku, A.; Durbin, T.D. Evaluating the regulated emissions, air toxics, ultrafine particles, and black carbon from SI-PFI and SI-DI vehicles operating on different ethanol and iso-butanol blends. Fuel 2014, 128, 410–421. [Google Scholar] [CrossRef] [Green Version]
  52. Yun, H.; Choi, K.; Lee, C.S. Effects of biobutanol and biobutanol–diesel blends on combustion and emission characteristics in a passenger car diesel engine with pilot injection strategies. Energy Convers. Manag. 2016, 111, 79–88. [Google Scholar] [CrossRef]
  53. Nayyar, A.; Sharma, D.; Soni, S.L.; Mathur, A. Experimental investigation of performance and emissions of a VCR diesel engine fuelled with n-butanol diesel blends under varying engine parameters. Environ. Sci. Pollut. Res. 2017, 24, 20315–20329. [Google Scholar] [CrossRef]
  54. Swamy, R.L.; Chandrashekar, T.K.; Banapurmath, N.R.; Khandal, S.V. Impact of Diesel-butanol Blends on Performance and Emission of Diesel Engine. Oil Gas Res. 2015, 1, 101. Available online: https://www.omicsonline.org/open-access/impact-of-dieselbutanol-blends-on-performance-and-emission-of-dieselengine-ogr-1000101.php?aid=63149 (accessed on 28 December 2019).
  55. Lapuerta, M.; Hernández, J.J.; Rodríguez-Fernández, J.; Barba, J.; Ramos, A.; Fernández-Rodríguez, D. Emission benefits from the use of n-butanol blends in a Euro 6 diesel engine. Int. J. Engine Res. 2017, 19, 1099–1112. [Google Scholar] [CrossRef]
  56. Liu, H.; Wang, X.; Zhang, D.; Dong, F.; Liu, X.; Yang, Y.; Huang, H.; Wang, Y.; Wang, Q.; Zheng, Z. Investigation on Blending Effects of Gasoline Fuel with N-Butanol, DMF, and Ethanol on the Fuel Consumption and Harmful Emissions in a GDI Vehicle. Energies 2019, 12, 1845. [Google Scholar] [CrossRef] [Green Version]
  57. Douvartzides, S.L.; Charisiou, N.D.; Papageridis, K.N.; Goula, M.A. Green Diesel: Biomass Feedstocks, Production Technologies, Catalytic Research, Fuel Properties and Performance in Compression Ignition Internal Combustion Engines. Energies 2019, 12, 809. [Google Scholar] [CrossRef] [Green Version]
  58. Verma, P.; Stevanovic, S.; Zare, A.; Dwivedi, G.; Van, T.C.; Davidson, M.; Rainey, T.; Brown, R.J.; Ristovski, Z.D. An Overview of the Influence of Biodiesel, Alcohols, and Various Oxygenated Additives on the Particulate Matter Emissions from Diesel Engines. Energies 2019, 12, 1987. [Google Scholar] [CrossRef] [Green Version]
  59. Elfasakhany, A.; Mahrous, A.F. Performance and emissions assessment of n-butanol–methanol–gasoline blends as a fuel in spark-ignition engines. Alex. Eng. J. 2016, 55, 3015–3024. [Google Scholar] [CrossRef] [Green Version]
  60. Black, G.; Curran, H.; Pichon, S.; Simmie, J.; Zhukov, V. Bio-butanol: Combustion properties and detailed chemical kinetic model. Combust. Flame 2010, 157, 363–373. [Google Scholar] [CrossRef]
  61. Frassoldati, A.; Grana, R.; Faravelli, T.; Ranzi, E.; Oßwald, P.; Kohse-Höinghaus, K.; Osswald, P. Detailed kinetic modeling of the combustion of the four butanol isomers in premixed low-pressure flames. Combust. Flame 2012, 159, 2295–2311. [Google Scholar] [CrossRef]
  62. Pexa, M.; Čedík, J.; Hönig, V.; Pražan, R. Lignocellulosic Biobutanol as Fuel for Diesel Engines. BioResources 2016, 11, 6006–6016. [Google Scholar] [CrossRef] [Green Version]
  63. Čedík, J.; Pexa, M.; Mařík, J.; Hönig, V.; Horníčková, Š.; Kubín, K. Influence of butanol and FAME blends on operational characteristics of compression ignition engine. Agron. Res. 2015, 13, 541–549. [Google Scholar]
  64. Peterka, B.; Pexa, M.; Čedík, J.; Mader, D.; Kotek, M. Comparison of exhaust emissions and fuel consumption of small combustion engine of portable generator operated on petrol and biobutanol. Agron. Res. 2017, 15, 1162–1169. [Google Scholar]
  65. Zhang, Y.; Huang, R.; Xu, S.; Huang, Y.; Huang, S.; Ma, Y.; Wang, Z. The effect of different n-butanol-fatty acid methyl esters (FAME) blends on puffing characteristics. Fuel 2017, 208, 30–40. [Google Scholar] [CrossRef]
  66. Hönig, V.; Pexa, M.; Linhart, Z. Biobutanol Standardizing Biodiesel from Waste Animal Fat. Pol. J. Environ. Stud. 2015, 24, 2433–2439. [Google Scholar] [CrossRef]
  67. Rakopoulos, D.C.; Rakopoulos, C.D.; Giakoumis, E.G.; Papagiannakis, R.G.; Kyritsis, D.C. Influence of properties of various common bio-fuels on the combustion and emission characteristics of high-speed DI (direct injection) diesel engine: Vegetable oil, bio-diesel, ethanol, n-butanol, diethyl ether. Energy 2014, 73, 354–366. [Google Scholar] [CrossRef]
  68. Rakopoulos, D.; Rakopoulos, C.; Hountalas, D.; Kakaras, E.; Giakoumis, E.; Papagiannakis, R. Investigation of the performance and emissions of bus engine operating on butanol/diesel fuel blends. Fuel 2010, 89, 2781–2790. [Google Scholar] [CrossRef]
  69. Tracking Clean Energy Progress. Available online: https://www.iea.org/tcep/transport/biofuels/ (accessed on 16 November 2019).
  70. COM. 112—A Roadmap for Moving to a Competitive Low Carbon Economy in 2050. 2011. Available online: https://www.eea.europa.eu/policy-documents/com-2011-112-a-roadmap (accessed on 16 November 2019).
  71. Galadima, A.; Muraza, O. Zeolite catalyst design for the conversion of glucose to furans and other renewable fuels. Fuel 2019, 258, 115851. [Google Scholar] [CrossRef]
  72. Statistical Yearbook of Forestry. Available online: https://stat.gov.pl (accessed on 16 November 2019).
  73. National Forestry Accounting Plan (NFAP). Developed by the Team for the Elaboration of National Plans Related to Accounting for Greenhouse Gas Emissions and Removals Resulting from Forestry Activities. Warsaw, 2018. Available online: https://bip.mos.gov.pl (accessed on 16 November 2019).
  74. Kożuch, A.; Banaś, J.; Zięba, S.; Bujoczek, L. Changes in the synthetic index of sustainable forest management at the level of regional directorates of the State Forests in 1993–2013. For. Res. Pap. 2018, 79, 229–236. [Google Scholar] [CrossRef] [Green Version]
  75. Forests in Poland. 2017. Available online: http://www.lasy.gov.pl/pl/informacje/publikacje/in-english/forests-in-poland/lasy-w-polsce-2017-en.pdf (accessed on 16 November 2019).
  76. Państwowe Gospodarstwo Leśne Lasy Państwowe. Forest Report in Poland; 2018. Available online: https://bip.lasy.gov.pl/pl/bip/px_~raport_o_lasach_2018_do_bip.pdf (accessed on 16 November 2019).
  77. Państwowe Gospodarstwo Leśne Lasy Państwowe. Forest Report in Poland; 2010. Available online: https://www.bdl.lasy.gov.pl/portal/Media/Default/Publikacje/raport_o_stanie_lasow_2010.pdf (accessed on 16 November 2019).
  78. Głowacki, S.; Bazylik, W.; Sojak, M. Urban Green as a Source of Biomass for Energy Purposes. Ciepłownictwo Ogrzew. Went. 2013, 44, 206–209. [Google Scholar]
  79. European Commission. Environment. Eco-Management and Audit Scheme (EMAS). Available online: https://ec.europa.eu/environment/emas/index_en.htm (accessed on 2 January 2020).
  80. Environmental Management Systems. The ISO 14001 Standard. Available online: https://www.pcbc.gov.pl/pl/uslugi/certyfikacja-systemow-zarzadzania/pn-en-iso-14001 (accessed on 2 January 2020).
  81. Brito, M.; Martins, F. Life cycle assessment of butanol production. Fuel 2017, 208, 476–482. [Google Scholar] [CrossRef] [Green Version]
  82. Levasseur, A.; Bahn, O.; Beloin-Saint-Pierre, D.; Marinova, M.; Vaillancourt, K. Assessing butanol from integrated forest biorefinery: A combined techno-economic and life cycle approach. Appl. Energy 2017, 198, 440–452. [Google Scholar] [CrossRef]
  83. Brandão, M.; Martin, M.; Cowie, A.; Hamelin, L.; Zamagni, A. Consequential Life Cycle Assessment: What, How, and Why? In Encyclopedia of Sustainable Technologies; Abraham, M.A., Ed.; Elsevier: Amsterdam, The Netherlands, 2017; pp. 277–284. [Google Scholar]
  84. Brander, M. Comparative analysis of attributional corporate greenhouse gas accounting, consequential life cycle assessment, and project/policy level accounting: A bioenergy case study. J. Clean. Prod. 2017, 167, 1401–1414. [Google Scholar] [CrossRef]
  85. Environmental Priority Strategies (EPS). Available online: http://www.gabi-software.com/international/support/gabi/gabi-lcia-documentation/environmental-priority-strategies-eps/ (accessed on 2 January 2020).
  86. CML-IA Characterisation Factors. Available online: https://www.universiteitleiden.nl/onderzoek/onderzoeksoutput/wiskunde-en-natuurwetenschappen/cml-cml-ia-characterisation-factors (accessed on 2 January 2020).
  87. Eco-Indicator 99 Method. Available online: https://www.sciencedirect.com/topics/engineering/eco-indicator (accessed on 2 January 2020).
  88. Jolliet, O.; Margni, M.; Charles, R.; Humbert, S.; Payet, J.; Rebitzer, G.; Rosenbaum, R. IMPACT 2002+: A new life cycle impact assessment methodology. Int. J. Life Cycle Assess. 2003, 8, 324–330. [Google Scholar] [CrossRef] [Green Version]
  89. ReCiPe. Available online: https://www.pre-sustainability.com/recipe (accessed on 2 January 2020).
  90. Wiesen, K.; Saurat, M.; Lettenmeier, M. Calculating the Material Input per Service Unit using the Ecoinvent database. Int. J. Perform. Eng. 2014, 10, 357–366. [Google Scholar]
  91. LCA. Software for Fact-Based Sustainability. Available online: https://simapro.com/ (accessed on 2 January 2020).
  92. GaBi Software. Available online: http://www.gabi-software.com/ce-eu-english/software/gabi-software/ (accessed on 2 January 2020).
  93. Material Flow Analysis & Life Cycle Assessment with the Software Umberto. Available online: https://www.ifu.com/en/umberto/ (accessed on 2 January 2020).
  94. Biernat, K. Perspectives for global development of biofuel technologies to 2050. Chemik 2012, 66, 1178–1189. [Google Scholar]
  95. Piekarski, W.; Zając, G. Possibility of the use of liquid biofuels as a supply to the internal combustion engines. Autobusy Tech. Eksploat. Syst. Transp. 2011, 12, 347–354. [Google Scholar]
  96. Biernat, K.; Jeziorkowski, A. Problems in supplying modern internal combustion engine with biofuels. Studia Ecol. Bioethicae 2008, 6, 307–329. [Google Scholar]
  97. Fiat Panda Misc Documents Accessories Brochure PDF. Available online: https://manuals.co/ (accessed on 16 November 2019).
  98. Ambrozik, A.; Kurczyński, D.; Łagowski, P.; Warianek, M. The toxicity of combustion gas from the Fiat 1.3 Multijet engine operating following the load characteristics and fed with rape oil esters. Proc. Inst. Veh. 2016, 1, 23–36. [Google Scholar]
  99. Ambrozik, A.; Ambrozik, T.; Kurczyński, D. Load characteristics of turbocharged 1.3 Multijet engine. Postępy Nauk. Tech. 2012, 15, 7–20. [Google Scholar]
  100. Merkisz, J.; Pielecha, I.; Pielecha, J.; Brudnicki, K. On-Road Exhaust Emissions from Passenger Cars Fitted with a Start-Stop System. Arch. Transp. 2011, 23, 37–46. [Google Scholar] [CrossRef] [Green Version]
  101. Zhu, T.; Wu, Y.; Li, B.; Zong, C.; Li, J. Simulation Research on the Start-stop System of Hybrid Electric Vehicle. J. Adv. Veh. Eng. 2017, 3, 55–64. [Google Scholar]
  102. Regulation (EC) No 443/2009 of the European Parliament and of the Council of 23 April 2009 Setting Emission Performance Standards for New Passenger Cars as Part of the Community’s Integrated Approach to Reduce CO2 Emissions from Light-Duty Vehicles (Text with EEA Relevance). Available online: https://eur-lex.europa.eu/ (accessed on 16 November 2019).
  103. Proposal for a Regulation of the European Parliament and of the Council Setting Emission Performance Standards for New Passenger Cars and for New Light Commercial Vehicles as Part of the Union’s Integrated Approach to Reduce CO2 Emissions from Light-Duty Vehicles and Amending Regulation (EC) No 715/2007 (Recast). Available online: https://eur-lex.europa.eu/ (accessed on 16 November 2019).
  104. CO2 Targets Are Becoming Ever More Demanding Worldwide. Available online: https://www.daimler.com/sustainability/vehicles/climate-protection/wltp/wltp-part-5.html (accessed on 16 November 2019).
  105. Panda Catalog. Available online: http://www.auto-alex.pl/files/23.pdf (accessed on 16 November 2019).
  106. Baczewski, K.; Kałdoński, T. Paliwa do Silników o Zapłonie Samoczynnym, 2nd ed.; Wydawnictwa Komunikacji i Łączności: Warszawa, Poland, 2017; pp. 50–210. [Google Scholar]
  107. Gwardiak, H.; Rozycki, K.; Ruszkarska, M.; Tylus, J.; Walisiewicz-Niedbalska, W. Evaluation of fatty acid methyl esters (FAME) obtained from various feedstock. Oilseed Crops 2011, 32, 137–147. [Google Scholar]
  108. Tucki, K.; Mruk, R.; Orynycz, O.; Wasiak, A.; Swić, A. Thermodynamic Fundamentals for Fuel Production Management. Sustainability 2019, 11, 4449. [Google Scholar] [CrossRef] [Green Version]
  109. International Energy Agency (IEA). Advanced Motor Fuels. Butanol, Properties. Available online: https://www.iea-amf.org/content/fuel_information/butanol/properties (accessed on 16 November 2019).
  110. Kruczyński, S.W.; Orliński, P.; Orliński, S. The effects of powering the agricultural engine with mixture diesel fuels with biobutanol to economic and energy signs of its work. Logistka 2011, 6, 1–8. [Google Scholar]
  111. Campbell, S.L.; Chancelier, J.P.; Nikoukhah, R. Modeling and Simulation in Scilab/Scicos with ScicosLab 4.4, 1st ed.; Springer: New York, NY, USA, 2006; pp. 73–155. [Google Scholar]
  112. Lachowicz, C.T. Matlab, Scilab, Maxima: Opis i Przykłady Zastosowań, 1st ed.; Oficyna Wydawnicza Politechniki Opolskiej: Opole, Poland, 2005; pp. 120–310. [Google Scholar]
  113. Brozi, A. Scilab w Przykładach, 1st ed.; Wydawnictwo Nakom: Poznań, Poland, 2007; pp. 62–209. [Google Scholar]
  114. Pavlovic, J.; Marotta, A.; Ciuffo, B. CO2 emissions and energy demands of vehicles tested under the NEDC and the new WLTP type approval test procedures. Appl. Energy 2016, 177, 661–670. [Google Scholar] [CrossRef]
  115. Pavlovic, J.; Ciuffo, B.; Fontaras, G.; Valverde, V.; Marotta, A. How much difference in type-approval CO2 emissions from passenger cars in Europe can be expected from changing to the new test procedure (NEDC vs. WLTP)? Transp. Res. Part A Policy Pract. 2018, 111, 136–147. [Google Scholar] [CrossRef]
  116. Merkisz, J. Real Road Tests—Exhaust Emission Results from Passenger Cars. J. KONES Powertrain Transp. 2011, 18, 253–260. [Google Scholar]
  117. Barlow, T.; Latham, S.; McCrae, I.; Boulter, P. A Reference Book of Driving Cycles for Use in the Measurement of Road Vehicle Emissions. Available online: https://trl.co.uk/reports/PPR354 (accessed on 16 November 2019).
  118. Regulation No 83 of the Economic Commission for Europe of the United Nations (UN/ECE)—Uniform Provisions Concerning the Approval of Vehicles with Regard to the Emission of Pollutants According to Engine Fuel Requirements. Available online: https://eur-lex.europa.eu/ (accessed on 16 November 2019).
  119. Tokgoz, S.; Laborde, D. Indirect Land Use Change Debate: What Did We Learn? Curr. Sustain. Energy Rep. 2014, 1, 104–110. [Google Scholar] [CrossRef] [Green Version]
  120. Khanna, M.; Zilberman, D. Modeling the land-use and greenhouse-gas implications of biofuels. Clim. Chang. Econ. 2012, 3, 1250016. [Google Scholar] [CrossRef]
  121. Plevin, R.J. Assessing the Climate Effects of Biofuels Using Integrated Assessment Models, Part I: Methodological Considerations. J. Ind. Ecol. 2016, 21, 1478–1487. [Google Scholar] [CrossRef] [Green Version]
  122. Styles, D.; Gibbons, J.; Williams, A.P.; Dauber, J.; Stichnothe, H.; Urban, B.; Chadwick, D.R.; Jones, D.L. Consequential life cycle assessment of biogas, biofuel and biomass energy options within an arable crop rotation. GCB Bioenergy 2015, 7, 1305–1320. [Google Scholar] [CrossRef] [Green Version]
  123. Decicco, J.M. Methodological Issues Regarding Biofuels and Carbon Uptake. Sustainability 2018, 10, 1581. [Google Scholar] [CrossRef] [Green Version]
  124. De Kleine, R.D.; Anderson, J.E.; Kim, H.C.; Wallington, T.J. Life cycle assessment is the most relevant framework to evaluate biofuel greenhouse gas burdens. Biofuels Bioprod. Biorefin. 2017, 11, 407–416. [Google Scholar] [CrossRef]
  125. Glensor, K.; Muñoz, B.; Rosa, M. Life-Cycle Assessment of Brazilian Transport Biofuel and Electrification Pathways. Sustainability 2019, 11, 6332. [Google Scholar] [CrossRef] [Green Version]
  126. Van Der Voet, E.; Lifset, R.J.; Luo, L. Life-cycle assessment of biofuels, convergence and divergence. Biofuels 2010, 1, 435–449. [Google Scholar] [CrossRef]
  127. Jones, C.; Gilbert, P.; Raugei, M.; Mander, S.; Leccisi, E. An approach to prospective consequential life cycle assessment and net energy analysis of distributed electricity generation. Energy Policy 2017, 100, 350–358. [Google Scholar] [CrossRef]
  128. Menten, F.; Chèze, B.; Patouillard, L.; Bouvart, F. A review of LCA greenhouse gas emissions results for advanced biofuels: The use of meta-regression analysis. Renew. Sustain. Energy Rev. 2013, 26, 108–134. [Google Scholar] [CrossRef]
  129. Guyon, O. Methodology for the Life Cycle Assessment of a Car-sharing Service. Available online: https://www.diva-portal.org/smash/get/diva2:1183366/FULLTEXT01.pdf (accessed on 16 November 2019).
  130. ISO. Environmental Management—Life cycle assessment—Requirements and Guidelines. Available online: https://www.iso.org/standard/38498.html (accessed on 16 November 2019).
  131. Volkswagen AG Group Research. The Caddy—Environmental Commendation Background Report. Available online: https://www.a-pointduurzaamheid.nl (accessed on 16 November 2019).
  132. Volkswagen AG Group Research. The Golf—Environmental Commendation Background Report. Available online: https://www.a-pointduurzaamheid.nl/files/4914/2348/7329/e_golf_Env_Comm.pdf (accessed on 16 November 2019).
  133. Ambrozik, A.; Kurczyński, D. Load characteristics in ad3.152 ur engine fuelled with mineral and biogenous blends. J. KONES Powertrain Transp. 2006, 13, 183–194. [Google Scholar]
  134. Labeckas, G.; Slavinskas, S. The effect of diesel fuel blending with rapeseed oil and rme on engine performance and exhaust emissions. J. KONES Powertrain Transp. 2005, 12, 187–194. [Google Scholar]
Figure 1. Diagram of the 1.3 MultiJet engine simulation model.
Energies 13 00561 g001
Figure 2. Parameters obtained from the block responsible for generating the WLTP test signal.
Energies 13 00561 g002
Figure 3. Parameters obtained from the “Drive system” simulation block.
Energies 13 00561 g003
Figure 4. Fuel flow per injection cycle: (a)—Diesel; (b)—FAME; (c)—Butanol.
Energies 13 00561 g004
Figure 5. Characteristics of the hourly fuel consumption as a function of the rotational speed and torque of the selected internal combustion engine adopted in the simulation.
Energies 13 00561 g005
Figure 6. Parameters obtained from the “Calculations for fuel/air” simulation block.
Energies 13 00561 g006
Figure 7. Carbon dioxide emissions per diesel, FAME, and biobutanol for one injection cycle: (a)—Diesel; (b)—FAME; (c)—Butanol.
Energies 13 00561 g007aEnergies 13 00561 g007b
Figure 8. Fuel consumption as a function of the share of an additive ((a)—start–stop ON, (b)—start–stop OFF).
Energies 13 00561 g008
Figure 9. Carbon dioxide emission for fuel mixtures as a function of the share of an additive ((a)—start–stop ON, (b)—start–stop OFF).
Energies 13 00561 g009
Figure 10. Impact of analyzed fuels onto selected environmental areas (mPt).
Energies 13 00561 g010
Figure 11. Particular carbon dioxide emissions occurring in production processes of selected fuels (%).
Energies 13 00561 g011
Figure 12. Comparison of carbon dioxide emissions from fuels in the context of the fuel life cycle.
Energies 13 00561 g012
Table 1. Basic technical data of the engine 1.3 MultiJet II used in the simulation.
ParameterUnitMultiJet II
Cylinder layout-in-line
Number of cylinders, c-4
Type of injection-direct, multistage
Compression ratio, e-16.8:1
Diameter of the cylinder, Dmm69.6
Piston stroke, Smm82
Engine displacement, Vsscm31251
Maximum engine power, NekW55
Engine rotational speed for its maximum power, nNrpm4000
Maximum engine torque, MeNm190
Engine rotational speed for its maximum torque, nMrpm1500
Rotational speed of idle gear, nbjrpm850 ± 20
Table 2. Selected properties of the fuels applied. FAME—fatty acid methyl esters.
ParameterDieselFAMEButanol
Carbon content (%)86.578.064.8
Hydrogen content (%)13.412.013.5
Oxygen content (%)0.010.021.6
Calorific value (kJ/g)44.037.033.1
Air demand (gair/gfuel)14.512.511.2
Table 3. Proportions of fuels used in the model.
Diesel/FAMEDiesel/Butanol
100%/0%100%/0%
90%/10%90%/10%
80%/20%80%/20%
70%/30%70%/30%
60%/40%60%/40%
50%/50%50%/50%
40%/60%40%/60%
30%/70%30%/70%
20%/80%20%/80%
10%/90%10%/90%
0%/100%0%/100%
Table 4. Vehicle parameters implemented in the “test generator” block.
ParameterUnitFiat Panda
Vehicle weightkg1020
Rolling resistanceN6.15
Aerodynamic resistanceN/(km/h)20.0412
Table 5. Parameters for the ‘drive system’ module based on the manufacturer’s data.
ParameterUnitFiat Panda
Radius of the vehicle wheelsm0.298
Drive system ratio for torque(-)0; 1/13.46; 1/7.05; 1/4.55; 1/3.24; 1/2.42
Drive system ratio for rotational speed(-)0; 13.46; 7.05; 4.55; 3,24; 2.42
Table 6. Parameters used in LCA analysis.
Fuel Consumption in the Cycle (l/100 km)
Fiat Panda
MultiJet II
UrbanExtra urbanCombinated
4.73.53.9
Estimated Fuel Consumption in Car Service Life
Diesel6750
FAME8250
Butanol8250
CO2 Emission from Fuels in Production Process (kgCO2/1 kg fuel)
Diesel0.341
Butanol3.18
FAME−7.01
CO2 Emission from Fuels in Burn Process (Start–Stop System ON) (g/km)
Diesel161,59
Butanol173,16
FAME161,33
CO2 Emission from Fuels in Burn Process (Start–Stop System OFF) (g/km)
Diesel163,65
Butanol175,39
FAME163,39
Service life of car (km)
150,000km
Table 7. List of CO2 emission results for the individual fuels with values from regulations.
Fuel UsedCO2 (kg) EmissionCO2 (g/km) EmissionCO2 (g/km) Value Required by the Regulation
Start–Stop System ON
FAME4.026175.48130
Butanol3.751163.44130
Diesel3.757163.87130
Start–Stop System OFF
FAME4.078175.398130
Butanol3.799163.398130
Diesel3.805163.656130
Table 8. Stoichiometric content of biobutanol compared to two methyl esters of fatty acids.
Content %CHO
Butanol64.8713.5221.63
Methyl palmitate75.5612.611.86
Methyl stearate76.5212.7610.74
Table 9. Total carbon dioxide emission from analyzed fuels during life cycle.
DieselFAMEButanol
CO2 total emission from fuels (start–stop system ON) (t)26.98−32.8512.43
CO2 total emission from fuels (start–stop system OFF) (t)27.29−32.5112.74
Table 10. Carbon dioxide emissions for a given fuel over the vehicle’s life cycle.
FuelCO2 Total (t)
Diesel26.98
FAME−32.85
Butanol12.43

