1. Introduction
All of the leading producers of drilling rigs in the recent three decades have devoted their attention to the development of process monitoring systems to enhance the control and quality of blast-hole drilling [
1]. This initial step of ore extraction in mines using blasting technology has to be performed with an excellent, repeatable accuracy and high efficiency in order to ensure the economic feasibility of mining operations in the reality of the currently worsening mining–geological conditions, meaning decreasing thickness of the deposits, their depletion and deepening location. Since on-board monitoring systems have became a standard for this type of machine, to utilize their potential, it is crucial to develop accurate data processing algorithms that will enable the assessment of the efficiency of the blast-hole drilling process.
To date, there have been several research directions regarding monitoring and data analysis systems related to the drilling process. Equipment could be used for rock mass characterization, drill bit wear monitoring, the assessment of the performance of the drilling process and operator’s skills, development of the design of a machine, minimization of the energy consumption for the drilling, etc. One of the most important parameters in blast-hole drilling is the service time of drill bits [
2]. Their design and gradual deterioration are the principal components influencing overall productivity and machine down-times. Although some methods for the on-line condition monitoring and wear prediction [
3] of drilling bits are currently under development, efficient diagnostics of these elements is still not a trivial task. The information about the number of drilling cycles as well as the quality of the drilling may be also used for maintenance policy.
Another issue arising in the real conditions of underground mines is the setting of appropriate drilling parameters for the usually not definitely known and varying rock media hardness, namely the drill bit rotation speed, feed pressure and percussion frequency. Although certain practical recommendations are given for each type of drilling tool by their producers, operators of machines need on-line data processing methods to adequately react to quickly changing geological conditions.
Regardless of the source of the measurement data, one can easily achieve very good results in the monitoring of the drilling process using basic analysis methods. In this work, it is shown that, with the help of very basic data acquisition systems, we obtain valuable measurements that allow us to avoid sophisticated and expensive measurement methods. The paper is organized as follows: first, we recall some work related to the monitoring of the drilling process; then, we define a research problem and propose a solution to it that includes experimental work, hardware and software solution. The validation of the proposed methods is conducted by comparison with an on-board embedded monitoring system installed on the machine as an option.
Monitoring of the Drilling Process—The State of the Art
The monitoring of blast-hole drilling performance, using both externally applied sensors and observations of the parameters of drilling tool-driving components, has been considered in numerous studies. Since the emergence of the concept of the so called “specific energy”, described by R. Teale in 1965 [
4], the main focus of research has aimed at upgrading the reliability, correctness and applicability of the rock mass characterization. The Measurement While Drilling (MWD) methods were used to evaluate roof strata based on feed pressure and acoustic data [
5,
6]. The detection of the abrupt changes in data patterns related to drilling, which was exhaustively presented in [
7], has been applied to detect interfaces between different lithological types or to locate voids in the roof layers. A brief introduction to one of the techniques that allows for the detection of discontinuities, voids, cracks and the identification of different roof strata—a cumulative sum algorithm (CUSUM)-based program—has been shown in [
8]. An accelerometer and acoustic sensor, independent of other sensors, have been successfully used to detect small apertures and voids in [
9].
A simple and widely used support vector machine (SVM) pattern recognition algorithm has been successfully used to classify different soft and hard rocks in real-time, as presented in [
10]. Input parameters such as the penetration rate, rotation pressure, feed pressure, vibration and acoustic signals have been used in combination with time series classification. Parameters such as the weight on bits or thrust and accelerometer data related with drilling—measured on the drill head as well as on other parts of the machine—have been used to estimate the mechanical properties of rock mass [
11]. Another contribution to the evaluation of rock mechanical parameters with MWD measurements was presented in [
12], in which an analytical model of a process that could be useful to evaluate the uni-axial compressive strength was described. The authors broke the process down into the repetitive cycles of feeding and cutting, and based on the fact that only cutting and indentation are effective, while friction on the flank surface and idle running do not contribute to the effective drilling work, an effective specific energy parameter that is independent of the penetration rate was derived.
MWD data, compared with geophysical loggings, were proven to be appropriate for determining rock properties in [
13]. In [
14], a method to derive operational parameters of the drilling jumbo (rate of penetration, rotary speed and torque and pulldown force) from voltages and currents was described. Data of this type have been applied to estimate rock-breakage characteristics, aimed at mine-to-mill optimization solutions in open-pit mining, as conceptually presented in [
15]. Another example of the characterization of drilled material in open-cast mines, performed based on the drilling performance indicator linked with geomechanical parameters and in which the new measure of the Modulated Specific Energy (SEM) was introduced, can be found in [
16]. Other interesting instance of the MWD technology application is the prediction of Excavation Damage Zones sizes, which are induced by blasting in underground excavations [
17].
As can be seen, the focus of researchers was aimed at obtaining information about the rock mass, indirectly and automatically, leading to an increase in the understanding of the interactions between the machine and rock material.
In addition to the characterization of rock properties, process parameters can be used for the on-line diagnostics of drilling tool wear and other parts of machine equipment. By conducting laboratory tests on the wear resistance of drill bits inserts made of Cemented Tungsten Carbide [
18] or their optimal selection and performance [
19], it is difficult to approach the real contact conditions due to the possible dynamical effects related to elastic deformations of the drill-string and other structural elements [
20]. For example, the effects of coupling modes on torsional, bending and axial vibrations can be observed in drilling units [
21].
Therefore, the simultaneous observation of the acoustic data, voltages, currents and other signals available from the on-board data acquisition systems—e.g., bailing water pressure or temperature [
22]—should help to better understand some hidden dynamical processes in the machine, leading to higher performance via its automation and control.
Acoustic telemetry and mud pulse telemetry are the communication methods used in deep-well drilling to provide valuable on-line information from the underground. However, acoustic signals have a significant attenuation and need repeaters for their transfer to on-surface monitoring systems [
23]. The horizontal blast holes have a comparatively small depth (2–6 m); thus, acoustic signals can be directly registered by a properly installed microphone. This particular feature constitutes a physical basis for drilling process and tool condition monitoring by the acoustic waves generated in the rock deformation zone.
To correctly understand the events in the drilling process and equipment, the adequate segmentation of continuously recorded signals is absolutely necessary, as in any other types of underground mining machines. The task of the identification of operational cycles in the monitoring systems of underground vehicles is solved in [
24].
Cycle extraction from process data has been discussed in [
25]. Stefaniak et al. proposed several algorithms for the multidimensional analysis of the data from an on-board monitoring system used in the underground heavy duty load-haul-dump trucks (LHDs) [
26]. The problem of drilling robotization has been discussed in [
27]. Timusk et al. proposed a method for the automated operating mode classification of online monitoring systems [
28]. Wodecki discussed long-term data analysis for condition monitoring purposes [
29], Al-Chalabi et al. [
30] discussed the problem of reliability in drilling. The problem of data acquisition, validation and analysis for LHD machines has been discussed in [
31]. Acoustic emission and different acoustic signals have also been used for drilling monitoring in various contexts [
32,
33,
34,
35,
36,
37]. However, as mentioned in the discussed case, blast-hole drilling in the considered mine is a specific problem due to its enormous scale. Precise information about the number of holes, their lengths and the manner in which the drilling was performed is required; in that sense, the monitoring of the drilling process and drilling related-knowledge acquisition is very challenging.
2. Problem Definition
To properly assess the efficiency of the works performed by mobile machinery, the division of the generic process of blast-mesh preparation into sub-processes is required. Cyclically repetitive processes, which are completed by the drilling jumbo included in the preparation of the mining face before the injection of explosives in blast-holes, include the positioning of the drill, hole pre-boring, the actual drilling of the blast hole and blast hole flushing. The identification of the above-mentioned sub-processes and the definition of their duration is undoubtedly valuable from the perspective of efficiency and quality assessment. The problem can be approached by taking advantage of the electrical current signal, which varies when the load on the working unit changes consecutively with the succeeding sub-processes comprising the drilling cycle. Moreover, inspired by the operator’s experience, an additional source of information regarding drilling performance can be taken into account, which is the acoustic signal. Being aware of the characteristic patterns in sound emission related to consecutive actions of a drilling rig, namely idle running (when the drill is positioned), pre-boring and the actual drilling, some informative features can be found in a pre-processed signal. The identification of such features can be used for the automatic distinguishing of the sub-processes and their duration and to count the number of drilled holes.
This paper outlines part of the fully automated evaluation of the operator’s and machine’s efficiency. The methods presented by the authors have potential for the monitoring of drilling in mining faces, with special attention being paid to the identification of the drilling of individual holes, based on three separate sources of information:
The automatic identification of cycles and analysis of their features (electric parameters, time, amount, presence of pre-boring etc.) based on signals registered by the on-board data acquisition system;
The automatic identification of cycles and analysis of their features based on the raw electric current consumption signal measured directly on the power line;
The automatic identification of cycles and analysis of their features based on external noise recording.
3. Machine and Experiment Description
In underground mines that exploit deposits with the use of blasting technology, the drilling rig is the first machine in the technological cycle, the performance of which affects the general efficiency obtained in the exploitation area. Self-propelled drilling machinery for mining purposes can be decomposed into key elements, which are the operator’s cockpit, electric cabinet, water hose and electric cable reeling units, diesel engine (or electric motor in case of battery-powered rigs), hydraulic system, leveling jacks, boom, arm and drill. In addition to drill carriages, there is sometimes a platform for a miner incorporated in the machine’s structure. Currently, drilling jumbos are adjustable to local mining conditions, and therefore there are a multitude of available sizes—from the large sizes designed for large excavations and construction of tunnels to small, compact versions that are appropriate in cramped conditions (in ultra-low seams, for example). The rigs are equipped typically with up to four booms. It should also be noted that the other type of machinery—the bolting-rig—that is responsible for the reinforcement of the excavation after the blasting and loading of ore is very similar from a design point of view and also performs drilling to prepare anchor holes. Thus, not only can the performance of the drilling rig operating at the first step of the technological cycle be approached with the method described in this study, but the efficiency of rotary drilling and the preceding injection of the resin bolts can be evaluated as well.
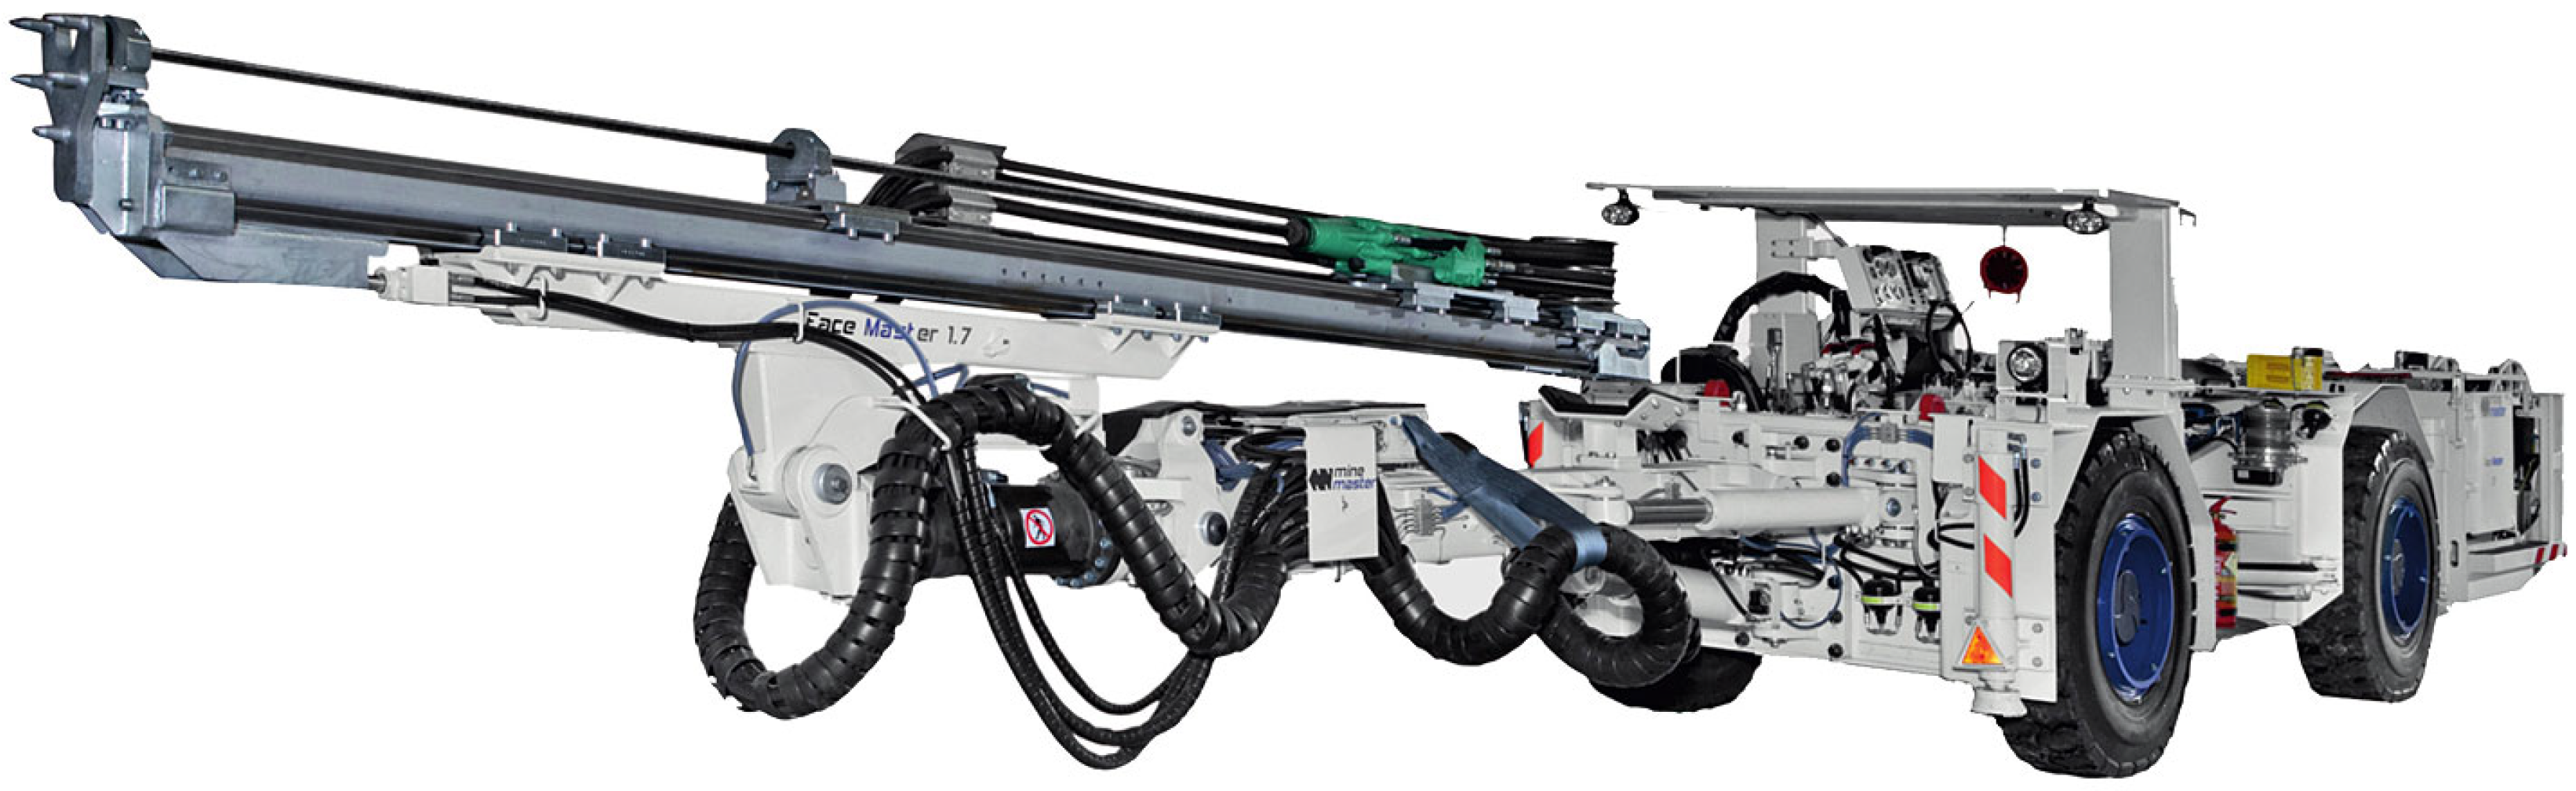
3.1. Drill Rig Facemaster 1.7
All the measurements described in this article were taken on the FaceMaster 1.7 single boom drill jumbo, as shown in
Figure 1). This drilling rig is an example of a diesel-powered machine designed for the preparation of a 3.2 m net length blast holes, with diameters from a threshold of 41–76 mm. The drilling rig is equipped with an HC95 LM hydraulic drifter that drives its rotary-percussive rock drill. After reaching the face and switching the combustion engine off, the main functionality of the machine is enabled by the supply of electrical energy from the mine’s energy distribution network. The electric motor driving the hydraulic pump and supplying the machine’s working system (the extension arm and feeder allow the positioning of the drill according to the established drilling-and-blasting mesh, together with the drifter providing rotation and percussion movements) is powered by an electric current.
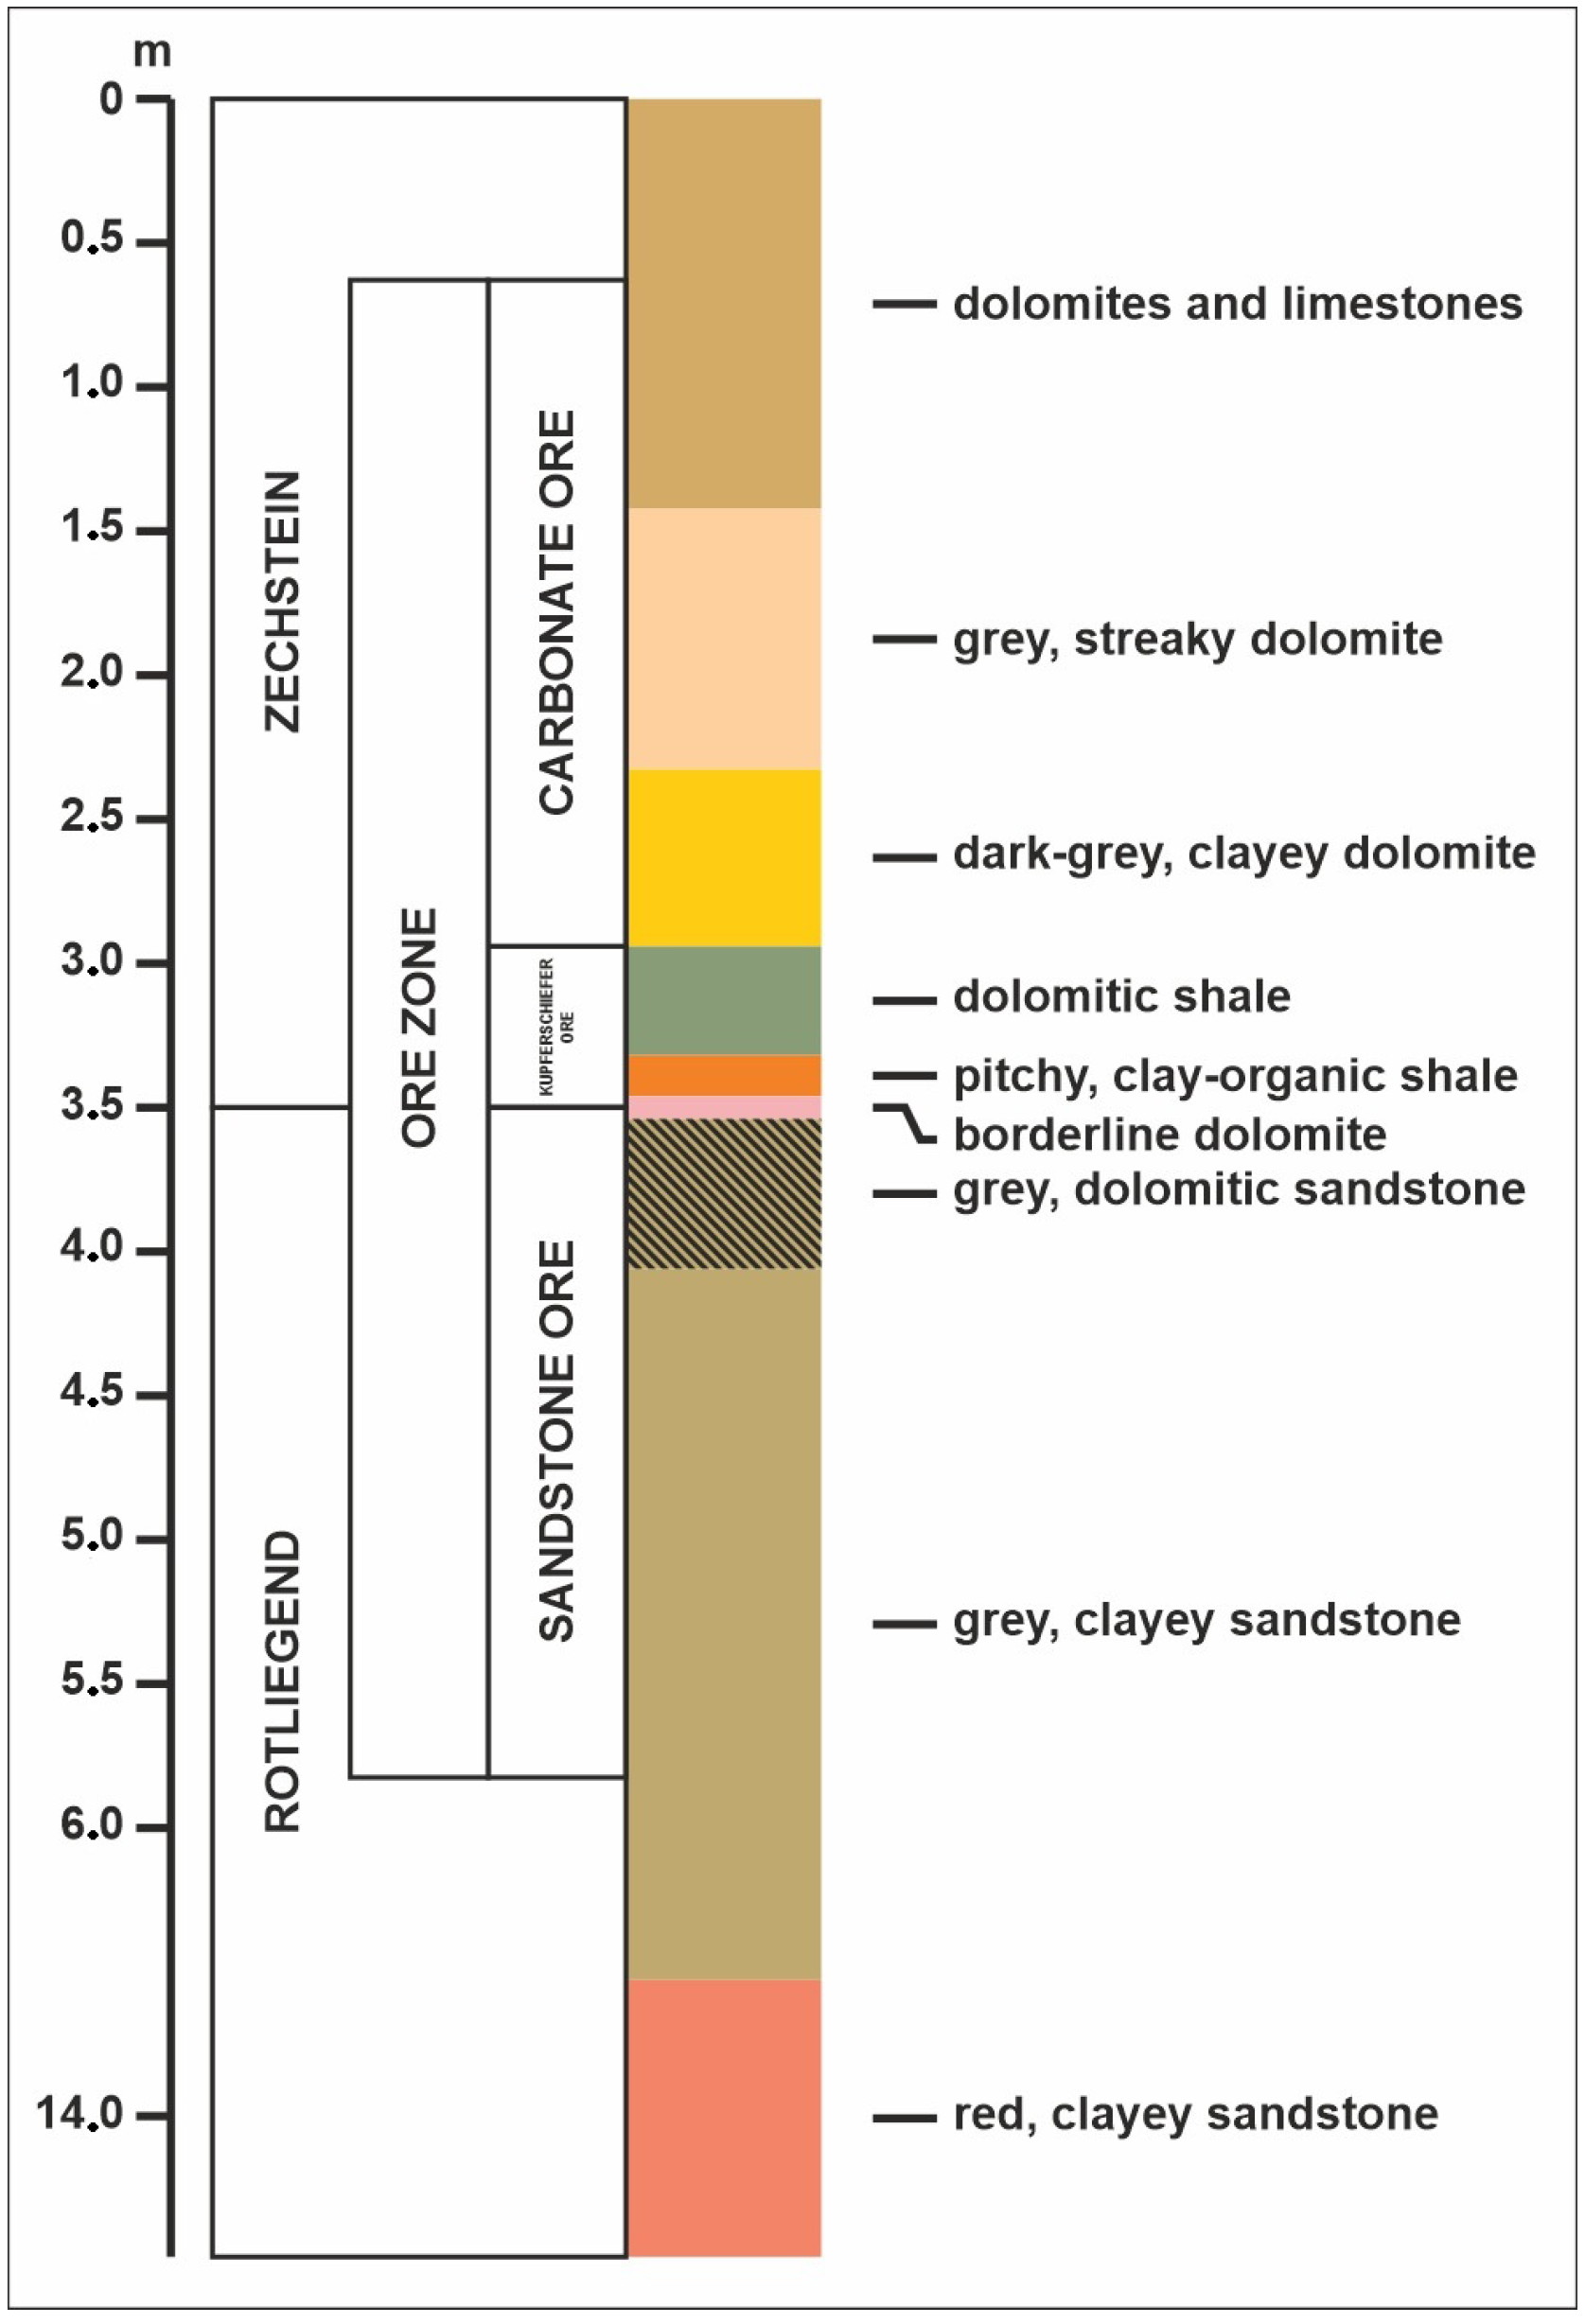
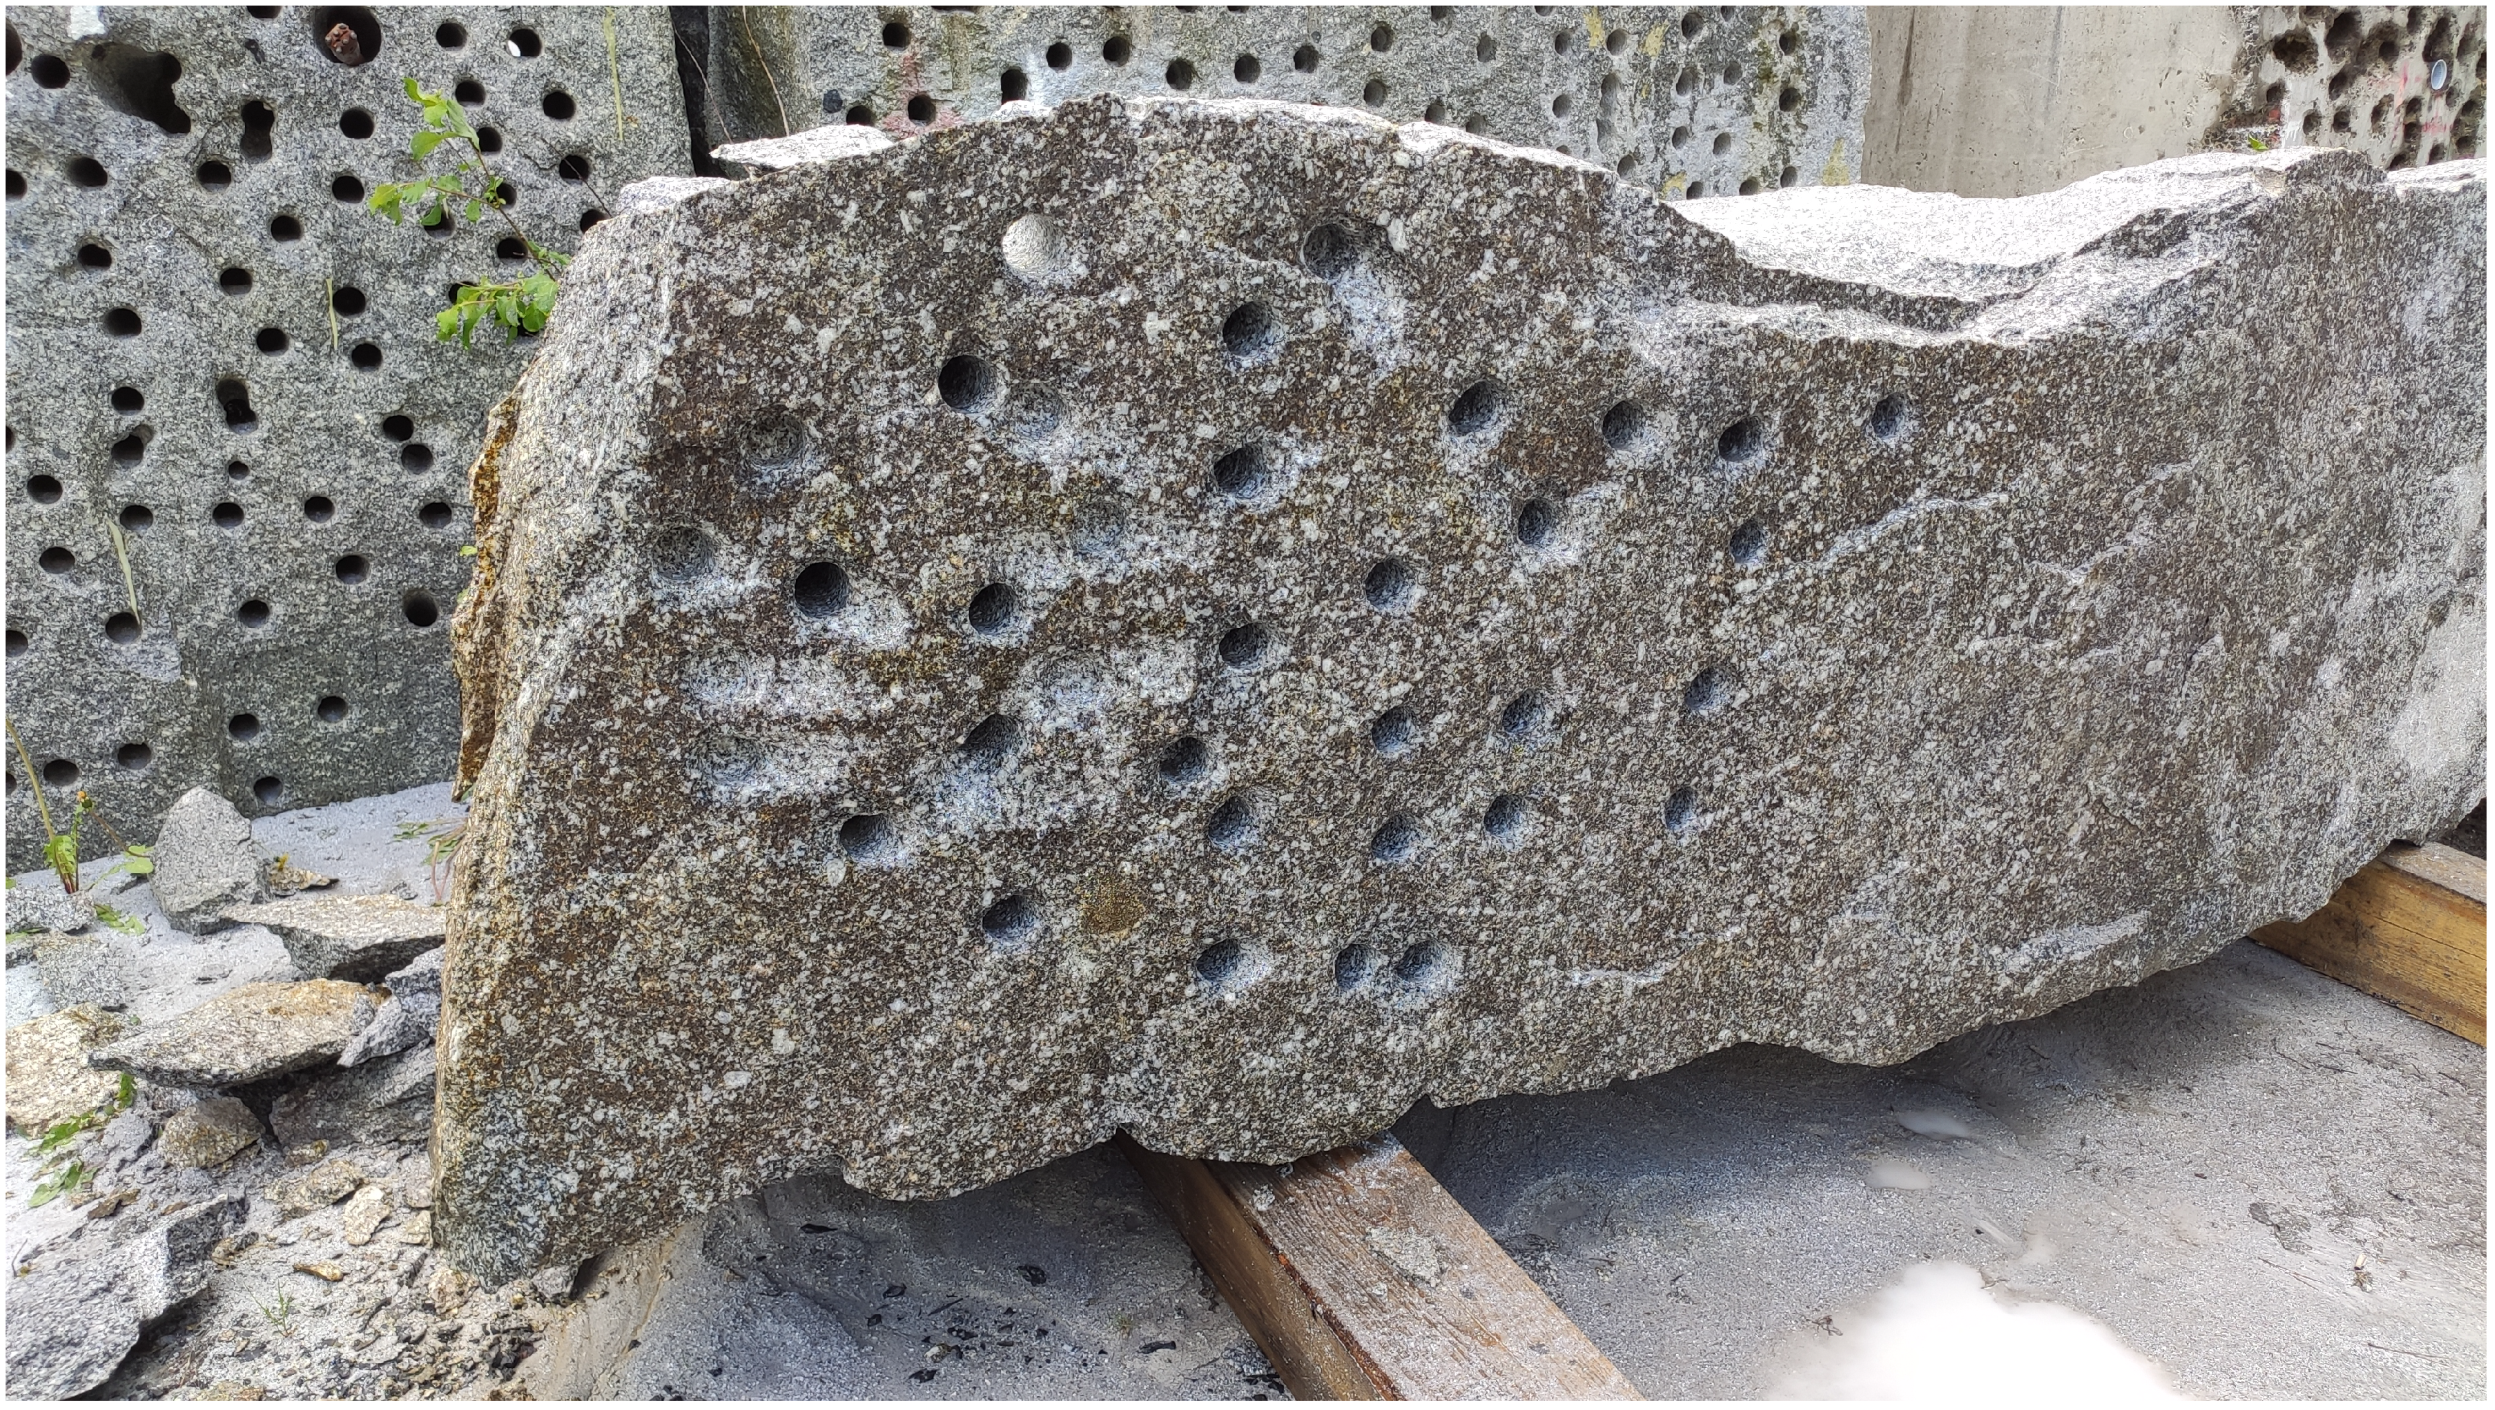
3.2. Geological Conditions
The experiment comprised the drilling of multiple blast holes with standard-diameter granitoid blocks at their full length (70–80 cm). The rock composition predominantly included feldspar, quartz and plagioclase, containing minor micas and amphiboles. Grains of the rock were relatively coarse and uniformly distributed. The lithology of the sample designed for the experiment was a rough approximation of the actual rock types encountered in the ore zone in the KGHM Polska Miedź mines, where the following lithological sub-types of rocks were present (see
Figure 2): dolomites and sandstones; grey, streaky dolomite; dark-grey, clayey dolomite; dolomitic shale; pitchy, clay-organic shale; grey, dolomitic sandstone; grey, clayey sandstone; and red, clayey sandstone. Furthermore, drilling performed in a uniform rock mass that is devoid of discontinuities, voids and interbeddings does not reflect the conditions present in the mining faces. Such occurrences of non-uniformity are suspected to cause changes in the instantaneous performance of rock drill, and thus other parameters are related to it, including those analyzed in this study.
It should be noted that a granite rock was chosen because its average compressive strength was approximately the same as the average compressive strength in an ore deposit profile, at approximately 130 MPa [
38,
39]. The aforementioned rock was easily accessible on the surface and had similar mechanical properties to the ore raw material. This made the experiment a good simulation of the conditions in an underground copper mine.
3.3. Scenarios for Experiment
The underground working conditions in which a single boom drill jumbo tends to work are often unpredictable, and it is very demanding to extract signals only from the machine’s drilling process. Based on ground experiments conducted at the MineMaster facility, measurements of vibrations, acoustics, and current consumption rates were taken. The principal approach was to implement many measurement sources for one process and distinguish the main features determining the drilling process phase between the different methods.
Using the non-invasive method of the machine’s workload assessment, a current measurement for instantaneous energy consumption was presented. An on-board diesel-engine powered only the steering system and a small hydraulic pump of the presented machine. As the power consumption of the drilling system was incomparably greater, the internal combustion engine was not used for this purpose. Thus, on these machines, the hydraulics of the drilling system were powered with an external AC 500 V or 1000 V three-phase voltage with a frequency of 50 Hz. An external source of electricity was connected to the machine’s electric cabinet. The power supply was symmetrical, and consequently, a current clamp was mounted on any conductor of the supply line. It is important to underline that the level of energy consumption during the drilling process for the other machine subsystems, apart from the drilling system, was roughly constant. Owing to that fact and thanks to the current level analysis, we were able to gain insights into how the drilling process changed directly from current measurement.
Our approach allowed us to observe the movement of the drill bit and the number of holes, as well as the type and “style” of drilling. Moreover, the inrush current was measured and was found to be significantly above the rated current because of a cold start that occurred at the beginning of the work. Summarizing the above, the proposed current level measurement gave us a deep understanding of the drilling process from a new approach based on the level of current rather than, for instance, the pressure of drilling subsystems, which is currently widely used.
The experiment was divided into eight phases in which drilling points were deployed on the rock surface, as can be seen in
Figure 3. The first experiment included the drilling of four holes in a straight line, and the second included five holes made in the same manner. The next stage consisted of five holes simulating an inexperienced machine operator, where the pre-drilling phase was slightly corrupted, as can be seen in the deeper analysis presented in the further
Section 6.3. Following that, the fourth trial included five holes of blow/dry drilling, with a further reach of the drill into the rock. The fifth phase included another four holes made in a straight line, and the last one was made without the flushing of the hole. The sixth stage comprised one properly drilled hole, and later the operator quickly moved the drilling system of the machine back. The corresponding data obtained from current usage showed that our experiment differed significantly from the standard drilling process. In the seventh phase, one long-hole drilling process can be seen. The last step comprised two holes made when the rear support feet were retracted.
4. Data Sources
In the first stage of the extraction and processing of the excavated material, we used a single boom drill jumbo. To precisely control the process, it was necessary to acquire data from the drilling process of the aforementioned machine. Although the working parameters depended in large part on the physicochemical parameters of the rock, this process was repetitive, and it was possible to distinguish subsequent stages of the drilling process. From the perspective of a company in which tens or hundreds of these machines work continuously, it is important to send only key information about the machine’s operation to the main supervisory control and data acquisition (SCADA) system. For this purpose, it is necesasry to determine the number and the quality of drilled holes. The system used for the diagnostics of working processes and technical conditions to support the management of the machinery in Polish rock mines is presented in [
24]. This system, implemented for self-driving mining machines, consists of several types of gathered information, mainly regarding subsystem pressures or the mechanical parameters of engines.
In this research, we aimed to develop an accessible and effective way to gather information about drilling performance. Thus, we used data related to power supply parameters acquired from the on-board system installed on the tested machine. Moreover, we proposed our electric current monitoring system as well as acoustic measurement (a simple smartphone was used to record a video from which sound was extracted). All these data acquisition methods, together with the techniques of their processing, are described in the following subsections.
4.1. On-Board Data Acquisition System
The first source of data in the performed experiment was the on-board data acquisition system that registered various parameters related to the machine systems’ power supply. The sampling frequency of the obtained dataset was equal to 10 Hz. For the purpose of the analysis described in this paper, the authors acquired the signals presented in
Table 1.
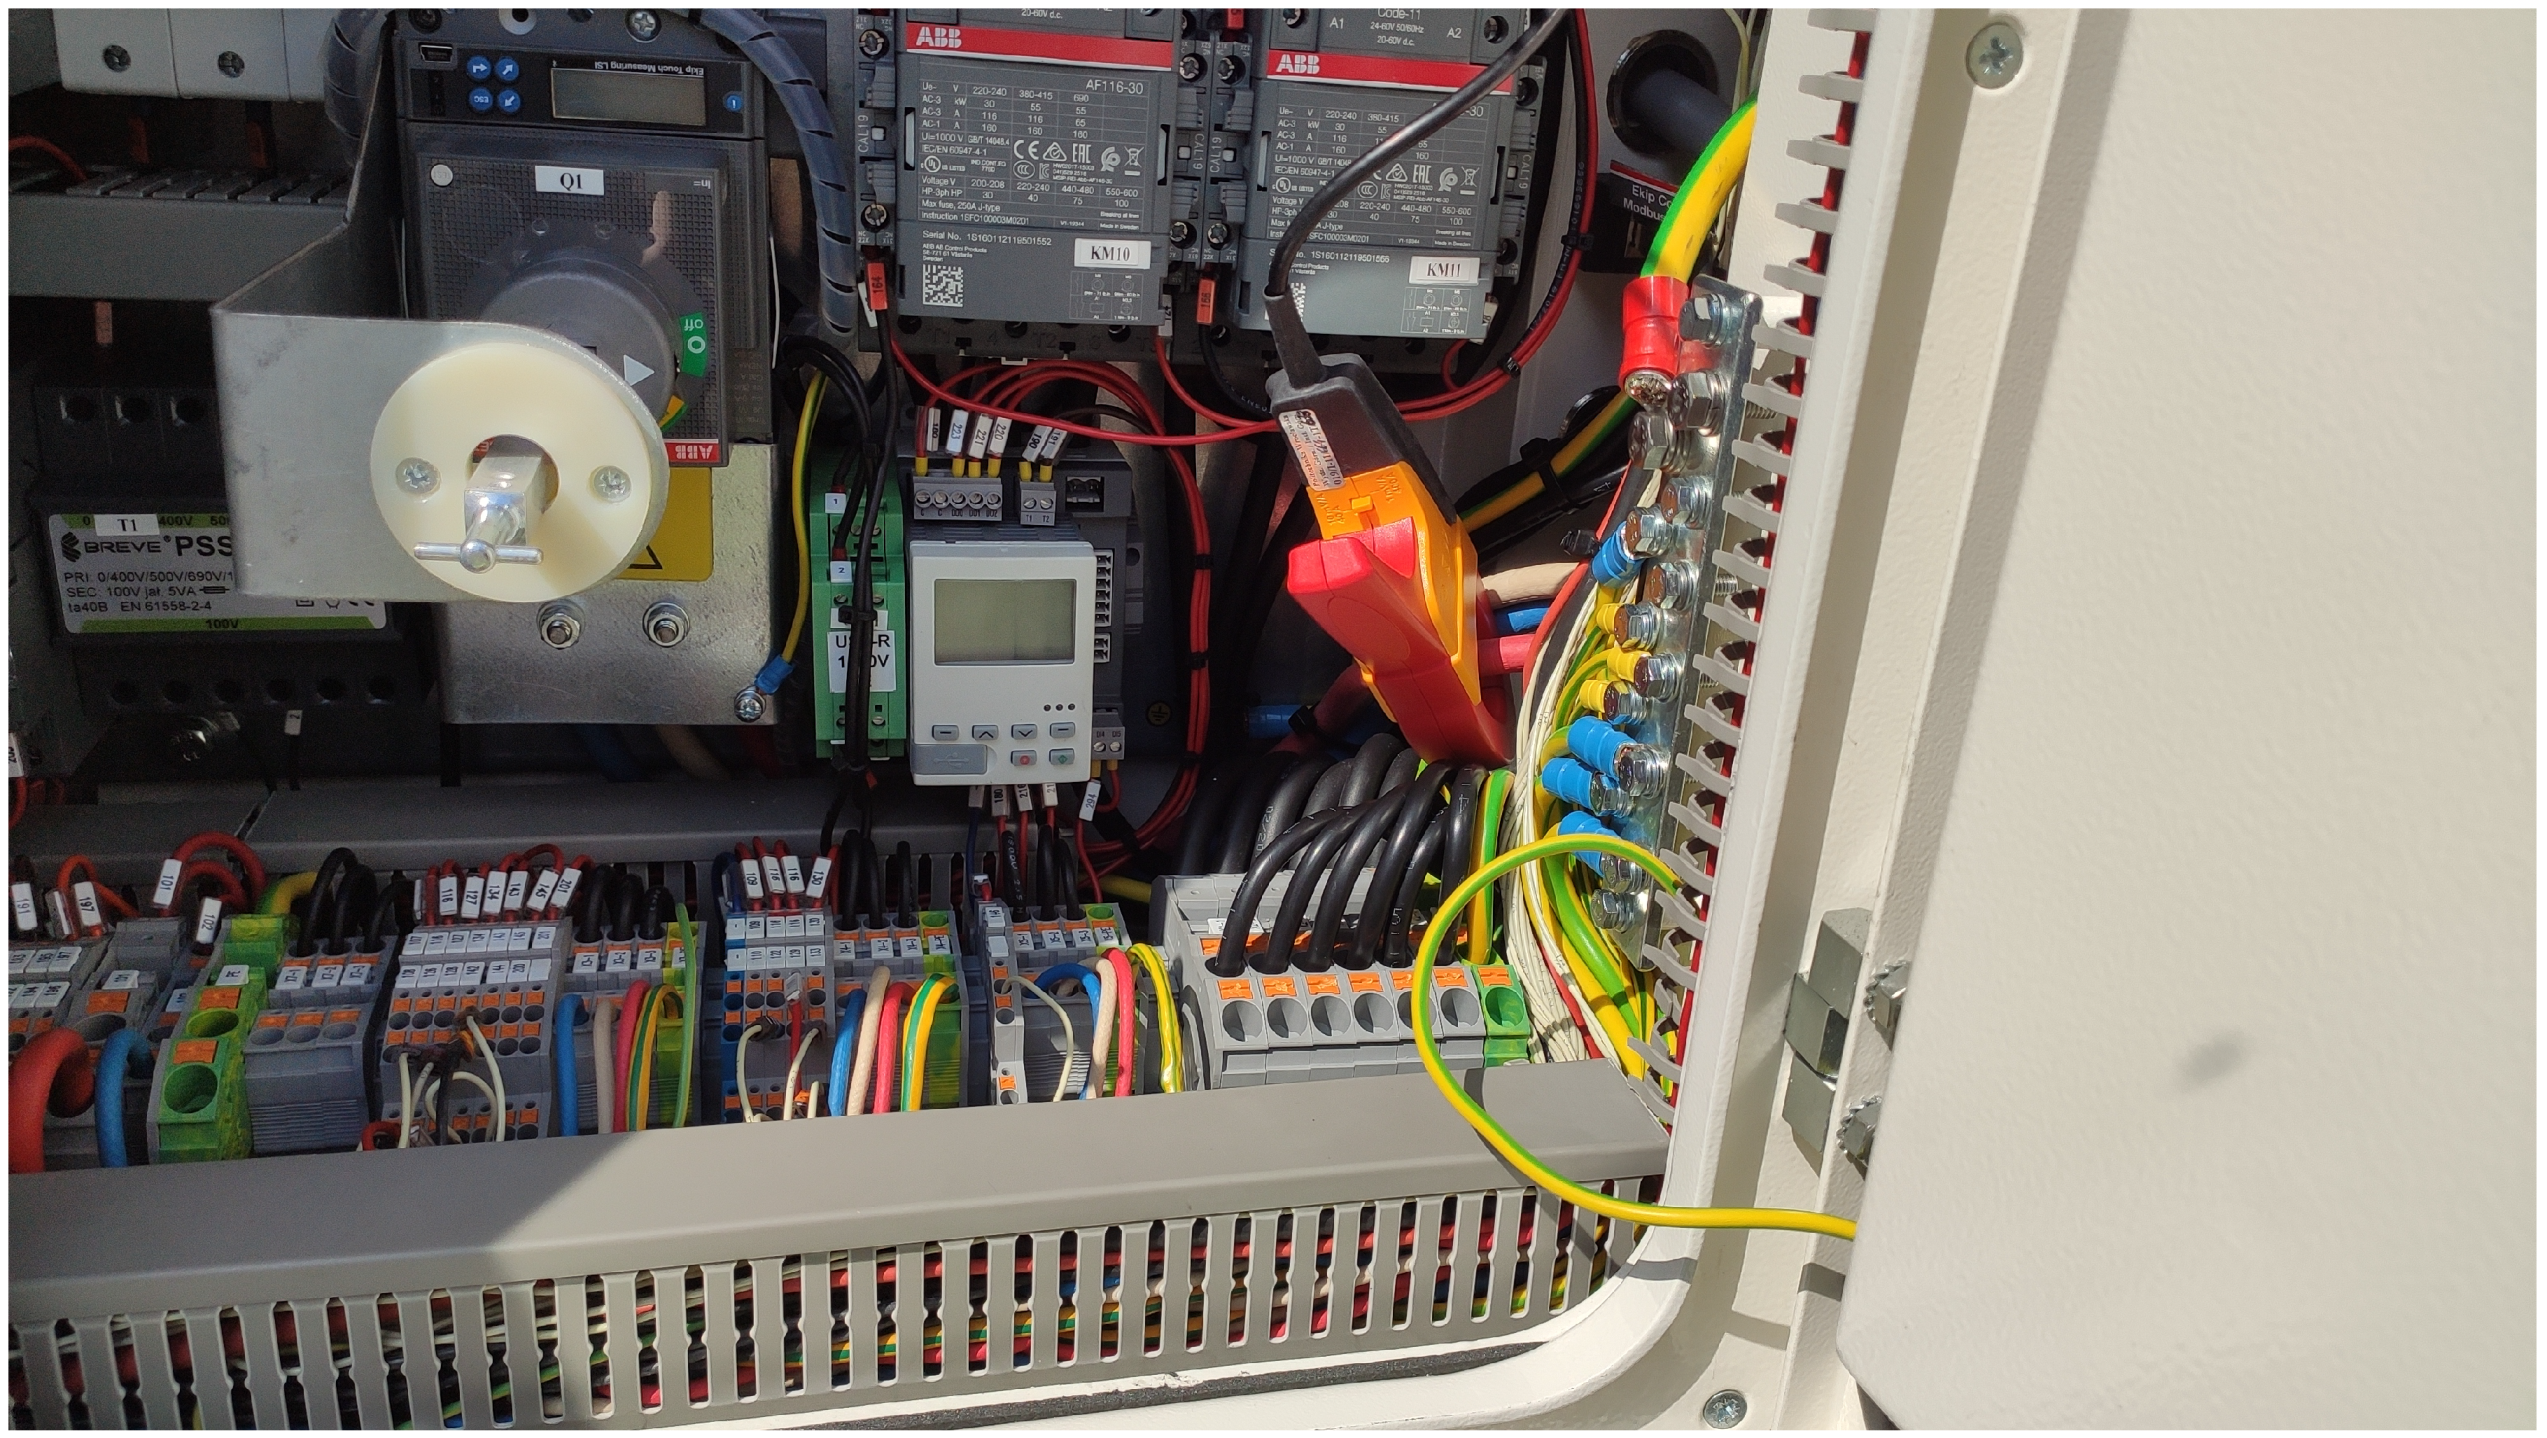
4.2. Induction Clamps for Current Measurement
As with many sensors used for current measurement in the automation industry, the majority of solutions are based on in-circuit measurement. It is necessary to apply this apparatus to the design level of machine development. On the other hand, current clamps are more convenient, as the current measurement system can be applied without any intervention in the machine’s electric circuits. The center of the measured conductor should be installed in the current clamp jaw. Additionally, it is necessary to consider that the clamp is perpendicular to the conductor, which helps users to gather appropriate results.
For experimental purposes, Fluke’s current clamp i400s (see
Figure 4) was used. An output AC voltage signal of 0–400 mV was received. For data handling, the cDAQ-9171 USB chassis with an analog-to-digital converter (ADC) module was used. The frequency of measurements was 2000 Hz; as a result, we observed a quick-change pulse at the moment of the engine starting. The second approach relied on the microcontroller-based measurement system, which omitted the presence of additional software from the signal card producer. All data were saved in .txt format on an SD card.
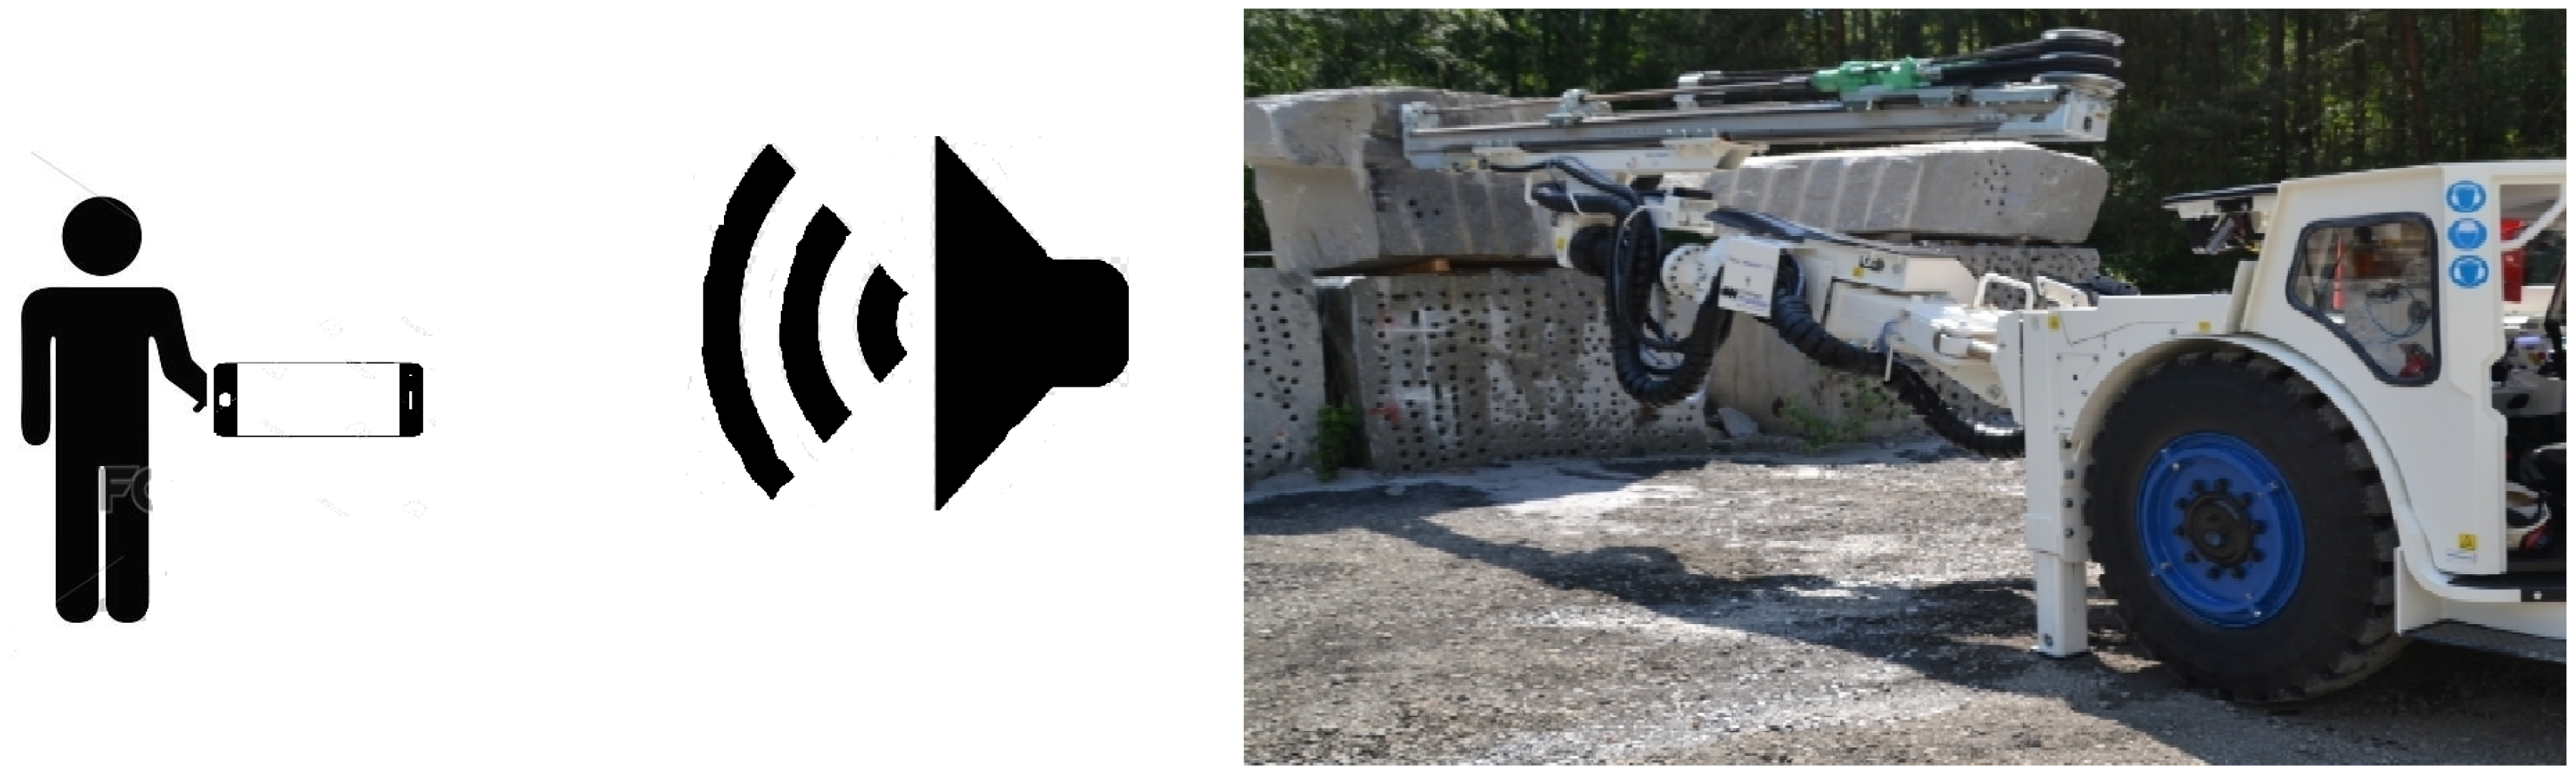
In addition to the electrical parameters, the authors registered an audio–video recording of the drilling activity. The recording was taken using a smartphone camera with a video sampling frequency of 60 frames per second and an audio sampling frequency of 48 kHz. The acquired video data provided a reference for other data sources and allowed us to validate timings and actions. Additionally, the audio feed extracted from the video files provided an additional data source for process-related analysis (
Figure 5).
5. Methods
The purpose of the methodology was to develop reliable raw data processing algorithms that are capable of extracting information about the drilling process. More precisely, it was expected that it would be possible to enable the identification of the number of cycles (the number of drilled holes) as well as information about the cycles’ properties (duration of the cycle, pre-drilling phase, etc.) to be provided.
5.1. Data Processing Framework
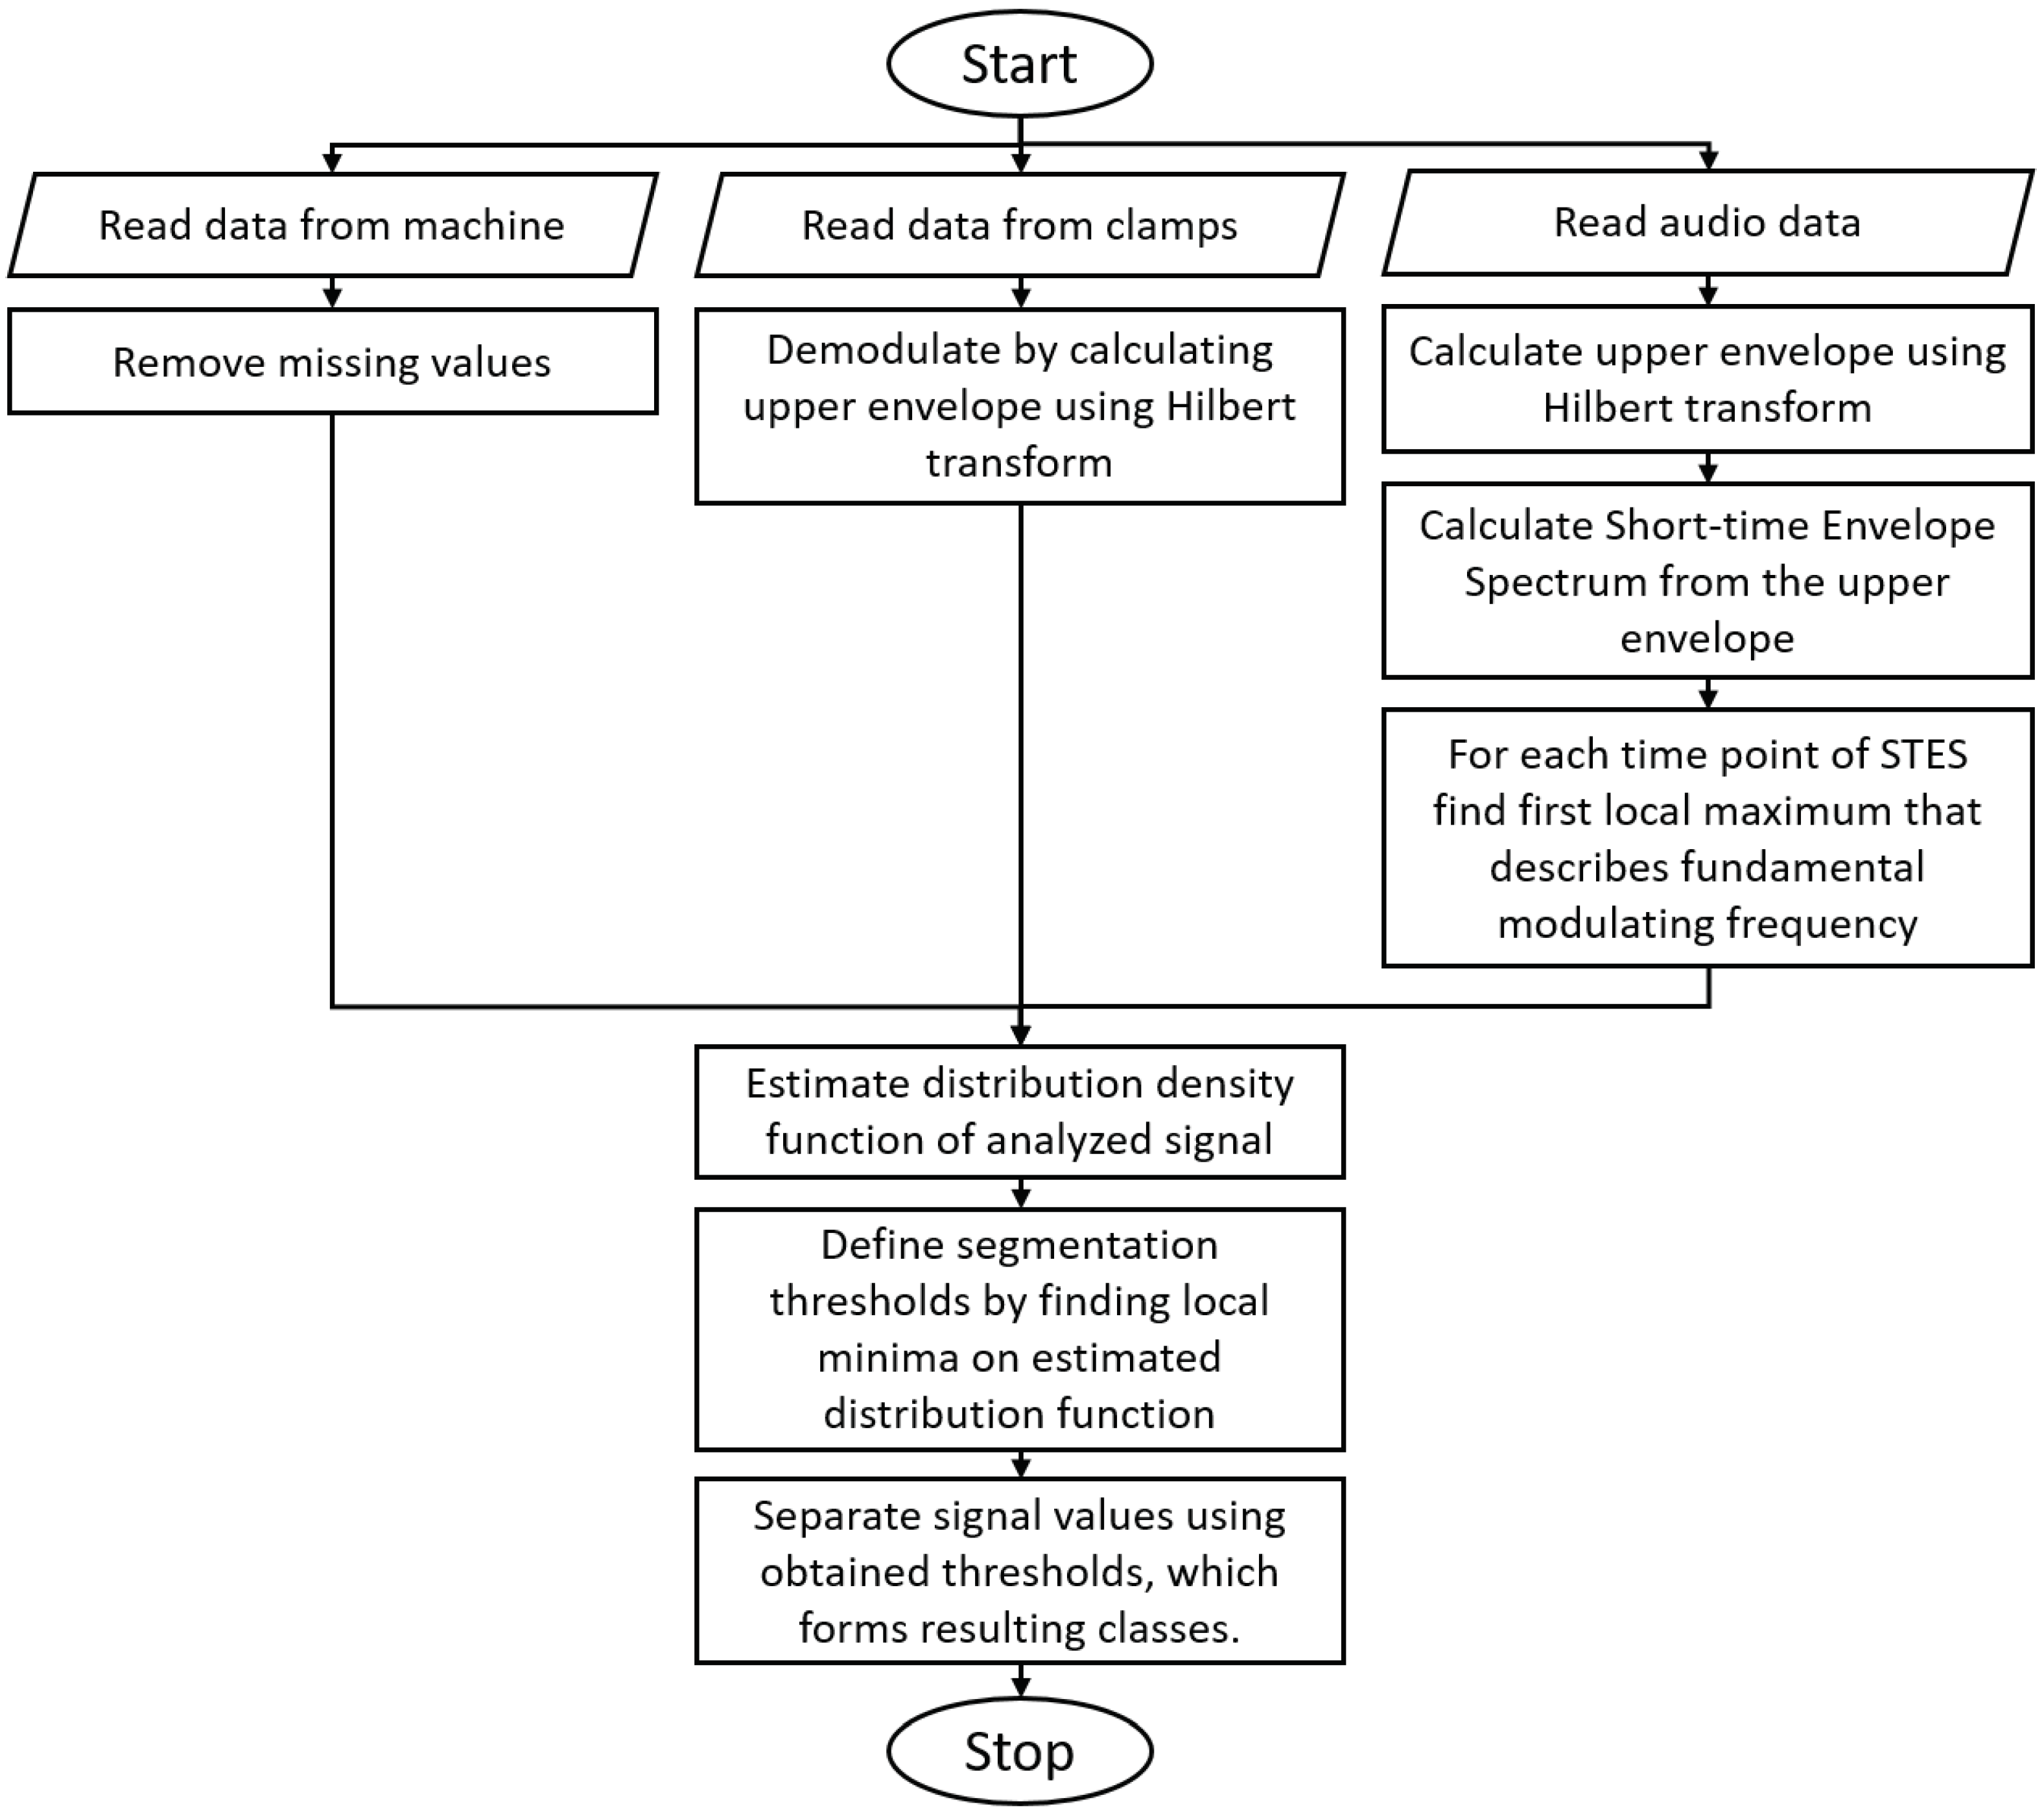
The methodology proposed here is a multistep procedure. Below, we first provide a general step-by-step framework (see
Figure 6); then, details of each presented step are further explained.
5.2. Density Distribution Estimation
In the presented application, density distribution was estimated using a kernel density estimator, which uses the estimated probability density function of a random variable [
41,
42]. For any real values of
x, the kernel density estimator’s formula is given by
where
are random samples from an unknown distribution,
n is the sample size,
is the kernel smoothing function and
h is the bandwidth. In this implementation, a standard Gaussian kernel is used.
The value of the bandwidth is obtained using the so-called Silverman’s rule of thumb [
42]. If Gaussian basis functions are used to approximate univariate data and the underlying density being estimated is Gaussian, the optimal choice for
h (that is, the bandwidth that minimizes the mean integrated squared error) is
where
is the estimator of the standard deviation of the samples and
n is the number of samples.
5.3. Threshold-Based Segmentation
The threshold-based segmentation of the signal is a fast and reliable method for the segmentation of data when individual states do not change over time. Thus, it can be useful for the processing of current signals, because current consumption levels (current consumption in the idle state, pre-boring state and drilling state) are typically well-defined.
For a given signal
of length
N with a predefined set of thresholds
T of size
K, the class indicator
is assigned to each sample based on the regime (range of values between two consecutive thresholds) to which it belongs. Firstly, the vectors of thresholds need to be padded from both sides with the minimum and maximum value of the dataset, so that each regime can be described with lower and upper boundaries:
Thus, the new vector
of length
N is created:
For ease of use, this formula has been presented in the form of pseudocode presented in Algorithm 1.
| Algorithm 1: Threshold-based segmentation. |
![Energies 13 06748 i001]() |
Thus, for each sample from the signal X, there is a value in vector C that holds its regime number. From this point, the easiest way to perform the actual segmentation is to calculate the numerical derivative of the vector C, where non-zero values will indicate the point of regime change, and the value for the next sample provides information about the class to which a given segment belongs.
5.4. Short-Time Envelope Spectrum
The short-time envelope spectrum (STES) applies the idea of envelope analysis, which is focused on cyclic modulations present in the signal, to the framework of time–frequency analysis. The authors decided to use the spectrogram as the base time–frequency representation. In the first step, the short-time Fourier transform (STFT) for discrete data
is given by the formula [
43]
where
is the frequency bin,
g is the time point and
is a window of length
L. One can observe that in STFT, for each time point, the Fourier transform is calculated using a fast Fourier transform (FFT). Furthermore, the spectrogram is the squared absolute value of the STFT:
The idea behind this method is to use a spectrogram not for the raw signal but for its upper envelope, calculated as a modulus of the Hilbert transform:
where
denotes the Hilbert transform of the signal
X [
44]. Applying the spectrogram algorithm to the envelope, one can obtain the STES:
6. Results
6.1. Process Monitoring Based on Electrical Data
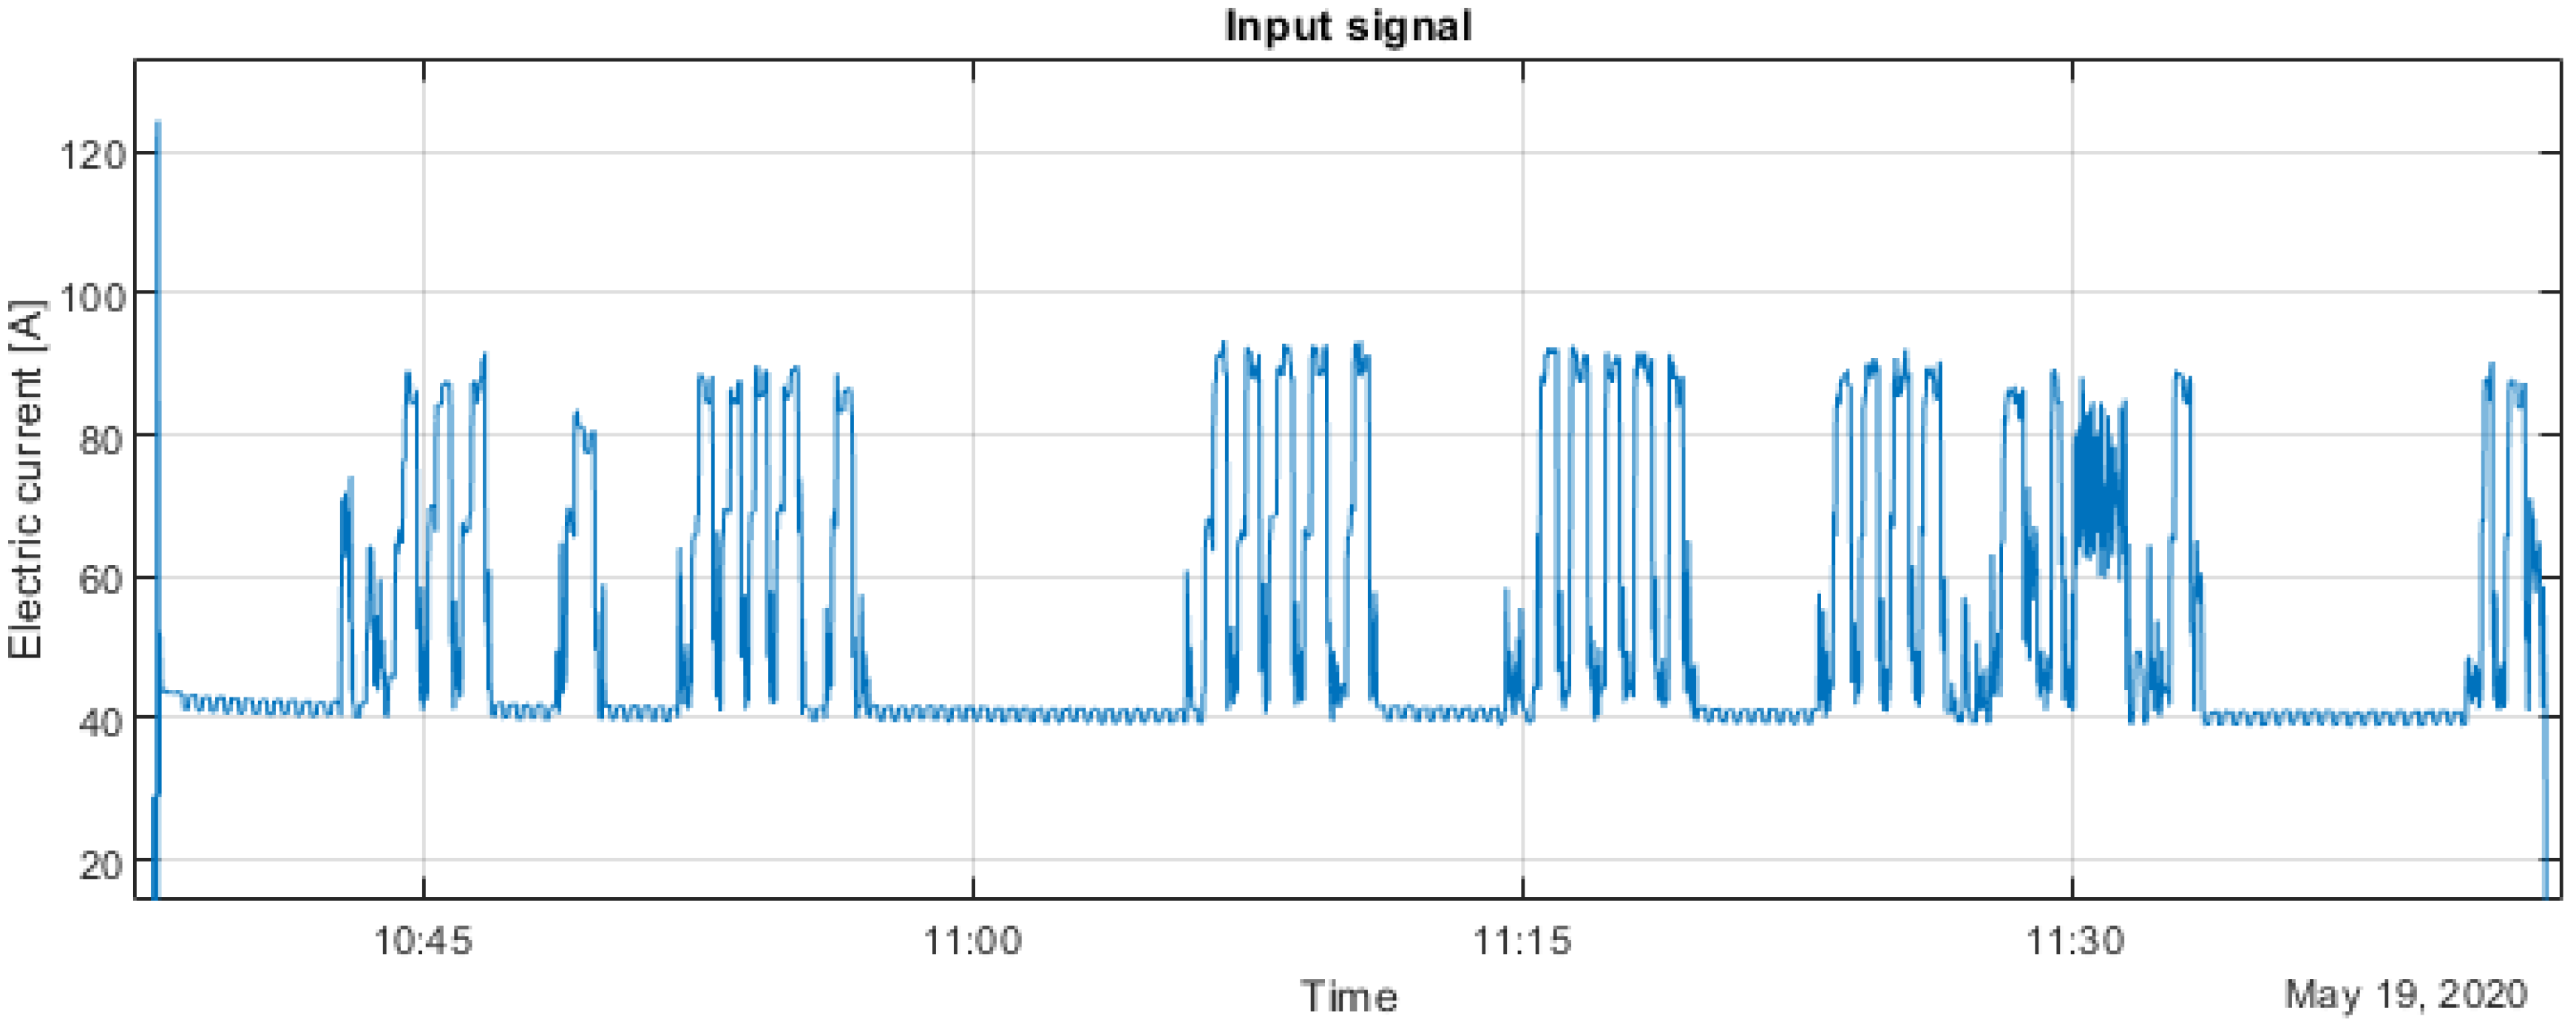
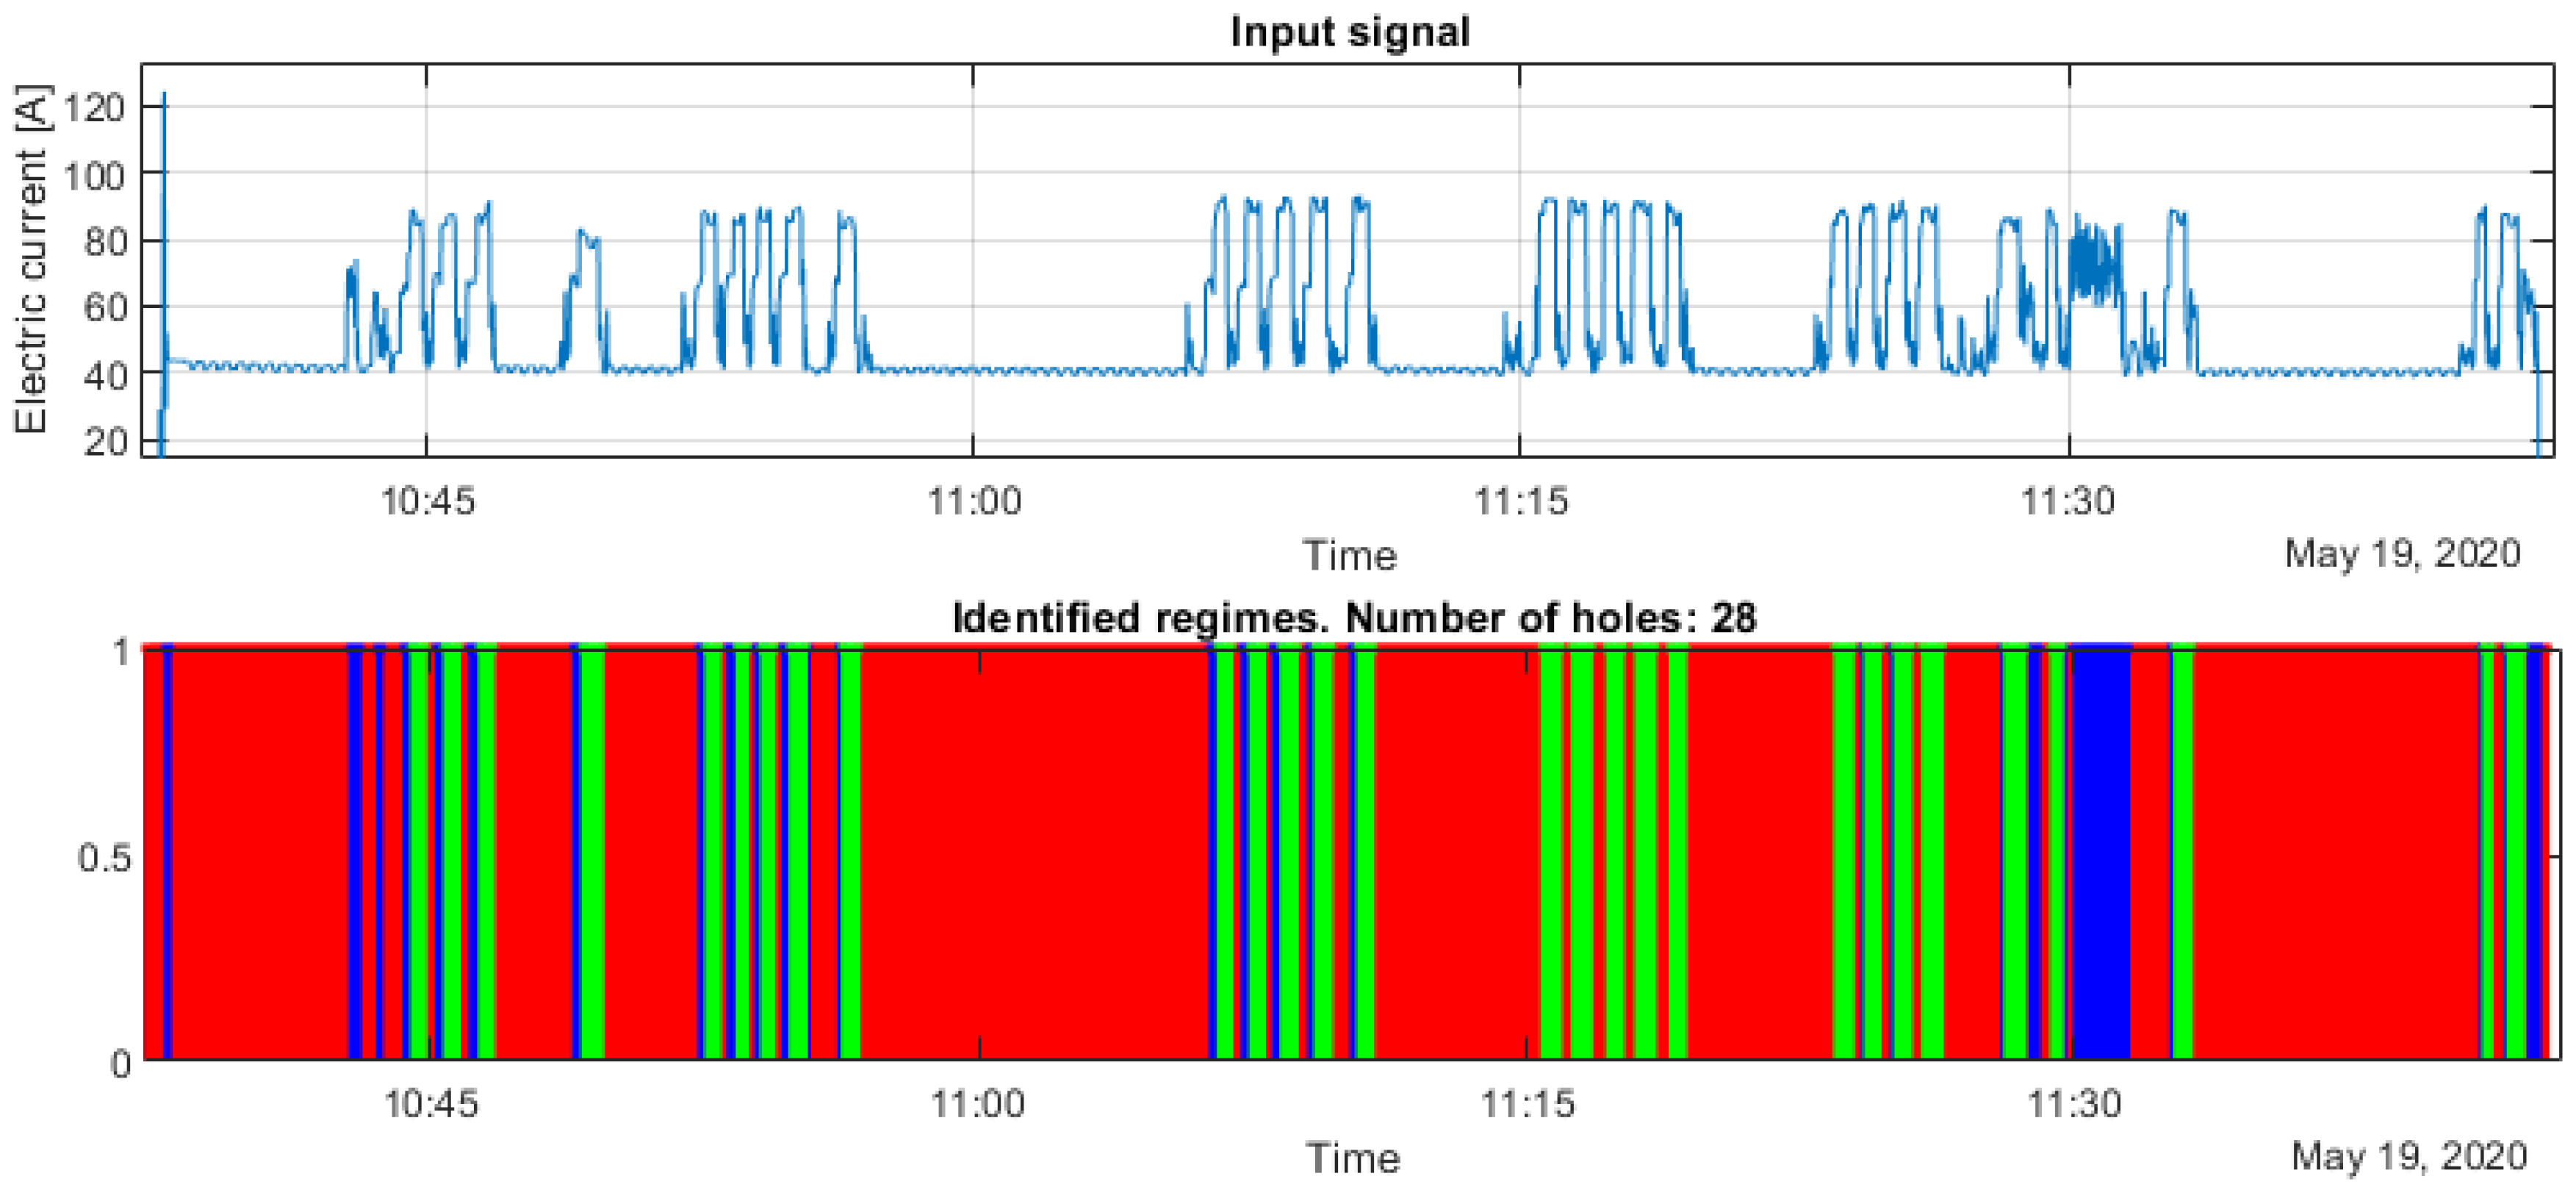
For this analysis, the variable describing the electrical current was selected as an input signal due to its clarity and descriptive structure (see
Figure 7). The main feature under consideration is the difference between levels describing the idle state, pre-boring and proper drilling.
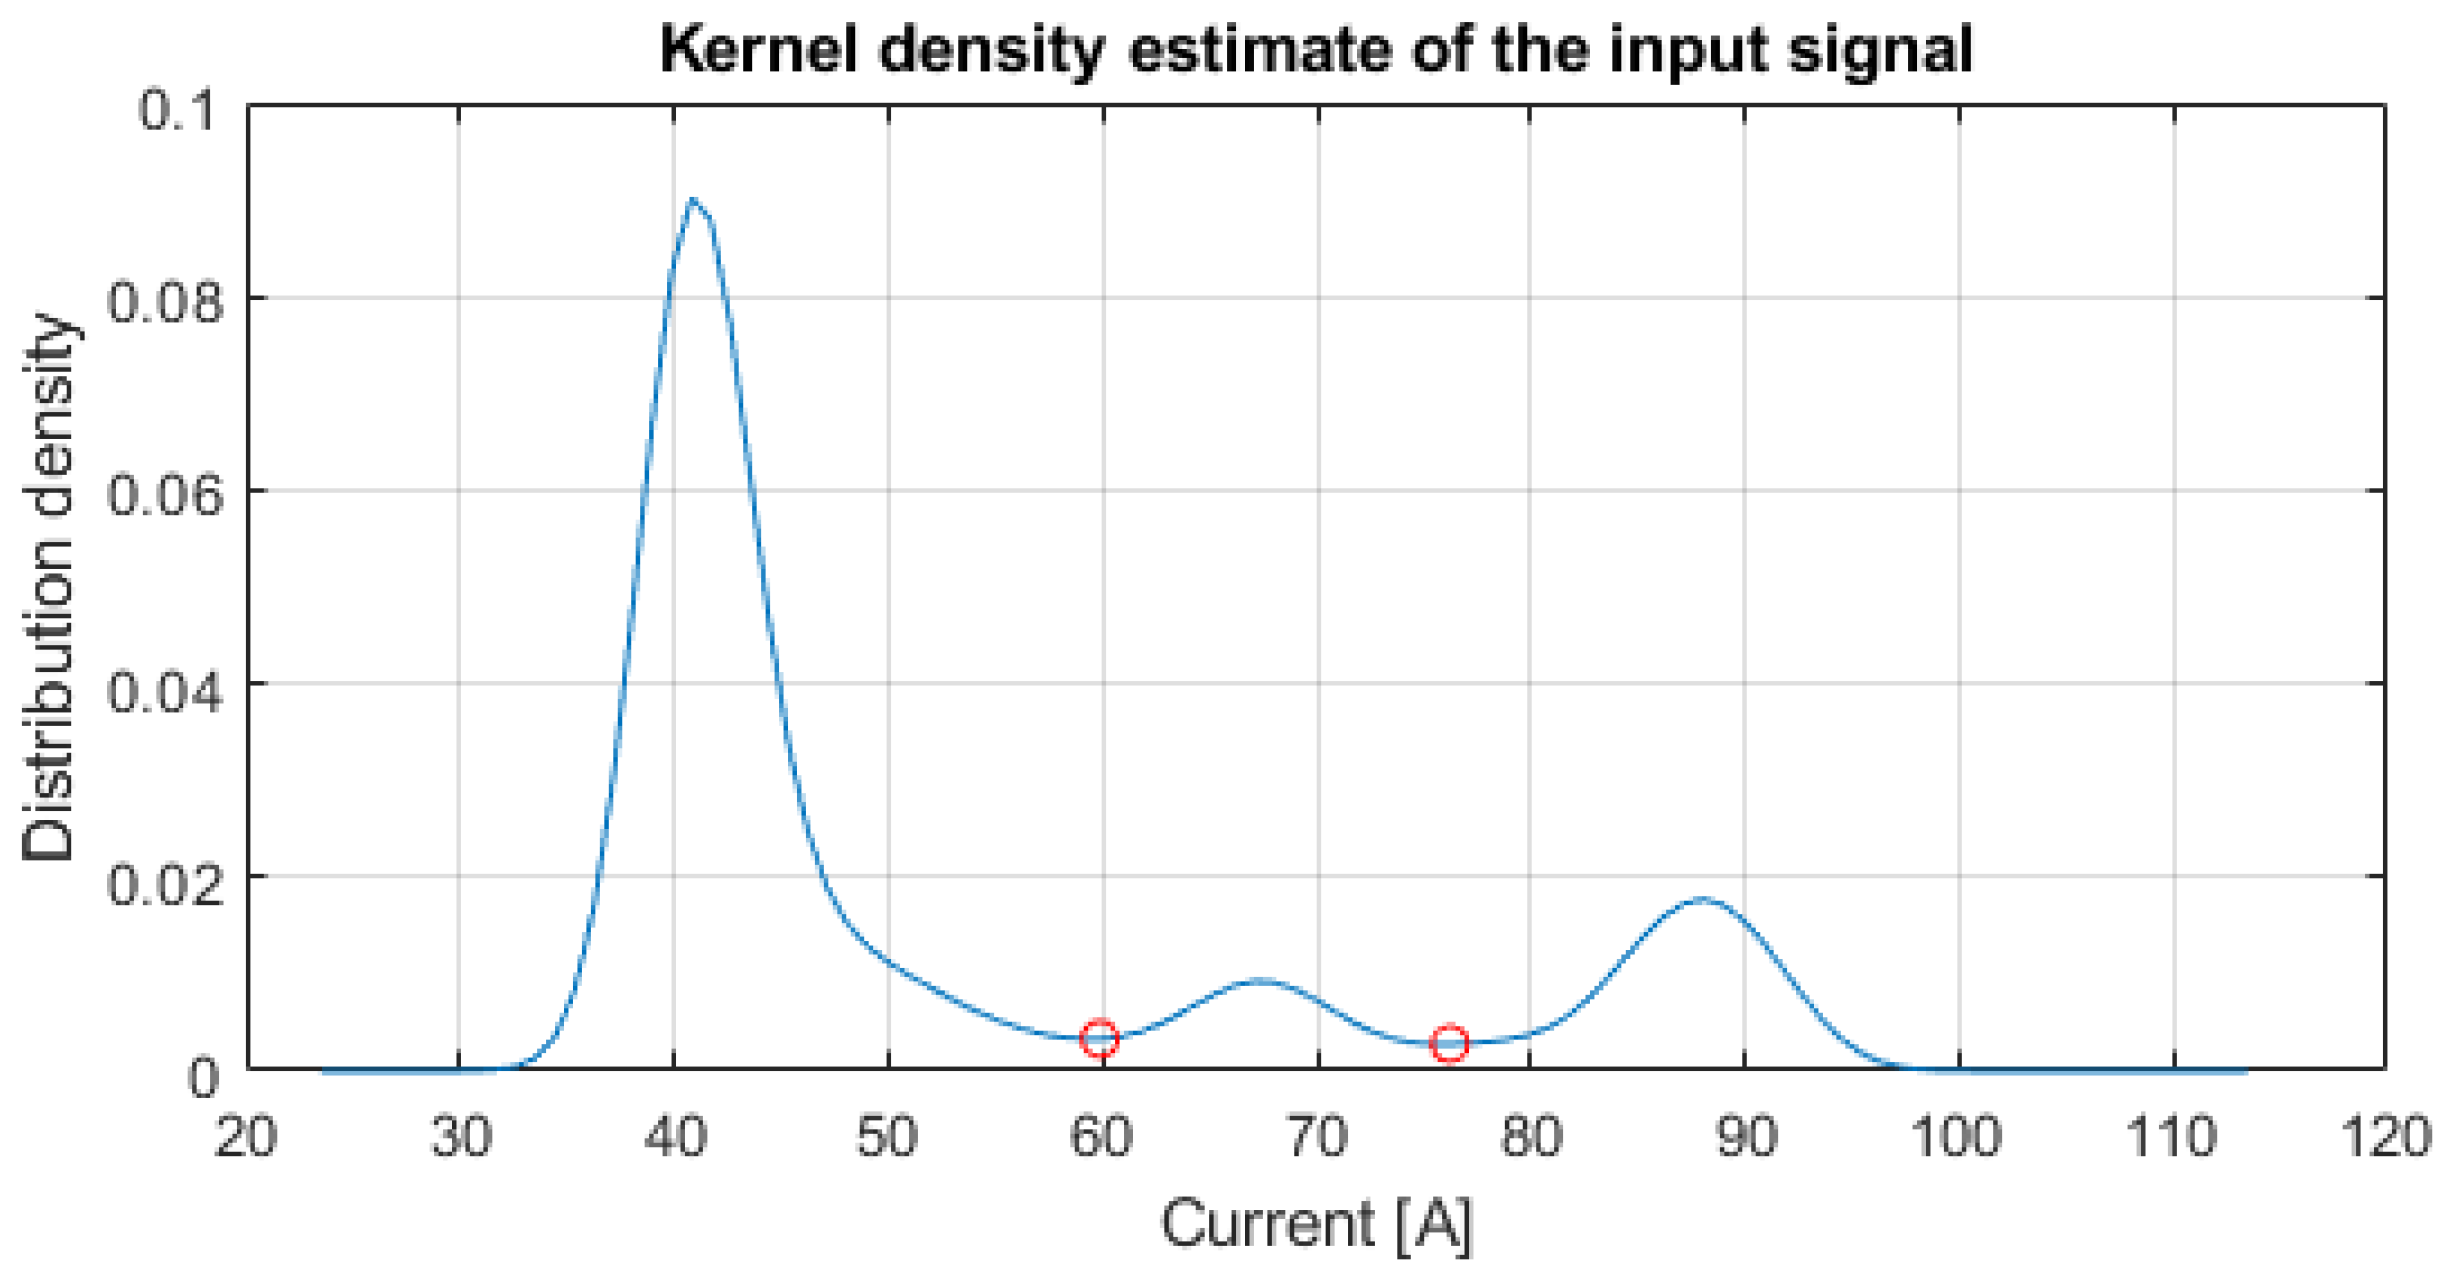
In the first step, the distribution of data is estimated using the algorithm described in
Section 5.2. According to the expectations, three main modes emerge that aggregate information about three states (idle, pre-boring and drilling), and the local minima between those modes indicate the optimal thresholds that will allow the separation of those states (see
Figure 8).
Finally, the signal is segmented according to the discovered thresholds (see
Figure 9). Segments describing each type of activity are denoted with different colors. Separate segments denoting drilling are then counted, which allows the amount of drilled holes to be obtained; in this case, 28.
Additionally, assuming the presence of three states instead of two (one could simply perform segmentation into “drilling”/“no drilling” states) allows the assessment of the quality of the process. Namely, it allows us to detect if a particular drilling action has been performed, including the pre-boring phase. As a result, it was detected that the first 14 holes (drills before the 11:15 time mark) were drilled properly with pre-boring, while the next five holes (drills immediately after the 11:15 time mark) exhibited no detected pre-boring phase, according to the request of the machine operator (i.e., the pre-boring phase was omitted on purpose). The next four holes were drilled with a present but significantly reduced (barely noticeable) pre-boring stage, which may lead to difficulties in detection. The analysis showed that two of those four holes exhibited a pre-boring phase that was significantly shorter than that for holes made properly, and the remaining two holes did not exhibit pre-boring in the results, which was also an expected result. The rest of the activities (at around the 11:30 mark and later to the end of the studied time) were performed randomly by the operator: drills were supposed to be performed properly, improperly and with a longer or shorter drilling duration. From those, five drills were identified as proper but with varying drilling durations (some of them were incomplete, and thus shorter), and one drill showed a reduced feed power.
Based on the obtained segmentation results presented by the authors, in
Table 2, basic statistical parameters of the operational regimes are shown.
6.2. The Proposed Current Measurement Analysis
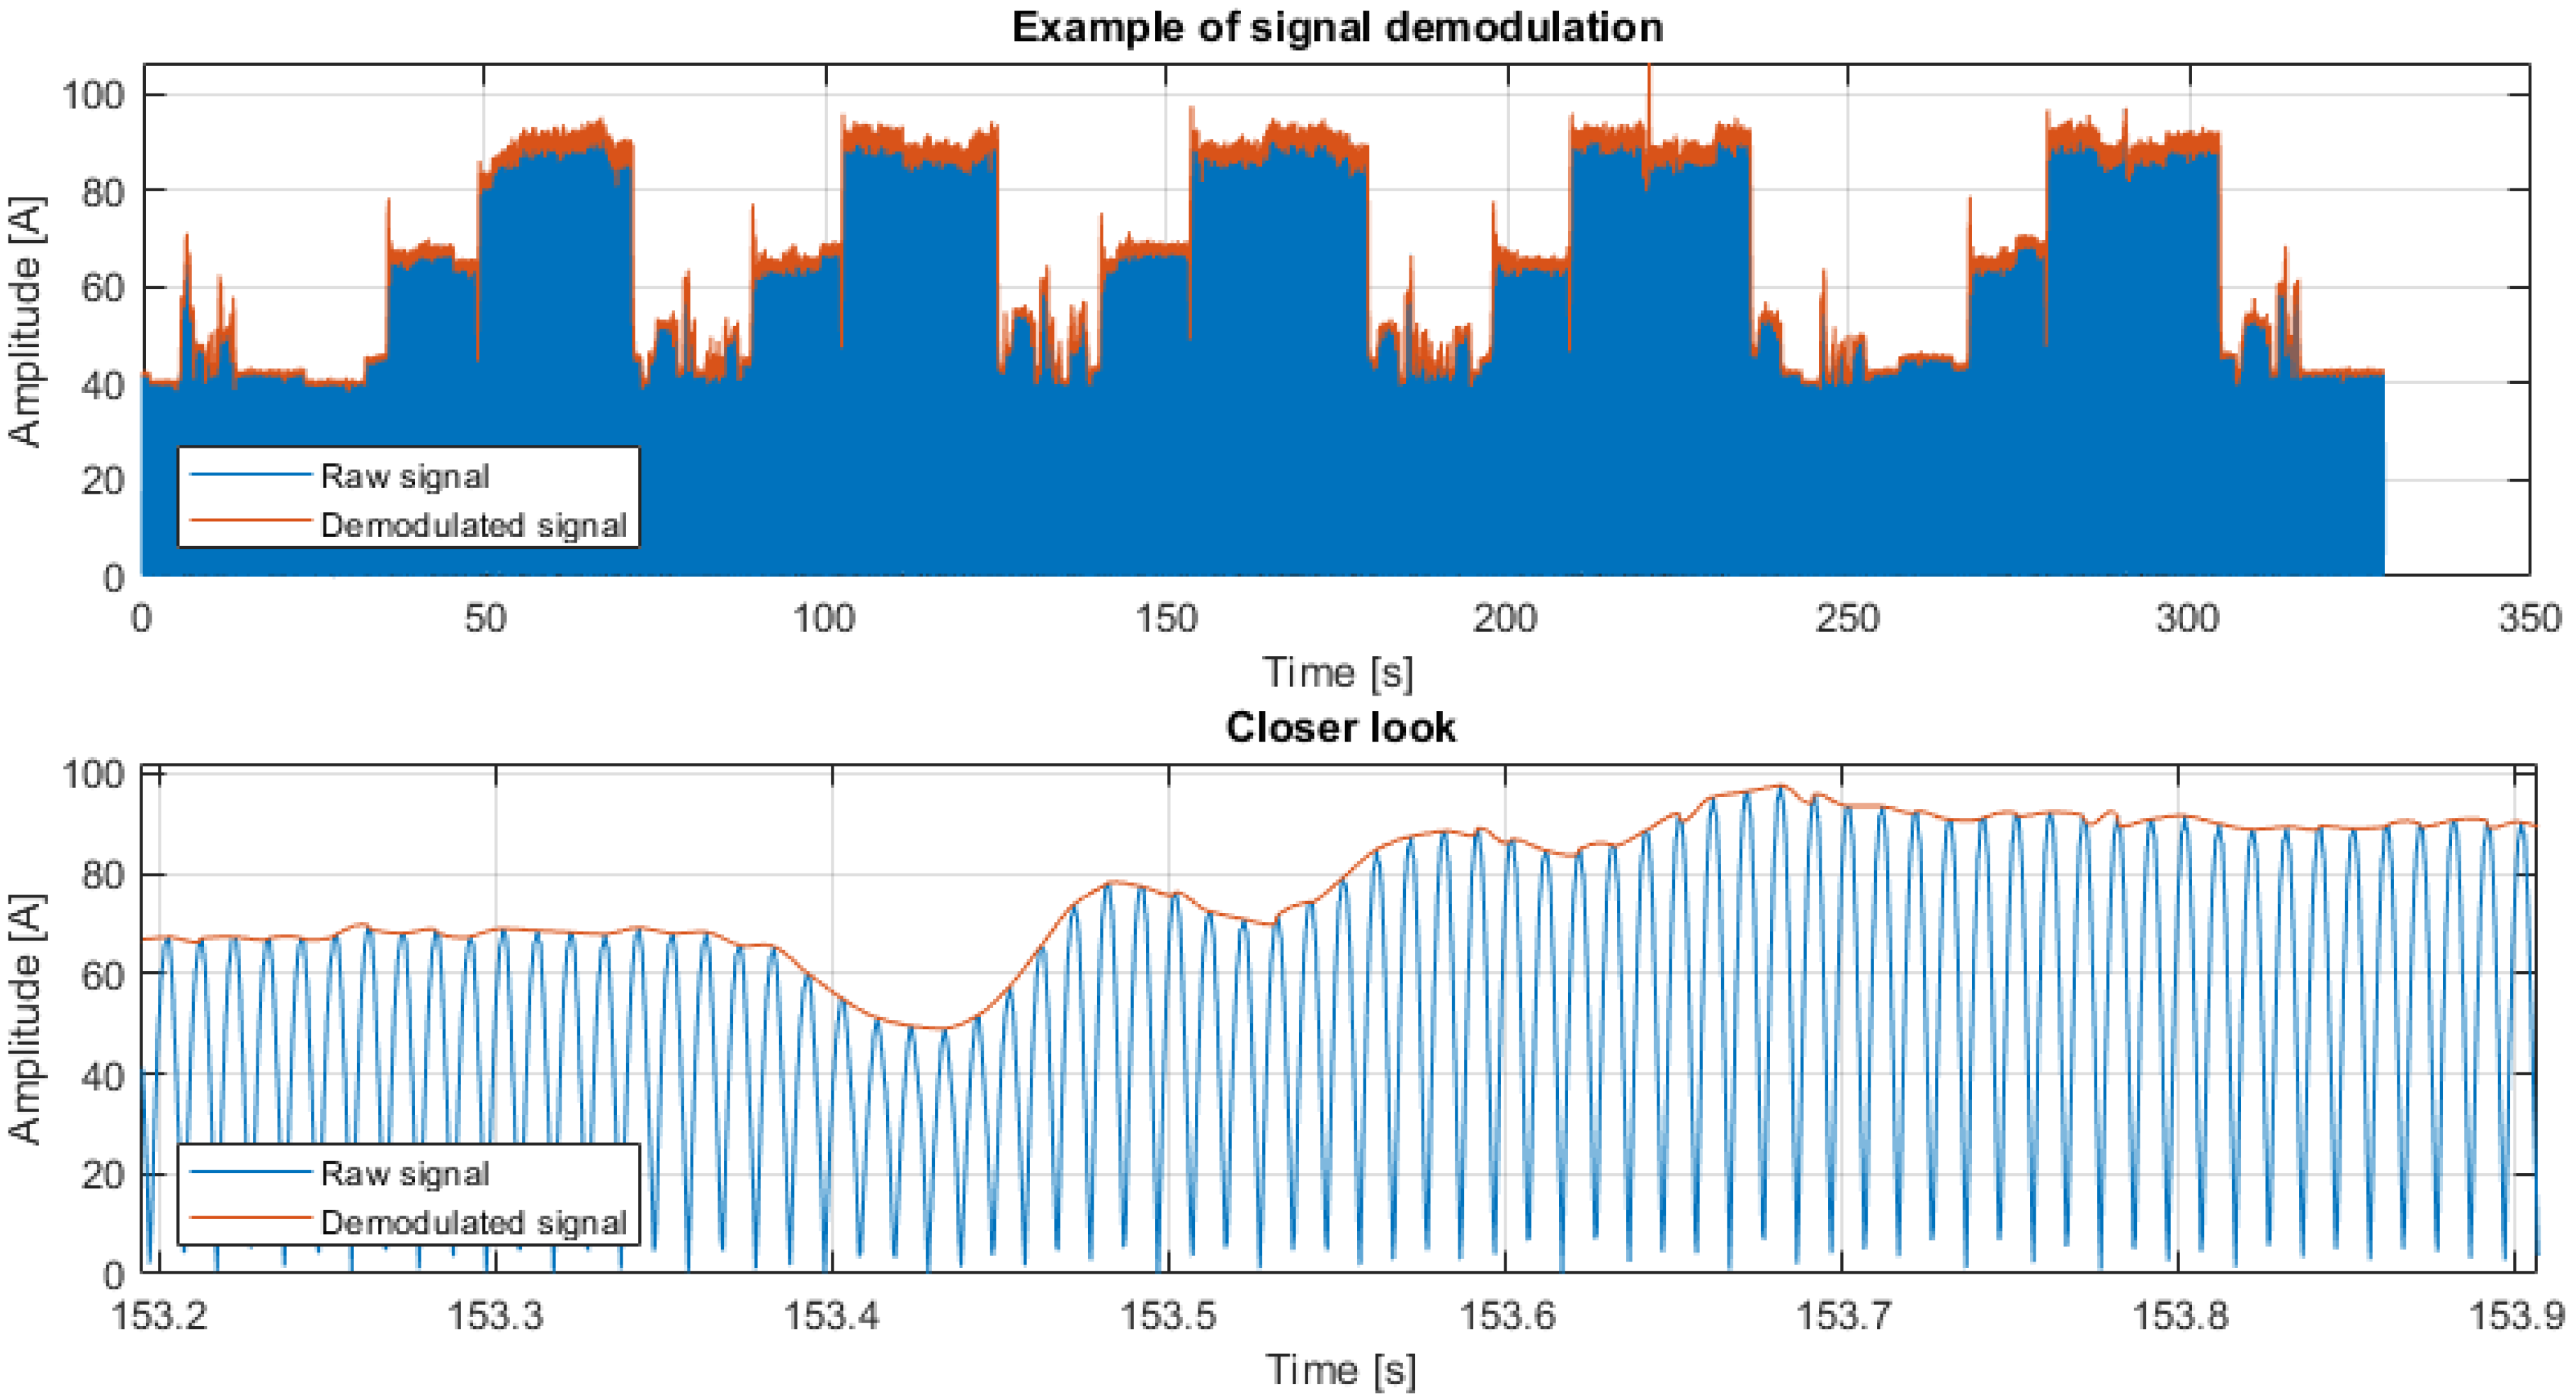
Data obtained from Fluke’s i400s current clamp are presented in
Figure 10 in blue color (after taking the absolute value to improve the temporal resolution of local maxima for demodulation, the raw signal is symmetrical around 0). The raw signal is a sine function that is amplitude-modulated with the actual signal amplitude, with a base (carrier) frequency of 50 Hz. The amplitude, calculated as the instantaneous current consumption and presented in Amperes [A], can be explicitly determined from the root mean square (RMS) signal value, converted directly from mV as a voltage output signal according to the amplification set on the current transformer built into Fluke’s clamp. Data were taken with a 2 kHz frequency to enable further analysis.
After extracting the upper envelope using the Hilbert transform (as in
Section 5.4), the obtained signal (the red plot in
Figure 10) shows the values of the measured current consumption in Amperes. In this form, it is usable for analysis and, more importantly, it perfectly matches the shape and scale of the signal registered by the on-board system (see the
Section 7.1). Due to this fact, it is possible to use those signals for cross-validation, and they can be analyzed using the same methods if desired. This is also the reason why the authors decided to limit the data analysis part of the current-related data to the machine-originated signals to avoid showing identical results twice.
6.3. Process Monitoring Based on Acoustic Data
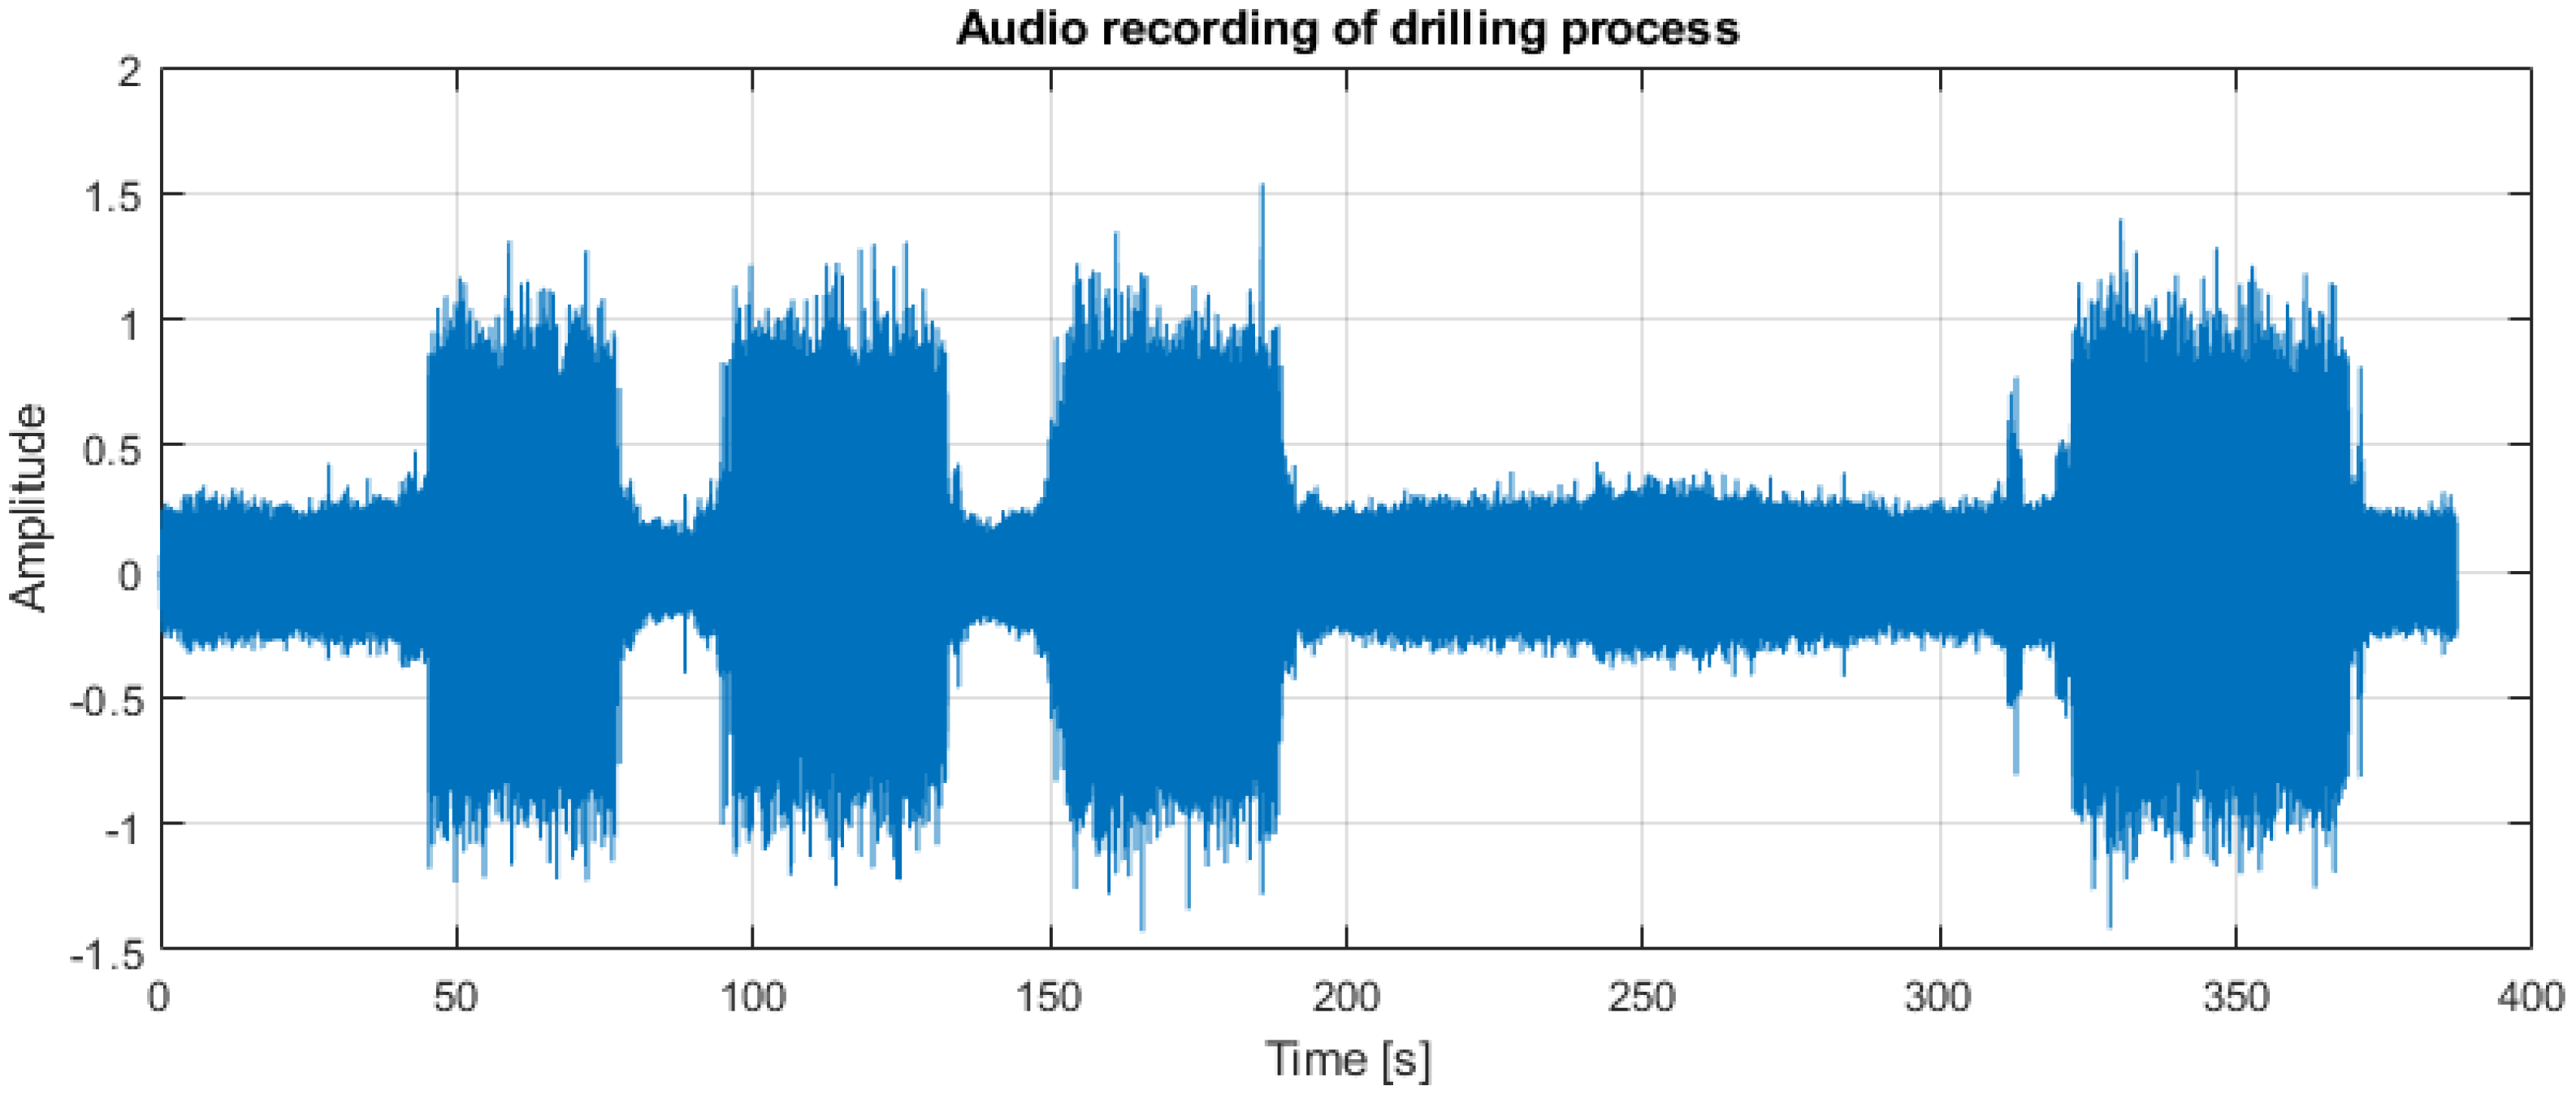
In this example, acoustic data extracted from the ordinary video recording are analyzed (see
Figure 11). The considered segment corresponds to the first four drilled holes from the previous example. During the experiment, video segments were recorded in shorter parts to avoid the necessity of working with large video files. Audio recordings were registered continuously because significantly less memory space per unit time was needed for their storage. As one can see, each individual drill is clearly visible. This signal could be processed very straightforwardly using the signal variance, which changed over time and was analyzed with the goal of finding segments of increased variance. However, considering that audio recordings can capture anything occurring in the neighborhood of the machine, the segments of increased acoustic energy could be caused by other sources. Thus, the authors decided to take advantage of the property visualized in
Figure 12.
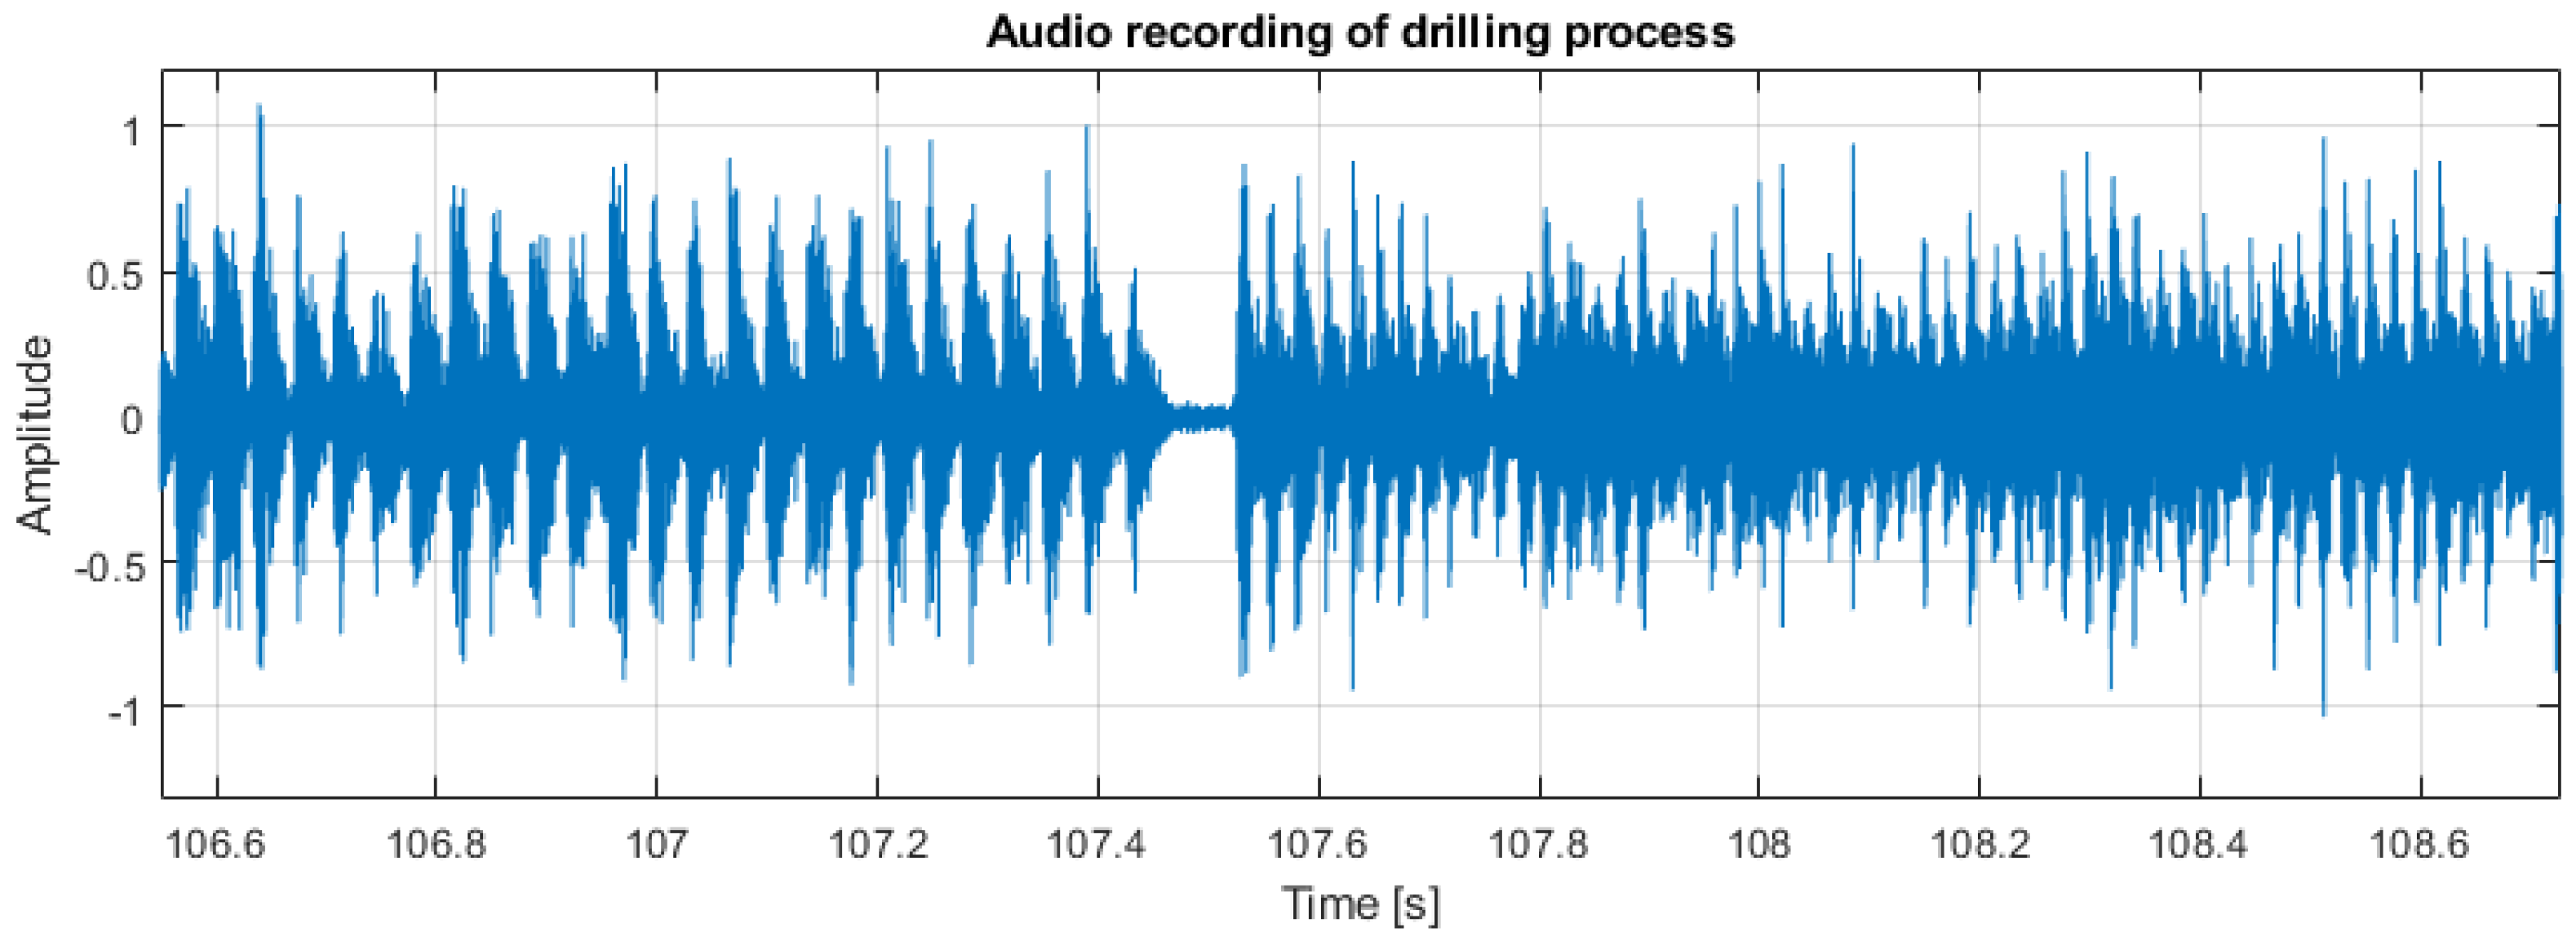
As one can see, the frequency of drill percussion during pre-boring differs from that experienced during drilling. Since those impacts can be understood as an amplitude modulation, the envelope spectrum can reveal the spectral structure of this modulation and give access to the fundamental frequency of percussion in a given moment.
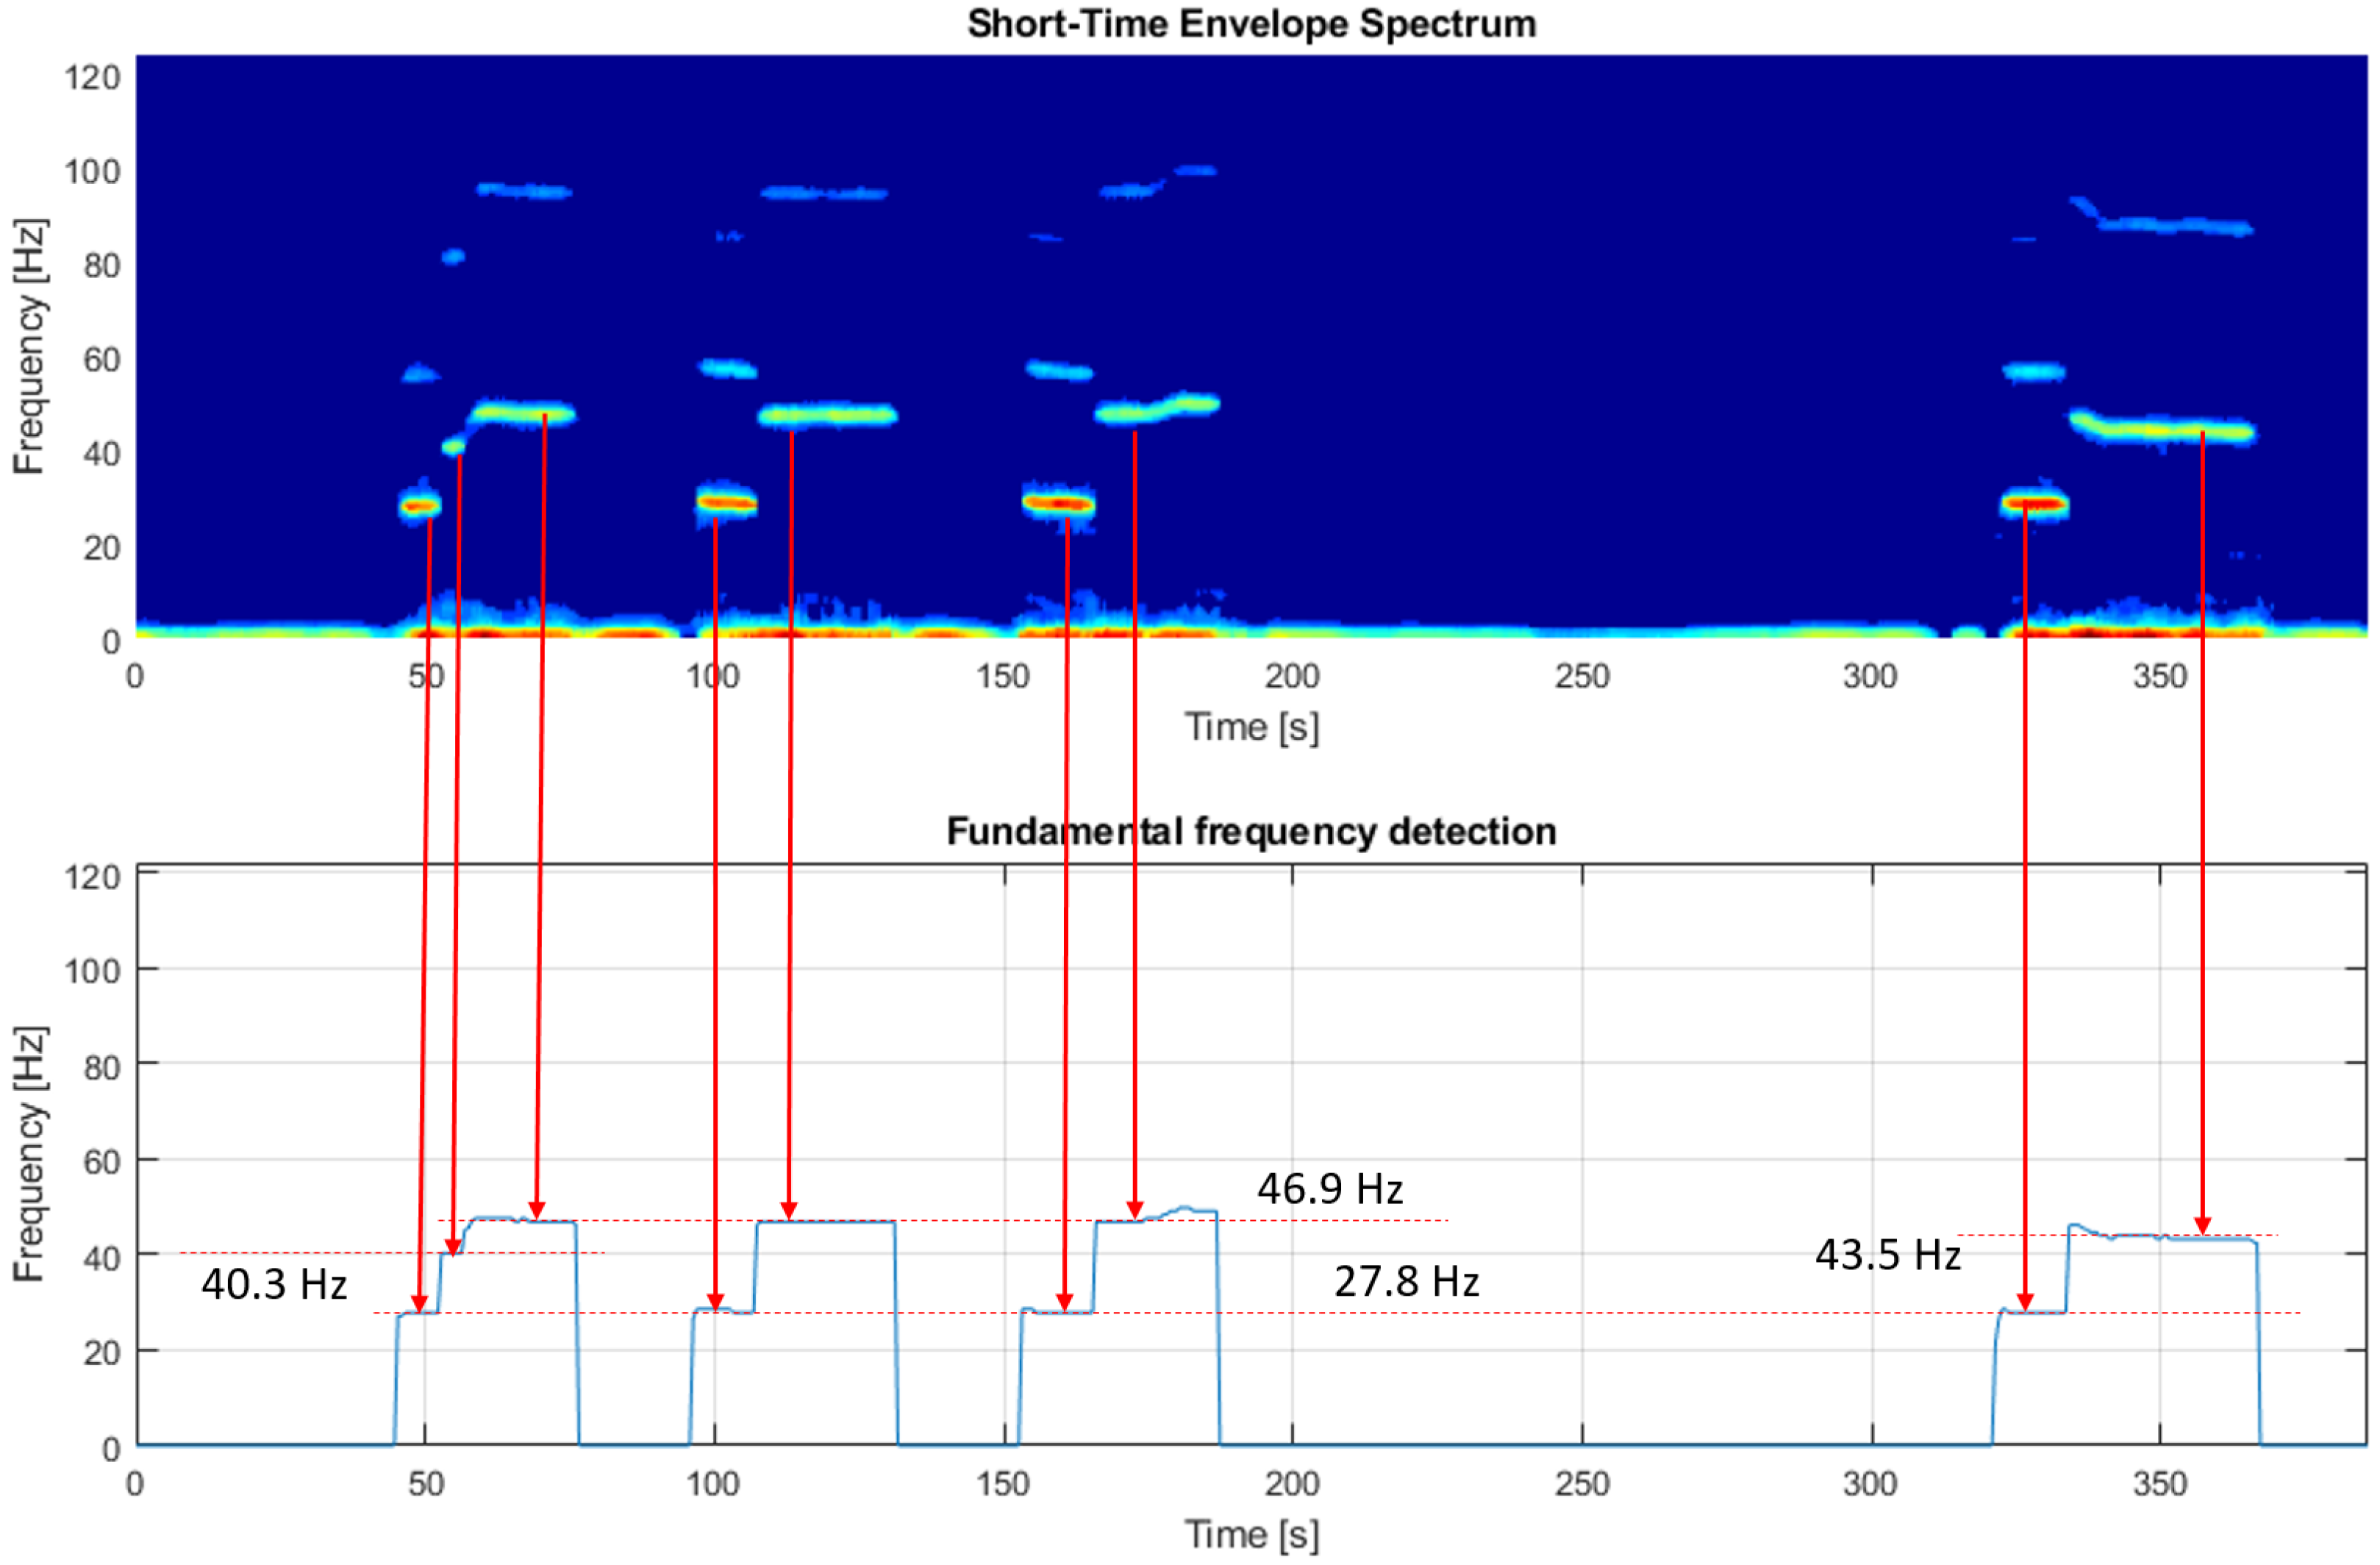
To achieve this goal, a short-time envelope spectrum was constructed for this signal (see
Figure 13 top panel), as described in
Section 5.4. As can be seen, frequencies that are responsible for the modulations are presented and laid out over time. Sometimes, consecutive harmonic frequencies are also visible; however, for this methodology, we were interested only in the fundamental frequencies. Based on this representation, it is possible to detect fundamental frequencies over time by finding the first significantly energetic component above the high-energy mode centered around zero. This procedure is repeated for each timestamp, and the result is presented in the bottom panel of
Figure 13.
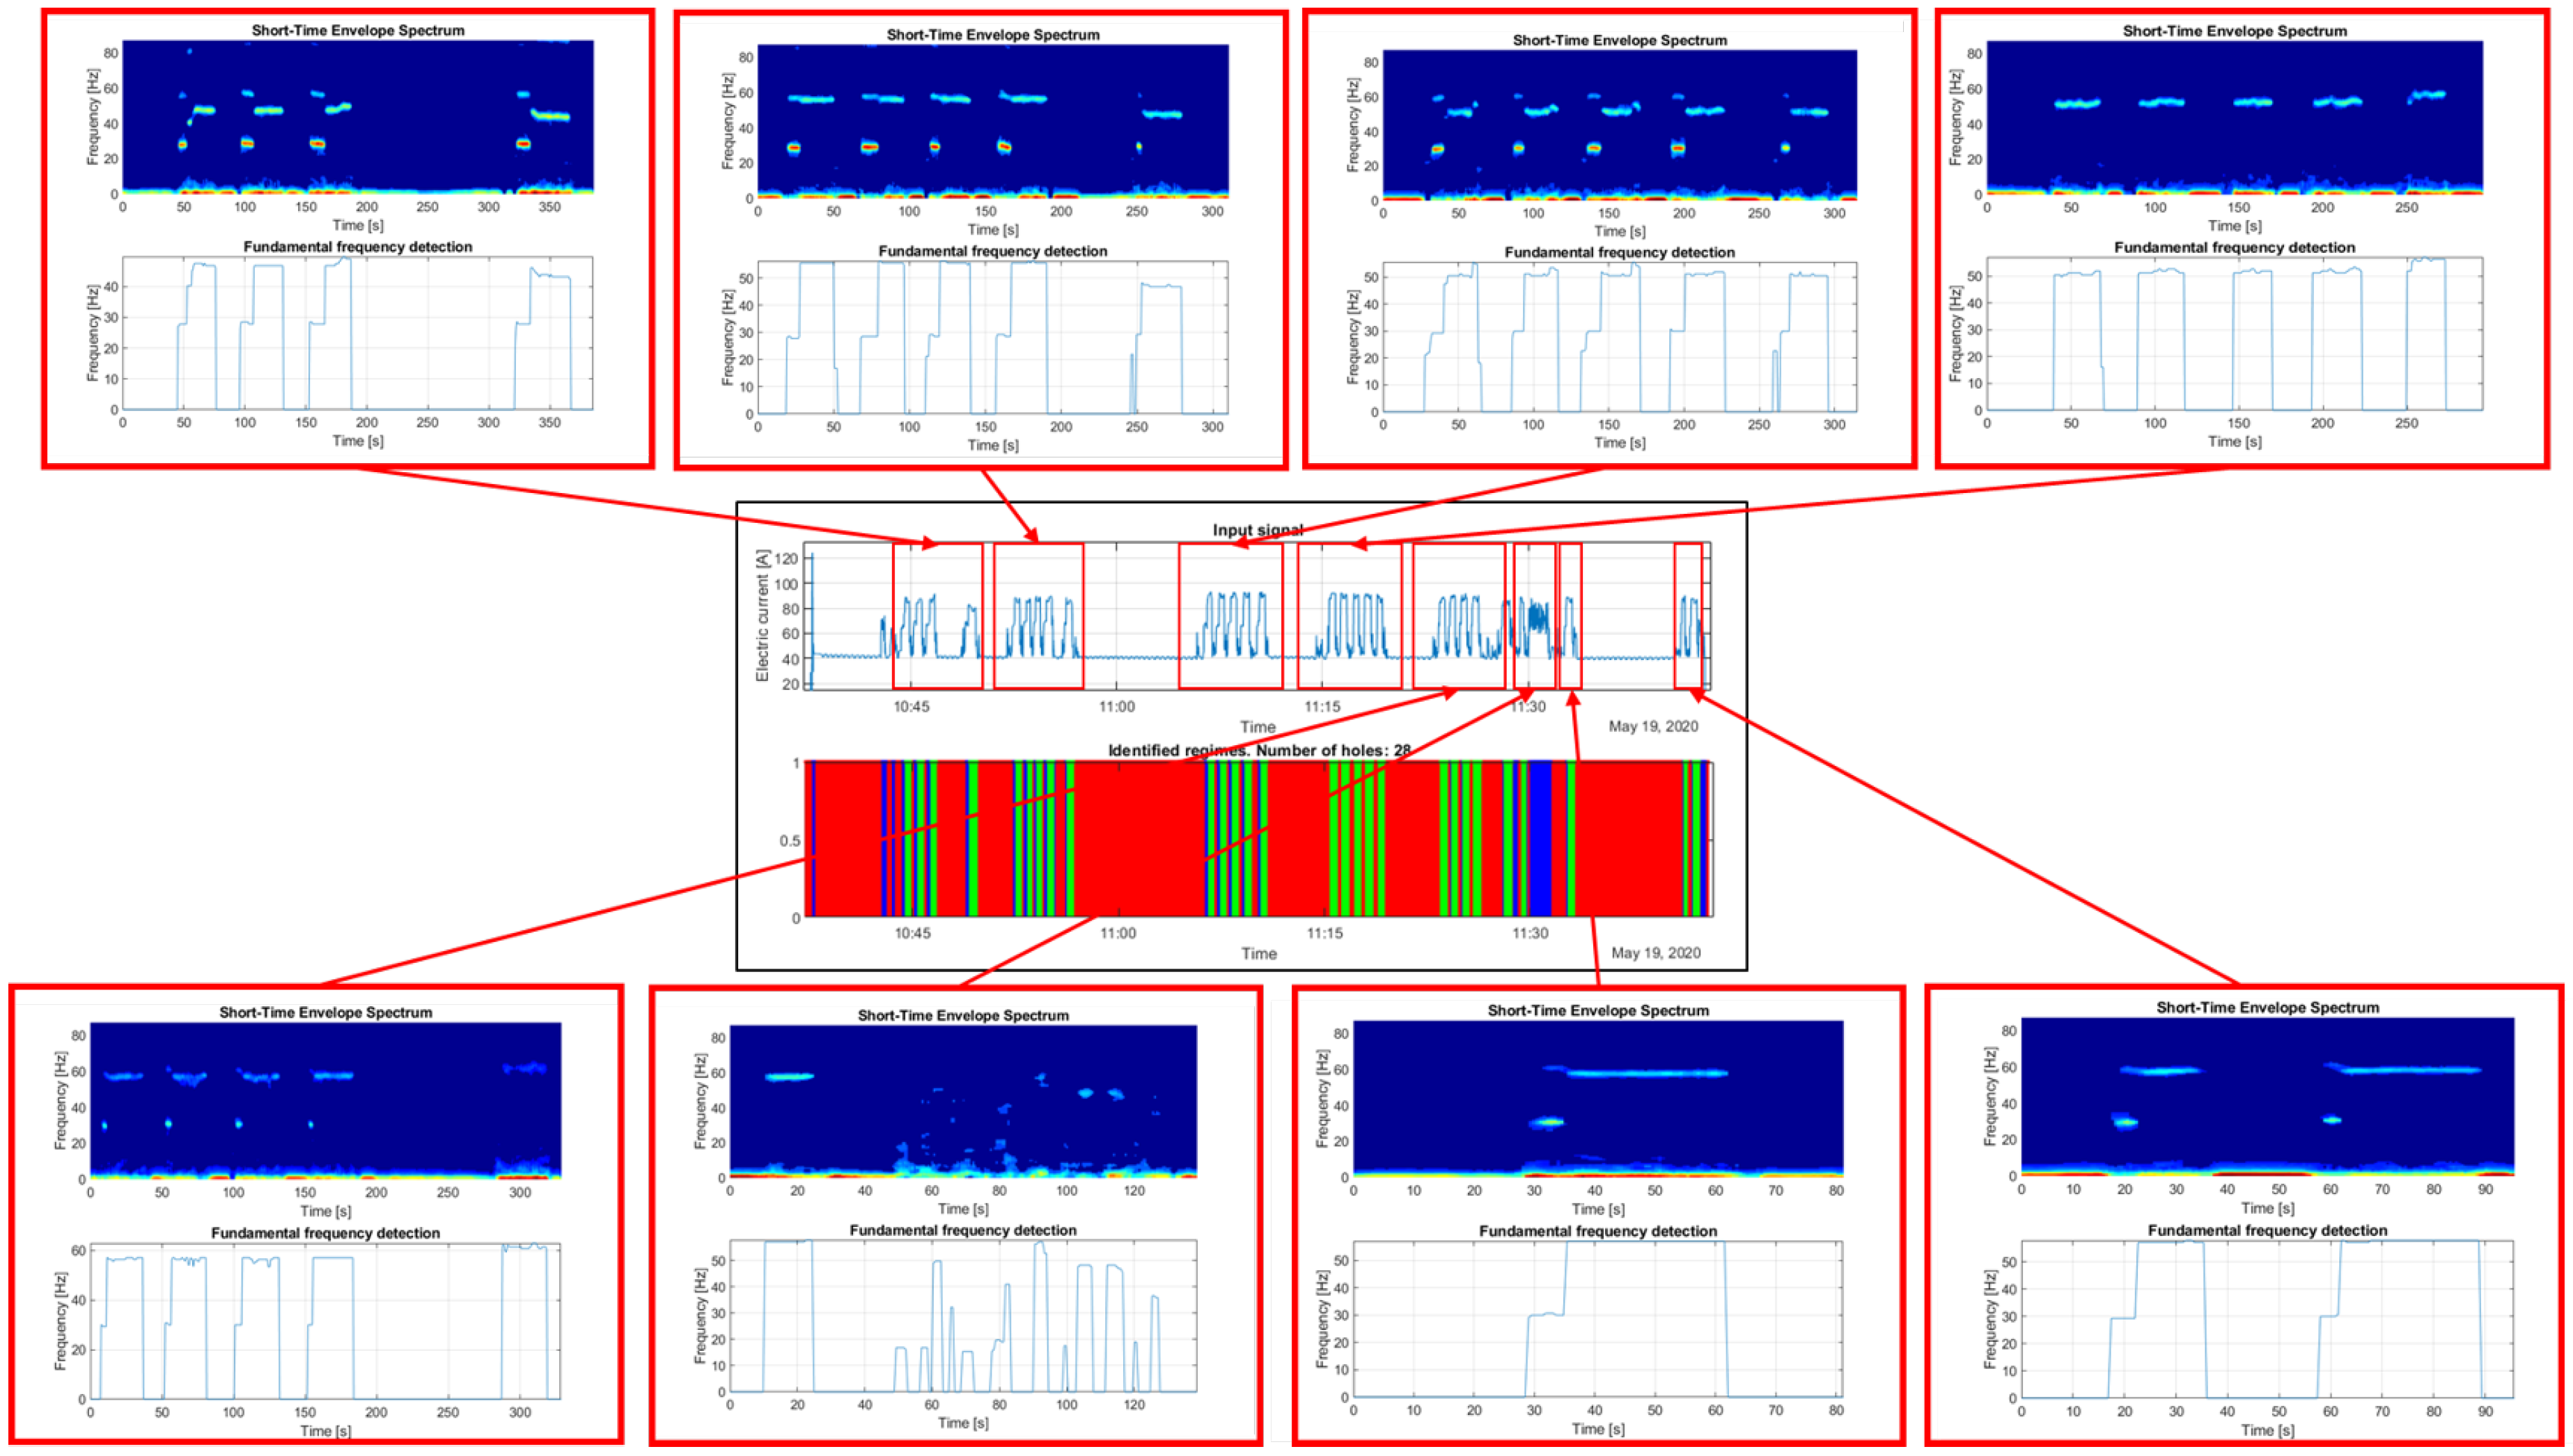
This result describes the first four holes drilled during the experiment.
Figure 14 presents the results obtained for the remaining parts with an indication of their location in time with respect to the continuous data obtained from the machine. The results are equally successful and, if desired, can be merged into one signal for further analysis. However, depending on the details of the solution deployed based on such measurements, it is possible that one can expect continuous audio measurement in the future.
It is important to note three outcomes regarding this result. Firstly, this approach allows the verification of the proper operation of a percussion control system by assessing its frequency of operation during various activities. Secondly, the structure of the obtained output signal is similar to the structure of the electric current signal from the previous example; thus, this result can be further processed in the same way and provides a validation-related value in case there is any problem with the system registering electric parameters. Finally, this example shows that data acquisition for similar analysis can be performed very easily if it is desired to quickly assess the functioning of any drilling machine in operation by simply going near the machine and recording a short piece of audio data.
7. Validation
The monitoring system installed on the machine provides high-quality data that allows the precise analysis of the drilling process in terms of the number of holes drilled, the duration of a single cycle, etc. In this work, it was used as a reference system to validate our monitoring devices. The reason for preparing a new monitoring system is simple—the monitoring system proposed by the manufacturer is optional when purchasing the machine, and to the authors’ best knowledge, there is no universal system for such a purpose that could be used in the case of the failure of the previous device. Moreover, in older machines, there are no monitoring systems for the drilling process.
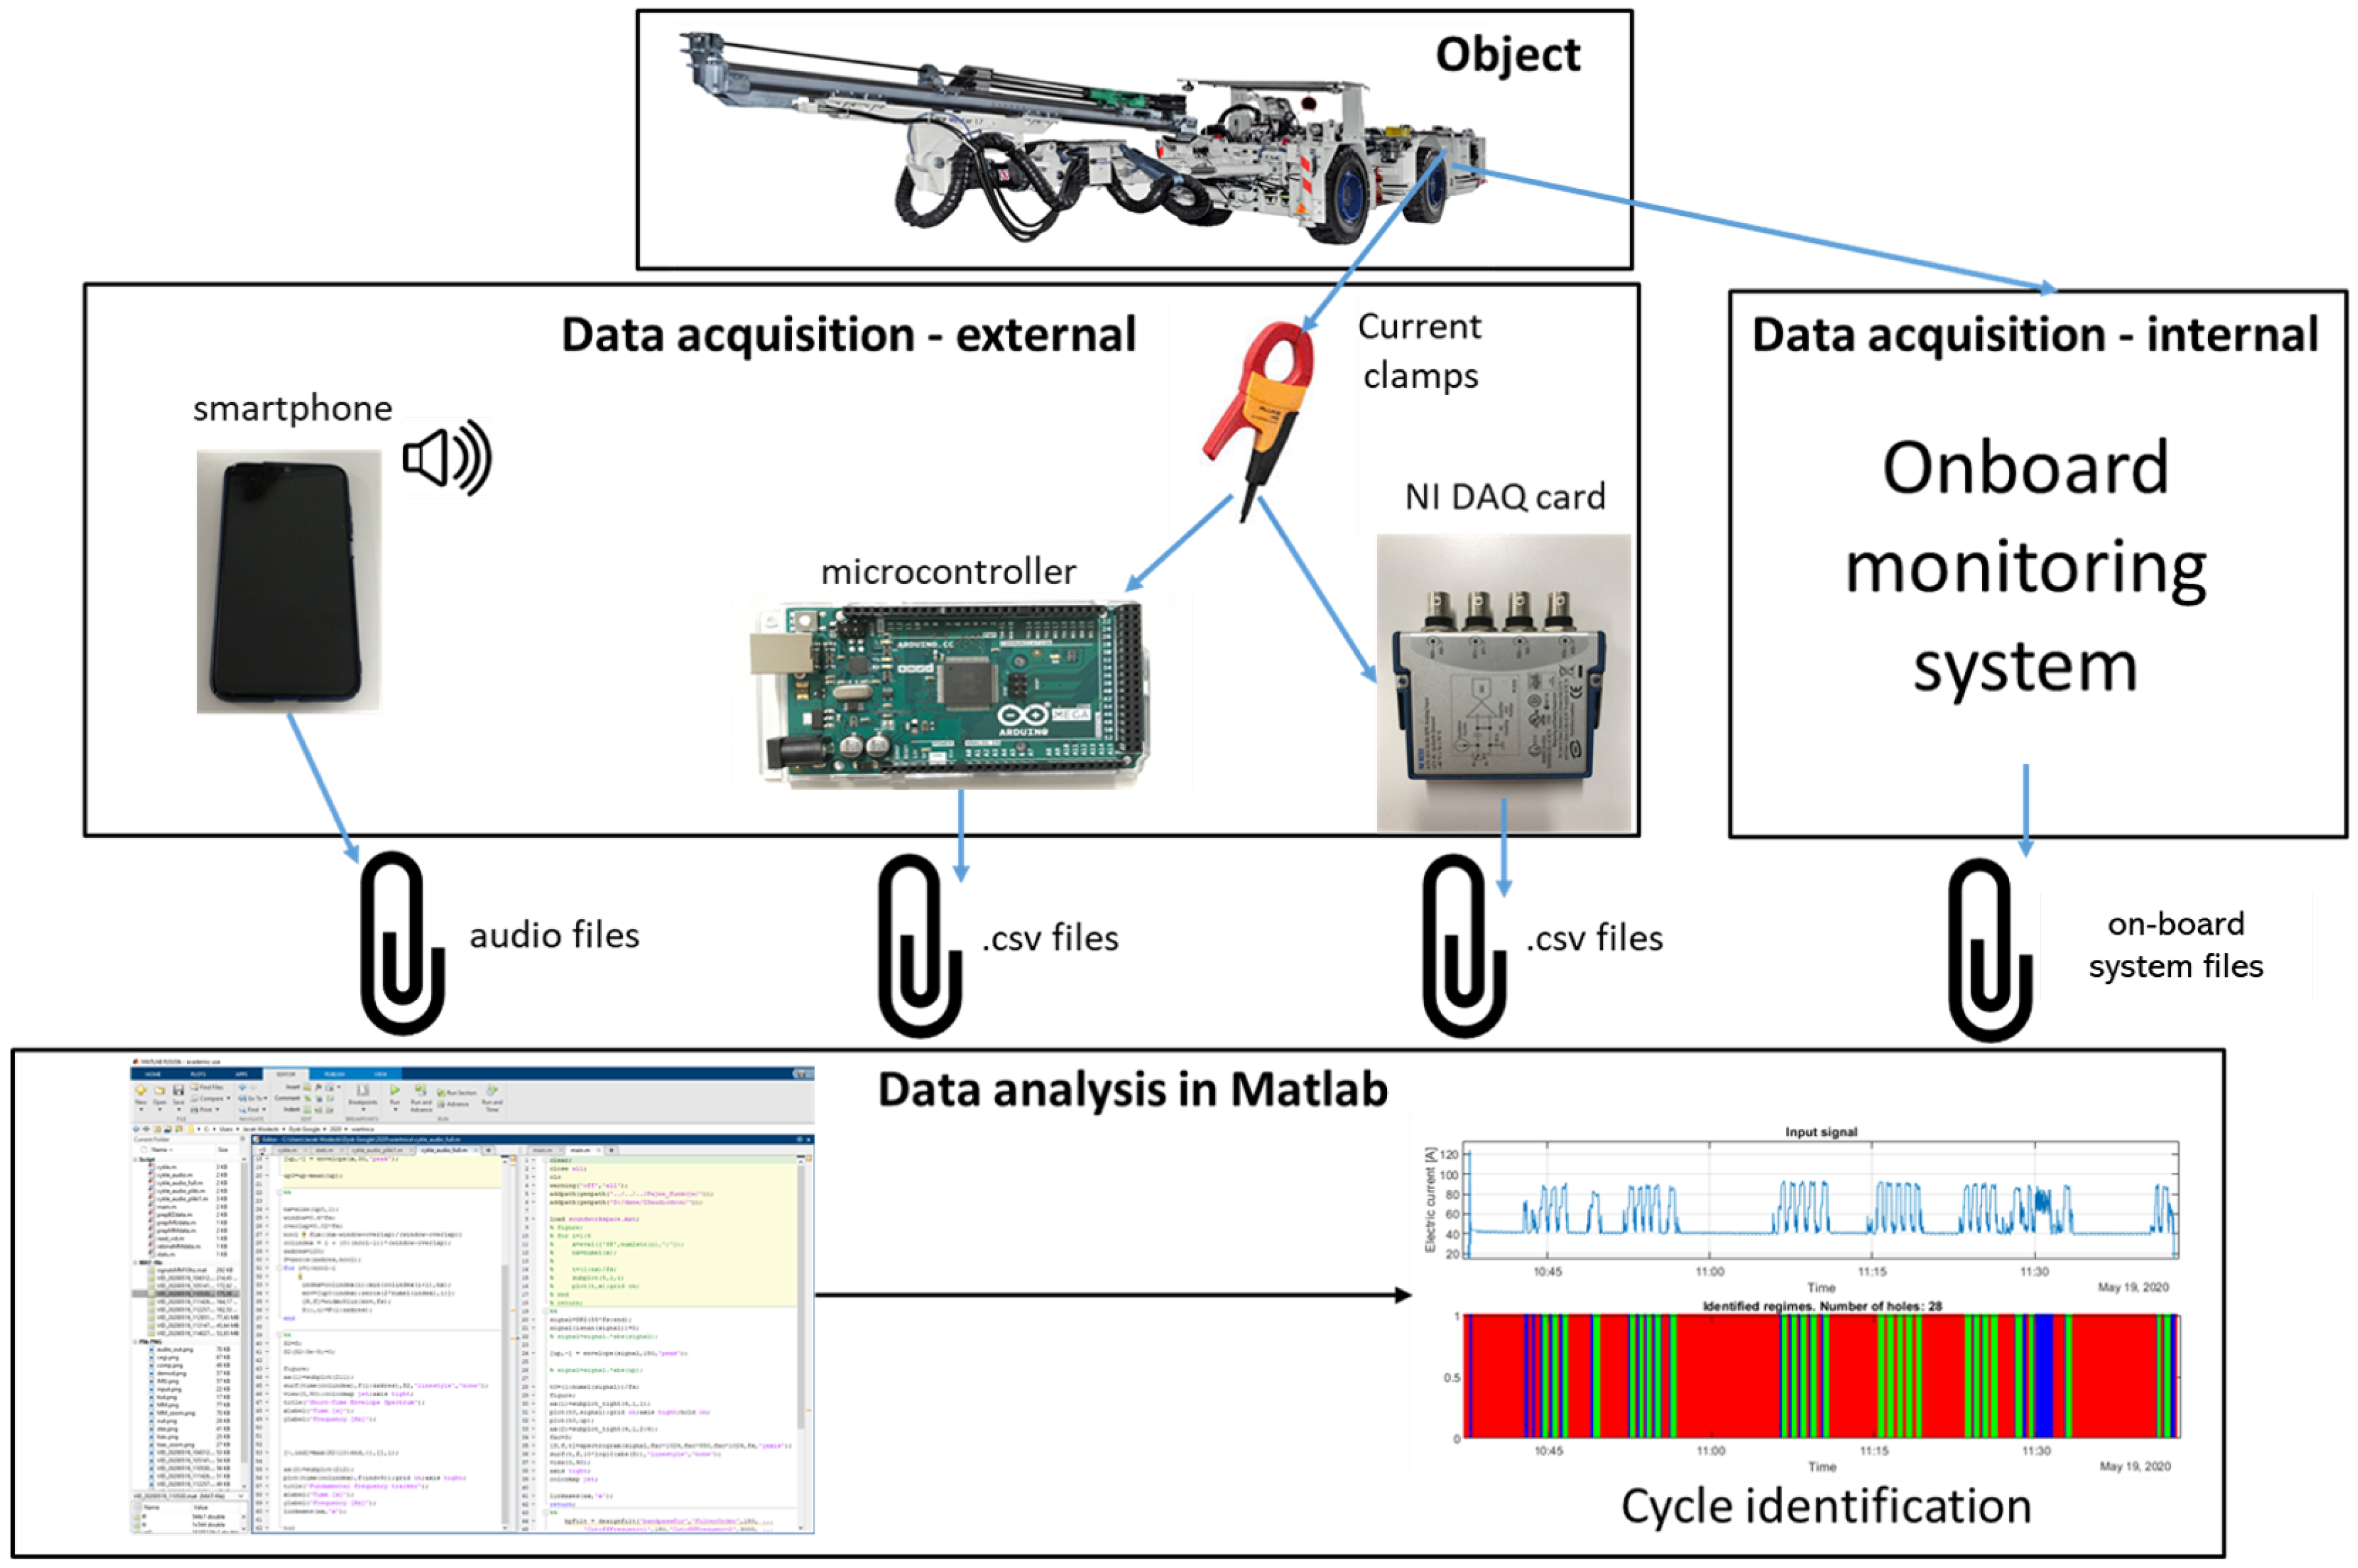
The proposed system is based on electric current consumption analysis. It provides basic hardware as well as software to calculate the required parameters. The first version of the system is based on a standard Data Acquisition Card from National Instrument, while the second version is based on an Arduino micro-controller with other electronic components to support local data recording on the SD card of the processed signal (amplified and digitized). A schematic representation of different data-acquisition methods that can be used to assess the drilling rig’s operation can be found in
Figure 15. Each monitoring system provides raw data in .csv format, which is then processed using the Matlab environment (signal processing toolbox). We used Matlab ver. R2020b and personal computers with an average office-class computational speed: an Intel I7 processor operating at 4 GHz and 8 GB of memory.
7.1. Audio–Video Recording
Both cases showed excellent technical parameters and allowed us to measure the current signal with a higher sampling frequency. Increasing the sampling frequency provides increased opportunities for transient events analysis in the signal. Current consumption requires special devices and integration with the electric circuits in the machine. It could be an interesting option to use acoustic signals for the monitoring of the drilling process. It should be mentioned that the diesel engine is switched off during drilling; the process is driven by an electric motor, meaning that background noise should be reduced.
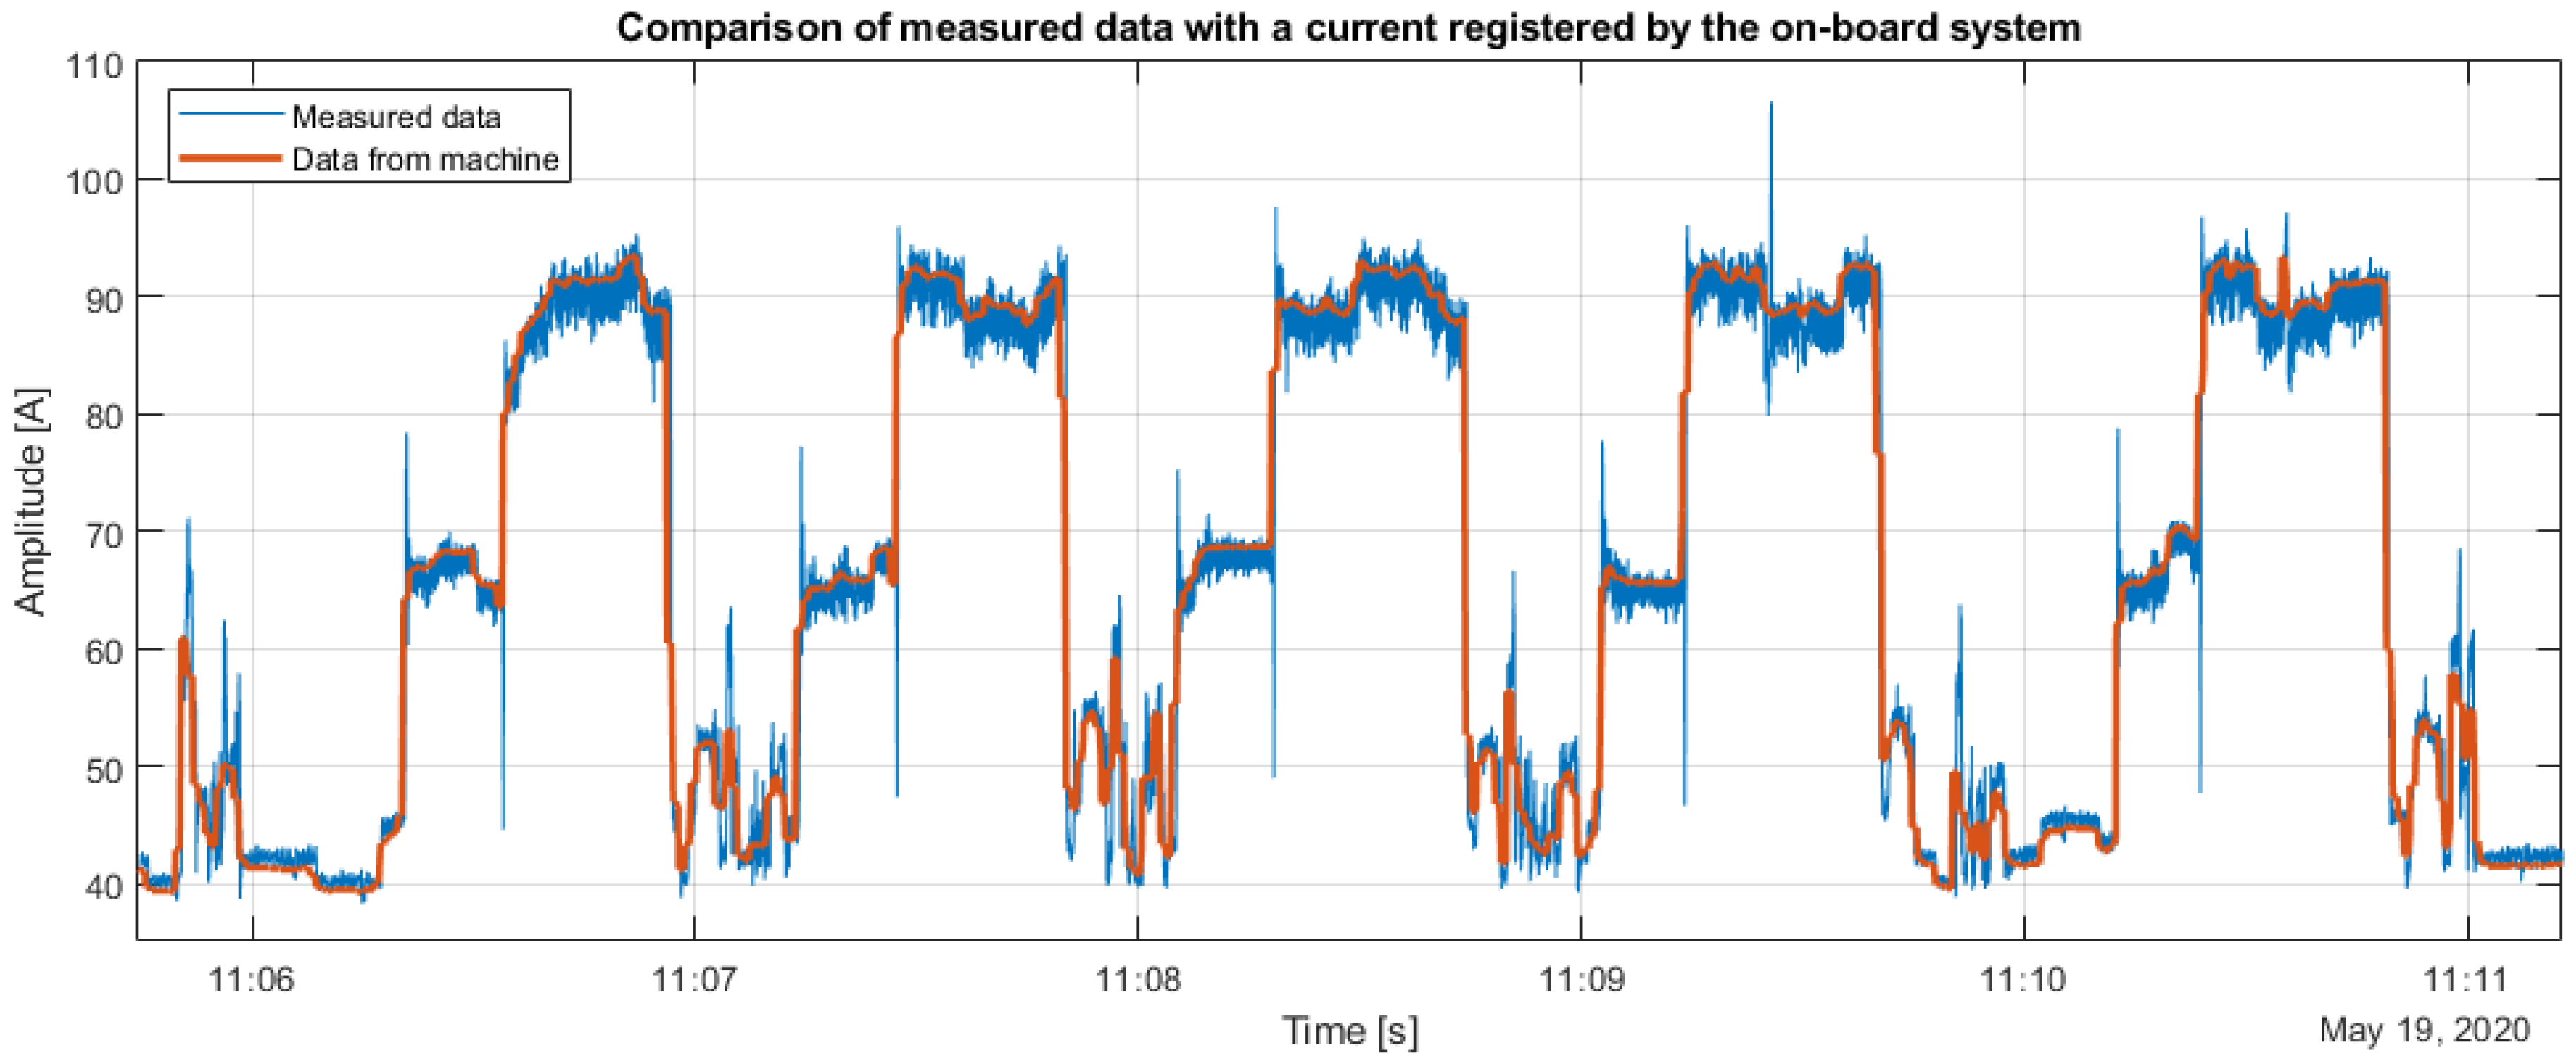
In this section, as a reference, the signal from the on-board monitoring system was used. As presented in
Figure 16, the signal acquired by the proposed system (blue curve) was very similar to the reference signal. As the sampling frequency was higher, more noise (that could be easily removed) could be observed, as well as some extra information related to transient events—low-frequency sampling was not able to capture this. The difference between the on-board and the proposed systems is related to the technologies used and sampling frequency.
Information extracted from acoustic signals has been discussed in detail in the previous section. It can be seen in
Figure 14 that, thanks to instantaneous frequency monitoring, it was possible to identify the pre-drilling and actual drilling phase. We can therefore conclude that both electric and acoustic measurements are very useful for drilling monitoring.
8. Discussion and Conclusions
In this paper, a data analysis methodology was proposed for three different data streams.
Case 1:Tthe data originating from the on-board monitoring system. The data, namely the current consumption, are a function of the load applied to the drilling tool. As the idle mode current is low, pre-drilling is associated with a medium load (60–70 A) and actual drilling means a heavily loaded system, so significant (>80 A) current consumption is visible. The signal is relatively clear, and so one can distinguish key elements of the cycle using simple statistical pattern recognition tools (threshold estimation based on probability density function). The statistical variability of real signal levels over the phases of drilling cycles is not very wide (up to ±5%); thus, the proposed method is robust and does not need subsequent tuning to account for changes of bits’ parameters or rock properties within a certain region of mining.
Case 2: The data originating from the proposed electrical current monitoring system. These data should be pre-processed to a similar format as data from the on-board system; then, the processing is performed according to the procedure in case 1. Besides, the higher sampling frequency of a new monitoring system allows the development of algorithms for specific feature detection in the drilling process, which are currently under development.
Case 3: The acoustic signals from the microphones. These data require more advanced techniques as they are processed using the Hilbert-based envelope analyzed in the time–frequency domain in order to extract the instantaneous frequency. It appears that idle mode, pre-drilling and actual drilling have completely different acoustic signatures in terms of sound levels but also in terms of their frequency structure. Thus, instantaneous frequency (IF) may be used as a feature for drilling monitoring. Using the IF as a function of time, one may simplify the situation to case 1 and apply the segmentation procedure.
Finally, all three approaches were compared and a very good convergence of results was shown. A holistic solution was proposed that covers the data acquisition system (electric current measurement and acoustic signal acquisition) and data processing algorithms for the extraction of information about cycles related to drilling. The data acquisition system is relatively cheap and may be easily composed of accessible components (induction clamp, microphone and an Arduino microcontroller), but it requires low-level programming experience and knowledge related with embedded electronics design. The second version is even simpler and is based on a simple sound recorder—a standard smartphone was used to capture the video and sound.
Future work will focus on large-scale testing in an underground mine to estimate the influence of external noise and repetitive reverberations in the confined space of narrow tunnels.

 ,
, 


