Article

Modelling End-User Behavior and Behavioral Change in Smart Grids. An Application of the Model of Frame Selection

Technology Studies Group, Faculty of Social Sciences, TU Dortmund University, 44227 Dortmund, Germany
*
Author to whom correspondence should be addressed.
Energies 2020, 13(24), 6674; https://doi.org/10.3390/en13246674
Submission received: 30 September 2020 / Revised: 5 December 2020 / Accepted: 14 December 2020 / Published: 17 December 2020
(This article belongs to the Special Issue Agent-Based Modeling of Socioeconomic Challenges of Energy Transition)

Abstract

:
This paper presents an agent-based model (ABM) for residential end-users, which is part of a larger, interdisciplinary co-simulation framework that helps to investigate the performance of future power distribution grids (i.e., smart grid scenarios). Different modes of governance (strong, soft and self-organization) as well as end-users’ heterogeneous behavior represent key influential factors. Feedback was implemented as a measure to foster grid-beneficial behavior, which encompasses a range of monetary and non-monetary incentives (e.g., via social comparison). The model of frame selection (MFS) serves as theoretical background for modelling end-users’ decision-making. Additionally, we conducted an online survey to ground the end-user sub-model on empirical data. Despite these empirical and theoretical foundations, the model presented should be viewed as a conceptual framework, which requires further data collection. Using an example scenario, representing a lowly populated residential area (167 households) with a high share of photovoltaic systems (30%), different modes of governance were compared with regard to their suitability for improving system stability (measured in cumulated load). Both soft and strong control were able to decrease overall fluctuations as well as the mean cumulated load (by approx. 10%, based on weekly observation). However, we argue that soft control could be sufficient and more societally desirable.

1. Introduction and State of Research

The energy system is in transition; especially the increasing share of volatile, decentral and renewable energy sources (RES) will change the structure and governance of this complex, socio-technical system. In this context, the reorganization of the energy supply creates new uncertainties and risks, because electricity generation and consumption become harder to plan and unpredictable power fluctuations are more likely. Especially the power distribution grid is confronted with this new situation, since a large part of RES is installed here [1]. New concepts of information management that connect distribution system operators (DSOs) and end-users (industrial, commercial and residential) offer one potential solution to tackle these challenges. In this context, the provision of electricity-related flexibilities by end-users (i.e., situational shifts in peak electricity demand) as well as energy efficiency programs are important stabilization measures when the system’s reliability is jeopardized [2].

1.1. Feedback, Information and the Role(s) of End-Users in Future Energy Systems

However, this is not a purely technological issue, but also a social innovation, since current practices and roles of societal actors need to change. From households’ perspective, electricity is normally perceived as a “hidden” and easily available good that is deeply embedded in daily routines [3]. These habits and routines may collide with the flexibility requirements of smart grids [4] (p. 127), which is why the provision of energy consumption feedback constitutes a possible intervention strategy to support behavioral changes [5] (p. 708). Such feedback usually contains numerical information on energy consumption (e.g., kWh or percent savings) or monetary incentives [6,7]. For this purpose, a wide range of technological mediums has been utilized, for example energy management systems (EMS), web portals, mobile applications or in-home displays (cf. [8] for an overview). EMS may include monitoring and automated controls for residential appliances that have high electricity consumption (e.g., heating, ventilation) or that are used for generation and storage (e.g., microgeneration plants and batteries).
However, conventional, numerical feedback presents no ‘silver bullet’ for changing behavior, because some studies also draw rather cautious conclusions concerning its effectiveness. This is due to a series of difficulties, like the strength of hidden routines, perceived losses of comfort, familiarization effects, frustrations concerning personal saving limits or issues of trust and data security [4,9,10,11,12]. Additionally, the more frequent use of an increasing number of energy-efficient technologies might counteract actual energy-savings and increase the energy intensity of households [13] (pp. 251–252)—a phenomenon referred to as the “rebound effect” (p. 27) [12,14]. Concerning other approaches that rely on the provision of information in order to facilitate behavioral changes, quite similar empirical results can be observed. With regard to demand-side management (DSM), for example, Parrish et al. identify factors influencing end-users’ engagement that go beyond exclusively economic utility considerations, such as trust, familiarity, perceived risk, perceived complexity and effort [15]. Similarly, the public communication of environmental policies faces challenges with regard to cognitive biases (e.g., perceived lack of control), emotions (e.g., fear), and expectations (e.g., social norms) [16].
In summary, the provision and communication of information to facilitate behavioral changes may face various challenges, stemming from actors’ social and psychological processes. Consequently, recent discussions have focused on the use of information and feedback that go beyond conventional, numerical and purely economic-oriented approaches [6], shifting the attention away from technological issues and towards the diverse characteristics and (social) behavior of households [17]. This usually refers to ‘soft’, non-monetary and normative incentives or “green nudges” [17] (p. 6) that are aimed at fostering more sustainable behavior: For example by appealing to end-users’ social norms (e.g., comparing their behavior to peers) or their environmental concerns (e.g., through feedback on the ecological footprint of their behavior). Another idea would be to conceive end-users as active energy system participants, who are “[…] involved in both problem and solution” [9] (p. 28), exhibit self-criticism concerning their energy practices, and may potentially contribute to electricity generation by operating private photovoltaic (PV) power plants or communal wind turbines [18]. When pursuing this idea further, electricity in future RES-based systems could be understood as a common pool resource [19,20], which is potentially limited (i.e., rivalrous) but also non-excludable. In the German energy system, for example, non-excludability is ensured through a legal basis (operators must guarantee ‘non-discriminatory grid access’ to everyone). Such a new understanding might emphasize end-users’ significance in contributing to a collective problem solution and their role as potential ‘partners’, who help DSOs to maintain system stability. Considering this idea, non-monetary incentives and feedback could also appeal to end-users’ energy-related involvement and willingness to cooperate.

1.2. Agent-Based Modelling and Simulation of Future Energy Systems

Agent-based modelling and simulation (ABMS) is a method often applied in computational social sciences that “explicitly addresses the heterogeneous nature” [21] (p. 30) of social agents and thus presents a suitable tool to study the issues mentioned above. In order to implement heterogeneity, social agents are usually provided with a set of diverse characteristics and decision strategies, encouraging the use of existing behavioral models and theories from sociology, psychology or behavioral economics. Furthermore, ABMS is a bottom-up approach, since societal dynamics on the macro-level (like the diffusion of innovations) arise from the aggregation of agents’ individual, distributed decisions and interactions on the micro-level [22] (p. 53). Consequently, ABMS is typically applied to investigate the dynamics of complex, socio-technical systems: For example concerning forecasts, projections of future pathways or what-if scenarios under different conditions [23] (p. 46).
Regarding energy-related issues, ABMS have focused particularly on the diffusion and adoption of innovative products and services, for example (green) electricity contracts and tariffs [24,25], heating systems [26,27], (community-based) microgeneration plants [28,29] or lighting [30]. In this context, Hesselink et al. provide a comprehensive analysis of households’ energy-efficient technology adoption in recent ABMS studies (e.g., lighting and PV), addressing especially the policy instruments applied to overcome structural, economic, behavioral and social barriers [21].
Some studies have also applied ABMS to investigate the effects of energy feedback, thus focusing more on the adoption of energy-efficient behaviors and social eco-innovations, for example with regard to heating [31] (p. 114). Anderson and Lee [32] furthermore analyzed the effects of normative feedback and social networks on the energy usage of building occupants. In their experiments, they found out that sending normative messages only to occupants with above-average energy use yielded the best results [32] (p. 281), thereby confirming that effective feedback strategies should take the heterogeneity of energy users into account.
Regarding demand-side management (DSM) and prosumers’ role in smart grids, there is a rich amount of studies applying agent-based approaches—respectively multi-agent systems (MAS) [33,34]. The solving of coordination and negotiation issues regarding demand-side flexibilities is usually regulated via differently designed pricing and market mechanisms here [33] (p. 10). Consequently, households—whether in their role as consumers or prosumers—are usually considered as cost-optimizing entities [35] (pp. 230–231). However, recent studies have increasingly focused on the distribution of shared energy resources in local communities [36,37,38], which supports the above-mentioned assumption of energy as a common pool resource.
With regard to agent- and activity-based models of DSM, researchers have also pointed out a lack of socio-technical perspective: This includes the consideration of end-users’ service expectations and willingness to change everyday practices [39] (p. 1584) as well as comfort requirements, affinity for technology or environmental awareness [40] (pp. 683–684). Recently, Siebert et al. have underlined that energy consumer agents “should be considered as […] driven not only by financial incentives but also driven by concepts such as values, beliefs, and social norms” [41] (p. 12). In their agent-based model, they implemented various consumer types (based on factors like interest in new technologies and openness to social influences); simulation experiments with different scenarios showed that even small changes in agents’ behavior (respectively the share of consumer types) may lead to “considerable differences and non-linearity in the grid power flow and voltage levels” [41] (p. 11).

1.3. Purpose and Structure of This Paper

As described above, maintaining system stability in future RES-based power distribution grids is the main issue that we investigate in this study. In this context, we focus on information management approaches in which DSOs try to encourage end-users to behave in a grid-beneficial manner by applying different intervention strategies (hereafter referred to as ‘modes of governance’), for example the provision of feedback. As our literature review indicates, previous ABM-related studies have already investigated the influence of various (information) management approaches on grid performance, especially with regard to DSM in smart grids. However, they tend to focus on technological issues and economic incentives, revealing a research gap with regard to a more nuanced perspective on end-user behavior.
This leads to the following research questions:
  • How do different modes of governance affect the performance of the grid, especially when considering a heterogeneous agent population?
  • How can we model heterogeneous end-users and use them as a ‘social ingredient’ to improve technical grid models?
Guided by these research questions, we draw on the methodological capabilities of ABMS in order to present a simulation framework that helps to investigate the performance of future power distribution grids (i.e., smart grid scenarios). Different modes of governance (i.e., soft and strong control as well as self-organization) and the dynamics emerging from the decisions of individual, residential end-users constitute key influential factors here. Based on discussions in current literature, the soft mode of governance refers to feedback mechanisms that consider end-users’ heterogeneous attitudes, preferences and behaviors. The feedback provided by DSOs therefore includes not only monetary (electricity costs, power consumption), but also more normative, non-monetary information (concerning social comparison, environmental impact and cooperativeness of the population).
Methods and materials are provided in Section 2 and Section 3: Section 2 briefly presents the overall simulation framework, which links different simulators from sociology and electrical engineering (co-simulation). However, we will focus on the end-user sub-model in this paper (Section 3), using the model of frame selection (MFS) as theoretical background for modelling end-users’ decision-making [42]. Additionally, we conducted an online survey to ground the end-user sub-model on empirical data. Exemplary simulation experiments are presented in Section 4 in order to show possible applications of the framework. We discuss the limitations and future prospects of the end-user model in Section 5. The article concludes in Section 6.

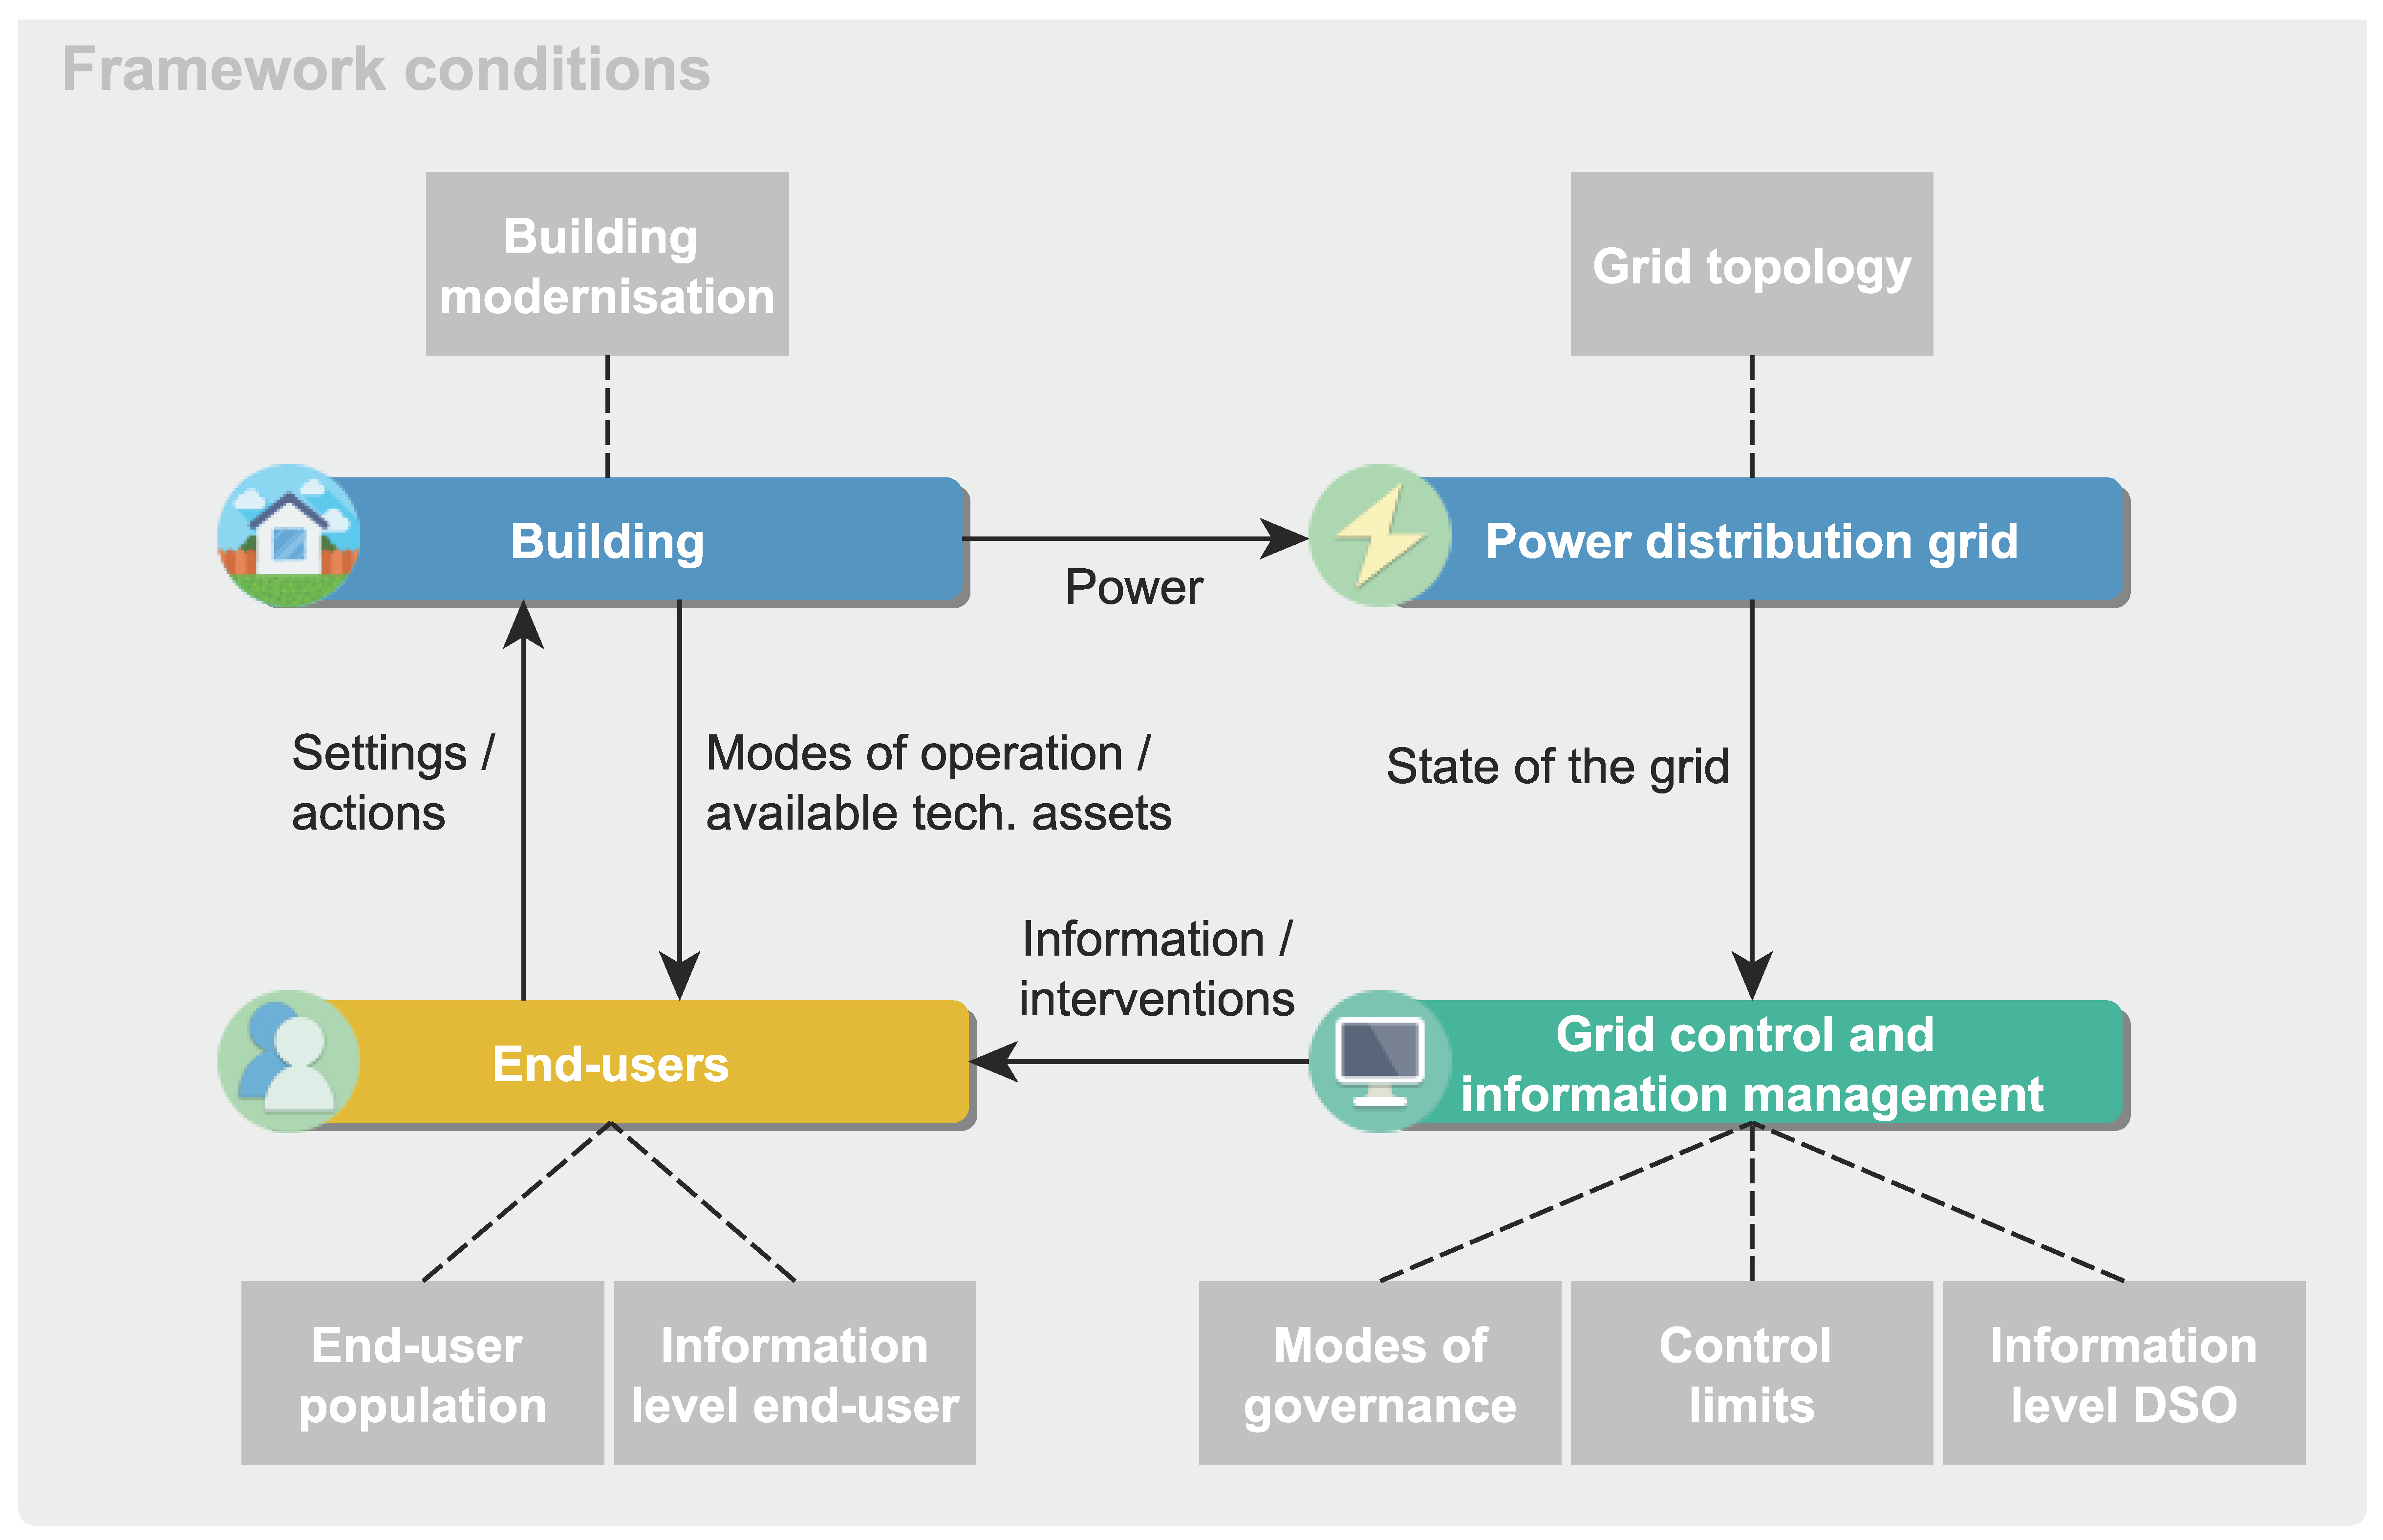
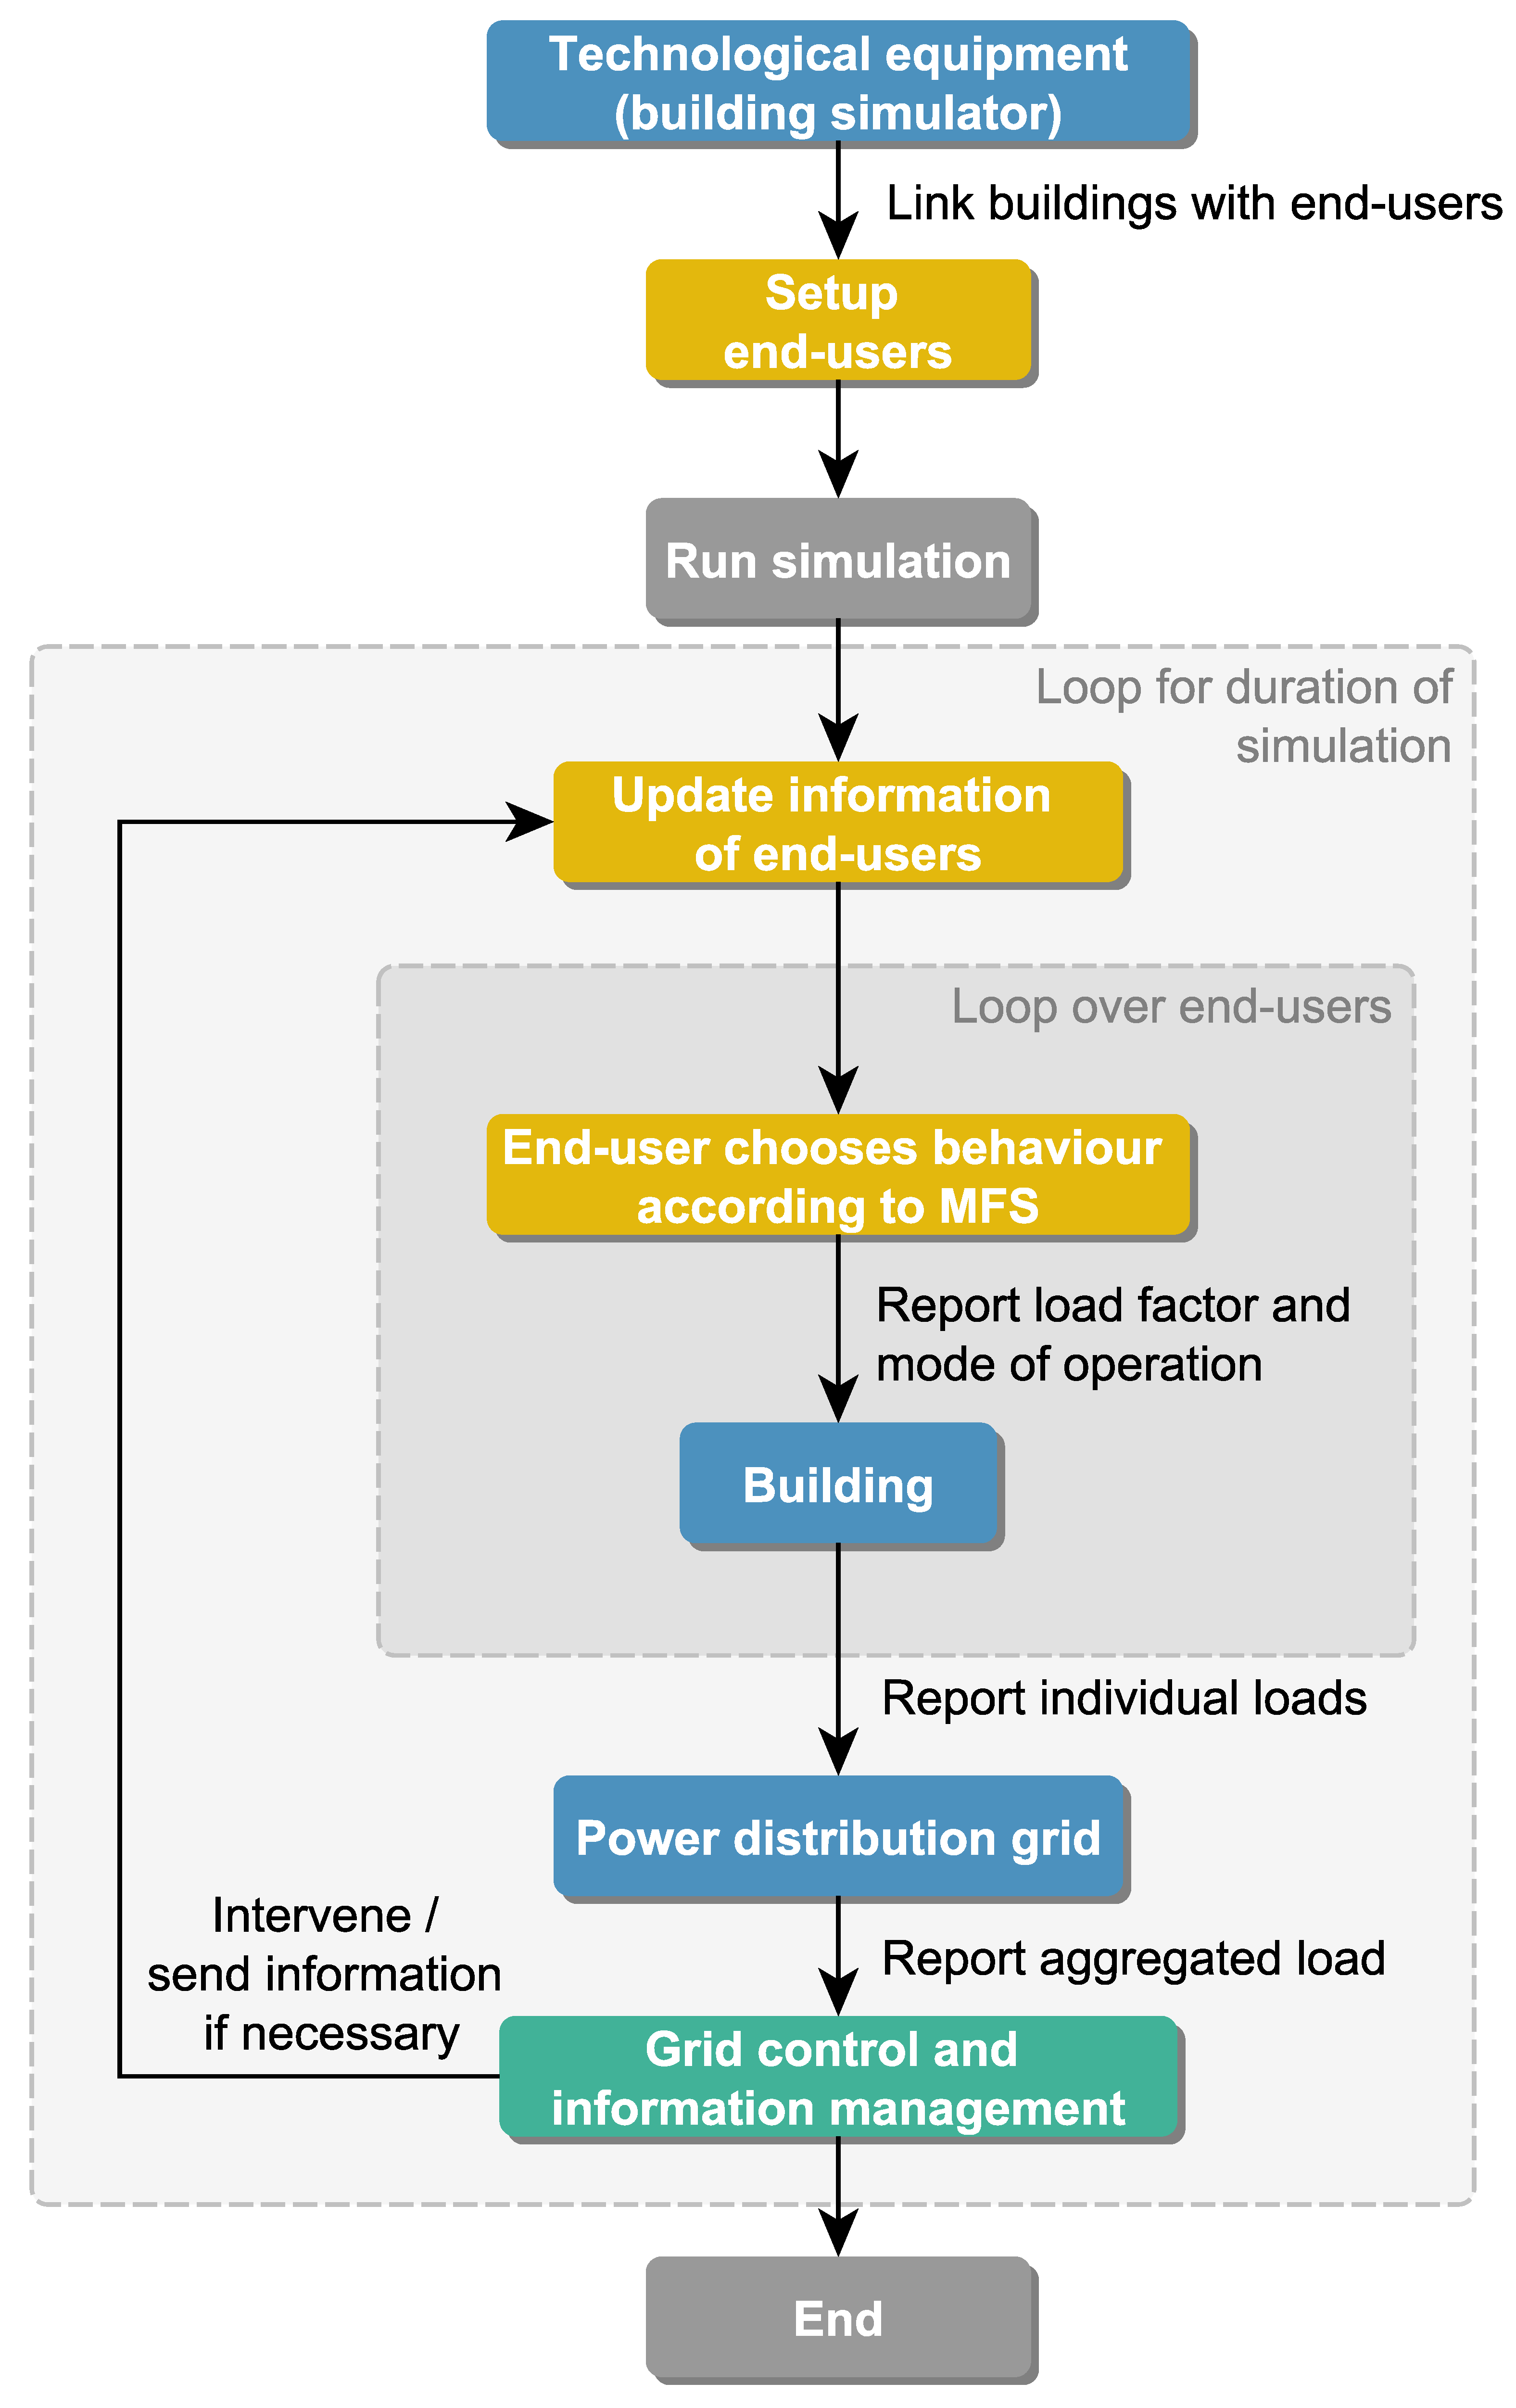
2. An Interdisciplinary Co-Simulation Framework for Future Power Distribution Grids

The co-simulation framework presents the results of an interdisciplinary research project (“Collaborative Data and Risk Management for Future Energy Grids—a Simulation Study”), conducted by the Institute of Energy Systems, Energy Efficiency and Energy Economics (Faculty of Electrical Engineering and Information Technology) as well as the Technology Studies Group (Faculty of Social Sciences) at TU Dortmund University. In this collaborative project, the power distribution grid was interpreted as a socio-technical system: Accordingly, the complexity of the system arises from the interaction of social (e.g., end-users and DSOs) as well as technical components (e.g., microgeneration facilities, grid topology). In this context, the framework was developed to investigate distribution power grid dynamics under different conditions, paying particular attention to information management concepts that involve DSOs and end-users. A simple visual representation of the framework can be found in Figure 1; for a more detailed description see Hidalgo Rodríguez et al. [43].
The framework is based on a sociological macro-micro-macro model (cf. for example [44,45]); specifically, we refer to Esser’s interpretation, the “model of sociological explanation” (MSE) [46] (pp. 91–100). This basic model differentiates three analytical steps: First, actors on the micro-level perceive a (social) situation or structure on the macro-level (“Logic of the situation”) [47] (p. 8). Individual actors then take decisions (“Logic of the selection”) (ibid.), resulting in a new, collective, and potentially unintended situation on the macro-level (“Logic of the aggregation”) [47] (p. 9). According to Esser and Kroneberg, actors’ interpretation of a situation (“Logic of the situation”) provides a direct link to the model of frame-selection [48] (pp. 68, 71), which we describe further in Chapter 3.
To our understanding, Esser’s basic concept of explaining macro-sociological phenomena is suitable for our case, our understanding of governance as well as the idea of ABMS in general: Influenced by current macro-level conditions (e.g., electricity prices), end-users make electricity-related decisions on the micro-level, for example reducing their power consumption or changing settings in their energy management system (EMS). In the building simulator, the decision of each individual end-user is translated into a load value, depending on residential appliances as well as external influences (i.e., weather). Since we aim to investigate future smart grids, we include inflexible household appliances, flexible appliances (heat pumps), power generators (rooftop PV systems) and storages (electric and thermal). With the exception of inflexible appliances, the operation of residential facilities can follow different optimization objectives (e.g., cost-optimal or grid-beneficial operation), which can be set by residents via a simplified EMS [49]. The EMS uses model predictive control to decide, for example, at which power level the heat pump shall operate, or whether the battery should be charged or discharged in the following time steps. When set to grid-beneficial mode of operation, the EMS tries to use as much (or less) energy as possible in the next time steps, in order to help keeping the grid in a stable state (for details see [48]). Cost-optimal operation takes fixed costs of self-generated or bought-in power into account. Using energy from a rooftop PV system is always cheaper than using bought (electric) power).
Individual loads are aggregated in the power distribution grid simulator, resulting in a macro-level grid state that serves as the basis of decision-making for grid control and information management. A control algorithm represents the role of DSOs concerning operational grid control: It has the objective to maintain grid stability and, if jeopardized, to intervene and interact with end-users.
This interaction between DSO and end-users is structured by different modes of governance. We refer to the analytical definition by Weyer et al., who understand governance as “a specific combination of the basic mechanisms of control and coordination […]” [50] (p. 17). In this context, control is a directional relation between a controlling subject (i.e., DSO) and an “object-to-be-controlled” (i.e., end-users). In order to achieve its goals, the subject tries to change the situational context of the objects by utilizing incentives with varying intensity (e.g., stimuli or constraints) [50] (p. 20). However, objects-to-be-controlled always have leeway concerning the compliance with these interventions: The attempt to control a socio-technical system thus always involves a risk of failure (ibid. p. 20). Coordination, on the other hand, refers to the “mutual adjustment of heterogeneous actors aiming at collectively solving problems in a way that is acceptable to all parties involved” (ibid. p. 22). Consequently, coordination is characterized by decentral and reflexive negotiation processes between a variety of actors, who consider each other’s behavior when making decisions.
Based on this definition, we distinguish three modes of governance. This distinction is also guided by flexibility concepts that are currently being discussed in economic and technical domains. As an example: A traffic-light concept with different stages that define “how market participants and network operators can interact with one another in future” [51] (p. 2). The modes of governance applied here are:
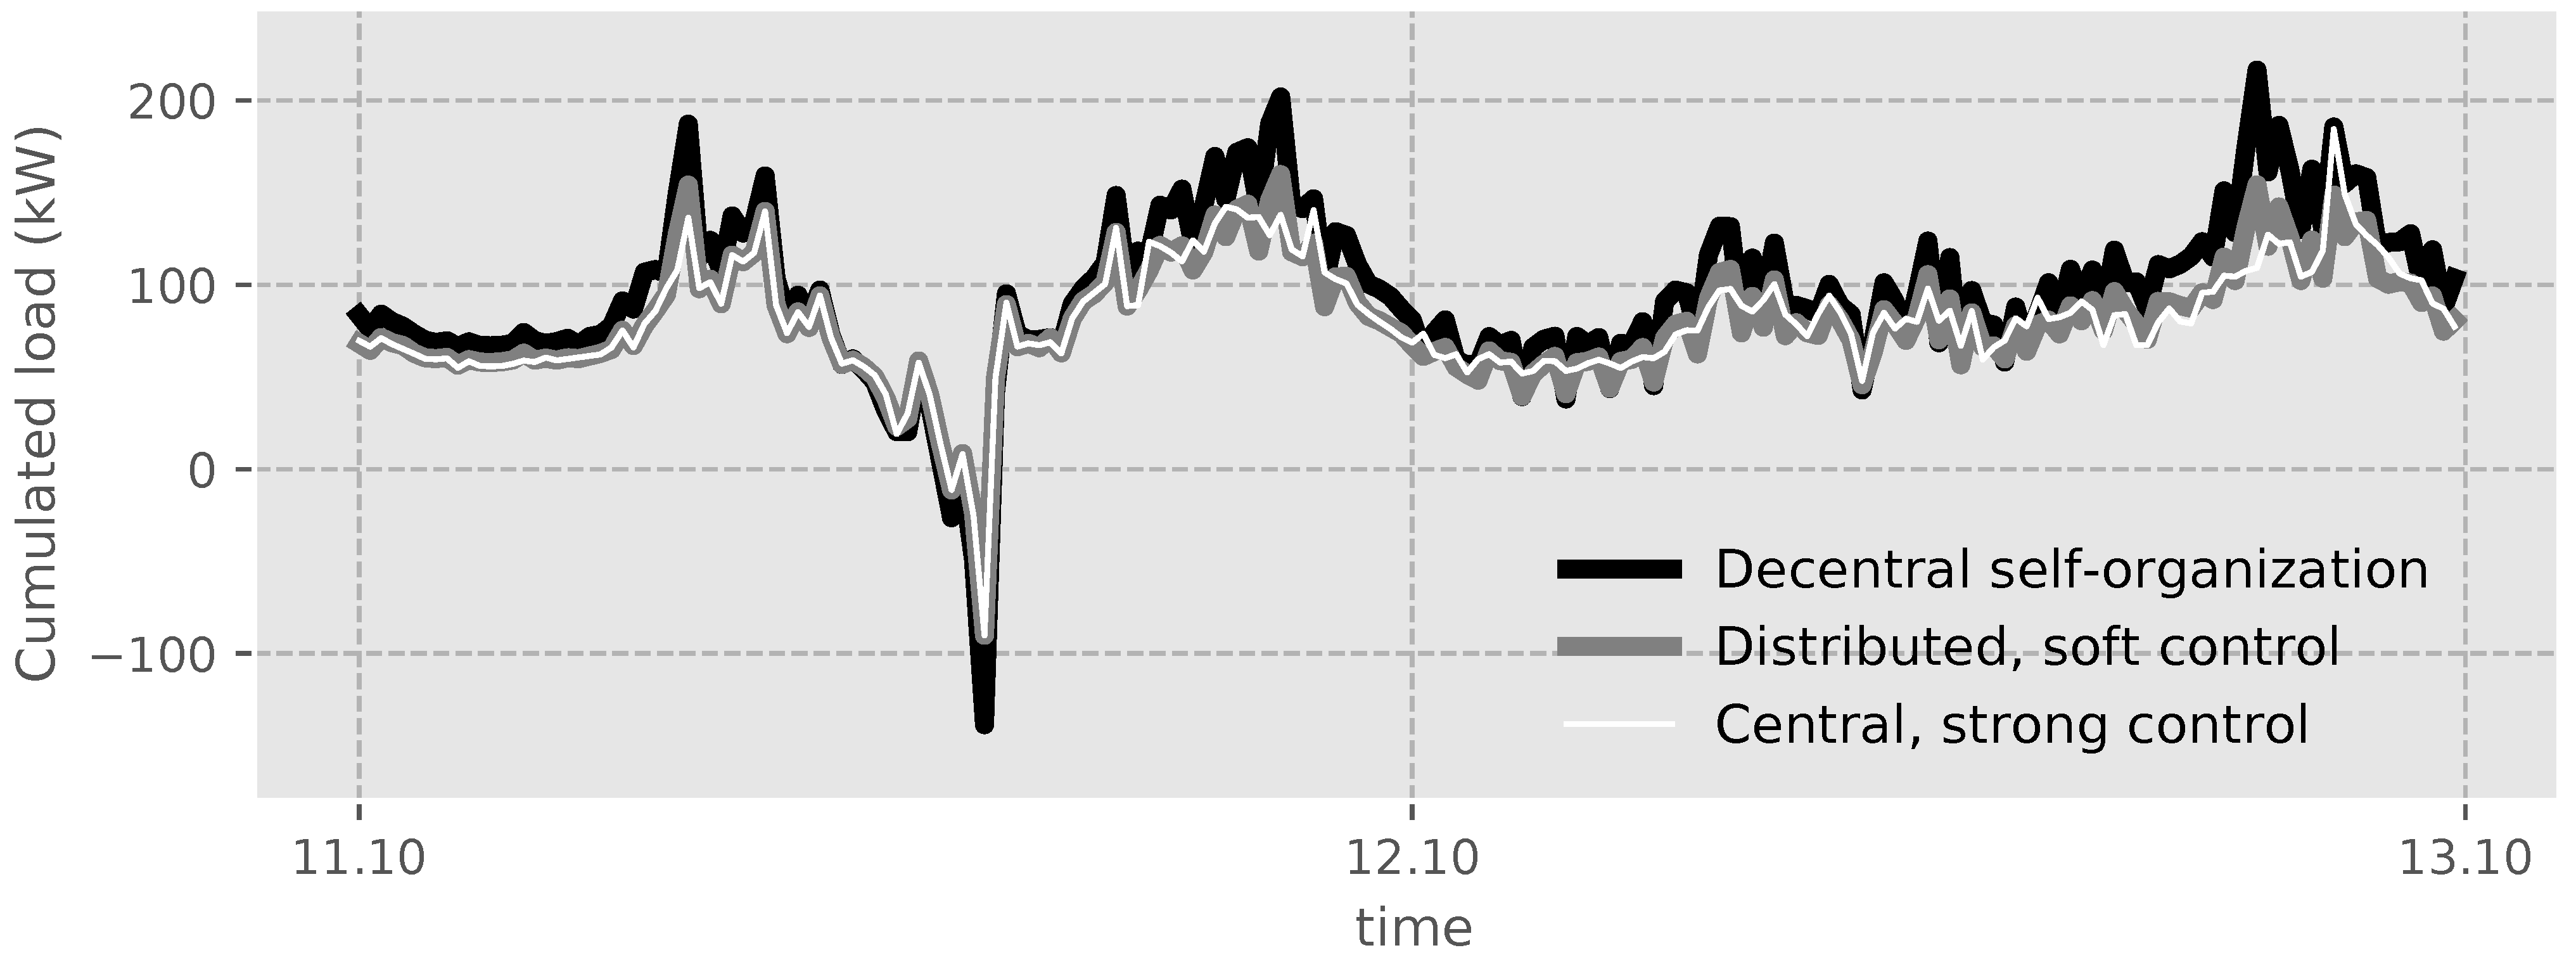
  • Decentral self-organization: All actors make their decisions independently; there is no exchange of information or intervention on part of the DSO (i.e., neither control nor coordination).
  • Distributed, soft control: The DSO intervenes and sends feedback and incentives (cf. Tables 1 and 2) to end-users, hoping that they adjust their behavior and contribute to solving the problem at hand. Since end-users’ contribution to collective problem-solving is an integral part of the incentive here, this constitutes a mixed mode of governance that links soft control and coordination.
  • Central, strong control: By contract, the DSO is allowed to directly access end-users’ EMSs and retrieve grid-beneficial flexibilities automatically. End-users receive the same information as in soft control; however, the EMS processes this information automatically, leaving the end-user no further leeway in their decision.
In summary, DSO’s interventions do not always have a direct impact, but rather influence decision-making of strategic actors at the micro-level, which then leads to emergent effects on the macro-level: power-surpluses or power-shortages [43]. The information from the DSO is updated at 15-min intervals. However, the DSO only intervenes and sends information as long as the grid’s stability is at risk.
Finally, framework conditions are used to specify scenarios by varying certain parameters (dotted lines in Figure 1): For example concerning the share of innovative residential appliances (building modernization), the dependency on external power supply (control limits), the share of different end-user types (population) or the possible interactions between grid control and end-users (modes of governance). The conditions relevant here will be described in more detail in Section 4.

3. Agent-Based Model for Residential End-Users’ Behavior

In order to describe the end-user sub-model in more detail, we draw on the ODD+D protocol in this section (Overview, Design Concepts and Details + Decision), which is an extension of the original ODD protocol by Grimm et al. [52,53]. It explicitly includes human decision-making and has been proposed as a standardized protocol for reporting ABMs. The model presented here was programmed in NetLogo [54].

3.1. Purpose

This sub-model is based on previous work of the authors and the simulator SimCo (Simulation of the Governance of Complex Systems, [55])—consequently, we named it SimCo-Energy. It aims to represent residential end-users’ decision-making and their reaction to DSO’s interventions. Depending on user-type specific preferences and attitudes, they respond to (non-)monetary incentives and electricity-related feedback by taking different actions, such as reducing their electricity consumption or switching devices’ modes of operation.

3.2. Theoretical Background

In order to model end-users, we utilize Kroneberg’s Model of Frame-Selection (MFS) and adapt it to electricity-related feedback and consumption behavior. The MFS has been applied to and empirically tested in various contexts, for example altruism, crime, fertility decisions, juvenile violence, voting behavior, and waste recycling (see for example [56,57,58,59]).
The MFS’s main advantage lies in the possibility to include actors’ situational awareness as well as their variable rationality [42] (p. 98); both concepts are highly relevant here. Firstly, as Davoudi et al. note concerning energy consumption behavior, “people move between […] two extremes, from simple heuristics to complex cognitive strategies, depending on the significance of the decision that they have to make […]” [60] (p.14). Accordingly, end-users may either be willed to “invest cognitive effort in the decision-making process” or they may act out of habit [61] (p. 1936). In this context, the MFS represents a fitting theoretical background as it differentiates two modes of decision-making to depict variable rationality: Actors may either draw on simple, automatic-spontaneous heuristics (“as-mode”) or on complex, reflexive-calculating decision strategies (“rc-mode”) [42]. The complexity and rationality of decision-making depend on the respective situation. External information, such as feedback and incentives, may act as environmental cues: These may automatically trigger behaviors without the need to consciously and repeatedly consider all other behavioral alternatives (cf. [62], cited from [31]), or reveal discrepancies and contribute to breaking prevailing habits [12] (p. 27).
Decision-making processes in the MFS are divided into three sequential stages:
  • The selection of a frame (“What kind of situation is this?”),
  • the selection of a script (“Which way of acting is appropriate?”),
  • and lastly the selection of an action (“What am I going to do?”) [42] (p. 99).
This distinction refers to the idea of mental models, which are defined as subjectively constructed and internally held interpretations of external phenomena that affect how a person behaves [63] (p. 42). In this context, frames represent mental models of situations, i.e., actors define the kind of situation they are currently faced with. Scripts, on the other hand, constitute mental models of “behavioral predispositions or programs of action” that are held by an actor and are perceived as relevant or suitable in the respective situation [42] (p. 99). These two mental models pre-structure an actor’s behavior and finally lead to the action selection, i.e., the choice of an actual behavior. The three phases can each be carried out in any mode (i.e., as- or rc-mode).
Similar approaches to variable rationality encompass, for example, the four decision strategies in Jager’s Consumat approach [64], which has been empirically tested and applied to investigate the diffusion of innovations (cf. [26,65]). Based on the degree of need-satisfaction and the certainty of opportunities, Jager distinguishes two automated (repetition, imitation) and two reasoned (deliberation, inquiring) strategies of information processing [64] (p. 79). Similarly, household agents in the ABMS of Schwarz and Ernst [66] apply three different decision rules when choosing water-saving innovations (peer evaluation, best-utility heuristic and rational-choice evaluation).

3.3. Entities, State Variables, and Scales

Residential end-user agents, i.e., private households, are the only entity in SimCo-Energy. The state variables that characterize individual end-users are summarized in Table 1: All variables are described in more detail over the course of Chapters 3.4 and 3.5; for reasons of comprehensibility, we grouped them in content-related units:
  • General attributes
  • Static MFS-related attributes
  • Situational information
  • Results of the MFS decision process
  • Energy-related output
  • Dissatisfaction-related attributes
In addition, each end-user agent is assigned to one building agent in the building simulator (see overall framework above): The building constitutes the spatio-technical context for an agent and therefore specifies which devices an agent can use or configure via the EMS (cf. “technological equipment” and “mode of operation” in Table 1). Furthermore, each building agent stores a residential load profile, which is assigned to an end-user agent and then modified by their behavior (cf. block E in Table 1)—due to self-regulated changes or DSO’s interventions.

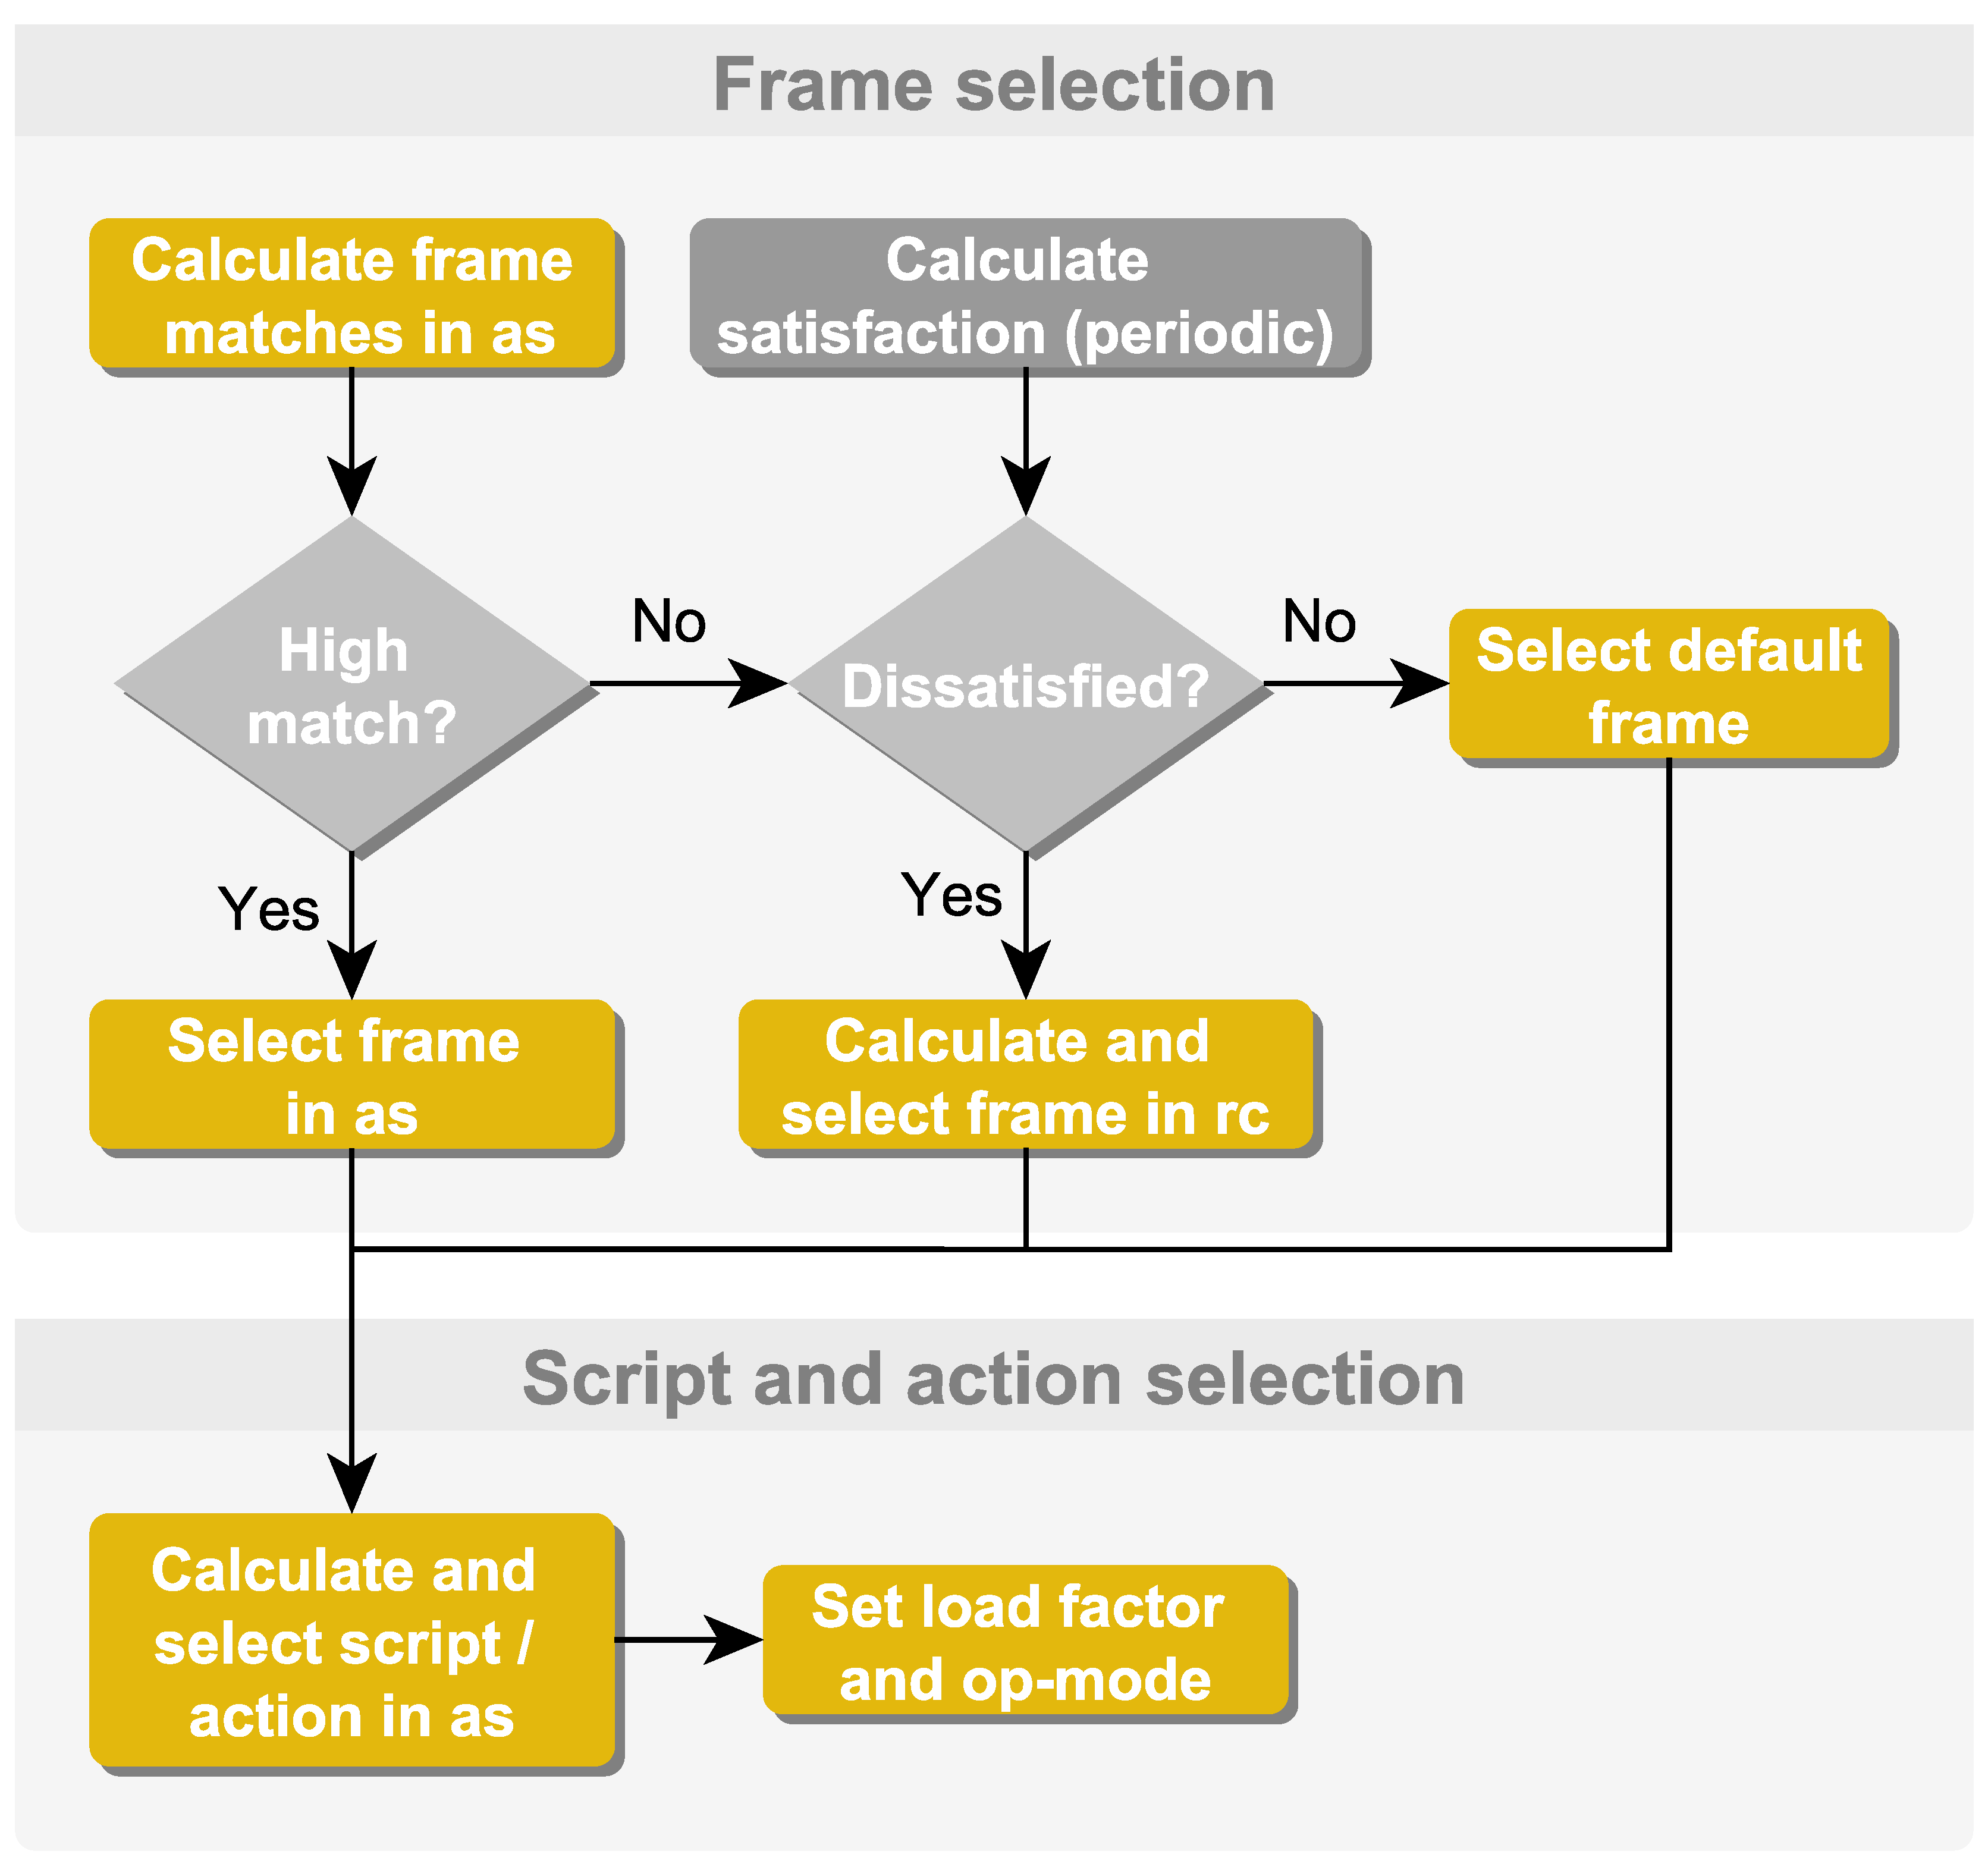
3.4. Individual Decision-Making

When grid stability is at risk and grid control decides to intervene by providing feedback and incentives to end-users (depending on the mode of governance presented in Section 2), end-users are faced with the choice of whether or not to comply with this ‘request for assistance’. In general, DSO’s requests resemble short messages to the end-users, which entail a recommended action (e.g., decreasing consumption or changing settings in the EMS) as well as a range of quantitative data concerning own consumption, current costs and cooperativeness of other agents (cf. variable “information profile” in Table 1 and Section 3.4.2). These interventions change end-users’ context and provide situational cues that may lead to behavioral changes. Figure 2 depicts the general process of SimCo-Energy and its interfaces with the other simulators of the framework (cf. Section 2).
End-users usually follow routines and habits when making daily electricity-related decisions. In our adaptation of the MFS, we therefore assume that end-users act in the habitual as-mode by default and activate ’default’ frames and scripts (i.e., ‘no need to act’ and ‘doing nothing’). This reflects end-users’ tendency to maintain the status quo instead of evaluating all information available [67] (p. 174). In technical terms, this means that the EMS is set to “cost-optimal” per default.
Agents can deviate from their default behavior when the following conditions are met:
  • End-users select another frame or script in as-mode if the match (i.e., the perceived fittingness of frames and scripts, max. value 1) of the best option is sufficiently high (above 0.8) or higher than the other options (twice as high as second best option’s match);
  • End-users can switch from as-mode to rc-mode if no match stands out and they are dissatisfied with their past behavior (see Section 3.5.4).
Figure 3 ‘zooms in’ on end-user agents’ behavior according to the MFS (as shown in the center of Figure 2) and shows a schematic depiction of the individual decision-making process.

3.4.1. Frame Selection in as-Mode

In this initial stage of decision-making, agents define their situation. We assume that an end-user either perceives no need to act in the present situation (“No need to act”, frame 0) or assumes that an (re-)action is required (“Need to act”, frame 1).
Frame selection in as-mode constitutes the rather spontaneous assessment of a situation based on general attitudes and dispositions. Only factors are taken into account that reflect an actor’s habitual, taken for granted and mentally anchored behavior [42] (p. 102). End-users finally choose the frame with the highest “match”, i.e., the frame that is perceived to fit the current situation best (p. 101). The match m of a frame i is calculated for each agent via the following equation:
m i = o i × l i × a i
Firstly, a refers to the “chronic accessibility” of a frame, i.e., the general willingness to activate it (p. 101). We use the end-user’s perceived personal responsibility concerning the energy transition as an (empirical) indicator for the chronic accessibility of frame 1 (“Need to act”) here. Since there are only two mutually exclusive frames, we assume that the chronic accessibility of frame 0 (a0) is equal to 1 − a1.
Secondly, o refers to the “presence of situational objects”, which represents the awareness for situational cues (ibid.). Two cues are relevant here: The DSO either sends a request to end-users, including a recommended action (e.g., lowering or raising power consumption); or no request is sent, if there is no need to intervene on part of the DSO, signaling ‘business-as-usual’. However, we assume that grid control’s requests are not perceived immediately by an agent, but rather require a certain response time (end-users’ spontaneity threshold). Each simulation step represents 15 min: Due to the parametrization of end-user types, response time may thus vary between 15 and 120 min. Once the threshold exceeds the duration of the request (i.e., simulation-steps passed), the awareness increases gradually over time, influenced by general attitude towards the possibilities of smart metering. This combination of spontaneity threshold and attitude is intended to address end-users’ involvement in electricity-related feedback (cf. [68]). The three variables are measured in simulation steps; however, we used self-reported, attitudinal measures as empirical indicators for spontaneity threshold and attitude (cf. Section 3.5.2). Consequently, o is determined as depicted in Algorithm 1.
Algorithm 1: Presence of Situational Objects
If request present = True:
  If request duration > spontaneity threshold:
   o = (request duration − spontaneity threshold)/attitude (capped at 1)
  Else: o = 0
Else: o = 0
Lastly, the “associative link” (l) states to what degree end-users take situational cues as an indicator for the existence of a certain frame [42] (p. 101): In our case, it specifies in how far the two cues are associated with the need to act (frame 1) or not (frame 0). This variable was not empirically collected, but estimated based on the general characteristics of the end-user clusters (cf. Section 3.5.2).
As an example, a request (sent by the operator) can only trigger any reaction, if an agent’s mental linkage between that request and frame 1 “need to act” as well as the general disposition to activate that frame (“chronic accessibility”) are sufficiently high. An end-user, who is more interested and engaged in energy-related topics, would therefore be more likely to respond than a passive user, who regards electricity as a hidden and taken for granted good.

3.4.2. Frame Selection in rc-Mode

In the rc-mode, actors systematically process information and finally choose the alternative with the highest subjective utility [42] (p. 102). According to Kroneberg, frame selection in rc-mode focuses on the conscious formulation of expectations regarding the appropriateness of a situation definition [69]. When applying these ideas to our case, actors might tend to formulate a need to act if the information available reveal a discrepancy between current practices and desired outcomes [3] (p. 119).
Referring to the “feedback-standard gap” described by Karlin et al. [70] (p. 2), we assume that a mismatch between an end-user’s actual behavior (feedback, f) and a provided standard (reference, r) increases the probability that choosing the frame ‘need to act’ (frame 1) is perceived as appropriate. The mismatch equals the absolute deviation of r and f, which is then compared to a threshold in order to determine an end-user’s perceived appropriateness of a frame. Table 2 shows the four types of information that influence the frame selection in rc-mode. They comprise both conventional and monetary as well as non-monetary information.
With the exception of “cooperativeness”, each household is provided with individual performance data for each type of information. “Power consumption” is used to calculate the mismatch within a household, whereas “social comparison” refers to the mismatch between a household and other households in its social network; consequently, both use a household’s personal power consumption of the last 24 h as an indicator for its actual behavior.
However, end-users evaluate information differently: This is implemented by giving end-users preferences concerning electricity-related decisions, which rate the four types of information in terms of their subjective importance (cf. Table 1). These preferences refer to eco-friendliness (power consumption), cost savings (electricity costs), social norms (social comparison) as well as compliance with stability requirements of the power grid (cooperativeness). While the first three criteria are rather common for models on energy consumption behavior (cf. [67]), the last one is adopted from the idea of ‘grid-beneficial behavior’, which encompasses, for instance, end-users’ willingness and ability to prevent grid bottlenecks/congestion or stabilize the local supply system [71] (p. 17) via temporal changes in energy consumption.
Summing up, the information in Table 2 can be transferred to probabilities that indicate the ‘correct’ definition of a situation—depending on the preferences of end-users. The expected appropriateness for each frame is consequently determined by calculating the mean probability of all four information types (consumption, cost, social comparison, cooperativeness); the frame with the highest expected appropriateness is then selected. As an example, end-users might be more likely to perceive a ‘need to act’ (frame 1), if they are cost-sensitive and the change of their current electricity costs (compared to their historical average) exceeds the threshold (here: 10%). Likewise, end-users who give high priority to stability compliance might formulate a ‘need to act’, when merely a small number of households (here: below 50%) cooperates although the latter might be counter-intuitive at first sight.

3.4.3. Script and Action Selection in as-Mode

Scripts constitute actors’ notions of courses of action (i.e., routines or behavioral predispositions) that are deemed appropriate for a given situation. Referring to Jager, we assume that scripts (and actions) are selected only in as-mode, because “a script hardly requires cognitive effort to be executed” and thus “individuals do not have to explicitly evaluate all aspects of the available options any more […]” [72]. For reasons of simplification, we combine the script and action selection stages here, since scripts can be regarded as “mental models of sequences of actions” [42] (p. 99). We decided to implement three script-action-combinations:
  • “Business as usual” (script 0): The end-user does not change their actions at all and behaves as usual.
  • “Adjusting power consumption” (script 1): The end-user changes their behavior, i.e., increasing or decreasing consumption within reasonable limits relative to their standard behavior (cf. Table 1). Additionally, the end-user changes the settings of their EMS to ‘cost-optimal’.
  • “Following recommendation of DSO” (script 2): The end-user adjusts their power consumption (see above) and additionally changes the EMS to a ‘grid-beneficial setting’, if available.
The match m of a script j is determined similarly to the frame match and is calculated as depicted in Equation (2):
m j = m i × a j i × a j
The first variable mi refers to the match of the previously chosen frame i (see above), indicating that a script is more likely to be activated if the situation is sufficiently clear to the agent.
Secondly, aji refers to the “temporary accessibility”, which represents an end-user’s mental association of a script with the selected frame. Consequently, it is conceptually similar to the “associative link” in the spontaneous frame selection (cf. Section 3.4.1). The temporary accessibility was not empirically collected, but estimated based on the general characteristics of the end-user clusters.
Lastly, aj refers to the chronic accessibility of a script, i.e., the strength of end-users’ mentally anchored behaviors [42] (p. 102). Since such behavior is, for example, reflected in routines and experiences, we use end-users’ familiarity with energy-saving measures as an indicator for script 1 (“Adjusting power consumption”). When routines involve the interaction with others (human and machine), trust constitutes an important influencing factor in socio-technical systems [67] (p. 181): It constitutes a social mechanism to reduce complexity and uncertainty, and is assumed to prevent passive behavior [73]. Consequently, we assume that end-users’ trust in specific actors, like DSOs and municipal utilities, indicate the general disposition to activate script 2 (“Following request of DSO”).
Finally, the results of the script selection, i.e., electricity consumption (“current load factor”, cf. Table 1) and EMS settings (“current mode of operation”, cf. Table 1) are reported to the building simulator (cf. Figure 2).

3.5. Further Design Concepts

3.5.1. Interactions and Social Influence

We implemented indirect social interactions between households: End-users are provided with information on the average consumption of their social network (‘social comparison’, see above), and may consider this information when making their decisions (depending on the preference to comply with the ‘social norm’, see above). Since we focus on short-term electricity feedback in our study, information on social peers are only available in form of aggregated data without providing an immediate insight into their specific actions, decisions or choices.

3.5.2. Empirical Background and Agent Heterogeneity

The agents in our model belong to one of several ‘end-user types’ that were differently parametrized with regard to the MFS-relevant decision variables (Appendix B as well as “dispositions” and “preferences” in Table 1). For this purpose, these variables were operationalized for an empirical (online) survey (Appendix A); the collected data was then used for a cluster analysis in order to identify and characterize heterogeneous, attitude-based end-user types.
Survey participants were recruited via the online research platform SurveyCircle [74]. In addition to the attitudinal data required for the cluster analysis, we also collected some basic sociodemographic (e.g., age, occupation, education) and household-related data (e.g., living conditions, dwelling). 101 people participated in mid-August 2018 (Germany; 62% female; average age of 29, ranging from 18 to 65). Due to the choice of an online research platform for data collection, the sample is biased towards a more academic segment of the population. This becomes evident by the rather high level of education (68% high school graduation, 56% university degree). 66% of the respondents are fully or partially employed; students make up 26% of the sample. Regarding the living conditions, 41% of the respondents live in detached or duplex houses; 37% are homeowners.
Since a detailed description of the cluster analysis would go beyond the scope of this article, it is only possible to refer to the Appendices here in which the results (Appendix B) and the underlying variables (Appendix A) are presented. Cluster analysis is a common method in social sciences to identify similar groups of objects, i.e., persons or organizations [75] (pp. 453–515). We used the Ward method to form clusters, which aims to combine those objects that increase the total variance within a group as little as possible. Although Formann suggests utilizing no more than 6–7 variables when conducting a cluster analysis with less than 128 cases (2k, with k being the number of cluster variables [76], cited after [77]), we have decided to include nine variables due to conceptual reasons (cf. Appendix B): Specifically, finding attitudinal clusters that differ concerning the MFS-specific variables. Variables that were not significantly distinct between clusters were later excluded and randomly distributed. Different quantities of clusters were checked, but the four-cluster solution yielded the results that were the clearest to interpret. Since our sample is comparatively small and not representative for the overall German population, the findings presented in Chapter 3 and 4 should not be generalized. Since we examine a generic, ideal-typical power grid in Chapter 4, we have nevertheless accepted this sample in order to represent the effect of heterogeneous agent types.
In the end, four end-user types were identified, and parametrized based on the empirical findings (Appendix B):
  • Hesitant skeptics: Typically not inclined to act and skeptical about interventions and the benefits of smart metering; aspire conformity within their social network.
  • Eco-responsible helpers: Exhibit a strong sense of responsibility and a constant need to act; prioritize environmental concerns over all other needs.
  • Cost-conscious materialists: Most likely to act due to cost-minimizing reasons.
  • Spendthrifts: No prominent dispositions, but put high trust in DSOs’ and municipal utilities’ interventions; while group conformity is important, cost-related issues play an inferior role.
By varying the shares of these types in the total population, it is possible to make assumptions about the general societal sentiment within a scenario, for example with regard to the populations’ openness to flexibility concepts.

3.5.3. Stochasticity

The parametrization of end-users entails some random components. Firstly, end-users’ social network is randomly generated at the start of the simulation. It consists of 20 end-users and does not change over time. Secondly, the initial value of the load-factor (cf. Table 1) is drawn from a normal distribution, based on the cluster means and standard deviations gained from the survey. Lastly, we randomly distributed the spontaneity value of end-users, because this variable showed no significant differences in mean values among clusters (cf. Appendix B).

3.5.4. Learning

Since the overall co-simulation framework focusses on operational grid control and therefore only considers a relatively limited time span, i.e., days to weeks (cf. Section 2), no long-term changes in end-users’ habits, dispositions or preferences are taken into account here.
However, we implemented a simple short-term learning mechanism, representing agents’ daily satisfaction. We assume that agents are satisfied if they do not need to actively engage in electricity-related decisions on a regular basis and thus perceive no need to act in a situation [78] (p. 398). The agent calculates a satisfaction value for each day passed (calculated by 1 − m1, i.e., the reverse match of frame 1). If the historical mean of these values is below a given threshold, their status is set to ‘dissatisfied’ (see Table 1). Since a low satisfaction with their current situation may cause agents to elaborate on alternative behaviors [64] (pp. 76–77), the ‘dissatisfied’ status constitutes a prerequisite for selecting the rc-mode in the frame-selection (see Section 3.4).
Additionally, the intensity of end-users’ load-factor adjustments declines over time (cf. “current load-factor” in Table 1) in order to represent feedback-related familiarization effects [4] (p. 130). Consequently, if end-users do not repeat such adjustments, short-term learning effects remain minor.

3.6. Implementation Details

SimCo-Energy was programmed in NetLogo [54], while the overall framework as well as the software for linking the separate models (mosaik [79]) are Python-based. We used the NetLogo-Java API to implement an adapter connecting SimCo-Energy to mosaik.
The agent-type parameters are specified in the code (see Table 1 and Appendix B), while the population (i.e., shares of agent-types) as well as the household-building-allocation are provided in external input files on setup (see below). In the running simulation, DSO’s requests are inputs from another model (grid control and information management, see Figure 1), which are based on the current criticality of the grid’s stability.

4. Results

4.1. Scenario Definition and Experimental Set-Up

To illustrate possible applications of the overall simulation framework, we will examine an exemplary scenario in the following. It represents a generic, lowly populated residential area with 167 households, which consists of single- and two-family houses (cf. grid topology by [80] (p. 25)). It should be noted that this grid topology represents an ideal-typical grid structure and not a real one. Consequently, it is not directly linked to the household-related data we gathered from the survey. The survey was merely used to introduce heterogeneity to the agent population in terms of attitudinal clusters. Based on the types identified in the empirical data, our scenario uses an agent population that includes a relatively high share of environmentally aware and cost-conscious end-users, compared to existing energy consumer typologies [81]. Furthermore, we assume a fairly high diffusion of PV systems, which increases the volatility of power generation through RES. End-user agents and building agents (cf. Chapter 2) were randomly linked to each other, excluding some unreasonable combinations (e.g., “hesitant skeptics” having an advanced degree of building modernization, cf. Table 3). The shares of end-user types and residential facilities are depicted in Table 3. Finally, all information presented in Table 2 are available to end-users (cost, social comparison, cooperativeness etc.).
Based on this scenario, we conducted three experiments with varying modes of governance (decentral self-organization; distributed, soft control; central, strong control; cf. Section 2). The DSO (represented by a control algorithm in our framework) is allowed to send requests to the consumers, indicating whether there is any need to use more or less electric energy in the current situation; these messages might additionally contain further information, like feedback and incentives (see Table 2). Central and distributed modes operate with narrow control limits for the grid control algorithm (between 10 and −10 kW aggregated load), which specifies the scope of permitted fluctuations; consequently, we assume that the distribution grid cannot completely rely on external power supply from the transmission grid, which would be the case in scenarios of “energy self-sufficiency” or “energy autonomy” [82,83].

4.2. Simulation Results

Three experiments were conducted for a seven-day period in order to examine in how far system stability on the macro-level can be improved through interventions. For this purpose, we use the cumulated load in kW as a macro-level indicator for assessing the experiments and the effectiveness of the three modes of governance. Positive loads stand for power consumption, while negative ones represent power feed-ins.
A two-day section of the measurement series is depicted in Figure 4. Due to a relatively high share of PV systems, we can observe a high load volatility: The black curve (decentral self-organization) shows a feed-in peak at noon of the first day, while no such weather-related generation occurs on the second day. On both evenings, the load increases clearly, since electricity consumption is higher during this time of the day. First successes can be observed concerning the interventions to reduce generation and feed-in, because the total absolute value of the loads declines and fluctuations in the grid decrease accordingly. Central, strong control shows slightly better results, although a possible control error can be observed on the evening of the second day, when the load value rises to the level of decentral self-organization for a short time. Nevertheless, differences between central and distributed control are minor, at least when merely considering technical indicators for system stability; one could argue however that the use of additional (social) indicators, for instance end-users’ satisfaction, may yield different results, since the central mode of governance constitutes a strong intervention into end-users’ residential facilities.
Figure 5 illustrates the results of the complete seven-day period by means of violin plots, which visualize the distribution of measured values regardless of their temporal occurrence—similar to a boxplot. Both interventions succeeded in reducing outliers (high consumption/feed-in) that are critical for grid stability.
A statistical analysis (see Table 4) supports these findings: Mean load values drop from 88.3 kW (decentral self-organization) to 77.6 kW (distributed, soft control) or 77.7 kW (central, strong control); additionally, standard deviation decreases from 57.7 to 44 (for both modes of control). At least for the scenario under investigation, we can make an interim supposition that soft control is sufficient for the time being and allows improving the local grid stability as a result of DSO’s and end-users’ interactions. A sufficient share of end-users is apparently willing (and able by means of technical facilities) to respond to soft interventions. Accordingly, it appears reasonable to resort to central, strong control only in justified and exceptional cases, for example when preceding attempts at soft control did not achieve the desired effects and there is an imminent risk to the stability of the system.

5. Discussion

We hope that SimCo-Energy may contribute to the discussion on the effects of end-users’ (participatory) behavior on grid operation. Primarily, because it takes two important aspects of decision-making into account: Variable rationality and situational awareness of agents. Nevertheless, our end-user model should be viewed as a conceptual framework that requires further data collection, since some agent parametrizations are still based on qualitative assessments and estimations (e.g., thresholds or linkages, cf. Table 1). Experimental research designs, for example “vignette analyses” or “factorial surveys” [84,85], could serve as valuable tools for data collection here. They allow to ‘simulate’ decision-making situations, in which respondents have to decide under different, systematically manipulated circumstances (i.e., environmental cues). Such situational descriptions could provide respondents (i.e., end-users) with different combinations of feedback information, hints and DSO’s requests (as presented in Table 2) and would enable researchers to elicit respondents’ “[…] beliefs, attitudes, judgments, knowledge, or intended behavior” [85] (p. 129). Consequently, the importance of different information (as well as their interaction effects) could be identified and assessed. However, such experimental research designs would require larger samples, which would also allow for a more reliable cluster analysis. Since scenario and grid investigated in this paper are rather generic (cf. Section 4.1), and in order to introduce heterogeneity to the agent population, we accepted the small sample for now. When running experiments with grids and scenarios that are more realistic, a bigger and more representative sample for the calibration of end-users is definitely needed.
Furthermore, the exemplary scenario, representing a lowly populated residential area (Chapter 4), was used here mainly for reasons of simplicity and to demonstrate the general applicability of the framework. However, researchers recognize a large potential for the energy transition in such rural regions [86] (p. 58), which holds further need for research [87,88] (p. 103). Although the simulation framework presented here encourages us to experiment with various scenarios and system configurations, it easily neglects the complex processes that (must) precede such a what-if state. In particular, the change of predominant institutional regime-structures in administration, user practices, management, or politics is of great importance here—be it at the level of rural communities [86] (p. 58) or at the overall system level [89] (p. 146). Our exemplary scenario assumes that the energy transition is already at an advanced stage and that end-users are mostly willing to adopt socio-technical innovations and to participate in energy-efficient programs—thereby neglecting potential institutional barriers and taking a very optimistic view [90]. While the result of our simulation—and the outcome of agent-based simulations in general—can certainly serve as input for practitioners to assess the impact of governance measures (under certain conditions), complementary strategic instruments are needed to communicate the potential benefits of those measures to affected actors and thus help to overcome institutional barriers [86].
Lastly, future simulation experiments should include the exploration of more elaborated scenarios (e.g., by comparing different populations or grids, by improving the information provided and received by the DSO or by giving DSOs a better foresight in order to generate more plausible and targeted requests). This could be complemented by the utilization of more advanced indicators for measuring the effects of these experiments. In terms of macro-indicators, for example, it would be useful to link measures for grid-stability and security of supply to macroeconomic performance parameters [91]. In order to give a more nuanced, micro-level assessment of scenarios, social indicators—like end-users’ satisfaction or their acceptance towards interventions—should also be elaborated for future experiments. Since satisfaction presents merely a simple mechanism in our model (cf. Section 3.5.4), we refrained from using it as an evaluation criterion for the simulation. Jager’s Consumat approach [92], which tackles issues of need satisfaction in a more refined way, may constitute a useful starting point for further improvements of the model. Furthermore, other micro-level evaluations (e.g., agent-type specific behavioral changes and responses) should be taken into account in future experiments.

6. Conclusions

We have presented an interdisciplinary co-simulation framework that covers both technical and social aspects of the power distribution grid, and that allows to test different what-if scenarios of future smart grids. In order to depict the behavior of residential end-users, we developed an ABMS that is based on the model of frame selection (MFS). The MFS assumes that actors interpret specific situations differently and choose from several behavioral alternatives, which they expect to be appropriate for the given situation; the MFS is thus particularly suited to depict the variable and situational rationality of actors. End-users respond to various electricity-related feedbacks and incentives in this ABMS and adapt their behavior where deemed appropriate. In this context, feedback and incentives constitute possible means of intervention for DSOs in order to encourage end-users to contribute to the stability of the system. Feedback does not only encompass financial incentives, but also more normative, non-monetary incentives that rather target end-users’ perceived role in the energy system, for instance concerning their energy-related involvement and intrinsic willingness to cooperate.
Using an example scenario, different interventions were compared with regard to their suitability for improving system stability. Both distributed, soft control and central, strong control were able to improve the measured values, whereby the differences between the two governance modes were comparatively small.

Author Contributions

Conceptualization, F.A., S.H. and J.W.; methodology, F.A., S.H. and J.W.; software, F.A. and S.H.; validation, F.A. and S.H.; formal analysis, F.A. and S.H.; investigation, F.A., S.H. and J.W.; data curation, F.A.; writing—original draft preparation, S.H.; writing—review and editing, F.A., S.H. and J.W.; visualization, F.A. and S.H.; supervision, J.W.; project administration, J.W.; funding acquisition, J.W. All authors have read and agreed to the published version of the manuscript.

Funding

Research has been funded by the German Federal Ministry of Education and Research (2015–2018) under the title “Collaborative Data and Risk Management for Future Energy Grids—A Simulation Study” (grant number 03EK3547).

Acknowledgments

We thank our cooperating partners in the above-mentioned project, Johanna Myrzik and Diego Iván Hidalgo Rodríguez, for their valuable contributions.

Conflicts of Interest

The authors declare no conflict of interest.

Appendix A

Table A1. Empirically Collected MFS-Variables I.
No.MFS VariableRelates toOperationalizationNo. of ItemsExamples 1
1Chronic accessibilityFrame (as)Personal ascription of responsibility concerning success of energy transition (frame 1)4“I’m always trying to make a contribution to the energy transition.”
“The success of the energy transition is beyond my capabilities.” (neg.)
2Presence of situational objectsFrame (as)Self-reported spontaneity and impulsive behavior4“I usually take my time before making decisions.” (neg.)
“I often decide by gut feeling.”
3Presence of situational objectsFrame (as)Attitude towards possibilities of smart metering4“I find the use of a Smart Meter interesting due to the possibilities of use.”
4PreferencesFrame (rc)Subjectively evaluated preferences when making decisions; relate to (1) costs, (2) eco-friendliness, (3) social norm and (4) grid-beneficial behavior1 for each preferenceWhen making electricity-related decisions, it is important to me that…
“… the environment is treated with care.” (eco-friendliness)
“… I meet the expectations of people who are important to me.” (social norm)
5Chronic accessibilityScript (as)Experiences with energy saving behavior (script 1)6How often have you done the following in the past year?
“Unplugged electrical appliances (e.g., computers, televisions, etc.) when they were not in use.”
6Chronic accessibilityScript (as)Trust in recommendations of DSO/electric utility (script 2)5“I think that my electric utility makes a competent impression.”
1 English translation, since survey was in German.
Table A2. Empirically Collected MFS-Variables II.
No.ScaleSource; Based onInternal Consistency of Scale*MeanStandard DeviationExplained Variance
1Five-level Likert scale (agreement)[93,94]0.7853.700.9363.17%
2Five-level Likert scale (agreement)[95]0.6902.910.7452.04%
3Five-level Likert scale (agreement)[96,97]0.9133.970.8579.53%
4Rating scale, adds up to 100% for all preferences.Own custom scale-0.40 (1),
0.37 (2),
0.07 (3), 0.16 (4)
0.20 (1),
0.17 (2),
0.07 (3),
0.10 (4)
-
5Five-level scale (frequency)[98,99,100]**3.520.57-
6Five-level Likert scale (agreement)[96]0.9043.560.7572.64%
* Based on Cronbach’s alpha. A value above 0.7 is considered acceptable. ** An index has been calculated here because the different practices do not need to correlate and therefore the calculation of internal consistency is not necessary.

Appendix B

Table A3. Agent-Type Parametrization Based on Empirical Data from the Cluster Analysis.
Cluster Means and Parametrization *
MFS-VariableRefers toDescription (Short)Hesitant SkepticsEco-Responsible HelpersCost-Conscious MaterialistsSpendthrifts
Chronic accessibilityFrame (as)Personal responsibility0.56
(−0.95)
0.83
(0.51)
0.65
(−0.48)
0.75
(0.07)
Presence of sit. objectsFrame (as)Spontaneity **----
Presence of sit. objectsFrame (as)Attitude ***3.75
(−2.01)
1.73
(0.35)
2.02
(0.01)
1.90
(0.15)
PreferencesFrame (rc)Eco-friendliness0.15
(−0.86)
0.49
(0.73)
0.24
(−0.58)
0.36
(−0.27)
PreferencesFrame (rc)Cost0.44
(0.38)
0.29
(−0.34)
0.58
(0.64)
0.34
(−0.43)
PreferencesFrame (rc)Grid-beneficial0.26
(1.02)
0.18
(0.23)
0.12
(−0.33)
0.12
(−0.44)
PreferencesFrame (rc)Social norm0.15
(1.12)
0.03
(−0.42)
0.05
(−0.27)
0.17
(0.78)
Chronic accessibilityScript (as)Experience energy saving0.62
(−0.76)
0.75
(0.43)
0.64
(−0.55)
0.73
(0.25)
Chronic accessibilityScript (as)Trust utility0.64
(−0.51)
0.73
(0.10)
0.67
(−0.25)
0.77
(0.38)
Share
(N = 95 ****)
9.5%
(9)
41.1%
(39)
30.2%
(29)
18.8%
(18)
* All variables (except preferences) were initially on a 5-point Likert scale for the survey (see Appendix A); for parametrization, these values were partially recoded to a scale from 0 to 1 (except “attitude”, see below). The upper values thus represent the recoded cluster means. In order to compare differently scaled variables, the z-standardized values are also reported here (see values in brackets). This means that all values have a mean value of 0 and a variance of 1: A value close to 0 indicates that the cluster has an average value (yellow shades); a positive (green shades) or negative (red shades) value indicates that the cluster has an above-average or below-average value. ** In order to check whether the clusters differ significantly from each other with regard to their mean values (external heterogeneity), we conducted an analysis of variance (ANOVA). Concerning “spontaneity” there was no significant difference in mean values, so this variable was excluded from further clustering. *** Since the attitude functions as a gradient in Algorithm 1, the initial scale was reversed (6 − cluster mean), meaning that a lower value signals a better attitude towards the possibilities of smart metering (i.e., 1 and 2). Consequently, the awareness for a situational cue increases more strongly with a positive attitude. **** After identifying and eliminating outliers via a Single Linkage algorithm [101] (p. 311), we kept 95 of the initial 101 cases for further analyses.

References

  1. Järventausta, P.; Repo, S.; Rautiainen, A.; Partanen, J. Smart grid power system control in distributed generation environment. Annu. Rev. Control. 2010, 34, 277–286. [Google Scholar] [CrossRef]
  2. Bundesnetzagentur. Flexibility in the Electricity System. Status Quo, Obstacles and Approaches for a Better Use of Flexibility; Bundesnetzagentur: Bonn, Germany, 2017. [Google Scholar]
  3. Stephenson, J.; Barton, B.; Carrington, G.; Doering, A.; Ford, R.; Hopkins, D.; Lawson, R.; McCarthy, A.; Rees, D.; Scott, M.; et al. The energy cultures framework: Exploring the role of norms, practices and material culture in shaping energy behaviour in New Zealand. Energy Res. Soc. Sci. 2015, 7, 117–123. [Google Scholar] [CrossRef]
  4. Hargreaves, T.; Nye, M.; Burgess, J. Keeping energy visible? Exploring how householders interact with feedback from smart energy monitors in the longer term. Energy Policy 2013, 52, 126–134. [Google Scholar] [CrossRef]
  5. Han, Q.Q.; Nieuwenhijsen, I.; De Vries, B.B.; Blokhuis, E.E.; Schaefer, W.W. Intervention strategy to stimulate energy-saving behavior of local residents. Energy Policy 2013, 52, 706–715. [Google Scholar] [CrossRef]
  6. Hargreaves, T. Beyond energy feedback. Build. Res. Inf. 2017, 46, 332–342. [Google Scholar] [CrossRef] [Green Version]
  7. Behrangrad, M. A review of demand side management business models in the electricity market. Renew. Sustain. Energy Rev. 2015, 47, 270–283. [Google Scholar] [CrossRef]
  8. Karlin, B.; Ford, R.; Squiers, C. Energy feedback technology: A review and taxonomy of products and platforms. Energy Effic. 2013, 7, 377–399. [Google Scholar] [CrossRef]
  9. Goulden, M.; Bedwell, B.D.; Rennick-Egglestone, S.; Rodden, T.; Spence, A. Smart grids, smart users? The role of the user in demand side management. Energy Res. Soc. Sci. 2014, 2, 21–29. [Google Scholar] [CrossRef]
  10. Döbelt, S.; Jung, M.; Busch, M.; Tscheligi, M. Consumers’ privacy concerns and implications for a privacy preserving Smart Grid architecture—Results of an Austrian study. Energy Res. Soc. Sci. 2015, 9, 137–145. [Google Scholar] [CrossRef]
  11. Horne, C.; Darras, B.; Bean, E.; Srivastava, A.; Frickel, S. Privacy, technology, and norms: The case of Smart Meters. Soc. Sci. Res. 2015, 51, 64–76. [Google Scholar] [CrossRef]
  12. Podgornik, A.; Sucic, B.; Blazic, B. Effects of customized consumption feedback on energy efficient behaviour in low-income households. J. Clean. Prod. 2016, 130, 25–34. [Google Scholar] [CrossRef]
  13. Tvaronavičienė, M.; Prakapienė, D.; Garškaitė-Milvydienė, K.; Prakapas, R.; Nawrot, Ł. Energy Efficiency in the Long-Run in the Selected European Countries. Econ. Sociol. 2018, 11, 245–254. [Google Scholar] [CrossRef] [PubMed] [Green Version]
  14. Madlener, R.; Turner, K. After 35 Years of Rebound Research in Economics: Where Do We Stand? In Rethinking Climate and Energy Policies: New Perspectives on the Rebound phenomenon; Santarius, T., Walnum, H.J., Aall, C., Eds.; Springer: Cham, Switzerland, 2016; pp. 17–36. ISBN 978-3-319-38805-2. [Google Scholar]
  15. Parrish, B.; Heptonstall, P.; Gross, R.; Sovacool, B.K. A systematic review of motivations, enablers and barriers for consumer engagement with residential demand response. Energy Policy 2020, 138, 111221. [Google Scholar] [CrossRef]
  16. Vries, G. Public Communication as a Tool to Implement Environmental Policies. Soc. Issues Policy Rev. 2019, 14, 244–272. [Google Scholar] [CrossRef]
  17. Hoppe, T.; De Vries, G. Social Innovation and the Energy Transition. Sustainability 2018, 11, 141. [Google Scholar] [CrossRef] [Green Version]
  18. Devine-Wright, P. Energy Citizenship: Psychological Aspects of Evolution in Sustainable Energy Technologies. In Governing Technology for Sustainability; Murphy, J., Ed.; Routledge: London, UK, 2012; pp. 63–86. ISBN 9781849771511. [Google Scholar]
  19. Ostrom, E. Coping with tragedies of the commons. Annu. Rev. Polit. Sci. 1999, 2, 493–535. [Google Scholar] [CrossRef]
  20. Wolsink, M. The research agenda on social acceptance of distributed generation in smart grids: Renewable as common pool resources. Renew. Sustain. Energy Rev. 2012, 16, 822–835. [Google Scholar] [CrossRef]
  21. Hesselink, L.X.; Chappin, E. Adoption of energy efficient technologies by households—Barriers, policies and agent-based modelling studies. Renew. Sustain. Energy Rev. 2019, 99, 29–41. [Google Scholar] [CrossRef]
  22. Nikolic, I.; Kasmire, J. Theory. In Agent-Based Modelling of Socio-Technical Systems; van Dam, K.H., Nikolic, I., Lukszo, Z., Eds.; Springer: Dordrecht, The Netherlands, 2013; pp. 11–71. ISBN 978-94-007-4932-0. [Google Scholar]
  23. Holtz, G.; Alkemade, F.; De Haan, F.; Köhler, J.; Trutnevyte, E.; Luthe, T.; Halbe, J.; Papachristos, G.; Chappin, E.; Kwakkel, J.; et al. Prospects of modelling societal transitions: Position paper of an emerging community. Environ. Innov. Soc. Transit. 2015, 17, 41–58. [Google Scholar] [CrossRef]
  24. Vasiljevska, J.; Douw, J.; Mengolini, A.; Nikolic, I. An Agent-Based Model of Electricity Consumer: Smart Metering Policy Implications in Europe. J. Artif. Soc. Soc. Simul. 2017, 20. [Google Scholar] [CrossRef] [Green Version]
  25. Krebs, F. An Empirically Grounded Model of Green Electricity Adoption in Germany: Calibration, Validation and Insights into Patterns of Diffusion. J. Artif. Soc. Soc. Simul. 2017, 20. [Google Scholar] [CrossRef] [Green Version]
  26. Sopha, B.M.; Klöckner, C.A.; Hertwich, E.G. Adoption and diffusion of heating systems in Norway: Coupling agent-based modeling with empirical research. Environ. Innov. Soc. Transit. 2013, 8, 42–61. [Google Scholar] [CrossRef]
  27. Gotts, N.M.; Polhill, J.G. Experiments with a Model of Domestic Energy Demand. J. Artif. Soc. Soc. Simul. 2017, 20. [Google Scholar] [CrossRef] [Green Version]
  28. Pasimeni, F. Community-Based Adoption and Diffusion of Micro-Grids: Analysis of the Italian Case with Agent-Based Model. J. Artif. Soc. Soc. Simul. 2019, 22. [Google Scholar] [CrossRef] [Green Version]
  29. Stavrakas, V.; Papadelis, S.; Flamos, A. An agent-based model to simulate technology adoption quantifying behavioural uncertainty of consumers. Appl. Energy 2019, 255, 113795. [Google Scholar] [CrossRef]
  30. Chappin, E.; Afman, M.R. An Agent-Based Model of Consumer Lighting. In Agent-Based Modelling of Socio-Technical Systems; van Dam, K.H., Nikolic, I., Lukszo, Z., Eds.; Springer: Dordrecht, The Netherlands, 2013; pp. 181–200. ISBN 978-94-007-4932-0. [Google Scholar]
  31. Jensen, T.; Holtz, G.; Chappin, E. Agent-based assessment framework for behavior-changing feedback devices: Spreading of devices and heating behavior. Technol. Forecast. Soc. Chang. 2015, 98, 105–119. [Google Scholar] [CrossRef] [Green Version]
  32. Anderson, K.; Lee, S. An empirically grounded model for simulating normative energy use feedback interventions. Appl. Energy 2016, 173, 272–282. [Google Scholar] [CrossRef]
  33. Hu, M.; Xiao, F.; Wang, S. Neighborhood-level coordination and negotiation techniques for managing demand-side flexibility in residential microgrids. Renew. Sustain. Energy Rev. 2021, 135, 110248. [Google Scholar] [CrossRef]
  34. Ringler, P.; Keles, D.; Fichtner, W. Agent-based modelling and simulation of smart electricity grids and markets–A literature review. Renew. Sustain. Energy Rev. 2016, 57, 205–215. [Google Scholar] [CrossRef]
  35. Klaimi, J.; Rahim-Amoud, R.; Merghem-Boulahia, L. Energy Management in the Smart Grids via Intelligent Storage Systems. In Contemporary Approaches and Methods in Fundamental Mathematics and Mechanics; Alonso-Betanzos, A., Sanchez-Maroño, N., Fontenla-Romero, O., Polhill, G., Craig, T., Bajo Peréz, J., Corchado, J.M., Eds.; Springer: Cham, Switzerland, 2017; pp. 227–249. [Google Scholar]
  36. Reis, I.F.; Gonçalves, I.; Lopes, M.A.; Antunes, C.H. A multi-agent system approach to exploit demand-side flexibility in an energy community. Util. Policy 2020, 67, 101114. [Google Scholar] [CrossRef]
  37. Čaušević, S.; Warnier, M.; Brazier, F.M. Self-determined distribution of local energy resources for ensuring power supply during outages. Energy Inform. 2019, 2, 6. [Google Scholar] [CrossRef]
  38. Lovati, M.; Zhang, X.; Huang, P.; Olsmats, C.; Maturi, L. Optimal Simulation of Three Peer to Peer (P2P) Business Models for Individual PV Prosumers in a Local Electricity Market Using Agent-Based Modelling. Buildings 2020, 10, 138. [Google Scholar] [CrossRef]
  39. McKenna, E.; Higginson, S.; Grunewald, P.; Darby, S.J. Simulating residential demand response: Improving socio-technical assumptions in activity-based models of energy demand. Energy Effic. 2018, 11, 1583–1597. [Google Scholar] [CrossRef] [Green Version]
  40. Schwarzer, J.; Engel, D.; Lehnhoff, S. Conceptual Design of an Agent-Based Socio-Technical Demand Response Consumer Model. In Proceedings of the 2018 IEEE 16th International Conference on Industrial Informatics (INDIN), Porto, Spain, 18–20 July 2018; IEEE: Piscataway, NJ, USA, 2018; pp. 680–685, ISBN 978-1-5386-4829-2. [Google Scholar]
  41. Siebert, L.C.; Aoki, A.R.; Lambert-Torres, G.; Lambert-De-Andrade, N.; Paterakis, N.G. An Agent-Based Approach for the Planning of Distribution Grids as a Socio-Technical System. Energies 2020, 13, 4837. [Google Scholar] [CrossRef]
  42. Kroneberg, C. Frames, scripts, and variable rationality: An integrative theory of action. In Analytical Sociology: Actions and Networks; Manzo, G., Ed.; Wiley: New York, NY, USA, 2014; pp. 95–123. [Google Scholar]
  43. Hidalgo Rodríguez, D.I.; Hoffmann, S.; Adelt, F.; Myrzik, J.; Weyer, J. A Socio-Technical Simulation Framework for Collaborative Management in Power Distribution Grids. In Proceedings of the International ETG Congress 2017, Bonn, Germany, 28–29 November 2017; VDE: Frankfurt am Main, Germany, 2017. ISBN 9783800745050. [Google Scholar]
  44. Coleman, J. Foundations of Social Theory; Harvard University Press: Cambridge, MA, USA, 1990. [Google Scholar]
  45. Ostrom, E. Beyond Markets and States: Polycentric Governance of Complex Economic Systems. Am. Econ. Rev. 2010, 100, 641–672. [Google Scholar] [CrossRef] [Green Version]
  46. Esser, H. Soziologie. Allgemeine Grundlagen; Campus: Frankfurt am Main, Germany, 1993; ISBN 9783593349602. [Google Scholar]
  47. Esser, H. The Rationality of Everyday Behavior. Ration. Soc. 1993, 5, 7–31. [Google Scholar] [CrossRef]
  48. Esser, H.; Kroneberg, C. An Integrative Theory of Action: The Model of Frame Selection. In Order on the Edge of Chaos; Lawler, E.J., Thye, S.R., Yoon, J., Eds.; Cambridge University Press (CUP): Cambridge, UK, 2015; pp. 63–85. ISBN 9781139924627. [Google Scholar]
  49. Rodríguez, D.I.H.; Hinker, J.; Myrzik, J.M. On the problem formulation of model predictive control for demand response of a power-to-heat home microgrid. In Proceedings of the 19th Power Systems Computation Conference PSCC, Genua, Italy, 20–24 July 2016. [Google Scholar]
  50. Weyer, J.; Adelt, F.; Hoffmann, S. Governance of Complex Systems: A Multi-Level Model; Technische Universität Dortmund: Dortmund, Germany, 2015; Volume 42, Available online: http://hdl.handle.net/2003/34132 (accessed on 20 February 2019).
  51. BDEW. Smart Grid Traffic Light Concept. Design of the Amber Phase; Federal Association of the German Energy and Water Industries: Berlin, Germany, 2015. [Google Scholar]
  52. Müller, B.; Bohn, F.; Dreßler, G.; Groeneveld, J.; Klassert, C.; Martin, R.; Schlüter, M.; Schulze, J.; Weise, H.; Schwarz, N. Describing human decisions in agent-based models—ODD + D, an extension of the ODD protocol. Environ. Model. Softw. 2013, 48, 37–48. [Google Scholar] [CrossRef]
  53. Grimm, V.; Berger, U.; Bastiansen, F.; Eliassen, S.; Ginot, V.; Giske, J.; Goss-Custard, J.; Grand, T.; Heinz, S.K.; Huse, G.; et al. A standard protocol for describing individual-based and agent-based models. Ecol. Model. 2006, 198, 115–126. [Google Scholar] [CrossRef]
  54. Wilensky, U. NetLogo. 1999. Available online: https://ccl.northwestern.edu/netlogo/ (accessed on 30 January 2019).
  55. Adelt, F.; Weyer, J.; Hoffmann, S.; Ihrig, A. Simulation of the Governance of Complex Systems (SimCo): Basic Concepts and Experiments on Urban Transportation. J. Artif. Soc. Soc. Simul. 2018, 21, 21. [Google Scholar] [CrossRef] [Green Version]
  56. Kroneberg, C.; Yaish, M.; Stocké, V. Norms and Rationality in Electoral Participation and in the Rescue of Jews in WWII. Ration. Soc. 2010, 22, 3–36. [Google Scholar] [CrossRef]
  57. Beier, H. Wie wirken Subkulturen der Gewalt? Das Zusammenspiel von Internalisierung und Verbreitung gewaltlegitimierender Normen in der Erklärung von Jugendgewalt. Kölner Z. Soziol. Sozialpsychol. 2016, 68, 457–485. [Google Scholar] [CrossRef]
  58. Kroneberg, C.; Kalter, F. Rational Choice Theory and Empirical Research: Methodological and Theoretical Contributions in Europe. Annu. Rev. Sociol. 2012, 38, 73–92. [Google Scholar] [CrossRef]
  59. Best, H.; Kneip, T. The impact of attitudes and behavioral costs on environmental behavior: A natural experiment on household waste recycling. Soc. Sci. Res. 2011, 40, 917–930. [Google Scholar] [CrossRef]
  60. Davoudi, S.; Dilley, L.; Crawford, J. Energy consumption behaviour: Rational or habitual? disP Plan. Rev. 2014, 50, 11–19. [Google Scholar] [CrossRef] [Green Version]
  61. Jager, W. Stimulating the diffusion of photovoltaic systems: A behavioural perspective. Energy Policy 2006, 34, 1935–1943. [Google Scholar] [CrossRef]
  62. Verplanken, B.; Wood, W. Interventions to Break and Create Consumer Habits. J. Public Policy Mark. 2006, 25, 90–103. [Google Scholar] [CrossRef] [Green Version]
  63. Rook, L. Mental models: A robust definition. Learn. Organ. 2013, 20, 38–47. [Google Scholar] [CrossRef] [Green Version]
  64. Jager, W. Modelling Consumer Behaviour. Ph.D. Thesis, University of Groningen, Groningen, The Netherlands, 2000. [Google Scholar]
  65. Janssen, M.A.; Jager, W. Stimulating diffusion of green products. J. Evol. Econ. 2002, 12, 283–306. [Google Scholar] [CrossRef]
  66. Schwarz, N.; Ernst, A. Agent-based modeling of the diffusion of environmental innovations—An empirical approach. Technol. Forecast. Soc. Chang. 2009, 76, 497–511. [Google Scholar] [CrossRef]
  67. Wilson, C.; Dowlatabadi, H. Models of Decision Making and Residential Energy Use. Annu. Rev. Environ. Resour. 2007, 32, 169–203. [Google Scholar] [CrossRef]
  68. Vasiljevska, J.; Gangale, F.; Mengolini, A. Evolving Role of Distribution System Operators in End User Engagement. In Proceedings of the CIRED Workshop 2016, Helsinki, Finland, 14–15 June 2016; Institution of Engineering and Technology: London, UK, 2016. ISBN 978-1-78561-202-2. [Google Scholar]
  69. Kroneberg, C. Die Definition der Situation und die variable Rationalität der Akteure/The Definition of the Situation and the Variable Rationality of Actors. Z. Soziol. 2005, 34, 344–363. [Google Scholar] [CrossRef]
  70. Karlin, B.; Zinger, J.F.; Ford, R. The effects of feedback on energy conservation: A meta-analysis. Psychol. Bull. 2015, 141, 1205–1227. [Google Scholar] [CrossRef]
  71. Plenz, M.; Hirschl, B. Prosumer im Energiesystem. Ökol. Wirtsch. 2016, 31, 16. [Google Scholar] [CrossRef]
  72. Jager, W. Breaking ’Bad Habits’: A Dynamical Perspective on HABIT Formation and Change. In Human Decision Making and Environmental Perception. Understanding and Assisting Human Decision Making in Real-Life Settings; Liber Americum for Charles Vlek; Jager, W., Hendrickx, L., Steg, L., Eds.; University of Groningen: Groningen, The Netherlands, 2003. [Google Scholar]
  73. Büscher, C.; Sumpf, P. “Trust” and “confidence” as socio-technical problems in the transformation of energy systems. Energy Sustain. Soc. 2015, 5, 34. [Google Scholar] [CrossRef] [Green Version]
  74. SurveyCircle. Research Website SurveyCircle; Mannheim. 2020. Available online: https://www.surveycircle.com (accessed on 19 October 2020).
  75. Backhaus, K.; Erichson, B.; Plinke, W.; Weiber, R. Multivariate Analysemethoden; Springer: Berlin/Heidelberg, Germany, 2016; ISBN 978-3-662-46075-7. [Google Scholar]
  76. Formann, A. Die Latent-Class-Analyse: Einführung in Die Theorie und Anwendung; Beltz: Weinheim, Germany, 1984. [Google Scholar]
  77. Dolnicar, S. A Review of Unquestioned Standards in Using Cluster Analysis for Data-Driven Market Segmentation. In Proceedings of the Australian and New Zealand Marketing Academy Conference 2002 (ANZMAC 2002), Melbourne, Australia, 2–4 December 2002. [Google Scholar]
  78. Broman Toft, M.B.; Schuitema, G.; Thøgersen, J. Responsible technology acceptance: Model development and application to consumer acceptance of Smart Grid technology. Appl. Energy 2014, 134, 392–400. [Google Scholar] [CrossRef]
  79. OFFIS. Mosaik—A Flexible Smart Grid Co-Simulation Framework; OFFIS: Oldenburg, Germany, 2020; Available online: https://mosaik.offis.de/ (accessed on 19 October 2020).
  80. Scheffler, J.U. Bestimmung der Maximal Zulässigen Netzanschlussleistung Photovoltaischer Energiewandlungsanlagen in Wohnsiedlungsgebieten. Ph.D. Thesis, TU Chemnitz, Fakultät für Elektrotechnik und Informationstechnik, Chemnitz, Germany, 2002. [Google Scholar]
  81. Hierzinger, R.; Herry, M.; Seisser, O.; Steinacher, I.; Wolf-Ebert, S. Energy Styles Klimagerechtes Leben der Zukunft. Energy Styles als Ansatzpunkt für Effiziente Policy Interventions; Österreichische Energieagentur: Wien, Austria, 2011. [Google Scholar]
  82. McKenna, R. The double-edged sword of decentralized energy autonomy. Energy Policy 2018, 113, 747–750. [Google Scholar] [CrossRef]
  83. Balcombe, P.; Rigby, D.; Azapagic, A. Energy self-sufficiency, grid demand variability and consumer costs: Integrating solar PV, Stirling engine CHP and battery storage. Appl. Energy 2015, 155, 393–408. [Google Scholar] [CrossRef]
  84. Aguinis, H.; Bradley, K.J. Best Practice Recommendations for Designing and Implementing Experimental Vignette Methodology Studies. Organ. Res. Methods 2014, 17, 351–371. [Google Scholar] [CrossRef]
  85. Atzmüller, C.; Steiner, P.M. Experimental Vignette Studies in Survey Research. Methodology 2010, 6, 128–138. [Google Scholar] [CrossRef]
  86. Kostiukevych, R.; Mishchuk, H.; Zhidebekkyzy, A.; Nakonieczny, J.; Akimov, O. The impact of European integration processes on the investment potential and institutional maturity of rural communities. Econ. Sociol. 2020, 13, 46–63. [Google Scholar] [CrossRef]
  87. Lutz, L.M.; Fischer, L.-B.; Newig, J.; Lang, D.J. Driving factors for the regional implementation of renewable energy-A multiple case study on the German energy transition. Energy Policy 2017, 105, 136–147. [Google Scholar] [CrossRef]
  88. Naumann, M.; Rudolph, D. Conceptualizing rural energy transitions: Energizing rural studies, ruralizing energy research. J. Rural. Stud. 2020, 73, 97–104. [Google Scholar] [CrossRef]
  89. Fuchs, G. Legitimacy and field development: Electricity transition(s) in Germany. Glob. Trans. 2019, 1, 141–147. [Google Scholar] [CrossRef]
  90. Parrish, B.; Gross, R.; Heptonstall, P. On demand: Can demand response live up to expectations in managing electricity systems? Energy Res. Soc. Sci. 2019, 51, 107–118. [Google Scholar] [CrossRef]
  91. Stavytskyy, A.; Kharlamova, G.; Giedraitis, V.; Šumskis, V. Estimating the interrelation between energy security and macroeconomic factors in European countries. J. Int. Stud. 2018, 11, 217–238. [Google Scholar] [CrossRef]
  92. Schaat, S.; Jager, W.; Dickert, S.; Schaat, S.; Jager, W.; Dickert, S.; Schaat, S.; Jager, W.; Dickert, S. Psychologically Plausible Models in Agent-Based Simulations of Sustainable Behavior. In Agent-Based Modeling of Sustainable Behaviors; Alonso-Betanzos, A., Sanchez-Maroño, N., Fontenla-Romero, O., Polhill, G., Craig, T., Bajo Peréz, J., Corchado, J.M., Eds.; Springer: Cham, Switzerland, 2017; pp. 1–25. ISBN 978-3-319-46330-8. [Google Scholar]
  93. Hunecke, M.; Blöbaum, A.; Matthies, E.; Höger, R. Verantwortungszuschreibung Intern Spezifisch; Zusammenstellung Sozialwissenschaftlicher Items und Skalen (ZIS). 2014. Available online: https://doi.org/10.6102/zis63 (accessed on 14 December 2020).
  94. Martens, T.; Rost, J.; Gresele, C. Verantwortung für Umweltprobleme; Zusammenstellung sozialwissenschaftlicher Items und Skalen (ZIS). 2014. Available online: https://doi.org/10.6102/zis205 (accessed on 14 December 2020).
  95. Kovaleva, A.; Beierlein, C.; Kemper, C.J.; Rammstedt, B. Eine Kurzskala zur Messung von Impulsivität nach dem UPPS-Ansatz: Die Skala Impulsives-Verhalten-8 (I-8). GESIS-Working Papers; Leibniz-Institut für Sozialwissenschaften: Mannheim, Germany, 2012. [Google Scholar]
  96. Chen, C.-F.; Xu, X.; Arpan, L. Between the technology acceptance model and sustainable energy technology acceptance model: Investigating smart meter acceptance in the United States. Energy Res. Soc. Sci. 2017, 25, 93–104. [Google Scholar] [CrossRef]
  97. Riester, J. Energie 4.0—Die Digitalisierung der Energiewirtschaft. Eine Empirische Untersuchung zur Verbraucherseitigen Akzeptanz der Smart Meter Technologie und Implikationen für deren Vermarktung; Hochschule Hof: Hof, Germany, 2017; ISBN 978-3-935565-29-5. [Google Scholar]
  98. Brosch, T.; Patel, M.; Sander, D. Affective Influences on Energy-Related Decisions and Behaviors. Front. Energy Res. 2014, 2, 53. [Google Scholar] [CrossRef] [Green Version]
  99. Schahn, J. Skalensystem zur Erfassung des Umweltbewusstseins (SEU3); Zusammenstellung Sozialwissenschaftlicher Items und Skalen (ZIS). 1999. Available online: https://doi.org/10.6102/zis167 (accessed on 14 December 2020).
  100. Abrahamse, W.; Steg, L. How do socio-demographic and psychological factors relate to households’ direct and indirect energy use and savings? J. Econ. Psychol. 2009, 30, 711–720. [Google Scholar] [CrossRef]
  101. Schütz, T. Book Review: A Concise Guide to Market Research; Springer: Berlin/Heidelberg, Germany, 2019; ISBN 978-3-662-56706-7. [Google Scholar]
Figure 1. Overall co-simulation framework including the four simulators (colored boxes) and scenario conditions (grey boxes). Source: Own figure based on [43] (p. 624).
Energies 13 06674 g001
Figure 2. Process of SimCo-Energy (yellow boxes) and interface with other simulators (green and blue boxes). Source: own figure.
Energies 13 06674 g002
Figure 3. Decision-making process of end-users, based on the MFS. Source: own figure.
Energies 13 06674 g003
Figure 4. Cumulated load in kW (two-day section) over time, comparing three modes of governance. Source: own figure.
Energies 13 06674 g004
Figure 5. Cumulated load in kW. Source: own figure.
Energies 13 06674 g005
Table 1. State variables of end-user agents. Source: own depiction.
End-User VariableValuesDescription
AType“Eco-helper”,
“Spendthrift”,
“Materialist”,
“Skeptic”
Affiliation to one of the four empirical agent-clusters; determines the parametrization concerning decision-making relevant variables.
Technological equipment“Inflexible electrical devices only”,
“PV system only”,
“PV system with battery storage”,
“PV system and heating pump”,
“Heating pump only”
One of five predefined equipment configurations; input from the building simulator; static and does not change over time.
Social networkList of agentsConsists of 20 other randomly selected end-users; static and does not change over time.
BFrame-related dispositionsChronic accessibility
(value btw. 0 and 1),
Presence of situational objects (btw. 0 and 1),
Associative link (btw. 0 and 1),
Spontaneity threshold
(btw. 0 and 4),
Attitude (btw. 1 and 5)
Variables for calculating the matches of the frames; static and does not change over time. Relevant for
as-mode.
Frame-related preferencesNumber between 0 and 1 for each of the four preferences (cost savings, eco-friendliness, social norm and compliance)Relates to the importance of the four quantitative information (“information profile”) and the probability to perceive a need to act (frame 1), if these information reveal a discrepancy. Relevant for rc-mode.
Script- and action-related dispositionsChronic accessibility
(value btw. 0 and 1),
Temporary accessibility
(btw. 0 and 1)
Variables for calculating the matches of the scripts. Relevant for as-mode.
CInformation profileList of values for each of the four quantitative information (costs, own consumption, consumption of peers, share of cooperation) in course of timeAn agent’s memory concerning current and historical information. Gets updated when grid control sends a request. Relevant for rc-mode.
DMatchNumber between 0 and 1 for each frame and script/actionRelates to the fit and suitability of a frame/script in a given situation.
Current frame“No need to act” (0),
“Need to act” (1)
The currently chosen frame.
Current script and action“Doing nothing” (0),
“Adjusting power consumption” (1),
“Following recommendation” (2)
The currently chosen script and action.
ECurrent mode of operation“Cost-optimal”,
“Grid-beneficial”
Simplified settings for the EMS that an agent possesses. Cost-optimal settings are the default for all types of equipment; grid-beneficial settings are available to all but inflexible electricity devices.
Current load factorValue between 0.5 and 2Modification (percentage) of the standard load profile (building simulator) of an end-user, indicating that they may habitually use more or less power.
Values get updated due to behavioral changes: Each selection of script/action 1 or 2 results in a 10% de-/increase of the previous value; 10% of that change (i.e., 1% of the old value) will remain in the next step, indicating familiarization effects.
FDissatisfaction thresholdValue between 0 and 1Threshold for determining the dissatisfied status.
Dissatisfied?BooleanAn agent’s dissatisfaction with regard to its current situation, compared to the past. Used for determining decision-making in rc-mode. Gets updated every day.
Table 2. Information used for determining the appropriateness of frame 1. Source: own depiction.
TypeFeedback (f)Reference (r)Threshold (for Frame 1)
Power consumptionpersonal power consumption of the last 24 hhistorical average of the personal power consumption>10% deviation
Electricity costaverage electricity costs of the last 24 hhistorical average of electricity costs>10% deviation
Social comparisonpersonal power consumption of the last 24 haverage consumption of other households in the personal social network>10% deviation
Cooperativenessnoneshare of households that pledged their support in the past (i.e., share of households that followed the request/recommendation)<50% supporters
Table 3. Shares of end-user types and building modernization for 167 households. Source: own depiction.
Share
PopulationHesitant skeptics10%
Eco-responsible helpers40%
Cost-conscious materialists30%
Spendthrifts20%
Building modernizationPV systems only35%
PV systems with battery storage10%
PV systems and heating pumps5%
Heating pumps only10%
Inflexible electricity devices only40%
Table 4. Cumulated load in kW. Source: own depiction.
MeanStandard DeviationMaximumMinimum0.99-Percentile0.01-Percentile
Decentral self-organization88.357.7273.8−174.8208.3−118.5
Distributed, soft control77.644.0203.0−122.0166.9−81.8
Central, strong control77.744.0197.8−103.6173.7−84.7
Publisher’s Note: MDPI stays neutral with regard to jurisdictional claims in published maps and institutional affiliations.

