Figure 1.
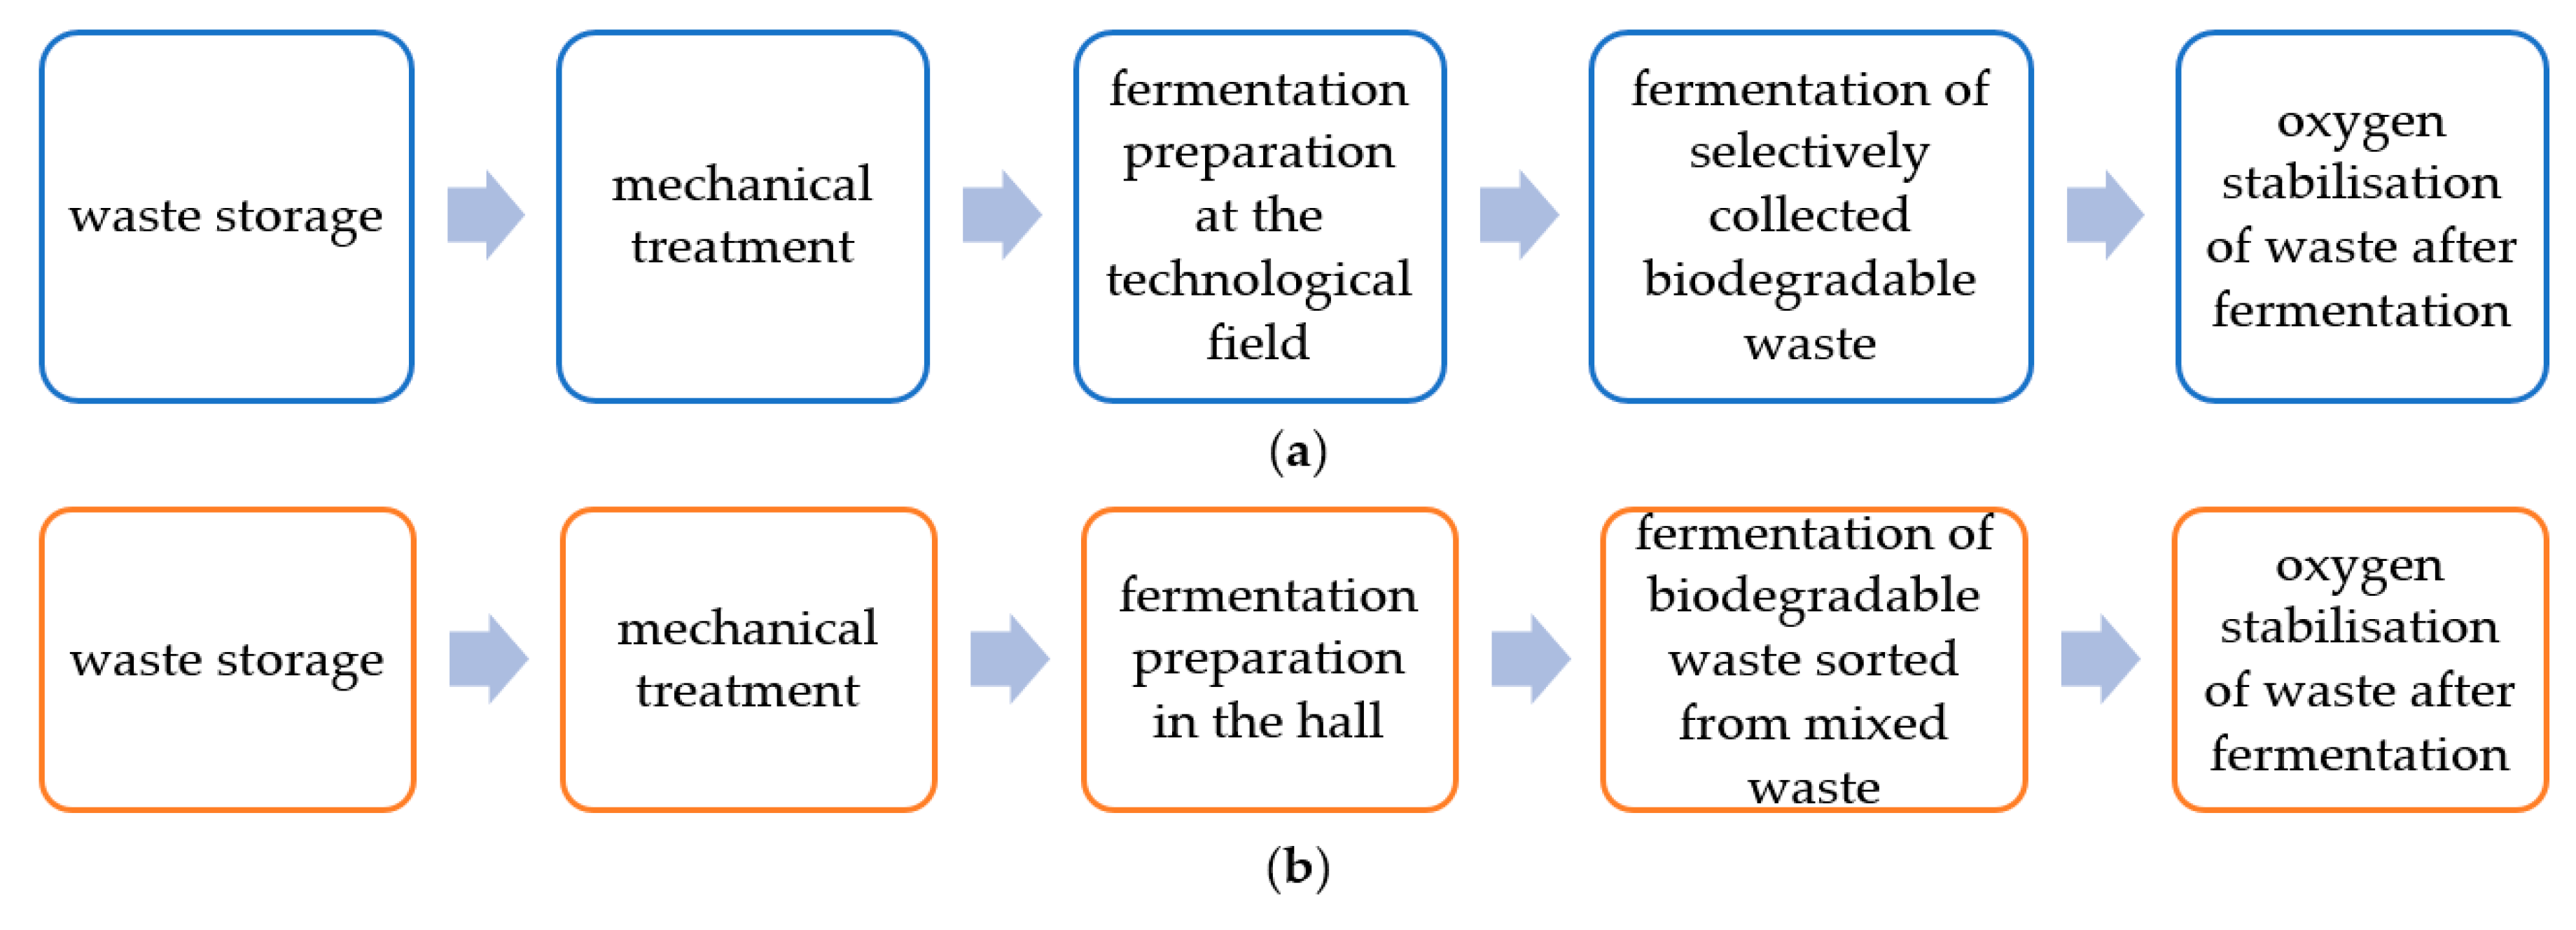
Process flow-chart of mechanical-biological treatment of waste at the analysed plant and main odour sources included in the research: A (a) and B (b).
Figure 1.
Process flow-chart of mechanical-biological treatment of waste at the analysed plant and main odour sources included in the research: A (a) and B (b).
Figure 2.
The MultiRae Pro gas detector characteristic.
Figure 2.
The MultiRae Pro gas detector characteristic.
Figure 3.
Inside and outside temperature (T) and relative humidity (RH) at biogas plant A (a) and biogas plant B (b) at individual measurement series.
Figure 3.
Inside and outside temperature (T) and relative humidity (RH) at biogas plant A (a) and biogas plant B (b) at individual measurement series.
Figure 4.
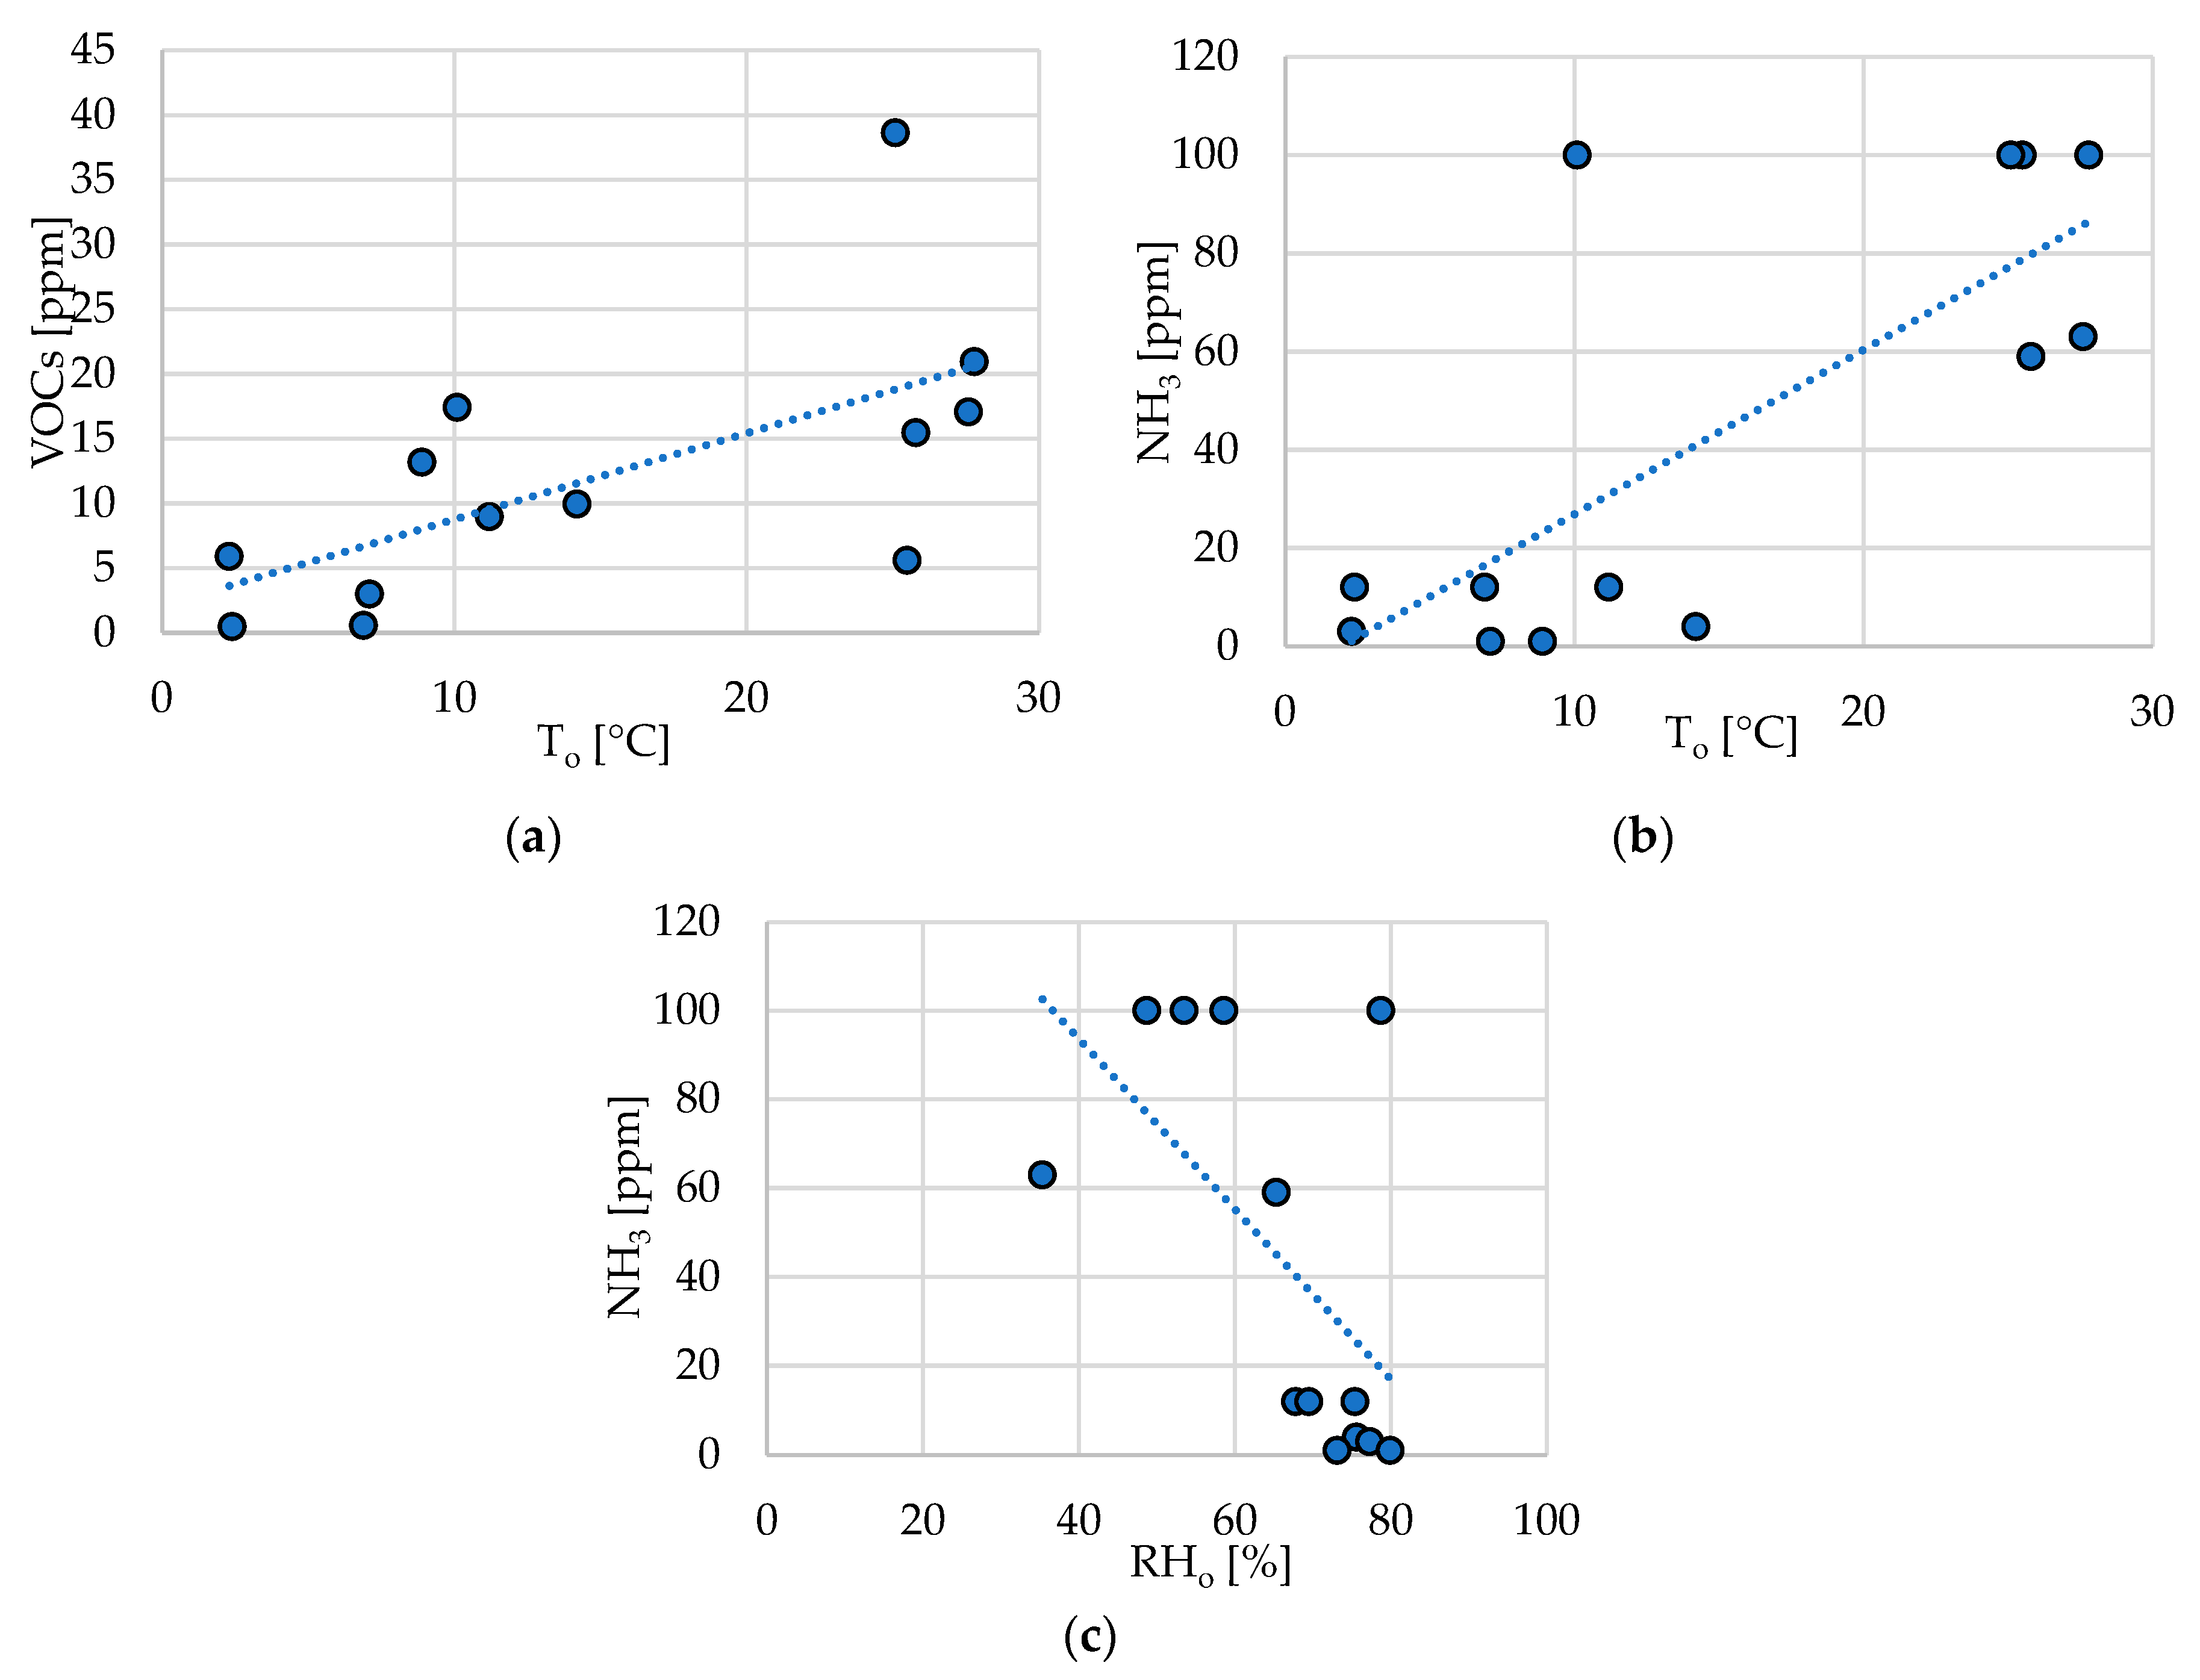
Correlation diagrams between NH3 concentration in the waste storage section of biogas plant A and measured microclimatic parameters with regression lines: (a) R2 = 0.37, (b) R2 = 0.33.
Figure 4.
Correlation diagrams between NH3 concentration in the waste storage section of biogas plant A and measured microclimatic parameters with regression lines: (a) R2 = 0.37, (b) R2 = 0.33.
Figure 5.
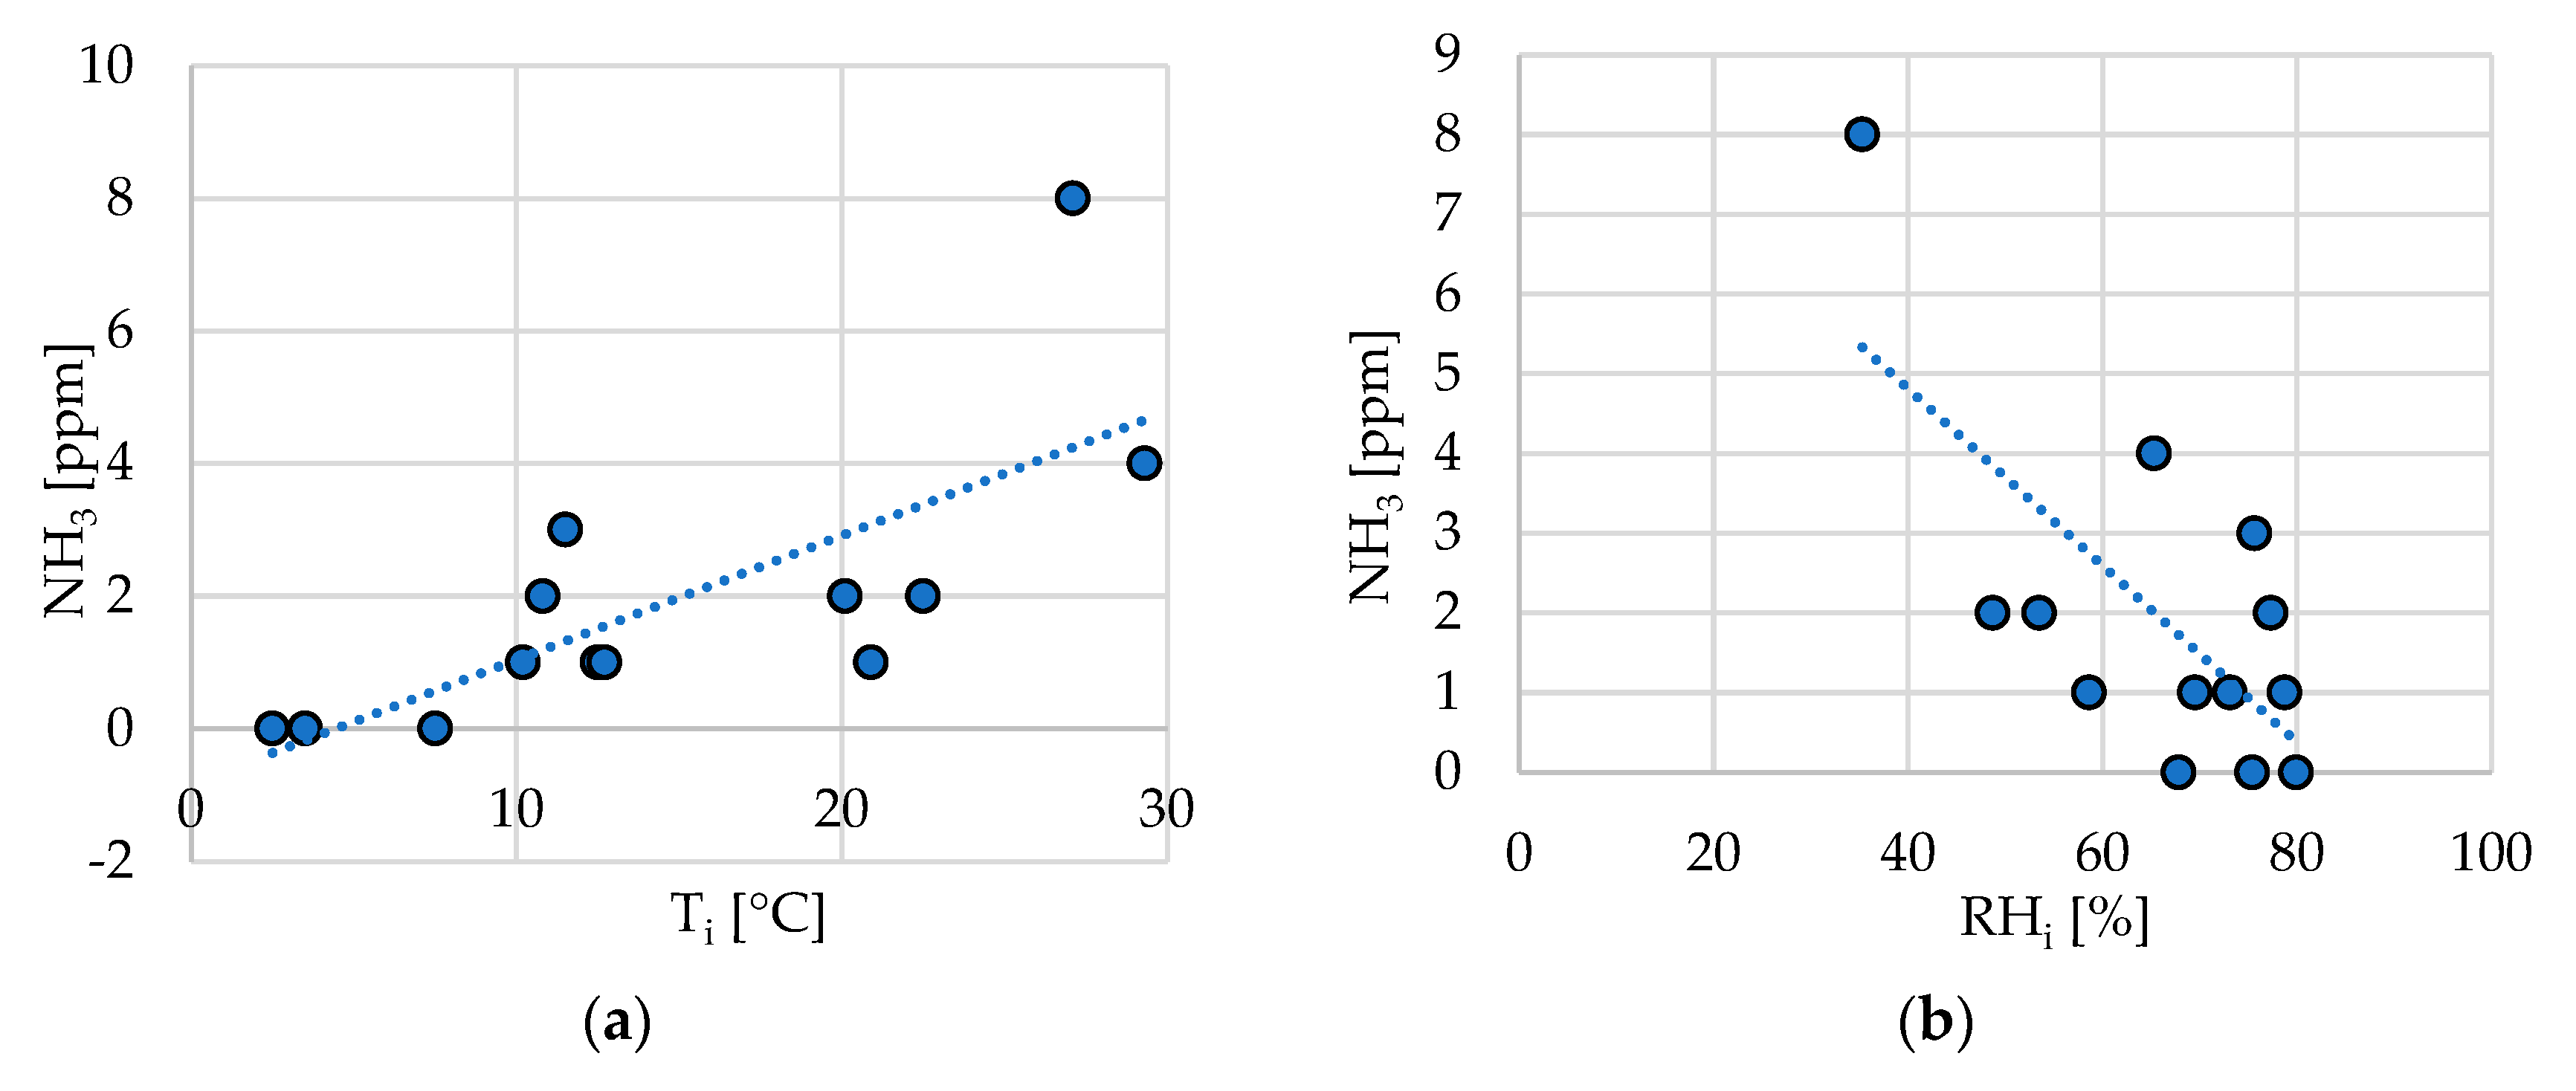
Correlation diagrams between NH3 concentration in the waste storage section of biogas plant B and measured microclimatic parameters with regression lines: (a) inside the hall R2 = 0.31, (b) selectively collected waste R2 = 0.49, (c) mixed waste R2 = 0.59.
Figure 5.
Correlation diagrams between NH3 concentration in the waste storage section of biogas plant B and measured microclimatic parameters with regression lines: (a) inside the hall R2 = 0.31, (b) selectively collected waste R2 = 0.49, (c) mixed waste R2 = 0.59.
Figure 6.
Correlation diagrams between VOC concentration in the mechanical treatment section of A biogas plant and measured RHi parameter with regression line: R2 = 0.36.
Figure 6.
Correlation diagrams between VOC concentration in the mechanical treatment section of A biogas plant and measured RHi parameter with regression line: R2 = 0.36.
Figure 7.
Correlation diagrams between odorant concentration in the fermentation preparation section of biogas plant A and measured microclimatic parameters, with regression lines: (a) R2 = 0.96, (b) R2 = 0.34, (c) R2 = 0.33.
Figure 7.
Correlation diagrams between odorant concentration in the fermentation preparation section of biogas plant A and measured microclimatic parameters, with regression lines: (a) R2 = 0.96, (b) R2 = 0.34, (c) R2 = 0.33.
Figure 8.
Correlation diagrams between odorant concentration in the fermentation preparation section of biogas plant B and measured microclimatic parameters, with regression lines: (a) fermentation fraction R2 = 0.44, (b) fermentation fraction R2 = 0.59, (c) wastewater tank R2 = 0.39, (d) wastewater tank R2 = 0.50.
Figure 9.
Correlation diagrams between odorant concentration in the oxygen stabilisation section of biogas plant B and measured microclimatic parameters, with regression lines: (a) R2 = 0.40, (b) R2 = 0.57, (c) R2 = 0.35.
Figure 9.
Correlation diagrams between odorant concentration in the oxygen stabilisation section of biogas plant B and measured microclimatic parameters, with regression lines: (a) R2 = 0.40, (b) R2 = 0.57, (c) R2 = 0.35.
Figure 10.
Correlation diagrams between NH3 concentration in the pre-RDF storage section of biogas plant A and measured microclimatic parameters, with regression lines: (a) R2 = 0.54, (b) R2 = 0.47.
Figure 10.
Correlation diagrams between NH3 concentration in the pre-RDF storage section of biogas plant A and measured microclimatic parameters, with regression lines: (a) R2 = 0.54, (b) R2 = 0.47.
Figure 11.
Correlation diagrams between odorant concentration in the pre-RDF storage section of biogas plant B and measured microclimatic parameters, with regression lines: (a) R2 = 0.39, (b) R2 = 0.44.
Figure 11.
Correlation diagrams between odorant concentration in the pre-RDF storage section of biogas plant B and measured microclimatic parameters, with regression lines: (a) R2 = 0.39, (b) R2 = 0.44.
Figure 12.
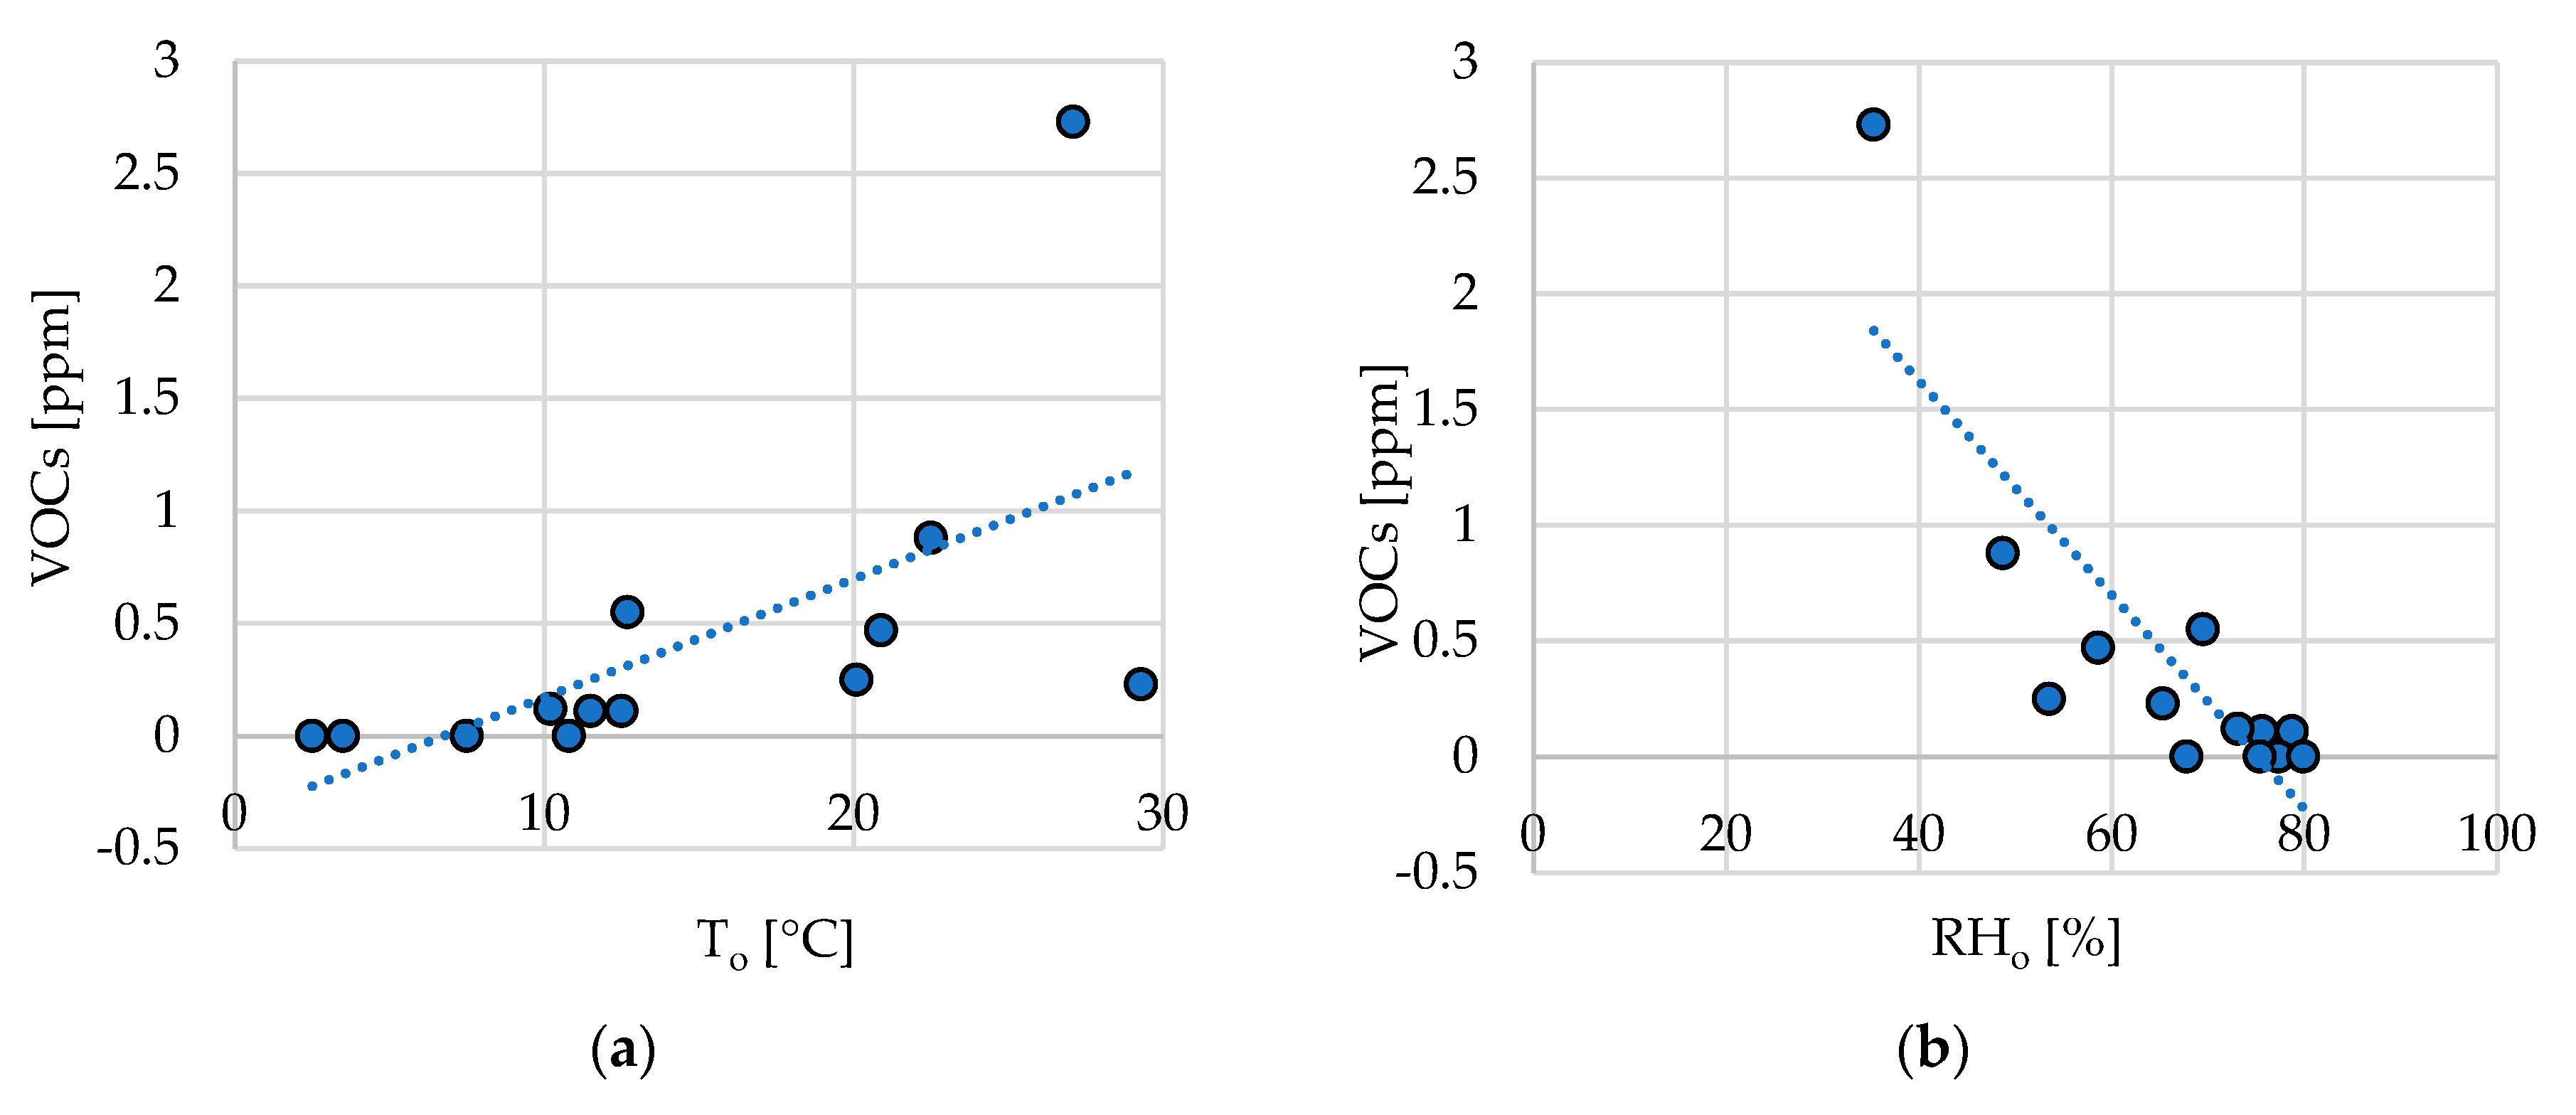
Correlation diagrams between VOC concentration in front of the mechanical treatment hall entrance at biogas plant A and measured microclimatic parameters, with regression lines: (a) R2 = 0.37, (b) R2 = 0.70.
Figure 12.
Correlation diagrams between VOC concentration in front of the mechanical treatment hall entrance at biogas plant A and measured microclimatic parameters, with regression lines: (a) R2 = 0.37, (b) R2 = 0.70.
Figure 13.
Correlation diagrams between VOC concentration in front of the mechanical treatment hall entrance at biogas plant B and measured microclimatic parameters, with regression lines: (a) R2 = 0.62, (b) R2 = 0.43.
Figure 13.
Correlation diagrams between VOC concentration in front of the mechanical treatment hall entrance at biogas plant B and measured microclimatic parameters, with regression lines: (a) R2 = 0.62, (b) R2 = 0.43.
Figure 14.
Correlation diagrams between emission from roof ventilators at biogas plant A and measured microclimatic parameters, with regression lines: (a) R2 = 0.35, (b) R2 = 0.43.
Figure 14.
Correlation diagrams between emission from roof ventilators at biogas plant A and measured microclimatic parameters, with regression lines: (a) R2 = 0.35, (b) R2 = 0.43.
Figure 15.
Correlation diagrams between emission from roof ventilators at biogas plant B and measured microclimatic parameters, with regression lines: (a) R2 = 0.67, (b) R2 = 0.47, (c) R2 = 0.41, (d) R2 = 0.58.
Figure 15.
Correlation diagrams between emission from roof ventilators at biogas plant B and measured microclimatic parameters, with regression lines: (a) R2 = 0.67, (b) R2 = 0.47, (c) R2 = 0.41, (d) R2 = 0.58.
Figure 16.
Correlation diagrams between VOC emission from biofilters at biogas plants and measured microclimatic parameters, with regression lines: (a) biogas plant A R2 = 0.39, (b) biogas plant B R2 = 0.33.
Figure 16.
Correlation diagrams between VOC emission from biofilters at biogas plants and measured microclimatic parameters, with regression lines: (a) biogas plant A R2 = 0.39, (b) biogas plant B R2 = 0.33.
Table 1.
Measurement points at the examined biogas plants.
Table 1.
Measurement points at the examined biogas plants.
| Name of Odour Source | Biogas Plant A | Biogas Plant B |
|---|
| Mark of Odour Source | Name of the Measurement Point | Mark of Odour Source | Name of the Measurement Point |
|---|
| Waste storage | a | inside the hall-centre | a | inside the hall-centre |
| b | mixed waste * | b | mixed waste * |
| c | selectively collected waste * | c | selectively collected waste * |
| Mechanical treatment | d | inside the hall—at 1.5 m ** | d | inside the hall—at 1.5 m ** |
| e | inside the hall—at 4.0 m ** | e | inside the hall—at 4.0 m ** |
| Fermentation preparation | f | fraction for fermentation * | f | fraction for fermentation * |
| g | over the wastewater tank of the pumping station | g | over the wastewater tank of the pumping station |
| Oxygen stabilization | h | waste subjected to an oxygen stabilization process * | h | waste subjected to an oxygen stabilization process * |
| i | biodegradable waste selectively collected * | i | green waste storage |
| preRDF *** storage | j | shredded preRDF fraction at the storage shelter * | j | shredded preRDF fraction storage * |
| j′ | RDF fraction subjected for biodrying |
| Deodorisation | k | biofilter surface * | k | biofilter surface * |
| Roof ventilators | l | ventilator 1—process gases captured over mixed waste | l | ventilator 1—process gases captured over mixed waste and selectively collected waste |
| m | ventilator 2—process gases captured from the hall-centre | m | ventilator 2 (dust extracting)—process gases captured from the hall-centre |
| n | ventilator 3—process gases captured from the hall of mechanical treatment | n | ventilator 3—process gases captured from the hall of mechanical treatment |
| n′ | ventilator 4—process gases captured from the hall of mechanical treatment |
| In front of technological halls | o | in front of the waste storage hall entrance | o | in front of the waste storage hall entrance |
| p | in front of the mechanical treatment hall entrance | p | in front of the mechanical treatment hall entrance |
Table 2.
Dates of measurement series at two biogas plants.
Table 2.
Dates of measurement series at two biogas plants.
| Biogas Plant A | Biogas Plant B |
|---|
| Series | Date | Series | Date |
|---|
| 1 | 05.07.2019 | 1 | 18.07.2019 |
| 2 | 18.07.2019 | 2 | 01.08.2019 |
| 3 | 01.08.2019 | 3 | 12.08.2019 |
| 4 | 12.08.2019 | 4 | 23.08.2019 |
| 5 | 23.08.2019 | 5 | 11.09.2019 |
| 6 | 19.09.2019 | 6 | 10.10.2019 |
| 7 | 10.10.2019 | 7 | 14.11.2019 |
| 8 | 14.11.2019 | 8 | 25.11.2019 |
| 9 | 25.11.2019 | 9 | 16.12.2019 |
| 10 | 16.12.2019 | 10 | 16.01.2020 |
| 11 | 16.01.2020 | 11 | 06.02.2020 |
| 12 | 06.02.2020 | 12 | 10.02.2020 |
| 13 | 11.03.2020 | 13 | 11.03.2020 |
Table 3.
Measurement results for the waste storage section.
Table 3.
Measurement results for the waste storage section.
| Biogas Plant | Measurement Series | VOCs [ppm] | NH3 [ppm] |
|---|
| a | b | c | a | b | c |
|---|
| A | 1 | 0.56 ± 0.09 | 2.21 ± 0.02 | 0.83 ± 0.01 | 1 ± 0.40 | 1 ± 0.49 | 1 ± 0.00 |
| 2 | 3.19 ± 0.29 | 12.24 ± 0.03 | 0.71 ± 0.01 | 1 ± 0.40 | 1 ± 0.00 | 1 ± 0.40 |
| 3 | 1.26 ± 0.24 | 11.73 ± 0.14 | 2.46 ± 0.04 | 2 ± 0.49 | 5 ± 0.00 | 2 ± 0.00 |
| 4 | 0.91 ± 0.16 | 3.04 ± 0.04 | 0.92 ± 0.01 | 1 ± 0.00 | 2 ± 0.00 | 4 ± 0.98 |
| 5 | 0.21 ± 0.01 | 0.76 ± 0.12 | 0.19 ± 0.00 | 1 ± 0.00 | 15 ± 1.85 | 1 ± 0.00 |
| 6 | 1.13 ± 0.02 | 3.45 ± 0.04 | 1.15 ± 0.03 | 1 ± 0.00 | 1 ± 0.00 | 1 ± 0.00 |
| 7 | 0.61 ± 0.06 | 9.42 ± 0.12 | 2.96 ± 0.05 | 1 ± 0.00 | 1 ± 0.00 | 1 ± 0.00 |
| 8 | 0.44 ± 0.13 | 2.08 ± 0.14 | 0.47 ± 0.01 | 2 ± 0.40 | 2 ± 0.00 | 6 ± 1.10 |
| 9 | 0.45 ± 0.10 | 2.07 ± 0.17 | 0.21 ± 0.01 | 0 ± 0.00 | 0 ± 0.00 | 0 ± 0.00 |
| 10 | 0.48 ± 0.01 | 0.88 ± 0.01 | 0.51 ± 0.01 | 1 ± 0.00 | 1 ± 0.00 | 1 ± 0.00 |
| 11 | 0.64 ± 0.01 | 0.26 ± 0.01 | 0.70 ± 0.01 | 0 ± 0.00 | 1 ± 0.00 | 1 ± 0.00 |
| 12 | 0.23 ± 0.00 | 0.88 ± 0.02 | 1.01 ± 0.01 | 0 ± 0.00 | 1 ± 0.00 | 1 ± 0.00 |
| 13 | 0.93 ± 0.01 | 3.25 ± 0.01 | 1.30 ± 0.01 | 1 ± 0.00 | 1 ± 0.00 | 1 ± 0.00 |
| B | 1 | 3.53 ± 0.13 | 15.13 ± 0.10 | 3.79 ± 0.16 | 2 ± 0.49 | 4 ± 0.49 | 2 ± 0.00 |
| 2 | 0.67 ± 0.04 | 8.72 ± 0.06 | 4.24 ± 0.12 | 1 ± 0.49 | 1 ± 0.00 | 1 ± 0.00 |
| 3 | 0.37 ± 0.03 | 2.55 ± 0.47 | 0.83 ± 0.01 | 1 ± 0.00 | 48 ± 4.91 | 6 ± 0.00 |
| 4 | 0.80 ± 0.05 | 0.93 ± 0.03 | 0.93 ± 0.02 | 2 ± 0.00 | 6 ± 0.40 | 2 ± 0.00 |
| 5 | 8.89 ± 2.49 | 18.66 ± 1.28 | 7.86 ± 0.12 | 1 ± 0.00 | 11 ± 1.02 | 2 ± 0.00 |
| 6 | 0.71 ± 0.09 | 4.29 ± 0.03 | 1.39 ± 0.06 | 2 ± 0.00 | 3 ± 0.00 | 2 ± 0.49 |
| 7 | 0.52 ± 0.01 | 10.31 ± 0.28 | 3.24 ± 0.07 | 2 ± 0.00 | 3 ± 0.00 | 2 ± 0.00 |
| 8 | 0.66 ± 0.01 | 4.87 ± 0.31 | 1.60 ± 0.01 | 0 ± 0.00 | 1 ± 0.00 | 0 ± 0.00 |
| 9 | 1.12 ± 0.04 | 1.51 ± 0.03 | 0.75 ± 0.02 | 1 ± 0.00 | 3 ± 0.00 | 1 ± 0.00 |
| 10 | 0.09 ± 0.01 | 1.01 ± 0.01 | 0.29 ± 0.02 | 0 ± 0.00 | 0 ± 0.00 | 0 ± 0.00 |
| 11 | 0.71 ± 0.02 | 8.72 ± 0.03 | 8.34 ± 0.03 | 1 ± 0.00 | 1 ± 0.00 | 1 ± 0.00 |
| 12 | 1.10 ± 0.03 | 8.52 ± 0.03 | 7.95 ± 0.04 | 1 ± 0.00 | 1 ± 0.00 | 1 ± 0.00 |
| 13 | 1.10 ± 0.03 | 5.85 ± 0.03 | 1.55 ± 0.01 | 1 ± 0.00 | 2 ± 0.00 | 3 ± 0.40 |
Table 4.
Measurement results for the mechanical treatment section.
Table 4.
Measurement results for the mechanical treatment section.
| Biogas Plant | Measurement Series | VOCs [ppm] | NH3 [ppm] |
|---|
| d | e | d | e |
|---|
| A | 1 | 0.33 ± 0.07 | 0.57 ± 0.05 | 0 ± 0.00 | 0 ± 0.00 |
| 2 | 0.58 ± 0.01 | 0.89 ± 0.01 | 1 ± 0.00 | 1 ± 0.00 |
| 3 | 1.75 ± 0.06 | 2.90 ± 0.08 | 1 ± 0.00 | 2 ± 0.00 |
| 4 | 0.17 ± 0.02 | 0.58 ± 0.09 | 1 ± 0.00 | 1 ± 0.00 |
| 5 | 1.27 ± 0.06 | 1.14 ± 0.07 | 1 ± 0.00 | 1 ± 0.00 |
| 6 | 1.15 ± 0.03 | 2.25 ± 0.07 | 1 ± 0.00 | 1 ± 0.00 |
| 7 | 0.53 ± 0.04 | 3.23 ± 0.03 | 1 ± 0.00 | 1 ± 0.00 |
| 8 | 0.27 ± 0.01 | 0.88 ± 0.19 | 2 ± 0.00 | 1 ± 0.00 |
| 9 | 0.40 ± 0.04 | 0.78 ± 0.05 | 0 ± 0.00 | 0 ± 0.00 |
| 10 | 0.65 ± 0.05 | 1.05 ± 0.03 | 1 ± 0.00 | 1 ± 0.00 |
| 11 | 0.11 ± 0.01 | 0.11 ± 0.01 | 1 ± 0.00 | 1 ± 0.00 |
| 12 | 0.13 ± 0.01 | 0.14 ± 0.01 | 0 ± 0.00 | 1 ± 0.00 |
| 13 | 0.97 ± 0.01 | 1.36 ± 0.02 | 1 ± 0.00 | 1 ± 0.00 |
| B | 1 | 1.75 ± 0.02 | 5.82 ± 0.94 | 1 ± 0.00 | 1 ± 0.00 |
| 2 | 1.07 ± 0.12 | 2.41 ± 0.28 | 1 ± 0.00 | 1 ± 0.00 |
| 3 | 0.43 ± 0.03 | 0.61 ± 0.06 | 3 ± 0.49 | 3 ± 0.40 |
| 4 | 2.61 ± 0.07 | 1.77 ± 0.24 | 2 ± 0.49 | 1 ± 0.40 |
| 5 | 5.08 ± 0.66 | 10.23 ± 1.42 | 1 ± 0.00 | 1 ± 0.00 |
| 6 | 0.69 ± 0.03 | 0.49 ± 0.05 | 5 ± 0.49 | 3 ± 0.00 |
| 7 | 0.79 ± 0.01 | 2.92 ± 0.12 | 3 ± 0.00 | 3 ± 0.00 |
| 8 | 0.55 ± 0.01 | 1.97 ± 0.05 | 0 ± 0.00 | 0 ± 0.00 |
| 9 | 0.72 ± 0.01 | 1.76 ± 0.03 | 1 ± 0.00 | 3 ± 0.00 |
| 10 | 0.03 ± 0.01 | 0.05 ± 0.01 | 0 ± 0.00 | 0 ± 0.00 |
| 11 | 0.44 ± 0.01 | 0.57 ± 0.02 | 1 ± 0.00 | 1 ± 0.00 |
| 12 | 0.35 ± 0.01 | 0.68 ± 0.01 | 1 ± 0.00 | 1 ± 0.00 |
| 13 | 1.50 ± 0.01 | 2.67 ± 0.02 | 2 ± 0.00 | 3 ± 0.00 |
Table 5.
Measurement results for the fermentation preparation technological operation.
Table 5.
Measurement results for the fermentation preparation technological operation.
| Biogas Plant | Measurement Series | VOCs [ppm] | NH3 [ppm] | H2S [ppm] | CH3SH [ppm] |
|---|
| f | g | f | g | g | g |
|---|
| A | 1 | - | 0.50 ± 0.01 | - | 0 ± 0.00 | 0 ± 0.00 | 0 ± 0.00 |
| 2 | - | 0.94 ± 0.06 | - | 1 ± 0.00 | 0 ± 0.00 | 0 ± 0.00 |
| 3 | - | 1.32 ± 0.06 | - | 1 ± 0.00 | 0 ± 0.00 | 0.1 ± 0.00 |
| 4 | - | 0.23 ± 0.01 | - | 1 ± 0.00 | 0 ± 0.00 | 0.2 ± 0.00 |
| 5 | - | 1.53 ± 0.09 | - | 2 ± 0.00 | 0 ± 0.00 | 0 ± 0.00 |
| 6 | 7.85 ± 0.49 | 0.92 ± 0.05 | 1 ± 0.00 | 1 ± 0.00 | 0 ± 0.00 | 0 ± 0.00 |
| 7 | - | 0.92 ± 0.01 | - | 1 ± 0.00 | 0 ± 0.00 | 0 ± 0.00 |
| 8 | - | 0.02 ± 0.00 | - | 0 ± 0.00 | 0 ± 0.00 | 0 ± 0.00 |
| 9 | 14.79 ± 1.87 | 0.73 ± 0.08 | 0 ± 0.00 | 0 ± 0.00 | 0 ± 0.00 | 0 ± 0.00 |
| 10 | - | 0.30 ± 0.01 | - | 1 ± 0.00 | 1.0 ± 0.00 | 1.5 ± 0.00 |
| 11 | 10.98 ± 0.66 | 0.19 ± 0.02 | 0 ± 0.00 | 0 ± 0.00 | 0 ± 0.00 | 0 ± 0.00 |
| 12 | - | 0.03 ± 0.01 | - | 0 ± 0.00 | 0 ± 0.00 | 0 ± 0.00 |
| 13 | 4.38 ± 0.07 | 0.19 ± 0.02 | 3 ± 0.00 | 1 ± 0.00 | 0 ± 0.00 | 0.1 ± 0.00 |
| B | 1 | 10.45 ± 0.03 | 1.71 ± 0.10 | 2 ± 0.00 | 25 ± 1.02 | 0 ± 0.00 | 0 ± 0.00 |
| 2 | 25.41 ± 0.06 | 2.99 ± 0.13 | 4 ± 0.40 | 17 ± 0.63 | 0 ± 0.00 | 0 ± 0.00 |
| 3 | 3.54 ± 0.03 | 3.69 ± 0.23 | 31 ± 3.03 | 100 ± 0.00 | 0 ± 0.00 | 10 ± 0.03 |
| 4 | 7.53 ± 3.03 | 3.69 ± 0.10 | 3 ± 0.40 | 37 ± 1.60 | 0.9 ± 0.01 | 1.3 ± 0.00 |
| 5 | 20.78 ± 0.06 | 2.13 ± 0.16 | 5 ± 0.40 | 33 ± 3.37 | 0.6 ± 0.01 | 0.5 ± 0.00 |
| 6 | 7.72 ± 0.03 | 2.70 ± 0.19 | 3 ± 0.49 | 54 ± 4.76 | 0 ± 0.00 | 0 ± 0.00 |
| 7 | 4.41 ± 0.16 | 2.03 ± 0.11 | 1 ± 0.00 | 3 ± 0.00 | 7.02 ± 0.00 | 10 ± 0.00 |
| 8 | 6.03 ± 0.07 | 20.38 ± 0.02 | 0 ± 0.00 | 18 ± 0.63 | 100 ± 0.00 | 10 ± 0.00 |
| 9 | 1.35 ± 0.02 | 0.90 ± 0.01 | 1 ± 0.00 | 4 ± 0.40 | 0 ± 0.00 | 0 ± 0.00 |
| 10 | 1.29 ± 0.02 | 0.17 ± 0.01 | 1 ± 0.00 | 3 ± 0.00 | 0.6 ± 0.01 | 0.6 ± 0.01 |
| 11 | 1.35 ± 0.01 | 0.01 ± 0.00 | 1 ± 0.00 | 0 ± 0.00 | 0 ± 0.00 | 0 ± 0.00 |
| 12 | 1.25 ± 0.01 | 1.95 ± 0.02 | 1 ± 0.00 | 0 ± 0.00 | 0 ± 0.00 | 0 ± 0.00 |
| 13 | 6.98 ± 0.03 | 2.70 ± 0.03 | 4 ± 0.40 | 4 ± 0.40 | 8.9 ± 0.02 | 9.8 ± 0.02 |
Table 6.
Measurement results for the oxygen stabilization technological operation.
Table 6.
Measurement results for the oxygen stabilization technological operation.
| Biogas Plant | Measurement Series | VOCs [ppm] | NH3 [ppm] |
|---|
| h | i | h | i |
|---|
| A | 1 | 16.22 ± 7.15 | 1.77 ± 0.09 | 48 ± 10.15 | 3 ± 0.40 |
| 2 | 2.35 ± 0.44 | 1.92 ± 0.06 | 36 ± 5.58 | 5 ± 0.40 |
| 3 | 0.95 ± 0.01 | 0.67 ± 0.01 | 8 ± 0.80 | 4 ± 0.00 |
| 4 | 1.20 ± 0.05 | 0.74 ± 0.02 | 8 ± 0.80 | 5 ± 0.00 |
| 5 | 6.47 ± 0.17 | 2.89 ± 0.10 | 100 ± 0.00 | 3 ± 0.40 |
| 6 | 4.53 ± 0.07 | 5.35 ± 0.11 | 8 ± 0.40 | 2 ± 0.00 |
| 7 | 3.37 ± 0.44 | 0.73 ± 0.04 | 5 ± 0.40 | 2 ± 0.00 |
| 8 | 1.03 ± 0.04 | 1.20 ± 0.05 | 20 ± 1.17 | 11 ± 0.75 |
| 9 | 3.90 ± 0.24 | 8.81 ± 0.08 | 1 ± 0.49 | 0 ± 0.00 |
| 10 | 7.49 ± 0.08 | 2.80 ± 0.15 | 0 ± 0.00 | 0 ± 0.00 |
| 11 | 11.97 ± 0.04 | 3.35 ± 0.03 | 100 ± 0.00 | 0 ± 0.00 |
| 12 | 0.55 ± 0.01 | 0.06 ± 0.01 | 7 ± 0.40 | 1 ± 0.00 |
| 13 | 0.46 ± 0.03 | 0.44 ± 0.02 | 11 ± 0.10 | 1 ± 0.00 |
| B | 1 | 1.93 ± 0.01 | 5.60 ± 0.04 | 1 ± 0.00 | 100 ± 0.00 |
| 2 | 2.54 ± 0.02 | 20.95 ± 0.40 | 2 ± 0.40 | 100 ± 0.00 |
| 3 | 1.41 ± 0.01 | 17.07 ± 0.44 | 4 ± 0.40 | 63 ± 0.49 |
| 4 | 11.00 ± 0.04 | 15.45 ± 0.04 | 100 ± 0.00 | 59 ± 0.80 |
| 5 | 1.96 ± 0.01 | 38.64 ± 0.49 | 18 ± 0.49 | 100 ± 0.00 |
| 6 | 5.02 ± 0.03 | 9.95 ± 0.03 | 4 ± 0.40 | 4 ± 0.40 |
| 7 | 0.94 ± 0.01 | 17.41 ± 0.94 | 14 ± 0.49 | 100 ± 0.00 |
| 8 | 0.23 ± 0.01 | 5.90 ± 0.03 | 0 ± 0.00 | 3 ± 0.40 |
| 9 | 0.64 ± 0.01 | 13.18 ± 0.04 | 0 ± 0.00 | 1 ± 0.00 |
| 10 | 0.55 ± 0.01 | 2.99 ± 0.01 | 0 ± 0.00 | 1 ± 0.00 |
| 11 | 0.54 ± 0.01 | 0.56 ± 0.01 | 0 ± 0.00 | 12 ± 0.40 |
| 12 | 0.49 ± 0.01 | 0.48 ± 0.01 | 0 ± 0.00 | 12 ± 0.40 |
| 13 | 4.97 ± 0.02 | 8.96 ± 0.02 | 4 ± 0.40 | 12 ± 0.49 |
Table 7.
Measurement results for the pre-RDF storage technological operation.
Table 7.
Measurement results for the pre-RDF storage technological operation.
| Biogas Plant | Measurement Series | VOCs [ppm] | NH3 [ppm] |
|---|
| j | j′ | j | j′ |
|---|
| A | 1 | 3.86 ± 0.01 | 0.43 ± 0.01 | 2 ± 0.00 | 4 ± 0.40 |
| 2 | 18.77 ± 1.42 | 0.47 ± 0.01 | 1 ± 0.00 | 1 ± 0.00 |
| 3 | 1.24 ± 0.03 | 0.32 ± 0.01 | 8 ± 0.80 | 1 ± 0.00 |
| 4 | 1.39 ± 0.05 | 0.25 ± 0.01 | 4 ± 0.40 | 1 ± 0.00 |
| 5 | 1.87 ± 0.07 | 1.81 ± 0.02 | 2 ± 0.00 | 2 ± 0.00 |
| 6 | 1.71 ± 0.05 | 2.25 ± 0.03 | 3 ± 0.00 | 2 ± 0.00 |
| 7 | 1.07 ± 0.02 | 1.27 ± 0.02 | 1 ± 0.00 | 2 ± 0.00 |
| 8 | 0.26 ± 0.01 | 0.48 ± 0.01 | 2 ± 0.00 | 4 ± 0.40 |
| 9 | 0.02 ± 0.00 | 0.32 ± 0.01 | 0 ± 0.00 | 1 ± 0.00 |
| 10 | 0.13 ± 0.00 | 0.56 ± 0.01 | 1 ± 0.00 | 1 ± 0.00 |
| 11 | 0.16 ± 0.00 | 1.35 ± 0.02 | 0 ± 0.00 | 2 ± 0.00 |
| 12 | 0.03 ± 0.00 | 0.10 ± 0.00 | 0 ± 0.00 | 1 ± 0.00 |
| 13 | 0.51 ± 0.01 | 1.29 ± 0.01 | 1 ± 0.00 | 2 ± 0.00 |
| B | 1 | 10.05 ± 0.14 | - | 1 ± 0.00 | - |
| 2 | 15.05 ± 1.28 | - | 1 ± 0.00 | - |
| 3 | 1.58 ± 0.02 | - | 30 ± 0.80 | - |
| 4 | 2.01 ± 0.01 | - | 17 ± 0.49 | - |
| 5 | 17.81 ± 1.28 | - | 4 ± 0.40 | - |
| 6 | 5.61 ± 0.09 | - | 2 ± 0.00 | - |
| 7 | 0.13 ± 0.01 | - | 2 ± 0.00 | - |
| 8 | 0.41 ± 0.01 | - | 0 ± 0.00 | - |
| 9 | 1.19 ± 0.01 | - | 1 ± 0.00 | - |
| 10 | 0.38 ± 0.01 | - | 1 ± 0.00 | - |
| 11 | 2.05 ± 0.01 | - | 1 ± 0.00 | - |
| 12 | 2.05 ± 0.01 | - | 1 ± 0.00 | - |
| 13 | 5.98 ± 0.07 | - | 2 ± 0.00 | - |
Table 8.
Measurement results in front of the technological plant buildings.
Table 8.
Measurement results in front of the technological plant buildings.
| Biogas Plant | Measurement Series | VOCs [ppm] | NH3 [ppm] |
|---|
| o | p | o | p |
|---|
| A | 1 | 0.28 ± 0 | 0.25 ± 0 | 1 ± 0 | 0 ± 0 |
| 2 | 0.56 ± 0 | 0.47 ± 0 | 0 ± 0 | 0 ± 0 |
| 3 | 0.31 ± 0 | 2.73 ± 0 | 0 ± 0 | 1 ± 0 |
| 4 | 0.25 ± 0 | 0.23 ± 0 | 1 ± 0 | 1 ± 0 |
| 5 | 0.09 ± 0 | 0.88 ± 0 | 1 ± 0 | 0 ± 0 |
| 6 | 0.11 ± 0 | 0.11 ± 0 | 1 ± 0 | 1 ± 0 |
| 7 | 0.10 ± 0 | 0.11 ± 0 | 1 ± 0 | 1 ± 0 |
| 8 | 0.24 ± 0 | 0 ± 0 | 0 ± 0 | 0 ± 0 |
| 9 | 0 ± 0 | 0 ± 0 | 0 ± 0 | 0 ± 0 |
| 10 | 0.06 ± 0 | 0.12 ± 0 | 0 ± 0 | 0 ± 0 |
| 11 | 0.07 ± 0 | 0 ± 0 | 0 ± 0 | 0 ± 0 |
| 12 | 0 ± 0 | 0 ± 0 | 0 ± 0 | 0 ± 0 |
| 13 | 0.74 ± 0 | 0.55 ± 0 | 1 ± 0 | 1 ± 0 |
| B | 1 | 0.58 ± 0 | 1.52 ± 0 | 1 ± 0 | 1 ± 0 |
| 2 | 0.24 ± 0 | 1.12 ± 0 | 0 ± 0 | 1 ± 0 |
| 3 | 0.30 ± 0 | 0.66 ± 0 | 1 ± 0 | 3 ± 0 |
| 4 | 0.32 ± 0 | 0.86 ± 0 | 2 ± 0 | 1 ± 0 |
| 5 | 0.44 ± 0 | 1.75 ± 0 | 1 ± 0 | 1 ± 0 |
| 6 | 0.21 ± 0 | 0.29 ± 0 | 2 ± 0 | 2 ± 0 |
| 7 | 0.30 ± 0 | 0.71 ± 0 | 2 ± 0 | 3 ± 0 |
| 8 | 0.11 ± 0 | 0 ± 0 | 0 ± 0 | 0 ± 0 |
| 9 | 0.91 ± 0 | 0.18 ± 0 | 1 ± 0 | 0 ± 0 |
| 10 | 0.10 ± 0 | 0.03 ± 0 | 1 ± 0 | 0 ± 0 |
| 11 | 0.71 ± 0 | 0.34 ± 0 | 1 ± 0 | 1 ± 0 |
| 12 | 0.95 ± 0 | 0.34 ± 0 | 1 ± 0 | 1 ± 0 |
| 13 | 0.75 ± 0 | 0.67 ± 0 | 1 ± 0 | 1 ± 0 |
Table 9.
Measurement results of the emissions from roof ventilators.
Table 9.
Measurement results of the emissions from roof ventilators.
| Biogas Plant | Number of Measurement Series | VOCs [kg/h] | NH3 [kg/h] |
|---|
| l | m | n | n′ | l | m | n | n′ |
|---|
| A | 1 | 0.067 ± 0 | 0.012 ± 0 | 0.012 ± 0 | - | 2.3·10−5 ± 0 | 2.3·10−5 ± 0 | 2.3·10−5 ± 0 | - |
| 2 | 0.089 ± 0 | 0.033 ± 0 | 0.060 ± 0 | - | 3.1·10−2 ± 0 | 3.1·10−2 ± 0 | 3.1·10−2 ± 0 | - |
| 3 | 0.106 ± 0 | 0.085 ± 0 | 0.097 ± 0 | - | 6.5·10−2 ± 0 | 6.5·10−2 ± 0 | 6.5·10−2 ± 0 | - |
| 4 | 0.025 ± 0 | 0.031 ± 0 | 0.032 ± 0 | - | 3.1·10−2 ± 0 | 3.1·10−2 ± 0 | 3.1·10−2 ± 0 | - |
| 5 | 0.053 ± 0 | 0.046 ± 0 | 0.055 ± 0 | - | 3.1·10−2 ± 0 | 3.1·10−2 ± 0 | 3.1·10−2 ± 0 | - |
| 6 | 0.070 ± 0 | 0.064 ± 0 | 0.064 ± 0 | - | 3.1·10−2 ± 0 | 3.1·10−2 ± 0 | 3.1·10−2 ± 0 | - |
| 7 | 0.062 ± 0 | 0.061 ± 0 | 0.062 ± 0 | - | 3.1·10−2 ± 0 | 3.1·10−2 ± 0 | 3.1·10−2 ± 0 | - |
| 8 | 0.062 ± 0 | 0.061 ± 0 | 0.062 ± 0 | - | 3.1·10−2 ± 0 | 3.1·10−2 ± 0 | 3.1·10−2 ± 0 | - |
| 9 | 0.032 ± 0 | 0.028 ± 0 | 0.029 ± 0 | - | 2.3·10−5 ± 0 | 2.3·10−5 ± 0 | 2.3·10−5 ± 0 | - |
| 10 | 0.032 ± 0 | 0.032 ± 0 | 0.032 ± 0 | - | 2.3·10−5 ± 0 | 2.3·10−5 ± 0 | 2.3·10−5 ± 0 | - |
| 11 | 0.031 ± 0 | 0.032 ± 0 | 0.031 ± 0 | - | 2.3·10−5 ± 0 | 2.3·10−5 ± 0 | 2.3·10−5 ± 0 | - |
| 12 | 0.027 ± 0 | 0.029 ± 0 | 0.028 ± 0 | - | 2.3·10−5 ± 0 | 2.3·10−5 ± 0 | 2.3·10−5 ± 0 | - |
| 13 | 0.051 ± 0 | 0.048 ± 0 | 0.050 ± 0 | - | 3.1·10−2 ± 0 | 3.1·10−2 ± 0 | 3.1·10−2 ± 0 | - |
| B | 1 | 0.264 ± 0 | 0.275 ± 0 | 0.253 ± 0 | 0.238 ± 0 | 0.063 ± 0 | 0.131 ± 0 | 0.063 ± 0 | 0.063 ± 0 |
| 2 | 0.208 ± 0 | 0.213 ± 0 | 0.205 ± 0 | 0.142 ± 0 | 0.063 ± 0 | 0.131 ± 0 | 0.063 ± 0 | 0.063 ± 0 |
| 3 | 0.086 ± 0 | 0.171 ± 0 | 0.096 ± 0 | 0.105 ± 0 | 0.271 ± 0 | 0.415 ± 0 | 0.271 ± 0 | 0.415 ± 0 |
| 4 | 0.204 ± 0 | 0.173 ± 0 | 0.151 ± 0 | 0.171 ± 0 | 0.415 ± 0 | 0.200 ± 0 | 0.131 ± 0 | 0.063 ± 0 |
| 5 | 0.199 ± 0 | 0.129 ± 0 | 0.227 ± 0 | 0.191 ± 0 | 0.131 ± 0 | 0.131 ± 0 | 0.131 ± 0 | 0.131 ± 0 |
| 6 | 0.023 ± 0 | 0.035 ± 0 | 0.028 ± 0 | 0.035 ± 0 | 0.063 ± 0 | 0.063 ± 0 | 0.131 ± 0 | 0.131 ± 0 |
| 7 | 0.066 ± 0 | 0.084 ± 0 | 0.059 ± 0 | 0.043 ± 0 | 0.063 ± 0 | 0.063 ± 0 | 0.063 ± 0 | 0.063 ± 0 |
| 8 | 0.048 ± 0 | 0.063 ± 0 | 0.064 ± 0 | 0.064 ± 0 | 0 ± 0 | 0 ± 0 | 0 ± 0 | 0 ± 0 |
| 9 | 0.080 ± 0 | 0.122 ± 0 | 0.079 ± 0 | 0.063 ± 0 | 0.063 ± 0 | 0.063 ± 0 | 0.063 ± 0 | 0.063 ± 0 |
| 10 | 0.011 ± 0 | 0.037 ± 0 | 0.009 ± 0 | 0.008 ± 0 | 0.063 ± 0 | 0.131 ± 0 | 0.063 ± 0 | 0.063 ± 0 |
| 11 | 0.022 ± 0 | 0.057 ± 0 | 0.034 ± 0 | 0.080 ± 0 | 0 ± 0 | 0 ± 0 | 0 ± 0 | 0 ± 0 |
| 12 | 0.031 ± 0 | 0.064 ± 0 | 0.040 ± 0 | 0.093 ± 0 | 0 ± 0 | 0 ± 0 | 0 ± 0 | 0 ± 0 |
| 13 | 0.083 ± 0 | 0.096 ± 0 | 0.076 ± 0 | 0.070 ± 0 | 0.200 ± 0 | 0.200 ± 0 | 0.131 ± 0 | 0.131 ± 0 |
Table 10.
Measurement results of the emissions from biofilters.
Table 10.
Measurement results of the emissions from biofilters.
| Biogas Plant | Measurement Series | VOCs [kg/h] | NH3 [kg/h] |
|---|
| k | k |
|---|
| A | 1 | 0.056 ± 0 | 0.162 ± 0 |
| 2 | 0.038 ± 0 | 0 ± 0 |
| 3 | 0.153 ± 0 | 0.078 ± 0 |
| 4 | 0.020 ± 0 | 0.162 ± 0 |
| 5 | 0.051 ± 0 | 0.248 ± 0 |
| 6 | 0.039 ± 0 | 0.078 ± 0 |
| 7 | 0.039 ± 0 | 0.078 ± 0 |
| 8 | 0.027 ± 0 | 0.148 ± 0 |
| 9 | 0.088 ± 0 | 0 ± 0 |
| 10 | 0.034 ± 0 | 0 ± 0 |
| 11 | 0.033 ± 0 | 0.335 ± 0 |
| 12 | 0 ± 0 | 0 ± 0 |
| 13 | 0.029 ± 0 | 0.078 ± 0 |
| B | 1 | 0.149 ± 0 | 4.5·10−5 ± 0 |
| 2 | 0.092 ± 0 | 6.2·10−2 ± 0 |
| 3 | 0.026 ± 0 | 1.3·10−1 ± 0 |
| 4 | 0.053 ± 0 | 1.3·10−1 ± 0 |
| 5 | 0.026 ± 0 | 1.3·10−1 ± 0 |
| 6 | 0.031 ± 0 | 1.3·10−1 ± 0 |
| 7 | 0.029 ± 0 | 1.3·10−1 ± 0 |
| 8 | 0.004 ± 0 | 4.5·10−5 ± 0 |
| 9 | 0.014 ± 0 | 6.2·10−2 ± 0 |
| 10 | 0.047 ± 0 | 6.2·10−2 ± 0 |
| 11 | 0.010 ± 0 | 4.5·10−5 ± 0 |
| 12 | 0.030 ± 0 | 4.5·10−5 ± 0 |
| 13 | 0.027 ± 0 | 1.3·10−1 ± 0 |
Table 11.
The best correlation coefficients between odorant concentrations and emissions and measured microclimatic conditions at biogas plants.
Table 11.
The best correlation coefficients between odorant concentrations and emissions and measured microclimatic conditions at biogas plants.
| Microclimatic Conditions | Odorant Concentrations/
Emissions | Correlation Coefficients | Technological Section | Biogas Plant |
|---|
| T | VOC | R | −0.9783 | Fermentation preparation | A |
| p | 0.0217 |
| VOC | R | 0.8163 | Roof ventilators | B |
| p | 0.0007 |
| VOC | R | 0.8094 | Roof ventilators | B |
| p | 0.0008 |
| VOC | R | 0.7989 | Roof ventilators | B |
| p | 0.0011 |
| VOC | R | 0.7856 | In front of technological plant buildings | B |
| p | 0.0015 |
| NH3 | R | 0.7539 | Oxygen stabilization | B |
| p | 0.0029 |
| VOC | R | 0.7349 | pre-RDF storage | A |
| p | 0.0042 |
| VOC | R | 0.7323 | Roof ventilators | B |
| p | 0.0044 |
| RH | VOC | R | −0.8393 | In front of technological plant buildings | A |
| p | 0.0003 |
| NH3 | R | −0.7670 | Fermentation preparation | B |
| p | 0.0022 |
| NH3 | R | −0.7617 | Roof ventilators | B |
| p | 0.0025 |
| NH3 | R | −0.7611 | Waste storage | B |
| p | 0.0025 |
| NH3 | R | −0.7186 | Roof ventilators | B |
| p | 0.0056 |
| NH3 | R | −0.7061 | Fermentation preparation | B |
| p | 0.0070 |


