Article

Multicriterial Evaluation of Renewable Energy Expansion Projects at Municipal Level for the Available Biomass Potential

1
Chair for Wind Power Drives, RWTH Aachen University, Campus-Boulevard 61, 52074 Aachen, Germany
2
Institute for Machine Elements and System Engineering, RWTH Aachen University, Schinkelstraße 10, 52062 Aachen, Germany
*
Author to whom correspondence should be addressed.
Energies 2020, 13(23), 6211; https://doi.org/10.3390/en13236211
Submission received: 30 October 2020 / Revised: 17 November 2020 / Accepted: 23 November 2020 / Published: 25 November 2020

Abstract

:
To reduce emissions in the energy sector and reach worldwide climate goals, further expansion of renewable energy sources (RES) is inevitable. Local opposition has increased in recent years, resulting in the need for more consideration of acceptance issues in the planning process of RES projects. To fill this gap, a method is introduced to consider the dimension of social acceptance in a holistic approach and at an early project stage. In a two-step procedure, a municipal interest profile is created, followed by an examination of possible expansion projects based on the municipal profile. Both hard and soft characteristics of a given project are assessed in combination. Using the example of two potential scenarios for biomass expansion in a given municipality in Germany, the methodology is put to the test. The results show that with the new method House of municipal Energy (HomE), the interest profile of a municipality can be quantified in a comprehensible and transparent way. It is further shown that, depending on the initial objective function of the municipality, different expansion scenarios can be advantageous. In the examined case, the larger biogas plant achieves a higher utility value, since a clearly higher local added value can be generated. A smaller plant, which is only operated with waste materials, is preferable with regard to the required area and lower environmental impact. However, the advantages of the larger plant outweigh those of the smaller plant for the investigated example.

Graphical Abstract

1. Introduction

Further expansion of renewable energy sources (RES) is inevitable to reduce emissions in the energy sector and reach worldwide climate goals. The high renewable energy potential in rural municipalities in Germany plays a crucial role to further increase the share of renewable energy in the electricity supply. In rural areas, renewable energy potential is significantly higher than in more densely populated regions [1]. Although, on an abstract level public support for the extension of RES is usually high, local opposition has increased in recent years. This phenomenon is known in the literature under the acronym NIMBY (not in my backyard) and is particularly common in the field of energy infrastructure [2]. The lack of social acceptance can delay and interrupt RES projects [3,4,5,6]. Often local stakeholders feel insufficiently involved in decision making and the sharing of burden and benefits.
The impact of renewable generation capacities for the local population tends to be quite excessive, ranging from visible changes to odor and noise emissions. On the other hand, successful RES projects bear benefits such as employment, improved image and additional income through power production [7,8]. Social acceptance has consequently been recognized as a key factor to ensure RES projects’ success and has gained increased attention in recent years [9,10,11]. In Germany, for example, legislation provides for public participation in the environmental impact assessment by the Environmental Impact Assessment Act (§§ 19, 22, 42 UVPG). However, this is essentially limited to the inspection and statement on already existing project drafts [12].
Social acceptance and active participation have been recognized as key factors [13]. It seems, however, that research in this field is not yet properly integrated into the development phase of RES projects. While it has become clear that local opposition can delay or even stop RES projects, acceptance analyses mainly occur after the success or failure of such projects [4,5,7,8]. Furthermore, the variety of characteristics of different objectives is rarely sufficiently discussed. Tools and methods of multicriteria decision analysis (MCDA) have become increasingly important here in recent years and are being increasingly used, e.g., for site evaluation and selection [14,15,16,17,18]. In project development, social aspects do not play a systemic role. Most studies on potential analysis consider technical or economic potential regardless of social and political issues [19,20,21,22,23,24,25], and those that do then consider entire nations in terms of policy making [26,27,28]. The compatibility of technoeconomic potential exploitation and local acceptance issues needs to be addressed at an early project development stage and local geographical level. The goal is to holistically gather and quantify local objectives in the context of RES expansion projects. Before realization, RES projects need to be analyzed regarding their capability to fulfill local objectives and not only fully exploit RES potential [29].
This study seizes the described state-of-the-art and tries to extend it by a new holistic MCDA method that properly implements social acceptance of municipal RES projects at an early project stage. To achieve this, the following steps are taken.
First, the application example and method are established in Section 2. Two different expansion scenarios for local biogas potential in a given pilot municipality are derived using the potential model BioPot. Following, the new method House of municipal Energy (HomE) is introduced for determining and quantifying the preferences of local stakeholders and how well these are met by a given expansion scenario. In Section 3, the results of the method application for the two scenarios are presented in the form of a utility value analysis. The paper is concluded in Section 4 and Section 5 with a short summary, discussion and outlook.

2. Materials and Methods

This paper couples two individual methods: an established model to assess the biomass potential of municipalities and a new methodology to receive utility values for given RES expansion projects. As it is still in the publishing process, the model for potential analysis (BioPot) will only be described and discussed shortly within Section 2.1 along with a presentation of the municipality investigated in this study. Section 2.2 then introduces the new method HomE, which is the core element of this paper.

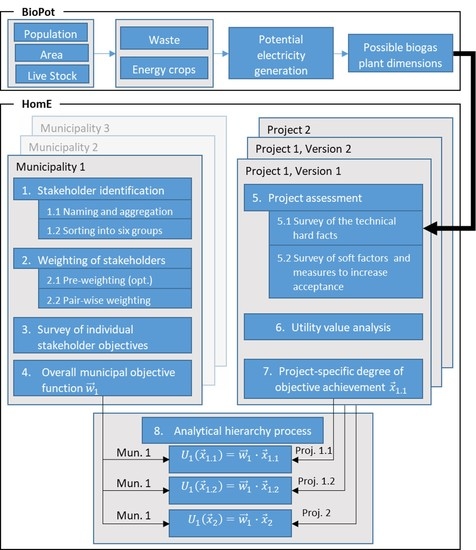
2.1. Definition of Potential Expansion Scenarios (BioPot)

BioPot is used to provide the technical and economic parameters for the investigated RES expansion scenarios. Based on the input parameters’ population area as well as livestock within the municipality, biomass availability for each month is calculated in the model. This mass flow data is the foundation for further calculating the power production from biomass in both existing and potential bioenergy power plants. In a second step, it is assessed whether the biomass mass flow exceeds the capacities of the existing bioenergy generation capacities in a given municipality. If so, suggestions for new generation capacities are developed. This is determined under consideration of a flexible operation of all bioenergy capacities. Consequently, electricity from biomass is used to balance offsets between wind and PV power feed-in and demand. Both waste products and energy crops are considered. Only the power sector is simulated, and heat and fuel sectors are neglected at this stage.
Using the example of a rural municipality in western Germany, two potential projects for planning, building and operating a bioenergy plant are designed. This municipality was chosen as it is part of the research project in which the methodology introduced by this paper is developed. In this municipality, the progress in RES expansion is quite advanced. Biogas, wind energy and solar energy plants are installed in large numbers; thus, there is already significant expertise in place to build upon. The municipality has 10,588 inhabitants in an area of 192.17 km2. Roughly half of the area is used for agriculture, leading to good suitability for bioenergy. There are already six biogas plants on site with rated power between 75 kW and 735 kW.
For the described municipality, two scenarios are developed for planning, building and operating a bioenergy power plant using the introduced model BioPot. The total potential of 35 GWhel/a for power production from biomass is calculated, whereas the biomass consists of 53.3% of energy crops and 46.7% of waste products. In both scenarios, it is assumed that the established plants are operated according to this ratio. This is important to determine the composition of the residual biomass for new bioenergy plants after supplying the existing plants. In Scenario A, the residual biomass is fully used, resulting in a 4 MW bioenergy power plant. In Scenario B, the potential is only partially exploited in a 1.2 MW power plant. In both scenarios, the potential plant uses primarily waste products. If these are not sufficient for the assumed plant operation, energy crops are included. The new plant operates at maximum profit, oriented towards the EEG2017 funding structure. The funding structure consists of a flexibility bonus of 40 €/kW and a fixed feed-in tariff per kilowatt-hour. The latter is determined by competitive tendering for new installations with an installed capacity exceeding 150 kW. Funding is only granted for the share of the electricity volume generated in a calendar year that corresponds to a rated power of 50% of the installed capacity [30]. This incentive structure aims at high rated power and low to medium full load hours. This is to enhance bioenergy as a flexible generation unit to compensate for wind and solar power fluctuations. Annual costs include investment costs allocated linearly over the lifetime, annual fixed costs and annual variable costs [31]. Figure 1 shows the profit curves for each scenario. The course of the blue and orange curves, respectively, follow the EEG2017 funding scheme. The characteristic knee in both the blue and orange profit curves is due to this incentive structure. The costs increase continuously with rising full load hours (FLH), whereas the revenue changes its pattern. Up to the point of 4380 FLH per year, both the revenue of direct selling and the flexibility bonus are gained:
R < 4380 FLH = R direct + R flex
R direct describes revenue from direct marketing, depending on fed-in power [ kWh ] . R flex describes revenue from the flexibility bonus, proportional to installed capacity [ kW ] . This flexibility bonus is lost when 4380 FLH per year are exceeded because it is assumed that the plant does not use its capacity in a variable manner but rather in a comparatively constant manner:
R > 4380 FLH = R direct
In Figure 1, profit curves are shown, with the profit being a result of revenue-less costs. While the characteristic knee is a result of the incentive structure, the difference between the blue and orange curve patterns is a result of different cost structures within the scenarios. In Scenario A, energy crops are used to supply the 4 MW bioenergy power plant, whereas in Scenario B, waste products in the municipality are sufficient to supply the 1.2 MW power plant. Consequently, no costs for fuel provision incur in this scenario. The dotted (Scenario A) and solid (Scenario B) black lines show the possible combinations of rated power and full load hours for the determined potential in power production from bioenergy. Computations show that the plant should be operated at exactly 4380 full load hours per year for maximum profit. The maximum profit operation mode is marked as the intersection with the highest possible profit curve.
In Scenario A, the 4 MW bioenergy power plant generates an annual power production of 17,529 MWh. The profit amounts to 1,167,859 €/a, resulting in a specific profit of 292 €/(kW×a). The new plant requires a cultivation area of 385 ha of energy crops. The municipality’s degree of self-sufficiency solely by generating electricity from biogas is 79.50%. The electricity demand is completely covered by biogas at a total of 3396 h/a.
In Scenario B, only one-third of the remaining bioenergy potential is used, resulting in 1.274 MW rated power and an annual power production of 5580 MWh. In comparison to Scenario A, the total profit decreases to 457,301 €/a. However, the specific profit increases to 359 €/(kW×a). Due to the lower rated power, a plant operation fully on waste products is possible. Consequently, neither money is spent, nor land is used on energy crop cultivation, leading to lower total costs. In addition, the smaller power plant causes less odor nuisance. Both aspects potentially lead to a higher acceptance in the population. Table 1 lists the technical characteristics of each scenario.

2.2. Introduction of the New Method HomE

In Section 2.2.1 and Section 2.2.2, the new methodology HomE for determining individual project utility values is introduced. The method includes a two-step procedure. First, a municipal interest profile is created. Possible RES expansion projects are then examined and evaluated based on the municipal profile. Figure 2 shows a simplified process scheme of the overall methodology and models used.
As a first step, multicriteria objective functions for municipalities are captured. These are then used to evaluate different RES expansion projects holistically against each other in a utility value analysis according to Refflinghaus [32]. The method is based on the House of Quality from the Quality Function Deployment [33]. It is therefore referred to in the following as the House of municipal Energy (HomE). The general idea of HomE is to calculate a utility value U i j for a given municipality i and RES expansion project j. To measure utility, nine predefined objectives are given that can be affected by RES expansion projects, namely: Public Participation, Regionalization, Climate Education, Environmental Protection, Technology Development, Local Added Value and Welfare, Independence, Image Improvement and Organization and Structure. The objective areas are based on literature research and an expert survey during a project workshop with representatives from two German municipalities [34,35,36,37,38]. It is important for the transferability of the methodology that the same nine objectives are always given. They must therefore be comprehensive and generally valid. It was found that the objectives mentioned above fulfill these requirements. A short description of each objective is given in Appendix A.
By using HomE, an individual weighting w i between the nine objective areas is determined for a municipality i. A degree of objective achievement x j is determined for each RES expansion project j. The project utility value is then calculated as follows.
U i j ( x j ) = w i · x j
This approach intends to reduce the complex evaluation of an expansion project down to a scalar utility value. This utility value always lays between 0% and 100%, whereby larger utility values are preferable. In a differential examination of several expansion projects, the project with the highest utility value should be implemented. Several expansion projects (alternatives) can be compared with each other in an analytical hierarchy process. Section 2.2.1 and Section 2.2.2 will explain how w i and x j are calculated.

2.2.1. Determination of the Individual Weighting Vector w i

To determine an individual objective weighting, the presented method follows a three-step approach. First, stakeholders who could potentially be affected by local RES expansion projects are identified. Both actively and passively involved stakeholders and stakeholder groups are registered and sorted into one of six groups: Public Sector, Private Persons, Utility Industry, Science and Education, Industry, Trade and Services and Multipliers. These groups were also developed in a project workshop together with representatives from local authorities, industry and research. Similar stakeholders with the same interest can be aggregated (e.g., “3 schools” instead of “School A,” “School B” and “School C”). The aggregated stakeholder group then receives a single weighting value.
In the next step, all stakeholders are given a weighting. An integer, linear scale is used. The maximum value can be adjusted according to the total number of all stakeholders.
Finally, the identification of each stakeholder with the nine given objectives is assessed. Identification values follow a logarithmic scale with the values 0, 1, 3 and 9 (none/weak/moderate/strong identification). The logarithmic scale causes interest peaks to stand out more and be identified more easily in the final results. The relevance of an objective is calculated by multiplying the weighting and identification of each stakeholder and then summarizing these values. To gain percentage values, the relevance values are normalized to 100%. This approach corresponds directly to the House of Quality (HoQ) as described by Hauser, except that the requirements are replaced by the stakeholders, and the functions are replaced by the objectives [33]. Figure 3 shows a comparative view of the House of Quality (HoQ) and the House of municipal Energy (HomE) to illustrate the similarity. The final percentage values of HomE can be interpreted as the overall relevance of an objective for the municipality. Thus, they provide the desired weighting vector w i .
This approach aims for a transparent and dynamic cross-section of individual interests along the entire municipality. Every stakeholder should be able to see how their own interests have been incorporated into the overall objective function. To ensure representative results, a dynamic and subsequent adjustment of the individual stakeholder profiles should be allowed.

2.2.2. Determination of Project-Specific Degree of Objective Achievement x j

The degree to which the given objectives are achieved by a RES expansion project is determined by means of a multistage utility value analysis. For a utility analysis according to von Colbe and Witte, single-objective criteria are identified and weighted. The partial utilities and the total utility value are then determined [39].
To derive the degree of achievement of an objective, various soft and hard factors that influence the objective are evaluated. Soft factors can directly or indirectly increase the social acceptance of a RES expansion project, e.g., informative events or surveys of local residents. Hard factors mean technical and economical details of a project such as energy yield, nominal power, land consumption or profit. Each measure contributes to the calculation of the utility value with its specific weighting. Two different types of soft criteria are defined for the given method: multiple-choice criteria and exclusive criteria. Most measures are implemented as multiple-choice. Only whether the measure is executed or not is relevant. In this case, the more measures implemented, the greater the utility value becomes. For some measures, however, it is necessary to select from various options that are mutually exclusive. For example, the criterion Legal Form of the Operator is recorded as an influence on the objective value Public Participation. In this case, the legal form “e.V.” (registered association) achieves a higher value than the legal form “GmbH” (limited liability company). Some measures influence several objectives at the same time. For example, the selection of the Legal Form of the Operator is also relevant for the objective Local Added Value and Welfare.
Consequently, the project is assigned a degree of achievement between 0% and 100% for each objective where 100% is always the best case and 0% is the neutral case. Figure 4 displays how different acceptance measures affect the degree of objective achievement on the example of Public Participation. Each of the nine main objectives is divided into subobjectives. Each subobjective receives a score ranging from 1 (low impact) to 10 (maximum impact) according to its impact on the upstream objective. The relative weight of a subobjective then results from normalization based on the sum of all points assigned. At the beginning of each chain, there must be an executable measure (multiple-choice measure) or an exclusive project criterion.
In the example given in Figure 4, a project with a Project Website, active Social Media and an Info Board would score 45% (=17% + 17% + 11%) for subobjective 1.2.1 (Information). This, respectively, increases the Public Project Engagement by 14% (=45% × 31%) and finally leads to 7% (=14% × 50%) of objective achievement in Public Participation.
To classify the benefit of acceptance measures, the allocated costs must be considered. Measures that affect multiple objectives at the same time are particularly interesting since the costs are incurred only once. In current studies, a total of 74 acceptance measures and relevant project criteria have been identified. For the sake of clarity and simplicity, this paper will only focus on five representative measures, namely Project Website, Guided Tours, Info Board, Information Letter and Citizen’s Panel. The remaining measures can be found in the supplementary materials of this paper. The costs for the assessed measures are assumed based on current market prices and offers. For further detail, see Table A2 and Table A3.

3. Results

For this paper, the new method HomE described in Section 2.2 is used to evaluate Scenarios A and B presented in Section 2.1. The goal is to identify a preferential expansion project. The results of this study will be presented in the following three subsections. First, the stakeholder distribution and weighting vector of the investigated municipality will be shown in Section 3.1. Subsequently, in Section 3.2, the two project scenarios are discussed in terms of objective achievement. Finally, Section 3.3 will address the overall utility value of both projects and their interpretation.

3.1. Municipal Stakeholder Analysis and Weighting Vector w i

The investigated municipality identified and named a total of 91 stakeholders. This includes individual persons and entities such as the local major as well as aggregated stakeholder groups such as banks and financial institutions. The stakeholders were assigned to the six stakeholder groups. The supplementary materials of this paper contain a complete version of the filled-out HomE where all stakeholder identifications can be traced. In the following, results are discussed based on the stakeholder groups only.
For the stakeholder weighting, a linear scale from 0 to 20 was used where 0 means no relation and 20 means maximum relation to local RES expansion projects. Table 2 shows the weighting results for the stakeholder groups.
In the given case, the stakeholder groups Public Sector and Multipliers have by far the biggest impact at 24% and 28%. This is due to the high number of stakeholders in these groups and the comparatively high average weight. In almost all stakeholder groups, a broad spectrum of the given scale was used. Only for the group Industry, Trade and Services was a rather low average weight of 6.19 was assigned.
According to the interviewed municipal representatives, in this municipality, RES projects are mainly promoted by local politics with the involvement of the utility industry. Local media and multipliers as well as research institutions act as catalysts and strong supporters. This picture corresponds well with the surveyed stakeholder weights.
In the next step, the objective weightings for each individual stakeholder are assessed in collaboration with the municipality (Section 2.2.1). The results are shown in Figure 5, aggregated by stakeholder groups alongside a radar chart of the final weighting vector w i .
Here, it becomes clear which stakeholders follow which goals. All stakeholder groups seem to have a certain interest in Regionalization, whereas only the Public Sector has some interest in Organization and Structure. Overall, for this municipality, Image Improvement and Regionalization are two objectives with distinct relevance peaks, whereas Organization and Structure is an objective of secondary interest. Again, these results were discussed with municipal representatives and found to be comprehensible. The municipality under study is comparatively small and benefits from short, uncomplicated administrative procedures. Therefore, projects with high organizational effort do not pose significant challenges. On the other hand, the municipality already has a positive ecological image and strong regional solidarity and benefits from the resulting media attention and immigration. These trends are captured well by the surveyed weighting vector.
Besides the comprehensibility of the resulting weighting vector, the municipal representatives stated the transparency of the method to be particularly beneficial. The quantification of results was also found to be well suited as a basis for discussion in the municipal dialog.

3.2. Objective Achievement of the Investigated Expansion Scenarios A and B

For this study, the procedure for determining project utility values presented in Section 2.2 is applied to Scenarios A and B described in Section 2.1. Table A1, Table A2 and Table A3 in the Appendix A give an overview of the regarded technical and economical parameters as well as acceptance measures.
None of the listed criteria affect the objectives Image Improvement or Organization and Structure. These two objectives have a utility value of 0% in the case under examination and are therefore not considered further in the following.
The calculation of objective achievement for Public Participation, Regionalization, Climate Education, Technology Development, and Independence follows exactly the approach as described in Section 2.2.2 and Figure 4. However, there is a slightly different procedure for Local Added Value and Environmental Protection, which will be briefly described below.
The objective Local Added Value measures the financial benefit that a renewable energy project generates for the municipality. According to Hirschl et al., this includes all profits (after tax) generated by companies that are residents in the municipality, the net income of the employees involved in the project and, finally, the taxes paid to the municipality as a result of the project [36]. Table 3 shows the specific municipal value-added effects for different RES technologies over 20 years according to Hirschl et al. A distinction is made between four value-added stages.
These values are used as a reference for evaluating the degree of objective achievement. For all the technologies examined, an overall view is taken of the maximum added p m a x value that could be achieved by exploiting the entire available potential. This value is then set in relation to the value-added p j actually achieved in the project j and compared to the degree of target achievement according to Formula (4). The quadratic form considers the decreasing marginal utility of additional profits.
x j , 6 = 0.75 · ( p j p m a x ) 2 + 1.75 ( p j p m a x )
In the given case, only two biogas plants are compared against each other. The maximum available capacity according to Section 2.1 is 4002 kW. In conclusion, the maximum possible added value is 29,474,730 EUR. Plant profits p A and p B for Scenarios A and B is also given in Section 2.1. It is assumed that plant production as well as planning and installation are not executed by local companies hence they do not yield any added value.
To calculate the degree of objective achievement for Environmental Protection, another comparative and literature-based approach across technologies is pursued. For the subobjectives Primary Energy Consumption, Greenhouse Gas Emissions, Acidification and Air Pollutants, a comparative consideration is made for how much can be saved in comparison to coal and gas power plants of the same dimensions in terms of annual energy production. To determine the utility value for the Area Consumption, values for the technology-specific space requirement were compiled. These values are listed with the corresponding utility values in Table 4. Since roof space is usually not available for other purposes, PV roof systems have an effective space requirement of 0 [40,41]. Utility values for area consumption a c j are calculated in a similar manner as for the Local Added Value following Formula (5).
x j , 4.5 = 0.6 · ( a c j a c m a x ) 2 1.6 ( a c j a c m a x )
With the given procedure, different utility values for both scenarios can be obtained. Figure 6 shows the unweighted degree of objective achievement x j for both scenarios.
Both scenarios achieve the same utility value in the objectives Public Participation, Regionalization, Climate Education and Technology Development. This is because both alternatives assume the same technology and the same acceptance measures. For Environmental Protection, the plant from Scenario B performs slightly better due to the smaller area requirement. On the other hand, the plant from Scenario A achieves significantly better values for Local Added Value and Independence. This is because of the higher profits being achieved due to economies of scale and more electricity being fed into the local supply. Even though Scenario A seems superior due to its wide lead in added value, there is no strict dominance in the given case.

3.3. Utility Value of the Investigated Scenarios and Recommended Concept

The final utility value is achieved by combining the municipal objective function with the project-specific degrees of objective achievement. Figure 7 shows the results above weighted with the municipal profile from Section 3.1. It can be observed how the Regionalization overhauled Public Participation and Climate Education in utility. Overall, however, the municipal objective function leads only to a marginal deformation of values in this case. According to the previous application of the method, this is not always the case.
By adding the weighted partial benefits, the overall utility values U A and U B of both options for action are determined. Figure 8 distinguishes between the base utility value of an option based on the technical hard facts and the additional utility value based on acceptance measures.
It becomes visible that despite the given acceptance measures, Scenario A always achieves the higher utility value and should be the preferred option. Due to the significantly higher profits in Scenario A, this appears comprehensible and as expected. In both scenarios, an increase in the utility value of 4% can be achieved by executing the acceptance measures described in Section 2.2.2.

4. Summary, Discussion and Outlook

In this study, a new method called HomE for the multicriteria evaluation of RES expansion projects in the planning phase was presented. The method was applied exemplarily onto two expansion scenarios in the biomass sector derived with the potential model BioPot. With the examined methodology, it was possible to quantify soft and hard influencing factors and thus make them uniformly comparable. Finally, it was shown how the calculated utility value can be used to perform an analytical hierarchy process to derive discrete decisions for action. This was achieved through the reduction of the complex, multidimensional decision situation to a scalar and transparent evaluation quantity—the utility value.
The supposedly unambiguous evaluation parameter, however, must be viewed critically. At the current state, only positive utility values can be created. The method is therefore based on the assumption that every RES project improves the situation of the community at least marginally. This poses a strongly generalizing simplification. Overall cost should always be regarded alongside the utility value. Its informative value is essentially based on a difference analysis between different options for action. A standalone project can hardly be evaluated regarding its usefulness. Consequently, HomE cannot be used to replace conventional technoeconomic valuation approaches. It can only provide a complementary contribution.
The factors that influence social acceptance are most certainly incomplete. A further extension of the currently considered acceptance measures and relevant project characteristics is necessary. The modular structure of the presented method is intended to enable subsequent extensions for this purpose.
Compared to existing models, the presented method is still at an early development stage and poses a rather rough procedure. The applicability for municipal decision makers at a reasonable expenditure of time may be advantageous compared to other models that are more complex or purely analytical. In previous implementations, the time required for municipal representatives to fill out HomE amounted to a few hours. Thus, theoretically, a first set of results can be achieved within one working day, e.g., during a workshop with different local representatives.
HomE can be of interest for different use cases and users. The method can be technically executed by a single person, e.g., from the local planning and administration or a researcher. Of course, the more stakeholders are actively involved in filling out HomE, the more representative the weighting function becomes. The weighting and parameterization of all subobjectives must not be adjusted by the user. This is to enable transferability of the methodology for different municipalities.
In future work, more use cases shall be integrated to derive a sensitivity analysis for the weighting method. Thus, the whole method can be further improved. More municipalities need to be surveyed regarding their individual stakeholders and interests. Accordingly, a clustering of municipal profiles can be developed, leading to reduced effort in a survey for future analyses. Furthermore, the method needs to be applied to more expansion projects, also integrating other sources of energy or electricity storage and demand-side projects. In this context, both potential analysis methods, such as BioPot, and real planned expansion projects in collaborating municipalities can be of interest.

5. Conclusions

The main objective of this study, namely the development, testing and first application of a new MCDA method for the holistic assessment of RES projects at a municipal level, was achieved. The HomE method allows an early and joint consideration of social acceptance factors alongside classical, technoeconomic design criteria in the planning phase of RES projects. The method provides a clear result for the case study under investigation. The higher utility value is to be interpreted in the sense that the scenario with the larger plant should be preferred.
The method proved to be robust with regard to its practical suitability when applied by the pilot municipality. It is important to note that the present application of the method is an individual case study from which no generalizations should be derived yet; however, in perspective, this is possible. For this reason, the authors consider HomE to be a useful extension of the state-of-the-art and the toolbox of MCDA and recommend that it should be pursued further in accordance with the extensions proposed in Section 4.

Supplementary Materials

The following are available online at https://www.mdpi.com/1996-1073/13/23/6211/s1, Figure S1: HomE anonymized, Table S1: Acceptance measures and weighting.

Author Contributions

Conceptualization, L.S. and L.B.; methodology, L.B.; software, L.S. and L.B.; validation, L.S. and L.B.; writing—original draft preparation, L.S. and L.B.; writing—review and editing, R.S.; visualization, L.B.; supervision, R.S. and G.J.; project administration, L.S. and L.B.; funding acquisition, L.S. and R.S. All authors have read and agreed to the published version of the manuscript.

Funding

This research was funded by the German Federal Ministry for Economic Affairs and Energy, grant number 03ET4070A. The APC was also funded by the German Federal Ministry for Economic Affairs and Energy.

Conflicts of Interest

The authors declare no conflict of interest. The funders had no role in the design of the study; in the collection, analyses, or interpretation of data; in the writing of the manuscript, or in the decision to publish the results.

Appendix A

Table A1. Elaborated main objectives and a short description.
ObjectiveShort Description
1Public ParticipationThe Public Participation expresses that the citizens of a municipality are financially and participatively involved in the design of the local energy system. The aim is to communicate openly and seek dialog with the citizens. In addition, citizens should be offered opportunities to participate financially or otherwise in RES projects.
2RegionalizationThe regionalization deals with cohesion in the community. The citizens should develop a sense of belonging and willingly identify with the municipality. This is achieved through the participation of citizens in renewable energy projects and a municipal orientation of the energy system.
3Climate EducationThe (climate) education deals with different ways of familiarizing the population with the topic of local energy supply. To reach citizens and especially young people, a systematic transfer of knowledge is necessary. Influences on politics and important persons in the community are also considered. In addition, positive effects can be achieved through the transformation of learning and teaching environments.
4Environmental ProtectionEnvironmental Protection has its focus on the protection of nature. Sustainable, conscious (consumer) behavior and the expansion of renewable energies should contribute to a reduction of pollutant emissions. At the same time, the impairment of the habitat by RE plants should be kept to a minimum.
5Technology DevelopmentThe objective Technology Development is to determine the extent to which various renewable energy projects contribute to technological progress in the energy industry. Due to their proximity and familiarity with the players involved, municipalities can facilitate the first practical applications of innovative ideas and thus contribute to the faster marketability of products and business models. RE projects should therefore be evaluated with regard to their innovativeness.
6Local Added Value and WelfareThe main question of this objective is to what extent renewable energy projects contribute to local value creation and what economic benefits are generated by different renewable energy projects. This includes, for example, the profits (after tax) generated by participating companies (after tax) allocated in the municipality, the net income of employees involved in the project and, finally, the taxes paid to the municipality as a result of the project.
7IndependenceThis objective is about how self-sufficient a municipality is. This includes, for example, the degree of autarky of the energy system and the extent to which citizens and local businesses are involved in decisions and developments affecting the energy system.
8Image ImprovementImage Improvement deals with the change of the external image of the municipality through RES projects. The aim is to promote high-profile topics such as CO2 savings, the creation of additional jobs and the expansion of renewable energies, thus increasing the attractiveness of the municipality.
9Organization and StructureThe question stands in the foreground, in how far an additional organizational expenditure in the municipality, caused by the regarded RES project results and whether even possibly restructuring measures are necessary within the municipality, to fulfill the requirements of the project.
Table A2. Exclusive project criteria and parameters.
Exclusive Criteria
(Technical and Economical)
Value
(Scenario A)
Value
(Scenario B)
Affected Objectives
Annual Power Production17,529 MWh5580 MWhEnvironmental Protection
Annual Profit8,846,600 EUR4,222,200 EURLocal Added Value
Self-sufficiency79.50%52.72%Independence
Area Consumption385 ha0 haEnvironmental Protection
Sales ConceptEEG supportedEEG supportedTechnology Development, Independence, Regionalization
Degree of InnovationLate majorityLate majorityTechnology Development
Share of Local Financing100%100%Regionalization, Independence
Table A3. Multiple-choice criteria.
Multiple-Choice Criteria
(Acceptance Measures)
CostAffected ObjectivesUtility Value Increase
Project Website1260 EURPublic Participation,
Climate Education
0.28%
Guided Tours1000 EURPublic Participation, Climate Education, Regionalization1.52%
Info Board450 EURPublic Participation, Climate Education0.97%
Information Letter150 EURPublic Participation0.84%
Citizen’s Panel9390 EURPublic Participation0.22%
Sum12,250 EUR 3.83%
The prices for an Information Board are assumed between 100 and 400 EUR for purchase, shipping and installation, as well as 50 EUR for maintenance. The printing of an Information Letter is similarly inexpensive. For a municipality with 10,000 inhabitants and 3.1 persons per household (assumption for a rural municipality), the costs are between 50 and 150 EUR if each household receives a flyer. However, there are additional costs for the hours of work needed to distribute the flyers. Nevertheless, it is considerably more expensive to run a Project Website. Costs for setting up the website start from 1000 EUR. In addition, there are the annual costs for the operation of the website, which range between 5 and 100 EUR. A Citizen’s Panel is particularly expensive, since 25 citizens are dispensed from their work for three to four days to prepare the report. The loss of earnings for these days has to be fully reimbursed. With an average income of 23,663 EUR, the loss of earnings of 25 people for four days is 9390 EUR.
The costs of measures can fluctuate considerably and should be estimated with local experience whenever possible. In the following, the introduced method is applied to an example municipality in western Germany.

References

  1. Jenssen, T.; König, A.; Eltrop, L. Bioenergy villages in Germany: Bringing a low carbon energy supply for rural areas into practice. Renew. Energy 2014, 61, 74–80. [Google Scholar] [CrossRef]
  2. Carley, S.; Konisky, D.M.; Atiq, Z.; Land, N. Energy infrastructure, NIMBYism, and public opinion: A systematic literature review of three decades of empirical survey literature. Environ. Res. Lett. 2020, 15, 93007. [Google Scholar] [CrossRef]
  3. McKenna, R. The double-edged sword of decentralized energy autonomy. Energy Policy 2018, 113, 747–750. [Google Scholar] [CrossRef]
  4. Schumacher, K.; Schultmann, F. Local Acceptance of Biogas Plants: A Comparative Study in the Trinational Upper Rhine Region. Waste Biomass Valor. 2017, 8, 2393–2412. [Google Scholar] [CrossRef]
  5. Schumacher, K.; Krones, F.; Mckenna, R.; Schultmann, F. Public acceptance of renewable energies and energy autonomy: A comparative study in the French, German and Swiss Upper Rhine region. Energy Policy 2018, 126, 315–332. [Google Scholar] [CrossRef]
  6. McKenna, R.; Weinand, J.M.; Mulalic, I.; Petrovic, S.; Mainzer, K.; Preis, T.; Moat, H.S. Quantifying the Trade-Off between Cost-Efficiency and Public Acceptance for Onshore Wind; KIT: Karlsruhe, Germany, 2020. [Google Scholar]
  7. Musall, F.D.; Kuik, O. Local acceptance of renewable energy—A case study from southeast Germany. Energy Policy 2011, 39, 3252–3260. [Google Scholar] [CrossRef]
  8. Friedl, C.; Reichl, J. Realizing energy infrastructure projects—A qualitative empirical analysis of local practices to address social acceptance. Energy Policy 2016, 89, 184–193. [Google Scholar] [CrossRef]
  9. Bronfman, N.C.; Jiménez, R.B.; Arévalo, P.C.; Cifuentes, L.A. Understanding social acceptance of electricity generation sources. Energy Policy 2012, 46, 246–252. [Google Scholar] [CrossRef]
  10. McKenna, R.; Bertsch, V.; Mainzer, K.; Fichtner, W. Combining local preferences with multi-criteria decision analysis and linear optimization to develop feasible energy concepts in small communities. Eur. J. Oper. Res. 2018, 268, 1092–1110. [Google Scholar] [CrossRef]
  11. Diller, C.; Gardt, M.; Litmeyer, M.-L. Neutrale Akzeptanzerhebungen? TATuP 2017, 26, 58–63. [Google Scholar] [CrossRef] [Green Version]
  12. Gesetz über die Umweltverträglichkeitsprüfung in der Fassung der Bekanntmachung vom 24. Februar 2010 (BGBl. I S. 94). UVPG. 2020. Available online: https://www.gesetze-im-internet.de/uvpg/BJNR102050990.html (accessed on 24 November 2020).
  13. Komendantova, N. Transferring awareness into action: A meta-analysis of the behavioral drivers of energy transitions in Germany, Austria, Finland, Morocco, Jordan and Iran. Energy Res. Soc. Sci. 2021, 71, 101826. [Google Scholar] [CrossRef]
  14. Arca, D.; Keskin Citiroglu, H. Geographical information systems-based analysis of site selection for wind power plants in Kozlu District (Zonguldak-NW Turkey) by multi-criteria decision analysis method. Energy Sources Part A Recovery Util. Environ. Eff. 2020, 1–13. [Google Scholar] [CrossRef]
  15. Tassoult, H.; Haddad, B. Suitable Sites for CSP Power Plants Installation in Algeria. In Proceedings of the 7th International Renewable and Sustainable Energy Conference (IRSEC), Agadir, Morocco, 27–30 November 2019; pp. 1–5. [Google Scholar]
  16. Kheybari, S.; Rezaie, F.M. Selection of biogas, solar, and wind power plants’ locations: An MCDA approach. J. Supply Chain Manag. Sci. 2020, 45–71. [Google Scholar] [CrossRef]
  17. Wu, T.; Xu, D.-L.; Yang, J.-B. Decentralized energy system and its performance assessment framework based on MCDA. In Developments of Artificial Intelligence Technologies in Computation and Robotics, Proceedings of the 14th International FLINS Conference (FLINS 2020), Cologne, Germany, 18–21 August 2020; Li, Z., Yuan, C., Lu, J., Kerre, E.E., Eds.; World Scientific Publishing Company: Singapore, 2020; pp. 344–352. ISBN 978-981-12-2332-7. [Google Scholar]
  18. Sałabun, W.; Wątróbski, J.; Shekhovtsov, A. Are MCDA Methods Benchmarkable? A Comparative Study of TOPSIS, VIKOR, COPRAS, and PROMETHEE II Methods. Symmetry 2020, 12, 1549. [Google Scholar] [CrossRef]
  19. BMVI. Räumlich Differenzierte Flächenpotentiale für Erneuerbare Energien in Deutschland; Bundesamt für Verkehr und Infrastruktur: Berlin, Germany, 2015. [Google Scholar]
  20. Kelm, T.; Metzger, J.; Fuchs, A.-L.; Schicketanz, S.; Günnewig, D.; Thylmann, M. Untersuchung zur Wirkung veränderter Flächenrestriktionen für PV-Freiflächenanlagen. Kurzstudie im Auftrag der Innogy SE; ZSW: Stuttgart, Germany, 2019. [Google Scholar]
  21. Landesamt für Natur, Umwelt und Verbraucherschutz NRW. LANUV-Fachbericht 40—Teil 3 Biomasse-Energie; Landesamt für Natur, Umwelt und Verbraucherschutz NRW: Recklinghausen, Germany, 2014. [Google Scholar]
  22. Landesamt für Natur, Umwelt und Verbraucherschutz NRW. LANUV-Fachbericht 40—Teil 1 Windenergie; Landesamt für Natur, Umwelt und Verbraucherschutz NRW: Recklinghausen, Germany, 2012. [Google Scholar]
  23. Landesamt für Natur, Umwelt und Verbraucherschutz NRW. LANUV-Fachbericht 40—Teil 2 Solarenergie; Landesamt für Natur, Umwelt und Verbraucherschutz NRW: Recklinghausen, Germany, 2013. [Google Scholar]
  24. Mainzer, K.; Killinger, S.; McKenna, R.; Fichtner, W. Assessment of rooftop photovoltaic potentials at the urban level using publicly available geodata and image recognition techniques. Sol. Energy 2017, 155, 561–573. [Google Scholar] [CrossRef] [Green Version]
  25. van Hoesen, J.; Letendre, S. Evaluating potential renewable energy resources in Poultney, Vermont: A GIS-based approach to supporting rural community energy planning. Renew. Energy 2010, 35, 2114–2122. [Google Scholar] [CrossRef]
  26. Solangi, Y.A.; Longsheng, C.; Shah, S.A.A.; Alsanad, A.; Ahmad, M.; Akbar, M.A.; Gumaei, A.; Ali, S. Analyzing Renewable Energy Sources of a Developing Country for Sustainable Development: An Integrated Fuzzy Based-Decision Methodology. Processes 2020, 8, 825. [Google Scholar] [CrossRef]
  27. Pojadas, D.J.; Abundo, M.L.S. A web-based Delphi multi-criteria group decision-making framework for renewable energy project development processes. IJMDM 2020, 19, 426. [Google Scholar] [CrossRef]
  28. Neofytou, H.; Nikas, A.; Doukas, H. Sustainable energy transition readiness: A multicriteria assessment index. Renew. Sustain. Energy Rev. 2020, 131, 109988. [Google Scholar] [CrossRef]
  29. Pehlken, A.; Wulf, K.; Grecksch, K.; Klenke, T.; Tsydenova, N. More Sustainable Bioenergy by Making Use of Regional Alternative Biomass? Sustainability 2020, 12, 7849. [Google Scholar] [CrossRef]
  30. BMJV. Gesetz für den Ausbau erneuerbarer Energien—EEG; BMJV: Berlin, Germany, 2017. [Google Scholar]
  31. Koch, M. Ökologische und Ökonomische Bewertung von Co-Vergärungsanlagen und Deren Standortwahl; KIT Scientific Publishing: Karlsruhe, Germany, 2009. [Google Scholar]
  32. Refflinghaus, R. Einsatz des Analytischen Hierarchie Prozesses zur Vorbereitung der kundenspezifischen Eingangsgrößen eines Quality Function Deployments; TU Dortmund: Dortmund, Germany, 2009; p. 12. [Google Scholar]
  33. Hauser, J.R.; Clausing, D. The House of Quality: Design is a team effort, but how do marketing and engineering talk to each other? Harv. Bus. Rev. 1988, 63–73. Available online: https://hbr.org/1988/05/the-house-of-quality (accessed on 24 November 2020).
  34. Berlo, K.; Wagner, O. Stadtwerke-Neugründungen und Rekommunalisierungen. Energieversorgung in kommunaler Verantwortung; Bewertung der 10 wichtigsten Ziele und deren Erreichbarkeit; Wuppertal Institut für Klima, Umwelt, Energie: Wuppertal, Germany, 2013. [Google Scholar]
  35. Flieger, B. Lokale Wertschöpfung durch Bürgerbeteiligung. Verb. Manag. 2011, 37, 50–57. [Google Scholar]
  36. Hirschl, B.; Aretz, A.; Prahl, A.; Böther, T.; Heinbach, K. Kommunale Wertschöpfung Durch Erneuerbare Energien; Institut für ökologische Wirtschaftsforschung: Berlin, Germany, 2010; ISBN 9783932092992. [Google Scholar]
  37. Becker, S.; Bues, A.; Naumann, M. Zur Analyse lokaler energiepolitischer Konflikte. Ski. Eines Anal. 2016, 74, 39–49. [Google Scholar] [CrossRef] [Green Version]
  38. Berlo, K.; Wagner, O. Zukunftsperspektiven kommunaler Energiewirtschaft. Raumplanung 2011, 158, 236–242. [Google Scholar]
  39. Busse von Colbe, W.; Witte, F. Investitionstheorie und Investitionsrechnung; Springer: Berlin/Heidelberg, Germany, 2018; ISBN 978-3-662-57906-0. [Google Scholar]
  40. Bayerisches Landesamt für Umwelt. Mischpult "Wärme" Information zur Berechnung. Energie-Atlas Bayern—Mischpult "Energiemix Bayern vor Ort"; Bayerisches Landesamt für Umwelt: Augsburg, Germany, 2018. [Google Scholar]
  41. Nitsch, J.; Pregger, T.; Naegler, T.; Heide, D.; Tena, D.L.; de Trieb, F.; Scholz, Y.; Nienhaus, K. Langfristszenarien und Strategien für den Ausbau der erneuerbaren Energien in Deutschland bei Berücksichtigung der Entwicklung in Europa und Global. BMU—FKZ 03MAP146; DLR: Stuttgart, Germany, 2012. [Google Scholar]
Figure 1. Profit curves for Scenarios A and B.
Energies 13 06211 g001
Figure 2. Process scheme of the presented methodology and models.
Energies 13 06211 g002
Figure 3. Comparative view of House of Quality (HoQ) and House of municipal Energy (HomE): (a) House of Quality (HoQ) from traditional quality function deployment; (b) House of municipal Energy (HomE) to assess municipal weighting function.
Energies 13 06211 g003
Figure 4. Exemplary breakdown of the degree of objective achievement for Public Participation.
Energies 13 06211 g004
Figure 5. Fillet-in HomE: stakeholder results by stakeholder groups and weighting vector w i for the investigated municipality in a radar chart.
Energies 13 06211 g005
Figure 6. Unweighted degree of objective achievement x A and x B for Scenarios A and B.
Energies 13 06211 g006
Figure 7. Weighted degree of objective achievement (partial utility values) for Scenarios A and B.
Energies 13 06211 g007
Figure 8. Overall utility values UA and UB.
Energies 13 06211 g008
Table 1. Scenario description.
CategoryScenario AScenario B
Rated power (kW)40021274
Annual power production (MWhel/a)17,5295580
Invest (€)8,846,6004,222,200
Annual profit (€/a)1,167,859457,301
Specific profit (€/(kW×a))292359
Self-sufficiency (%)79.5052.72
Full load hours (h/a)43804380
Full supply hours (h/a)33961226
Land consumption for biomass (ha)3850
Table 2. Stakeholder group results.
Stakeholder GroupNumber of StakeholdersAverage WeightingMax WeightingMin WeightingRelative Weight
Public Sector1910.3218724%
Private Persons99.3316310%
Utility Industry139.8518415%
Science and Education910.5616411%
Industry, Trade and Services166.1911212%
Multipliers259.2416328%
Sum91 100%
Table 3. Municipal value-added effects over a period of 20 years (according to [36]).
Added Value in €/kWPlant ProductionPlanning and InstallationTechnical OperationBusiness AdministrationSum
Wind Park248693807201417
Private Roof Solar Plant55029534019203105
Public Roof Solar Plant47230446019403176
Ground-mounted Solar Plant47226446012602456
Biogas Plant307271202036006198
Biomass Plant673252430021407365
Table 4. Area requirements and utility value of different renewable energy technologies.
TechnologyArea Consumption in m2/kWhUtility Value
Wind Turbine0.0250.98
Roof Solar Plant01
Ground-mounted Solar Plant0.010.99
Biogas Plant0.520.56
Biomass Plant1.670
Publisher’s Note: MDPI stays neutral with regard to jurisdictional claims in published maps and institutional affiliations.

