1. Introduction
Although mining is often considered a “dirty” industry, its growth continues. This is due to the increasing demand for raw material, especially for rare earth material, which is needed for ICT, automotive, etc. industries. Unfortunately, raw materials are non-renewable resources. Intensive development of mining requires searching for new deposits in deep parts of the Earth. This leads to an increase in the level of hazard in an underground mine. In this article, we will selectively consider gas hazards, which are the subject of many studies [
1,
2,
3,
4]. In the considered mine, the most critical gases for miner health are hydrogen sulfide (
), carbon monoxide (CO), and other NOx (gases in the nitric oxide family). They are present in mining voids because of the operation of LHDs (CO, NOx), blasting procedures (CO), and natural sources (
) [
5,
6,
7,
8].
The cost of ventilation, the geometry of the considered mine and the mining technology used make the ventilation process very difficult. Moreover, the local air quality may fluctuate and pose a threat to miners. Thus, portable, personal devices are required, in order to inform miners about gas hazards. There are tools available on the market, meeting certain requirements for that demanding environment. However, although these allow the storage of data collected during a shift, they do not allow basic analysis of the acquired data in an online mode. In addition, these solutions are extremely expensive, and it is impossible to equip all underground workers.
The main aim of this article is to develop a basic monitoring system using low-cost gas sensors and microcontrollers (hardware modules) and take advantage of commonly used smartphones as computing and visualization resources. After the shift, when the miner leaves the mine and all collected data is in the phone memory, it may be automatically transferred to the cloud. Then, using advanced analytical tools, one may perform short-term and long-term analysis, including the spatial nature of data and its random character. During the shift, the miner may use a smartphone as a computer for simple visualization of past and current values on a plot, and some basic prediction (regression models) may be easily achieved to increase awareness to the miner.
Our solution is low-cost, intuitive, easily accessible (everybody has a smartphone these days), and can also be used as a mobile data-acquisition device for long-term analysis on the surface using advanced analytical tools. It should be highlighted that using mobile phones for measurements is not a new idea; however, we have not met such an approach in underground mining. Mobile phones have been used in tele-medicine [
9], in condition monitoring [
10,
11], and environment monitoring [
12,
13]. See [
14,
15] for a review.
The rest of the paper is organized as follows: first, we will review the existing commercial products and some research activity in the area. Then, we will propose our system and in detail; each component will be described. To validate our measurement device, we performed two tests: one in laboratory conditions (to check the system’s functionalities) and a second in a real underground mine with a gas hazard. The second test covers the comparison with results obtained by commercial measurement devices used in the mine regularly. Finally, we present a discussion and conclusions.
The places for underground measurements were selected by ventilation services. The selection of the measurement locations was based on the employee knowledge, supported by previous measurements in the given exploitation areas. The measurements were taken in mining divisions where increased concentrations of gases, such as hydrogen sulfide and carbon monoxide, occur. The measurements were carried out in fresh and used air streams.
This article presents a technique for a continuous measurement of gas concentrations, which has not yet been implemented in the underground mines of KGHM Polska Miedz S.A. The measurement system created is cheaper than other measurement systems available on the market. The use of this system will contribute to increased control over the safety of underground employees. The system is in line with the global trend of the Internet of Things, where microcontrollers are used and, by means of wireless communication, with low power consumption, give the possibility of measuring environmental conditions even for as demanding environment as a deep copper ore mine.
This article highlights the benefits from the implementation of a cost-effective environmental condition assessment system in line with Industry 4.0 fundaments. Presentation of the possibilities of additive manufacturing, wireless data transmission, and a set of sensors to be used as a new monitoring tool for the ventilation crew has been made. Presented results can be used for the better understanding of changes in the underground environment thanks to continuous measurement.
2. State of the Art—Mining Atmosphere Monitoring in a Deep Mine
Air pollution is now one of the most important problems all over the world. The problem of polluted air also applies to the mine environment, where workers are exposed to gas hazards every day, especially those providing services close to the mining face. Currently, global mining is moving towards deeper and deeper parts of the rock mass. It is a significant problem to transport adequate amounts of fresh air to the excavations. Malfunction of this process causes an increase in the gas hazard. That is why the ongoing activities in the world to develop a system for monitoring air quality and pollution in real time are crucial [
16,
17,
18].
The article presents a measuring system for gases such as hydrogen sulfide and carbon monoxide. These gases are two of the most dangerous gases in the mine atmosphere. An employee who is in an environment with an increased concentration of
is exposed to various health effects depending on the value of its concentration. At values up to 5 ppm, human beings suffer from eye irritation, headaches, and nausea. At concentrations of 5–50 ppm, conjunctivitis may occur, 100 ppm—olfactory disorders. At values of about 200–750 ppm, pulmonary edema and apnea appear, and at the concentration of about 1000 ppm, immediate respiratory paralysis and death [
19,
20,
21]. The next gas analyzed is carbon monoxide. This is probably the most dangerous gas in the mine atmosphere. If an employee is exposed to this gas at a concentration of approximately 35 ppm, a slight headache may occur after 6–8 h. If the concentration is 100–200 ppm, a headache may occur after 2 or 3 h, and at 400 ppm, after 1 h. At a gas concentration of 1600 ppm, death occurs in less than 2 h, and at 12,800 ppm, a human passes away within 3 min [
22,
23].
Technologies of production of hazardous gas sensors differ from each other both based on materials detecting concentrations of elements and chemical compounds as well as by different methods of physical quantity transduction. The main groups of gas-sensing materials are metal-oxide semiconductors, conducting polymer composite, and other modern functional materials [
24]. Most sensors rely on transduction methods such as chemoresistance, quartz crystal microbalance, and MOSFET technology [
25]. Sensors with metal-oxide-sensing elements—ubiquitous for commercial purposes—use
. It absorbs gas molecules and activates reactions combined with carbon oxide detection [
26]. There are many works concerning the increasing performance of
as a gas sensor and to broaden the scope of use cases [
27,
28].
Another interesting approach for further hazardous gas sensor development is the usage of micromachining technology. Expansion of micro-electro-mechanical systems (MEMS), micro/nano-based structures, are going to play an active role in the detection industry. The measurements can be taken thanks to microcantilever deflection induced by an additional mass, attached to the end of the cantilever, which is generated by a mass gain on the sensitive element, and assigned to a specific gas concentration value. From this phenomenon, signals are taken and transformed by the Wheatstone bridge circuit. Calculation of the resonance frequency shift is made and directly the gas concentration is obtained [
29,
30,
31].
Among the measuring devices, which monitor gas concentration values in excavations, the most popular are portable gas detectors. Those devices have the possibility of reading the parameters in real time. This experiment was conducted in underground conditions, and there are several accessories for measuring gas concentrations. Most often, PAC8500 and X-am 8000 gas detectors are used to measure the gas level of CO and
. These devices, however, have only a discrete analysis function. Portable detectors are characterized by the possibility of instant assessment of the tested gas concentration [
32]. Owing to the high cost of gas meters, only gas service employees and shift supervisors are equipped with those devices. However, more and more ideas are emerging, and new technologies are under constant development. It allows us to find new opportunities for ventilation measurements. The purpose of this article is to present the gas measurement system and applies it as personal equipment for every underground worker. Moreover, we are pursued to design a new approach of cost-efficient, easy-to-deploy, IoT-networked devices with smartphone usage for data presentation and acquisition.
One of the more interesting ideas is the use of the Arduino platform, which is also used for the gas concentration meter prototype in [
33]. The popularity of smartphones creates an opportunity to design solutions with dedicated software. Among the various applications one may find one which could help to protect human health. An example is an application created for the Android operating system, which is used to assess air pollution. The application, connected to the appropriate gas sensors, sends information in real time about the state of the environment [
34]. The development of modern industry, well known as Industry 4.0, puts an enormous impact on technological progress in the field of sensor devices. Smart metering, big data analytics, and cloud computing can be applied in the mining industry too. Unification of smart sensor networks and data handling for better understanding of the environmental properties in underground conditions is now widely taken into account [
35,
36].
Due to the geometry of the mine and room-and-pillar technology, online/real-time information about gas concentration/distribution in the whole mine is technically not feasible. It is well known that the vicinity of mining faces is the most critical part of the mine. Owing to dynamic changes because of blasting procedures, there is no infrastructure in place (sensors, monitoring systems, electricity, etc.).
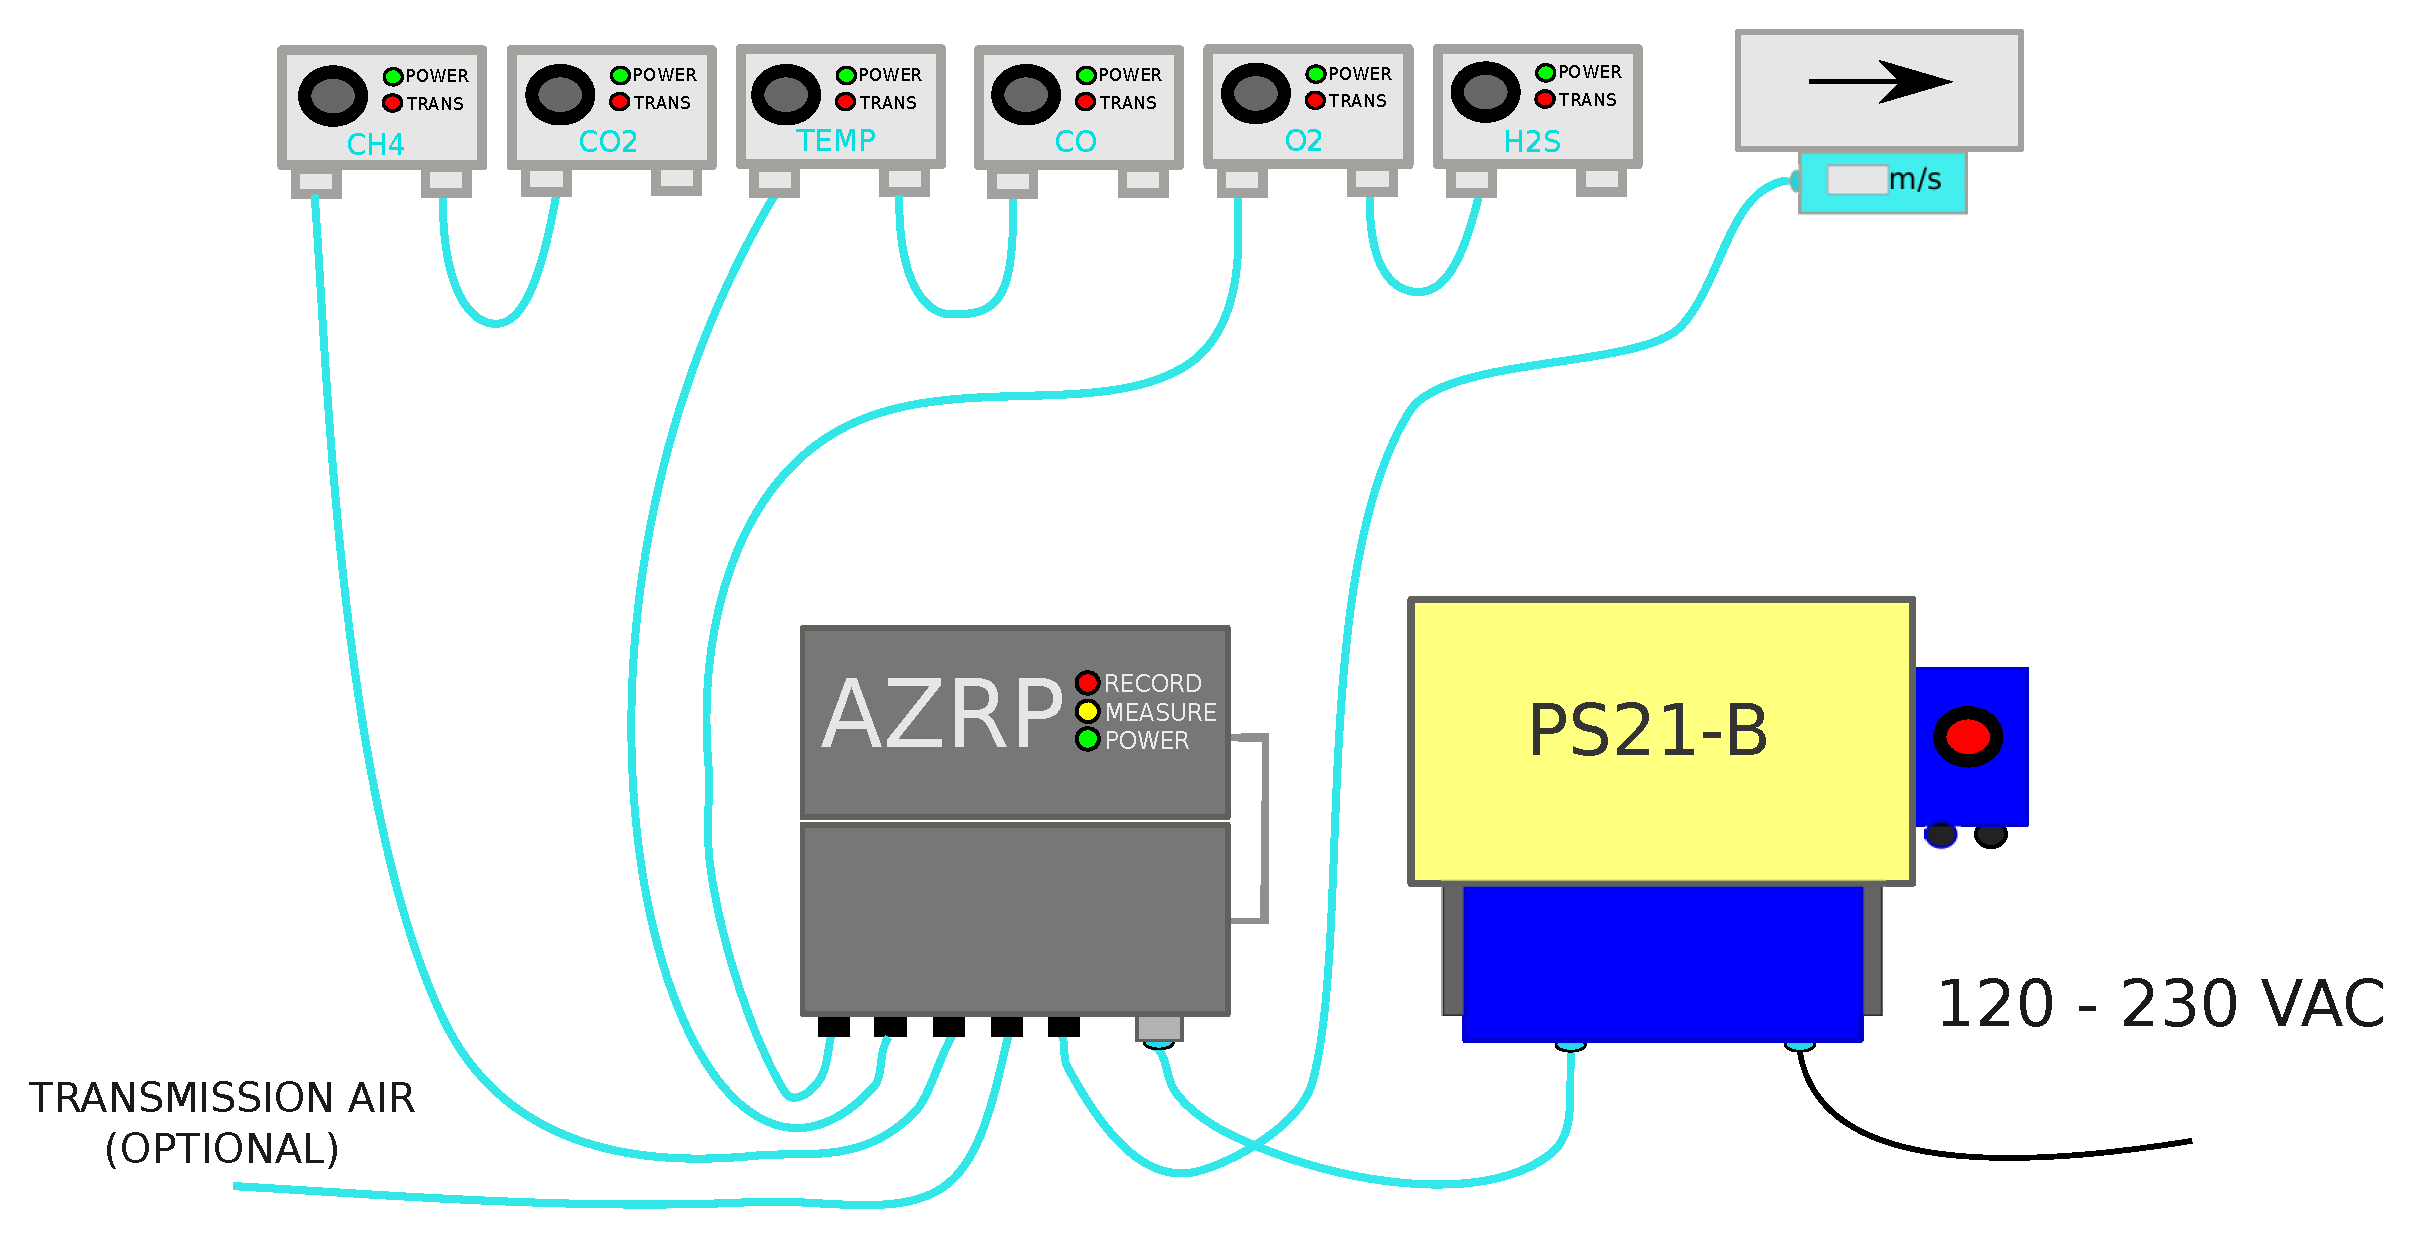
Thus, to get information about gas concentration, the possible solution is by using an individual gas detector for each miner. Such devices are used in the mine presently; however, they do not register data for deeper, more comprehensive analysis. For testing purposes, and installation of the measurement device with several gas-type detectors and long-term data acquisition, has been considered in copper mining in Poland but is more a research project than everyday practice. The device is a prototype. It can work up to 50
(IP65 certificate) [
37]. The structure of the monitoring system is presented in
Figure 1.
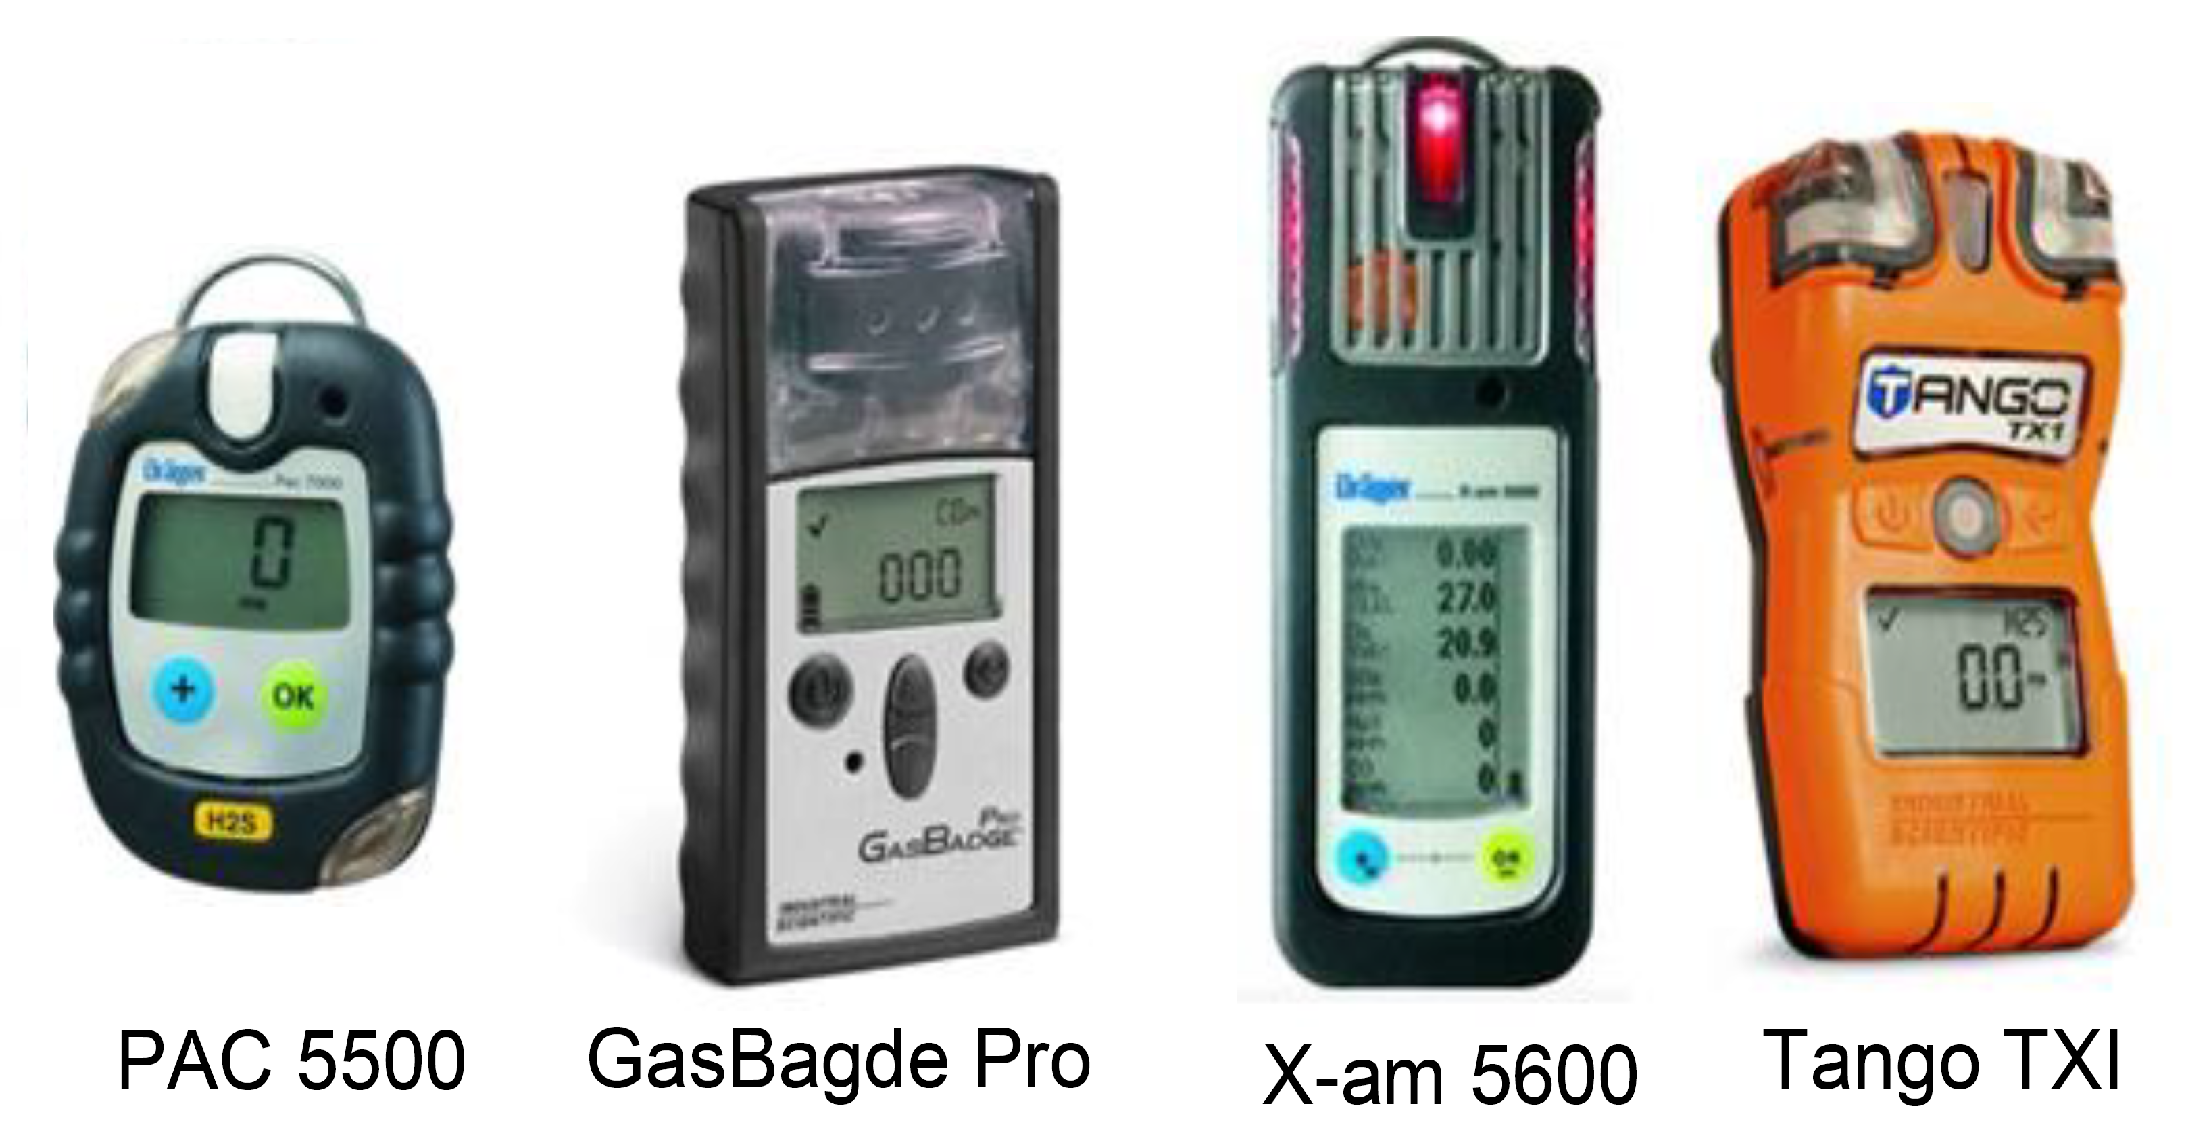
More feasible solutions are associated with portable devices (
Figure 2). They can measure gas concentration; however, they have a simple user interface and do not allow doing any analysis.
Thus, it creates an opportunity for research in this area. Air pollution was deeply studied in the literature. Also, the mining atmosphere quality measurement is an important topic for researchers [
39]. Mine gas monitoring problems have been studied in [
40]. Gas monitoring and testing in underground mines using wireless technology has been taken into consideration in [
41]. Wireless sensor networks for the detection of explosive atmospheres in underground coal mines have been discussed in [
42]. Portable gas sensors (including
) have been discussed in [
43,
44,
45]. A low-power, wearable, multi-sensor data-acquisition system for environmental monitoring has been studied in [
46]. Wearable sensors have been proposed also in [
47,
48]. Air-quality monitoring systems based on microcontrollers as Raspberry Pi [
49,
50] or Arduino [
51,
52] have been also considered. The idea of the electronic nose concept has been proposed in [
53]. CO detectors are based on a laser diode proposed in [
54]. Statistical analysis of CO and
in deep underground mines for long-term measurements have been studied in [
3,
4].
3. A General Concept of the System
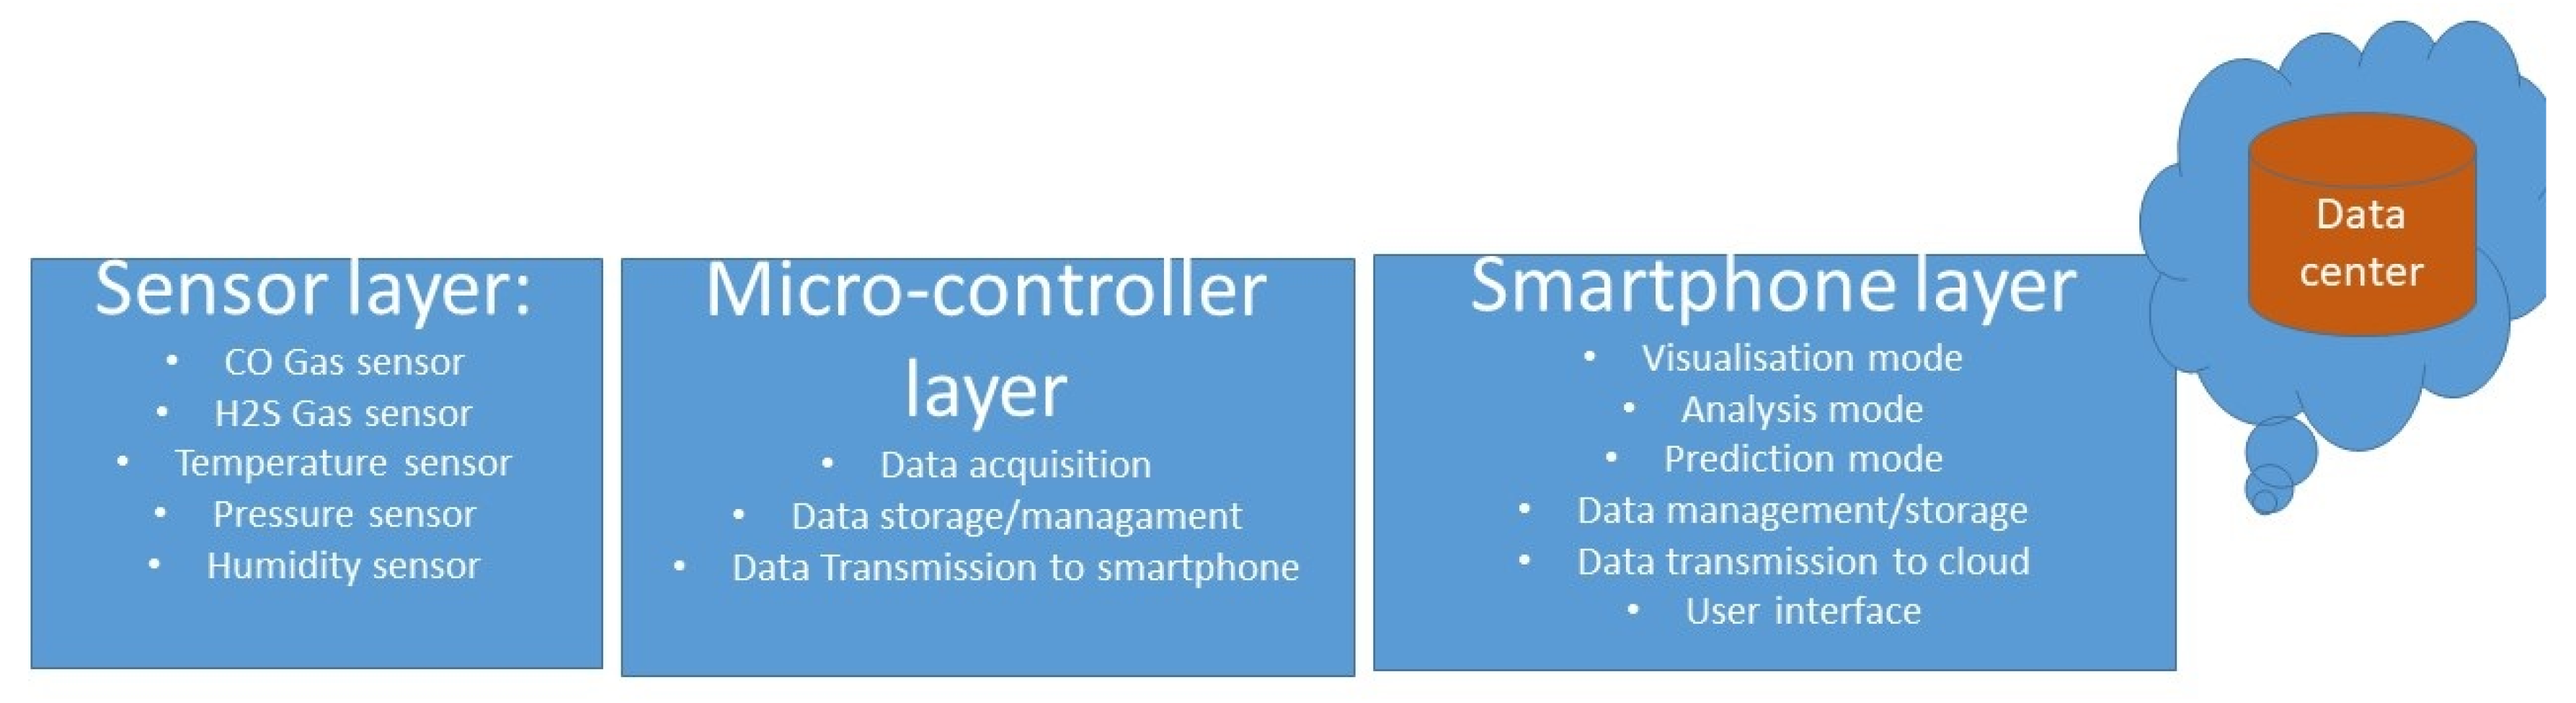
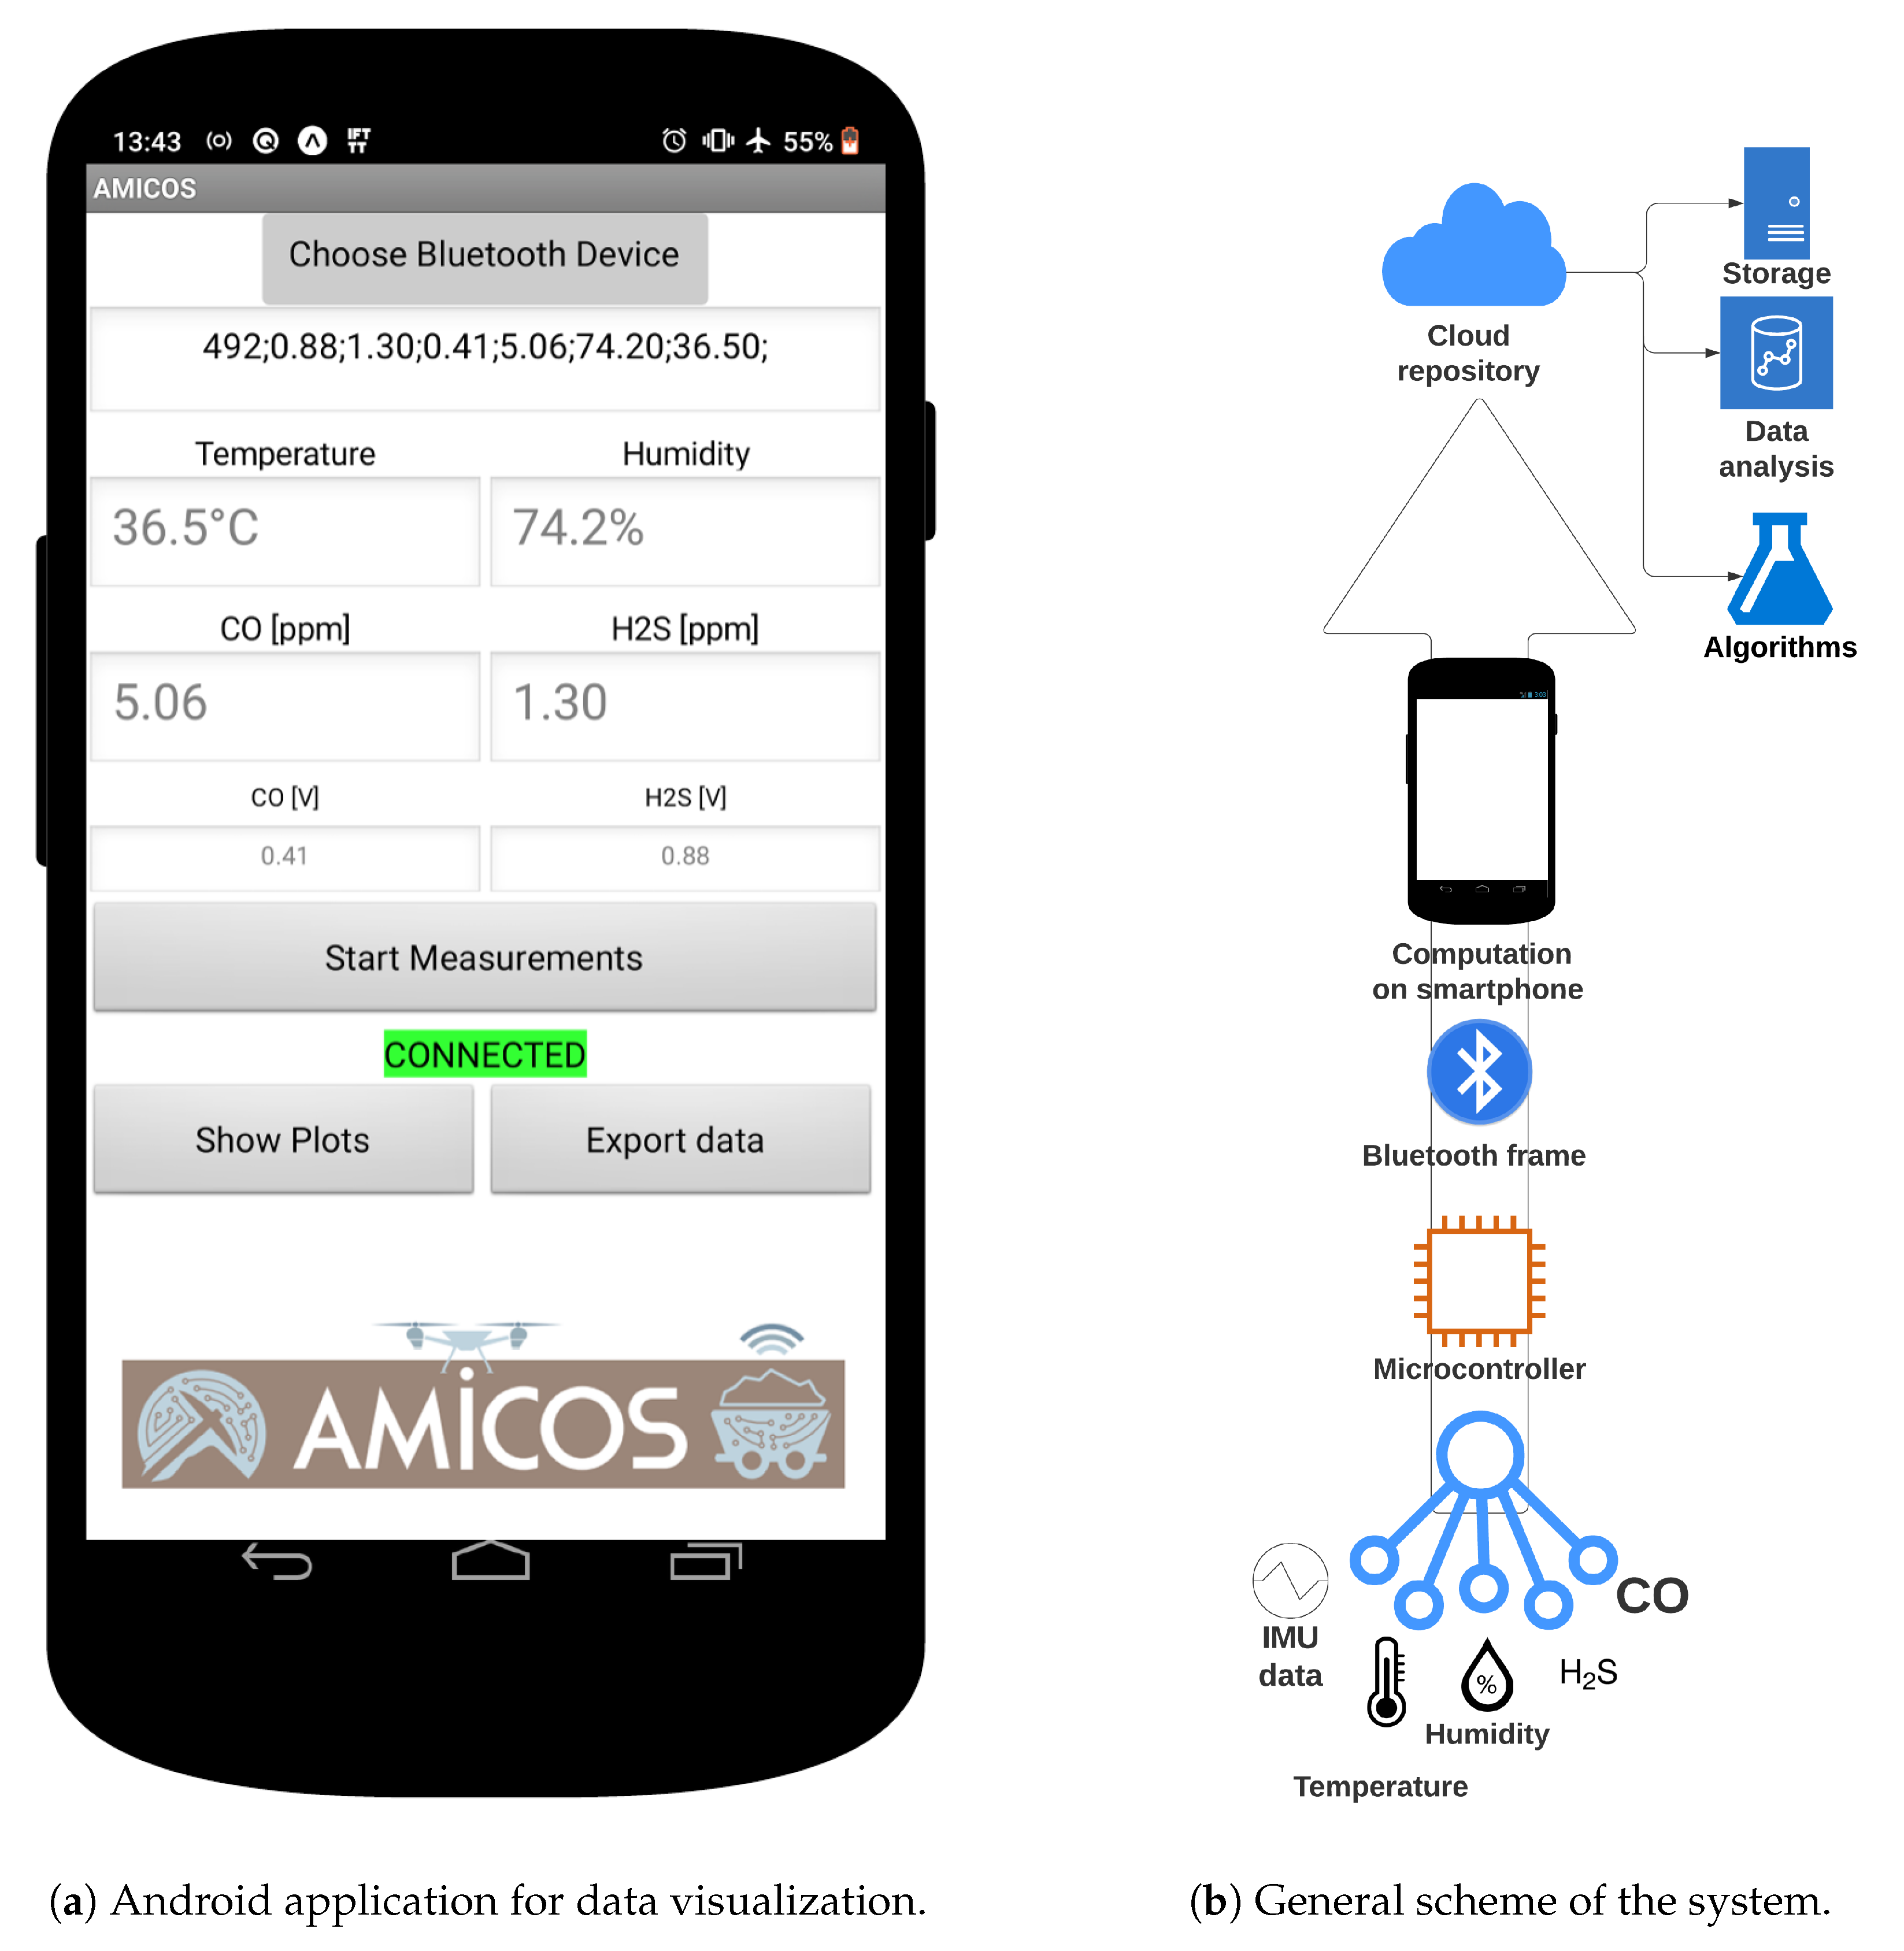
The idea of the system is presented in
Figure 3. It consists of 4 modules: sensor layers, data acquisition by the microcontroller, smartphone, and external IT infrastructure on the surface (optional). The main factor of portable environmental measurement unit construction is its low price and scalability attributes. It is based on an open-source platform and easy-to-use devices. Data visualization and additional storage functionality are satisfied thanks to the Android application (.apk format).
In this case, the ventilation crew at the underground mine Sieroszowice–Polkowice uses PAC850, among the variety of devices on the market, as a hazardous gas sensor.
Table 1 shows the parameters of the device used.
The data presented in the table below presents the scope of the measuring device used in the underground mine of KGHM Polska Miedź S.A. Although the sensors used in PAC-type measuring devices have larger measuring ranges, in the calibration process, a range smaller than the measuring capabilities of the sensors is set as limit values. The measurement thresholds established during the calibration process are the values at which one should immediately withdraw from the excavations, as longer time spent breathing in such an atmosphere may have serious health consequences.
The measurement data analyzed in the article was measured and generated by means of a constructed measurement system. The place of measurements was located in the underground mine in the areas where excavation was performed. The area of the survey was selected after consultation with the ventilation department employees, whose knowledge, supported by previous measurements and their analysis, allowed for the selection of gas hazardous zones. Concentrations of gases such as hydrogen sulfide and carbon monoxide were measured and then analyzed. The measurement was performed continuously, and the collected data displayed in the application on the phone were compared with the results of the measurements of the equipment used by the mine employees (PAC8000 and X-am 5600). The measurement results and their analysis are presented in
Section 4.
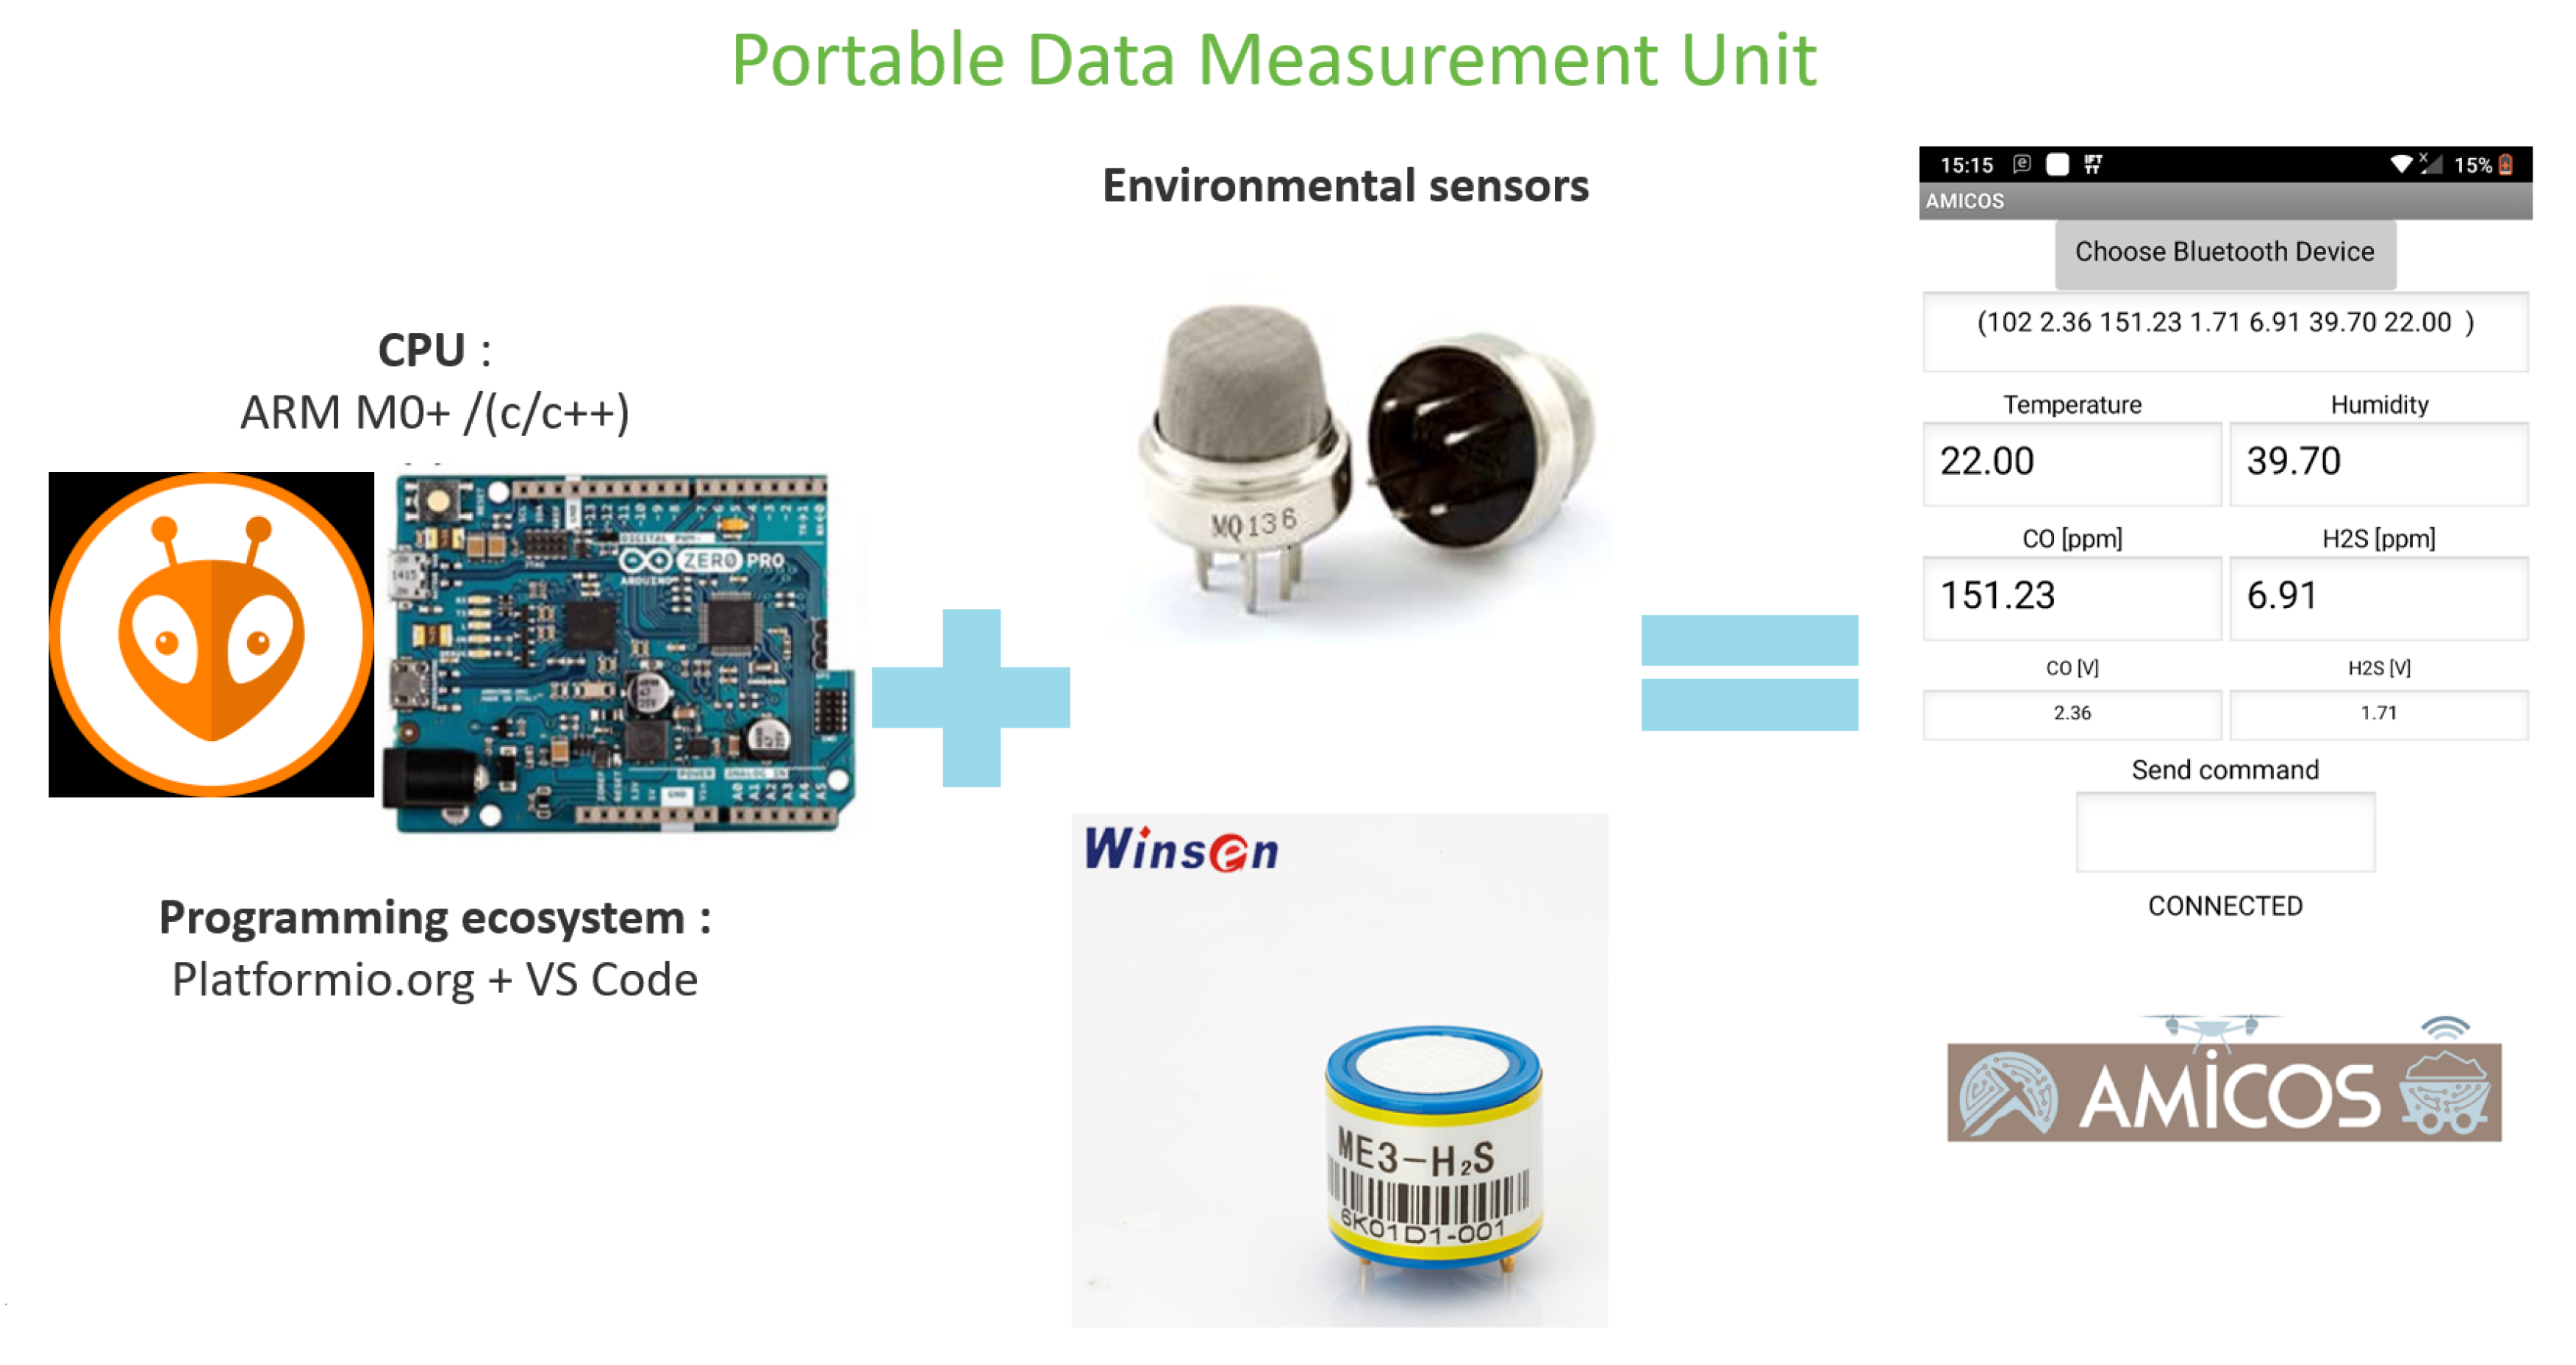
3.1. A Hardware: Environmental Sensors
The main purpose of the presented prototype is to measure gas concentration in the mine environment. To achieve it, an MQ-9 sensor for CO concentration and MQ-136 and ZE03-H2S for
concentration is used. These sensors use Tin Dioxide (SnO
) as sensitive material, which changes conductivity depending on gas concentration. As an output, the voltage output is obtained. Using the formula from manufacturer datasheet [
55,
56] and calibration using certified devices from mine ventilation crew PPM concentration is calculated. Additionally, the DHT22 (temperature and humidity sensor) is used with temperature range: −40
to 80
± 0.5
and humidity from 0% to 100% ± 1% (see
Table 2).
3.2. Hardware: Microcontroller
As the a main computer, Arduino M0 Pro with 32-bit ARM Cortex M0 core is used. The performance was satisfied with 48 MHz clocks and 32 Kb SRAM. Gas sensors are connected to analog pins. Other devices such as SD Card Reader, DHT22, and HC06 Bluetooth module [
57] use UART, SPI, and (I
C) communication protocols. Circuit voltage of sensors, especially the HC06 Bluetooth module, needs a stable 5 V voltage level, thus power bank RAXFLY 10,000 mAh was used. The system scheme is presented in
Figure 4.
Environmental condition measurements are taken with 1 Hz frequency. Subsequently, PPM values are calculated, and the data frame goes further to the smartphone using the Bluetooth connection. With the aim of data protection against corruption and malfunction from a highly harsh and changeable mine environment, every 5 min the whole file with measurements is sent to a smartphone for data redundancy.
3.3. Smartphone Layer
First, the smartphone plays the role of visualization medium using data from the Bluetooth connection. The provided user interface can manage with a short command for the microcontroller layer to change the frequency of measurement (0.05–2 Hz). All data is stored in a folder on the smartphone with the option of auto-upload to a private cloud when a device is connected to the cellular/Wi-Fi network.
The second part of the used sensors come from a smartphone. Its embedded IMU sensor provides information about acceleration, velocity, etc. Frequency of 10 Hz helps to obtain additional information e.g., about several steps from smartphone sensors. In the case of the emergency state, when hazardous gas concentration increases, the application makes the phone vibrate and the background blinks red.
During the experiment, a standard smartphone with the Android operating system was used (Nokia 8). In future tests designed for the assessment of the entire mine, we will have to apply special devices approved by standards. In accordance with the Regulation of the Minister of Energy of 23 November 2016 (Chapter VI), the degree of protection of the device must not be less than IP 54 [
37].
3.4. Rapid Manufacturing for Mining Purposes
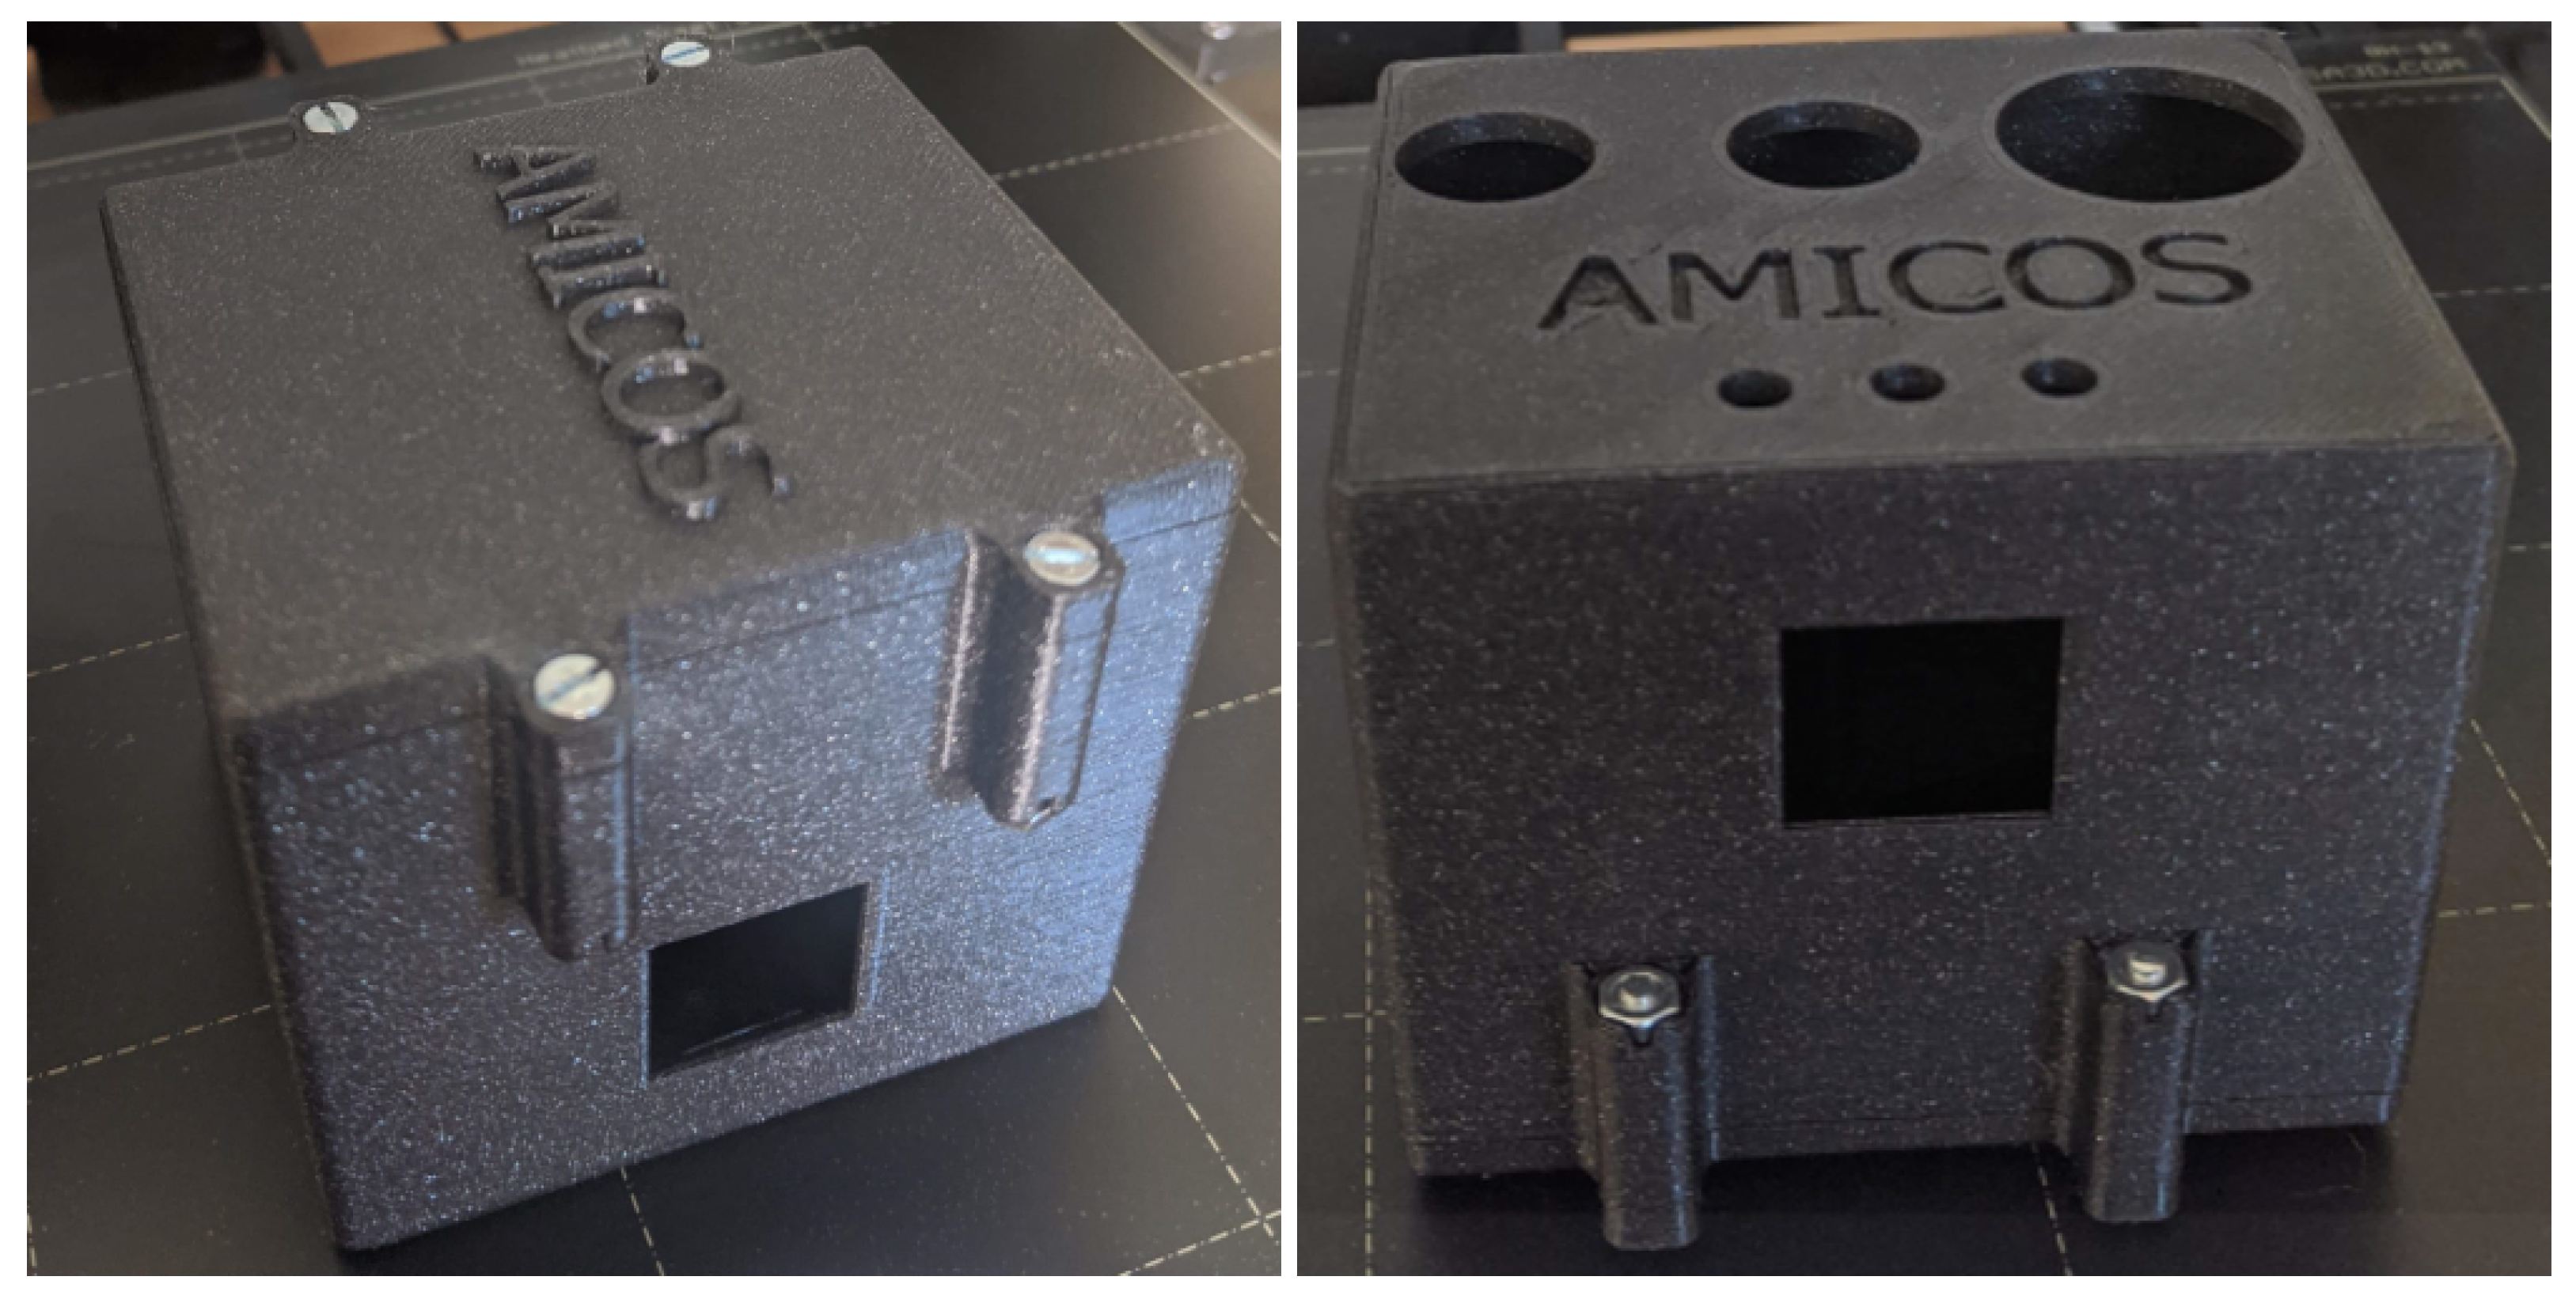
As a part of rapid manufacturing, the most widespread and accessible method is 3D printing. Using a Prusa Mk3S printer a custom case for the onboard computer was created. A hand-sized 70 × 75 × 67 mm case with holes for the gas sensors and control diodes protects the measurement unit from the harsh mining environment and simultaneously allows evaluation of ventilation condition correspondingly. The created case is presented in
Figure 5. Polylactic acid (PLA) was chosen as a construction material. Its mechanical parameters are sufficient for use as a case in the mine area. Moreover, PLA is a biodegradable plastic, and its physical properties are excellent for a thermoplastic forming process [
58,
59].
3.5. Software for Microcontroller
The open-source project has an enormous impact on beginners who want to start their adventure with microcontrollers. Arduino boards are the leader for education usage as well as IoT product development [
60]. For this publication, integrated development environment (IDE) for the embedded project, platformio.org, is used to expand capabilities of used hardware [
61]. This IDE, as an add-on for Visual Studio Code, enables rapid application development with a variety of boards and microcontroller models. Additionally, it maintains order in libraries that has an enormous impact on more complex project development.
3.6. Software for Smartphone
The HC06 Bluetooth module constitutes a bridge between the embedded ecosystem and eye-friendly data visualization [
57]. Since more than 70% of mobile phones use Android OS, the dedicated application with data visualization and logging feature is created for that particular OS [
62]. Data stored on smartphones enable unlimited possibilities to send information to the other applications, e.g., cloud provider storage, instantly (see
Figure 6a,b). For that purpose, the MIT App Inventor, a block-based coding environment for mobile application development, was used. It ensures fast up-and-running mobile applications. Within the MIT App Inventor, block of code for Bluetooth connectivity and acquisition of data from IMU sensors was used. When a new data frame from a microcontroller occurs, data visualization is made instantly. In the background, every 100 milliseconds, the app saves information about the present values of acceleration and velocity. Other important functionalities of the application are measurement data management, simple visualization in the text field, and data plotting.
3.7. Cost Comparison and Repeatability Device Architecture
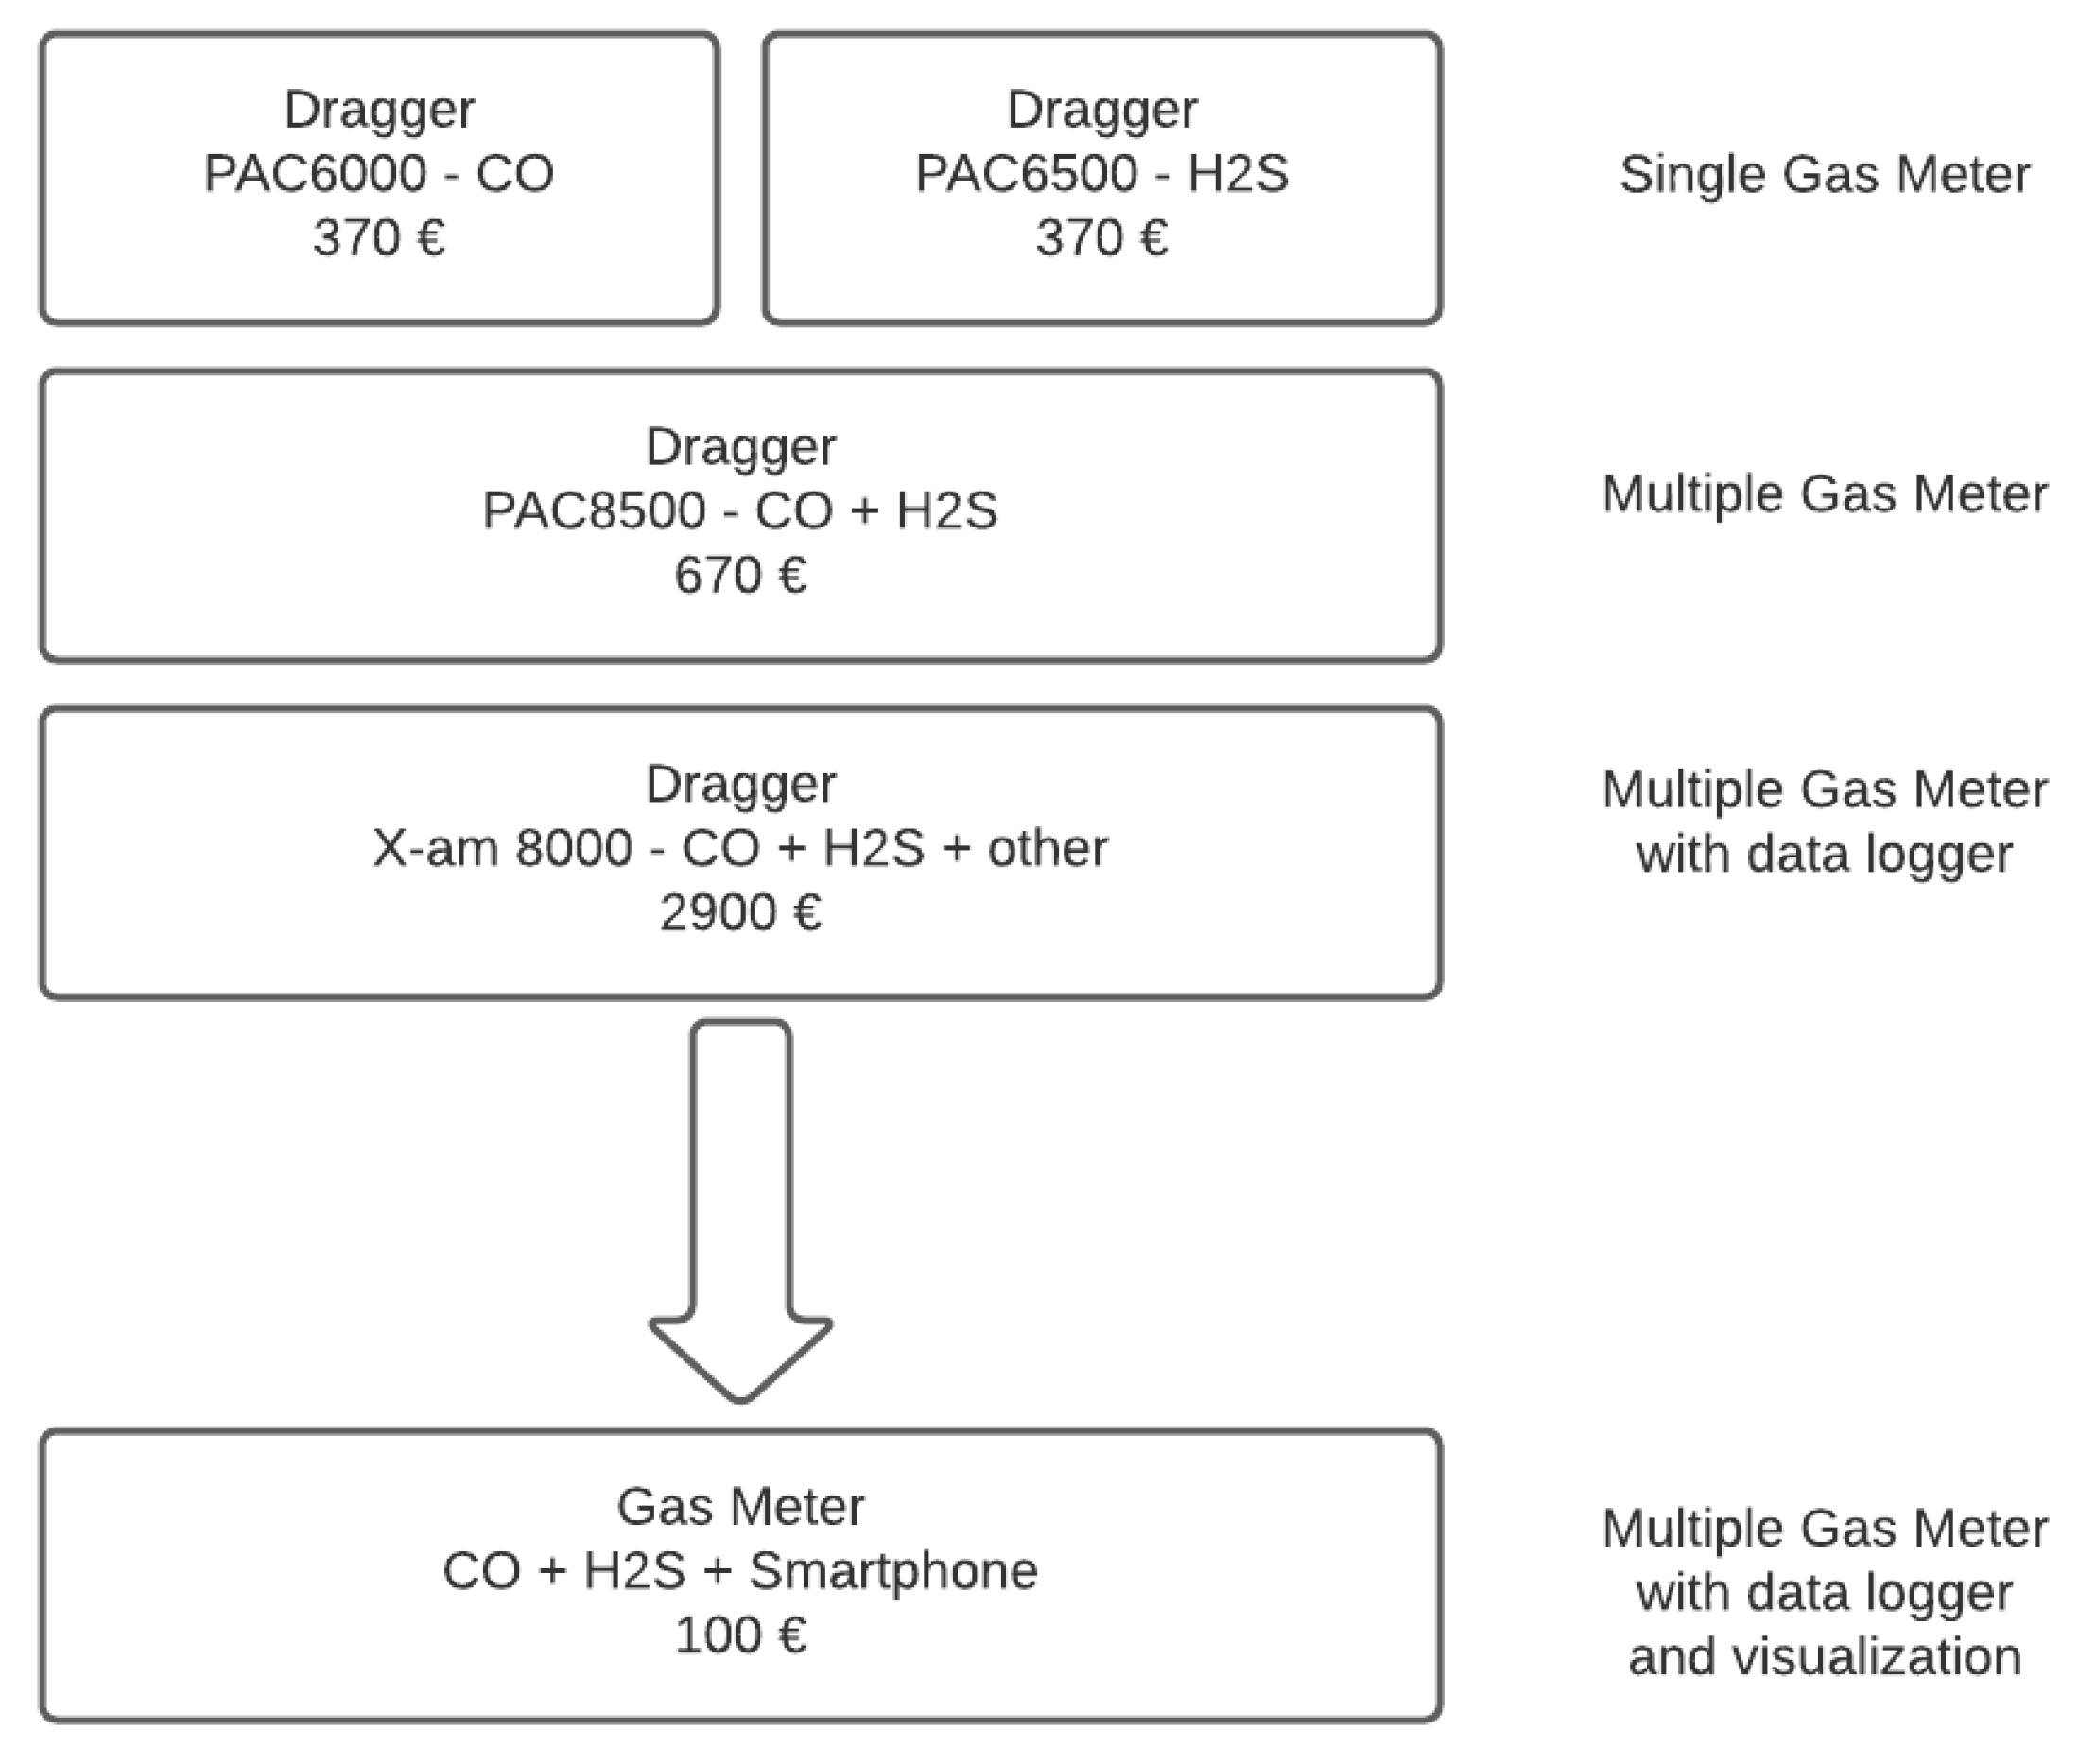
Hazardous gas sensors used in the aforementioned mine are devices from Dragger manufacturer shown in
Figure 7. Devices, with basic functionality, which only covers the function of displaying the instantaneous gas concentration value, are PAC6000 and PAC6500—single gas meters. More convincing in usage are multiple gas meters—PAC8500—with cost ca. 850€. The most advanced sensor with additional functions such as data recording or complex data visualization is the PAC8500. The cost of the device is almost 3000€. The presented IoT device, together with the smartphone used as a component for data visualization, costs less than 100€. In addition, our prototype has options such as cloud data storage or drawing a plot for data visualization. Within the framework of Industry 4.0, the software developed is easily scalable, so there are no restrictions that these devices will be introduced to a greater extent to equip underground workers. This will significantly help to raise workers’ awareness of the environmental conditions at work and allow them to react more quickly if a hazard arises.
4. Experiments
The experience was divided into two parts. The first part focused on carrying out tests in laboratory conditions, while the second part concerned the performance of measurements in real conditions in an underground copper mine belonging to KGHM Polska Miedź S.A. The results of the tests of measurements of gases such as hydrogen sulfide and carbon monoxide, their interpretation, and analysis are included in this section.
4.1. Test in the Lab
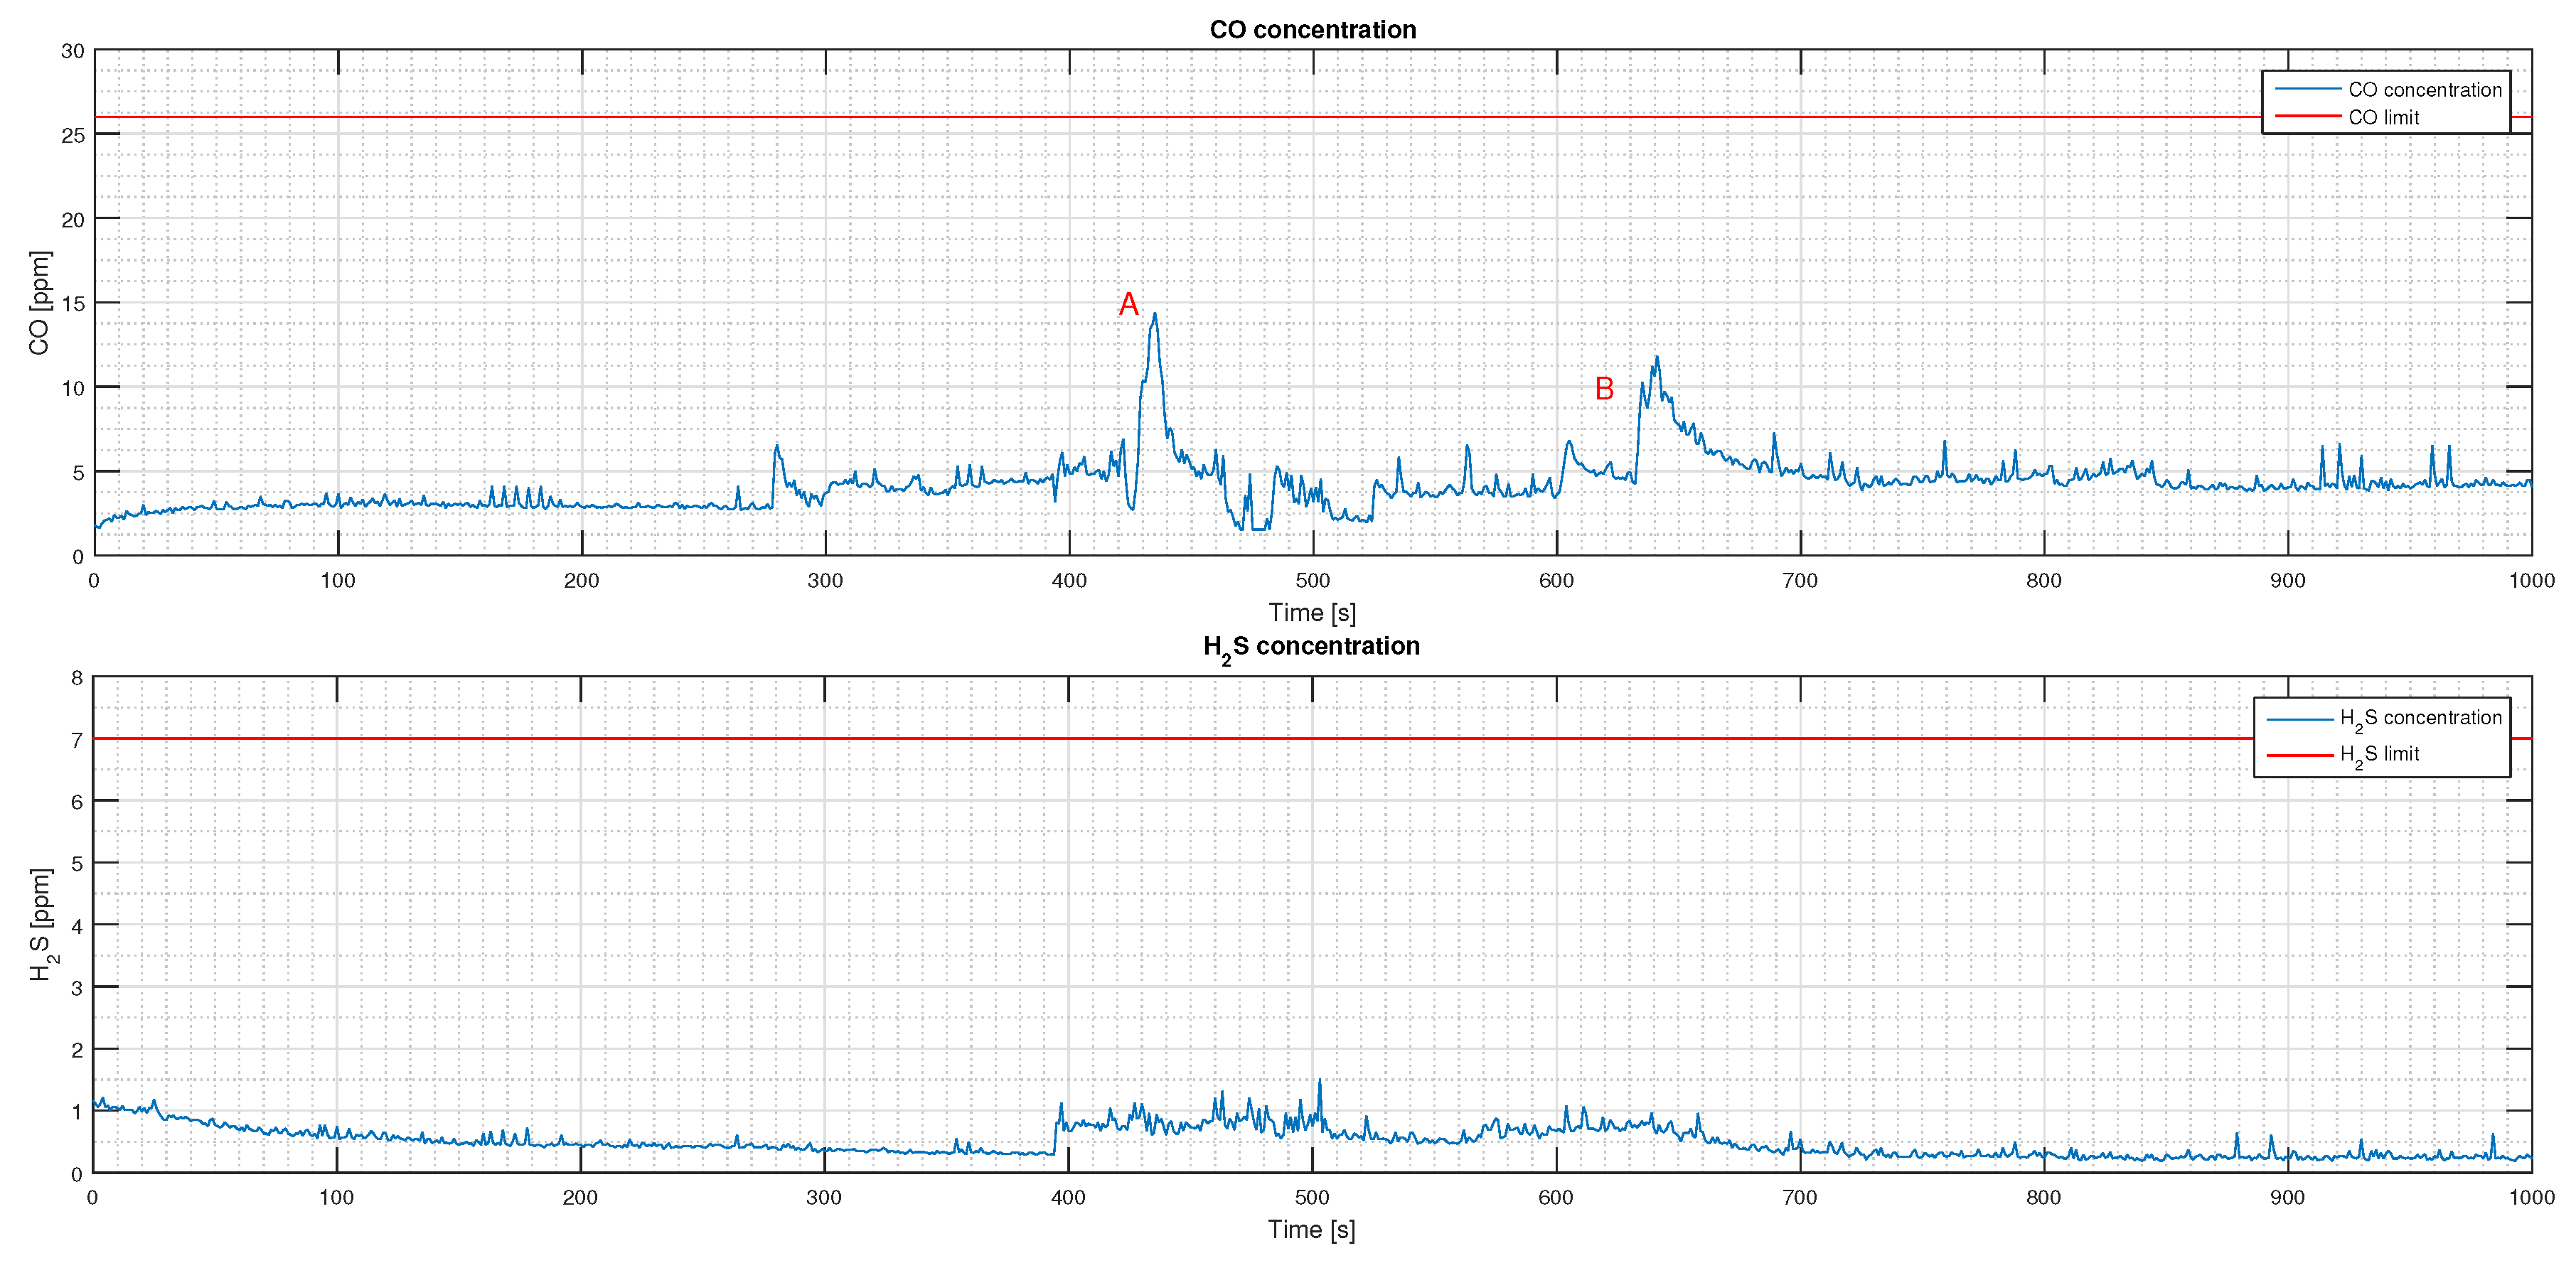
Experiments in the mine are always difficult and may have a lot of limitations so first we decided to test our device in lab conditions. The experiment aimed to check measurement ability and preliminarily evaluate the sensitivity of the system. As a source of CO gas, we have used an unburned piece of wood. We produced a bit of smoke. By decreasing the distance between the source of the smoke and the sensor, we have increased gas concentration that could be seen in
Figure 8, point A and B. We cannot imitate the source of
in the lab, so for the second gas, we just tested the ability of measurement
concentration in the air. For both cases, one may notice some minor fluctuations in gas concentration. For both gases, we were far from the limit value used in the mine (note red lines, 26 ppm for CO and 7 for
, are based on mining law [
37]). An example of environmental data acquired during the test, namely CO and
, is presented in
Figure 8. The conclusion from that simple test is that system is working, data can be acquired and stored in the device and at least the CO sensor is able to react to change in CO concentration.
4.2. Mining Area Experiment
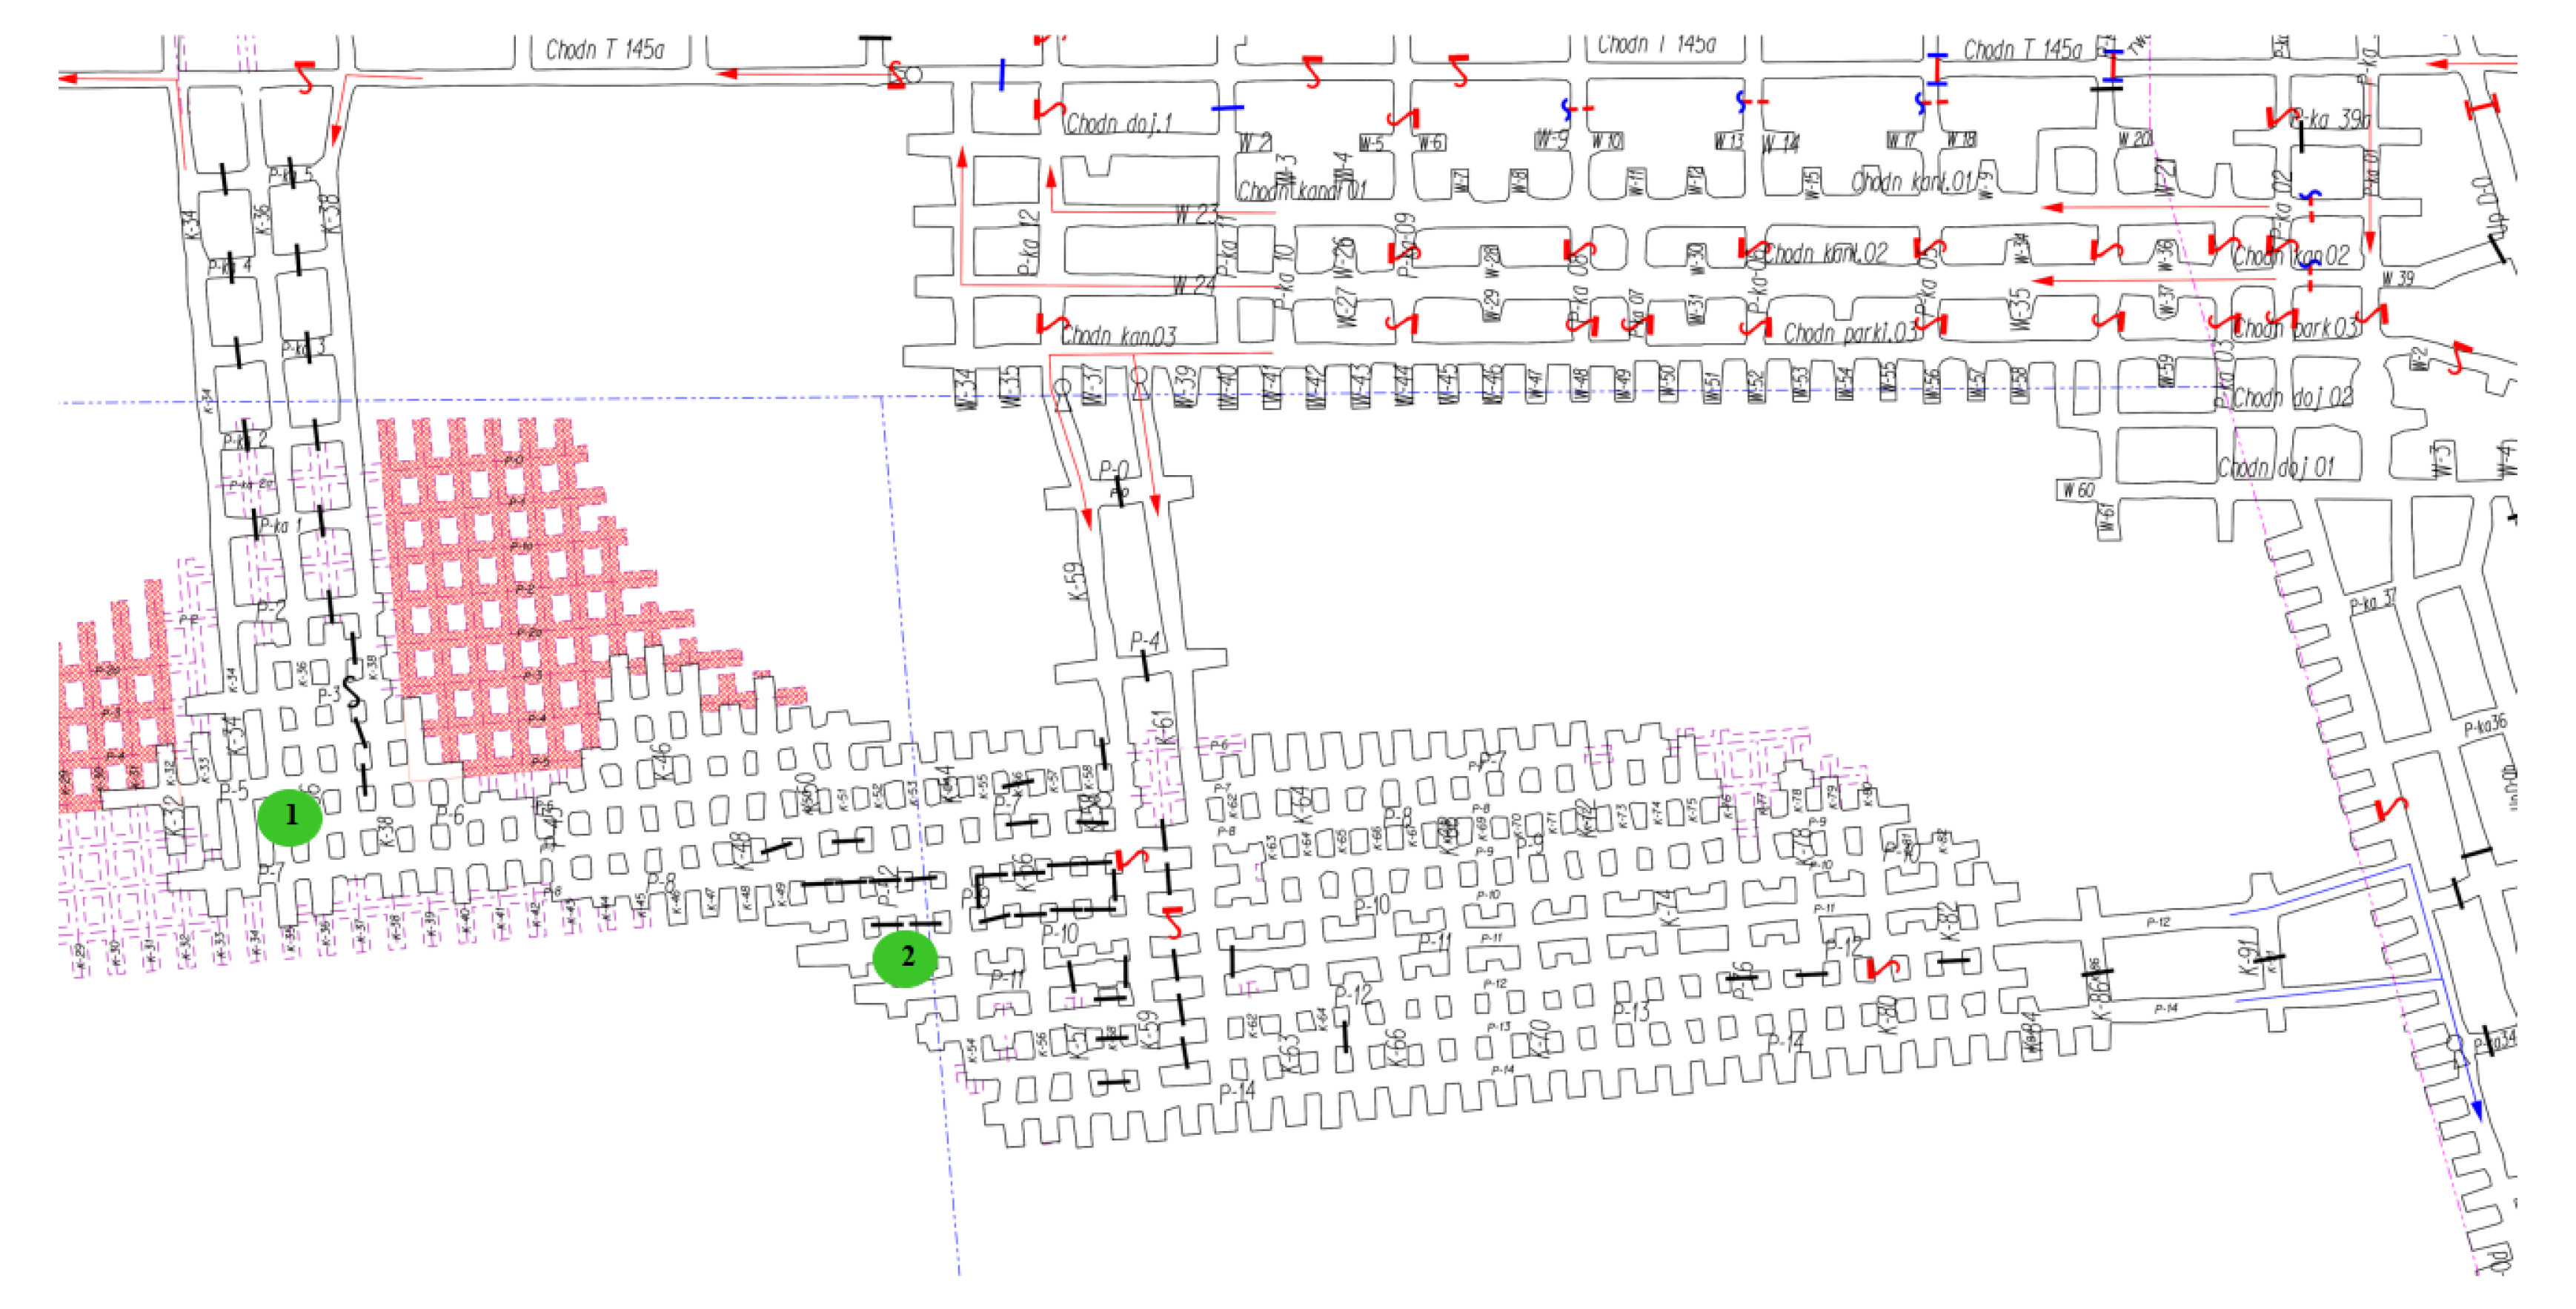
The examined mine is characterized by difficult operating conditions i.e., a large depth of exploitation, an extensive mine area, and harsh air atmosphere. The mine exploits minerals based on a room-and-pillar system. Excavations, where measurements were carried out, are marked in green circles on the map in
Figure 9.
To achieve our goals, the plan of experiments has been discussed with the mining staff. This mine is in operation and as mentioned there might be potential serious hazards related to gas presence. The experiment was conducted in two places chosen by mine ventilation staff. Measurements were taken near the mining face, so higher concentrations of CO and gases, respectively, were expected. There are many factors influencing air quality in the mine: the presence of machines, the amount of time after blasting, distance to the shaft, and distance to fresh and used air streams. On the map, the red arrows symbolize the fresh air, while the blue arrows represent the return air. In addition, air regulators are marked on the map with red symbols—mainly air stopping. The expected progress of the mining face is marked in purple. A significant influence on micro-climate in the mining void (tunnel) is also geological conditions and the presence of machines (with diesel engines). To select an appropriate location for experiments deep knowledge about mining conditions is crucial.
4.3. Validation in the Mine
During underground measurements in the mine, difficult climatic conditions that prevail in underground excavations should be taken into account. First of all, there is the high temperature, which ranges from 35 C to 39 C in our experiment as well as high humidity 55–85%. The measurement time was about 60 min (3600 s). In addition, mining faces are characterized by a high level of dust and salinity.
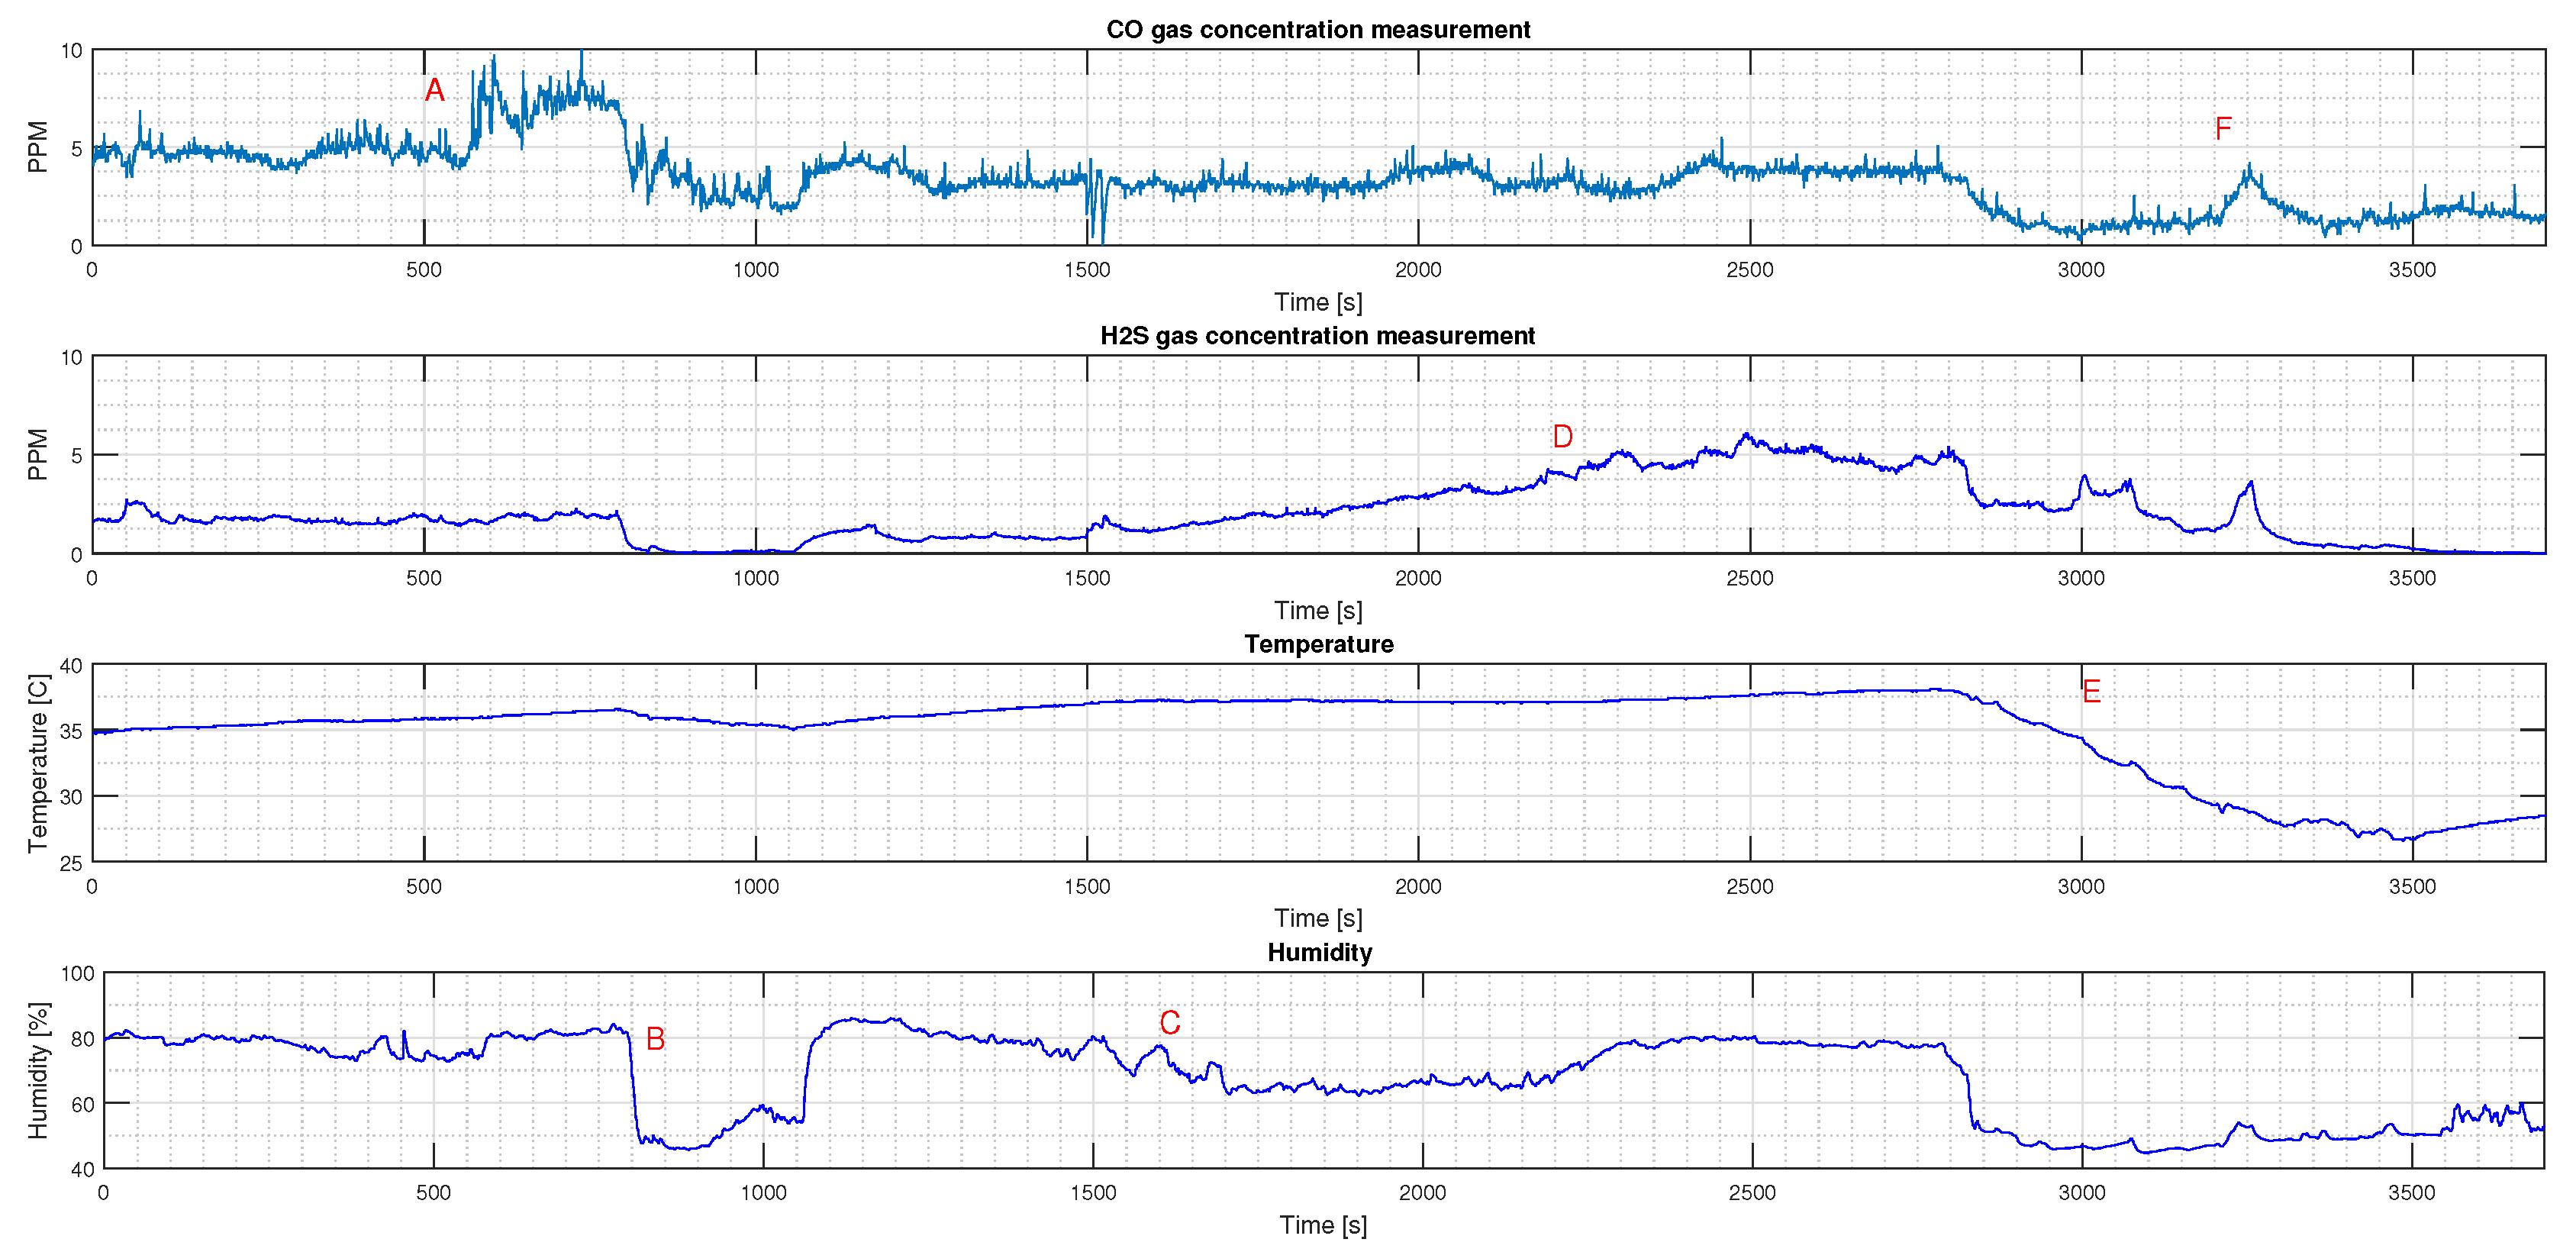
The measurements allowed us to see that along with the changing concentration of gases in the excavation, the designed meter recorded concentration changes in a manner analogous to gas detectors equipped with ventilation services in copper mines (Drager PAC6500 and PAC8500). At moments of concentration increase or decrease on mine measuring instruments, identical variation in the shape of measured values on the meter prototype was noticed. Below are graphs of recorded CO concentration values and in the ppm unit. Other environmental parameter changes during the experiments also are presented as a variance of temperature and humidity.
In the graph above, showing the concentration distribution of the analyzed CO gas, it can be seen that none of the analyzed gases exceeded the limit values. The maximum value of the carbon-oxygen concentration in the mine excavation is 26 ppm [
37]. The highest values of carbon monoxide were recorded at the very beginning of the measurement (see point A in
Figure 10). The high concentration of this gas was caused by the work of machines in nearby excavations. As the distance from the working front had been moving away, the CO content decreased. Individual measuring peaks are probably caused by machines passing nearby the measuring route (point F). The maximum concentration of carbon monoxide was not close to the limit value.
The next graph shows the hydrogen sulfide concentration distribution. The maximum value of hydrogen sulfide concentration in the excavation is 7 ppm and during measurement. It was not exceeded [
37]. The measurement was made in the excavation in the department, where the concentration parameter
increased value significantly (point D). In other analyzed excavations, the hydrogen sulfide measurement sensor showed close to zero values.
This noticeable moment of measurement is at B and E points in
Figure 10. It is crucial to consider that at point B and E we were in a fresh air inlet area that is notable on the humidity and temperature chart. A mixture of fresh air causes a decrease in temperature and humidity as well as hazard gas concentration. Other ventilation facilities, such as air stopping, play an important role in environmental parameter-shaping in the mine. In
Figure 10 point C travel through several air dams is noticed.
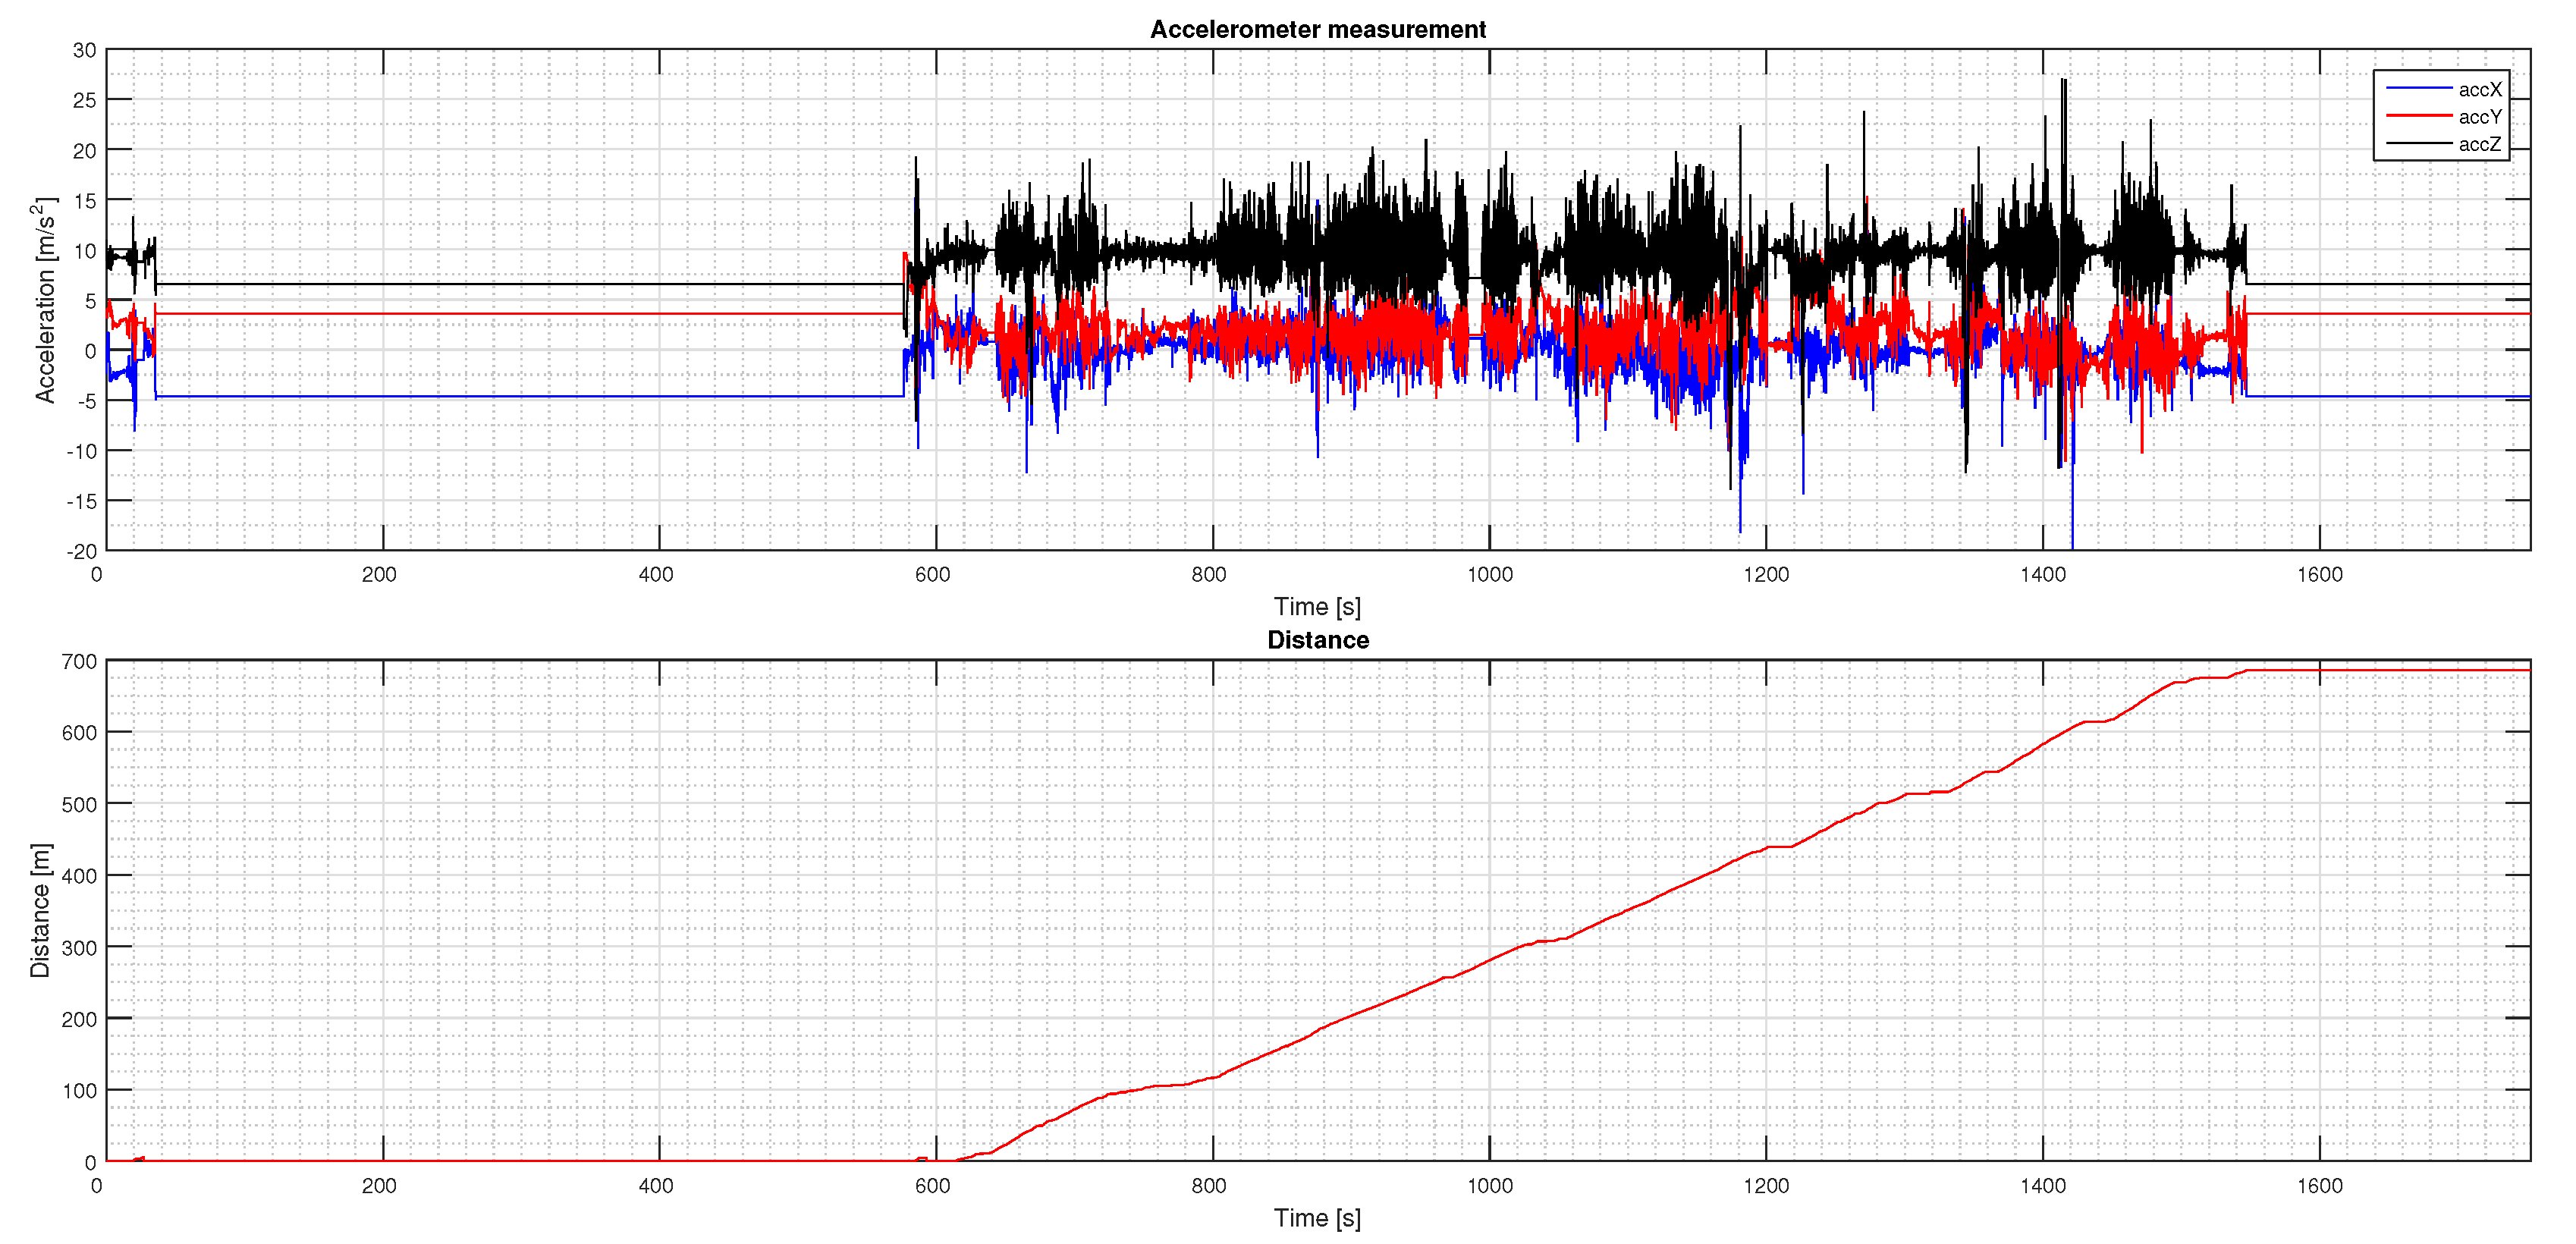
Using data from IMU sensors, built into the phone, distance calculation was performed with satisfactory accuracy. Signals are collected every 100 ms. When the main acceleration vector increases swiftly, then the application on the smartphone computes this event as a new step. Data is taken about acceleration and velocity in 3 axes. Based on that, when every considerable variation occurs, a step calculation function is triggered [
67]. As can be seen in
Figure 11 during the test, the length of distance is nearly 700 m. It could be helpful to estimate an overall distance made by the mine crew after the shift.
5. Validation
The standard process of sensor validation for industry usage involves special calibration equipment. These devices have required certificates and other approvals, which confirm their workability and operational reliability. It is how every industrial device is calibrated in an accredited laboratory. A described operation takes a long time, and it is expensive. In the case of a portable environmental measurement unit, proposed in this article, it is made in another way. On the ground of indications from devices widely used by mine ventilation crew, the calibration is conducted. After software-based calibration, data from certified portable sensors and prototypes are the same. This approach is, like the whole proposed solution, low-cost, not time-consuming, and has comparable accuracy.
For further analysis and scale-up, a prototype is necessary to confirm the correction of data, especially the calculation of PPM concentration. A device with a mixture of gas for calibration and validation measuring equipment such as proposed in [
32] must be used. Valid data calculation needs additional information from the sensor’s producers like cross-sensitivity. Thanks to that, we could separate the noise from the contribution of other gases to the sensor. Conducted calibration will allow us to bring the device into wider service in the mine environment.
6. Discussion
In an underground mine, detecting a gas hazard is essential. In this article, we focus on the most important and dangerous gases for underground workers—carbon monoxide and hydrogen sulfide. For KGHM Polska Miedz S.A. and other mining companies, this issue is critical from the underground employee safety point of view. As previous publications have shown, for example [
19,
22], which have precisely juxtaposed the appropriate gas concentrations with the corresponding symptoms, measurements of CO and
are very important. Apart from the measurements, which are carried out in real time in the mine, there is also a need for continuous monitoring and data collection for subsequent analyses. Hebda-Sobkowicz et al. [
3,
4] show how important it is to analyze the data collected continuously and over a longer period of time in the process of gas hazard assessment. This work presents the approach that could be helpful to improve the work of ventilation services.
Thanks to the development of sensors, microcontrollers, and a wide usage of the smartphone, we proposed a system, which can be used for every underground worker. Our solutions enable real-time data collection and analysis to describe environmental conditions from the gas hazard point of view, in particular, and CO. Each mine employee could be equipped with a personal gas concentration sensor/analyzer and as a result of that, safety could rise easily. In the case of emergency, state workers evacuate themselves immediately. Furthermore, in accordance with the development of technology and the Internet of Things, our proprietary software and measuring system can be easily extended to test the conditions of other gases such as NOx, SOx, CH.
The main purpose of this work is to develop a low-cost, portable measurement system for the analysis of mine environment. To accomplish that, experiments under stable lab conditions and also in the underground copper mine were carried out. The created system allows us to conduct a basic analysis in situ as well as a long-term investigation of retrieved data. The environmental data-acquisition system, tested in the mine, can be successfully implemented.
Obtained data from each test shows that created system works well. Retrieved data is satisfying. In moments when there is a change in gas parameters such as measurements near mining machines or the place of natural hydrogen sulfide discharge, our prototype registers it. Collected data are the same as those gathered by the equipment of the mine’s ventilation services crew.
7. Conclusions
There are detection systems on the market for the measurement of environmental parameters, namely concentrations of hazardous gases, which are both portable and stationary systems. However, it is difficult to obtain a stable source of power supply in underground conditions, and battery-based systems are difficult to maintain in practice. Moreover, due to the constantly moving mining front, in the mines using room-and-pillar with blasting technology, some underground mine areas have no infrastructure; in particular, there is no access to the electricity grid. The aforementioned blasting, possible seismic hazard etc., forces minimization of the use of stationary infrastructure near the mining face. Therefore, it is necessary to focus the efforts on the creation of battery-powered portable measurement systems, with long operating times, and the ability for wireless data transmission. This article presents an attempt at developing a solution according to the assumptions mentioned above.
The proposed measurement system is highly cost-effective in comparison with other existing solutions on the market. Moreover, implementation is less time-intensive and gives satisfying results simultaneously, compared with existing approaches used in the mining industry. The presented architecture of the system can easily extend for other sensors to measure various environmental parameters. Among CO and presented in this article, it is crucial to observe NOx or O gases too. Subsequently, software for sensor handling, and mobile application and creation of a 3D-printed case was presented, describing the functionality of a device. Thanks to the proposed solution, it is possible to access environmental data in real time. In comparison to other available devices, the proposed solution can measure, visualize current gas concentration, and possess basic analytical functionality-historical data, trends, and basic prediction. It should be stated that the system is open, more functions may be added if required. Usage of an open-source platform for hardware systems and smartphone applications fits perfectly into today’s software development trends, in line with the principles of Industry 4.0. Information can be used by ventilation crew both underground and above using a cloud solution for further data analysis. The application on a mobile phone stores messages from sensors and presents them immediately. When it is accessible, the connection to wireless communication, such as Wi-Fi or cellular data, are sent to the online repository. The results in this article confirm the correct work of the gas concentration meter prototype. Usage of the popular platform and efficient framework simplifies the process of code creation and management for embedded systems. The next step is to calibrate the prototype using a dedicated machine with the gas mixture. This mixture must be similar to the mine atmosphere. Thanks to that, the following experiment in the mine environment will be enrolled to ensure repeatability. After that, the proposed system could be used in a wider scope to empower the mine crew safety.
Considering all the above, the presented aspect may have enormous relevance for the mining industry. The problem of gas hazards in underground mines significantly affects the safety of employees. We try to solve this issue, generated by the industry, using the proposed system. Thanks to that, we could collect a lot of data and use it to determine underground ventilation changes such as hazardous gas concentration at a specific time. It gains knowledge about ventilation processes and generates new solutions. The designed measurement system is greatly flexible and allows us to expand measurements for other gases or specific mines’ environment parameters in the future.

 ,
, 


