1. Introduction
A modern and reliable electricity supply is crucial for human well-being and for the economic development of a country. Access to energy is vital and allows the provision of drinking water, lighting, heating, food, transportation, and telecommunications [
1]. However, approximately 1 billion people still do not have access to electricity and live in areas without connection to the electricity grid [
2].
In Colombia, as in the rest of the countries of Latin America, access to electricity in remote areas is very limited due to the lack of infrastructure necessary to bring electricity to these places [
3] and due to the precarious economic conditions of potential users, so it is not profitable for electricity companies to invest in these areas. In the so-called non-interconnected zone (NIZ), which corresponds to 52% of the territory of Colombia, approximately 92% of the electrical energy is generated by thermal plants with diesel generators, and the rest is generated by small hydroelectric plants. In these areas, the population lives in places with difficult access, which increases the price of fuel (diesel) in thermal plants, which emit polluting gases and generate noise pollution [
4], so this generation system is not the most recommended [
5]. In addition to this insufficient and limited electricity supply, autonomous energy resources have not been improved or used [
6], which has led to poor social and economic development of the population of these areas.
The Government of Colombia, through Law 697 of 2001, established that the rational use of energy was a matter of social character and of national interest. Law 1715 of 2014 [
7] advocated the use of nonconventional sources for energy generation. Programmes such as PROURE [
8] (Rational and Efficient Energy Use Programme and unconventional energy sources) promoted the financing of energy generation projects in the NIZ. All these initiatives can foster distributed generation and microgrids since they allow electricity to be generated and supplied near the places where it is consumed. A microgrid can be defined as a system that includes generation sources, loads and small-scale energy storage devices [
9]. They are called hybrid microgrids when they combine two or more energy sources, such as diesel generators, renewable energies, fuel cells, etc. [
10]. Hybrid microgrids can be an alternative energy supply in remote areas and they have already been used in several countries for the electrification of rural areas or islands [
11,
12,
13,
14,
15,
16,
17,
18,
19,
20].
The use of more than one source of electric power generation, of storage systems, and the intermittent nature of solar and wind irradiation complicate the design of hybrid microgrids, since it is necessary to find the optimal design from an economic, technical and environmental point of view [
21]. Several studies have attempted to determine the best design, maximizing the use of renewable energies and minimizing the use of fossil fuels [
22,
23,
24,
25,
26,
27]. In [
28] the authors performed a technical and economic assessment, using HOMER, of a hybrid PV-wind-diesel system in a village located in a remote area. Kaabeche et al. [
29] presented an iterative method for the optimization of an isolated PV-wind-diesel hybrid system. Ocon et al. [
30] studied the behavior of 215 microgrids with a 20% reduction in energy costs. Bekel and Bjorn [
31] presented a study on a hybrid system that supplied energy to 200 families in an isolated community. In another work [
20], Gebrehiwot et al. performed a sensitivity analysis to determine the effect of variations in solar radiation, wind and diesel price in a hybrid system.
The optimization of isolated microgrids depends mainly on the cost and lifetime of the batteries, and there are several studies focusing on the technical and economic analysis of systems that use lead-acid batteries [
32], since this is the most commonly used technology in these systems. Other studies focus on the techno-economic analysis of microgrids in rural areas, such as the one carried out by López-González et al. [
33] where 13 microgrids were proposed for remote areas in Venezuela, including PV-wind generation systems with lead-acid batteries. Other authors, such as Dhundara et al. [
34] have carried out a techno-economic analysis of a microgrid considering the state of charge of lead-acid and lithium batteries, taking into account consumption data, resources and current prices. A recent study conducted a techno-economic analysis of photovoltaic systems [
35] for a locality of the NIZ of Colombia. In another study, Guacaneme et al. [
36] presented several solutions using microgrids for rural areas of Colombia.
Considering all these previous works, it can be affirmed that it is necessary to carry out more studies to determine the characteristics that isolated microgrids must have in developing countries [
37,
38]. It will thus be possible to study their behavior from a technical, economic and environmental point of view in current climate conditions and in situations in which changes in consumption occur, determining the net present cost (NPC) of the system, the levelized cost of energy (LCOE) and the level of emissions [
39,
40,
41].
This article presents a techno-economic analysis for 6 isolated microgrids with renewable energy generation located in the NIZ of Colombia.
Section 2 describes the methodology used, considering factors such as geographical location, climate, the profile of current and managed demand, and the availability of renewable resources in the 6 localities.
Section 3 shows the results of the microgrid optimizations. In
Section 4, the discussion is presented, and finally, the conclusions of this work are presented.
2. Materials and Methods
The models of the 6 generation systems were simulated using iHOGA 2.5 software [
42]. iHOGA (improved Hybrid Optimization by Genetic Algorithms) is a software developed in C++ by researchers of the University of Zaragoza (Spain) for the simulation and optimization of hybrid stand-alone and also grid-connected electric power generation systems based on renewable energies. It includes advanced optimization models (genetic algorithms), which implies the possibility of obtaining the optimum system using very low computational times. iHOGA uses advanced models to accurately estimate the lifetime of the batteries, which are generally the most expensive components, with high requirements for costly replacements.
As a first criterion for the selection of microgrids, the availability of renewable resources was taken into account. The input data for the optimization correspond to irradiation and wind speed data for each location [
43], as well as the actual daily load profiles, the modified profiles applying demand-side management, and financial data, such as the inflation rate and the interest rate of money. As a result of the optimizations, the sizes of each of the components were obtained, which corresponded to the solution with the lowest LCOE. In addition to the economic results, the total CO
2 emissions of the life cycle and the useful life of the batteries were obtained.
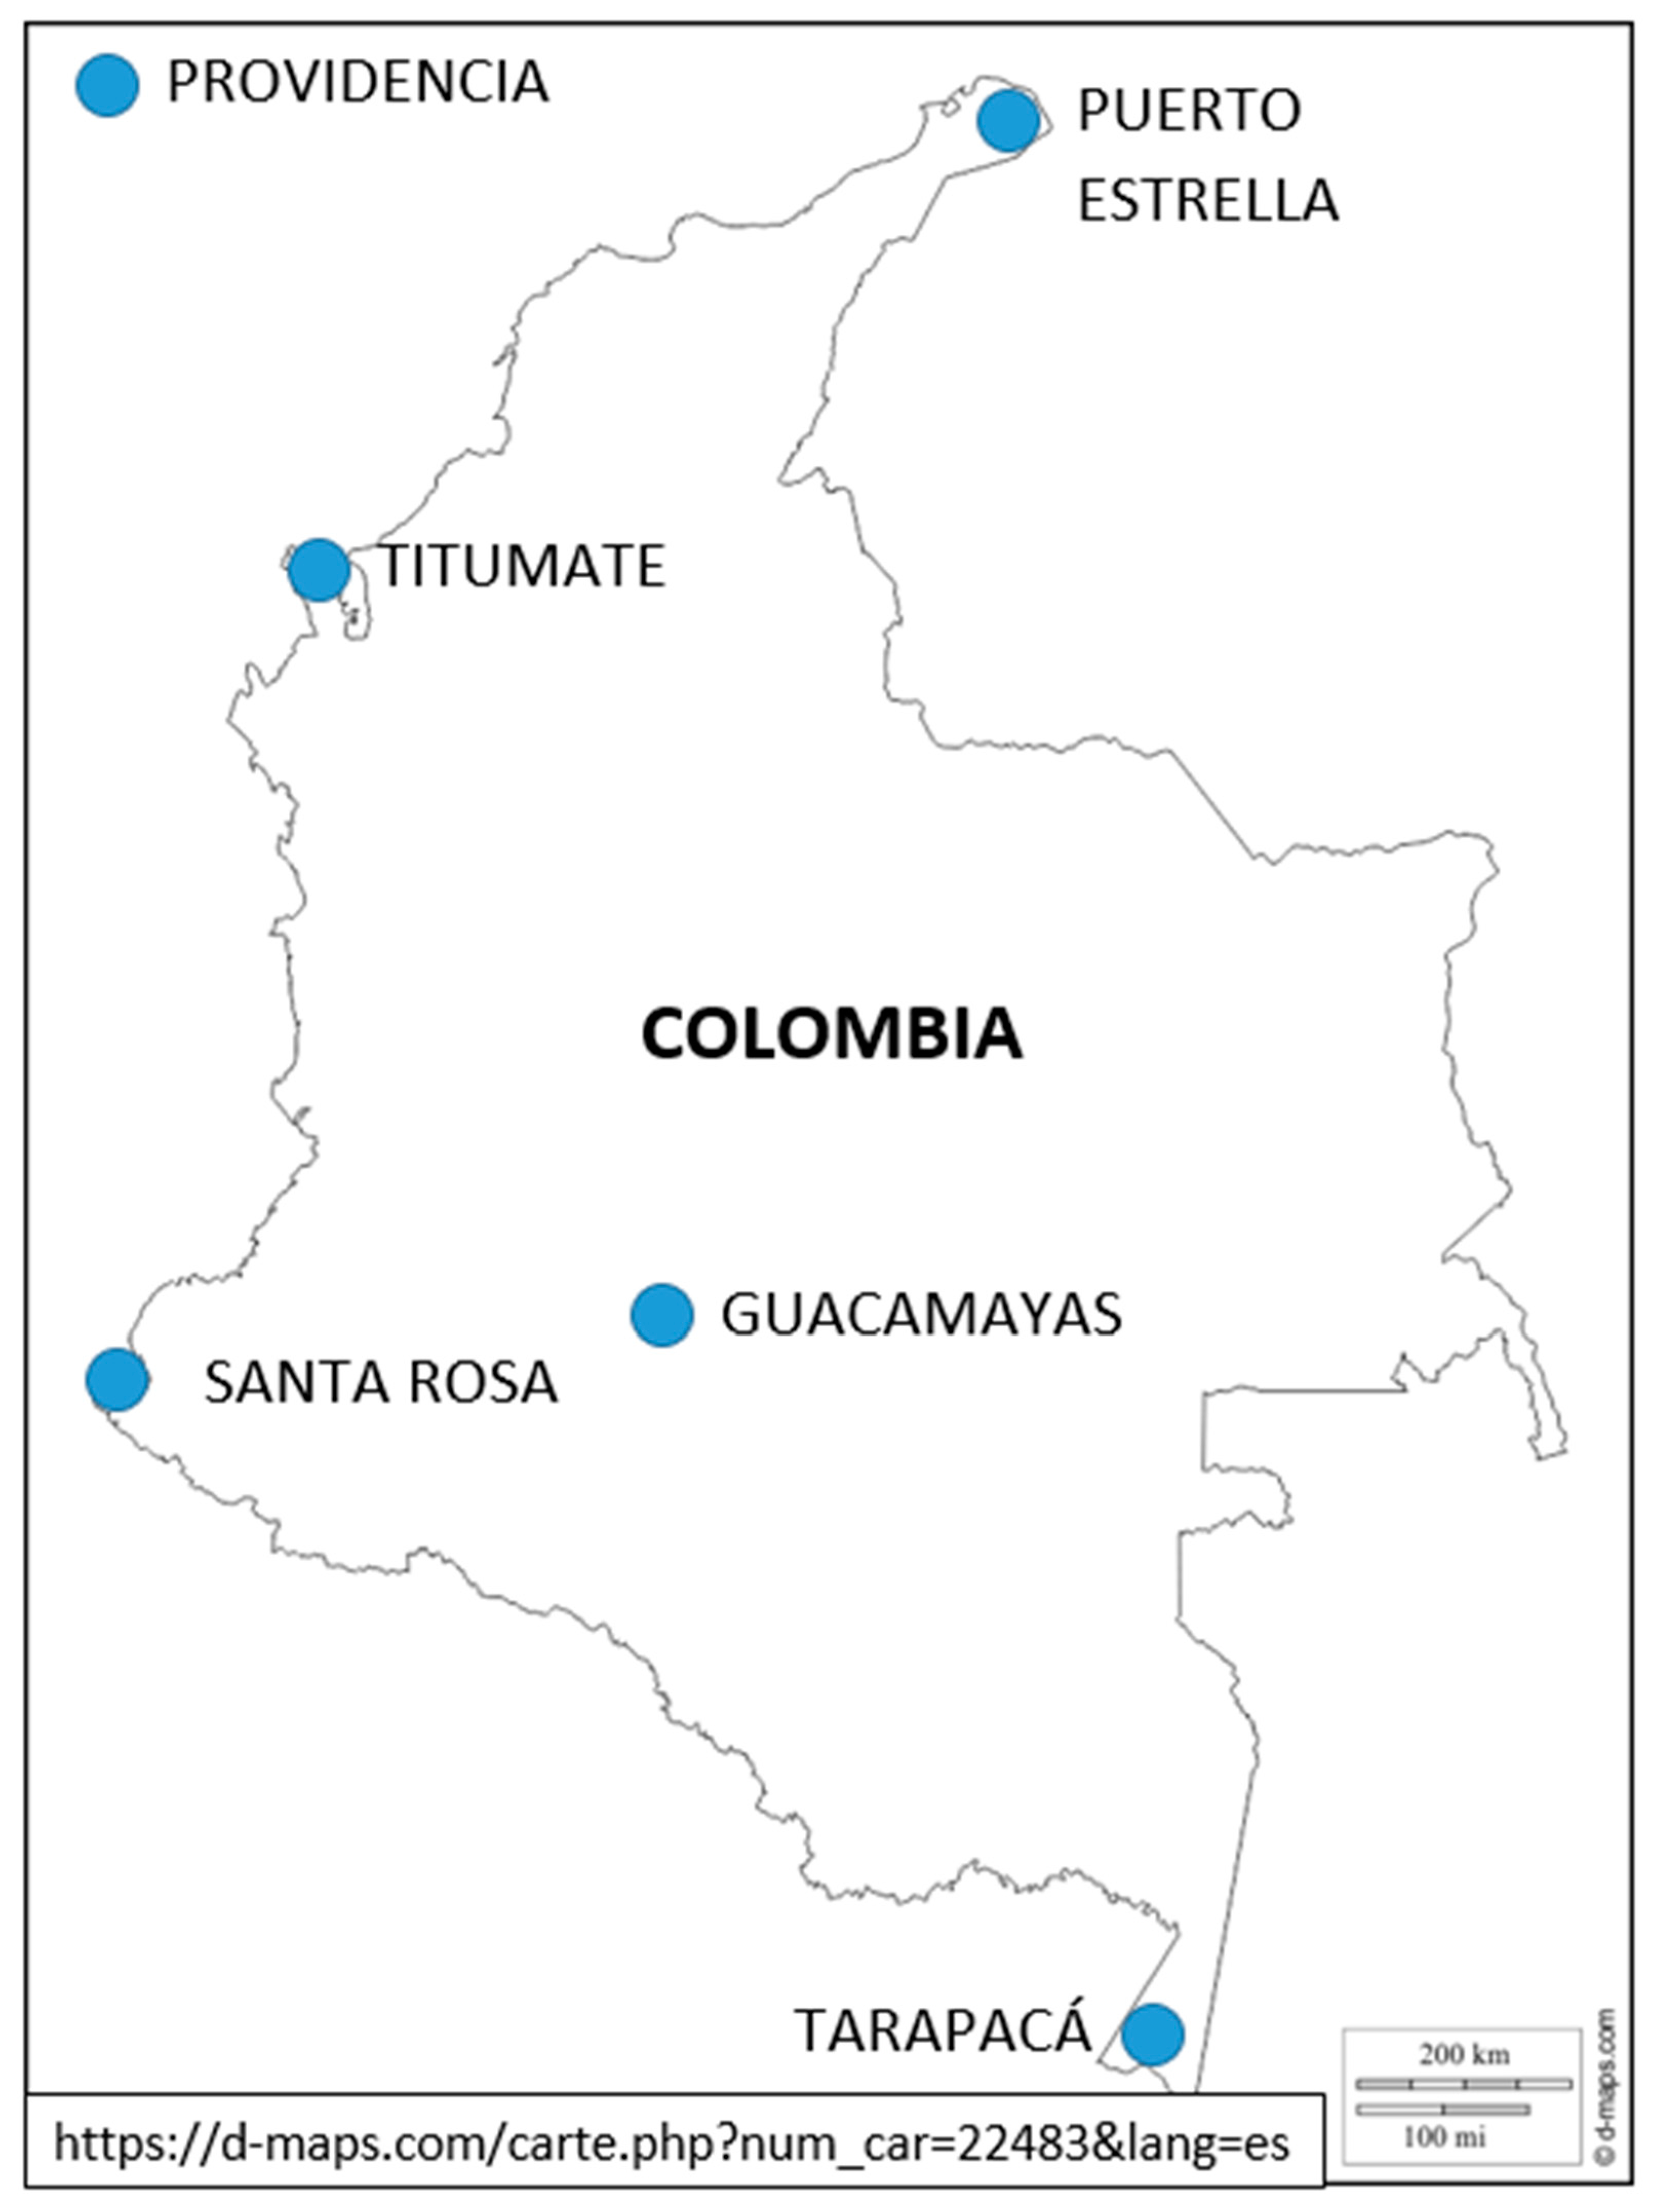
2.1. Geographic Location and Climate
The locations selected for this study are located within the NIZ. However, they have very different climatic conditions and renewable resources. The 6 selected locations have an altitude of less than 300 metres. The first three locations are found in tropical forests, Guacamayas is in the tropical savanna, Providencia has a dry tropical climate, and Puerto Estrella has an arid desert climate [
44,
45].
Figure 1 shows the map locations, and the
Table 1 shows the geographic and climate information of the selected locations:
2.2. Population
The population density of these localities is very low, classified as populated centers according to the classification of the National Administrative Department of Statistics (DANE) [
46]. These communities have the particularity that they belong to rural areas with accessibility problems and they lack access to the electricity networks belonging to the National Interconnected System (NIS).
Table 2 shows the number of households in each locality.
2.3. Energy Demand and Current Generation Sources
Most of the energy demand of these communities corresponds to lighting, small appliances and refrigeration equipment. The demand for energy during daylight hours is low because the main activities in these communities are agriculture and fishing, which naturally take place outside of the home. For the preparation of meals, mainly firewood is used, and in some cases liquid propane gas (LPG) [
47].
Table 3 shows the current situation of energy demand and generation systems of the 6 locations. In the case of Providencia, the average consumption for an isolated house was selected, and in the case of Puerto Estrella, the consumption for 20 houses was considered, and wind generation was not considered because the wind turbines currently installed were not in service [
48].
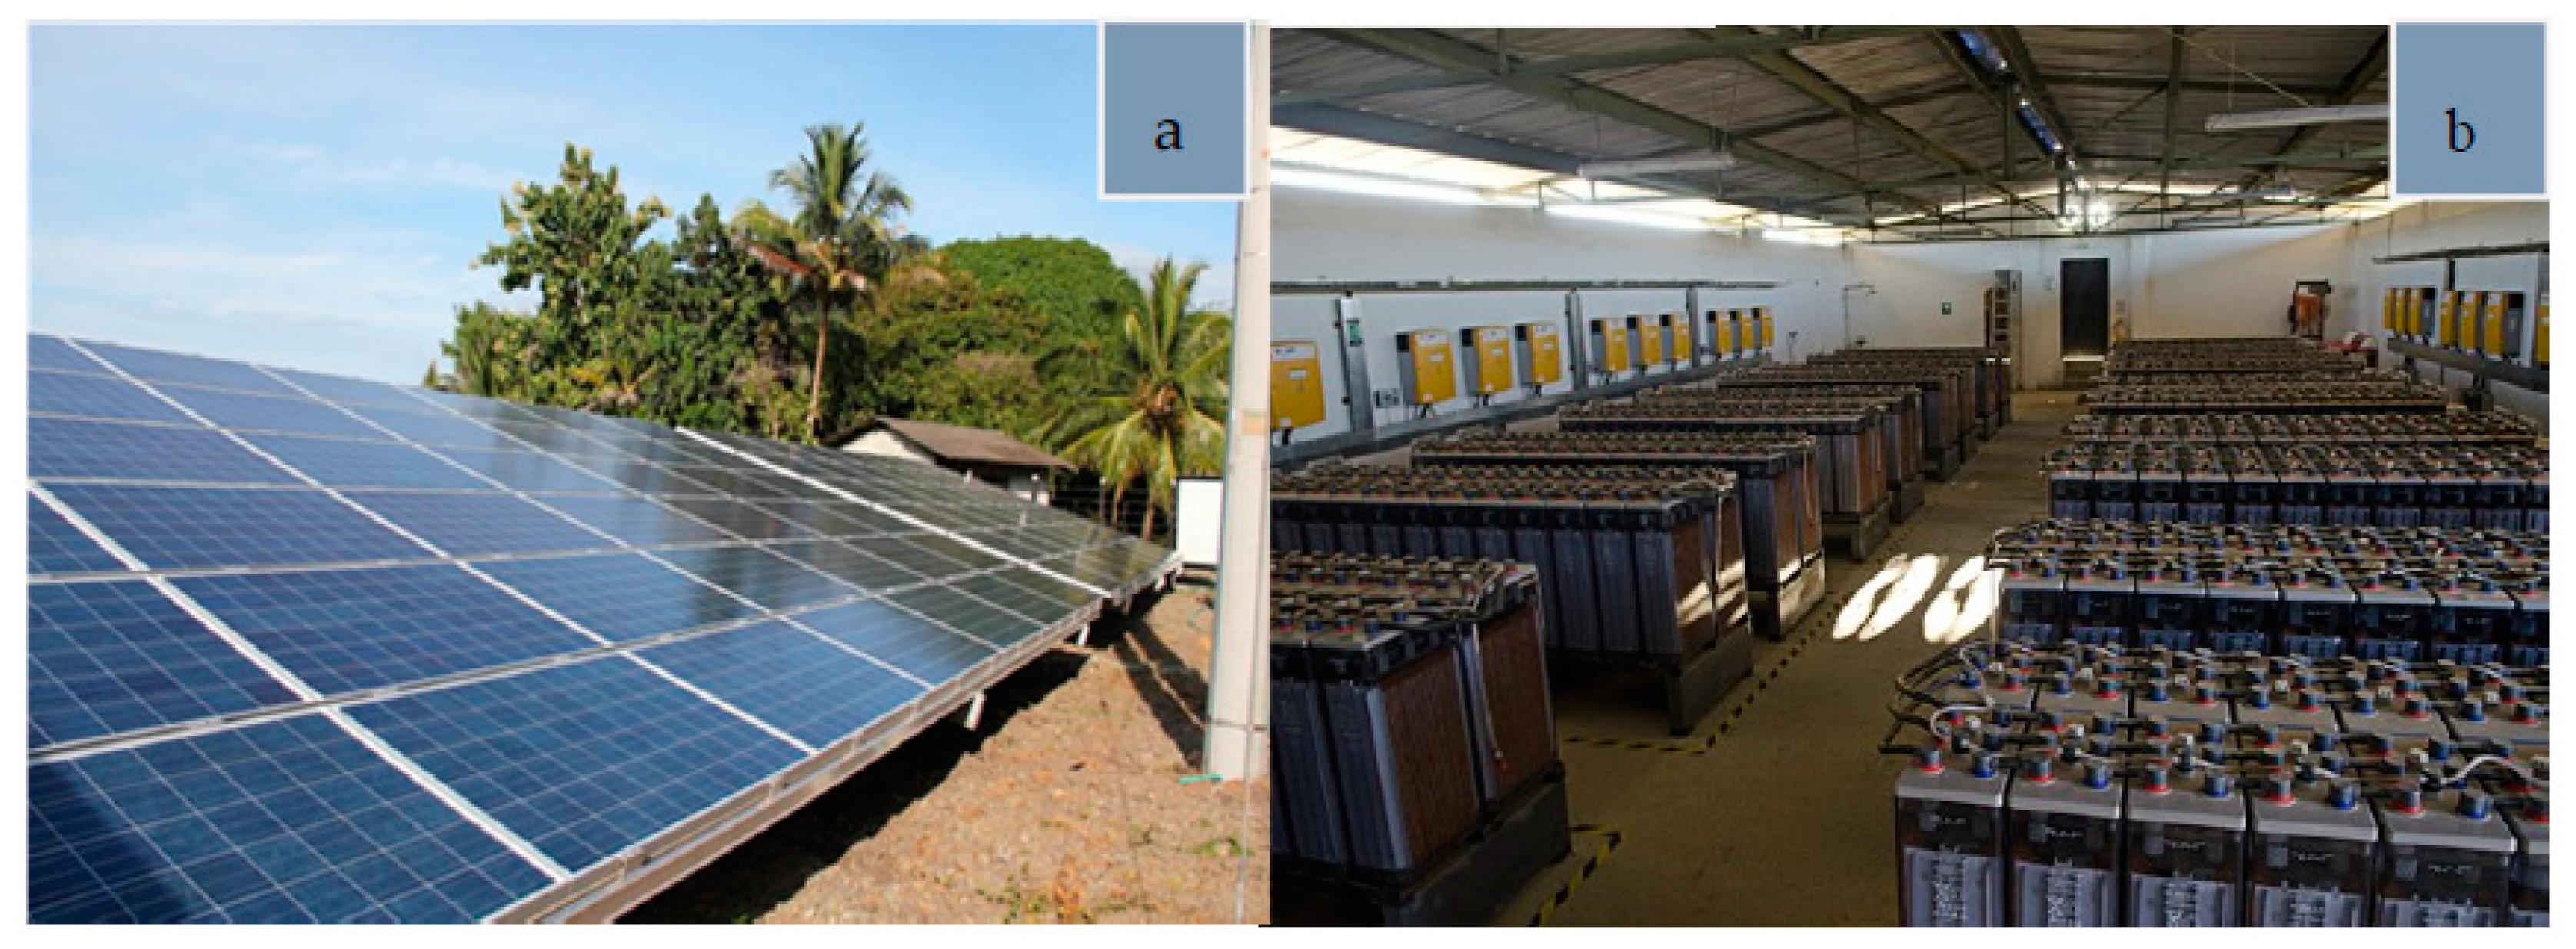
Figure 2 shows 2 of the systems considered in this work; they are currently operating as hybrid systems in Titumate and Puerto Estrella.
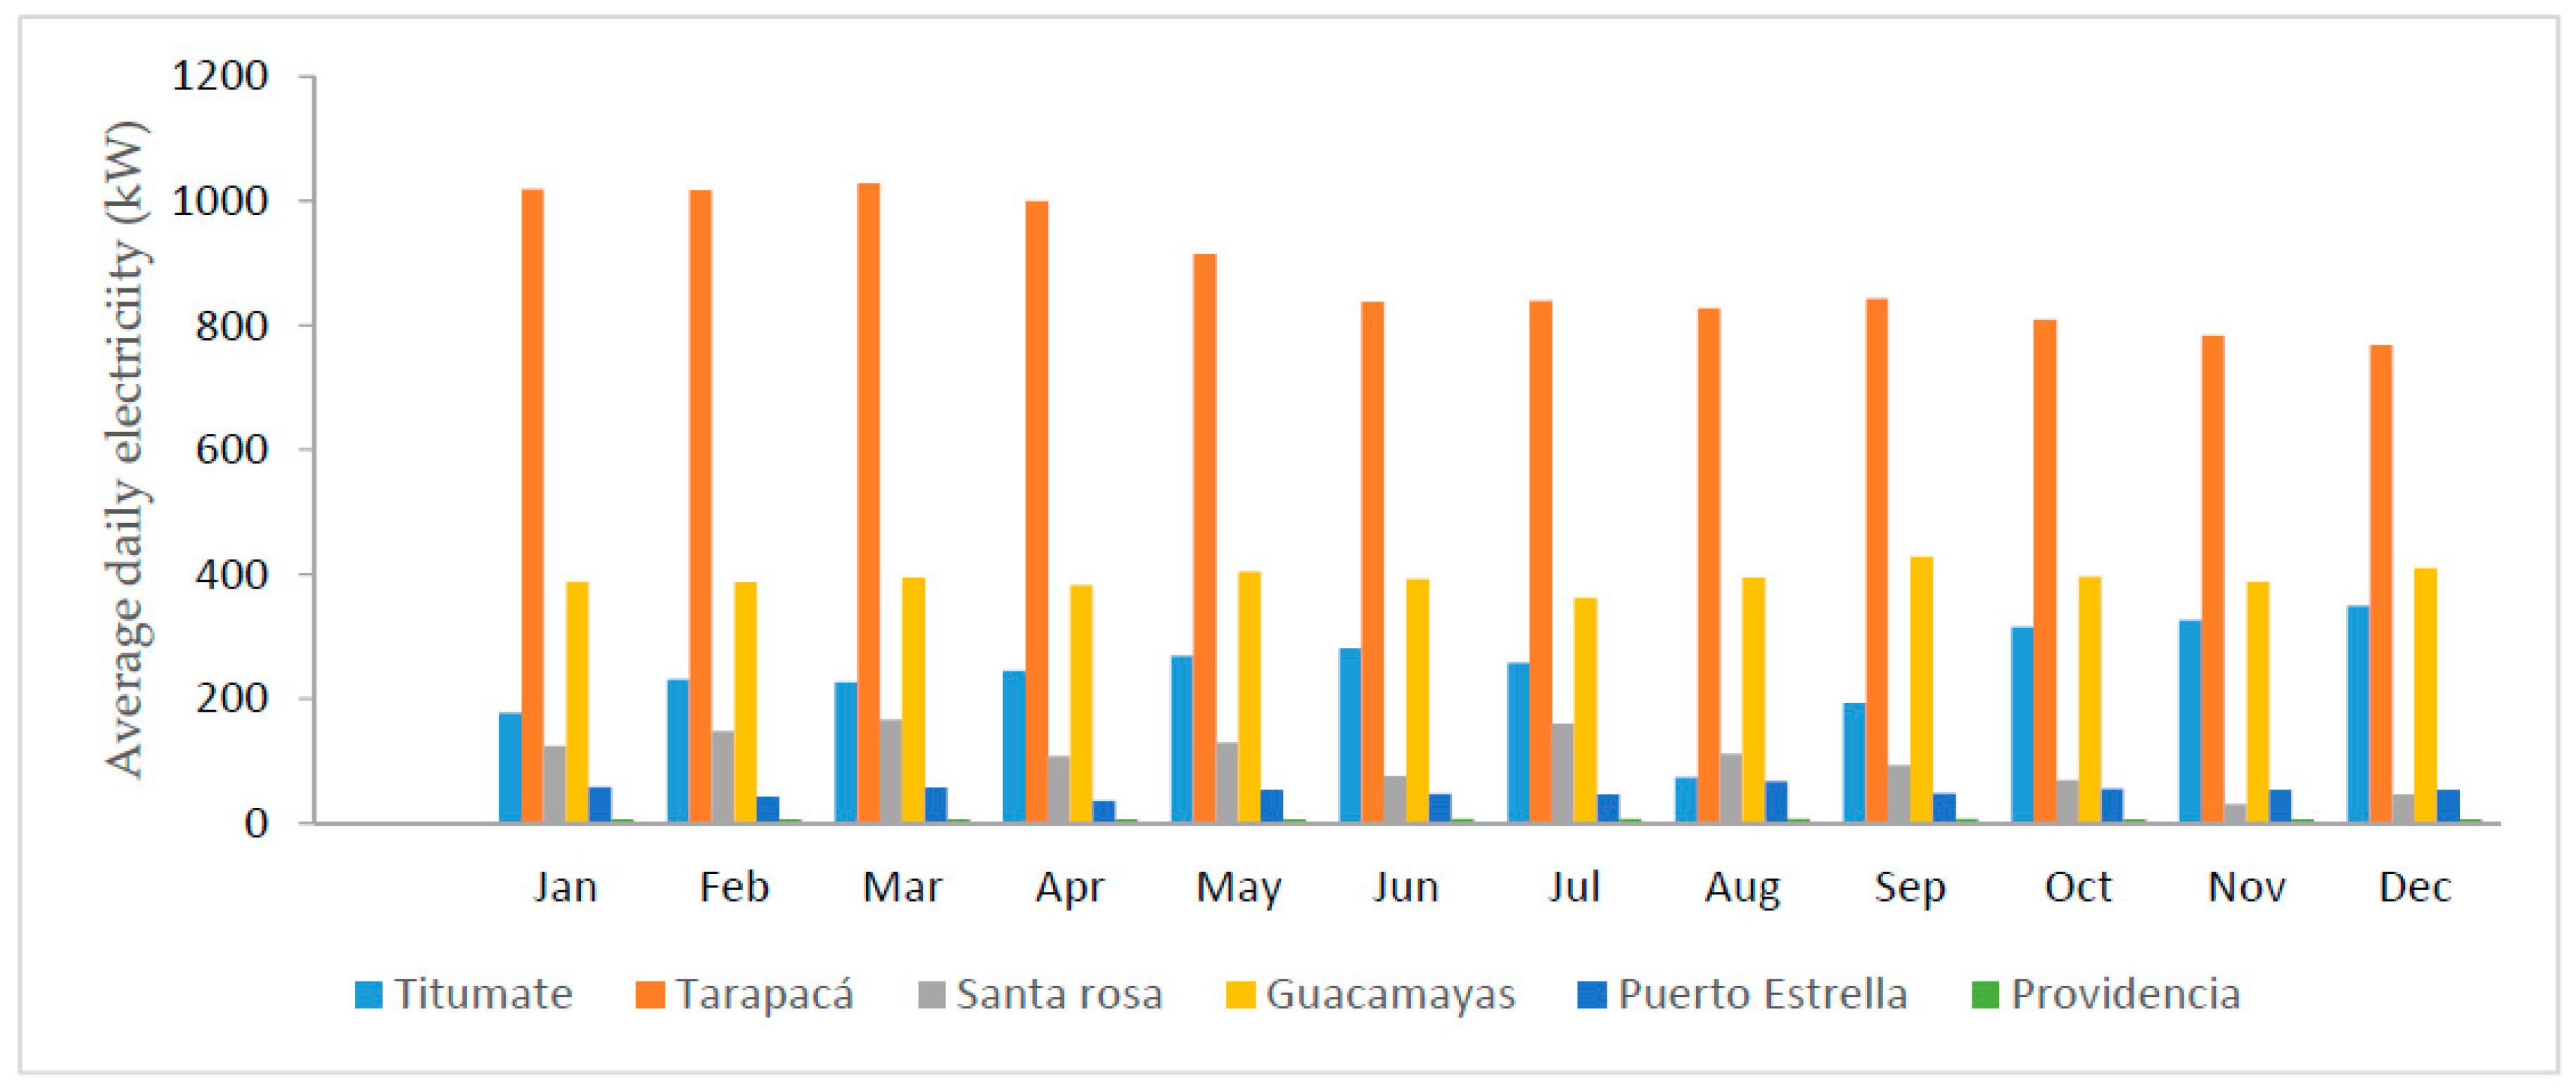
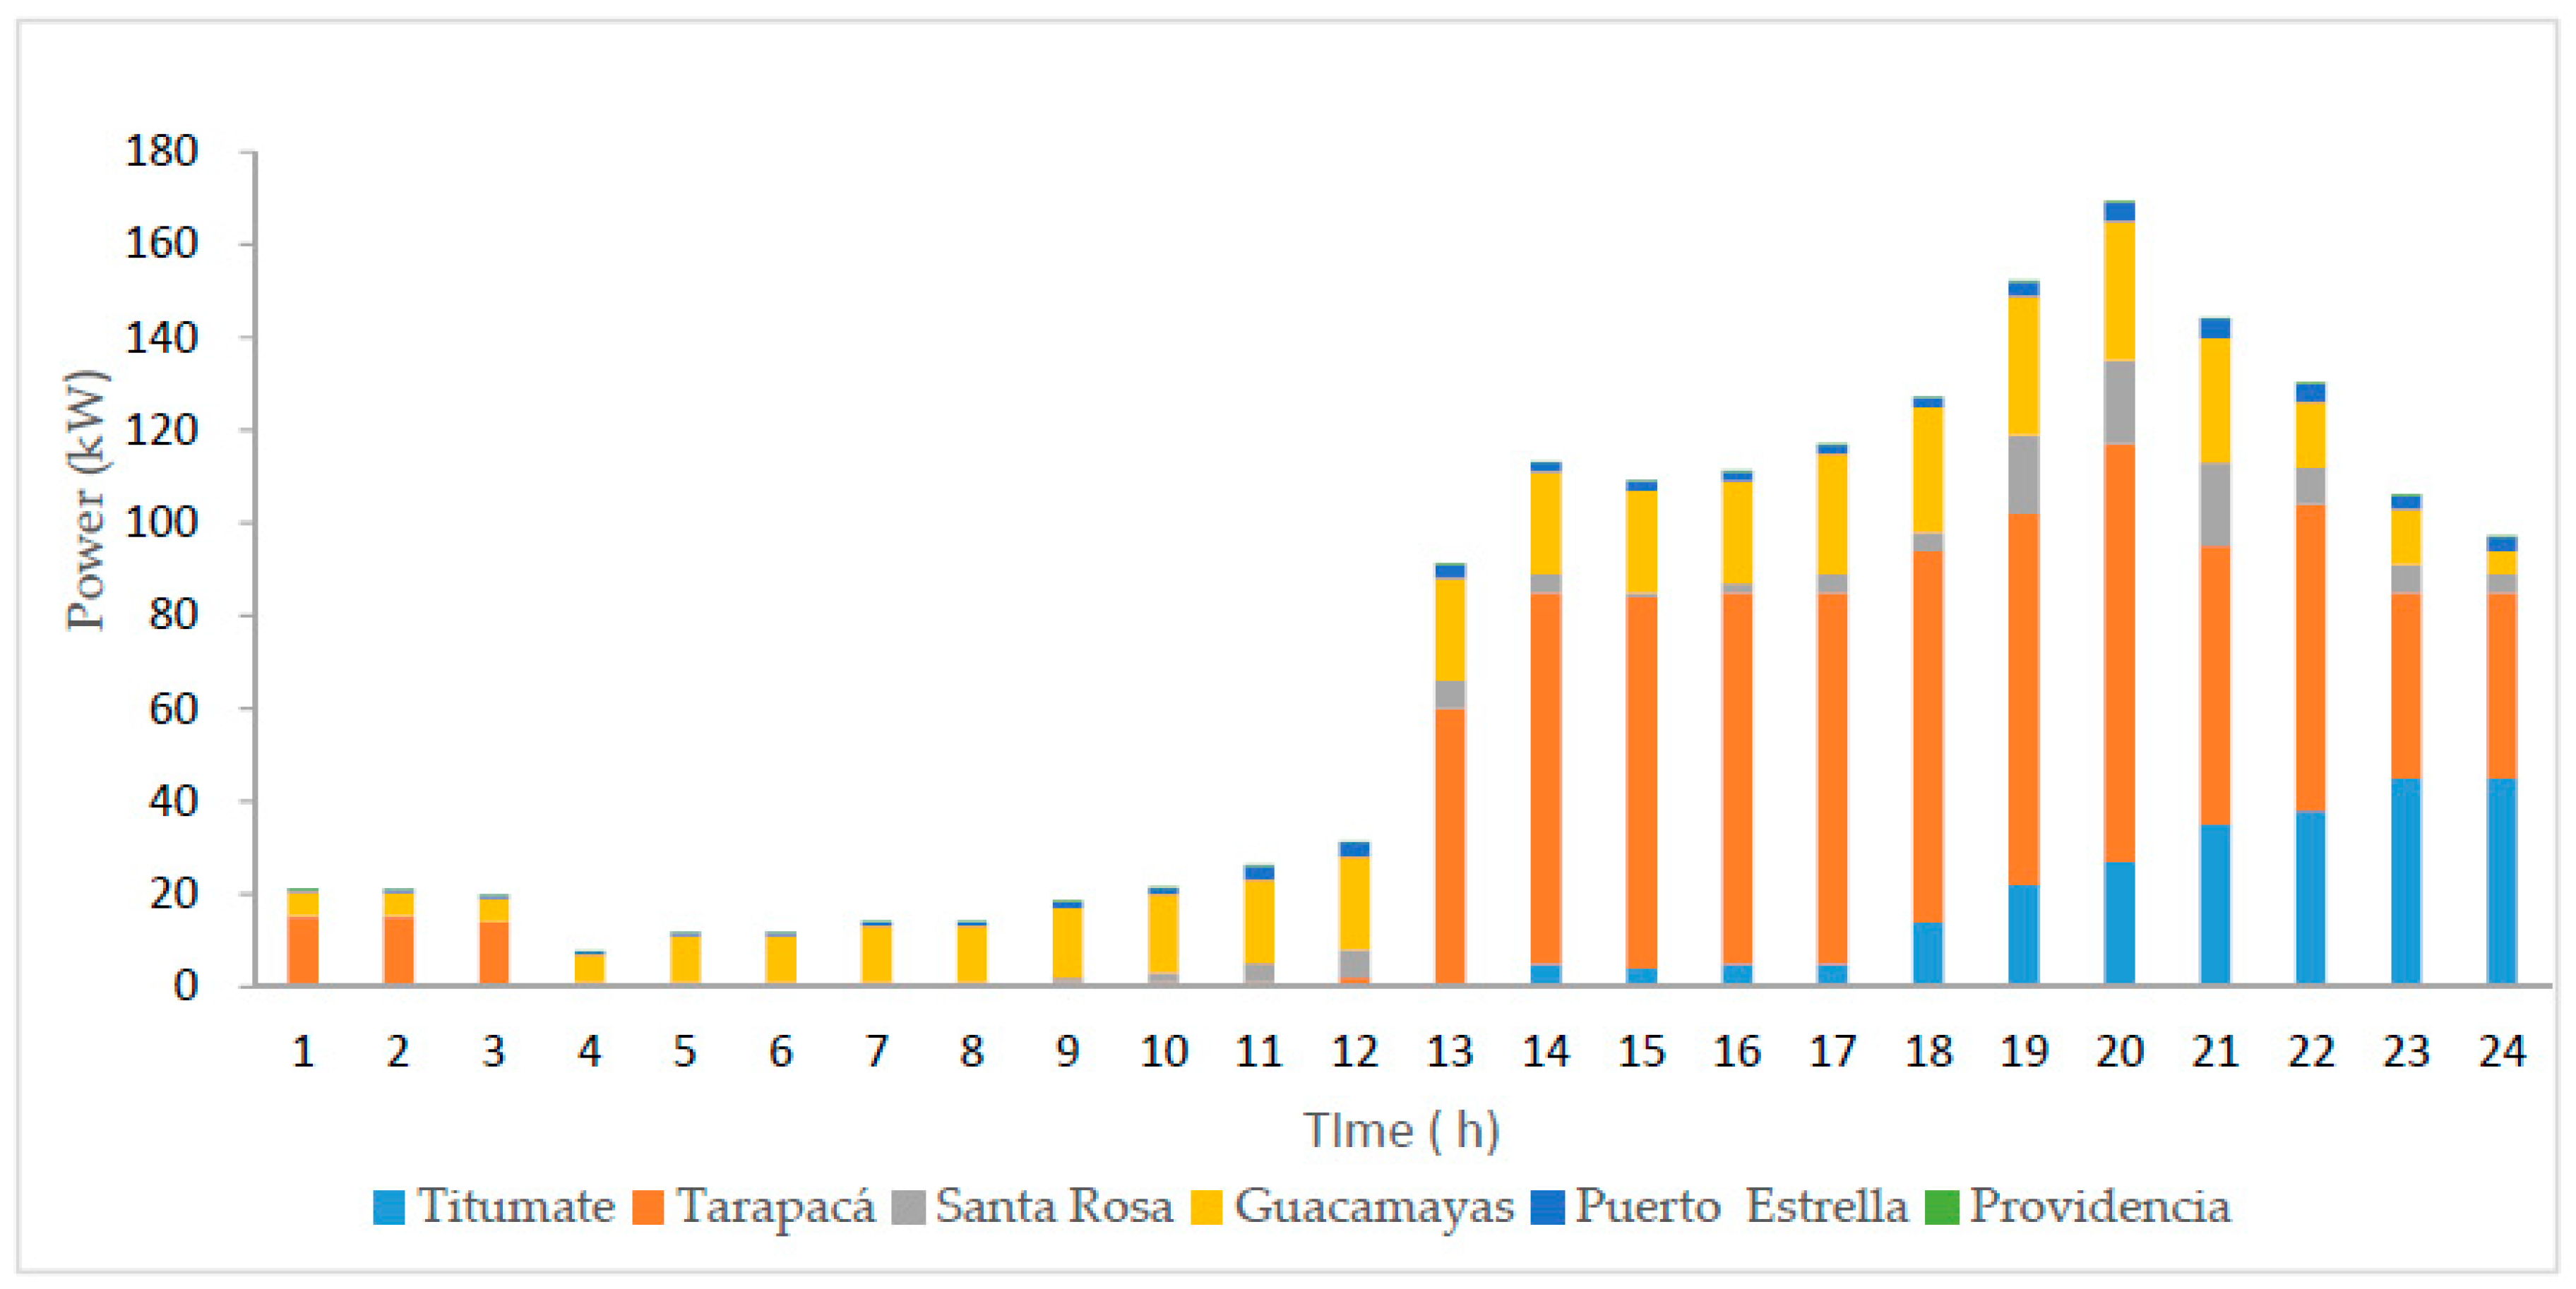
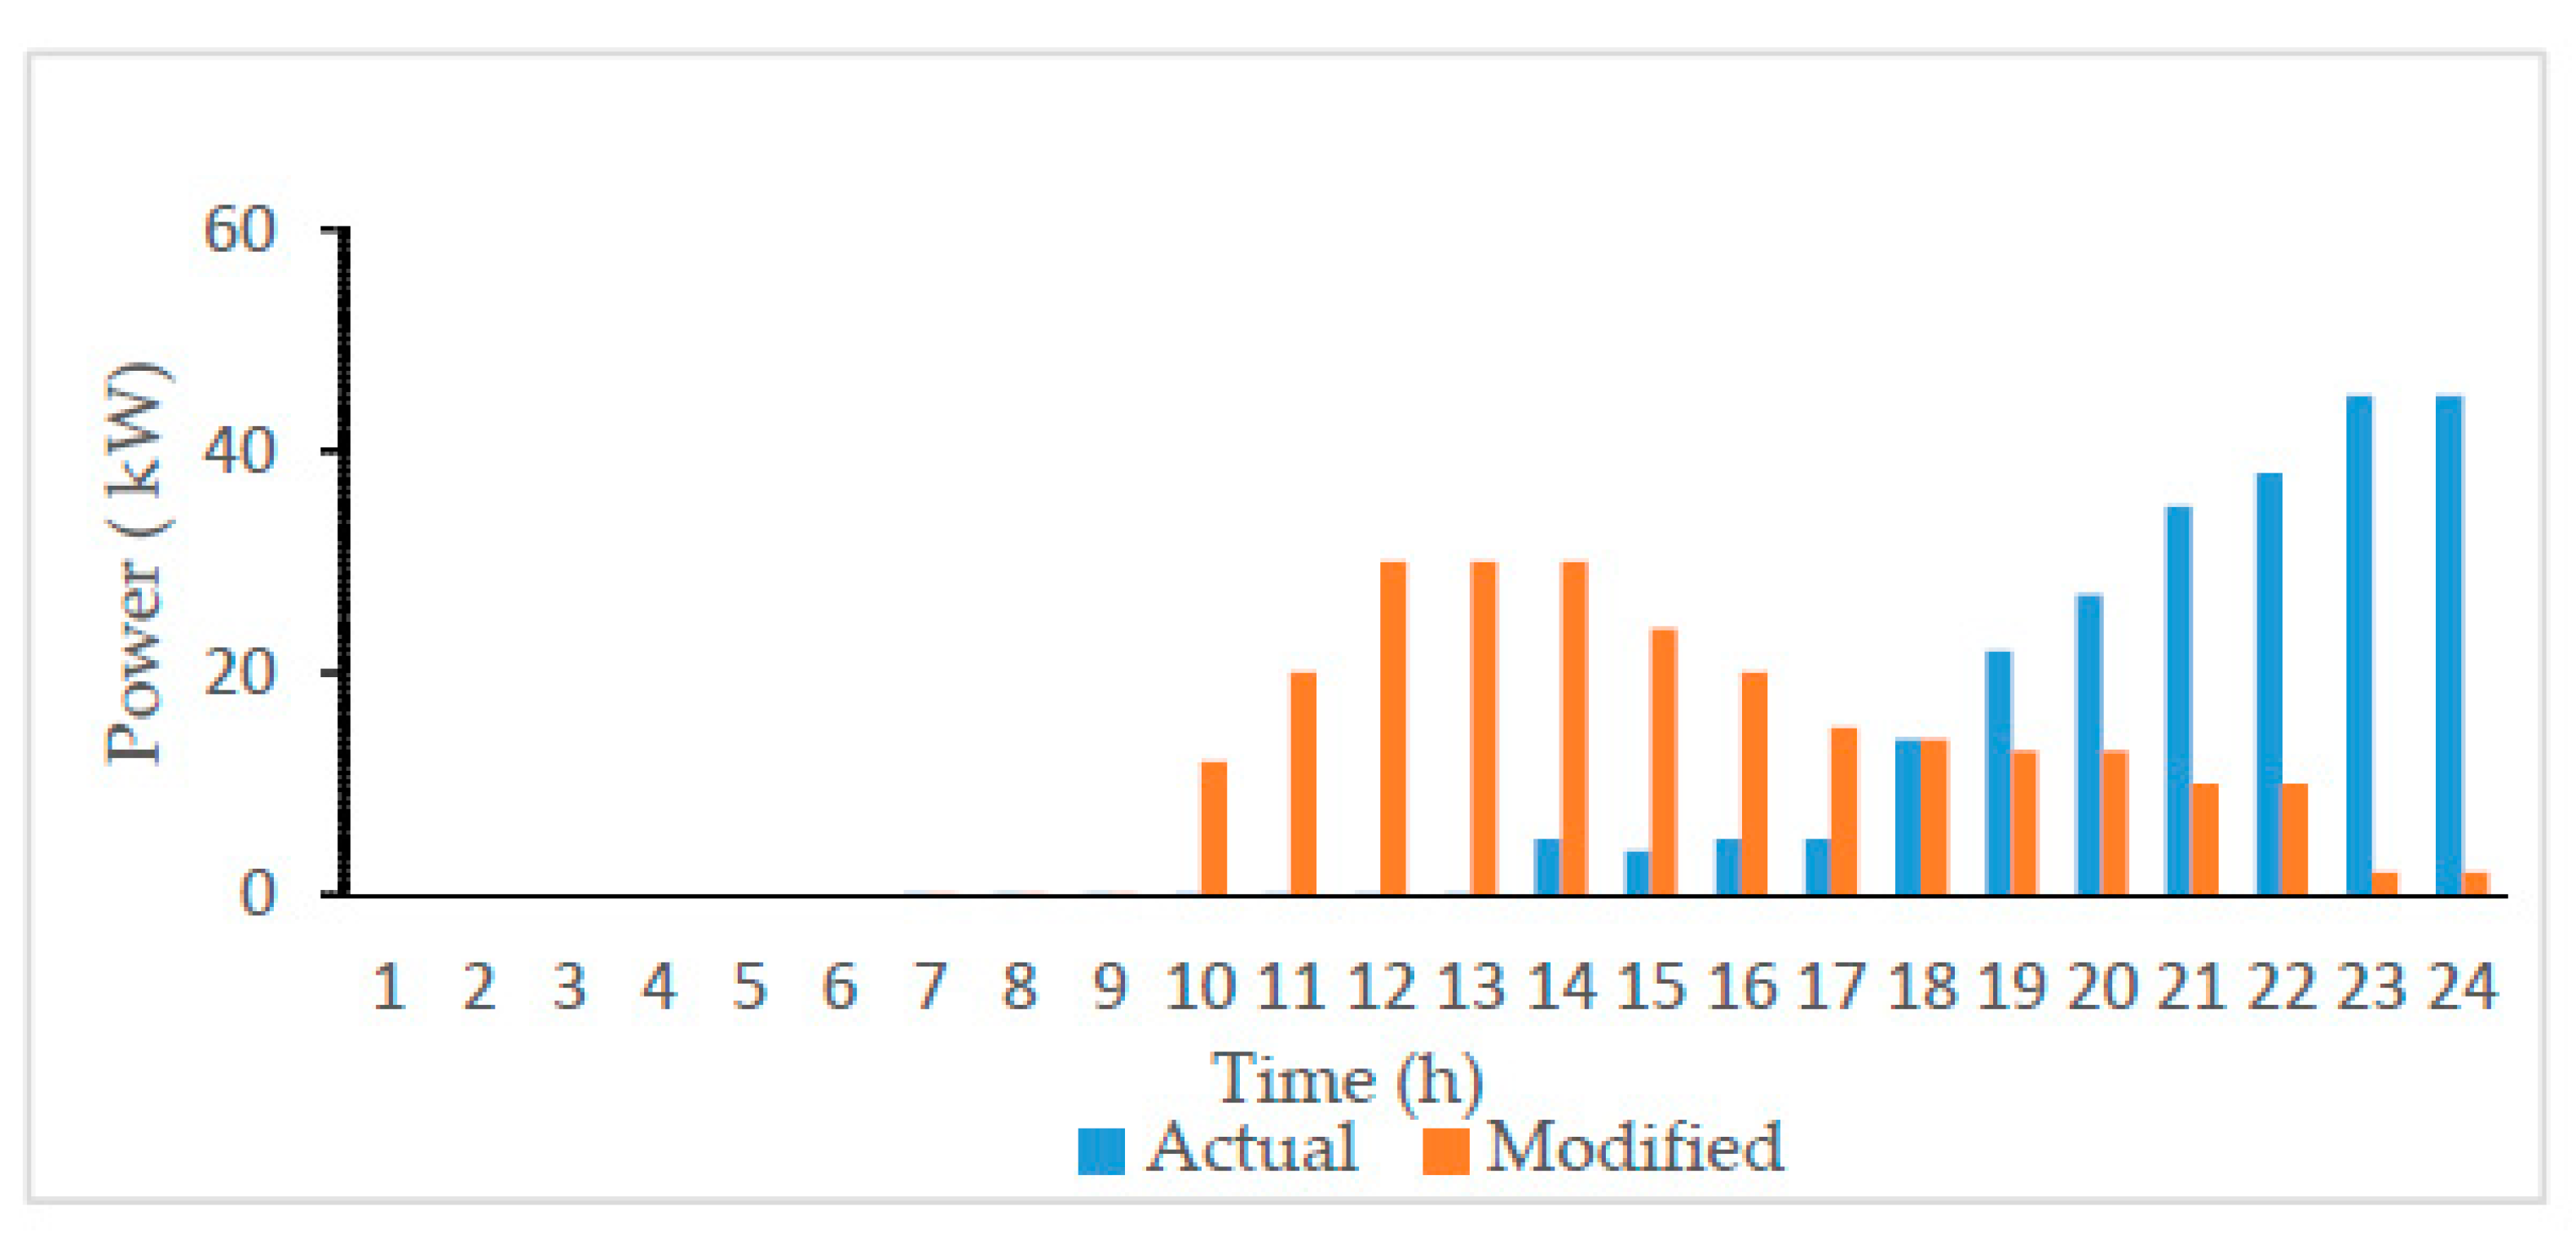
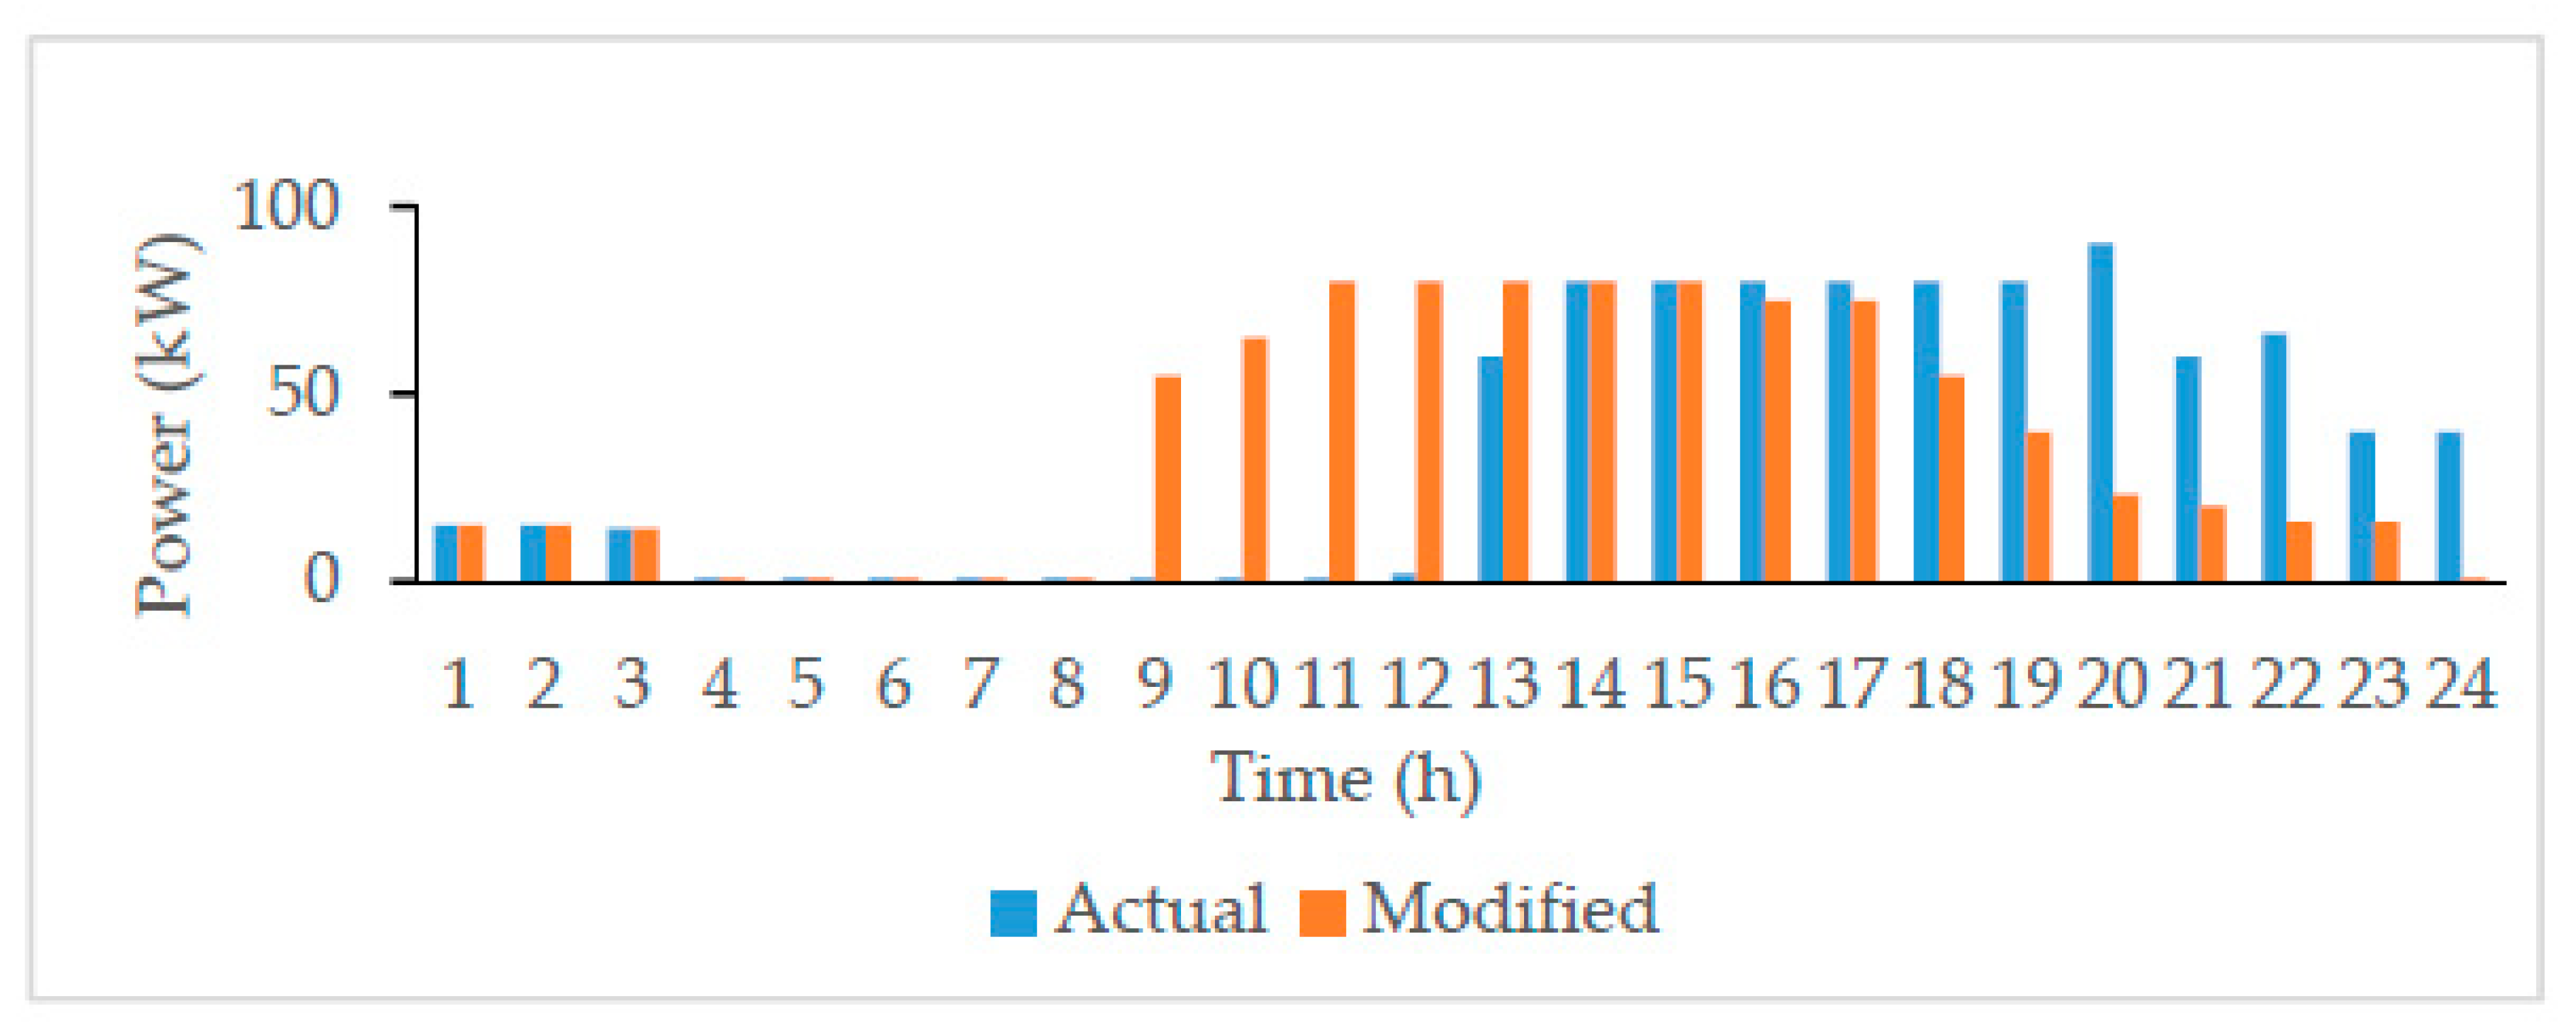
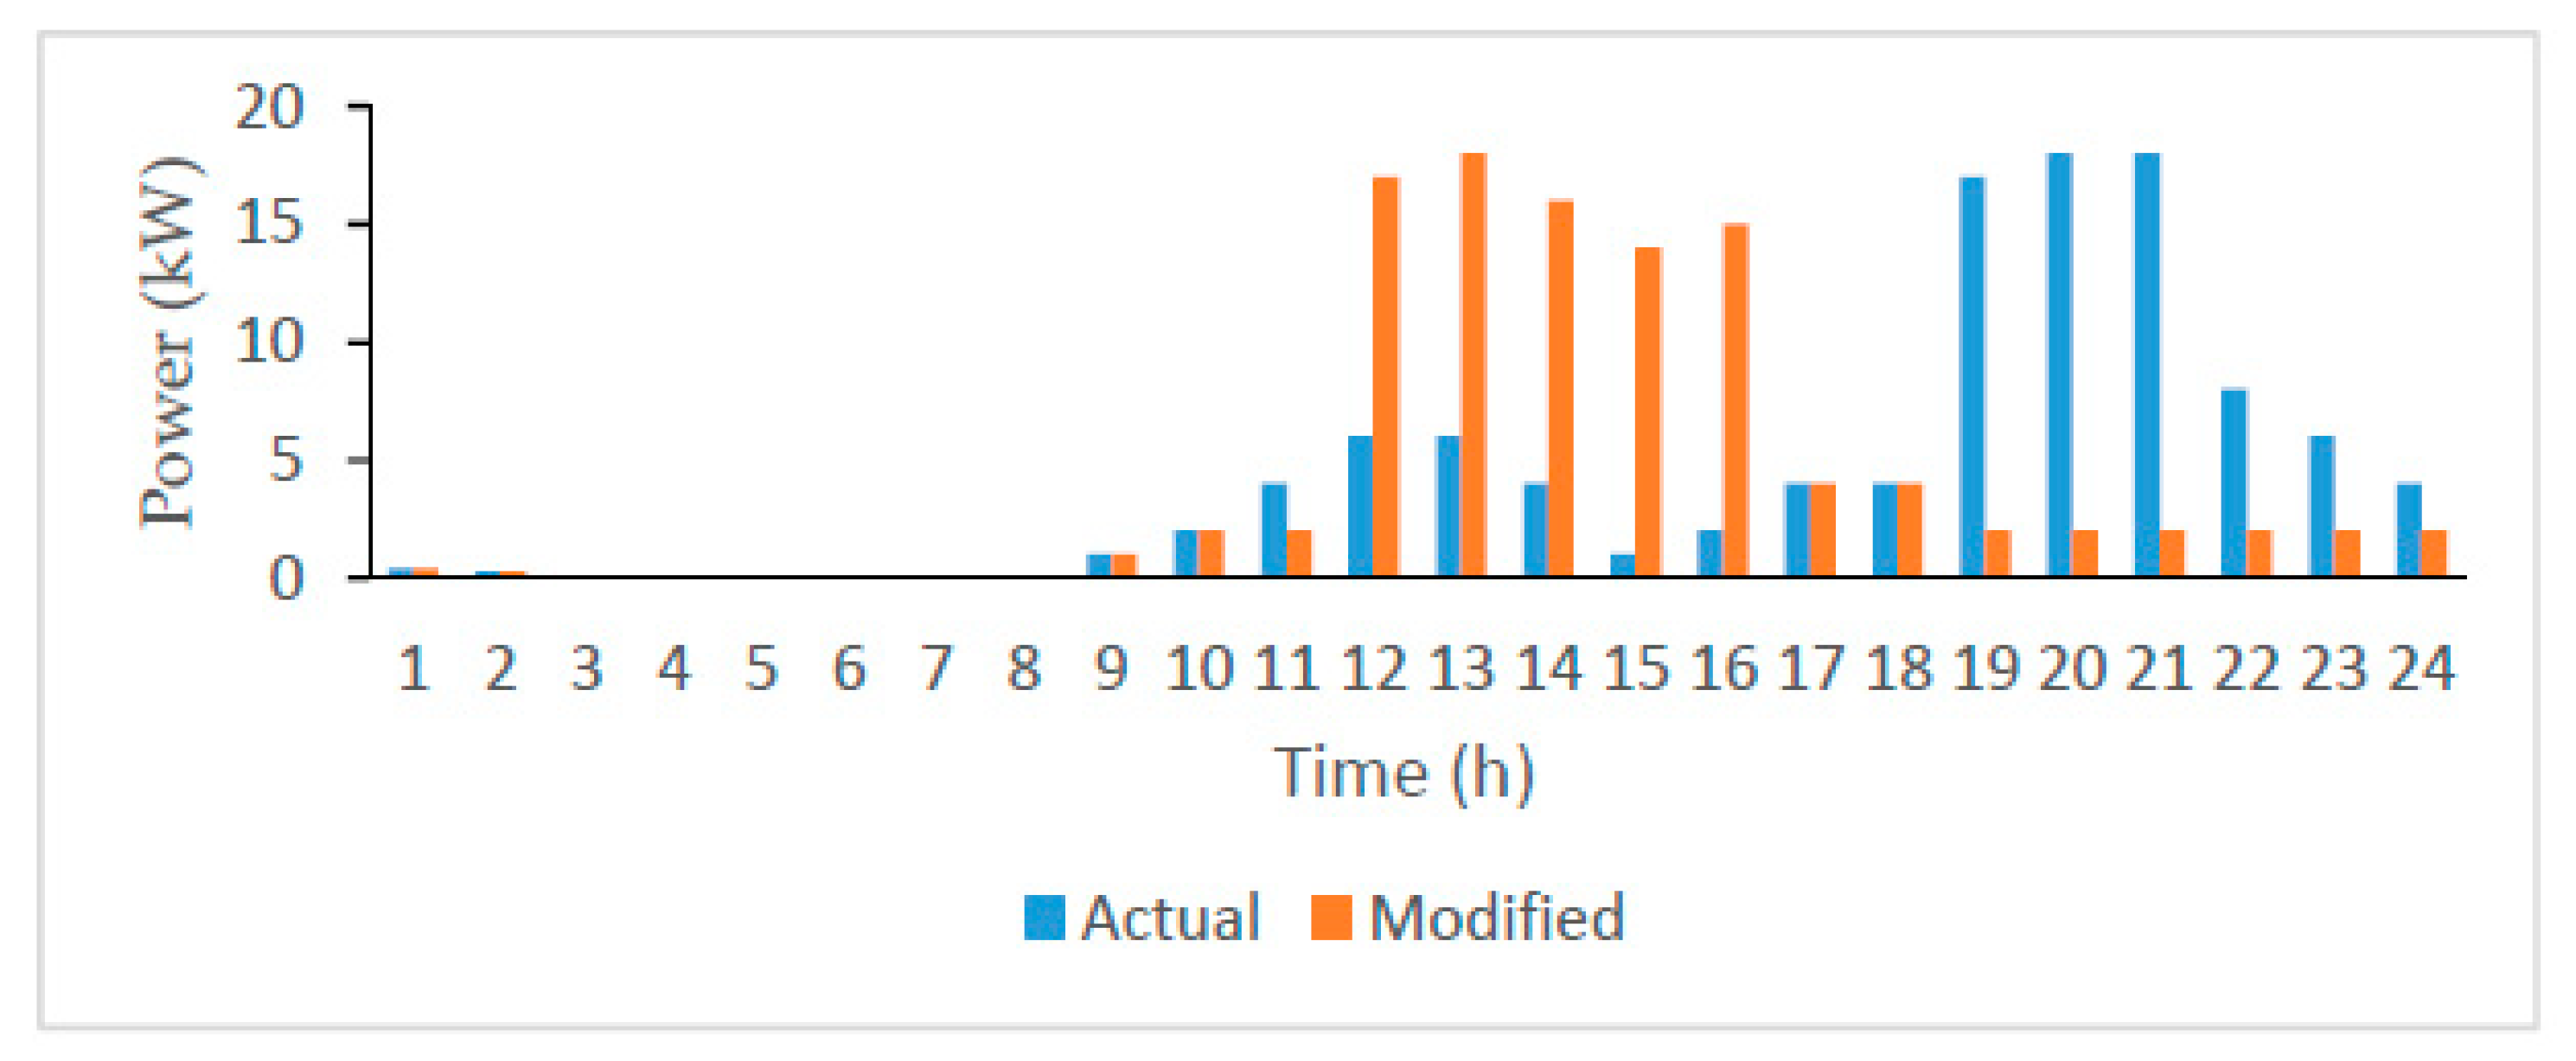
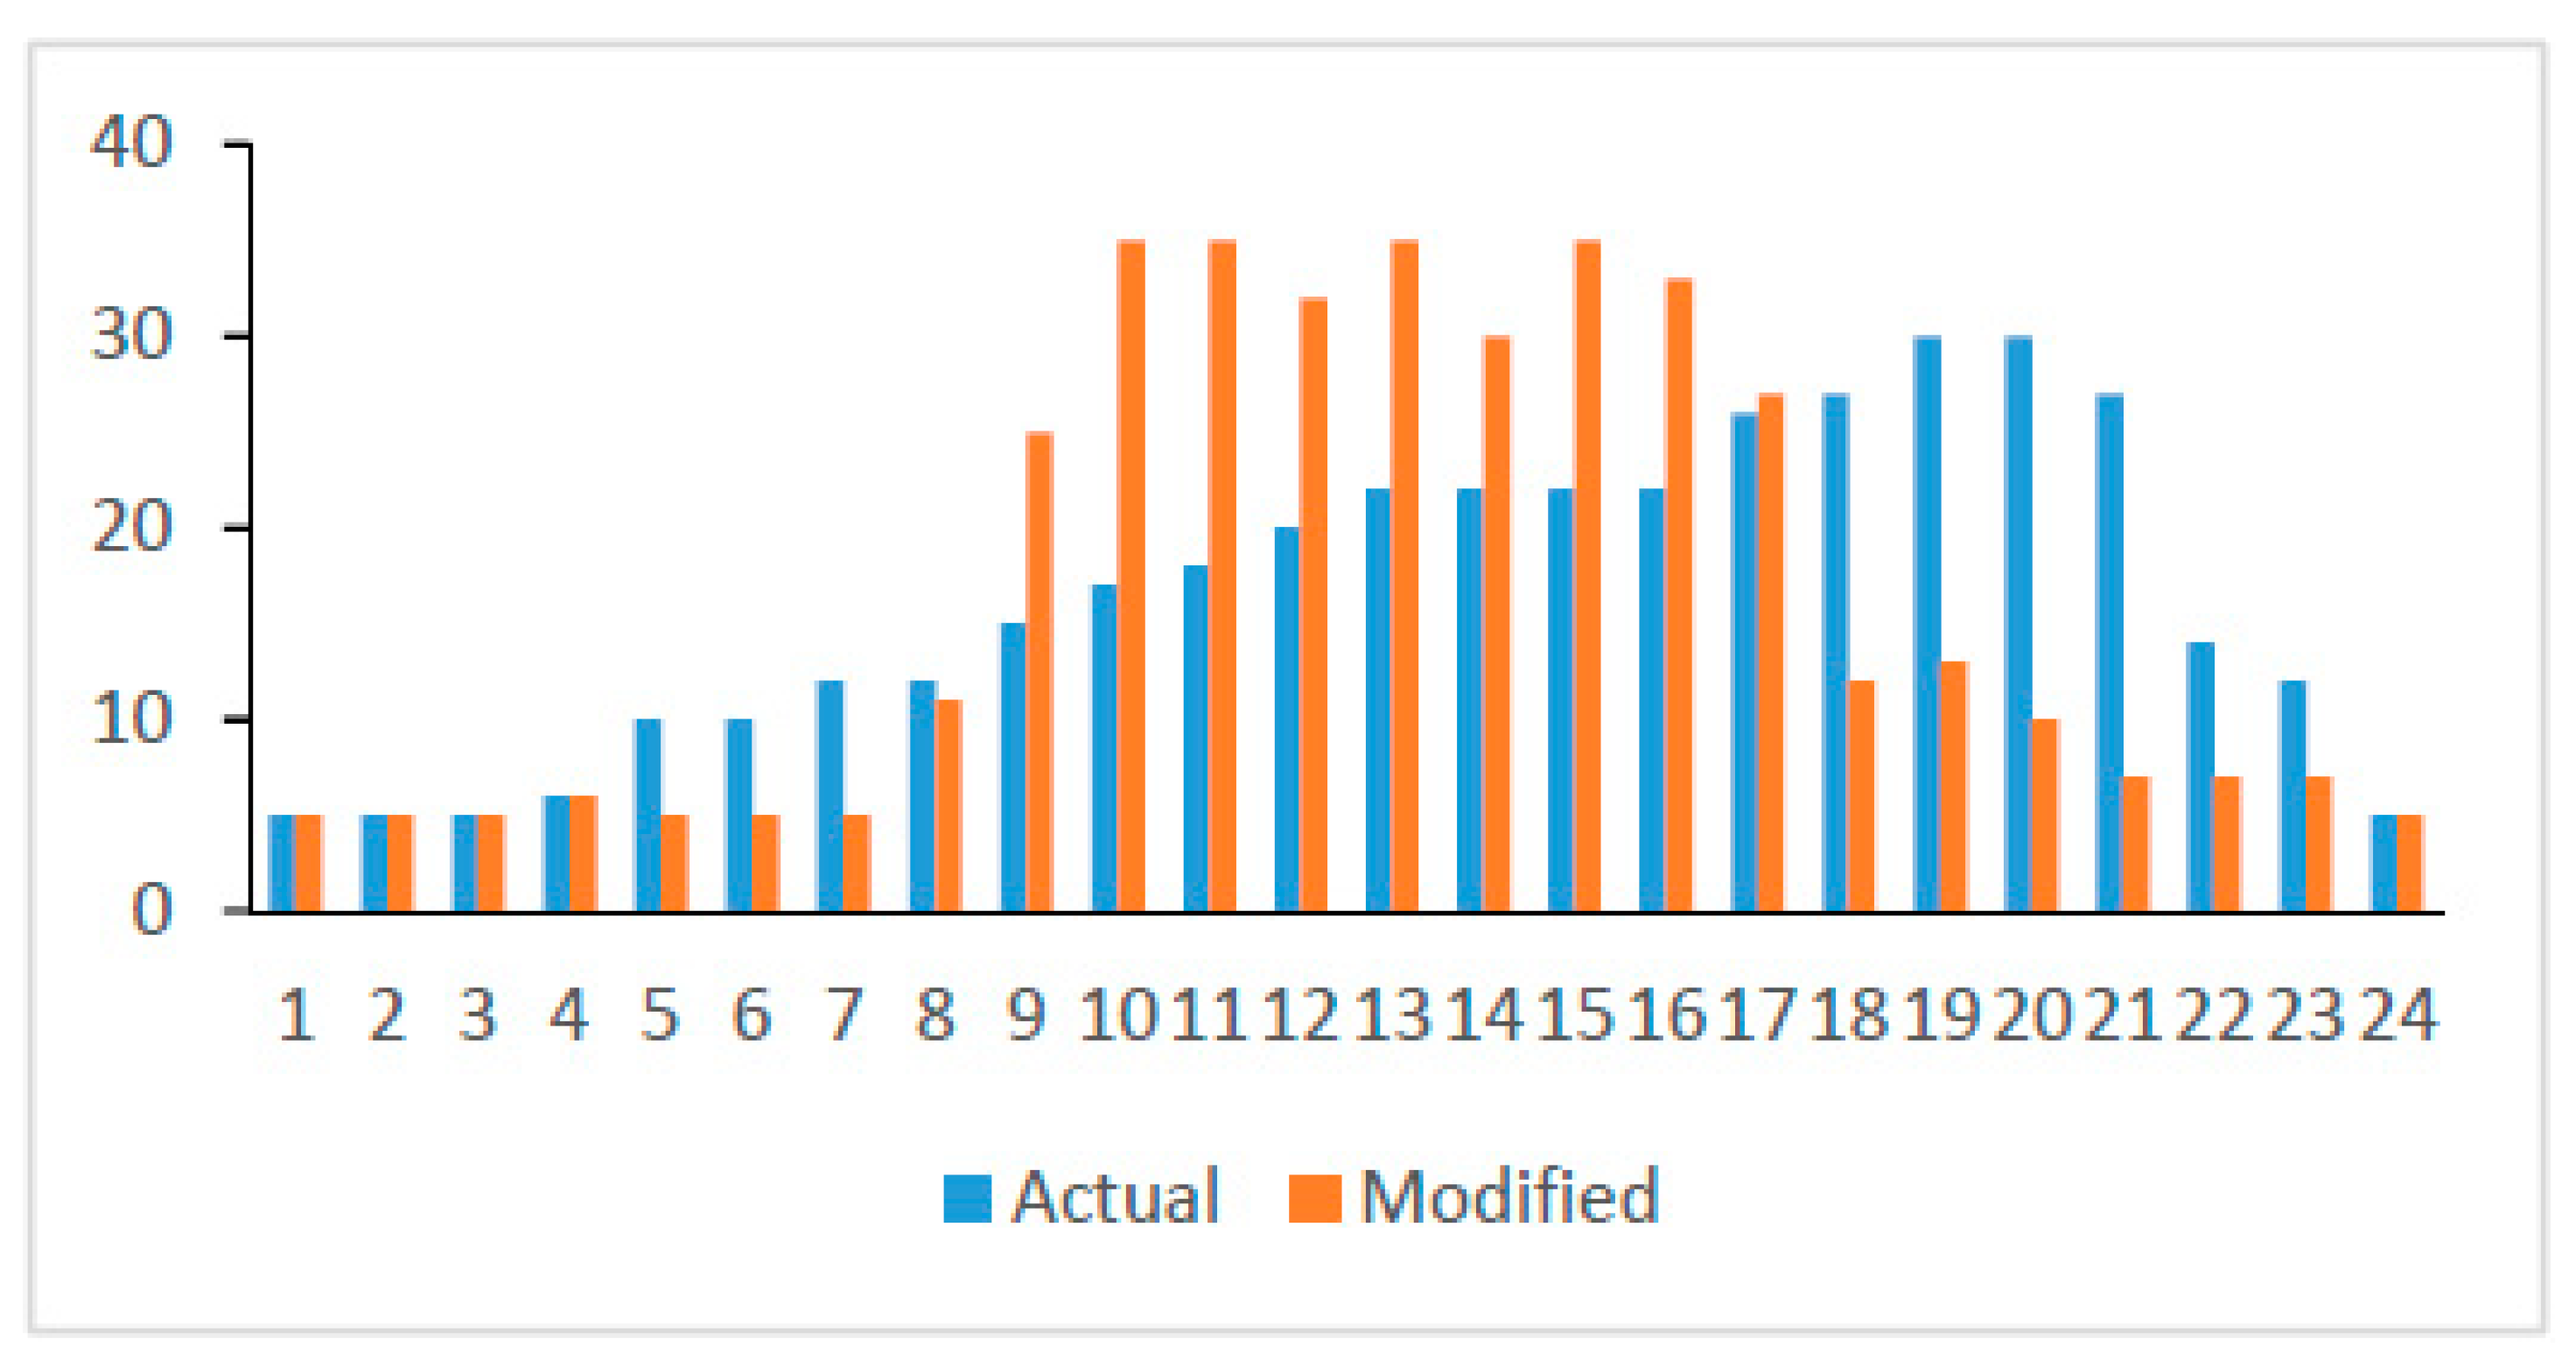
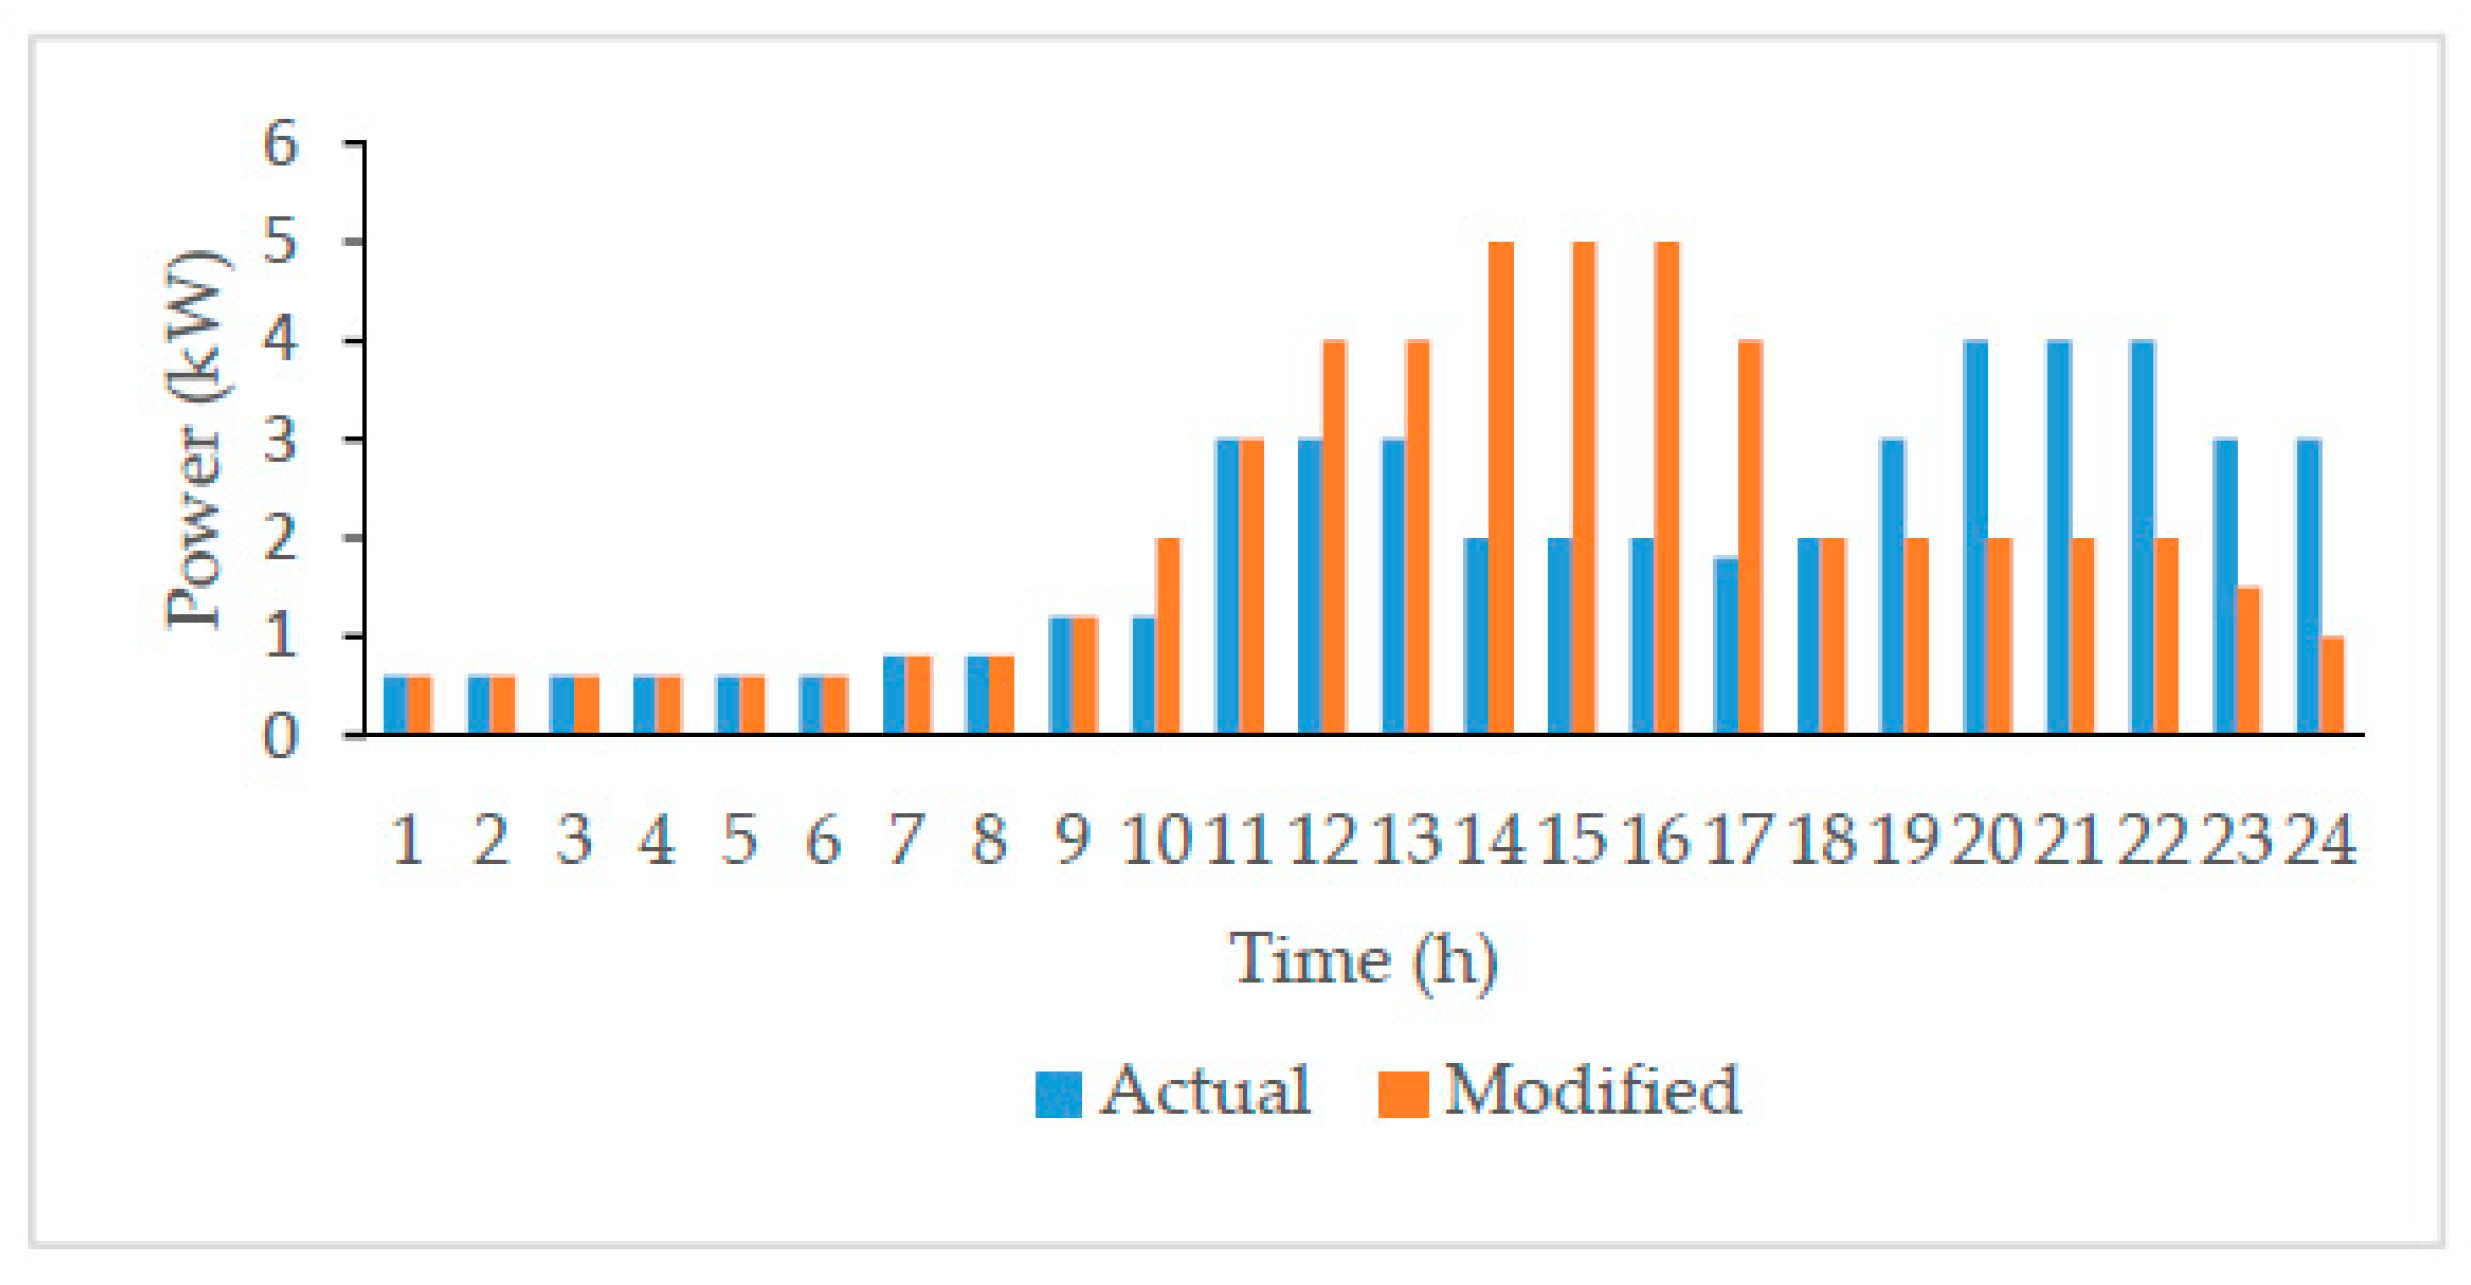
The annual profiles of the daily demand for the 6 locations were prepared using data provided by the national monitoring center of the Institute of Planning and Promotion of Energetic Solutions (IPSE) in the Non Interconnected Zones [
50].
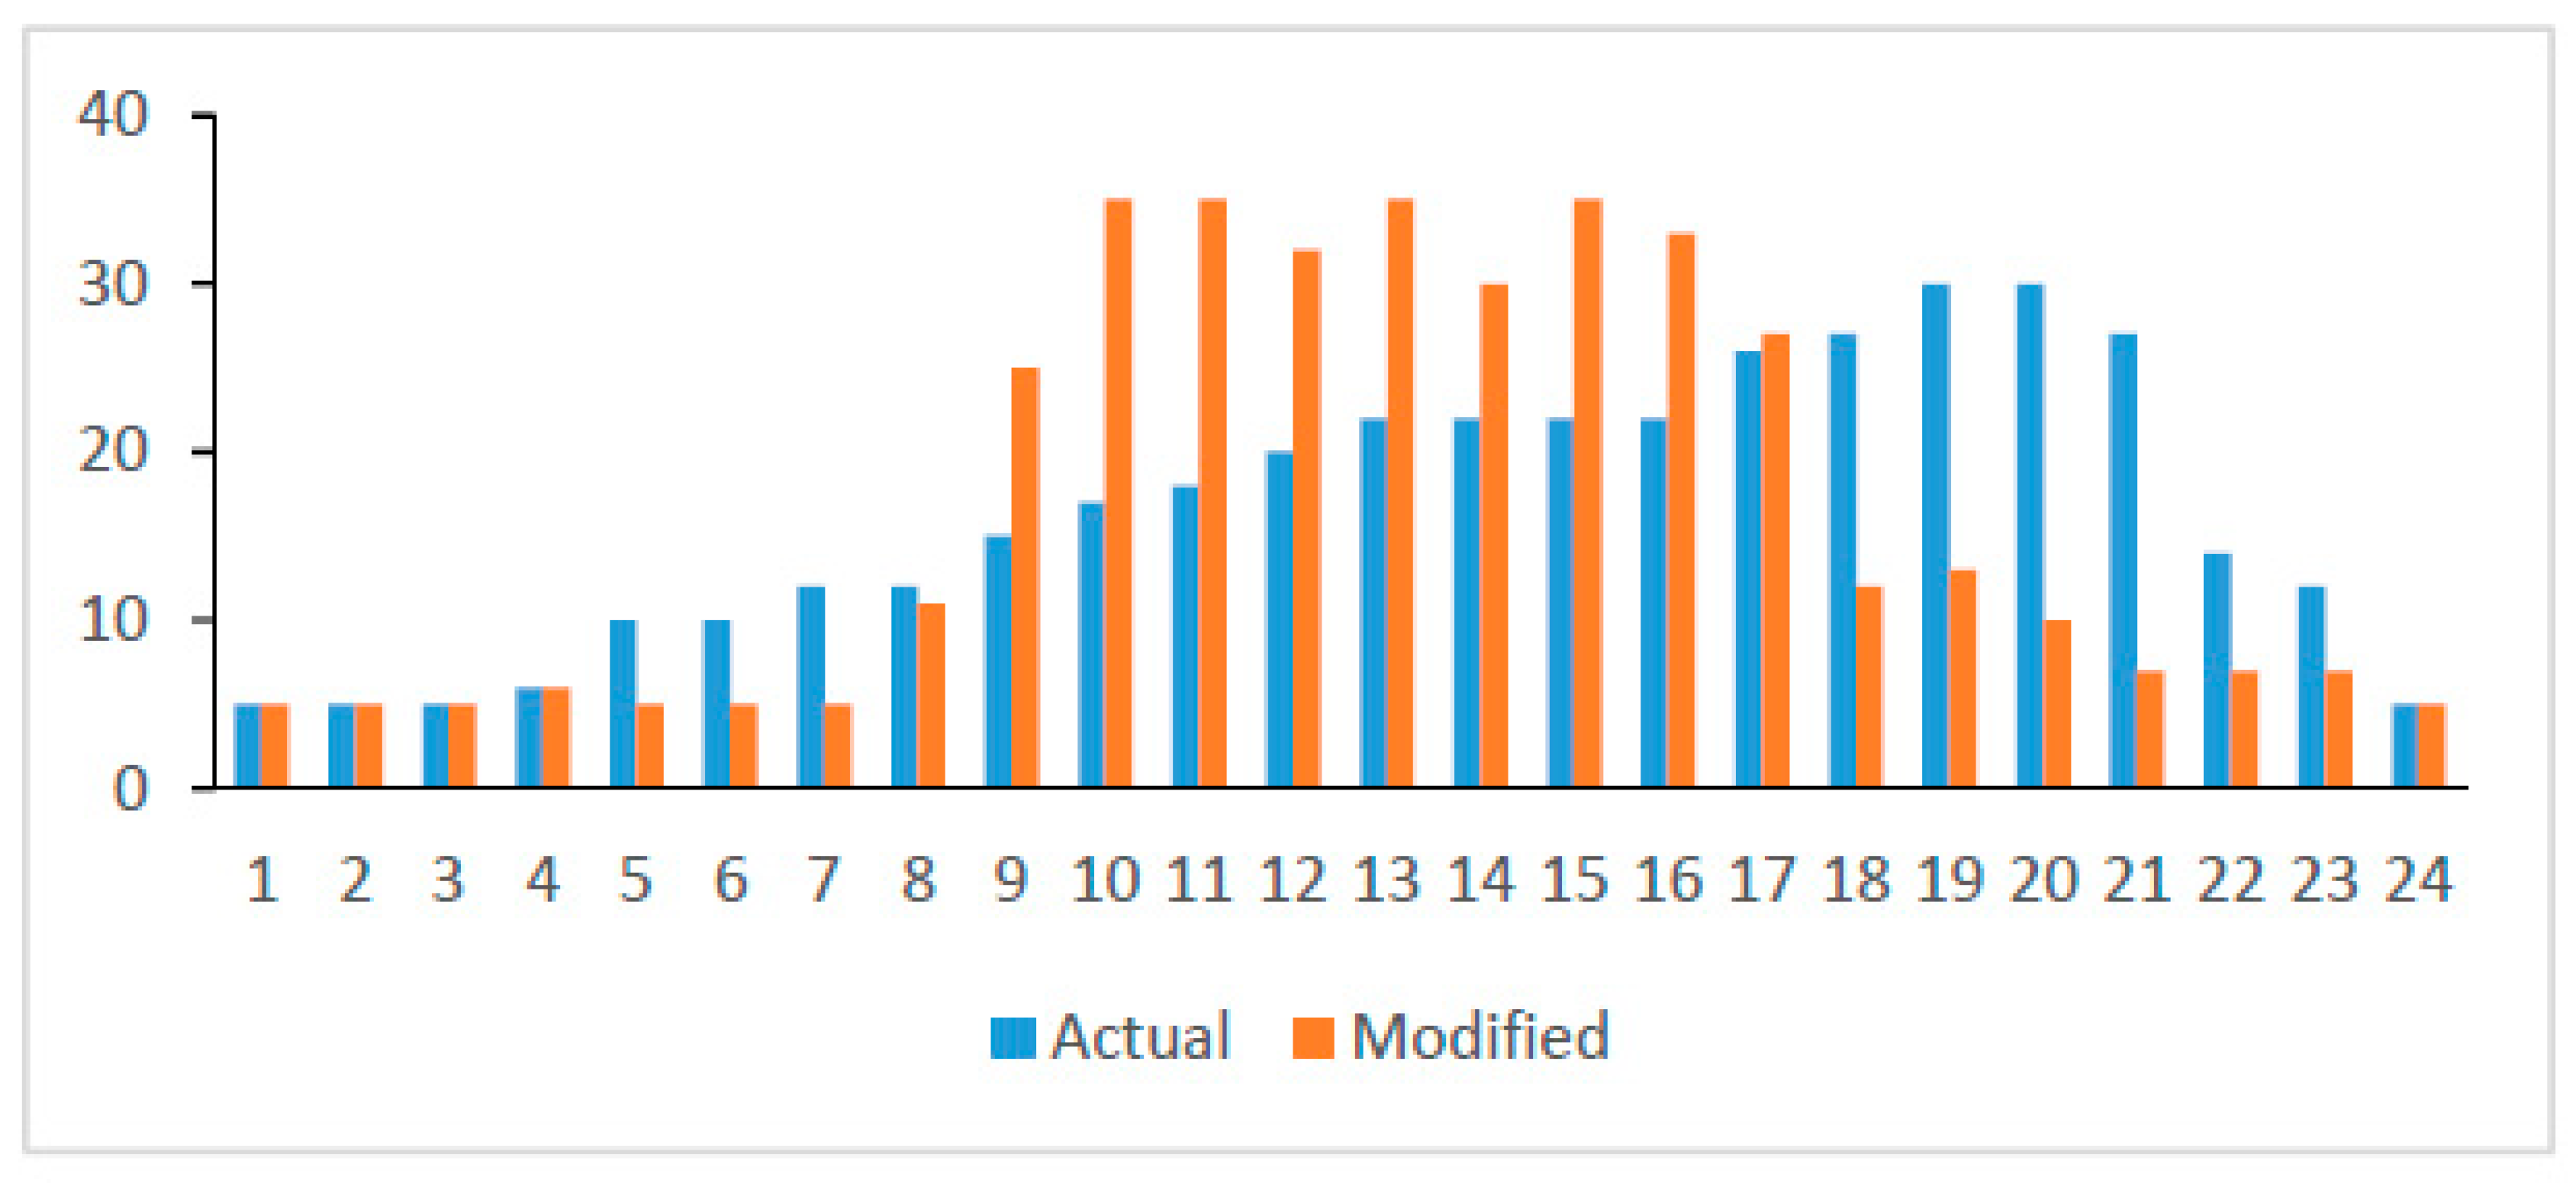
Figure 3 and
Figure 4 show the average daily demand curves for one year, as well as the daily demand profile for the 6 locations. It is important to note that most of the energy demand is produced at night, except in the case of Providencia, where consumption is similar during all hours of the day. In some of the simulations, a modified demand curve was used applying demand-side management [
51,
52].
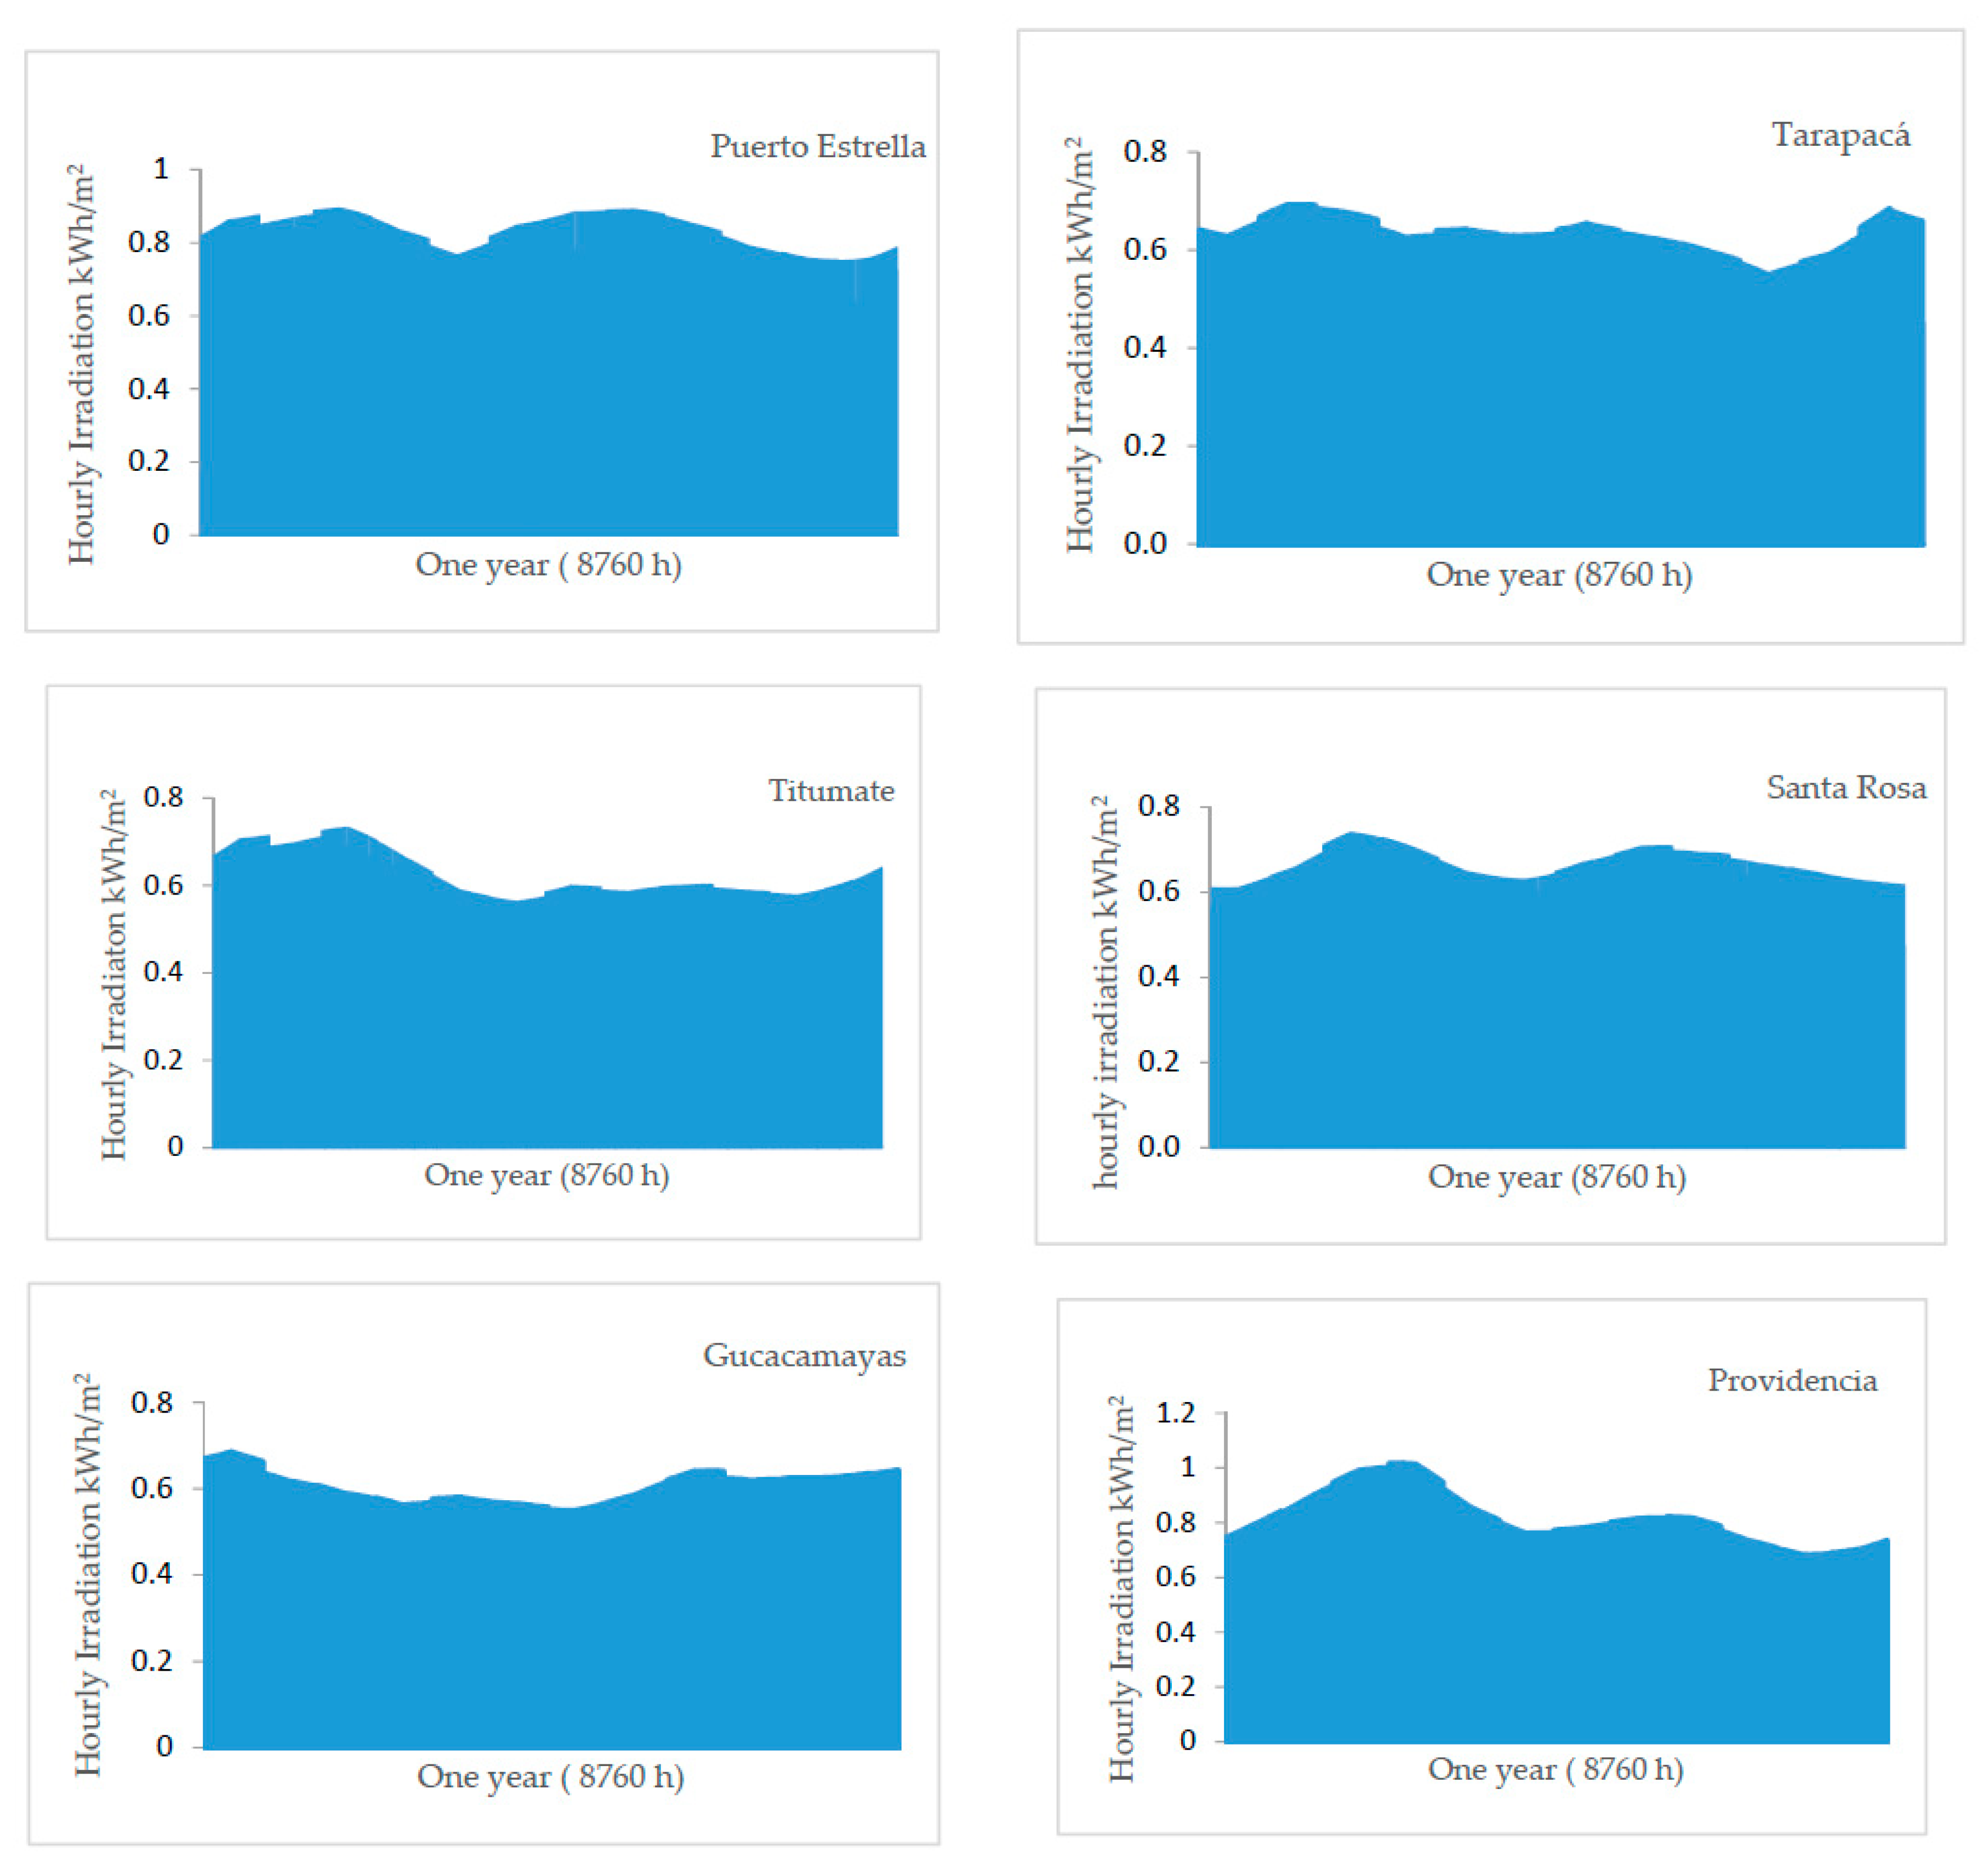
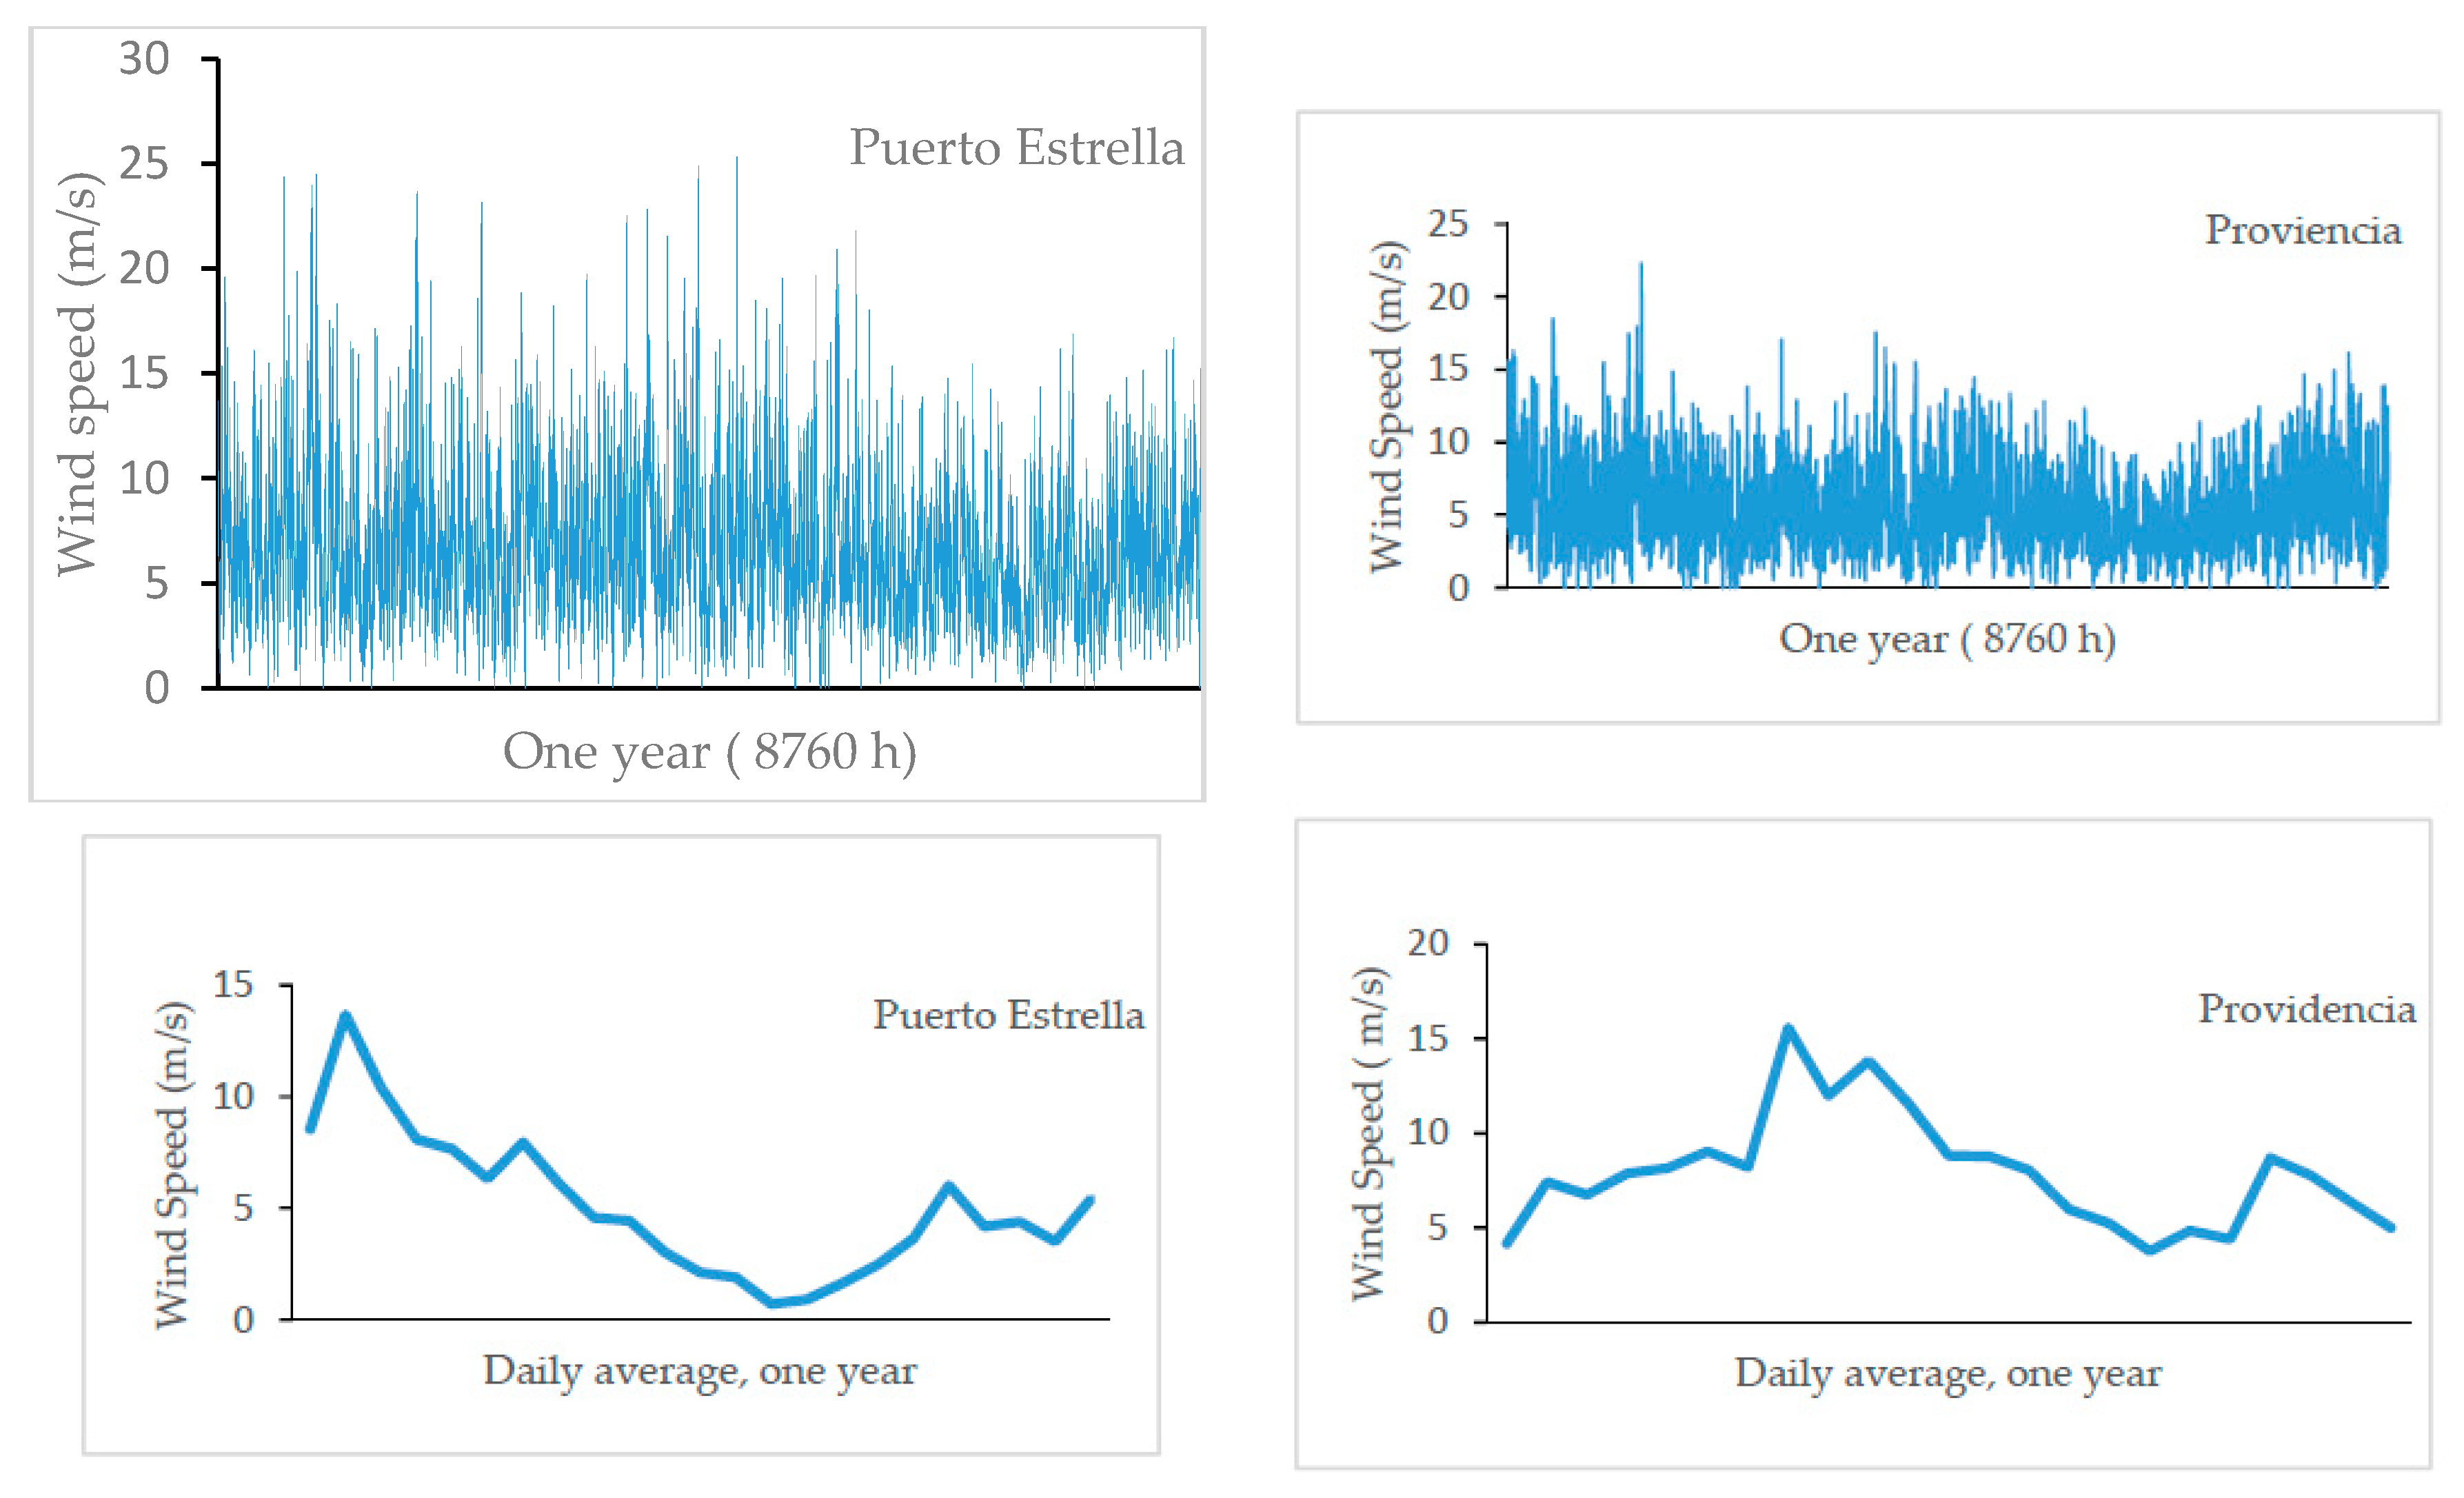
2.4. Availability of Renewable Resources
The 6 locations selected for this study have average daily irradiation values of 4.5 kWh/m
2/day, exceeding the global average value [
53]. On the other hand, only in Puerto Estrella and Providencia is generation by wind resource viable, with both having an average wind speed greater than 8 m/s [
54].
Figure 5 and
Figure 6 show the hourly irradiation and wind speeds over a whole year. Puerto Estrella is located in an area with the highest average wind speeds in South America, making wind power generation viable [
55].
2.5. Parameters Used in the Optimization
Table 4,
Table 5,
Table 6,
Table 7,
Table 8 and
Table 9 show the parameters used in the optimization of the microgrids in the 6 locations. Commercial PV modules, wind turbines, batteries, diesel generators and inverter/chargers were selected. The minimum/maximum number of components in parallel shown in
Table 9 were obtained with the pre-sizing calculations of iHOGA, these were needed to limit the search space in the optimization. In all cases, it has been considered that the lifespan of the system coincides with that of the photovoltaic generator (25 years). The models used to estimate battery lifetime were those of Schiffer et al. [
56] for lead-acid, and the model by Wang et al. [
57] for LiFePO4/graphite lithium iron phosphate batteries. For the diesel generators and the wind and hydraulic turbines, the mathematical models are found in [
58]. The calculations of life cycle emissions were based on previous work [
59]. The inflation rate of Colombia was applied, which is currently 4% [
60], and an interest rate of 7% was used. With these parameters, the iHOGA software was able to obtain the optimal solutions (generation of system configurations for each microgrid) using evolutionary algorithms [
61].
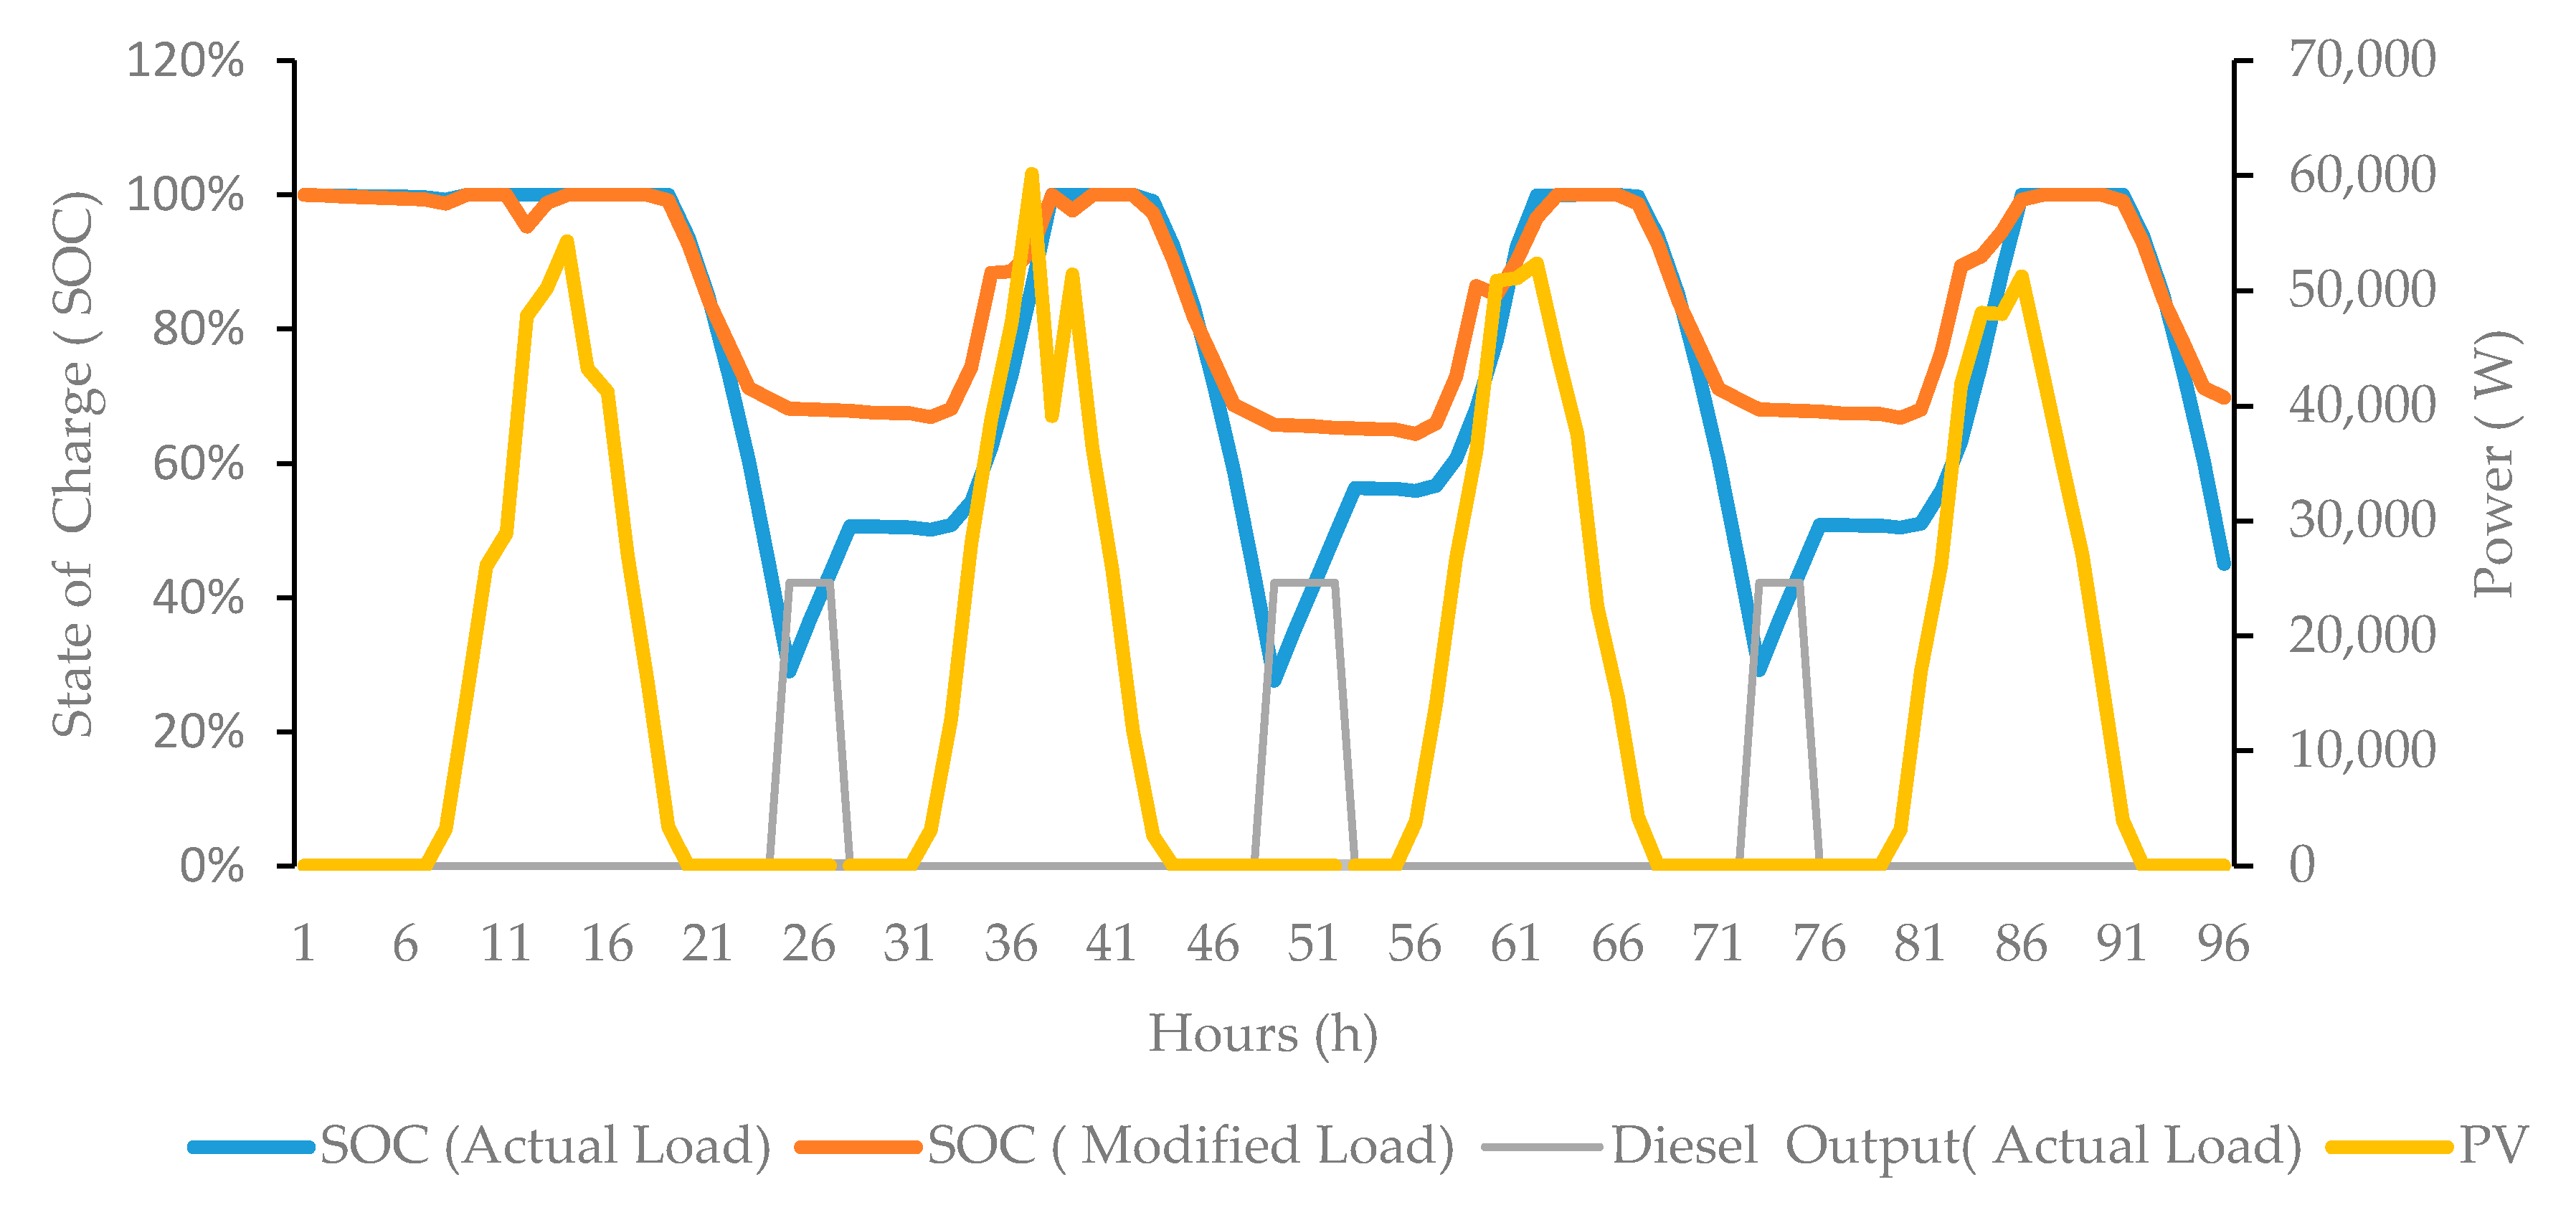
In addition to the optimal configurations of the generation systems, iHOGA determined the most appropriate control strategy between the two that were considered. These two strategies are as follows:
Load following (LF): In systems that include batteries and a diesel or gasoline generator, when the energy from renewable sources is not sufficient to satisfy the demand, the batteries are responsible for supplying this deficit. In the case that the batteries are not able to supply all the energy demanded, it is the generator that must provide it.
Cycle charging (CC): Differs from the previous strategy in that in the event that the generator is required to operate, it will operate at its nominal power to satisfy the demand and, in addition, to charge the batteries only during that hour. There is a variant of this cycle charging strategy, called the setpoint strategy, in which the diesel generator continues to operate at its nominal power until the battery bank reaches a specific value of state of charge, which by default is 95%.
4. Discussion
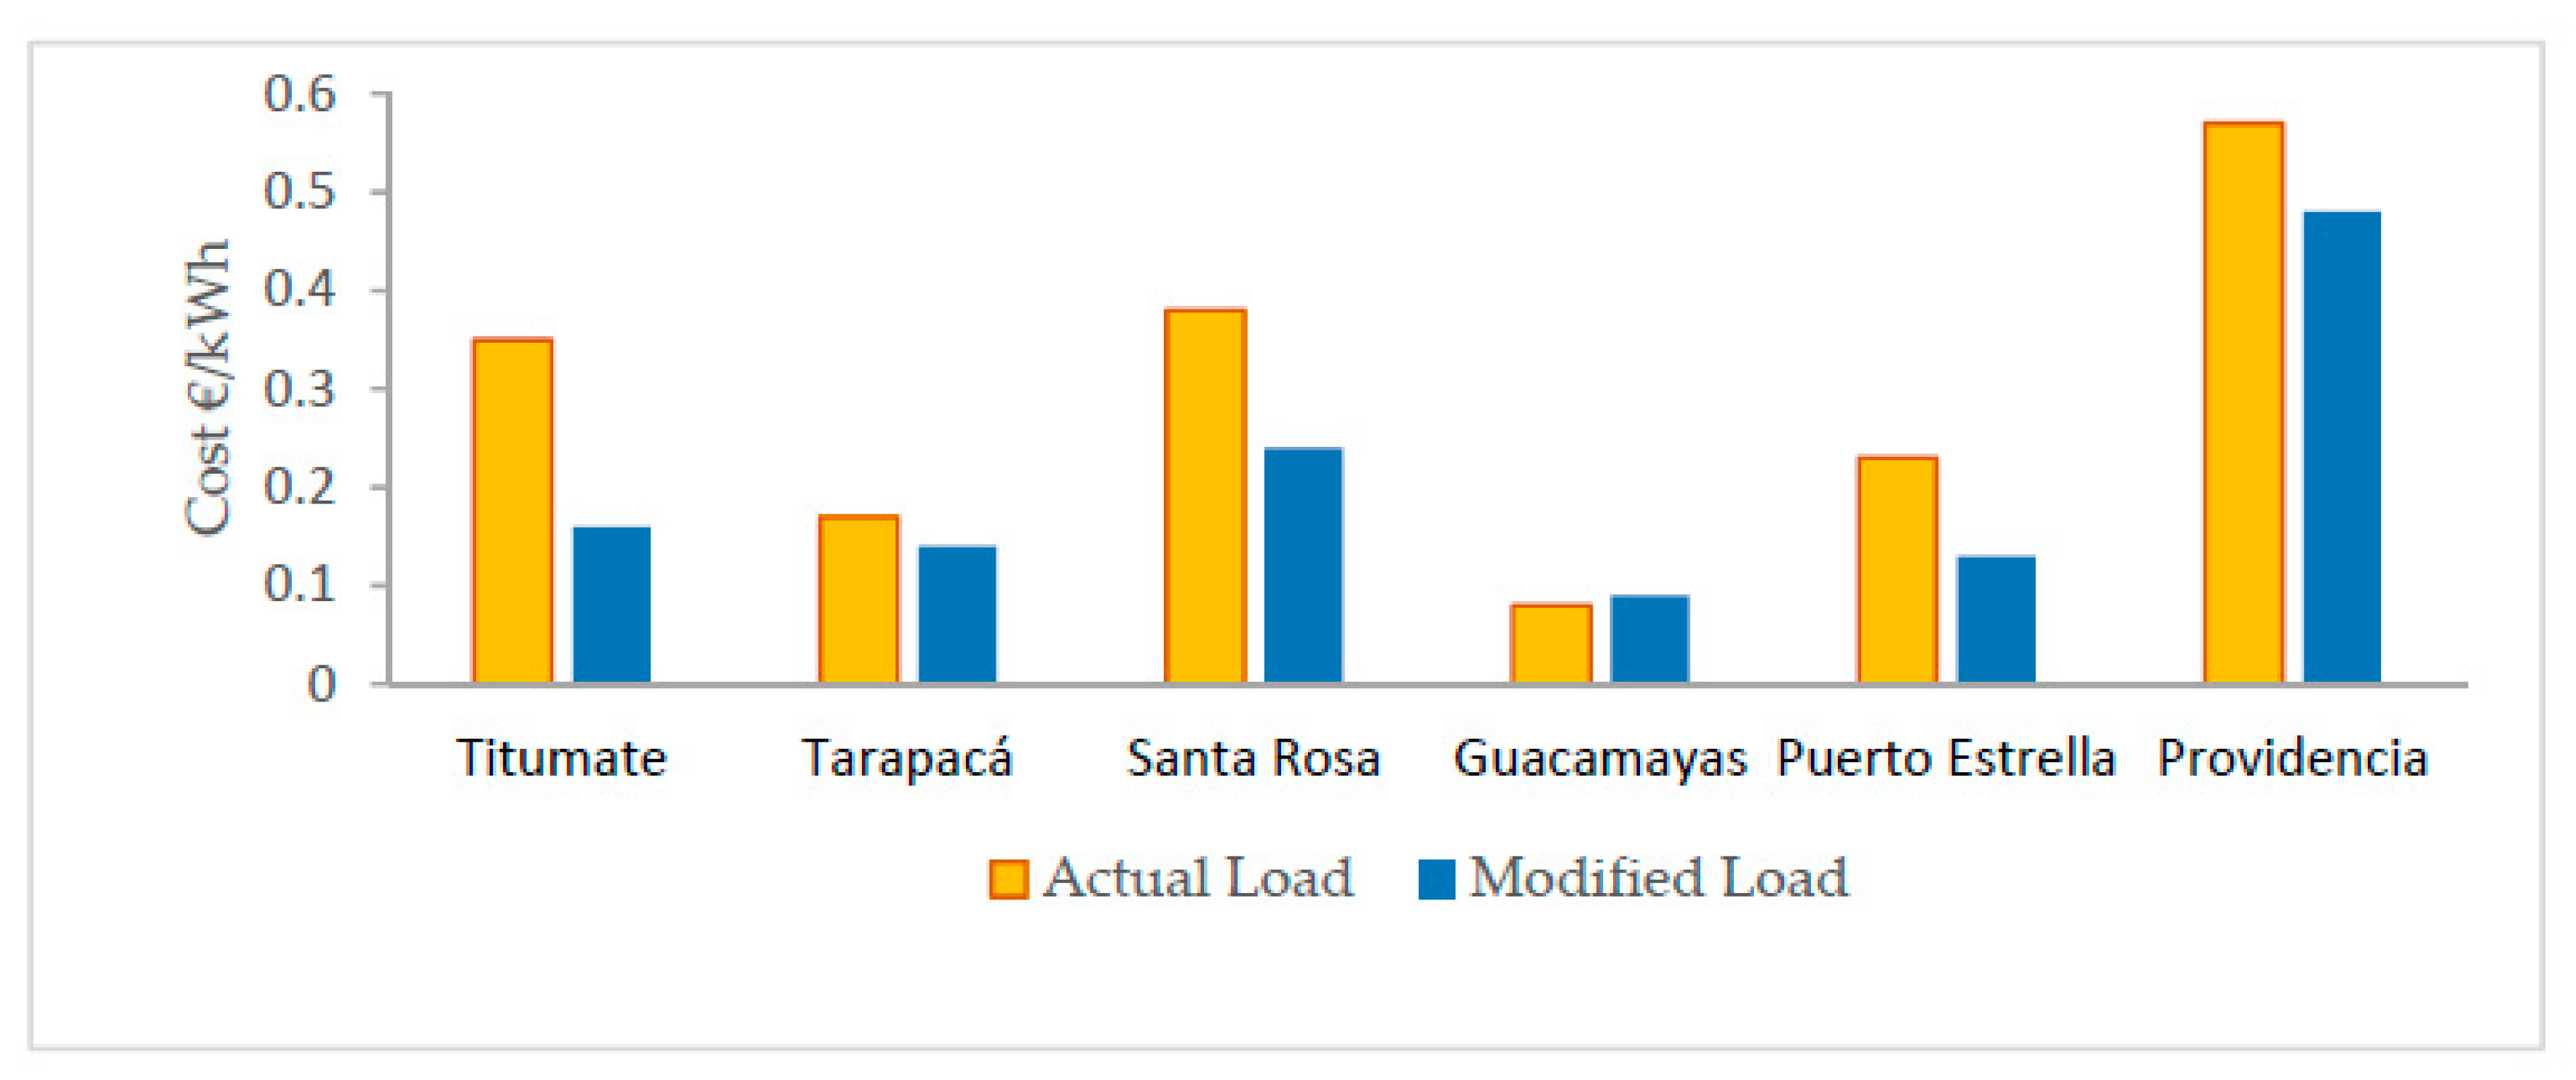
Figure 15 shows the different energy costs obtained with the current and modified load profiles for the 6 microgrids using lead-acid batteries and the load following strategy. A lower energy price is observed in 5 of the locations using a modified load profile.
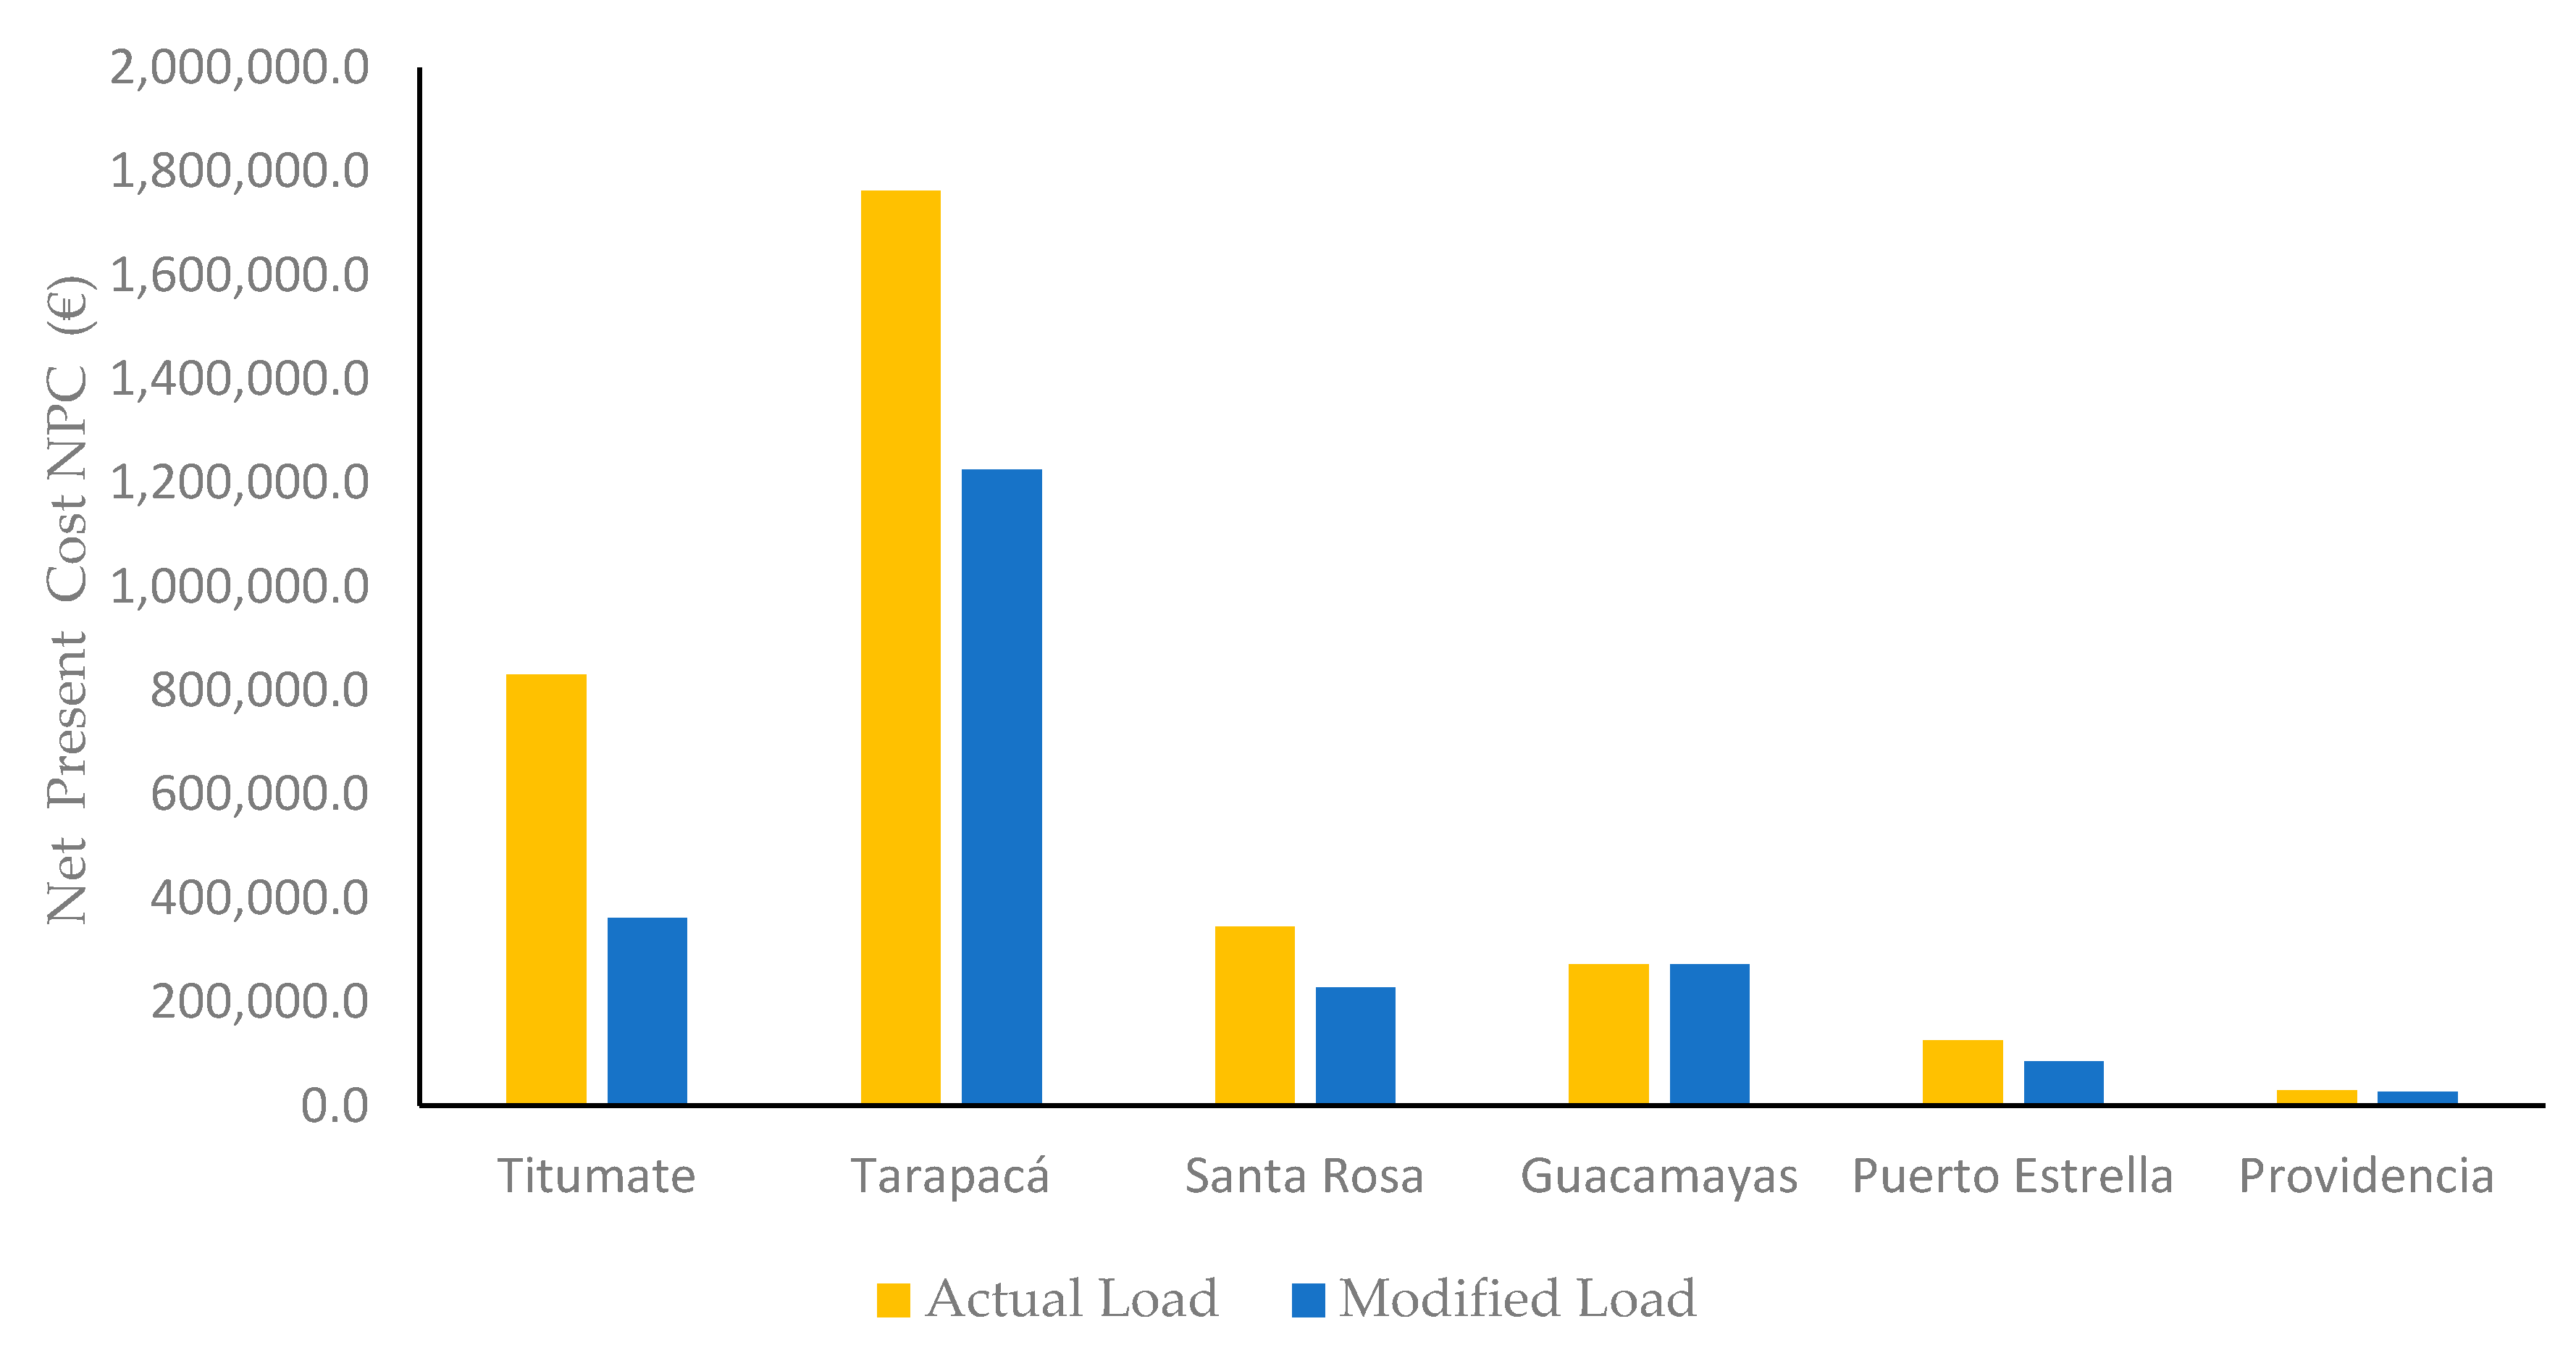
Figure 16 shows the NPCs of the 6 locations for optimization using lithium batteries and with the load following strategy, observing a decrease in costs in 5 of the 6 microgrids using modified load profiles. In three locations (Titumate, Santa Rosa and Puerto Estrella) the cost reduction is around 50% with the modified load profile.
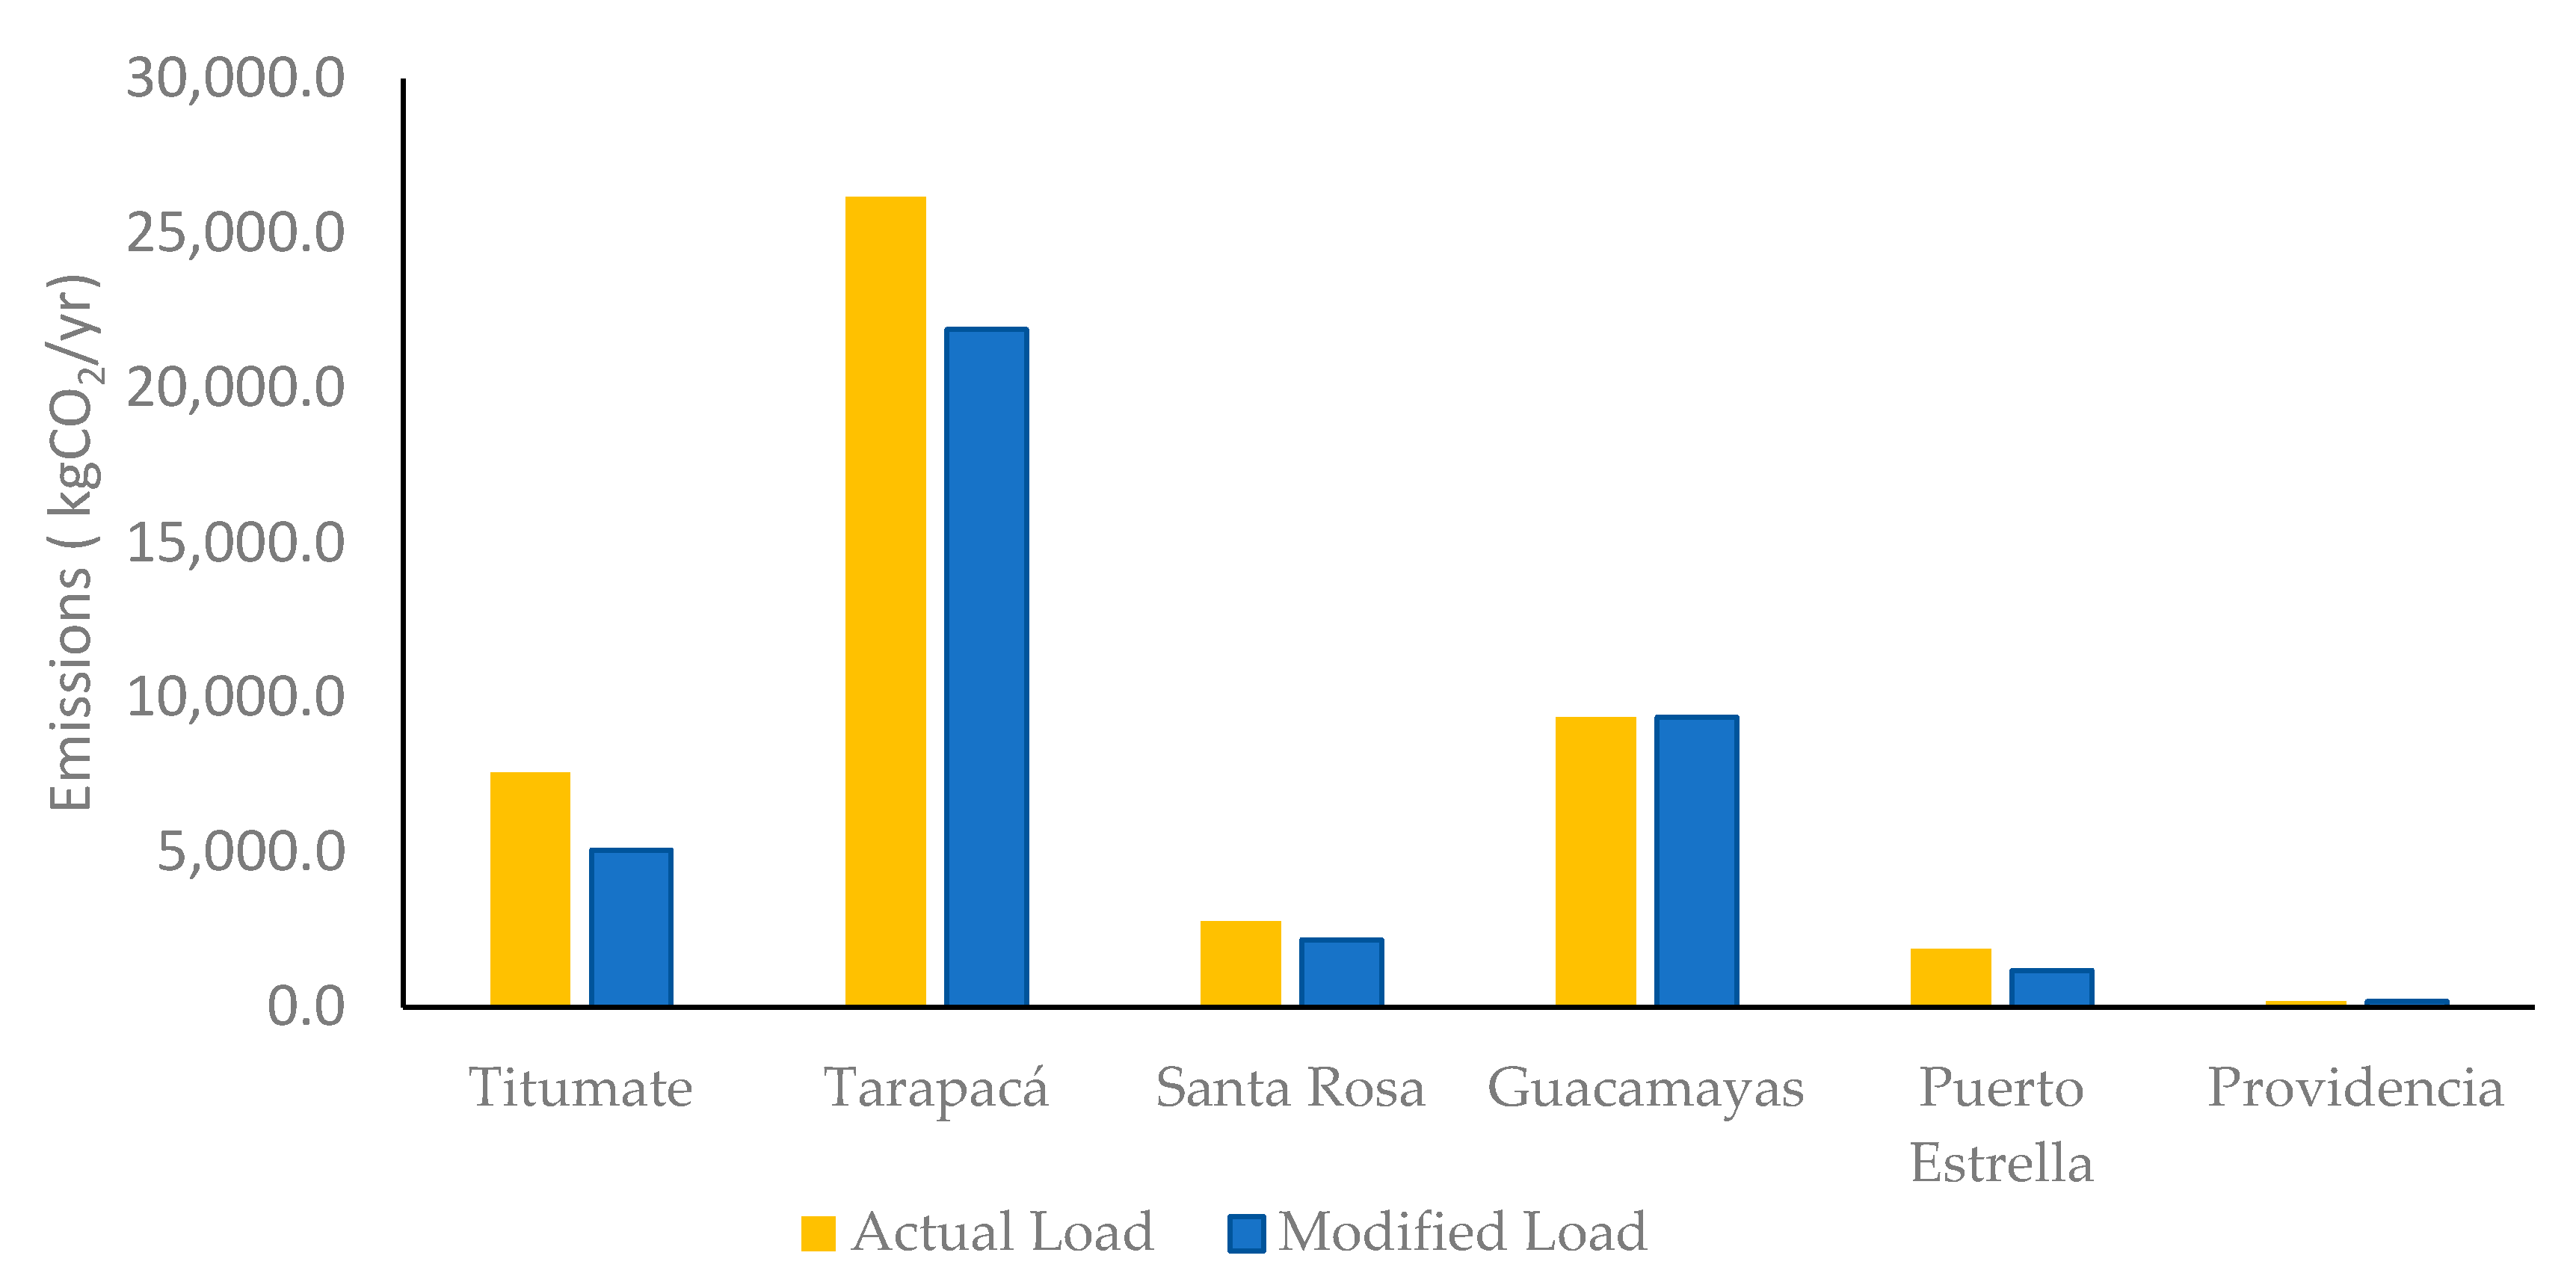
The level of emissions also decreases in 5 locations, as seen in
Figure 17, where the results of the optimizations using lithium batteries with the cycle charging control strategy are presented.
The results obtained in the simulation model of the microgrid is performed during several years (usually 20–25 years), the performance is repeated considering all years the same, considering the load to be constant. This is a limitation, as load can change during the years.
Further research should be done for the accurate estimation of the diesel price, considering that diesel cost in the NIZ of Colombia is highly variable due to its drawbacks associated with the transportation in areas of difficult access. Further research could also include sensitivity analysis considering factors such as: load variation, the price of fuel, renewable energy subsidies, interest rates and acquisition cost of components of the system. In addition, the simulations were performed using mono-objective optimization (minimization of NPC), however future studies can address the use of multi-objective optimization including equivalent CO2 emissions, human development index (HDI) and job creation. All of these features are available in the iHOGA software.
From a technical and economical point of view, this study opens the possibilities for exploring isolated hybrid microgrids in developing countries like Colombia, considering future technological improvements and cost reductions in batteries and PV modules.
5. Conclusions
This article presents a techno-economic study of isolated microgrids of the NIZ of Colombia. Optimal generation hybrid systems have been obtained for 6 locations, considering the possibility of using diesel generators, solar panels, hydraulic turbines, wind turbines and batteries. The results show that NPC values lower than the current ones (powered mainly with diesel) can be achieved in almost all scenarios thanks to the reduction in the number of operating hours of the diesel generators and the use of demand-side management. However, this demand-side management is limited, to a large extent, by the difficulty of changing the consumption habits of users. The results have also shown that lithium batteries can be a good alternative to lead-acid batteries, considering the useful life and costs of the system.
It is important to note that optimization strategies could include a demand side management program that can reduce operation cost. In addition, the development of microgrids with renewable energies in rural areas also will help to meet the challenge of energy supply of remote zones and will reduce the dependence on fossil fuels. The study findings provide a basis to explore optimization of microgrids with other technologies such as fuel cells and biomass. Nevertheless, the Colombian government will have to play a crucial role for the development of the isolated hybrid microgrids in remote areas.


