1. Introduction
Subjects related to electric vehicles (EVs) have gained the attention of both academia and industry. Ever-increasing environmental concerns have triggered research on new technologies that will make EVs an environmental-friendly alternative to conventional vehicles [
1]. In addition, the integration of renewable energy sources (RES) in the electric grid enables the distributed energy production and management, following the philosophy of the smart grid [
2]. Nevertheless, the introduction of EVs disrupts the operation of the power grid [
3], in a similar manner to the introduction of renewable energy sources in the past. As a result, novel energy management techniques should be introduced to ensure the stability of the power grid, and transform EVs from being passive energy consumers, into being active elements of the smart grid [
4]. Towards this end, the communication mechanisms between the smart grid and the EV pose a major role. Using vehicle-to-grid (V2G) communications, the coordination of the EV charging can be achieved [
5].
A major concern related to the charging of EVs is the long duration of the procedure. Therefore, smart scheduling mechanisms should be employed to ensure the timely fulfilment of charging tasks, while meeting the driver’s demands and the constraints of the charging station (CS) operators, in the context of a win-win situation [
6].
To address these challenges, this paper presents a framework for the smart charging of EVs in a CS, supporting the driver towards the selection of the most appropriate CS according to the driver’s preferences and transportation needs. The charge scheduling is facilitated by a heuristic algorithm, while the charging station selection mechanism is facilitated by the analytic hierarchy process (AHP). For V2G communications, the Open Platform Communications–Unified Architecture (OPC–UA) standard is used. In the context of the smart grid, this work focuses only on the EV-CS integration. The proposed framework can be extended to include more elements of the Smart Grid, such as renewable energy sources, generators, and loads.
This research work is an extension of the paper [
7], where the OPC–UA for the communication of the CS and the EV is demonstrated, and an initial stand-alone investigation of the AHP is performed, without being integrated with a scheduling algorithm. In this paper, the AHP is evaluated during three charging scenarios and with CSs that have different resource availability. In addition, the method to capture the priorities of the driver in the form of weight factors is analysed in detail. Furthermore, the optimisation objectives for the charge scheduling are presented in the Authors’ previous work [
8]. The findings in [
8] indicated that the proposed two-layer genetic algorithm was a complicated and computing-intensive approach. The approach that is followed in this paper provides better results in shorter time. Moreover, this paper presents a method for the selection of the operating parameters of two heuristic algorithms via a sensitivity analysis that is based on Taguchi arrays. Summarising, this paper presents the full implementation of the proposed framework with extensive evaluation under different charging scenarios.
2. Background and Related Work
Considering the large volume of publications on the overall subject of the charge scheduling of electric vehicles, the literature review of this paper focuses on selected aspects of charge scheduling that require further investigation towards implementing a framework that delivers the charging services to the owners of the EVs.
The field of charge scheduling of EVs has been reviewed in [
4], where the existing literature was classified in the categories of unidirectional and bi-directional charging, which were further classified in the categories of centralised and decentralised scheduling. The authors in [
9] classify the charge scheduling problems in four classes, i.e., problems related to the smart grid, controlled EV charging problems, CS network design problems, and routing problems. Two heuristic algorithms are introduced to reduce the computational time required by a mixed-integer linear programming algorithm.
Most papers propose a centralised architecture aiming to support the power grid. In this context, the authors in [
10] provide V2G reactive power transmission, while maintaining their owners’ requirements for charging. Wang et al. in [
11] integrate the CSs and the power distribution system to propose a centralised scheduling method that employs the multi-objective evolutionary algorithm based on decomposition. In this context, the authors in [
6] not only provide a centralised scheduling algorithm that offers a good performance, but they also take into consideration the user convenience in an environment with identical CSs.
The stochastic nature of the charge-scheduling problem has been investigated in [
12], where the Authors perform a two-stage mixed-integer linear programming optimisation integrating the user satisfaction and network uncertainties, while considering all CS operators as individual entities. In the context of decision-making support, [
13] present a dispatch strategy for the EV charging using three distinct charging/discharging current levels, to allow bi-directional energy flow between the EV and the grid.
The authors in [
14] identify that a single-aggregator architecture provides limited scalability, therefore distributed algorithms operating in a hierarchical structure should be employed. As a result, the optimisation results between the smart grid and the CS operators can be entered as setpoints in a low-level scheduling that aims to satisfy the charging requirements of the EV owners, along with the specific criteria of the CS operators.
In this context, the authors in [
15] propose a hierarchical optimisation procedure that uses a genetic algorithm (GA) to generate the optimal setpoints for the maximisation of the aggregator’s profit in the high-level optimisation, while the low-level optimisation to satisfy the needs of each user is performed using mixed-integer linear programming. The two-stage optimisation has been also employed in [
16] where the grid operator provides the operating requirements for the EV aggregators, who in turn optimise the charging of individual EVs. As the complexity of the scheduling problem increases, the GA is proposed to substitute the mixed-integer linear programming algorithm [
17]. In addition, to mitigate the computational time of the integer linear programming (ILP), game theoretic algorithms have been proposed [
18,
19]. Considering that the criteria and the objective function of a charge scheduling problem can often be not linear or quadratic, the conventional convex optimisation may not be sufficient, and heuristics need to be employed [
20].
Moreover, the resource-sharing concept has been introduced in [
21], while the requirement of non-revoking previously made reservations is characterised as of crucial importance in [
22]. In [
23], the authors propose a management scheme providing admission control, scheduling, and pricing for a CS with single type of chargers that can be shared across many charging spots.
The use of different types of charger has been investigated in [
24], where the authors employed a hybrid method composed by a PSO and a GA. The authors in [
25] employ a different approach in the subject of EV owner satisfaction in a game theoretic optimisation by introducing a trust evaluation index of the CSs, following a social network approach. The authors identify that the existing literature mostly focuses on the two-side interactions inside a smart grid (i.e., grid operator–CS operator). The consideration of the user-specific requirements (journey requirements, parking duration) have been stressed in the work of [
26].
The importance of the V2G communications has been underlined in [
27] as a major enabler for charge scheduling. In addition, the requirement for interoperability among the subsystems of the smart grid have been highlighted in [
2]. In this context, the Open Platform Communications–Unified Architecture (OPC–UA) standard has been highlighted as an enabling technology for communications within the smart grid [
28,
29]. The application of the OPC–UA for V2G communications has been introduced in [
7], where its semantic modelling capabilities are utilised to support heterogeneous information models. The importance of the semantic data representation within the V2G communications has been highlighted in [
30,
31].
Considering the literature review on the aforementioned subjects, in this paper, an online decentralised framework for the decision-making support during the charge scheduling of EVs is proposed, emphasising on the preferences of the driver. The present work differs from the previous literature in the basis that it decouples charge scheduling within each CS, from the decision-making procedure within each EV. The charge scheduling is performed using a heuristic algorithm to conclude into near-optimal solutions in a timely manner, allowing the modification of the decision-making criteria in real time. Aiming to satisfy both the operators of the CSs and the drivers of the EVs, the proposed algorithm evaluates the suitability of multiple types of charger that are shared between multiple charging points in a resource-sharing manner. All EVs and CSs are considered individual entities that operate autonomously, without being dictated by a global scheduling system. As a result, the EV owner is allowed to take the final decision on the selection of the charging station. This decision-making procedure is facilitated by the AHP, which is not studied in a similar application by the existing literature. Finally, the introduction of a semantic communication standard, as the OPC–UA, for the V2G communications allows interoperability of the heterogeneous entities of the smart grid ecosystem, enabling multi-disciplinary collaboration.
3. Proposed Framework
In this paper, a framework for the smart charging of EVs, facilitated by V2G communications, is introduced (
Figure 1). The framework employs a heuristic algorithm for the charge scheduling of EVs and the AHP for supporting the decision-making of the driver towards selecting the most appropriate charging station. The V2G communications are facilitated by the OPC–UA standard.
Initially, the EV communicates, via OPC–UA, the charging requirements to the adjacent CSs. This information is related to the charging energy to satisfy the transportation requirements of the driver. Considering that abnormal charging conditions may damage the cells [
32], an important feature of the proposed algorithm is the preservation of the battery health during the evaluation of the alternatives. For this purpose, the EV communicates to the CS the nominal battery voltage and current, as well as the maximum battery charging current, following the suggestions by the battery manufacturer. To assure the fulfilment of the charging task according to the driver’s schedule, the requested completion time (i.e., the charging due time) is also sent to the CS. In the final step, the driver’s priorities for charging of the in form of weight factors are also transmitted to the CS, to ensure the delivery of personalised solutions.
Upon receiving the requirements from the EV, the resource management system of the CS executes the heuristic algorithm and offers a charging proposal. The two decisions during the charge scheduling refer to the selection of the charger type and the charging current, respectively. The operation of the proposed algorithm is in discrete timeslots. If the offer is accepted by the driver of the EV, the resources are reserved (
Figure 2).
The operation of the algorithm is in discrete timeslots with a duration of five minutes. Considering that a charging task has a duration of more than 20 min, the 5-min timeslot allows multiple charging alternatives to be evaluated even in short charging tasks. The formation of the alternative is performed by selecting the type of charger and the charging current for each timeslot. On the top area of
Figure 2, the availability of chargers for each timeslot is presented. As the case study, a CS with five chargers is selected. Three of those chargers are ‘Normal’ chargers (i.e., chargers 2–4), while two of the five chargers are ‘Fast’ chargers (i.e., chargers 5, 6). The algorithm allows for an EV to be parked but not being charged. This is modelled using the virtual charger No. 1. Hence, if the charger No. 1 is selected for a timeslot, the EV is parked but not being charged in that timeslot. By inspecting the available chargers for each timeslot, the algorithm generates only feasible solutions.
The requirements for the operation of the smart charging framework are as follows. The resource-sharing is achieved by using power relays to connect each power socket to multiple chargers. As a result, the allocation of multiple physical chargers to a charging task, towards finding the optimal sequence is achieved. In small charging stations, the low complexity allows for all chargers to be connected to all power sockets. This is not the case for large charging stations, where the interconnection of all chargers to all parking positions can increase the initial costs and the operational complexity of the station. In such case, the algorithm allows the grouping of chargers into clusters, and the CS searches all clusters in parallel for the optimal solution. Furthermore, the EV and the CS have to comply to a communication standard (in this paper OPC–UA is chosen).
The advantages of the suggested approach are the resource sharing, the fast identification of a near-optimal solution, the preservation of the battery health, and the inclusion of user-defined priorities. Furthermore, the use heuristics, enables the decoupling of the definition of the decision-making objectives from the search mechanism of the solution space. As a result, the decision-making objectives can be modified based on the specific requirements that may emerge. Using OPC–UA, the independent entities of a smart grid are interconnected, forming a cyber-physical ecosystem.
4. Charge Scheduling Using Heuristic Algorithms
In this section, the mathematical formulation of the problem of the charge scheduling is demonstrated. In addition, the two heuristic algorithms that are evaluated, namely PSO and GA, are briefly demonstrated. The suitability of the PSO and the GA in scheduling problems has been investigated in [
17,
20,
24,
33,
34]. Afterwards, those algorithms were investigated for the proposed application. The results following their comparison with the exhaustive search, along with their low computing requirements indicated that the proposed algorithms are suitable for a scheduling application that requires near-optimal solutions in short time. Those results indicated that the GA and the PSO can satisfy the requirements of the proposed problem. Therefore, more complex variations of those algorithms were not investigated. In the last step, those algorithms were tuned through the sensitivity analysis, and they are directly compared with each other.
4.1. Mathematical Formulation
The scheduling algorithm aims to satisfy five decision-making objectives that are represented by their non-negative criteria as presented in this section. The ‘charge completion time’ criterion (1) ensures the timely fulfilment of the task, following the driver’s schedule. It is not specified as a constraint to permit small delays of the completion time if this could result in an improved solution. The maximum value of this criterion indicates that the charging is fulfilled prior the time requested by the driver. In the case of a delay, the value of the criterion is decreased as a linear function of the delay time. The variable named ‘tolerance’ demonstrates the maximum allowed charging delay.
The proposed framework allows for continuous variations of the energy price that is a characteristic of a dynamic smart grid. Therefore, the charging alternatives are also evaluated based on their overall economic cost. The cost of the charging task is modelled through the ‘price’ criterion (2). The ‘price’ criterion is calculated in comparison to the maximum and the minimum charging prices that refer to the timeframe under investigation. Hence, the actual charging price is normalised in the range [0, 1] according to the minimum and the maximum charging prices. The price criterion takes the value of 1 if the EV is being charged with the lowest tariff. Instead, it takes zero value when the EV is being charged with the highest tariff.
The third criterion is related to the maximisation of the resource utilisation of the CS. The utilisation is calculated during each timeslot by the division of the charging current with the nominal current of a charger (3). The timeslots in which the EV is not being charged are not considered, as the resource-sharing approach releases the occupied resources during those timeslots.
The last two criteria aim to preserve the battery health by minimising the average current and the maximum current that charges the batteries. The average current is calculated only during the actual charging timeslots (non-charging timeslots are not considered) (4). In the next step, the average current criterion takes its higher value if the current does not exceed the nominal battery charging current (5). Otherwise, the criterion is linearly decreased (5). The same approach is followed for the calculation of the criterion referring to the maximum charging current (6). The objective function (7) is calculated through the weighted sum of the aforementioned criteria (1–6). The weights reflect the priorities of the operator of the CS and the driver of the EV. The improper selection of the weight factors may result in low-quality solutions [
35,
36]. Nevertheless, the weighted sum method is used in this paper as a simplified solution to engage the drivers in the decision-making by importing their preferences. To mitigate the negative effects of wrong weight selection, the weights that reflect the priorities of the driver are generated through the pairwise comparisons of the AHP method. As a result, the consistency of the selected weight factors is guaranteed.
The constraints refer to the charge completion time constraint (8) and the charging current constraint (9). Moreover, to integrate the limitations of the smart grid, the overall electric power that is delivered by the CS to the EVs can be constrained to provide load-balancing functionalities such as ‘peak shaving’ and ‘valley filling’.
where,
complTimecriterion: The charge completion time criterion with values in the range [0, 1].
complTime: The charge completion time in timeslots.
PrefTime: The preferred charge completion time in timeslots.
Tolerance: The acceptable delay of the charging task in timeslots.
pricecriterion: The price criterion with values in the range [0, 1].
normalisedPrice: The cost of the task normalised in the range [0, 1]. The 1 indicates charging with the highest price for all timeslots, while 0 indicates charging with the lowest price for all timeslots.
utilisationcriterion: The utilisation criterion in the range [0, 1].
timeslots: The number of actual charging timeslots. The timeslots referring to the parking but not charging state are not included in this value.
Ii,charging: The output current of the charger during the ith timeslot.
Ii,chargerRated: The rated current of the selected charger during the ith timeslot.
Iavg: The average charging current of a task.
Iavgcriterion: The average charging current criterion with values in the range [0, 1].
NomCurrent: The nominal battery charging current.
MaxAvgCurrent: The maximum allowed average charging current.
Imaxcriterion: The maximum charging current criterion with values in the range [0, 1].
Imax: The maximum current during a charging task.
MaxBatCurrent: The highest current for the battery, as specified by the battery manufacturer.
The weights for each criterion.
To further illustrate the application of the proposed method, a charging scenario is demonstrated. Specifically, the charging requirements of the EV are presented in columns 1–7 of
Table 1. Additionally, the capabilities of the chargers in the CS are presented in columns 8–9 of
Table 1. The CS under evaluation has “Normal” chargers providing maximum charging current of 90 A, and “Fast” chargers providing maximum charging currents of 300 A.
Following the charging requirements presented in
Table 1, a charging scenario is demonstrated in
Table 2. The charging task has a duration of 25 min (i.e., 5 timeslots). During each timeslot, the type of the selected charger is presented, along with the charging price and current. The proposed solution results to a delay of 5 min to the charging task and a decreased utilisation of the resources, aiming to reduce the battery degradation.
The values of the criteria following Equations (1)–(3), (5) and (6), along with their corresponding weight factors are presented in
Table 3. Moreover, the value of the objective function for this charging scenario is presented in the last column of
Table 3, as a weighted sum of the criteria.
Equations (1)–(9) are entered in the optimisation routine to calculate the objective function and conclude to the sequence of currents that will be used for the charging task. The charging requirements are sent by the EV to the charging station, and they are pre-processed following the flowchart presented in
Figure 3. Specifically, if the driver requests fast charging (i.e., charging with current higher than the nominal current of the battery), the value for the average charging current that is used in the algorithm, is the one that is calculated by the driver’s preferred charging energy and completion time. In addition, the optimisation routine examines the availability matrix for the resources of the CS, and it selects one resource per charger type to significantly reduce the operation time of the algorithm.
4.2. Genetic Algorithm (GA)
GAs were introduced by J. Holland, whose initial goal was to formally study the phenomenon of adaptation as it occurs in nature and to develop ways in which the mechanisms of natural adaptation might be imported into computer systems [
37]. At the first step of the generic implementation of a GA, the algorithm generates a population of potential solutions through random sampling. Those solutions are evaluated, and the value of the objective function is calculated. In the context of the GA, the objective function is usually called the fitness function. Afterwards, the crossover operation is performed on, randomly selected, solutions of the population to generate solutions with improved fitness values. At the next step, randomly selected variables are resampled through the mutation operation to further improve the quality of the solution. As a next step, the best solutions (i.e., the elites) of each population are transferred to the next generation, and the same procedure occurs until the end of all generations.
4.3. Particle Swarm Optimisation (PSO)
Particle Swarm Optimisation (PSO) first introduced by Eberhart and Kennedy in 1995, is a form of swarm intelligence in which the behaviour of a biological social system like a flock of birds or a school of fish is simulated [
38].
Initially, the locations of the particles are assigned randomly, and each particle moves toward the target at a certain speed. As the number of iterations increases, the swarm approaches the target. In each iteration the solution is updated in two ways. The first optimal solution is found by the particles and the second solution which is the global optimal solution is obtained by the swarm. Furthermore, the speed and location of the particles are updated according to Equations (10) and (11) [
39].
where,
: Speed of search particles in iteration t + 1.
: Weight representing the inertia of the particle.
: Speed of search particles in iteration t.
, : c1 is the self-adjustment weight, c2 is the social-adjustment weight.
, : Random numbers over the range [0, 1].
: Best solution obtained by particles.
: Best solution obtained by swarm.
: Location of search particles in iteration t + 1.
: Location of search particles in iteration t.
5. Charging Station Selection Using Analytic Hierarchy Process (AHP)
In this Section, the theoretical formulation of the AHP for the scope of the decision support during the charging station selection is presented. Additionally, a flowchart for an application the importing of the preferences of the driver is proposed.
5.1. Theoretical Formulation of the AHP
After the generation of the charge schedules of the CSs through the heuristic algorithm, the decision-making support system of the EV ranks the CSs based on the priorities of the driver. The decision-making support is facilitated by the AHP. The AHP is classified as a major decision-support method, which is used in various engineering fields [
40]. A major highlight of the method is that it allows the usage of subjective factors. Despite its broad usage, especially in the subject of decision-making in production systems [
41], the AHP has not been sufficiently investigated in the subject of CS selection by the drivers of EVs. Nevertheless, it has been selected as dispatch mechanism for the EV charging, supporting V2G power transfer. In the context of this paper, the selection of the most appropriate CS, according to the priorities of the driver, is evaluated as a multicriteria decision-making problem.
The computing system of the EV retrieves the quotations of the nearby CSs via the OPC–UA and evaluates them based on the quality of services that they provide. The needs of the driver are determined based on their transportation schedule, which can be obtained by integrating the related web services and mobile applications. Moreover, the state-of-charge of the battery stack and the requested energy to accomplish the upcoming transportation tasks can be determined by the Battery Management System (BMS). The criteria for the decision-making algorithm are introduced in Equations (12)–(15), and they can be modified to satisfy needs that may emerge. Those criteria refer to the cost of the EV charging, the degradation of the batteries, and the timely completion of the charging task.
where,
Pricecriterion: The criterion that corresponds to the satisfaction of the charging cost requirements of the EV driver.
PreferredPrice: The reference price for the evaluation. It can be calculated using the average EV charging price of a region.
StationPrice: The charging cost that refers to a specific CS.
AvgCurrentcriterion: The first criterion related to the preservation of the battery health that refers to the average charging current.
EVAverageCurrent: The preferred average charging current based on the energy and completion time requirements of the driver.
StationAverageCurrent: The average charging current that will be offered by the charging station.
AggressiveChrgcriterion: The second criterion related to the preservation of the battery health that refers to the maximum charging current.
StationMaximumCurrent: The maximum charging current that will be offered by the charging station.
ComplTimecriterion: The criterion that corresponds to the timely completion of the charging task.
PreferredChargeDuration: The preferred duration of the charging task based on the schedule of the driver.
ChargeDuration: The charge duration following the charge schedule of the station.
TravelTime: The time that is required for transportation to the station.
High values of the criteria contribute in favour of the CS. The AHP allows an intuitive procedure for the users to easily define their preferences assigning the appropriate values to the criteria matrix. Afterwards, the values of the criteria are normalised in the [
1,
9] scale that is used by the AHP during the evaluation of the alternatives (16) (Equal importance = 1, Extremely Important = 9).
where,
: the normalised value of the criterion [
7].
X: the value of the criterion as a result of Equations (12)–(15).
Xmin, Xmax: the minimum and the maximum values of the criterion (ymax = 9, ymin = 1).
The method indicates the formation of two types of judgment matrices that include pairwise comparisons (
Table 4). The first judgement matrix refers to the evaluation of the criteria, while the second type of matrix refers to the evaluation of all the alternatives under each criterion.
To allow for reproducible results, the variation of the AHP presented in [
42] is followed. The preferences of the drivers are depicted in the criteria judgment matrix. The judgment matrix referring to the alternatives is created from the charging parameters that are sent by the CSs. The pairwise comparisons are performed by dividing the values for each criterion that correspond to each of the two stations that are compared. The priorities of the criteria and the alternatives are calculated by the right principal eigenvector. Given a judgment matrix with pairwise comparisons, the corresponding maximum eigenvector is approximated by using the geometric mean of each row. In the next step the normalisation of the eigenvectors is performed by their division with the sum of the corresponding row, hence the priority vector (PV) is formed. During the pairwise comparisons of the AHP, an aspect that requires careful handling is the consistency of the judgement matrices. In this paper the consistency ratio is verified to have a value below 10%.
Finally, the formation of the decision matrix is performed as follows. The rows of the matrix correspond to the alternatives, while the columns refer to the criteria (
Table 5). The priority vector of the criteria table depicts the weight for each criterion (first row). The priority vectors for all the alternatives under a given criterion are multiplied by the corresponding weight form the columns of the decision matrix. The final ranking of the alternatives is performed by the calculation of the weighted sum (utility value) of the rows of the decision matrix.
5.2. Flowchart for the Quantification of the Priorities of the Driver
A major advantage of the proposed method is its potential for real-life application. Towards this end, a concern is the approach that will be followed for the quantification of the preferences of the driver. The operation of the AHP is based on Saaty’s fundamental scale for the pairwise comparisons [
42]. Saaty’s scale quantifies the intensity of importance between two alternatives or criteria using the distinct levels of “Equal Importance”, “Moderate Importance”, “Strong Importance”, “Very Strong Importance”, and “Extreme Importance”. In order to make this procedure intuitive, the flowchart of
Figure 4 is proposed to be employed in a commercial software implementation of the proposed method. The driver should be prompted to import the charging priorities in linguistic form, following Saaty’s scale. Afterwards, the consistency ratio (CR) is calculated. If the value of the CR is above 10%, the priorities of the driver are inconsistent, and the procedure should be reinitiated.
6. Open Platform Communications–Unified Architecture (OPC–UA) Communications
In the context of the proposed framework, the V2G communications are facilitated by the OPC–UA standard. The OPC–UA standard operates on top of the Transmission Control Protocol/Internet Protocol (TCP/IP) following the publish/subscribe pattern [
43]. The standard allows the EVs and the CSs to expose their information via semantic representation in their information models.
The information model of a system within OPC–UA is delivered in an extensible semantic form, which allows the decoupling of the data schema from the implementation of the communications [
44]. The main benefit of the semantic representation are the enhanced levels of interoperability that it provides. As a result, even systems with heterogeneous data models, developed by different vendors, can be integrated in real-time, without the use of complicated software adaptors. The information model can be expanded to include information related to the drivetrain of the EV, with its electrical and mechanical subsystems, along with information related to other important systems (e.g., EV passenger accommodation systems). During the design of the information model, the Unified Modelling Language (UML) can be used, following the appropriate guidelines [
45,
46].
An important aspect of the OPC–UA is the exploration of the information model of a server, by clients that are not familiar with its exact structure. The client can browse through the server to gather the required information and understand its content through metadata and semantic representation. By complying to a common vocabulary [
47], the developer of the information model can embed tags in the description of the variables to support the client during their retrieval and enhance the interoperability among the EVs and the CSs with different information models. A sequence diagram for the operation of the OPC–UA is demonstrated in
Figure 5.
The EVs should be able to communicate with the CSs from any location. As a result, the EVs should employ a module for cellular communications. The ever-increasing number of systems that need to be connected to the internet cannot be supported by the internet protocol (IP) IPv4. Therefore, the application of OPC-UA for the charge scheduling of EVs requires the usage of the IPv6 protocol or the coexistence of both the IPv4 and the IPv6 protocols. The coexistence of IPv4 and IPv6 protocols can support the integration of legacy systems of the smart grid that support only IPv4 communications. The laboratory prototype that is used for the evaluation of the OPC–UA in the scope of this work operated using IPv4. To satisfy the real-life requirements, a reference architecture for the implementation of the OPC–UA communications is presented in
Figure 6. The addresses of the EVs and the CSs are managed by a central cloud platform, which also serves as a virtual private network (VPN) server to integrate the EVs that are only compatible with the IPv4 protocol. The EVs that are IPv6 compatible, request from the platform the addresses of the CSs that will be evaluated. Afterwards, they communicate directly with the CS. The network controllers of the CS and cloud platform have to be able to handle both IPv4 and IPv6 protocols (i.e., being dual-stack compatible).
The OPC–UA communications have been implemented using Java based on the framework provided in [
48]. It has been deployed in a PC with the Intel Core i7-5500U processor to emulate the charging station, and it has also been deployed to a Raspberry Pi 3 microcomputer to emulate the limited processing capabilities that the computing system of an EV may have. The compatibility of the OPC–UA server is evaluated using the Softing OPC–UA client [
49].
7. Performance Evaluation of the Charge Scheduling—Digital Experimentation
In this, the operation of the charge scheduling is evaluated using a software implemented in MATLAB for the scope of this work. All the experiments refer to a specific type of vehicle designed for urban transportation.
7.1. Evaluation Method
The case study refers to a CS including three normal and two fast chargers of 90 A and 300 A maximum charging current, respectively. The timeslot duration has a fixed value of 5 min. The selection of the 5-min timeslot is performed aiming not only to avoid damaging the battery by continuously modifying its charging current, but also to provide an extended solution space for the satisfaction of the decision-making objectives. For the case study, various experiments have been conducted with EVs for urban transportations that have a nominal battery voltage of 90 V, a maximum current of 270 A, and a total capacity of 180 Ah [
50]. The price for the Normal Charger (€/kWh), for each timeslot, is sampled from the normal distribution
, and the price per kWh for the fast charger is assumed to be double the price of the normal. For the evaluation purposes, 100 charging tasks have been randomly generated to improve the accuracy of the results and to overcome the inherent randomness of creating alternatives [
51]. The 100 charging tasks have required duration (completion time) randomly sampled in the range (20, 95) minutes, while the increase in the stored energy of the battery is randomly sampled in the range (30, 180) Ah.
Finally, the weights are selected with the following rationale. The EV driver and the CS operator share equally the total weight. As a result, the utilisation criterion weight is set to 0.5, and the criteria that refer to the driver are set with the price criterion weight being 0.25, the average current criterion being 0.125, and the maximum current criterion being 0.125.
For the aforementioned charging tasks, both the GA and the PSO algorithms have been evaluated following the method of orthogonal arrays that is introduced by Taguchi. Specifically, using the Taguchi method for statistical design of experiments, the most suitable parameters for the operation of both algorithms are selected. The specific method for the design of experiments and the evaluation of the parameters is obtained from [
52,
53]. In the first step, the main parameters for the evaluation of each algorithm and their levels have been determined. Subsequently, the Taguchi array with pairwise orthogonal columns is created. For the Taguchi method for statistical design of experiments, the orthogonality is interpreted in the combinational sense. As a result, the orthogonality ensures that for every pair of columns, all combinations of the parameter levels occur an equal number of times [
52]. The columns of the orthogonal array represent the factors (i.e., parameters of the algorithm) to be studied, and the rows represent the individual experiments. An example of a Taguchi orthogonal array containing three parameters with three distinct levels each is depicted in
Table 6. The inner product of two columns of
Table 6 results to zero. Each element of each column of
Table 6 has to be translated to a specific value of the parameter.
For the evaluation of the GA and the PSO, one Taguchi orthogonal array with 3 parameters and 10 levels is created. As a result, the necessary number of experiments for the selection of the best parameters of the heuristic algorithms is 100. After completing the 100 experiments for the 100 charging cases and calculating the objective function, the evaluation phase begins. It has to be remarked that the maximum value of the objective function was not 1.0 for all the 100 charging cases. The maximum value of the objected function reflected the compromise among the various criteria. Therefore, for the evaluation phase, the value of the objective function for each Taguchi experiment is normalised based on the maximum value of the objective function for that specific charging task, In the first step, the effect of each parameter level to the mean value of the objective function is evaluated (17), (18) [
53].
where,
: The vector with the parameters under investigation.
: The output of the model for each vector X.
: The parameter under investigation (e.g., the number of Generations of a GA).
: The specific value of that is evaluated (e.g., the number of Generations for the GA is equal to 100).
: The mean value of the objective function for the parameter with value . This value is obtained by fixing to the value and varying the other parameters.
Afterwards, the effect of each parameter level is further evaluated by the variance of the objective function (Equation (19)) [
53]. In the final step, the average of the aforementioned metrics (mean and variance) for each parameter level during the various charging tasks is obtained to conclude in the most appropriate set of parameters for the evaluation of each algorithm.
The results of this sensitivity analysis for the parameters of the GA and the PSO are presented in
Section 7.2 and
Section 7.3, respectively. For reproducibility, all experiments have been performed using the “Global Optimisation Toolbox” of MATLAB [
54]. The experiments are executed on a workstation with the Intel i7 8700 (6 cores, 12 threads, 3.2 GHz base clock frequency, and 4.6 GHz maximum clock frequency).
7.2. Genetic Algorithm (GA) Parameter Selection
In this section, the application of the methodology of
Section 7.1 for the case of the GA is presented. Specifically, the values of the “Population Size”, the “Number of Generations”, and the “Crossover Rate” are selected. For the “Population Size” 10 values in the range (100, 1000) with step size 100 are evaluated. For the “Number of Generations” 10 values in the range (25, 250) with step size 25 are evaluated. For the “Crossover Rate” 10 values in the range (0.1, 1) with step size 0.1 are evaluated. As a result, a Taguchi orthogonal array with 3 parameters and 10 levels is used for the design of experiments. The selection of the maximum values for the “Population Size” and the “Number of Generations” has been performed, aiming to finalise the optimisation of a charging task of 1.5 h (18 variables) in less than 15 s. Furthermore, the “Number of Elites” is set as 5% of the “Population Size”, and the “Maximum Stall Generations” number is set as the half of the “Generation size. The results of this sensitivity analysis are presented in
Figure 7,
Figure 8 and
Figure 9. Each figure demonstrates the mean value of the objective function and its variance, for the various levels of the parameter under investigation, following the analysis given in 7.1. The selected values of the parameters are as follows. The “Population Size” is equal to 700 (
Figure 7), the “Number of Generations” is equal to 125 (
Figure 8), and the “Crossover Rate” is equal to 0.8 (
Figure 9).
7.3. Particle Swarm Optimisation (PSO) Parameter Selection
Following the same approach as the GA, in this Section, the application of the methodology given in the
Section 7.1 for the case of the PSO is presented. Specifically, the values of the “Initial Swarm Span”, the “Maximum Iterations”, and the “Swarm Size” are selected. The values of the “Self-adjustment weight” and the “Social-adjustment weight” have been fixed to 1.49 based on previous literature [
39,
55]. For the selection of the “Initial Swarm Span” 10 values in the range (500, 5000) with step size 500 are evaluated. For the “Maximum Iterations” 10 values in the range (250, 2500) with step size 250 are evaluated. For the “Swarm Size” 10 values in the range (45, 450) with step size 45 are evaluated. Similar to the evaluation of the parameters for the GA, the maximum values for the parameters of the PSO have been selected aiming to finalise the optimisation of a charging task of 1.5 h (18 variables) in less than 15 s. Finally, the “Maximum Stall Iterations” number is set as the 1/4 of the “Maximum Iterations”. Similarly to the sensitivity analysis for the GA, the results of the sensitivity analysis of the PSO are demonstrated in
Figure 10,
Figure 11 and
Figure 12.
The selected values of the parameters are as follows. The “Initial Swarm Span” is equal to 2500 (
Figure 10), the “Maximum Iterations” is equal to 1250 (
Figure 11), and the “Swarm Size” is equal to 225 (
Figure 12). For the “Maximum Iterations” and the “Swarm Size” the computational burden was also taken into consideration.
7.4. Discussion of the Sensitivity Analysis
Examining the results of the sensitivity analysis for the GA and the PSO (
Figure 7,
Figure 8,
Figure 9,
Figure 10,
Figure 11 and
Figure 12), it is observed that the mean value of the objective function does not improve radically. The main reason for this result is that the minimum values of the parameters of the heuristic algorithms have relatively high values according to the existing literature. As a result, even with the lowest values for the parameters “Population Size”, “Number of Generations”, “Max Iterations”, and “Overall Swarm Size”, the heuristic algorithms can conclude in results with adequate quality. In addition, according to the robust design theory of [
52,
53], the sensitivity analysis requires the analysis of variances to determine the configuration of parameters that makes the performance more robust. As a result, in the context of this paper, the final selection of the parameters for the heuristic algorithms has been made by combining the results of both the “means” and the “variances” metrics. Finally, it has to be remarked that the sensitivity analysis has been performed for 100 charging tasks that have been randomly generated. The objective for the selection of the 100 charging tasks was to improve the accuracy of the results and to overcome the inherent randomness, or potential bias, of creating alternatives.
7.5. Comparison between the Genetic Algorithm (GA) and the Particle Swarm Optimisation (PSO)
After the selection of the parameters of the heuristic algorithms, a comparison is performed to select the most appropriate algorithm for the charge scheduling of EVs. Both algorithms are evaluated for the 100 charging cases presented in
Section 7.1. The direct comparison for each charging case results in mean value and the variance of the objective function for each algorithm as presented in
Figure 13, the PSO results in higher values of the value of the objective function and lower variance, compared to the performance of the GA. As a result, the PSO is a more suitable algorithm for this variance of the charge scheduling problem.
In addition, to evaluate the algorithms based on the computational time, a series of charging tasks were performed with durations in the range of (20, 120) minutes, which used a 5 min timeslot corresponding to (4, 24) variables. The results are presented in
Figure 14, where it can be observed that the GA had an average computational time of 1.62 s, while the PSO had an average computational time of 2.38 s. The stopping criterion of the PSO was that the relative change of the objective value was less than the pre-defined tolerance. By contrast, the stopping criterion of the GA was that the maximum number of generations was reached. Nevertheless, the PSO achieved better results to the value of the objective function by an average of 3.15 %.
Furthermore, to evaluate the algorithms after allowing them to operate in similar computational time, the number of generations of the GA was increased to 200, in comparison to the value of 125 that was selected after the sensitivity analysis. The results are depicted in
Figure 15, where it can be observed that the GA had an average computational time of 2.58 s, while the PSO had an average computational time of 2.38 s. The PSO achieved better results by an average of 2.13%.
7.6. Comparison with the Exhaustive Search
The PSO algorithm was also evaluated in comparison with the exhaustive search for a charge duration of four timeslots. The computing time for the exhaustive search for a charging task of 20 min (four timeslots) was 60 s using parallel processing, while the required time for the PSO was 1.57 s using single-core processing. The exhaustive search evaluated all possible charging current combinations for all timeslots with steps of 2 A. The exhaustive search always provided the best solution, and as a result the error was always positive and calculated using (20).
where,
experimentError: The error of the PSO during each experiment compared to the exhaustive search.
resultexhaustive: The fitness value of the optimal solution as calculated by the exhaustive search.
resultPSO: The fitness value of the solution as calculated in PSO.
The weighed sum method for the solution of multi-objective optimisation problems may result in decreased performance when extreme values of weight factors are used. To investigate the performance of the PSO in such cases, a comparison with the exhaustive search was performed. Specifically, the results in
Figure 16 demonstrate the relative error of the PSO when all criteria are evaluated, when only the price is evaluated, and when only the utilisation of resources is evaluated. The results indicate that in all cases the PSO has a mean error of less than 1%. This performance indicates that the PSO performs well towards finding the solution of the charge scheduling problem.
8. Operation Scenario
After the evaluation of the performance of the PSO compared to the exhaustive search, the proposed framework was demonstrated in a potential real-life scenario. For the case study, a charging task for an EV was communicated to 15 CSs.
All CSs were identical, with three normal and two fast chargers, and they had different resource availabilities during the requested period for charging. After receiving the charging requirements from the EVs, each CS operated the PSO and concluded in a proposed charging schedule. Afterwards, the EV evaluated the proposed charging schedules of all CSs through the AHP to conclude on the most appropriate based on the preferences of the driver.
The spatial distribution of the CSs refers to the city of Oslo, as a city with adequate charging infrastructure for EVs [
56]. Therefore, the distance in kilometres between the EV and each charging station was sampled from the normal distribution
N (1.74, 0.3364) [
57]. The consumption of the prototype EV was measured as 1.5 Ah/km and the average travelling speed was set to 30 km/h. In a real-life application of the proposed framework, the average travelling speed to the station could be obtained from traffic information captured using the application programming interface (API) of a commercial application (e.g., Google Maps). Additionally, the average consumption of the EV will be calculated using statistical information from the computing unit of the EV, in a similar manner as the fuel consumption of conventional vehicles is calculated. Furthermore, the priorities of the driver are presented in
Table 7 along with the priority vector as calculated by the AHP. For the evaluation of the full PSO-AHP decision-making framework, the Utilisation criterion (CS objective) had an assumed weight factor of 0.4, while the weight factors that reflect the priorities of the driver had a total weight of 0.6 and they had weight factors as presented in the last column of
Table 7. Those weight factors were calculated by multiplying the value of the priority vector by 0.6, and as a result the sum of all factors equalled 1.
The 15 CSs that were evaluated, had availabilities in the range [10–94%]. Three charging scenarios were defined, representing indicative requirements set by the EV driver. In all three scenarios, the energy requirement referred to an increase in the battery charge by 95 Ah. The three scenarios were differentiated by the preferred completion time of the charging task. The first scenario corresponded to an urgent fast charging task, which had a preferred completion time of 30 min. The second scenario had reduced restriction in the completion time, which was 1 h. The third scenario had a completion time of 1.5 h.
The results are demonstrated in
Table 8, where it can be observed that the proposed framework manages to conclude in feasible solutions even for CSs with low availability, by taking advantage of the resource-sharing mechanism. The objective function of the proposed solution is significantly reduced when the availability of the CS drops below 30%. Therefore, the CSs that employ the proposed solution can provide competitive solutions even in low-availability scenarios. The ranking of the CSs for the three evaluation scenarios, using the AHP, is presented in
Table 9. By comparing the results of
Table 8 and
Table 9, it can be observed that the ranking of the CSs based on their value of the objective function (PSO), and their ranking based on the AHP is not identical. This is justified by the fact that the PSO aims to satisfy both the CS operator and the driver, whereas the AHP aims to support the driver making the best decision based on their subjective preferences. The final decision is made following the outcome of the AHP.
Moreover, the detailed quotations of the CSs for Scenario 2 are presented in
Table 10, where the preferred solution is No 3. The solution No 3 corresponds to a CS with high availability of chargers, which is close to the location of the EV. Therefore, it can satisfy the preferences of the driver, while maintaining high utilisation of the charging resources. In
Table 10, it can also be observed that CSs No. 13–15 could not provide the requested energy to the EV due to limited resource availability.
The weight factors that are presented in
Table 7 indicate that the “Average Charging Current” criterion has the highest priority.
Table 10 demonstrates the detailed CS quotation for the charging Scenario 2, after employing the weight factors of
Table 7. In
Table 10, station No 11 offers a charging solution with an average charging current of 115.72 A, which is higher than the preferred value of 95 A (calculated by the required energy and the completion time). In addition, the use of slightly average higher current results in a faster charging time. As a result, even if the first priority of the driver does not take its maximum value, the overall solution for a charging station with low availability (i.e., CS No 11) is competitive.
9. Conclusions
In this paper, a framework for the smart charging of EVs is proposed. The decision-making procedure for the smart charging is performed in two phases. During the first phase, the prospective CSs employ the PSO to generate the charging schedules and provide those as quotations to the EV. During the second phase, the energy management unit of the EV evaluates the CSs using the AHP to select the most appropriate based on the needs of the driver for transportation and their user-defined priorities. The communications among the EV and the CSs are facilitated by the OPC–UA standard to promote interoperability among heterogeneous systems.
By evaluating the proposed algorithm compared to the exhaustive search in the solution space, low errors of 0.65% have been observed. Moreover, the resource-sharing mechanism allows the generation of competitive solutions, even by CSs with low availabilities. It is noted that in real-life applications, algorithms that are based on the exhaustive search are not applicable due to their high computing requirements. In addition, convex optimisation methods may suffer from reduced flexibility during the modification of the scheduling objectives, as those are closely related to the effectiveness of the selected mathematical method. Furthermore, heuristic algorithms can surpass those obstacles and conclude in flexible smart algorithms that generate near-optimal solutions.
The benefits of the proposed framework are summarised as follows:
The utilisation of the PSO as the scheduling algorithm results in decoupling of the search mechanism of the solution space from the evaluation of the criteria. Therefore, enhanced flexibility is introduced during the specification of the decision-making objectives, along with real-time preference modification using the corresponding weight factors.
Near-optimal solutions are identified in a timely manner to satisfy the requirements for the application of the algorithm during transportation scenarios in urban environments.
The preferences of non-experienced decision-makers (i.e., the drivers of the EVs) are introduced into the framework through the weight factors generated by an intuitive procedure of the pairwise comparison within the AHP.
The scheduling algorithm supports the evaluation of multiple types of charger that are shared between multiple charging points in a resource-sharing manner.
The communications among the EVs and the charging stations are facilitated by the OPC–UA standard to support the interoperability of heterogeneous subsystems in a smart grid.
In the future work, the Authors aim to extend the operation of the proposed framework to enable V2G energy transfer and evaluate its performance during load balancing requirements of the Smart Grid.
Author Contributions
Conceptualization, N.M., D.M. and E.T.; methodology, N.M., D.M. and E.T.; software, N.M.; validation, N.M.; formal analysis, N.M., D.M. and E.T.; investigation, N.M., D.M. and E.T.; resources, N.M., D.M. and E.T.; data curation, N.M.; writing—original draft preparation, N.M., D.M. and E.T.; writing—review and editing, N.M., D.M. and E.T.; visualization, N.M.; supervision, D.M. and E.T.; project administration, D.M. and E.T.; funding acquisition, N.M., and E.T. All authors have read and agreed to the published version of the manuscript.
Funding
This research is co-financed by Greece and the European Union (European Social Fund- ESF) through the Operational Programme «Human Resources Development, Education and Lifelong Learning» in the context of the project “Strengthening Human Resources Research Potential via Doctorate Research” (MIS-5000432), implemented by the State Scholarships Foundation (ΙΚΥ).
Conflicts of Interest
The authors declare no conflict of interest. The funders had no role in the design of the study; in the collection, analyses, or interpretation of data; in the writing of the manuscript; or in the decision to publish the results.
References
- Ghosh, A. Possibilities and Challenges for the Inclusion of the Electric Vehicle (EV) to Reduce the Carbon Footprint in the Transport Sector: A Review. Energies 2020, 13, 2602. [Google Scholar] [CrossRef]
- Howell, S.; Rezgui, Y.; Hippolyte, J.L.; Jayan, B.; Li, H. Towards the next generation of smart grids: Semantic and holonic multi-agent management of distributed energy resources. Renew. Sust. Energ. Rev. 2017, 77, 193–214. [Google Scholar] [CrossRef]
- Nour, M.; Chaves-Ávila, J.; Magdy, G.; Sánchez-Miralles, Á. Review of Positive and Negative Impacts of Electric Vehicles Charging on Electric Power Systems. Energies 2020, 13, 4675. [Google Scholar] [CrossRef]
- Mukherjee, J.C.; Gupta, A. A Review of Charge Scheduling of Electric Vehicles in Smart Grid. IEEE Syst. J. 2015, 9, 1541–1553. [Google Scholar] [CrossRef]
- Peng, H.; Liang, L.; Shen, X.; Li, G.Y. Vehicular Communications: A Network Layer Perspective. IEEE Trans. Veh. Technol. 2019, 68, 1064–1078. [Google Scholar] [CrossRef] [Green Version]
- Chung, H.; Li, W.; Yuen, C.; Wen, C.; Crespi, N. Electric Vehicle Charge Scheduling Mechanism to Maximize Cost Efficiency and User Convenience. IEEE Trans. Smart Grid 2019, 10, 3020–3030. [Google Scholar] [CrossRef] [Green Version]
- Milas, N.T.; Tatakis, E.C. Charging Station Selection through the Analytic Hierarchy Process enabled by OPC-UA for Vehicle-to-Grid Communications. In Proceedings of the 21st European Conference on Power Electronics and Applications (EPE ‘19 ECCE Europe), Genova, Italy, 2–5 September 2019; pp. 1–10. [Google Scholar]
- Milas, N.T.; Mourtzis, D.A.; Giotakos, P.I.; Tatakis, E.C. Two-Layer Genetic Algorithm for the Charge Scheduling of Electric Vehicles. In Proceedings of the 22nd European Conference on Power Electronics and Applications (EPE’20 ECCE Europe), Lyon, France, 7–11 September 2020; pp. 1–10. [Google Scholar]
- Sassi, O.; Oulamara, A. Electric vehicle scheduling and optimal charging problem: Complexity, exact and heuristic approaches. Int. J. Prod. Res. 2016, 55, 519–535. [Google Scholar] [CrossRef]
- Wang, J.; Bharati, G.R.; Paudyal, S.; Ceylan, O.; Bhattarai, B.P.; Myers, K.S. Coordinated Electric Vehicle Charging with Reactive Power Support to Distribution Grids. IEEE Trans. Ind. Informat. 2019, 15, 54–63. [Google Scholar] [CrossRef]
- Wang, S.; Dong, Z.Y.; Luo, F.; Meng, K.; Zhang, Y. Stochastic Collaborative Planning of Electric Vehicle Charging Stations and Power Distribution System. IEEE Trans. Ind. Informat. 2018, 14, 321–331. [Google Scholar] [CrossRef]
- Hashemi, B.; Shahabi, M.; Teimourzadeh-Baboli, P. Stochastic-Based Optimal Charging Strategy for Plug-In Electric Vehicles Aggregator Under Incentive and Regulatory Policies of DSO. IEEE Trans. Veh. Technol. 2019, 68, 3234–3245. [Google Scholar] [CrossRef]
- Wang, L.; Sharkh, S.; Chipperfield, A.; Cruden, A. Dispatch of Vehicle-to-Grid Battery Storage Using an Analytic Hierarchy Process. IEEE Trans. Veh. Technol. 2017, 66, 2952–2965. [Google Scholar] [CrossRef] [Green Version]
- Chen, X.; Leung, K.; Lam, A.Y.S.; Hill, D.J. Online Scheduling for Hierarchical Vehicle-to-Grid System: Design, Formulation, and Algorithm. IEEE Trans. Veh. Technol. 2019, 68, 1302–1317. [Google Scholar] [CrossRef]
- Mao, T.; Lau, W.; Shum, C.; Chung, H.S.; Tsang, K.; Tse, N.C. A Regulation Policy of EV Discharging Price for Demand Scheduling. IEEE Trans. Power Syst. 2018, 33, 1275–1288. [Google Scholar] [CrossRef]
- Wang, D.; Guan, X.; Wu, J.; Li, P.; Zan, P.; Xu, H. Integrated Energy Exchange Scheduling for Multimicrogrid System with Electric Vehicles. IEEE Trans. Smart Grid 2016, 7, 1762–1774. [Google Scholar] [CrossRef] [Green Version]
- Lin, C.; Deng, D.; Kuo, C.; Liang, Y. Optimal Charging Control of Energy Storage and Electric Vehicle of an Individual in the Internet of Energy With Energy Trading. IEEE Trans. Ind. Informat. 2018, 14, 2570–2578. [Google Scholar] [CrossRef]
- Kabir, M.E.; Assi, C.; Tushar, M.H.K.; Yan, J. Optimal Scheduling of EV Charging at a Solar Power-Based Charging Station. IEEE Syst. J. 2020, 14, 1–11. [Google Scholar] [CrossRef]
- Atallah, R.F.; Assi, C.M.; Fawaz, W.; Tushar, M.H.K.; Khabbaz, M.J. Optimal Supercharge Scheduling of Electric Vehicles: Centralized Versus Decentralized Methods. IEEE Trans. Veh. Technol. 2018, 67, 7896–7909. [Google Scholar] [CrossRef]
- Li, S.; Li, J.; Su, C.; Yang, Q. Optimization of Bi-Directional V2G Behavior with Active Battery Anti-Aging Scheduling. IEEE Access 2020, 8, 11186–11196. [Google Scholar] [CrossRef]
- Zhang, H.; Hu, Z.; Xu, Z.; Song, Y. Optimal Planning of PEV Charging Station with Single Output Multiple Cables Charging Spots. IEEE Trans. Smart Grid 2017, 8, 2119–2128. [Google Scholar] [CrossRef]
- Tucker, N.; Alizadeh, M. An Online Admission Control Mechanism for Electric Vehicles at Public Parking Infrastructures. IEEE Trans. Smart Grid. 2020, 11, 161–170. [Google Scholar] [CrossRef] [Green Version]
- Wang, S.; Bi, S.; Zhang, Y.A.; Huang, J. Electrical Vehicle Charging Station Profit Maximization: Admission, Pricing, and Online Scheduling. IEEE Trans. Sustain. Energy 2018, 9, 1722–1731. [Google Scholar] [CrossRef] [Green Version]
- Wu, H.; Pang, G.K.H.; Choy, K.L.; Lam, H.Y. An Optimization Model for Electric Vehicle Battery Charging at a Battery Swapping Station. IEEE Trans. Veh. Technol. 2018, 67, 881–895. [Google Scholar] [CrossRef]
- Wang, Y.; Su, Z.; Xu, Q.; Yang, T.; Zhang, N. A Novel Charging Scheme for Electric Vehicles with Smart Communities in Vehicular Networks. IEEE Trans. Veh. Technol. 2019, 68, 8487–8501. [Google Scholar] [CrossRef]
- Cao, Y.; Wang, T.; Kaiwartya, O.; Min, G.; Ahmad, N.; Abdullah, A.H. An EV Charging Management System Concerning Drivers’ Trip Duration and Mobility Uncertainty. IEEE Trans. Syst. Man. Cybern. Syst. 2018, 48, 596–607. [Google Scholar] [CrossRef] [Green Version]
- Su, Z.; Wang, Y.; Xu, Q.; Fei, M.; Tian, Y.; Zhang, N. A Secure Charging Scheme for Electric Vehicles with Smart Communities in Energy Blockchain. IEEE Internet Things J. 2019, 6, 4601–4613. [Google Scholar] [CrossRef] [Green Version]
- Rohjans, S.; Fensel, D.; Fensel, A. OPC UA goes semantics: Integrated communications in smart grids. In Proceedings of the 2011 IEEE 16th Conference on Emerging Technologies & Factory Automation (ETFA 2011), Toulouse, France, 5–9 September 2011; pp. 1–4. [Google Scholar]
- Cintuglu, M.H.; Mohammed, O.A. Multiagent-based decentralized operation of microgrids considering data interoperability. In Proceedings of the 6th IEEE Int. Conf. on Smart Grid Communications (SmartGridComm 2015), Miami, FL, USA, 2–5 November 2015; pp. 404–409. [Google Scholar]
- Yoo, M.; Kolyvakis, P.; Kiritsis, D.; Werthmann, D.; Hellbach, R. Semantic Model for IoT-Enabled Electric Vehicle Services: Puzzling with Ontologies. In Proceedings of the 4th IEEE International Conference on Future Internet of Things and Cloud (FiCloud), Vienna, Austria, 22–24 August 2016; pp. 387–392. [Google Scholar]
- Hussain, S.M.S.; Ustun, T.S.; Nsonga, P.; Ali, I. IEEE 1609 WAVE and IEC 61850 Standard Communication Based Integrated EV Charging Management in Smart Grids. IEEE Trans. Veh. Technol. 2018, 67, 7690–7697. [Google Scholar] [CrossRef]
- Bhattacharjee, A.; Mohanty, R.K.; Ghosh, A. Design of an Optimized Thermal Management System for Li-Ion Batteries under Different Discharging Conditions. Energies 2020, 13, 5695. [Google Scholar] [CrossRef]
- Cheng, R.H.; Xu, C.; Wu, T.K. A Genetic Approach to Solve the Emergent Charging Scheduling Problem Using Multiple Charging Vehicles for Wireless Rechargeable Sensor Networks. Energies 2019, 12, 287. [Google Scholar] [CrossRef] [Green Version]
- Liu, D.; Wang, Y.; Shen, Y. Electric Vehicle Charging and Discharging Coordination on Distribution Network Using Multi-Objective Particle Swarm Optimization and Fuzzy Decision Making. Energies 2016, 9, 186. [Google Scholar] [CrossRef]
- Paterakis, N.G.; Gibescu, M.; Bakirtzis, A.G.; Catalão, J.P.S. A Multi-Objective Optimization Approach to Risk-Constrained Energy and Reserve Procurement Using Demand Response. IEEE Trans. Power Syst. 2018, 33, 3940–3954. [Google Scholar] [CrossRef]
- Miettinen, K. Some Methods for Nonlinear Multi-objective Optimization. In Evolutionary Multi-Criterion Optimization—Lecture Notes in Computer Science; Zitzler, E., Thiele, L., Deb, K., Coello Coello, C.A., Corne, D., Eds.; Springer: Berlin/Heidelberg, Germany, 2001; Volume 1993, pp. 1–20. [Google Scholar]
- Mitchell, M. An Introduction to Genetic Algorithms; MIT Press: Cambridge, MA, USA, 1998. [Google Scholar]
- Weise, T. Global Optimization Algorithms—Theory and Application, 2nd ed. Self-Published. 2009. Available online: http://www.it-weise.de/projects/book.pdf (accessed on 10 October 2020).
- Wang, D.; Tan, D.; Liu, L. Particle swarm optimization algorithm: An overview. Soft Comput. 2018, 22, 387–408. [Google Scholar] [CrossRef]
- Emrouznejad, A.; Marra, M. The state of the art development of AHP (1979–2017): A literature review with a social network analysis. Int. J. Prod. Res. 2017, 55, 6653–6675. [Google Scholar] [CrossRef] [Green Version]
- Mourtzis, D.; Vlachou, E.; Milas, N.; Tapoglou, N.; Mehnen, J. A cloud-based, knowledge-enriched framework for increasing machining efficiency based on machine tool monitoring. Proc. Inst. Mech. Eng. Part B J. Eng. Manuf. 2017, 233, 278–292. [Google Scholar] [CrossRef] [Green Version]
- Triantaphyllou, E.; Mann, S.H. Using the analytic Hierarchy process for decision making in engineering applications: Some challenges. Int. J. Ind. Eng. Theory 1995, 2, 35–44. [Google Scholar]
- Mourtzis, D.; Milas, N.; Vlachou, A. An Internet of Things-Based Monitoring System for Shop-Floor Control. J. Comput. Inf. Sci. Eng. 2018, 18, 021005. [Google Scholar] [CrossRef]
- Cavalieri, S.; Salafia, M.G.; Scroppo, M.S. Integrating OPC UA with web technologies to enhance interoperability. Comput. Stand. Interfaces 2019, 61, 45–64. [Google Scholar] [CrossRef]
- Mourtzis, D.; Milas, N.; Athinaios, N. Towards Machine Shop 4.0: A General Machine Model for CNC machine-tools through OPC-UA. Procedia CIRP 2018, 78, 301–306. [Google Scholar] [CrossRef]
- Lee, B.; Kim, D.K.; Yang, H.; Oh, S. Model transformation between OPC UA and UML. Comput. Stand. Interfaces 2017, 50, 236–250. [Google Scholar] [CrossRef]
- Habib, S.; Khan, M.M.; Abbas, F.; Sang, L.; Shahid, M.U.; Tang, H. A Comprehensive Study of Implemented International Standards, Technical Challenges, Impacts and Prospects for Electric Vehicles. IEEE Access 2018, 6, 13866–13890. [Google Scholar] [CrossRef]
- Eclipse Milo. An Open Source Implementation of OPC UA (IEC 62541). Github Repository. Available online: https://github.com/eclipse/milo (accessed on 21 September 2020).
- OPC UA Demo Client, Softing. Available online: https://data-intelligence.softing.com/products/opc-software-platform/opc-ua-demo-client/ (accessed on 21 September 2020).
- Milas, N.T.; Tatakis, E.C.; Mitronikas, E.D. Investigation of the operation of an electric city car equipped with electronic differential using CAN-enabled monitoring. In Proceedings of the 4th Panhellenic Conference on Electronics and Telecommunications (PACET 2017), Xanthi, Greece, 17–18 November 2017; pp. 1–4. [Google Scholar]
- Mourtzis, D.; Doukas, M.; Psarommatis, F. Design of manufacturing networks for mass customisation using an intelligent search method. Int. J. Comput. Integr. Manuf. 2014, 28, 679–700. [Google Scholar] [CrossRef]
- Phadke, M.S. Quality Engineering Using Robust Design, 1st ed.; Prentice Hall: Englewood Cliffs, NJ, USA, 1995. [Google Scholar]
- Saltelli, A.; Tarantola, S.; Campolongo, F.; Ratto, M. Sensitivity Analysis in Practice: A Guide to Assessing Scientific Models; John Wiley & Sons Ltd.: Chichester, UK, 2004. [Google Scholar]
- MATLAB Documentation. Global Optimization Toolbox. Available online: https://uk.mathworks.com/help/gads/index.html?s_tid=CRUX_lftnav (accessed on 21 September 2020).
- Eberhart, R.C.; Shi, Y. Comparing inertia weights and constriction factors in particle swarm optimization. In Proceedings of the 2000 Congress on Evolutionary Computation, CEC00 (Cat. No.00TH8512), La Jolla, CA, USA, 16–19 July 2000; pp. 84–88. [Google Scholar]
- Statistics Norway. Electric Prices. Available online: https://www.ssb.no/en/elkraftpris (accessed on 21 September 2020).
- PlugShare. Available online: https://www.plugshare.com/ (accessed on 21 September 2020).
Figure 1.
Overall representation of the smart charging framework.
Figure 1.
Overall representation of the smart charging framework.
Figure 2.
The formation of the charging alternative.
Figure 2.
The formation of the charging alternative.
Figure 3.
The flowchart to import the variables for the initialisation of the optimisation.
Figure 3.
The flowchart to import the variables for the initialisation of the optimisation.
Figure 4.
The flowchart for the quantification of the driver’s priorities.
Figure 4.
The flowchart for the quantification of the driver’s priorities.
Figure 5.
The sequence diagram for the Open Platform Communications–Unified Architecture (OPC–UA) communications.
Figure 5.
The sequence diagram for the Open Platform Communications–Unified Architecture (OPC–UA) communications.
Figure 6.
A reference architecture for the OPC–UA implementation.
Figure 6.
A reference architecture for the OPC–UA implementation.
Figure 7.
Sensitivity analysis of genetic algorithm (GA) evaluating the population size.
Figure 7.
Sensitivity analysis of genetic algorithm (GA) evaluating the population size.
Figure 8.
Sensitivity analysis of GA evaluating the number of generations.
Figure 8.
Sensitivity analysis of GA evaluating the number of generations.
Figure 9.
Sensitivity analysis of GA evaluating the crossover rate.
Figure 9.
Sensitivity analysis of GA evaluating the crossover rate.
Figure 10.
Sensitivity analysis of PSO evaluating the Initial Swarm Span.
Figure 10.
Sensitivity analysis of PSO evaluating the Initial Swarm Span.
Figure 11.
Sensitivity analysis of particle swarm optimisation (PSO) evaluating the maximum number of iterations.
Figure 11.
Sensitivity analysis of particle swarm optimisation (PSO) evaluating the maximum number of iterations.
Figure 12.
Sensitivity analysis of PSO evaluating the swarm size.
Figure 12.
Sensitivity analysis of PSO evaluating the swarm size.
Figure 13.
Performance comparison between the PSO and the GA.
Figure 13.
Performance comparison between the PSO and the GA.
Figure 14.
Computational time comparison between the PSO and the GA using the parameters of the sensitivity analysis.
Figure 14.
Computational time comparison between the PSO and the GA using the parameters of the sensitivity analysis.
Figure 15.
Computational time comparison between the PSO and the GA increasing the number of generations to 200.
Figure 15.
Computational time comparison between the PSO and the GA increasing the number of generations to 200.
Figure 16.
Comparison between the exhaustive search and the PSO under optimisation for all criteria, only price criterion, and only utilization criterion.
Figure 16.
Comparison between the exhaustive search and the PSO under optimisation for all criteria, only price criterion, and only utilization criterion.
Table 1.
The charging requirements of the electric vehicle (EV) and the capabilities of the charging station (CS).
Table 1.
The charging requirements of the electric vehicle (EV) and the capabilities of the charging station (CS).
| EV Requirements | CS Capabilities |
|---|
| Charging Voltage | Charging Duration | Acceptable Delay (Tolerance) | Preferred Average Current | Max Battery Current | Requested Battery Charge | Max Battery Current | Max Normal Current | Max Fast Current |
|---|
| 90 V | 20 min (4 Timeslots) | 10 min (2 Timeslots) | 201 A | 270 A | 67 Ah | 270 A | 90 A | 300 A |
Table 2.
The proposed indicative charging scenario.
Table 2.
The proposed indicative charging scenario.
| | Timeslot No (Each Timeslot = 5 min) | Total Price/Charge |
|---|
| 1 | 2 | 3 | 4 | 5 | |
|---|
| Charger | Fast | Fast | Normal | Normal | Fast | Total Price | Total Ah |
| Price (€/kWh) | 0.264 | 0.202 | 0.151 | 0.135 | 0.260 | 1.33 € | 67 Ah |
| Current (A) | 208 | 208 | 90 | 90 | 208 |
Table 3.
The values of the criteria and the objective function for the indicative charging scenario.
Table 3.
The values of the criteria and the objective function for the indicative charging scenario.
| Criterion | Due Time | Total Price | Utilisation | Iavg | Imax | Objective Value |
|---|
| Value | 0.5 | 0.409 | 0.816 | 1 | 0.9 | 0.783 |
| Weight | 0.126 | 0.126 | 0.4 | 0.288 | 0.06 |
Table 4.
The pairwise comparisons considering three criteria/alternatives.
Table 4.
The pairwise comparisons considering three criteria/alternatives.
| | Criteria/Alternatives | Priority Vector |
|---|
| Criteria/Alternatives | C11 | C12 | C13 | |
| C21 | C22 | C23 | |
| C31 | C32 | C33 | |
Table 5.
The decision matrix providing the ranking of the alternatives.
Table 5.
The decision matrix providing the ranking of the alternatives.
| | Criteria | Final Priority |
|---|
| Weights | PVCrit1 | PVCrit2 | PVCrit3 |
|---|
| Alternatives | PVCrit1 ∙ PV(A1,C1) | PVCrit2 ∙ PV(A1,C2) | PVCrit3 ∙ PV(A1,C3) | |
| PVCrit1 ∙ PV(A2,C1) | PVCrit2 ∙ PV(A2,C2) | PVCrit3 ∙ PV(A2,C3) | |
| PVCrit1 ∙ PV(A3,C1) | PVCrit3 ∙ PV(A3,C2) | PVCrit3 ∙ PV(A3,C3) | |
Table 6.
The three-parameter/three-level Taguchi orthogonal array.
Table 6.
The three-parameter/three-level Taguchi orthogonal array.
| Experiment Number | Parameter Value |
|---|
| Param. 1 | Param. 2 | Param. 3 |
|---|
| 1 | −1 | −1 | −1 |
| 2 | −1 | 0 | 0 |
| 3 | −1 | 1 | 1 |
| 4 | 0 | −1 | 1 |
| 5 | 0 | 0 | −1 |
| 6 | 0 | 1 | 0 |
| 7 | 1 | −1 | 0 |
| 8 | 1 | 0 | 1 |
| 9 | 1 | 1 | −1 |
Table 7.
The analytic hierarchy process (AHP) criteria as defined by the driver.
Table 7.
The analytic hierarchy process (AHP) criteria as defined by the driver.
| Criterion | Price | Avg. Cur. | Max. Cur. | Due Time | Priority Vector | Weight Factor |
|---|
| Price | 1.00 | 0.33 | 3.00 | 1.00 | 0.21 | 0.126 |
| Avg. Cur. | 3.00 | 1.00 | 3.00 | 3.00 | 0.48 | 0.288 |
| Max. Cur. | 0.33 | 0.33 | 1.00 | 0.33 | 0.10 | 0.06 |
| Due Time | 1.00 | 0.33 | 3.00 | 1.00 | 0.21 | 0.126 |
Table 8.
The objective function value of each CS after the operation of the PSO, for the three scenarios.
Table 8.
The objective function value of each CS after the operation of the PSO, for the three scenarios.
| | Station Availability (%) |
|---|
| | 94% | 88% | 82% | 76% | 70% | 64% | 58% | 52% | 46% | 40% | 34% | 28% | 22% | 16% | 10% |
|---|
| Sc1 | 0.83 | 0.82 | 0.82 | 0.82 | 0.82 | 0.82 | 0.78 | 0.76 | 0.80 | 0.00 | 0.00 | 0.00 | 0.00 | 0.00 | 0.00 |
| Sc2 | 0.90 | 0.89 | 0.92 | 0.90 | 0.86 | 0.86 | 0.86 | 0.83 | 0.89 | 0.83 | 0.76 | 0.55 | 0.00 | 0.00 | 0.00 |
| Sc3 | 0.88 | 0.85 | 0.87 | 0.84 | 0.89 | 0.89 | 0.89 | 0.89 | 0.89 | 0.89 | 0.87 | 0.54 | 0.58 | 0.54 | 0.00 |
Table 9.
The ranking of each CS after the operation of the AHP for the three scenarios.
Table 9.
The ranking of each CS after the operation of the AHP for the three scenarios.
| | Station Availability (%) |
|---|
| | 94% | 88% | 82% | 76% | 70% | 64% | 58% | 52% | 46% | 40% | 34% | 28% | 22% | 16% | 10% |
|---|
| Sc1 | 0.122 | 0.081 | 0.155 | 0.096 | 0.122 | 0.143 | 0.139 | 0.095 | 0.048 | 0.000 | 0.000 | 0.000 | 0.000 | 0.000 | 0.000 |
| Sc2 | 0.089 | 0.084 | 0.102 | 0.088 | 0.094 | 0.089 | 0.086 | 0.079 | 0.076 | 0.083 | 0.084 | 0.046 | 0.000 | 0.000 | 0.000 |
| Sc3 | 0.070 | 0.085 | 0.089 | 0.082 | 0.074 | 0.084 | 0.081 | 0.074 | 0.081 | 0.087 | 0.089 | 0.031 | 0.042 | 0.032 | 0.000 |
Table 10.
The detailed CS quotation for Scenario 2.
Table 10.
The detailed CS quotation for Scenario 2.
| Station No | Station Dist. (km) | Travel Capac. (Ah) | Travel Time (h) | Charge Dur. (h) | Station Avg. Cur. (A) | Station Max Cur. (A) | Charging Cost (€) | Total Capac. (Ah) | Station Rank |
|---|
| 1 | 2.05 | 3.08 | 0.068 | 1.08 | 90.62 | 98.08 | 1.20 | 98.17 | 0.089 |
| 2 | 2.80 | 4.21 | 0.093 | 1.08 | 91.57 | 110.47 | 1.22 | 99.21 | 0.084 |
| 3 | 0.43 | 0.64 | 0.014 | 1.08 | 88.27 | 90.00 | 1.11 | 95.64 | 0.102 |
| 4 | 2.24 | 3.36 | 0.075 | 1.08 | 90.79 | 100.32 | 1.21 | 98.36 | 0.088 |
| 5 | 1.50 | 2.25 | 0.050 | 1.08 | 89.77 | 90.00 | 1.12 | 97.25 | 0.094 |
| 6 | 0.98 | 1.47 | 0.033 | 1.17 | 89.94 | 90.00 | 1.10 | 97.20 | 0.089 |
| 7 | 1.41 | 2.12 | 0.047 | 1.17 | 89.65 | 90.00 | 1.10 | 97.12 | 0.086 |
| 8 | 1.94 | 2.91 | 0.065 | 1.00 | 106.81 | 151.63 | 1.63 | 97.91 | 0.079 |
| 9 | 3.82 | 5.72 | 0.127 | 1.08 | 92.98 | 128.68 | 1.27 | 100.72 | 0.076 |
| 10 | 3.35 | 5.02 | 0.112 | 0.92 | 109.11 | 160.08 | 1.64 | 100.02 | 0.083 |
| 11 | 0.96 | 1.44 | 0.032 | 0.92 | 115.72 | 175.82 | 1.61 | 96.44 | 0.084 |
| 12 | 3.50 | 5.25 | 0.117 | 0.75 | 202.51 | 258.75 | 2.06 | 101.25 | 0.046 |
| 13 | 2.16 | 3.24 | 0.072 | 0.42 | 270.00 | 270.00 | 2.09 | 90.00 | 0.000 |
| 14 | 1.70 | 2.56 | 0.057 | 0.33 | 270.00 | 270.00 | 2.10 | 90.00 | 0.000 |
| 15 | 2.15 | 3.23 | 0.072 | 0.17 | 270.00 | 270.00 | 0.94 | 45.00 | 0.000 |
| Publisher’s Note: MDPI stays neutral with regard to jurisdictional claims in published maps and institutional affiliations. |
© 2020 by the authors. Licensee MDPI, Basel, Switzerland. This article is an open access article distributed under the terms and conditions of the Creative Commons Attribution (CC BY) license (http://creativecommons.org/licenses/by/4.0/).


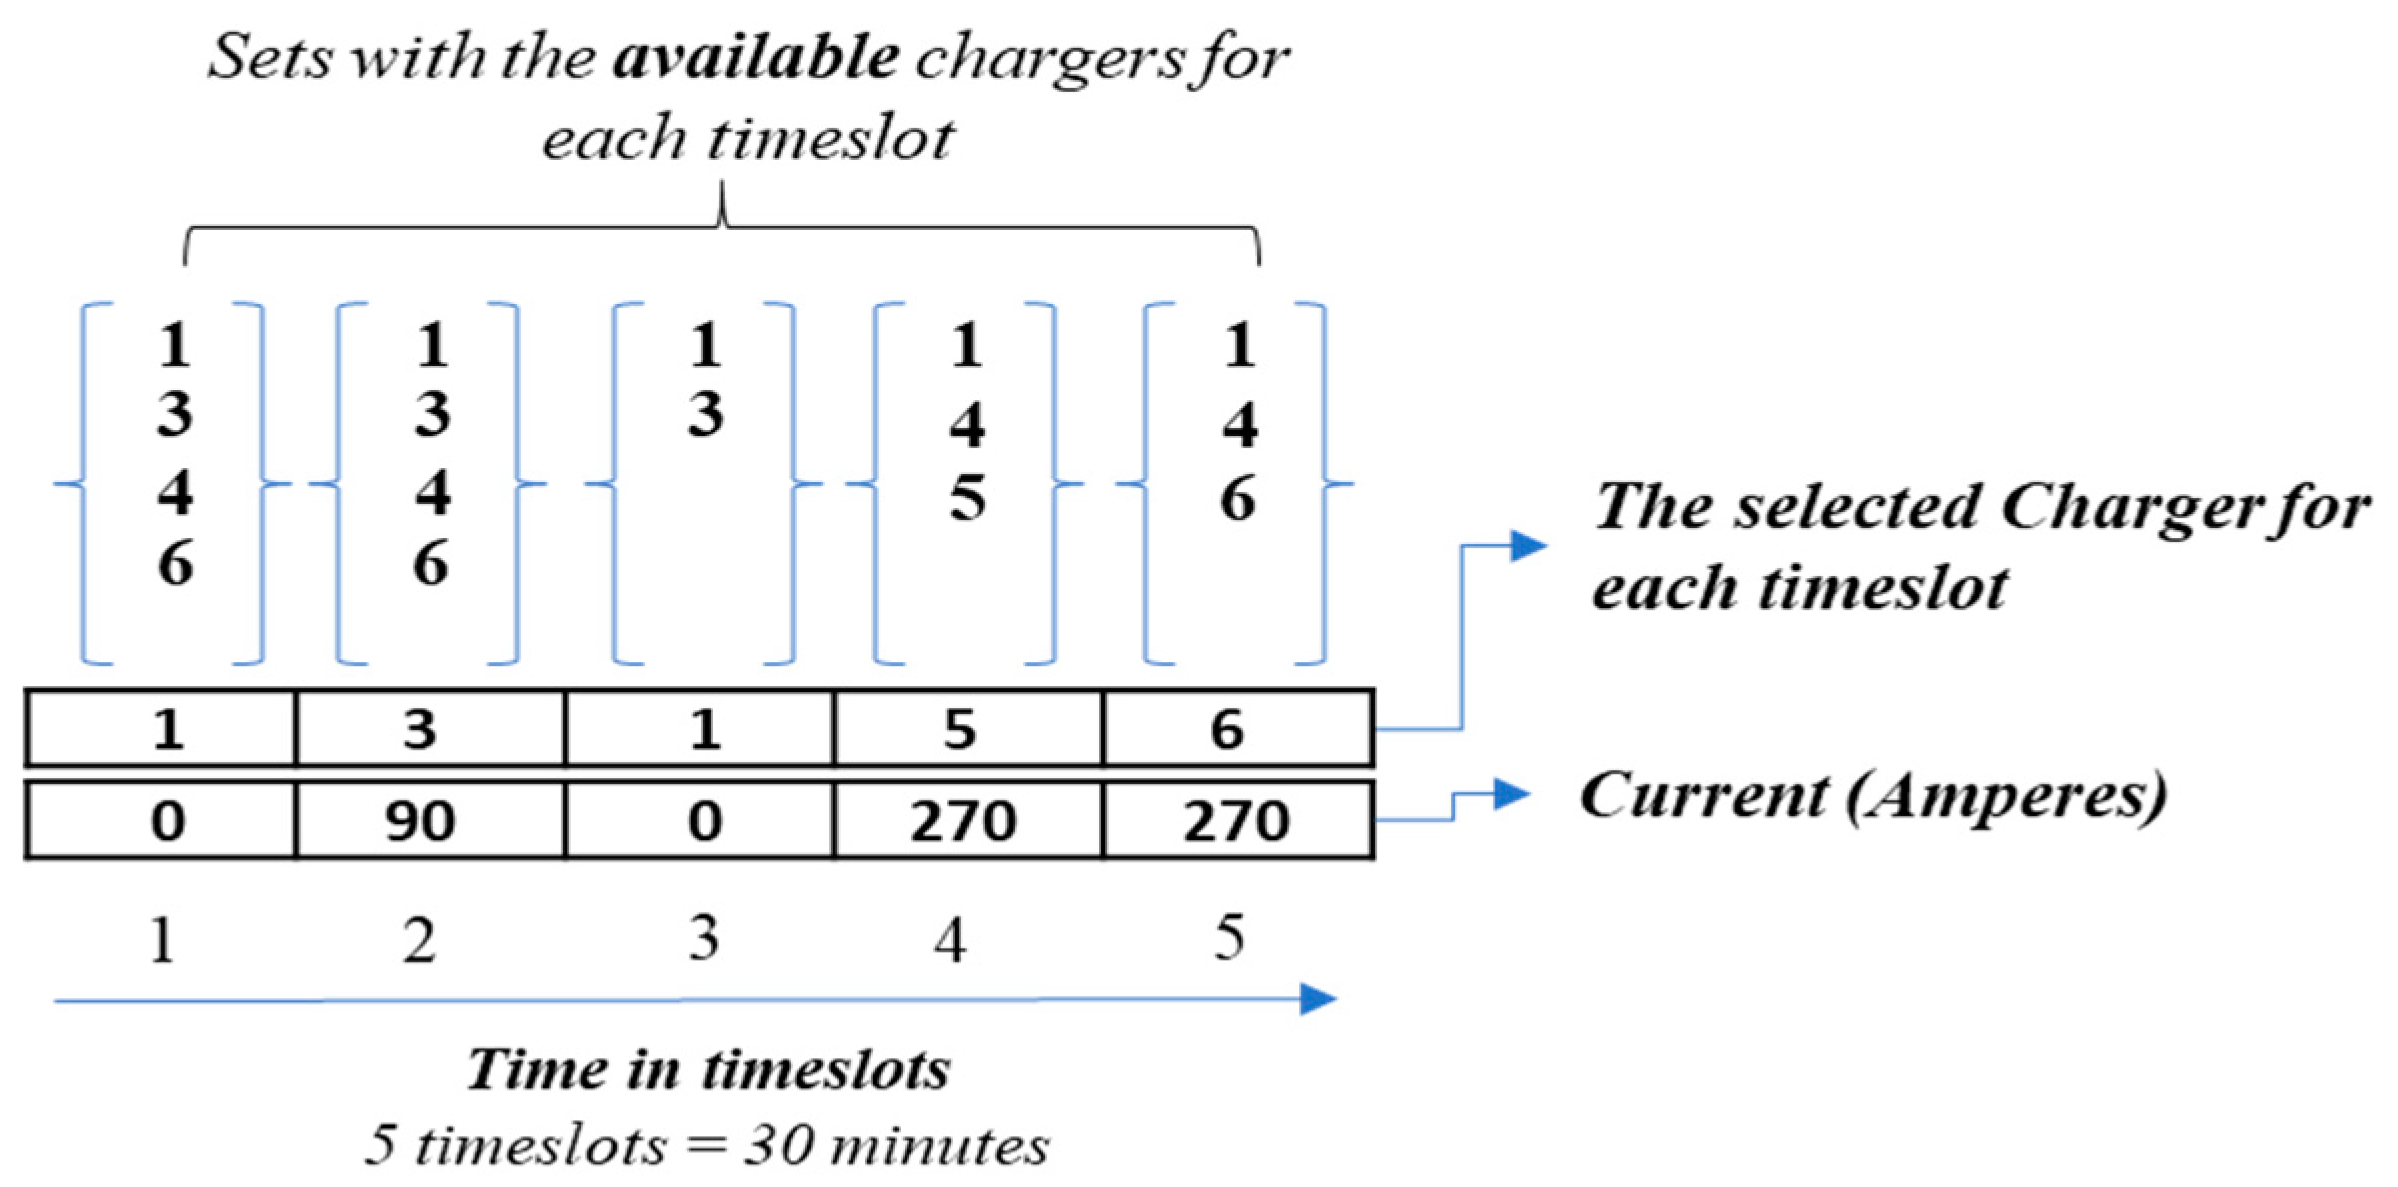
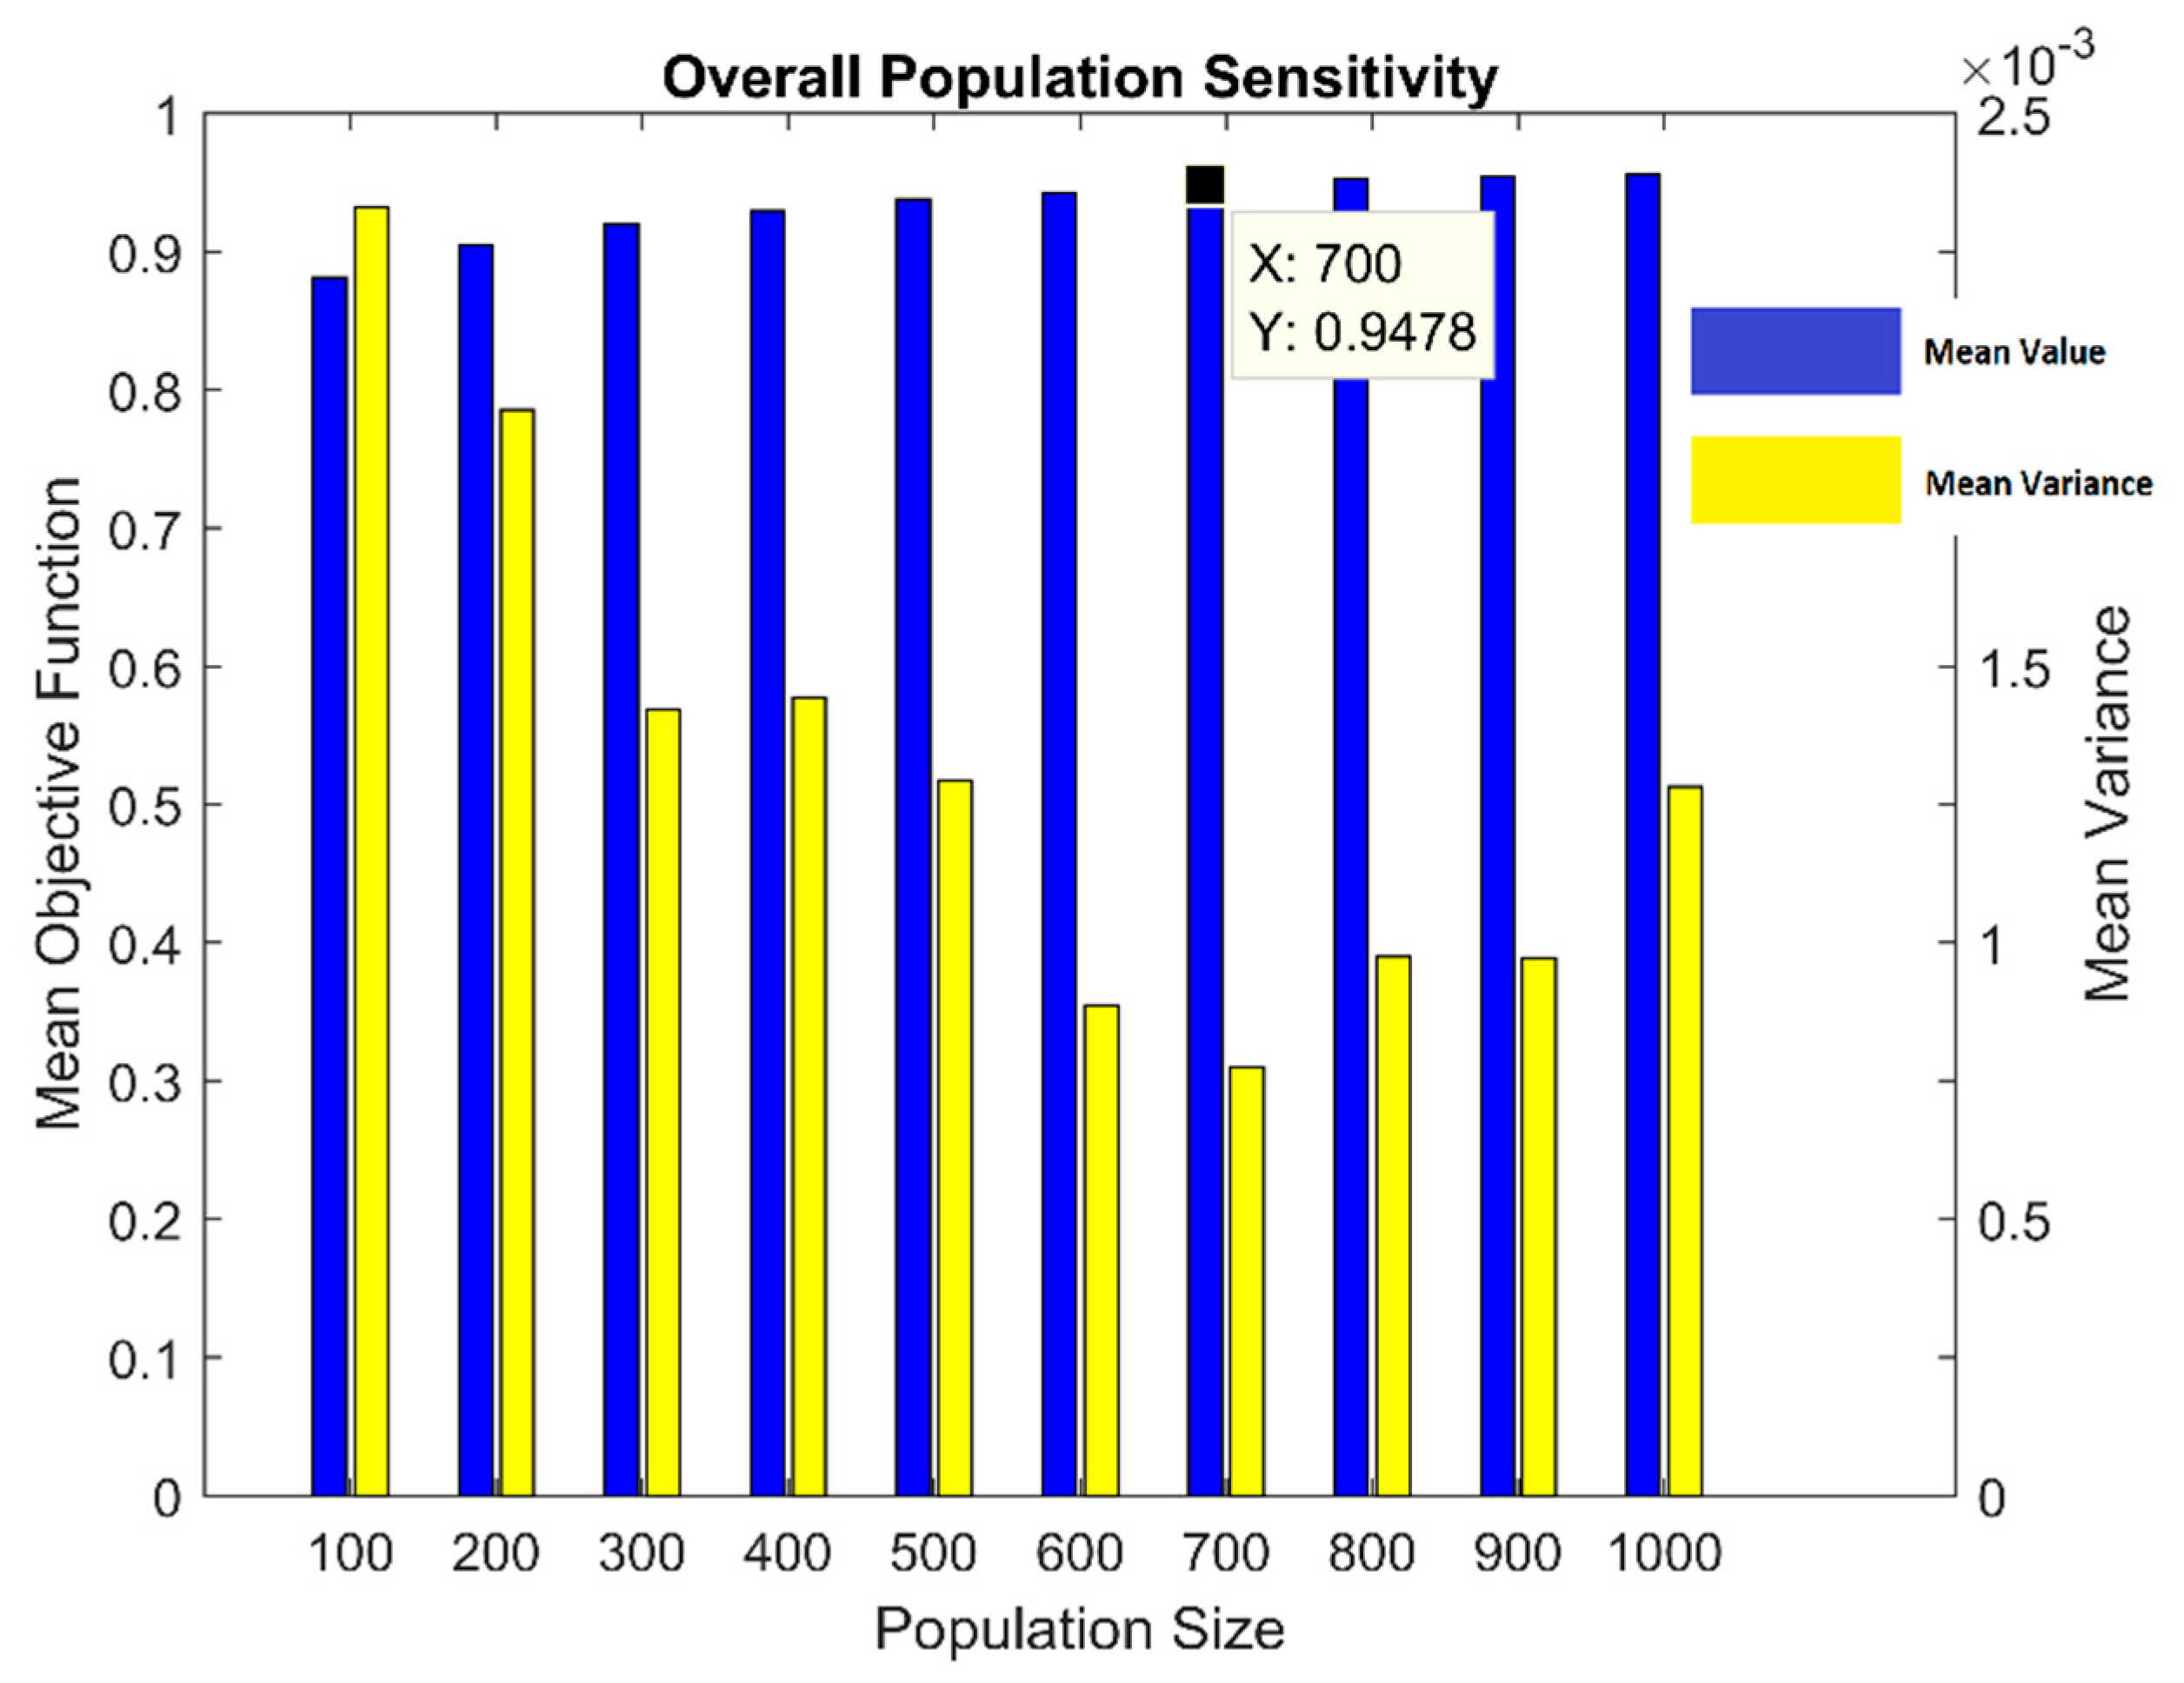
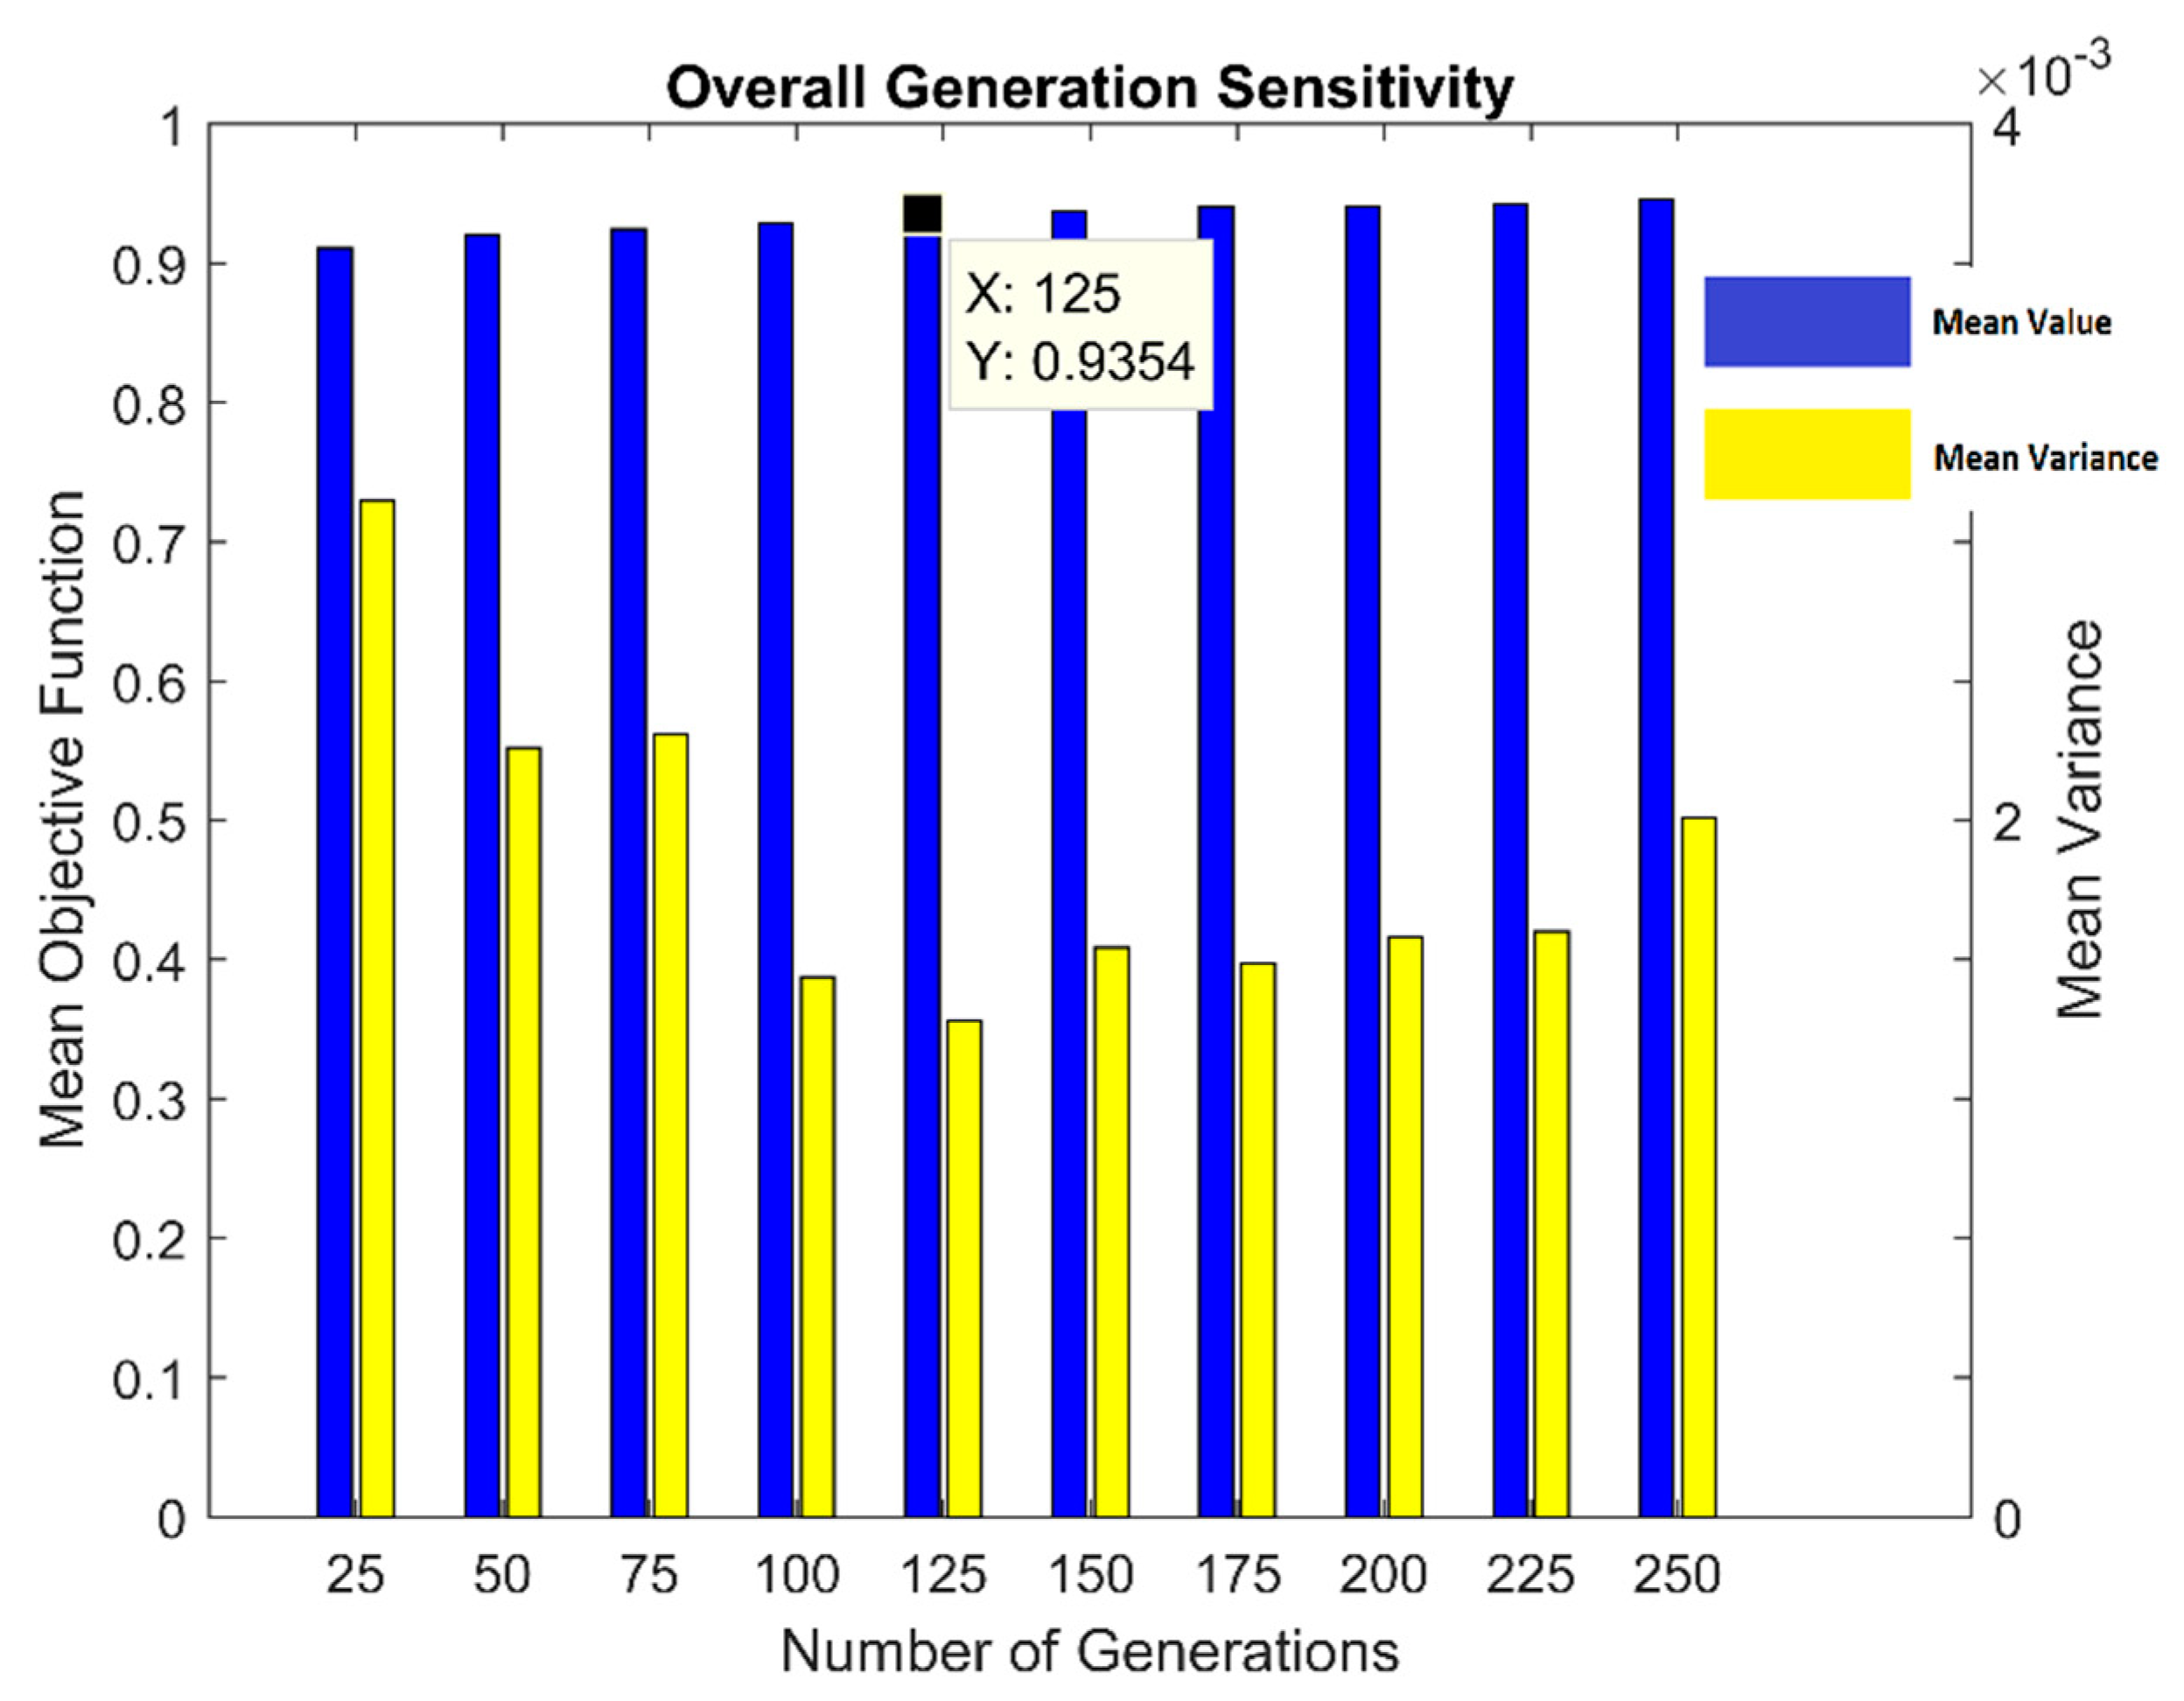
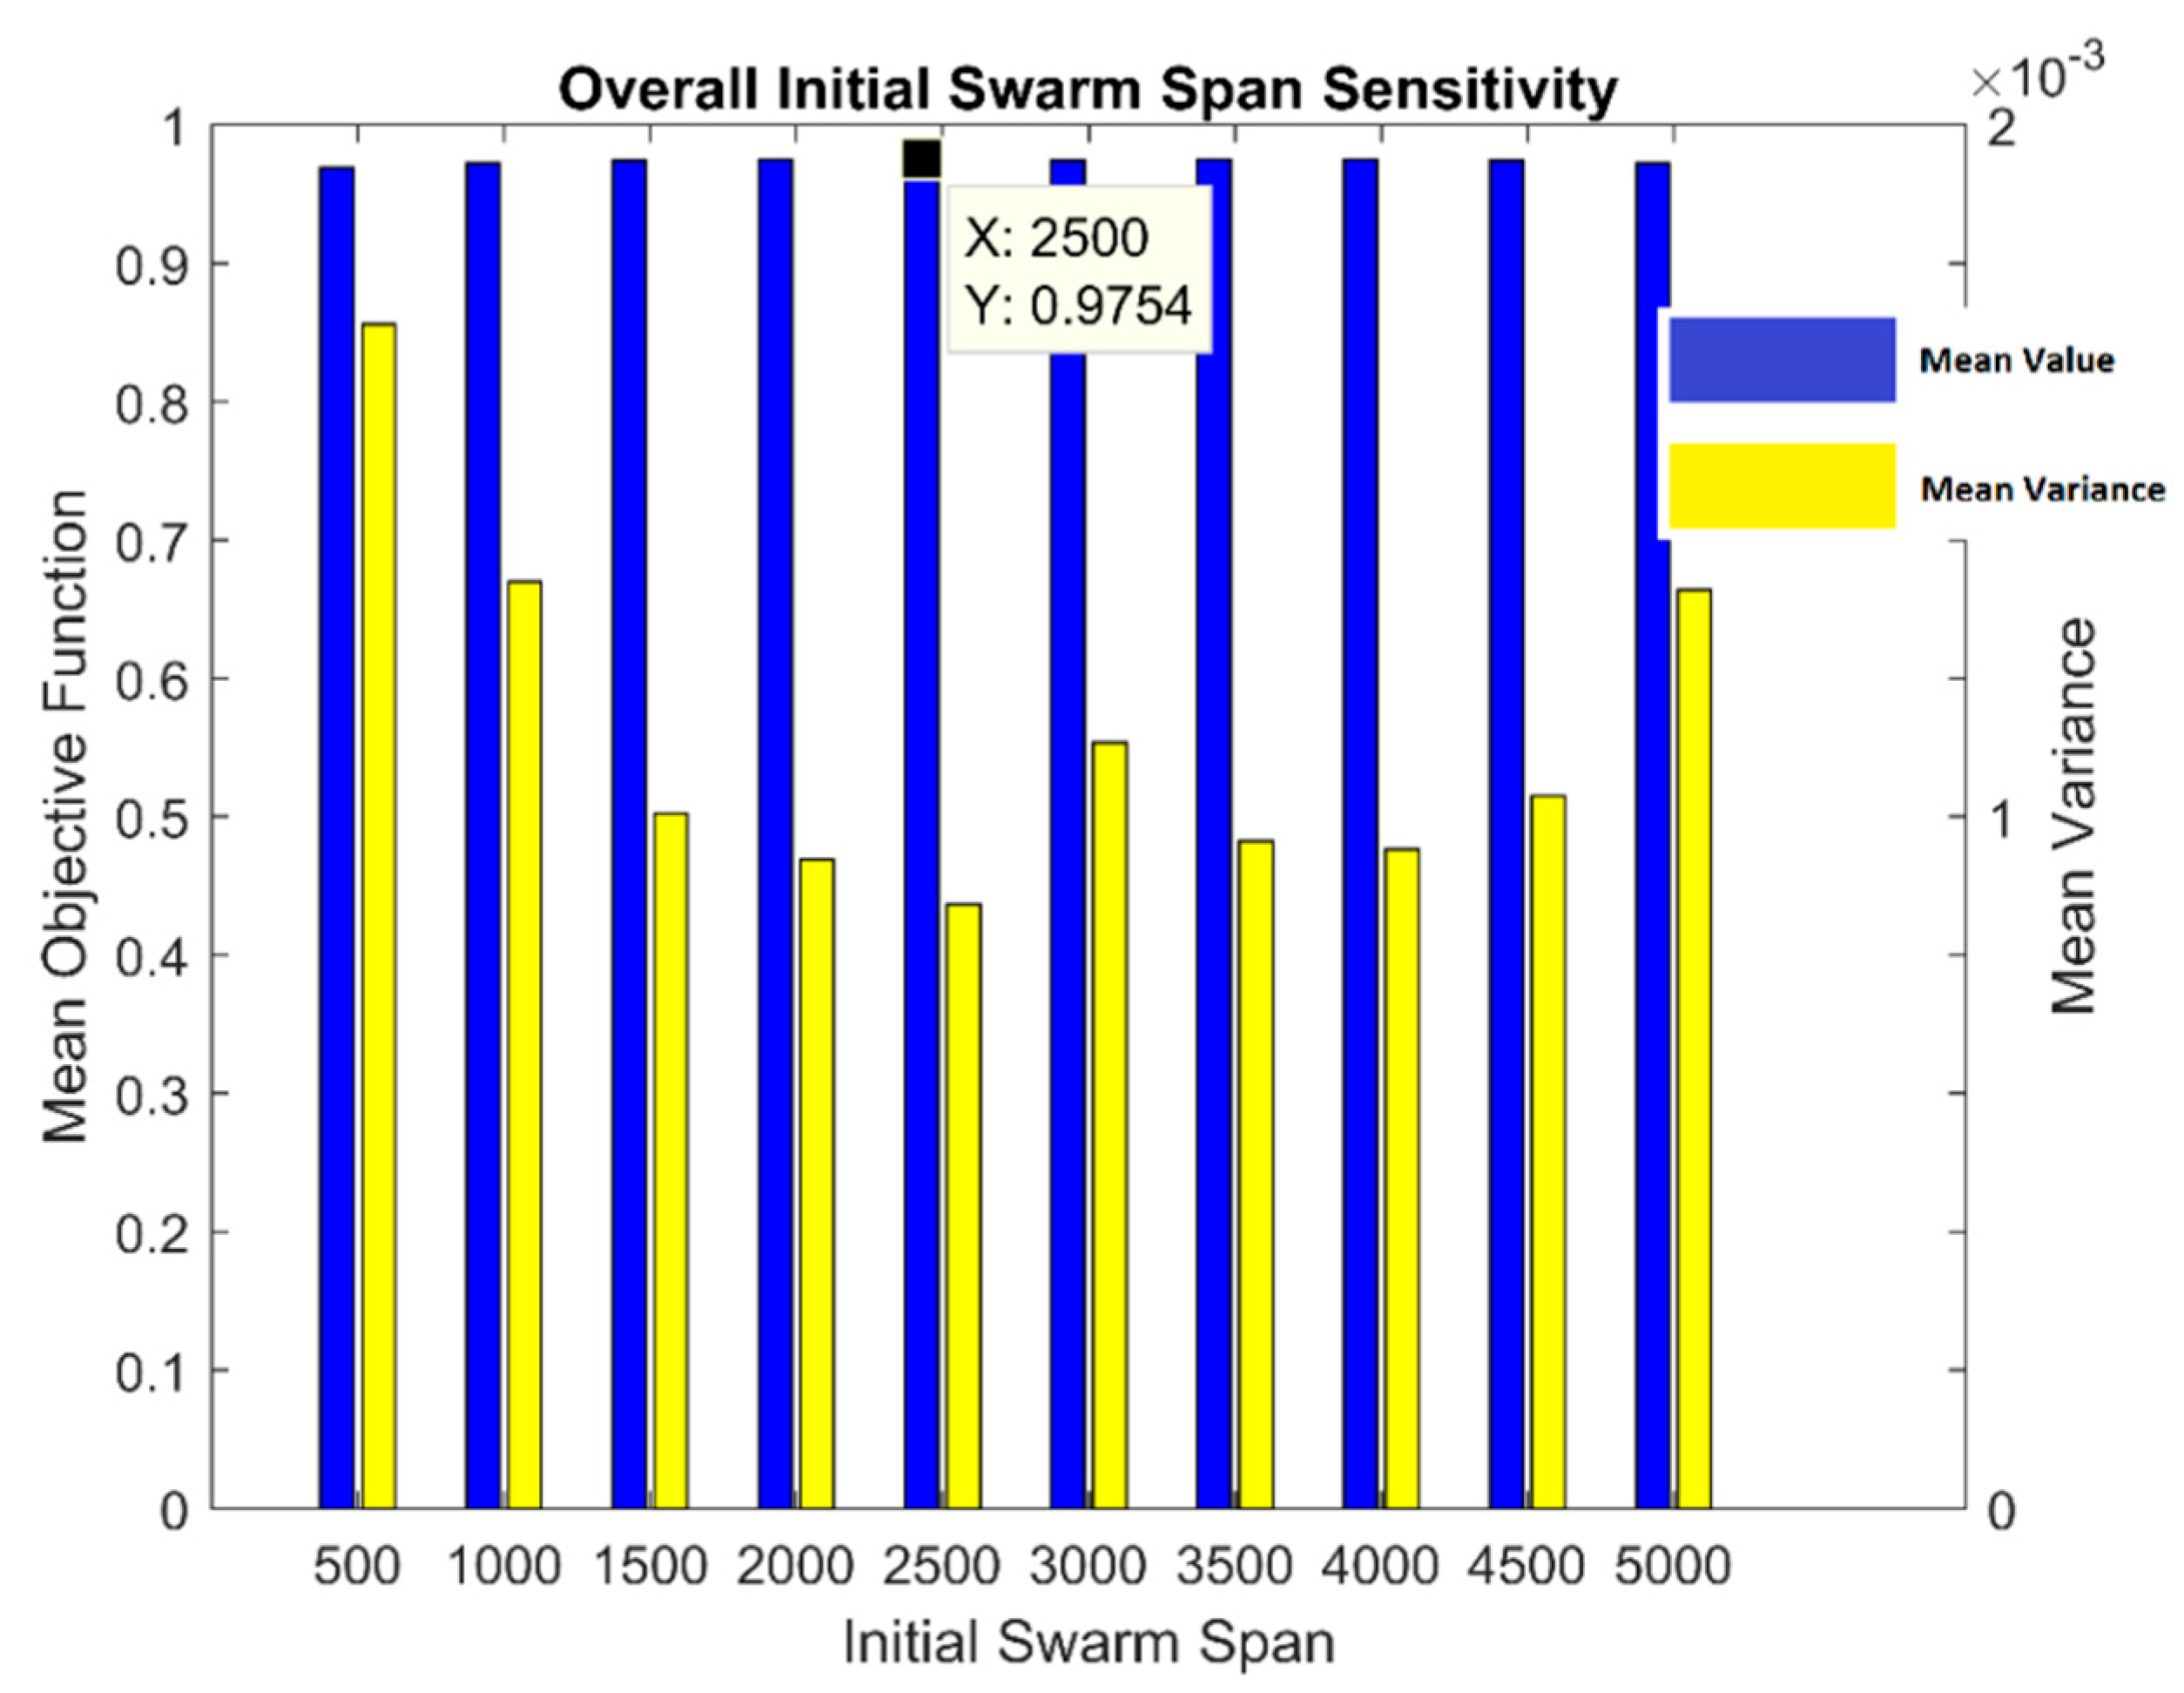
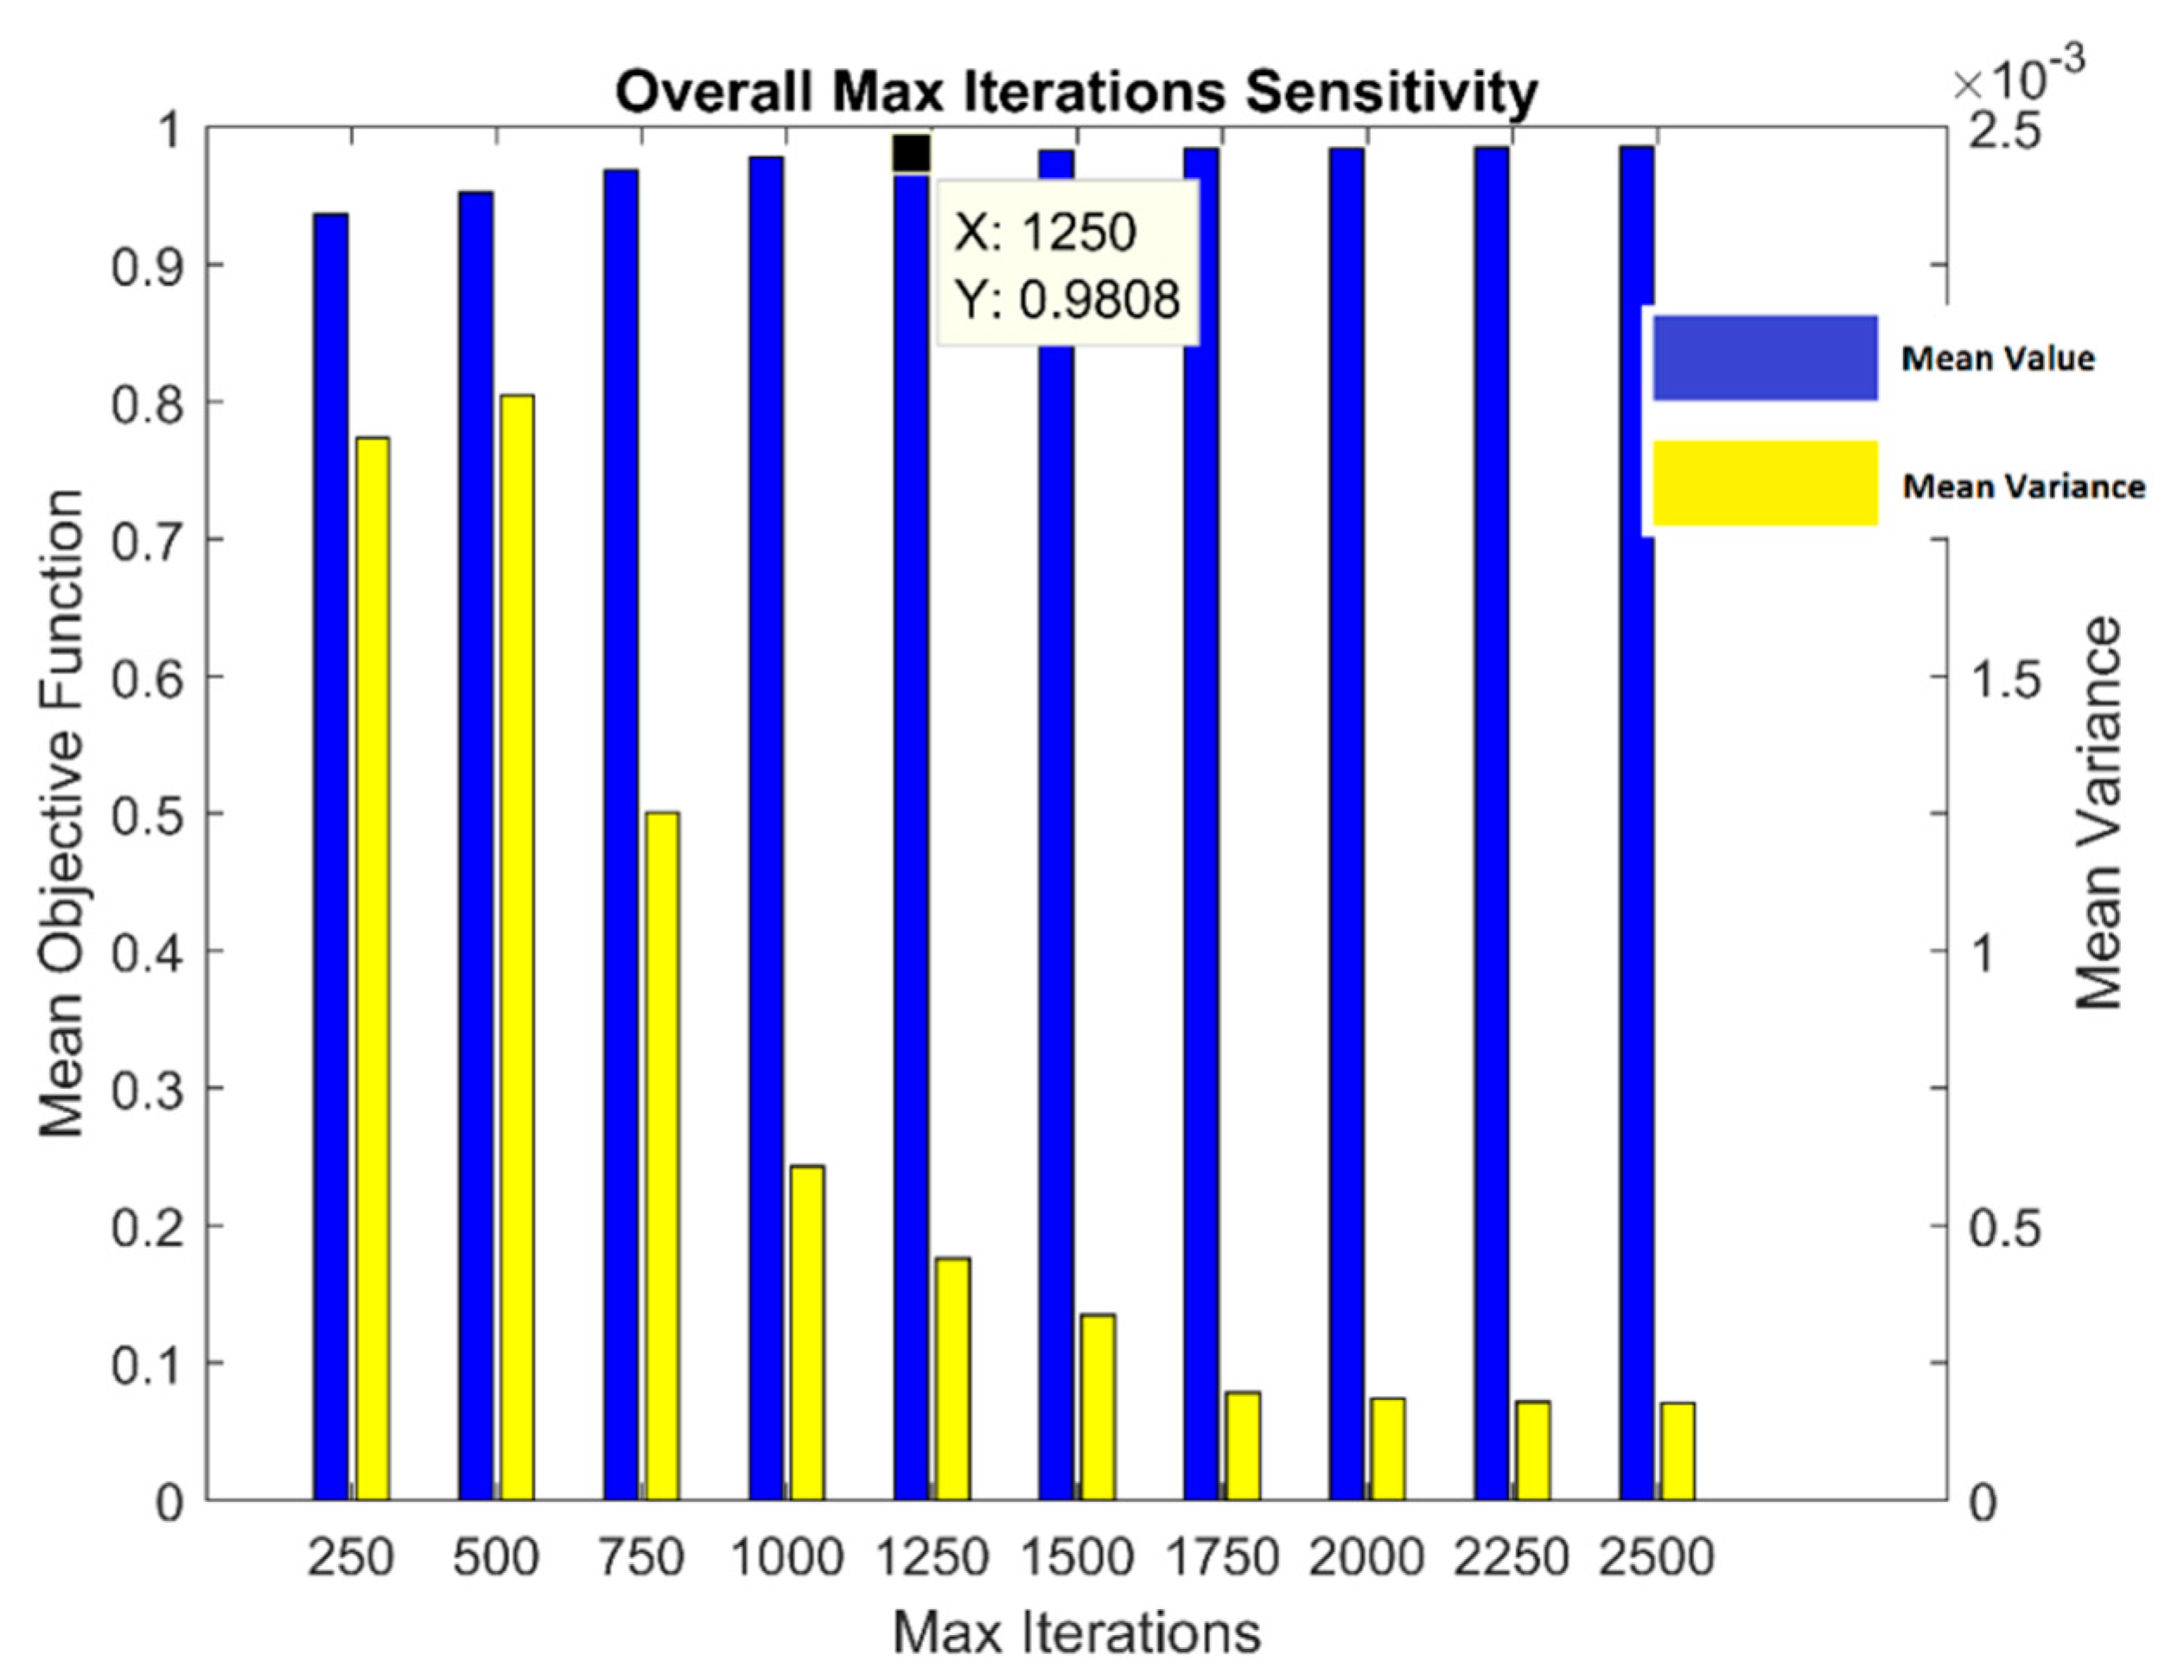
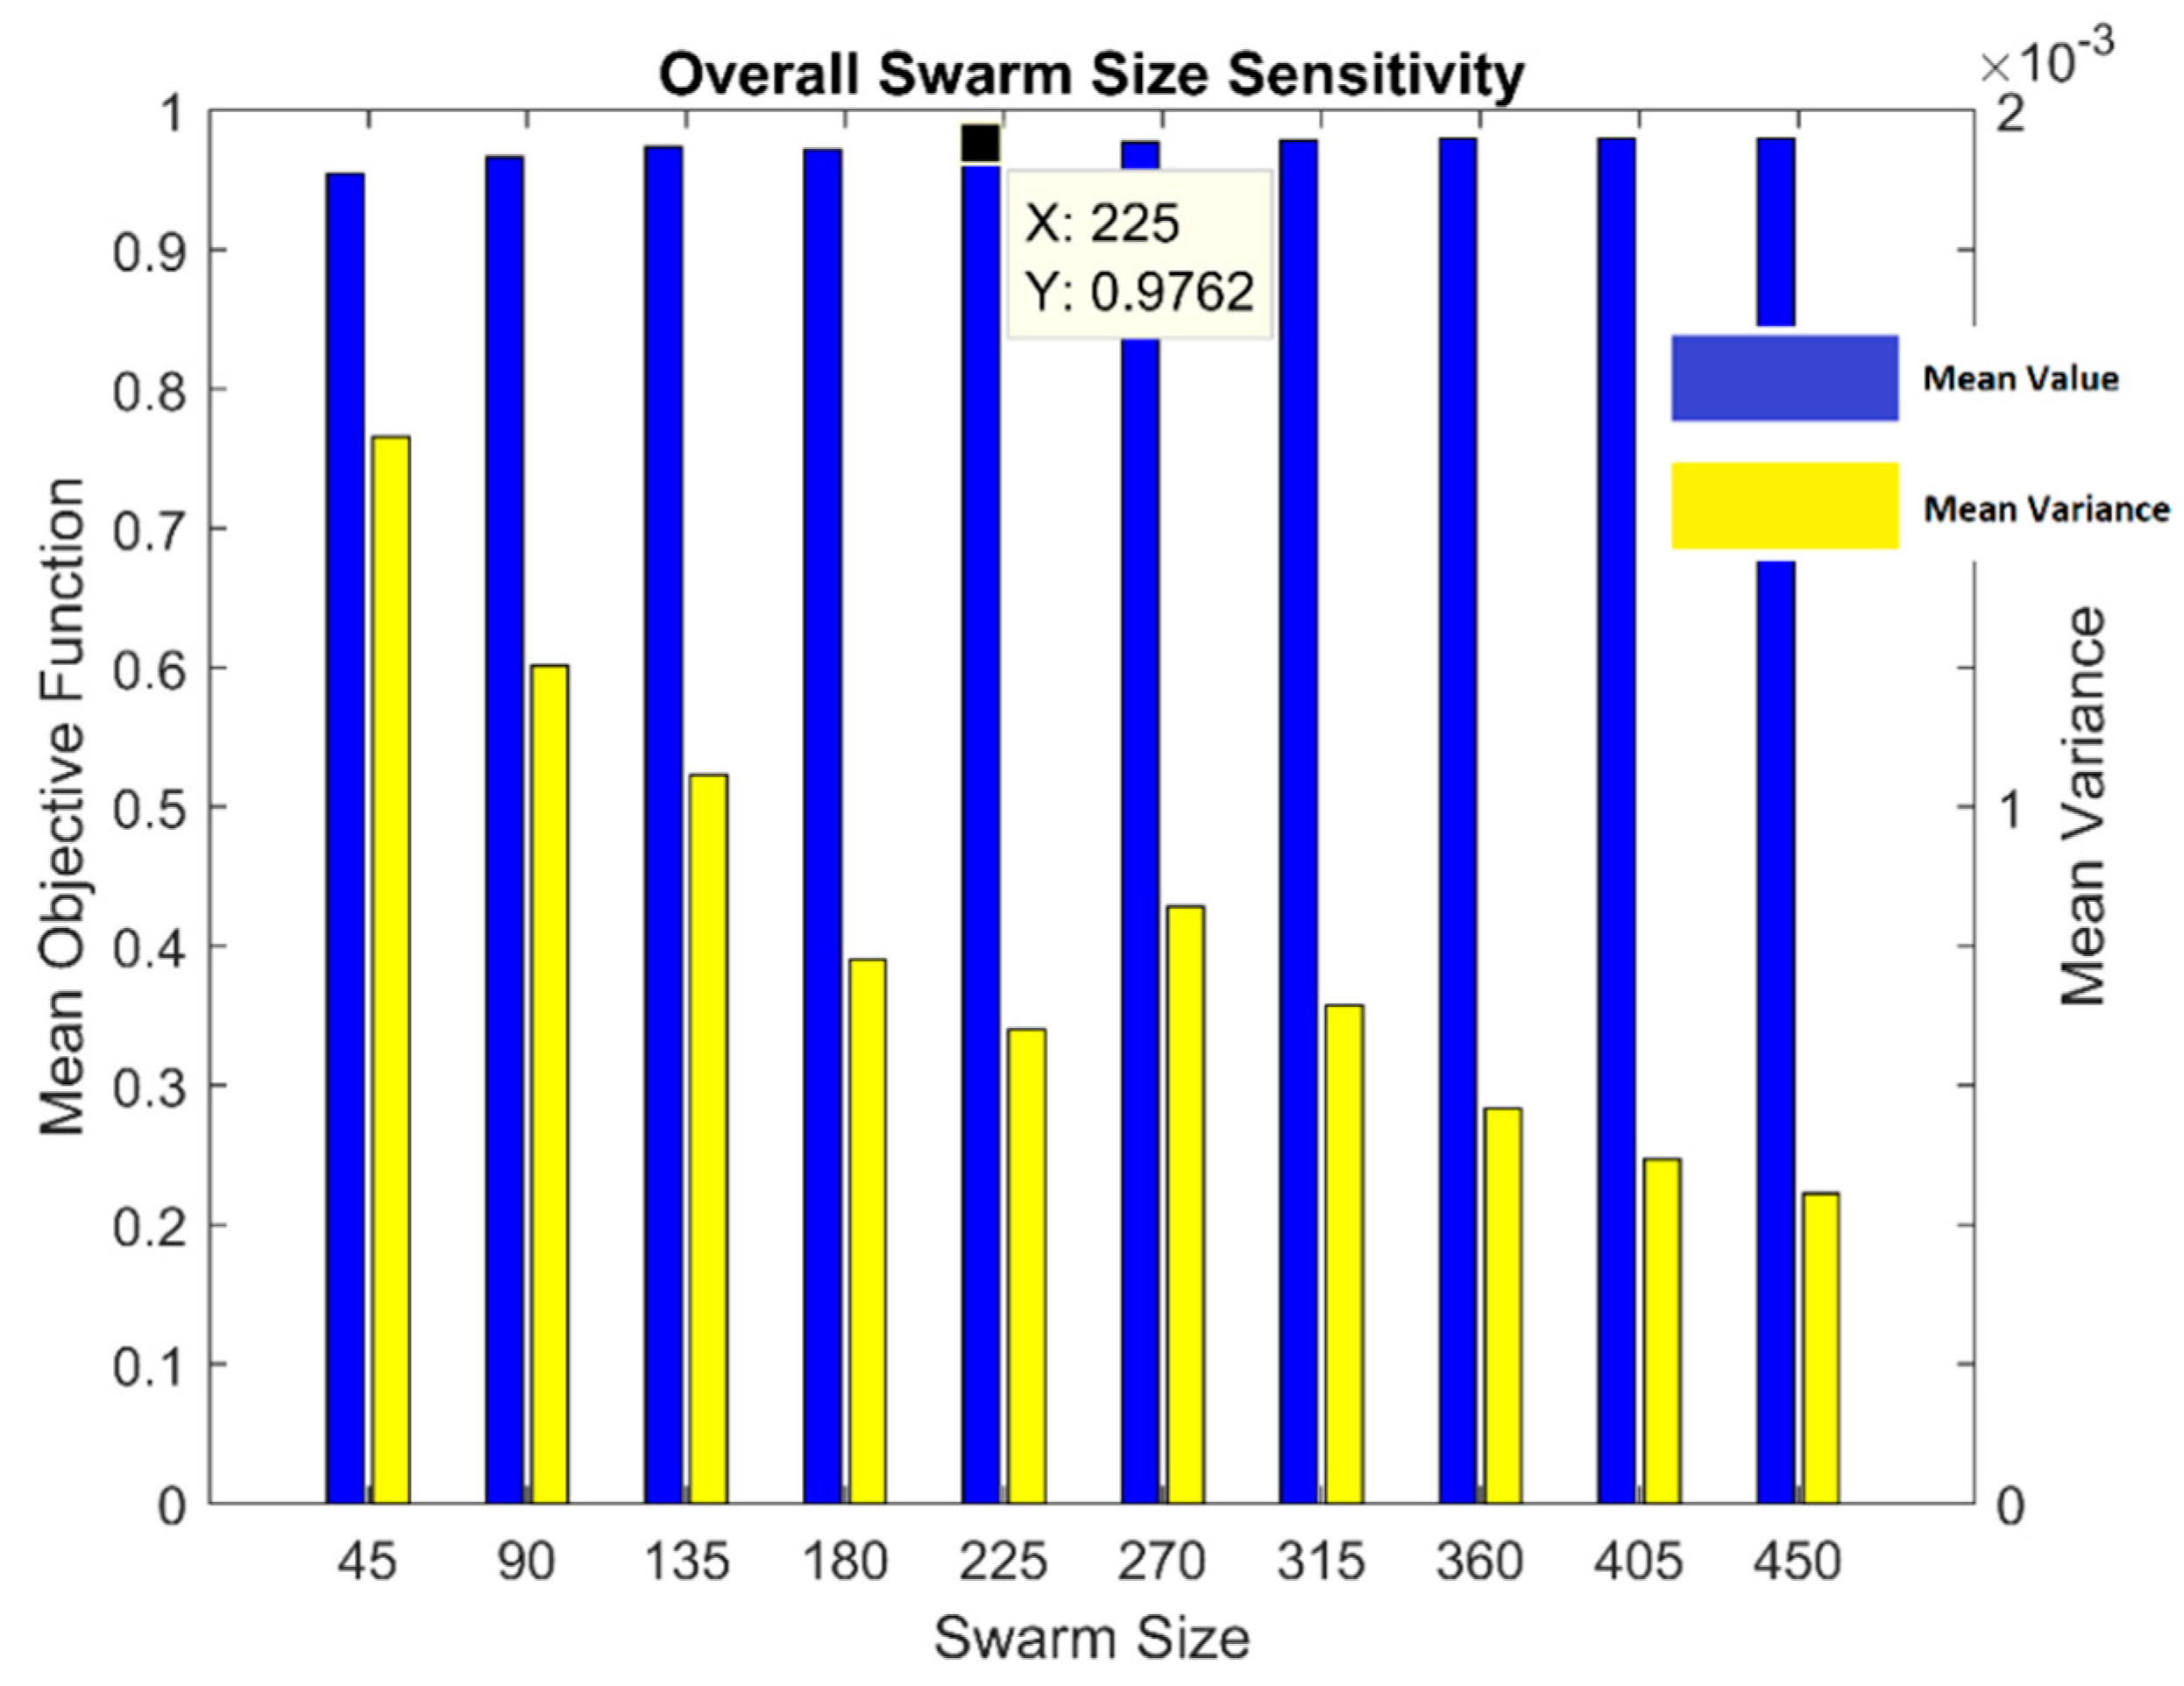