Article

Life Cycle Performance of Various Energy Sources Used in the Czech Republic

by
Markéta Šerešová
1,
Jiří Štefanica
2,
Monika Vitvarová
1,
Kristina Zakuciová
1,2,
Petr Wolf
3 and
Vladimír Kočí
1,4,*
1
Department of Environmental Chemistry, University of Chemistry and Technology Prague, Technická 5, 160 00 Prague, Czech Republic
2
ÚJV Řež, a. s, Hlavní 130, Řež, 250 68 Husinec, Czech Republic
3
CTU UCEEB, Třinecká 1024, 273 43 Buštěhrad, Czech Republic
4
Faculty of Architecture, Czech Technical University, 166 34 Prague, Czech Republic
*
Author to whom correspondence should be addressed.
Energies 2020, 13(21), 5833; https://doi.org/10.3390/en13215833
Submission received: 13 October 2020 / Revised: 30 October 2020 / Accepted: 6 November 2020 / Published: 8 November 2020
(This article belongs to the Section B: Energy and Environment)

Abstract

:
As both the human population and living standards grow, so does the worldwide electricity demand. However, the power sector is also one of the biggest environmental polluters. Therefore, options are currently being sought aimed at reducing environmental impacts, one of the potential tools for which concerns the use of life cycle assessment. This study, therefore, focuses on the most commonly used nonrenewable (black coal, lignite, natural gas and nuclear) and renewable sources (wind, hydro and photovoltaic) in the Czech Republic in terms of their construction, operation, and decommissioning periods. Environmental impacts are assessed via the use of selected impact categories by way of product environmental footprint methodology. The results highlight the potential environmental impacts associated with electricity generation for each of the primary energy sources. Black coal and lignite power plants were found to contribute most to the global warming, resource use, energy carriers and respiratory inorganics categories. On the other hand, the impact on water depletion and resource use, mineral and metals categories were found to be most significantly affected by the production of electricity from photovoltaic power plants. Finally, it is proposed that the results be employed to design scenarios for the future energy mix.

Graphical Abstract

1. Introduction

Electricity consumption is rising sharply in parallel with the increasing standard of living of the world’s population. Electricity consumption has increased by almost half over the last 20 years. According to data from the International Energy Agency, an average of 3.2 MWh per capita were consumed in 2017 [1]. At the same time, the power sector is one of the world’s largest polluters and is responsible for the production of around 33 Gt of CO2 emissions per year. Furthermore, the energy mixtures of most countries in the world are based on the utilization of fossil fuel, directly coal [2], a form of production that exerts substantial environmental impacts via the production of up to 30% of all global CO2 emissions [1]. Indeed, it is CO2 emissions, and other significant environmental impacts such as water consumption, that have led to efforts to decentralize the production of energy and to enhance environmental security [3]. At the same time, the level of interest in the use of renewable electricity sources (RES) has increased substantially. The advantages of RES include their low-emission operation and the diversification and decentralization of electricity supply [4]. However, it is misguided to consider renewables as being completely emission-free.
In the last decades, substantial progress was achieved in the field of producing RES technologies, lowering the investment price and material sources and increasing operational efficiencies. A good example is the solar industry where technology progress enabled the production of thinner solar cell wafers with less waste. Diamond wire sawing is a new technology to cut the solar wafers where the abrasive is fixed to the wires. This technology yields reduced kerf loss, thus saving material and preserving resources for the future, reduces hazardous waste and requires fewer resources for postprocessing at the same time [5]. A detailed study about LCA of various renewable sources can be found in [6]. Sherwani et al. [7] published an LCA study comparing various types of photovoltaic (PV) modules and systems based on amorphous, mono-crystalline, poly-crystalline and other technologies.
The production of electricity from nonrenewable sources (NRES) causes significant environmental impacts primary during their operation phase. On the other hand, the RES impacts include construction and decommissioning phases, in particular, in the form of mining and the processing of minerals, and the end of their life cycle at which time the various construction materials are further processed or disposed of [4,8,9]. It is, therefore, appropriate to assess both RES and NRES from the perspective of the whole of their life cycles, i.e., from construction to decommissioning [9,10].
Life cycle assessment (LCA) provides an ideal analytical tool for the assessment of the environmental impacts associated with the whole of the power plants’ life cycles. The main advantage of the analysis is that it serves to evaluate all the material and energy flows that enter and exit the assessed system, including the waste produced and emissions. This comprehensive assessment prevents the shifting of issues from one phase of the life cycle to another or from one environmental problem to another [11].
Many studies have already addressed the assessment of the environmental impacts of energy sources [7,8,12,13,14,15,16,17]. In the European context, the environmental impacts associated RES and NRES have been assessed, for example, in Greece [4]. The analysis was focused particularly on impacts associated with atmospheric emissions (CO2, CH4, NOX, SO2, particulate matter-PM10, CO, HCl) and other waste that is produced during the power supply life cycle.
A further study from Greece presented both the environmental impacts of current electricity generation and those associated with future potential energy mixtures for 2020 and 2030 [13]. Moreover, the report was conducted on the assessment of the environmental impacts of the Polish energy mix. It corresponds with the Czech Republic, where the power sector is mainly built on fossil fuels [18]. A further LCA study addressed scenarios concerning the future development of the energy mix in Spain [19] and transmission and distribution systems, and the resulting energy losses were discussed in a number of other studies [12,13,20]. In addition, outside Europe, studies have been conducted in, for example, Mexico [15], Canada [16] and China [21].
Based on the above-mentioned studies, it is reasonable to conclude that the suitability of the use of such sources, together with their potential environmental impacts, must always be assessed in the context of their use under local conditions. For example, photovoltaic power plants in southern Europe evince different efficiencies in terms of converting solar energy into electricity than do those in northern Europe. Hence, the results of studies that assess the use of various technologies in certain locations may not always be transferable to other states or regions. Thus, this study focused on the assessment of the environmental impacts of various sources of electricity in the Czech Republic.

Overview of Czech Electricity Production and Consumption

Electricity consumption in the Czech Republic is constantly increasing and, in 2018, it reached a value of 73.9 TWh, 47% of which was generated by coal-fired power plants, which are significant sources of pollutant emissions, e.g., the greenhouse gases SO2, NOX and particulate matter (PM10). While greenhouse gas emissions in the Czech Republic decreased by more than one third in the period 1990 to 2016 in comparison with the European Union average, emissions in the Czech Republic remain high, i.e., 12.4 t CO2 eq. in the Czech Republic compared to 8.7 t CO2 eq. in the EU [22]. The increasing consumption of electricity has been accompanied by a corresponding increase in the potential environmental impacts [23]. After coal-fired power plants, the second electricity producers are nuclear power plants which produced 34% of all electricity in 2018 [24]. RES contributed 11% to the total produced electricity. The share of the various sources in the energy mix of the Czech Republic is continually changing and evolving (see Table 1). In 2009, the share of gross electricity produced from RES was around 6.8%. 2015 witnessed the largest RES share of gross electricity production, 13.2%, since which time the share of energy produced from RES has been declining [24].
A closer consideration of the various types of RES revealed the following year-on-year development. Due to high feed-in tariffs there has been a high increase of PV installed power in 2010 (from 465 MWp to 1959 MWp). In the following years the feed-in tarriff was lowered and new restrictions on connecting PV systems were introduced. Concerning wind power plants, the installed capacity has increased year-on-year together with the amount of electricity produced. In 2009, the installed capacity was 193 MWe, reaching 316 MWe in 2018. The gross amount of electricity produced from this source more than doubled in 2018 to 609 MWh. The installed capacity of hydroelectric power plants increased slightly year-on-year from 2.2 MWe in 2009 to 2.3 MWe in 2018. However, due to dry periods and reduced river flows, the electricity produced decreased by 33% in the monitored period to 1,628,830 MWh [24]. The debate on the future composition of the energy mix, and the appropriate share of various types of energy sources, has been underway in the Czech Republic for many years. Furthermore, several legislative measures and plans have been introduced, aimed at increasing the share of RES in the Czech energy mix. The topic is also linked to the Energy and Climate Plan of the Czech Republic, which envisages an increase in the share of renewable sources up to 22% of total energy consumption by 2030 [25].
To date, however, no study has been compiled in the Czech Republic that take into account operational data and comprehensively assesses the environmental impacts associated with the various sources employing the LCA method, thus presenting the current situation with respect to electricity generation in the Czech Republic. According to the latest available information, the only example of an LCA study that assessed the environmental impacts of RES in the Czech Republic consists of a paper [26] that assessed the various sources based on inventory data obtained from available LCA databases. However, such databases, e.g., Sphere [27] or ecoinvent [28], provide only general and rough estimates for a given country rather than data from specific power plants.
Hence, this study focused on the assessment of the environmental impacts of electricity generation sources. The study assessed a total of 22 power plants, i.e., six NRES and 16 RES. Table 2 presents evaluated energy sources in the study and its installed capacities.

2. Materials and Methods

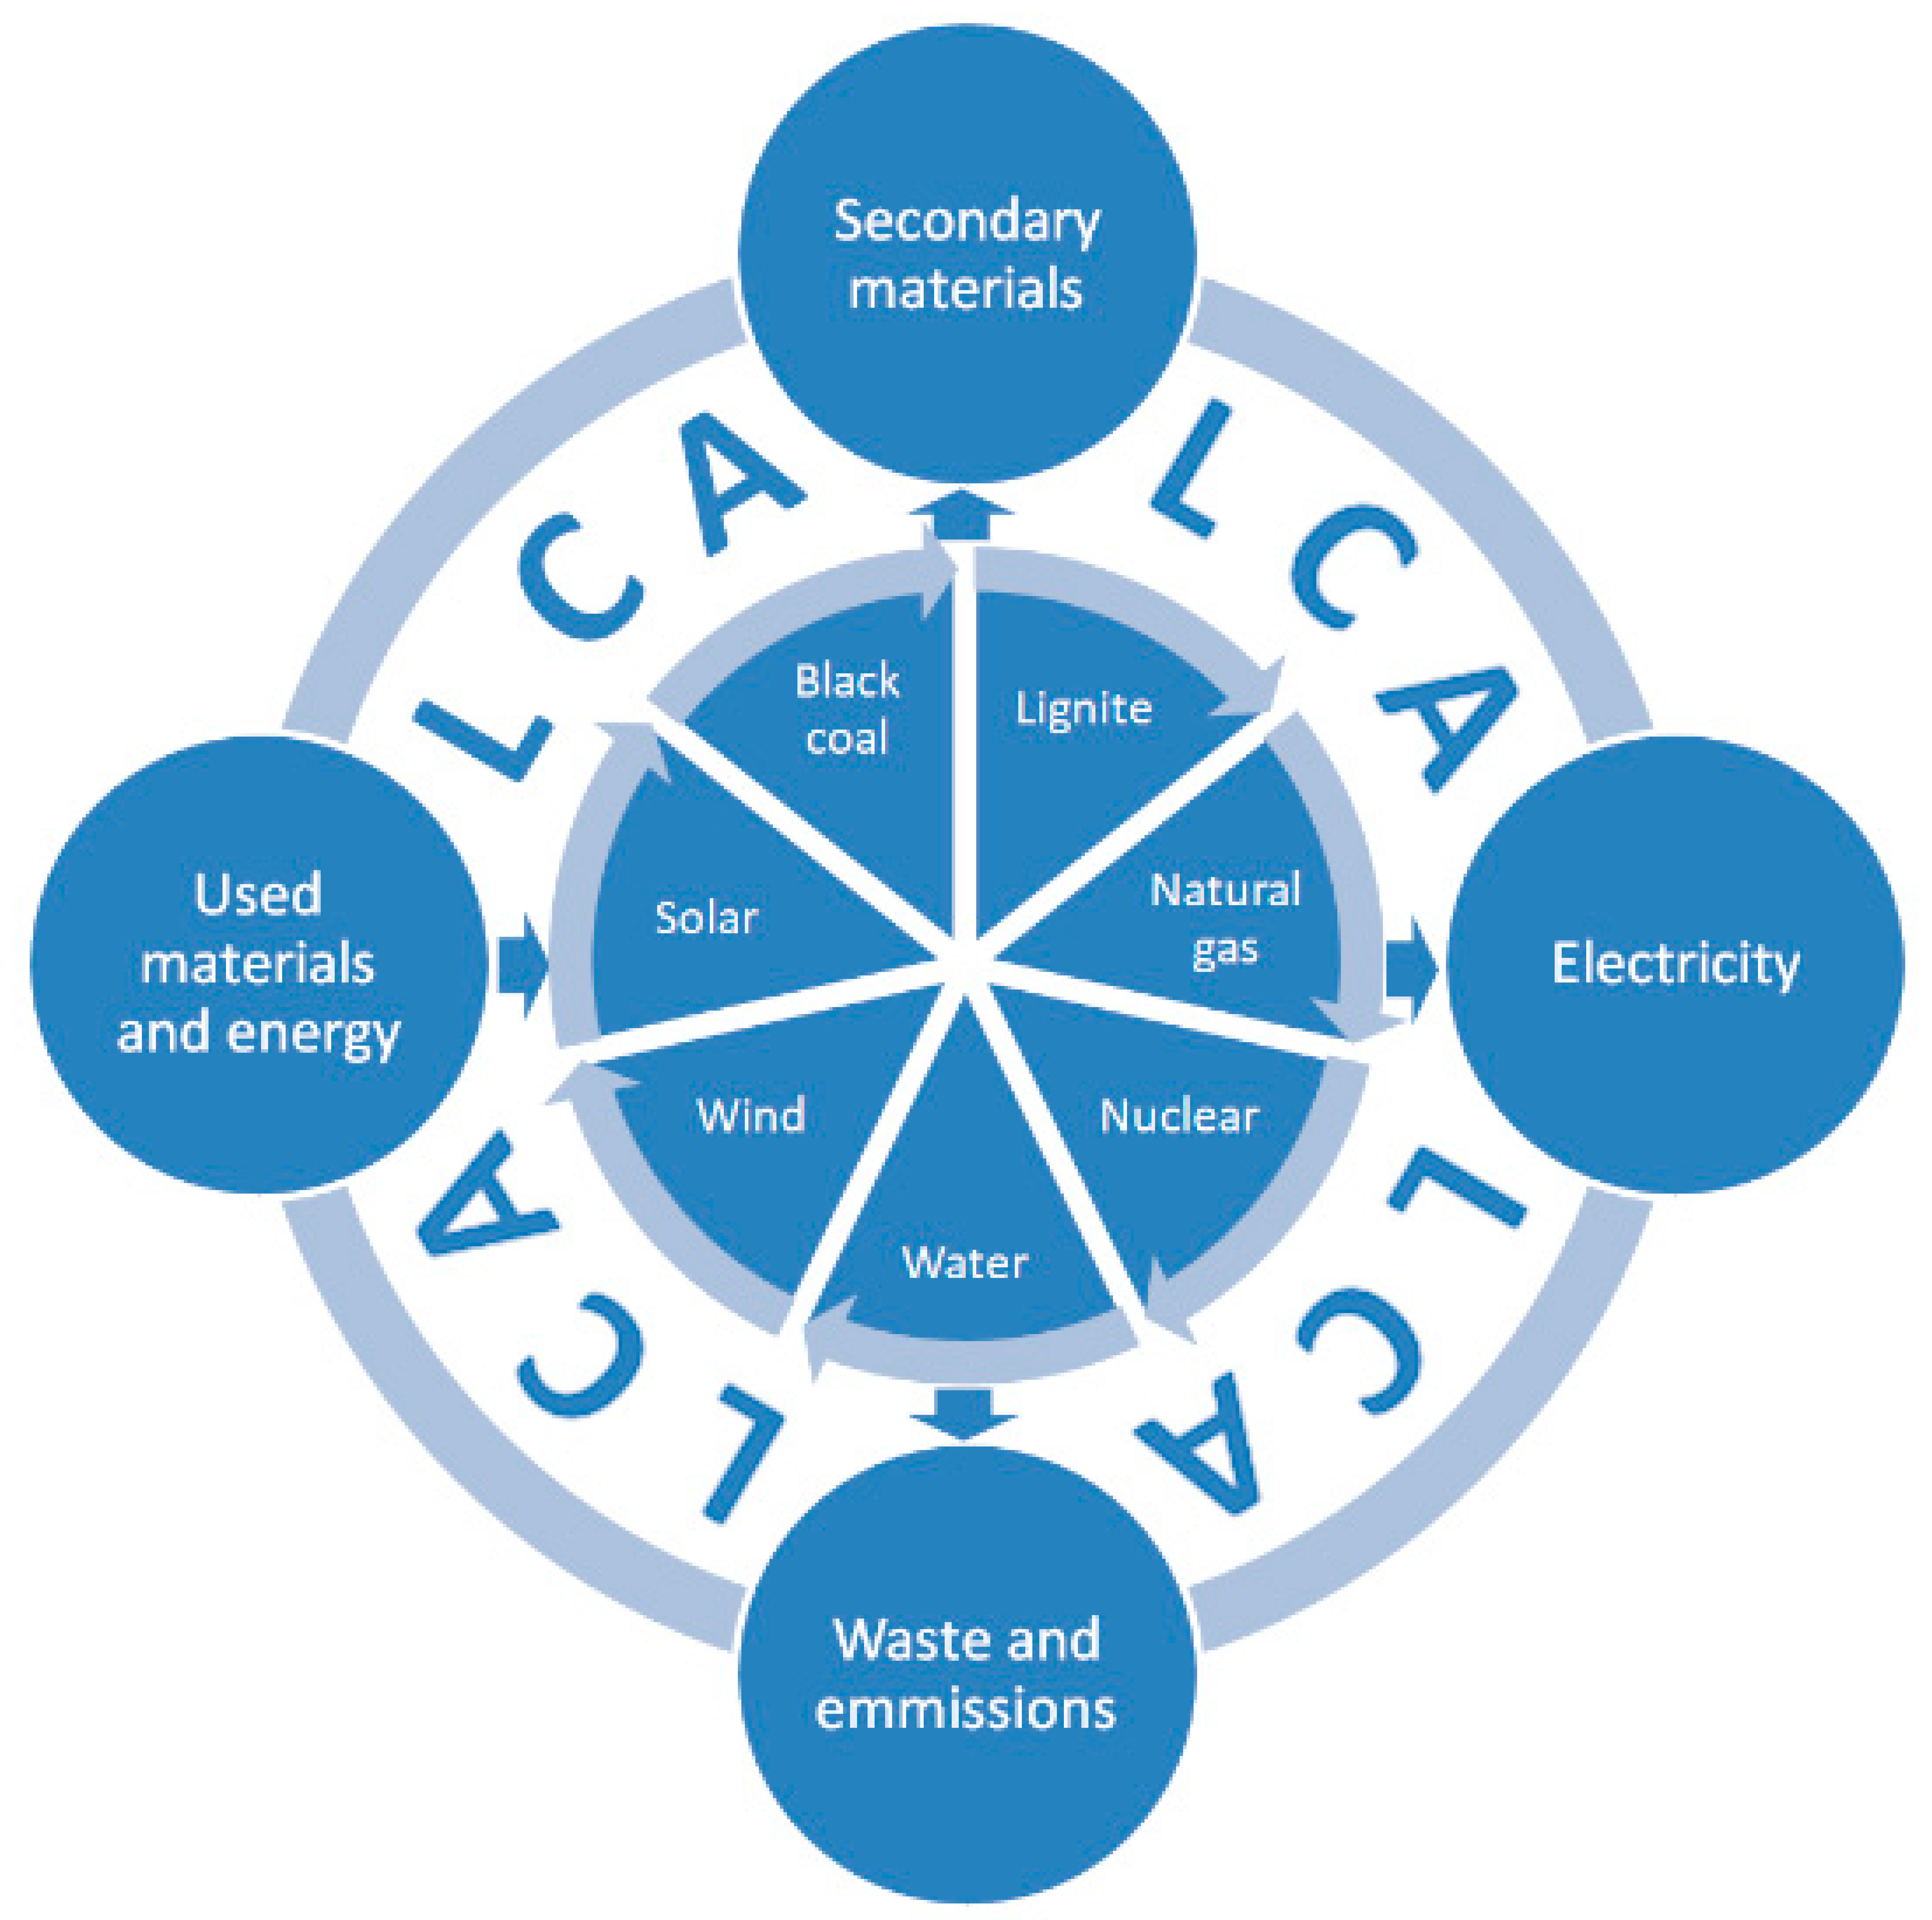
2.1. Objective and Scope of the Study

This study aimed to employ the LCA method to evaluate the potential environmental impacts of electricity sources in the Czech Republic using the PEF 2.0 methodology. The study assessed the construction, operation, maintenance and decommissioning of various sources. The functional unit was defined as the production of 1 kWh of electricity supplied to the grid after deducting the consumption component resulting from the production of the respective source. The aim was to include representatives of all categories of energy sources, i.e., nonrenewable and renewable, both centralized and decentralized. In the analysis, it covered 91% of electricity production categories (see Table 1). Only sources located in the Czech Republic that have licenses to supply electricity were taken into account. Table 1 presents the amounts of electricity produced by the various sources and the number of technologies assessed in this study.

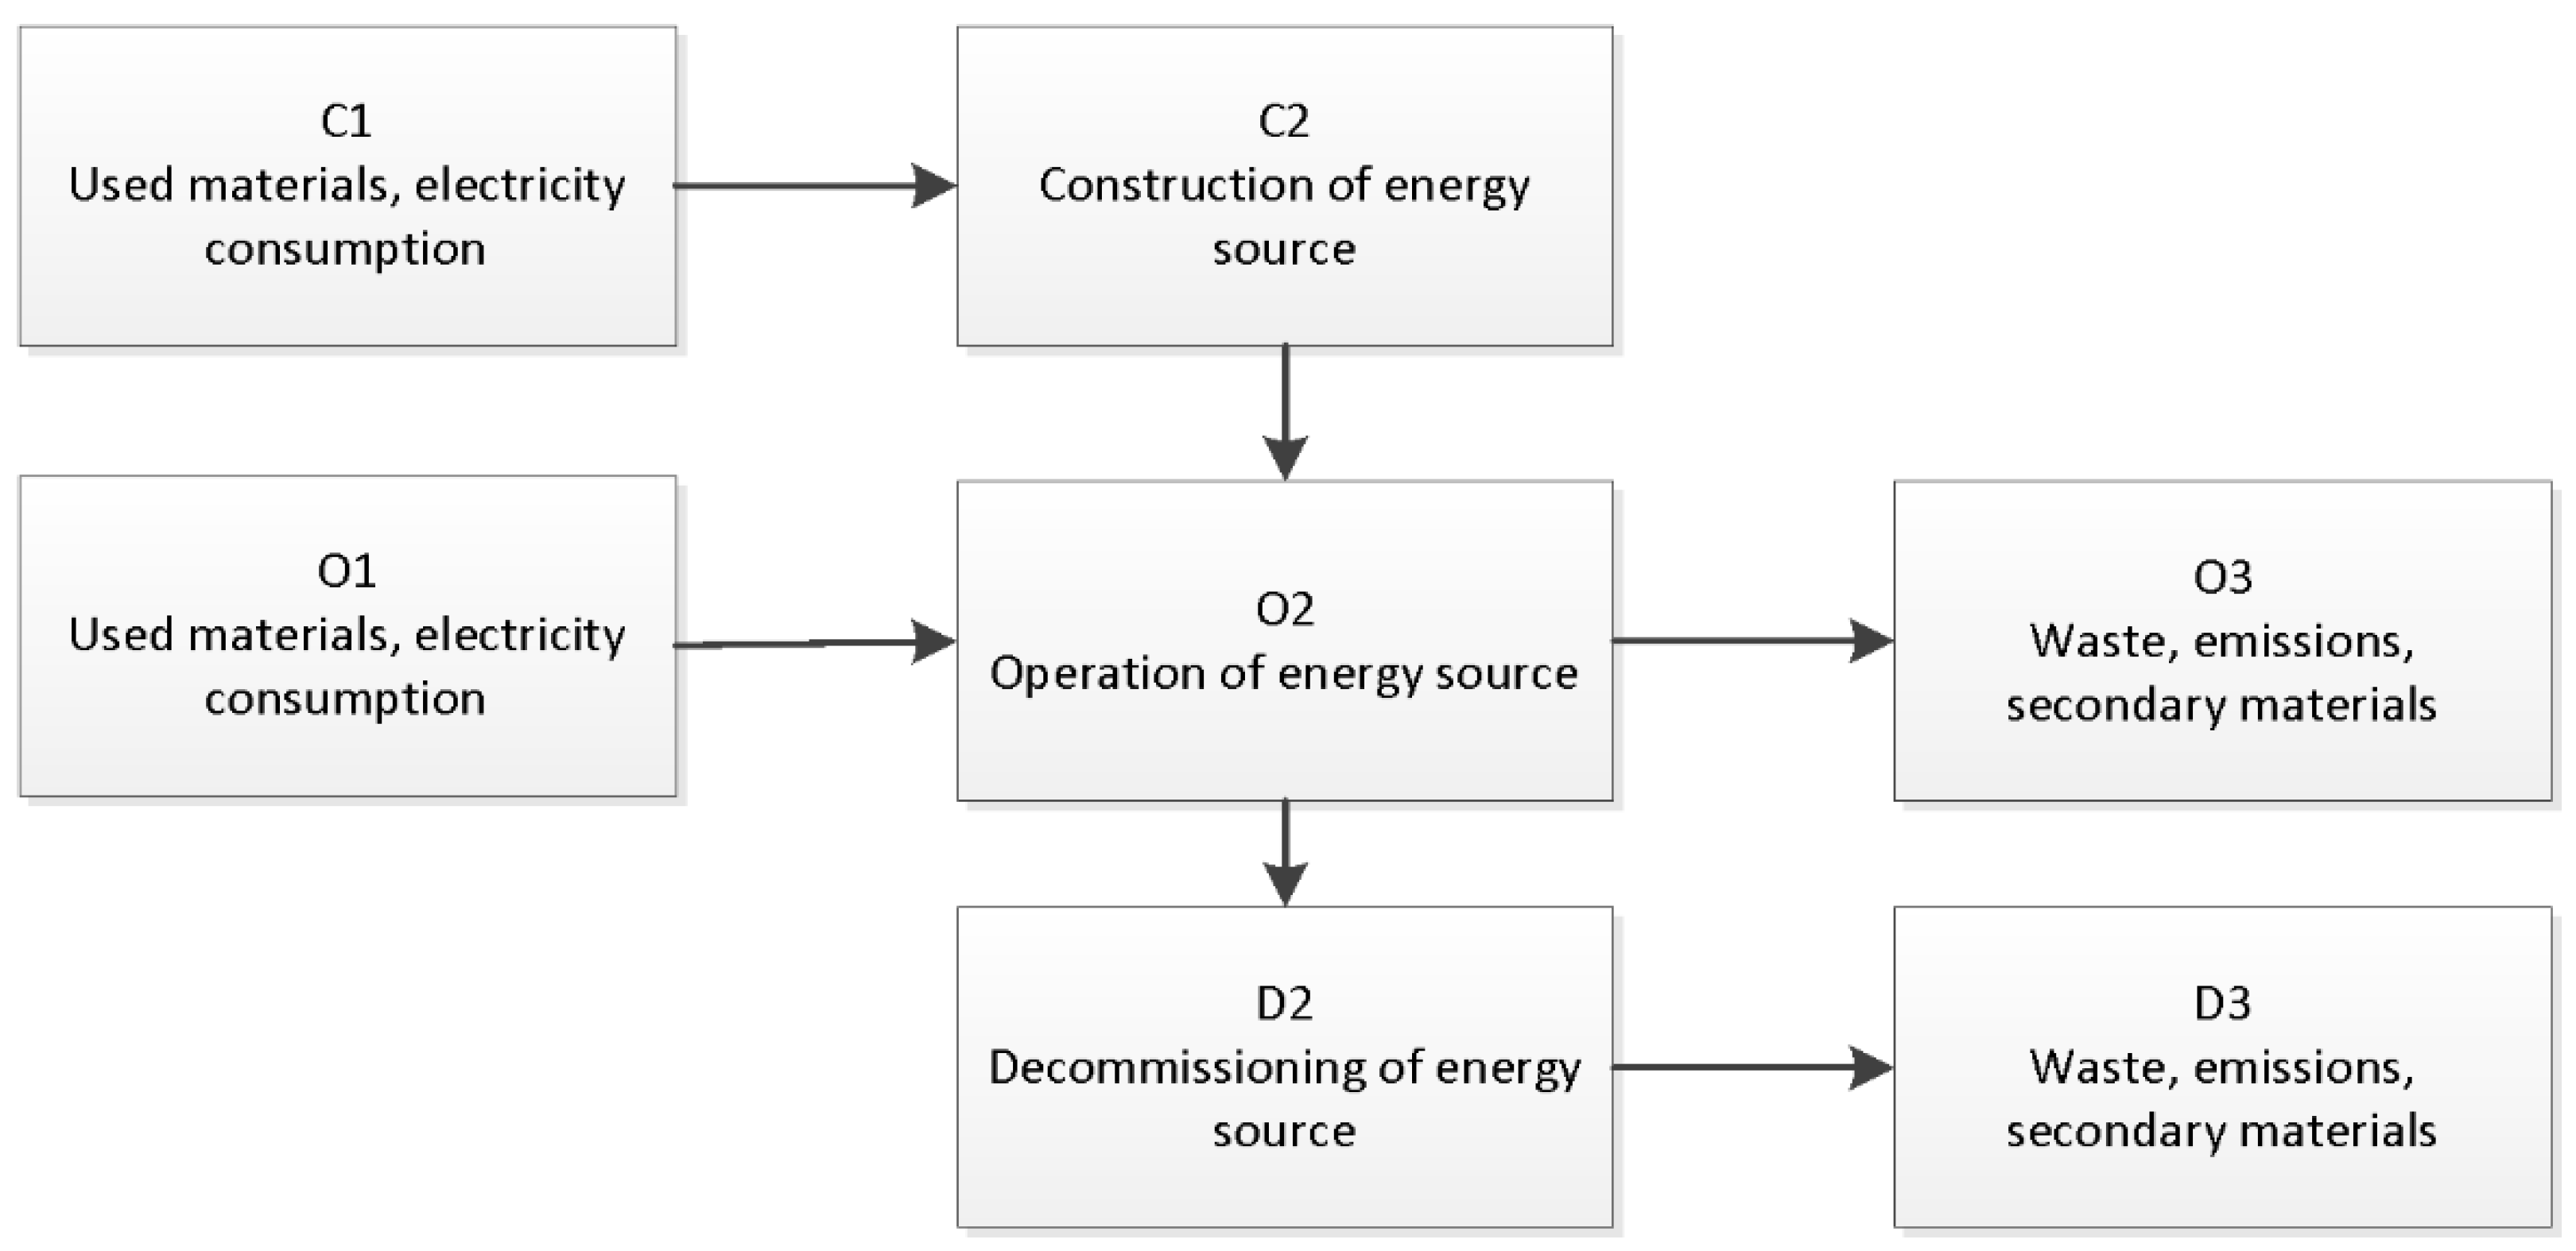
2.2. System Boundary Definition

Each product system consists of a different number of processes and flows. While other processes may be related to the life cycle of the assessed product, they are not considered relevant for the evaluation. So-called system boundaries serve to distinguish between essential and nonessential processes. The appropriate selection of the system boundaries is significant since they affect the results of the study [11].
The life cycles of the considered energy sources were divided into three phases, i.e., construction and life-time repair and maintenance facilities period (marked C), operation (marked O) and the decommissioning period (marked D) (Figure 1). Energy and material flows enter and exit each of the individual phases. The input may consist of either materials or the required electrical or thermal energy. At the same time, the output is most often emissions to environmental components, the waste produced or secondary raw materials.
The boundaries of the system with respect to the energy sources were shortened using module C3, i.e., by the waste generated and secondary raw materials during the construction phase, and via module D1, material and energy flows required during decommissioning, i.e., fuel and electricity. The boundaries of the system were adjusted in both cases for two reasons. The data for module C3 was obtained only for hydropower plants. Following the calculation of their environmental impacts, it was found that their contribution within the whole of the assessed system was negligible, i.e., in absolute values, it was equal to 0%. In the case of module D1, data were obtained only for coal/lignite and nuclear power plants. The results of the contribution of this module to the overall impacts indicated that this module also exerted insignificant environmental effects on the selected impact categories. Since the observed environmental impacts of modules C3 and D1 appeared to be marginal, they were eliminated from the system boundaries for the reasons mentioned above, i.e., to maintain consistency in terms of the assessment of all the energy sources.
The expected service life differed for each type of source. The various life-times applied in the study are presented in Table 3.

2.3. Life-Cycle Inventory

The second phase of the life cycle inventory (LCI) involves the collection of data on all the significant input material and energy flows and the emissions to all components of the environment or other waste streams associated with the electricity generation life cycle. Data collection comprises a key stage in the LCA study since the scope and detail of the input data may significantly affect the results of the study. Primary (foreground) data were obtained for the period 2015–2018 on the majority of the power plant operators for the purposes of this study. In cases where no input data were available, secondary data from the Sphera database [27] or ecoinvent [28] were employed, or the data were calculated based on expert estimates or literature sources.

2.3.1. Construction

Data concerning the construction of power plants and main technological components are challenging to obtain; indeed, these data are usually not available at all. In this study, primary data were obtained only for the water source power plant. In all the other cases, expert estimates were made on the basis of previous projects, literary references [30,31,32,33] and information provided by manufacturers and suppliers.

2.3.2. Operation

The operational data obtained were used to assess the technological and other processes surrounding this period. To achieve consistent results, all the mass and energy flows were covered for a minimum period of one year. The average value for the period 2015–2018 was then used to minimize the impact of exceptional events. If it was not possible to use the primary data, the input data values were calculated.

2.3.3. Decommissioning

Since the study served for the assessment of only operational sources in the Czech Republic, no primary data on the decommissioning and removal of energy sources were obtained. Hence, literary references [34,35,36] and expert estimates were used in the study concerning this component of the life cycle from previous assessments and studies.

2.4. Assumptions

When compiling LCA studies, it is necessary to accept certain simplifications and assumptions which may affect the final interpretation of the study. The critical assumptions applied in this study are as follows:
  • In the case of coal-fired and lignite power plants, the environmental impacts associated with by-products (fly ash, slag, gypsum) were not assessed in this study.
  • Due to the reduction in the average efficiency of PV panels, it was expected that a reduction of annual electricity production of 10% would occur after 10 years of operation and 20% after 20 years.
  • During the power plant decommissioning phase, their removal to so-called green meadows was considered. This rule, however, is not applied to hydroelectric power plants, concerning which it is assumed that only the technological parts of the power plant would be removed and the water components (reservoir, weir) would be preserved so as to maintain flow regulation. The recycling of individual technological units was considered.
    • o The life cycle of steel was considered to terminate as 98 wt.% material reuse and 2 wt.% landfill disposal [34].
    • o The end of the life cycle for other metals (aluminum, copper, silicon, lead, silver, etc.) was modelled as 100 wt.% material reuse [35].
  • The end of the life cycle of plastic and paper waste was modelled on the basis of data obtained from the Czech Statistical Office on municipal waste management [37], i.e., as 59 wt.% landfill disposal, as 18 wt.% energy and as 29 wt.% material recovery.
  • All so-called environmental credits arising from the material or energy reuse of waste were presented in the study as environmental benefits.
  • The following transport distances were used for modelling purposes; they represent upwardly rounded values based on real conditions in the Czech Republic:
    • o Concrete and gravel used for construction: 100 km
    • o Waste materials for landfill or energy recovery: 200 km
    • o Waste materials for material recovery: 1000 km
    • Renewable energy sources
    • o Materials used for construction: 1000 km
    • Nonrenewable energy sources (including nuclear power)
    • o Materials used for construction: 500 km
    • o Radioactive waste to radioactive waste repositories: 300 km
  • With respect to practice in the Czech Republic, transportation by truck was chosen as the primary means of transport for construction and building materials (concrete, steel) and wastes. Rail transport was selected for the transit of fuels (coal, lignite, nuclear), other solid process materials (such as fly ash, limestone etc.) and waste including spent nuclear fuel and radioactive waste. Furthermore, for nuclear power plants, rail was also chosen as the means of transport of construction materials and building materials for both C and D life-time phases.
  • The life cycle of stainless steel was used to model the use of steel and iron. Since, in many cases, it was not possible to distinguish between different types of steel, the worst-case scenario was chosen. The production of stainless steel is more energy and material-intensive than carbon and alloy steels, and its production leads to more significant environmental impacts.

2.5. Life Cycle Impact Assessment

The product environmental footprint (PEF or EF) methodology developed at the Joint Research Centre of the European Commission was chosen to determine the environmental impacts of electricity production. This methodology is applied to assessing environmental impacts across various impact categories. Environmental impact assessment employing the EF 2.0 method is recommended by the European Commission for the assessment of the environmental footprint of products. Since electricity generation is a service that provides a particular product, the EF methodology is considered suitable for the environmental assessment thereof. The following impact categories were selected for the environmental impact assessment due to their importance for the region of the European Union, as indicated by the weighting factors of the EF 2.0 methodology.
Selected impact categories:
  • Climate change (kg (CO2 eq.) [38]
  • Resource use, fossils MJ [39]
  • Resource use, minerals and metals (kg Sb eq.) [39]
  • Water scarcity (m3 world eq.) [40]
  • Particulate matter (disease incidents) [40]

3. Life Cycle Impact Assessment of the Energy Sources Used in The Czech Republic
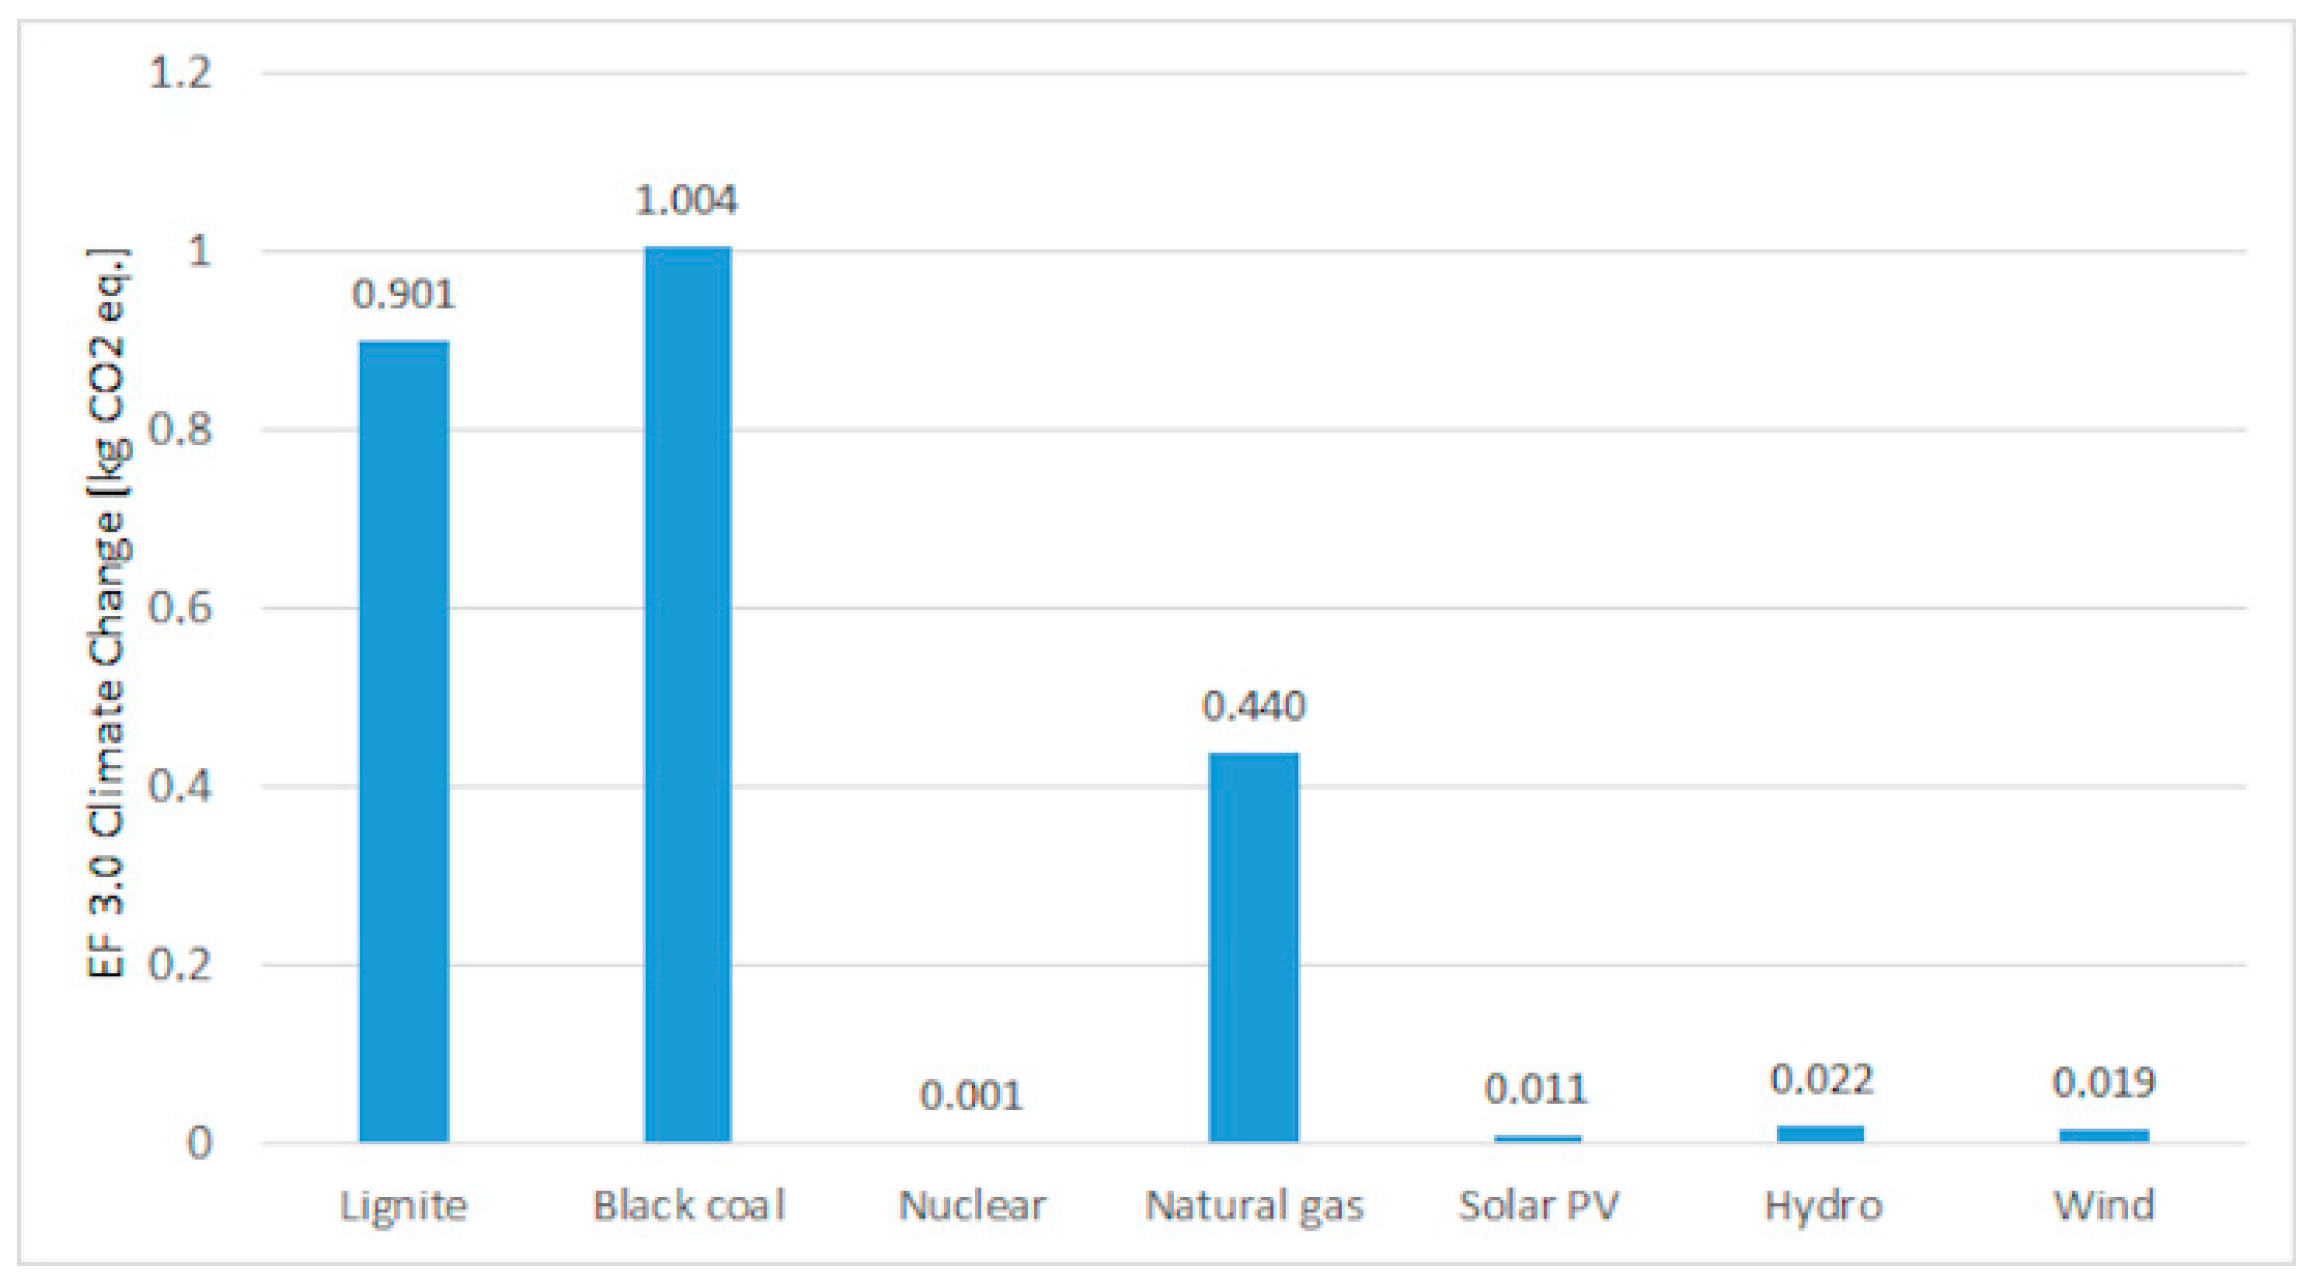
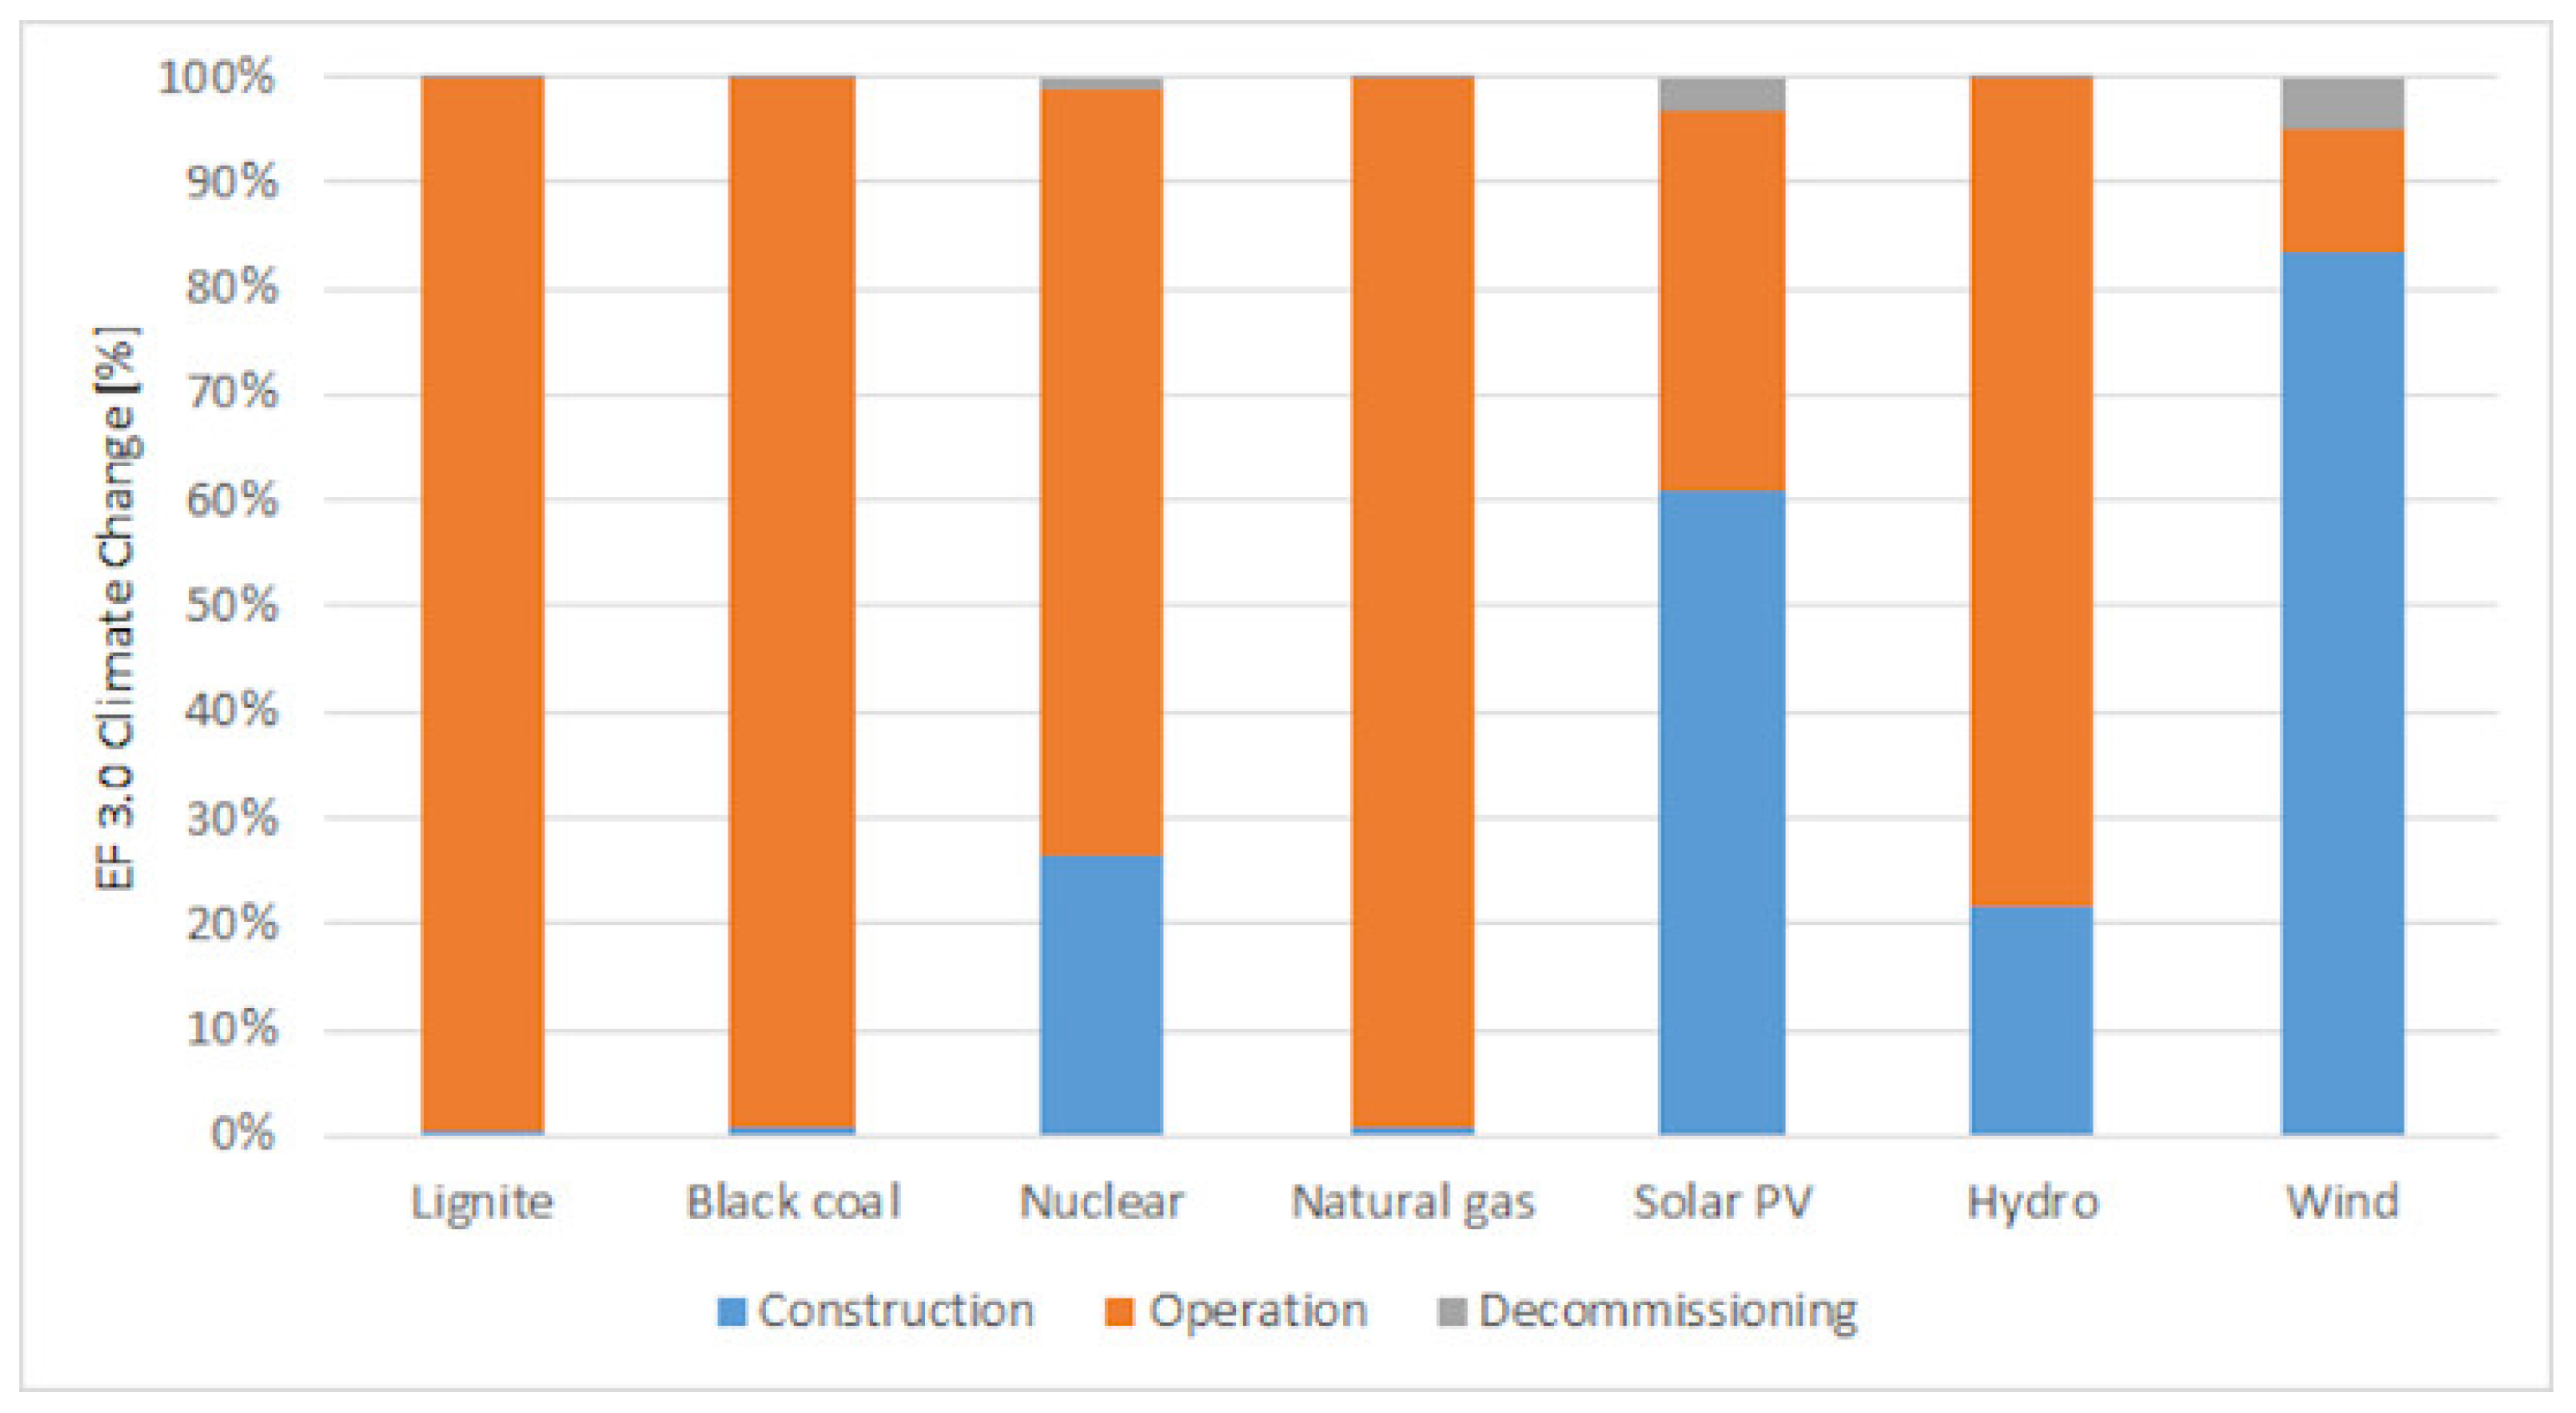
The following section presents the environmental impacts associated with the life cycles of individual energy sources and the production of 1 kWh. Following figures present the results from the characterization phase for individual impact categories. The results quantify the sum of the environmental impacts associated with the entire life cycle of each source, namely the construction, renovation, operation and decommissioning phases. The results for individual types of power plants are aggregated.

3.1. Climate Change

Figure 2 provides comparisons of energy sources in terms of their environmental impacts on the climate change category, expressed in terms of kg CO2 equivalent. The highest impacts are associated with the life cycle of coal-fired power plants, on average 953 g CO2/kWh. The results correspond to other studies, according to which global warming potention (GWP) values range between 750 g and 1372 g CO2/kWh [10,12,14,41]. The results thus indicate that coal sources exert approximately double the impact of natural gas sources. Renewable sources (photovoltaic, wind, hydro) and nuclear sources exert significantly lower impacts on the climate change category. The impacts of nuclear resources are the lowest of all sources with respect to this category, at 1.45 g CO2/kWh. Other studies have reported GWP values associated with the life cycle of nuclear power plants with very high dispersion, i.e., 2 g to 130 g CO2/kWh [10,41,42,43]. The variability of the results is due mainly to the consideration of different fuel enrichment technologies and methodological approaches [10]. The impacts of renewable energy sources with concern to this category are many times lower than those of nonrenewable sources, i.e., the life cycle of hydropower plants is 22 g CO2/kWh, wind power plants 19 g CO2/kWh and photovoltaic power plants 11 g CO2/kWh.
Most of the impacts of fossil fuels (black coal, lignite and natural gas) are related to the operational phase, specifically fuel combustion (Figure 3). In the case of hydropower, the construction phase of the power plant and, subsequently, the consumption of electricity from the grid for its own operation purposes during the operational period contribute most to the climate change category. Concerning small hydropower plants, the impact of the production of waste during the operation of the power plant is also relatively significant. It should be noted here that part of the waste production relates to waste removed from rivers. The relatively substantial variance in the environmental impacts of hydropower plants indicated by previous case studies was due to the differing conditions of individual facilities in terms of the slope and flow of the river. With respect to wind and photovoltaic power plants, the most significant period of the impacts on the climate change category is the construction phase, i.e., the production of construction materials. In contrast, for nuclear power plants, the main impact on this category relates to the fuel preparation process. In terms of the life cycle perspective, no electricity source has a zero carbon footprint.

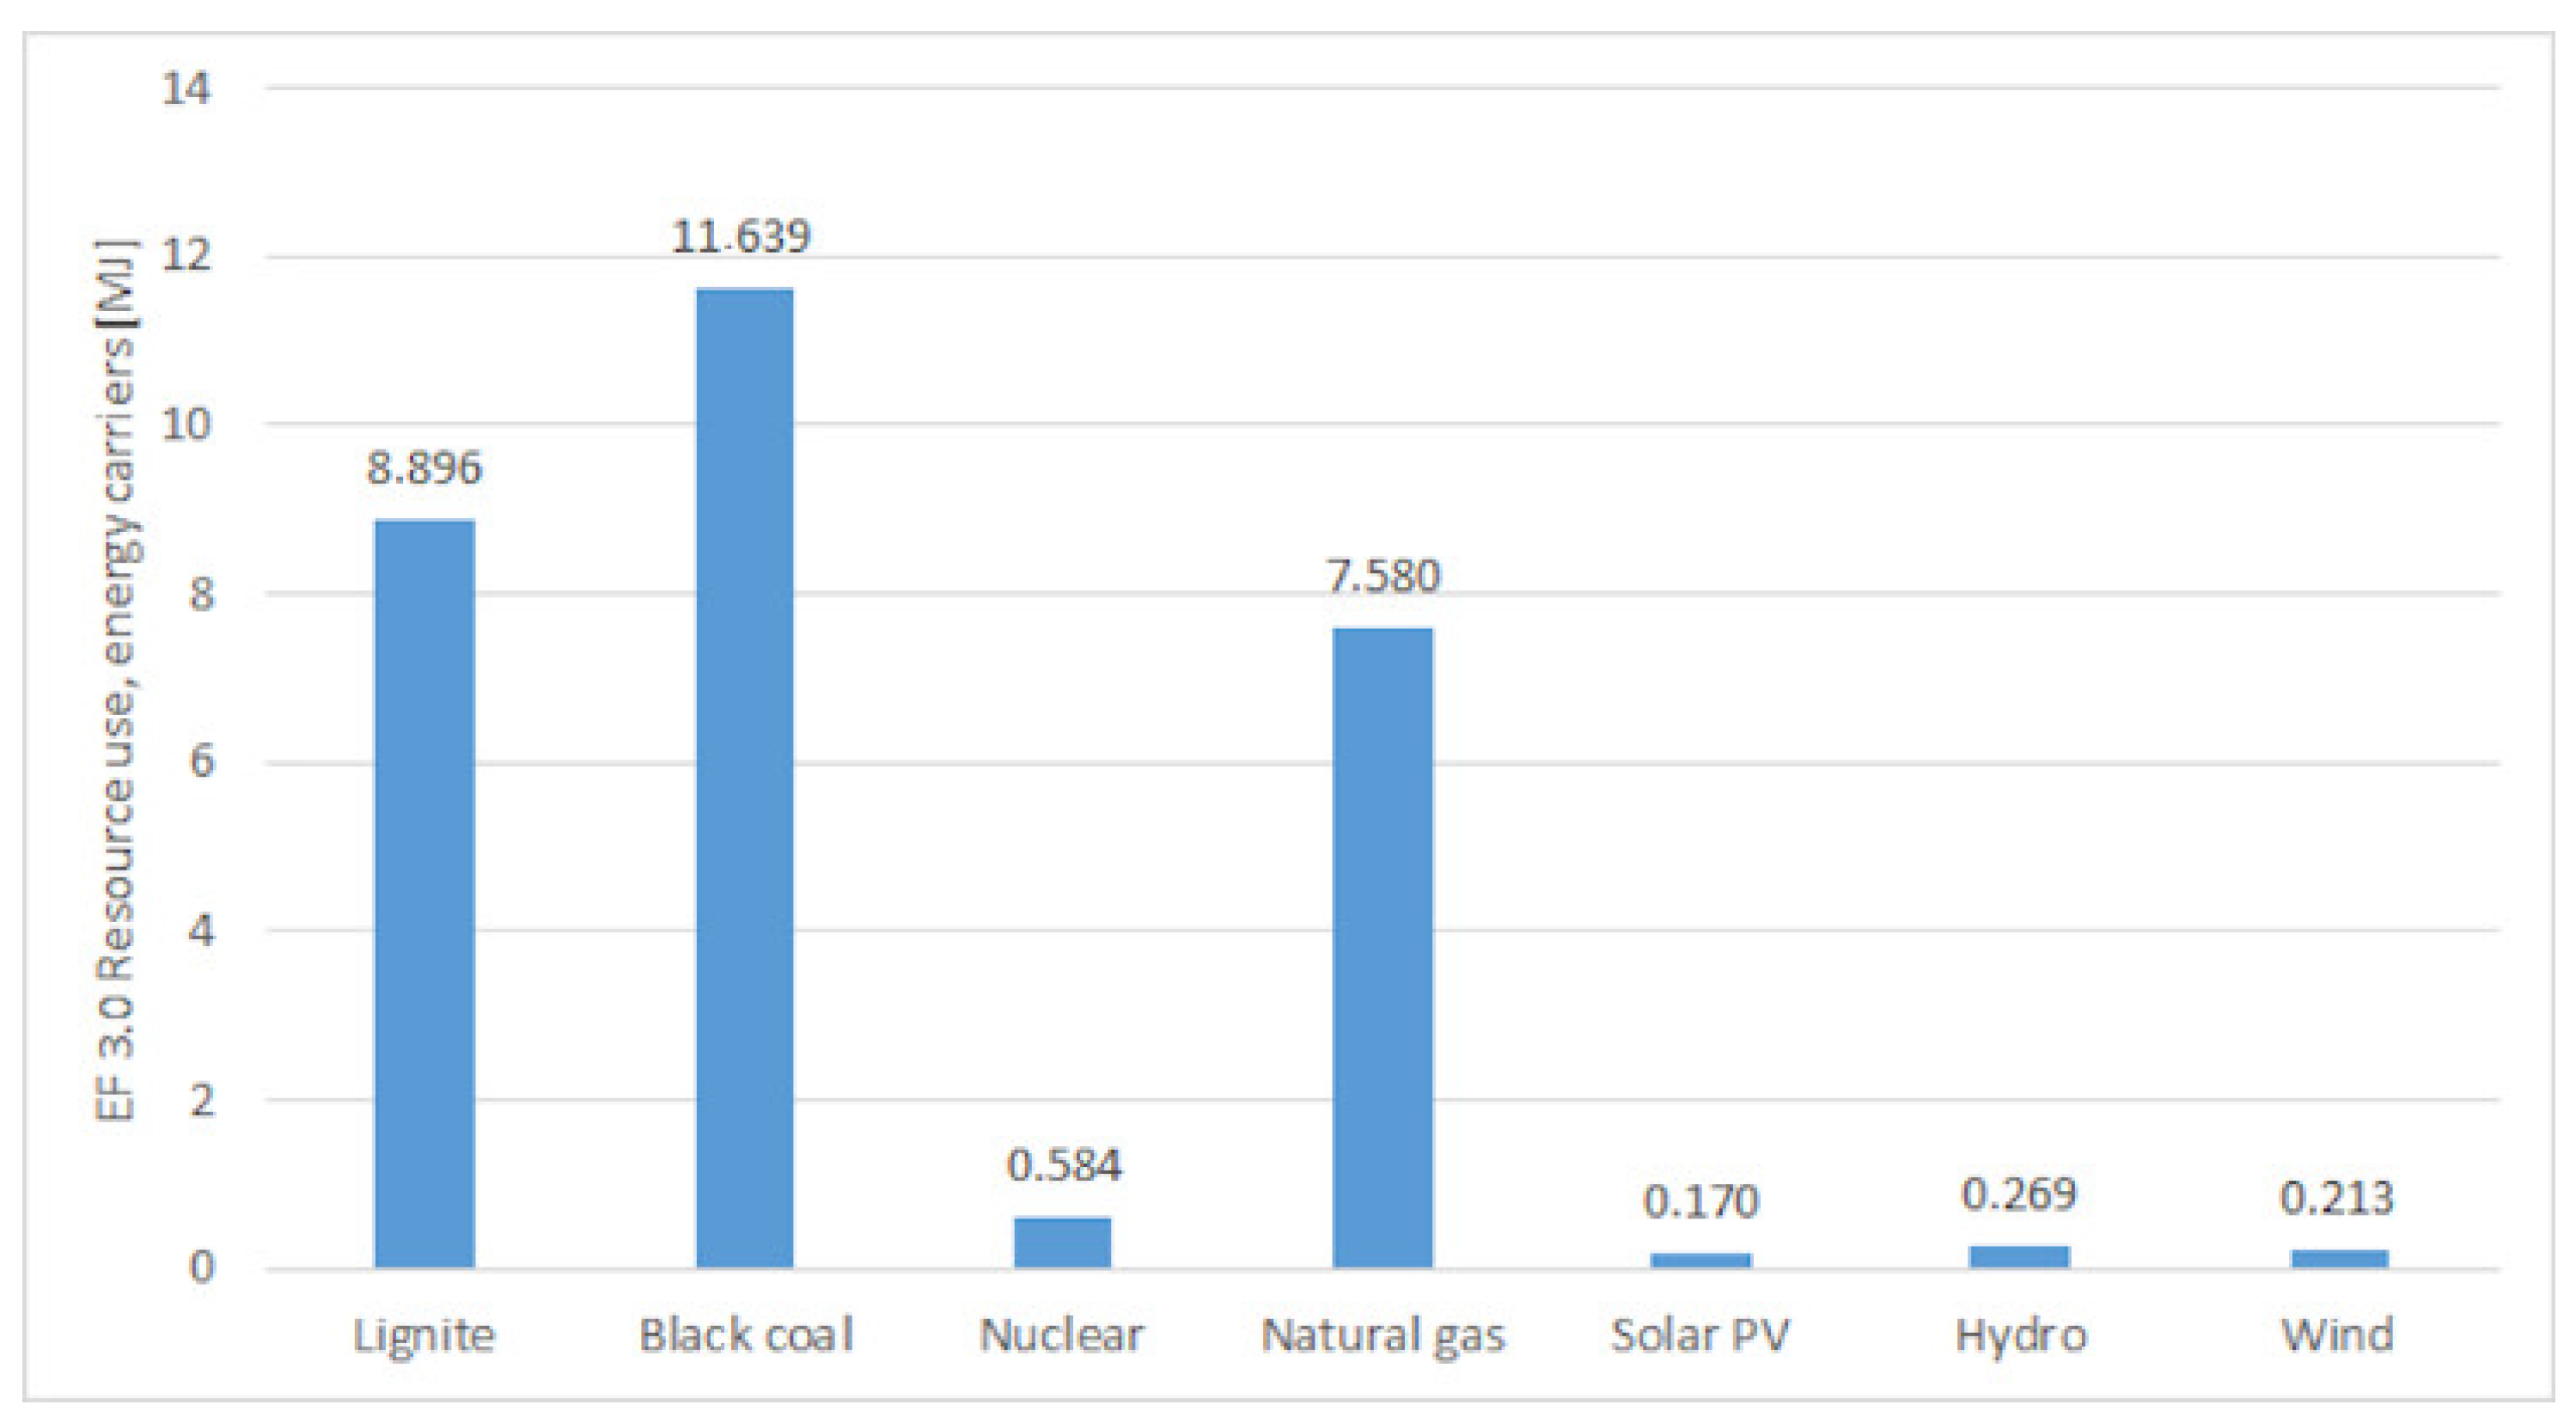
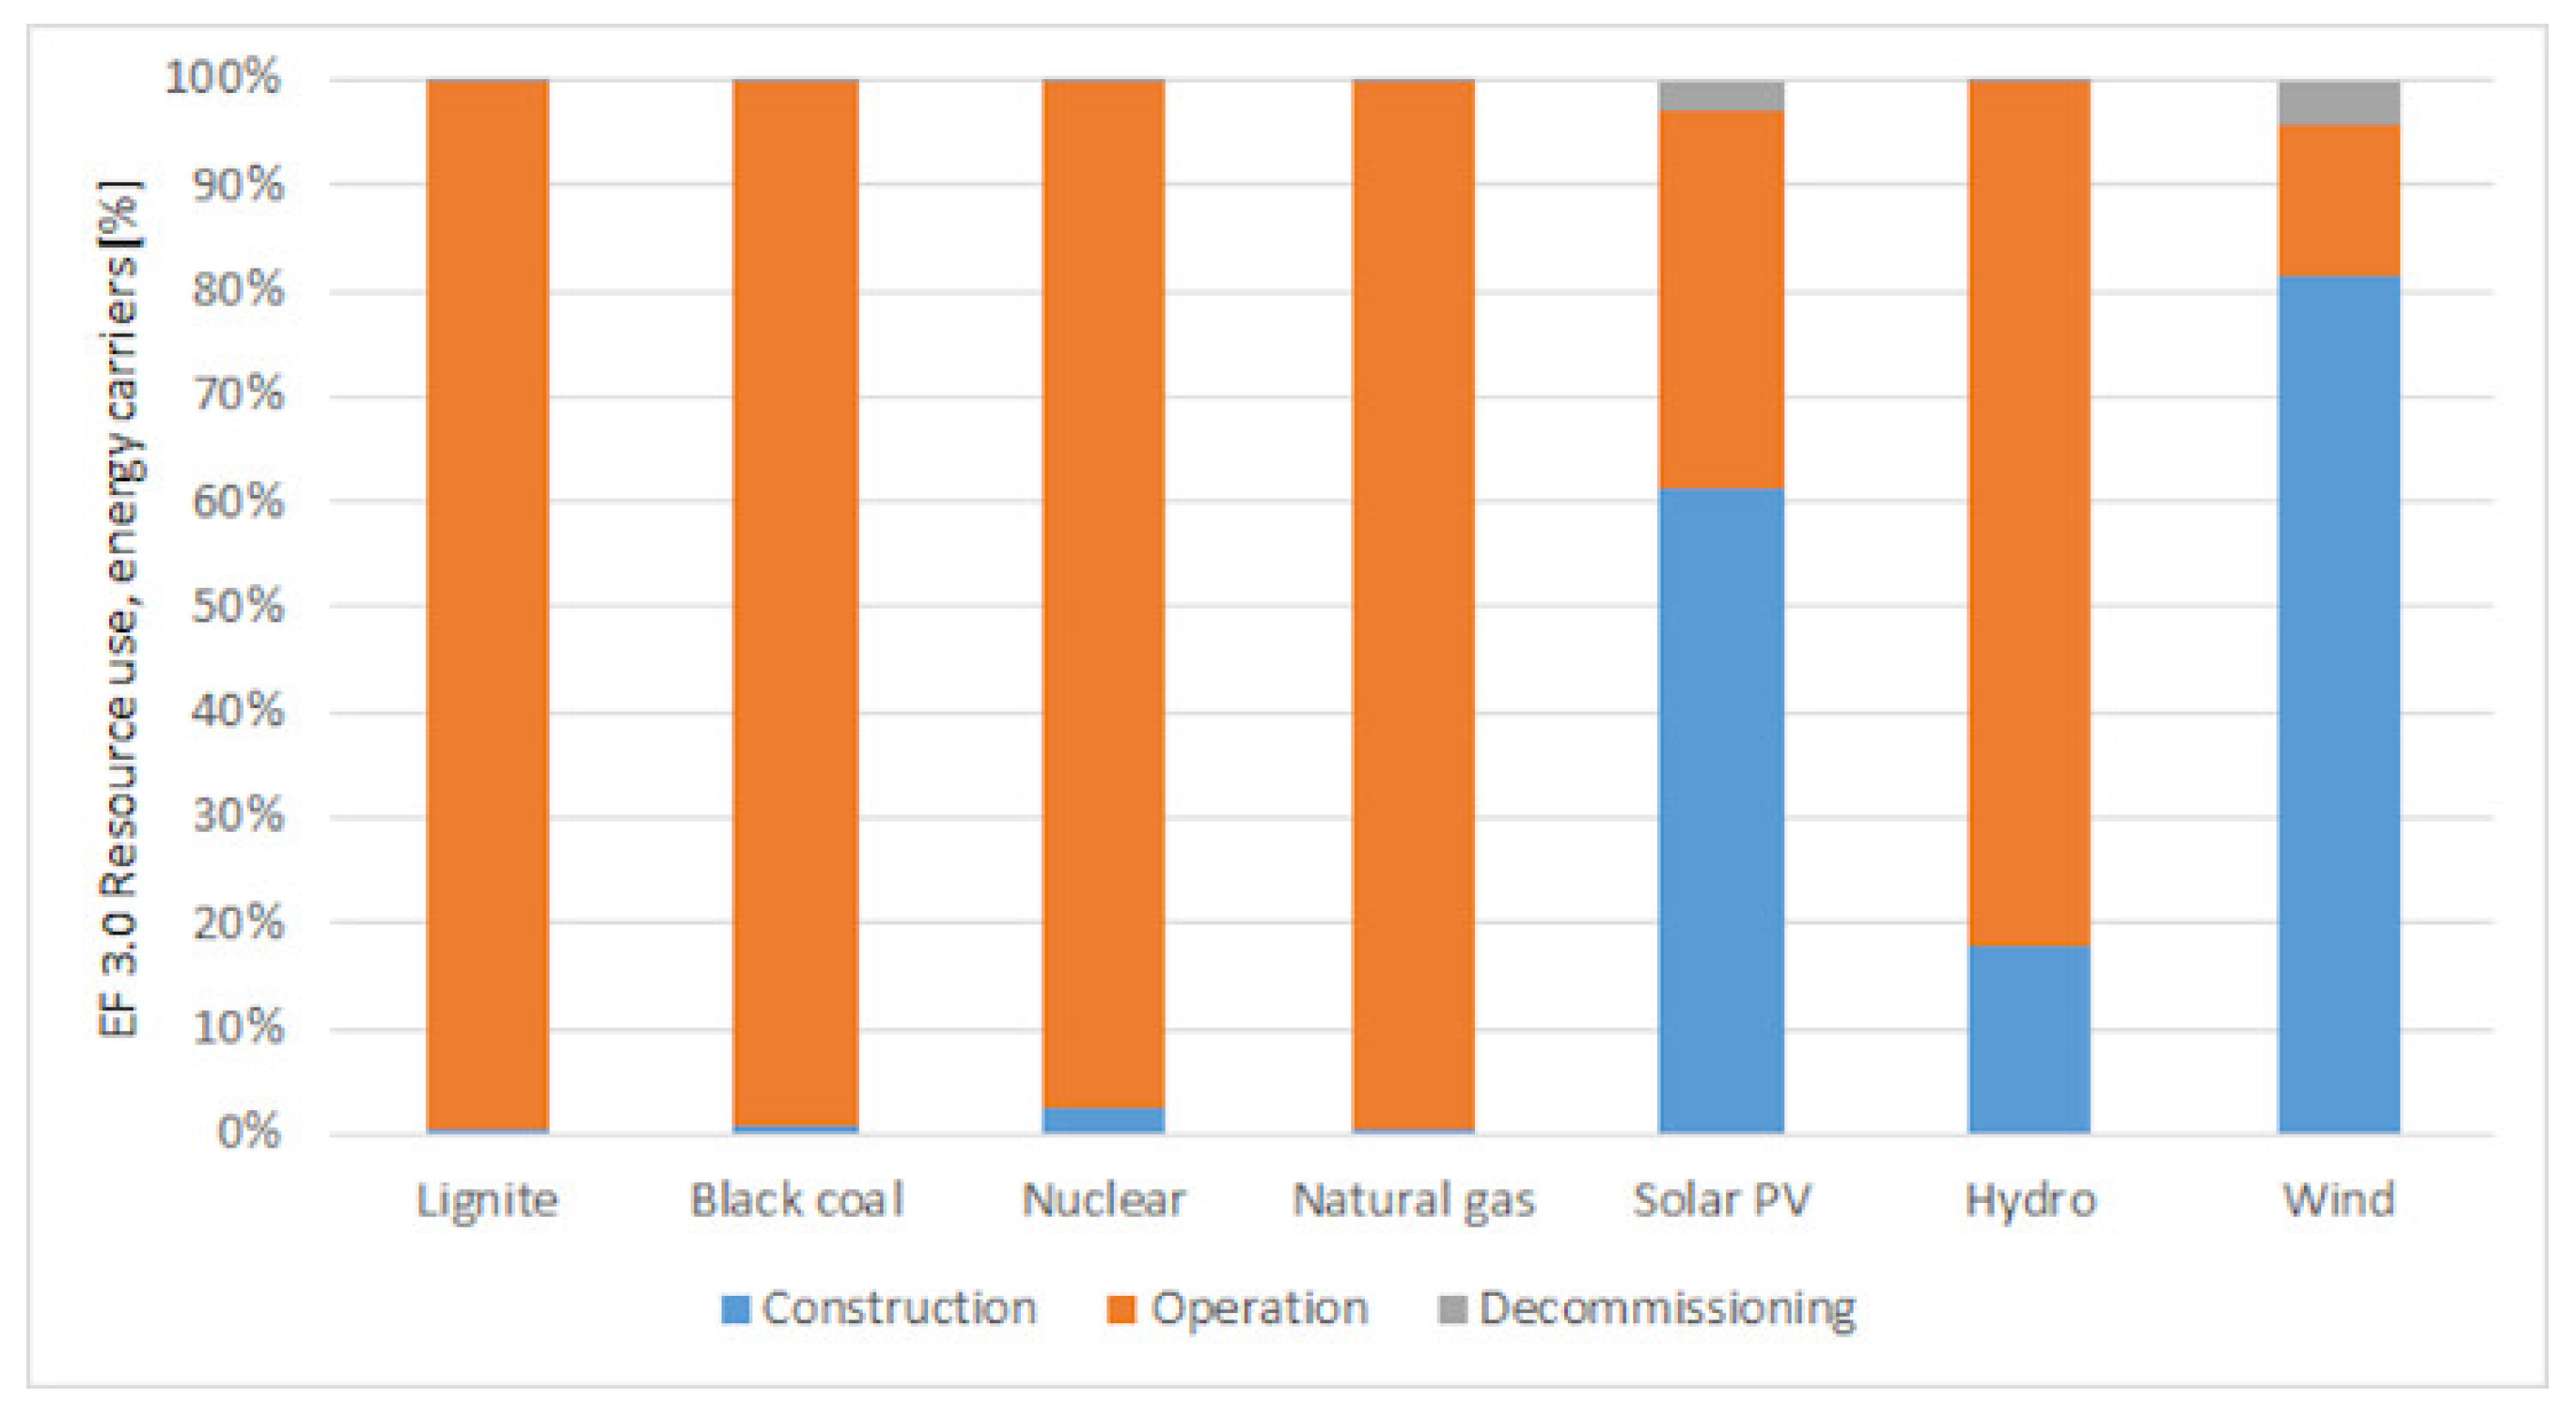
3.2. Resource Use, Energy Carriers

A comparison of energy sources in the resource use, energy carriers impact category, expressed in terms of MJ of primary energy, is provided in Figure 4. The most significant impacts associated with this category relate to fossil fuel sources, i.e., 8.9 MJ/kWh for lignite power plants and 11.6 MJ/kWh for black coal power plants. Lignite sources exert an approximately 16% higher impact than do natural gas sources, while coal sources exert a 19% higher impact due to the higher efficiency of gas sources. Other sources exert very-low impacts compared to those of fossil fuels; the impact of nuclear power plants on this category amounts to 0.6 MJ/kWh and, in the case of renewable sources, the most significant impact relates to hydropower plants at 0.3 MJ/kWh.
Concerning fossil fuel sources, all impacts in terms of the resource use, energy carriers category relate to the operational phase, i.e., the fuel extraction and preparation processes (Figure 5). Concerning coal sources, relatively high dispersion of impacts is evident due to the differing efficiencies of the assessed power plants (the selection included an older power plant with below-average efficiency, and a new power plant with a high level of electricity generation efficiency). The impacts of nuclear sources on this category relate mainly to the operational phase and concern principally the preparation, extraction and enrichment of nuclear fuel. In the case of renewable sources, the impacts in terms of the resource use, energy carriers category relate primarily to the production of the materials used in the construction of these power units. As regards the operational phase, the impacts on this category relate to the electricity consumed, which is supplied from the Czech energy mix. The highest potential for environmental benefits relates to renewable sources, since a significant amount of the energy-intensive raw materials used in their construction can be reused following decommissioning.

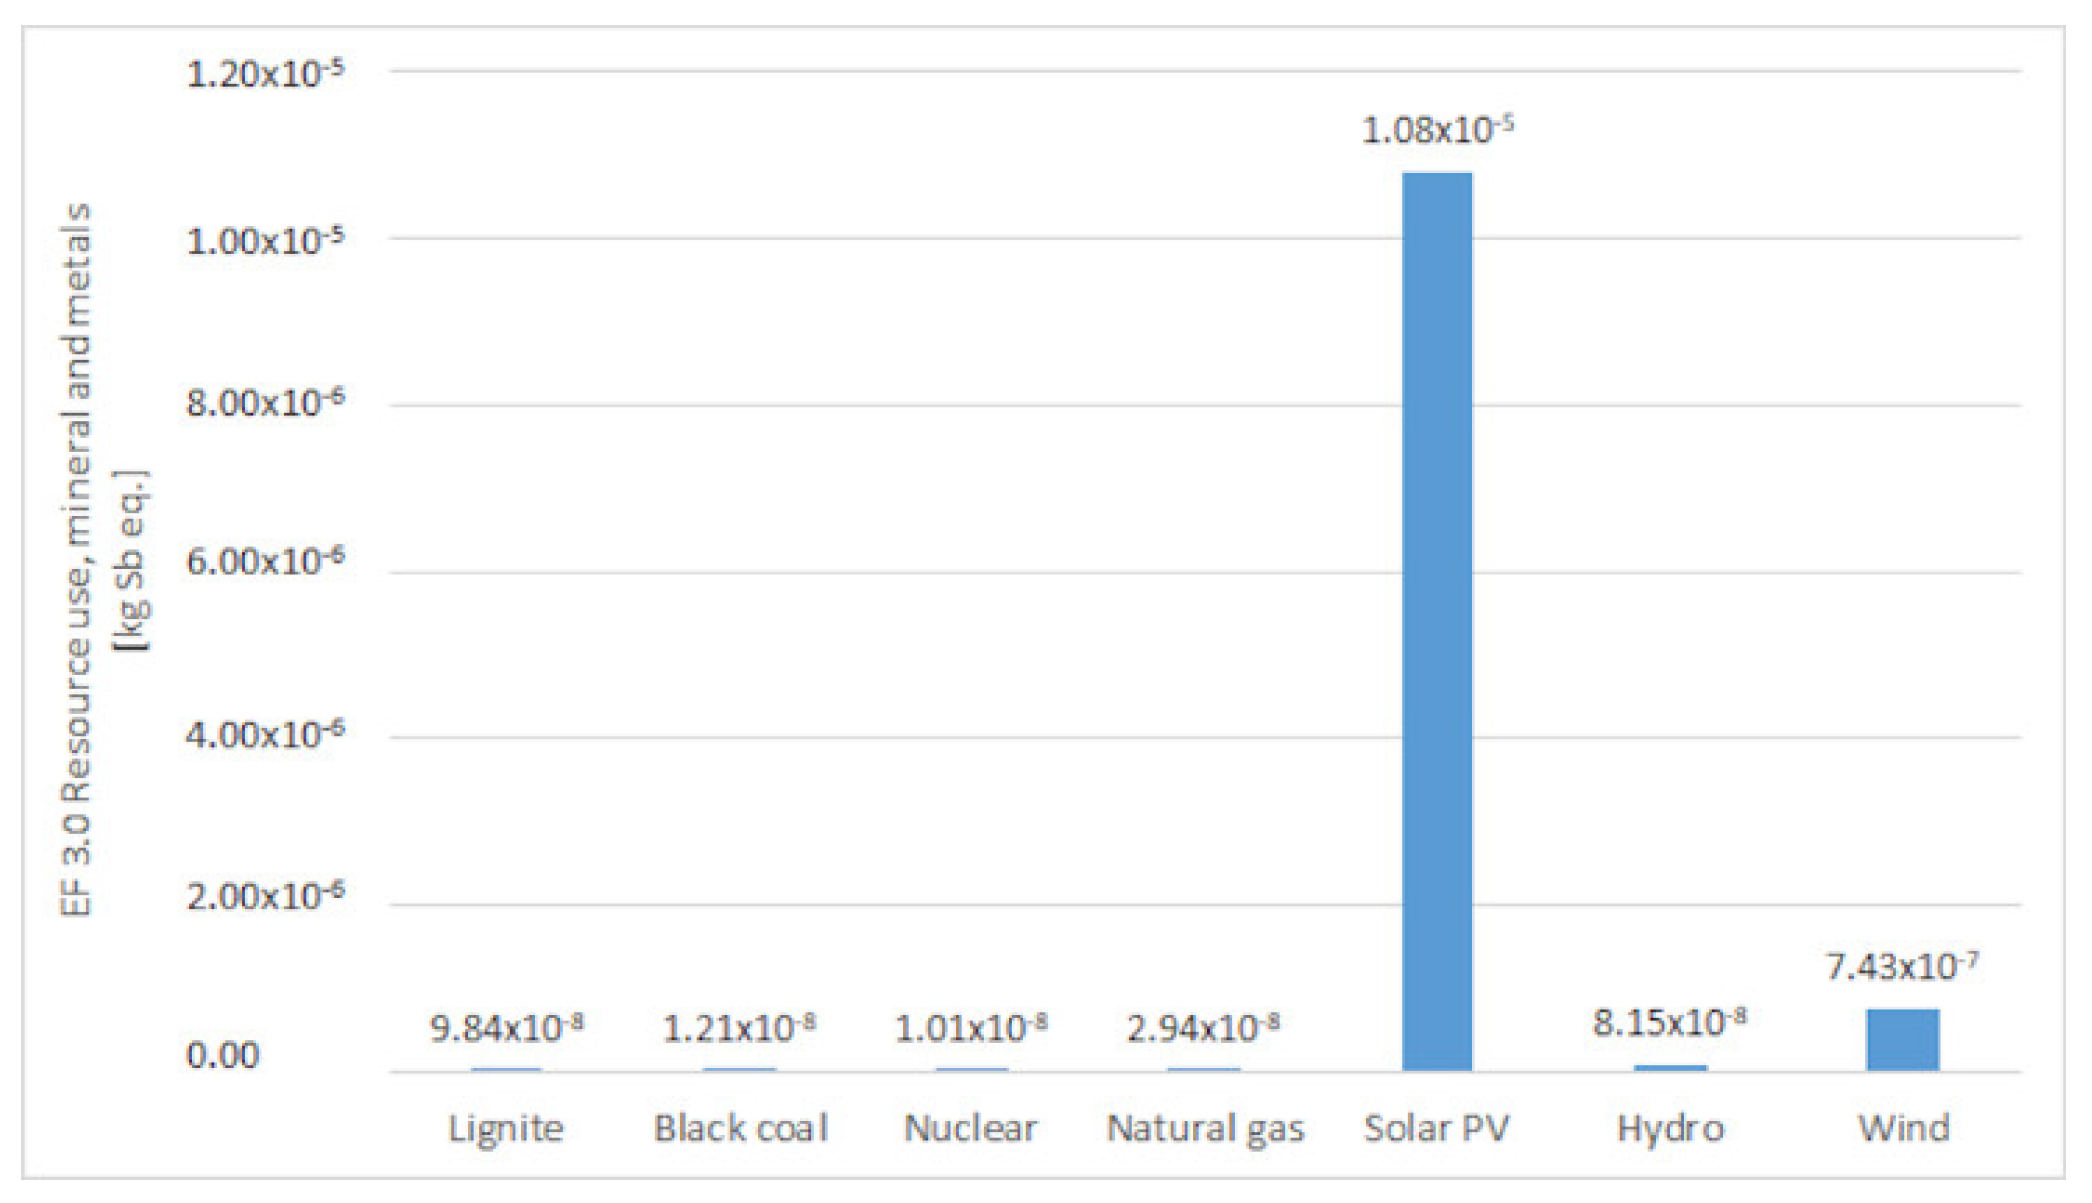
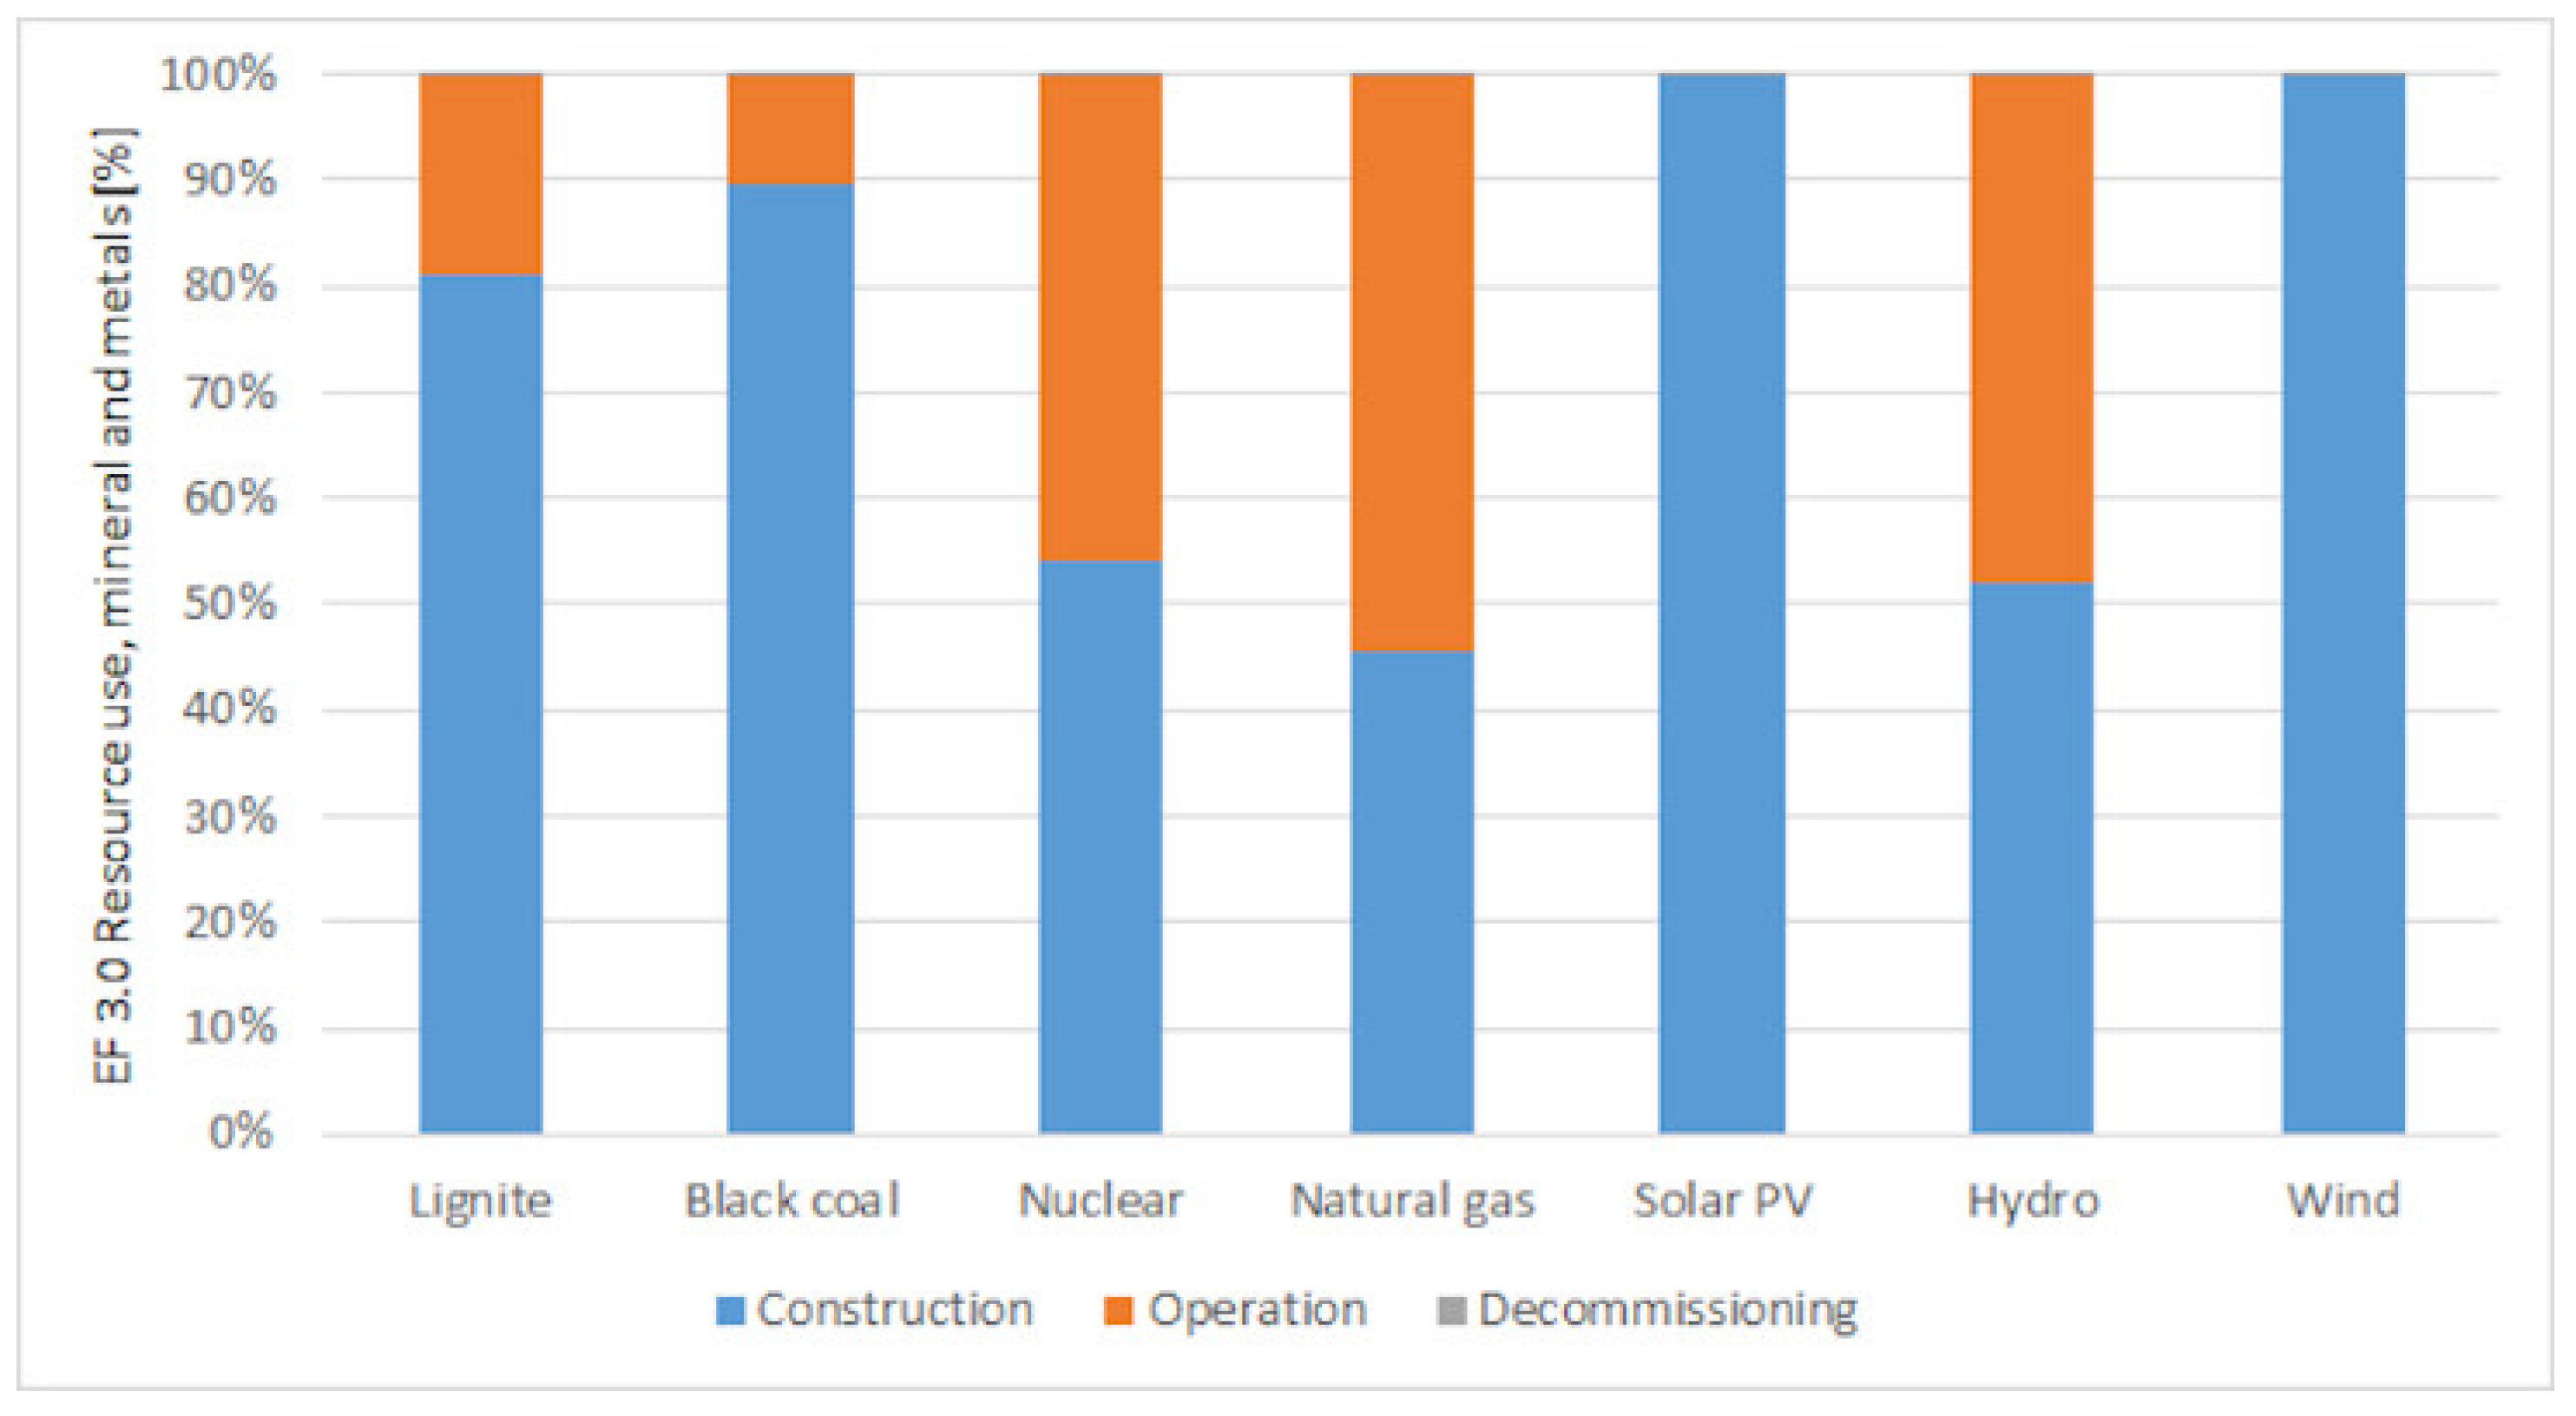
3.3. Resource Use, Minerals and Metals
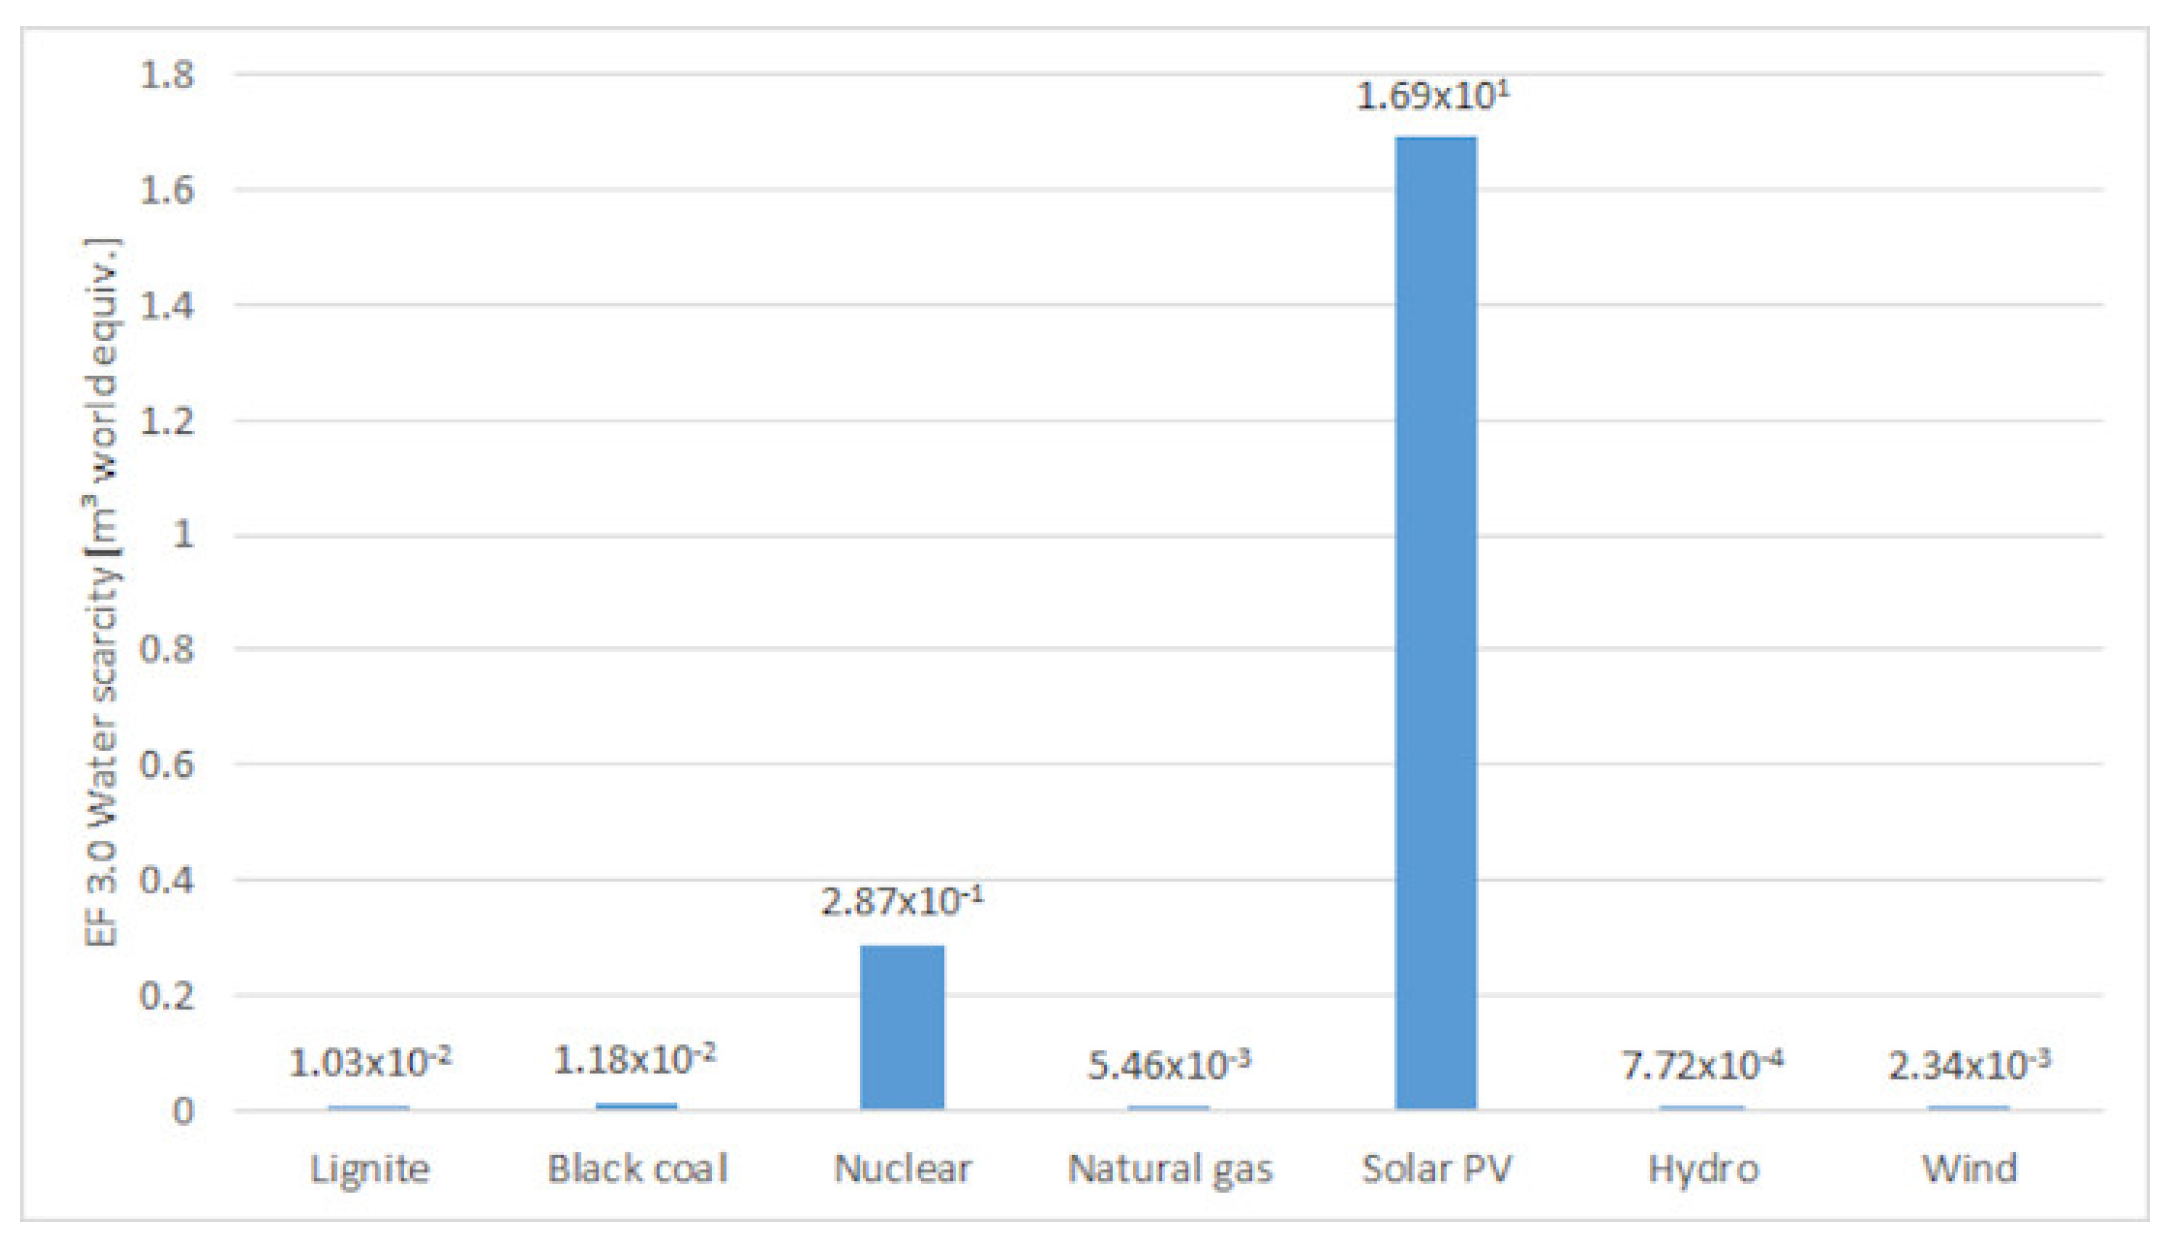
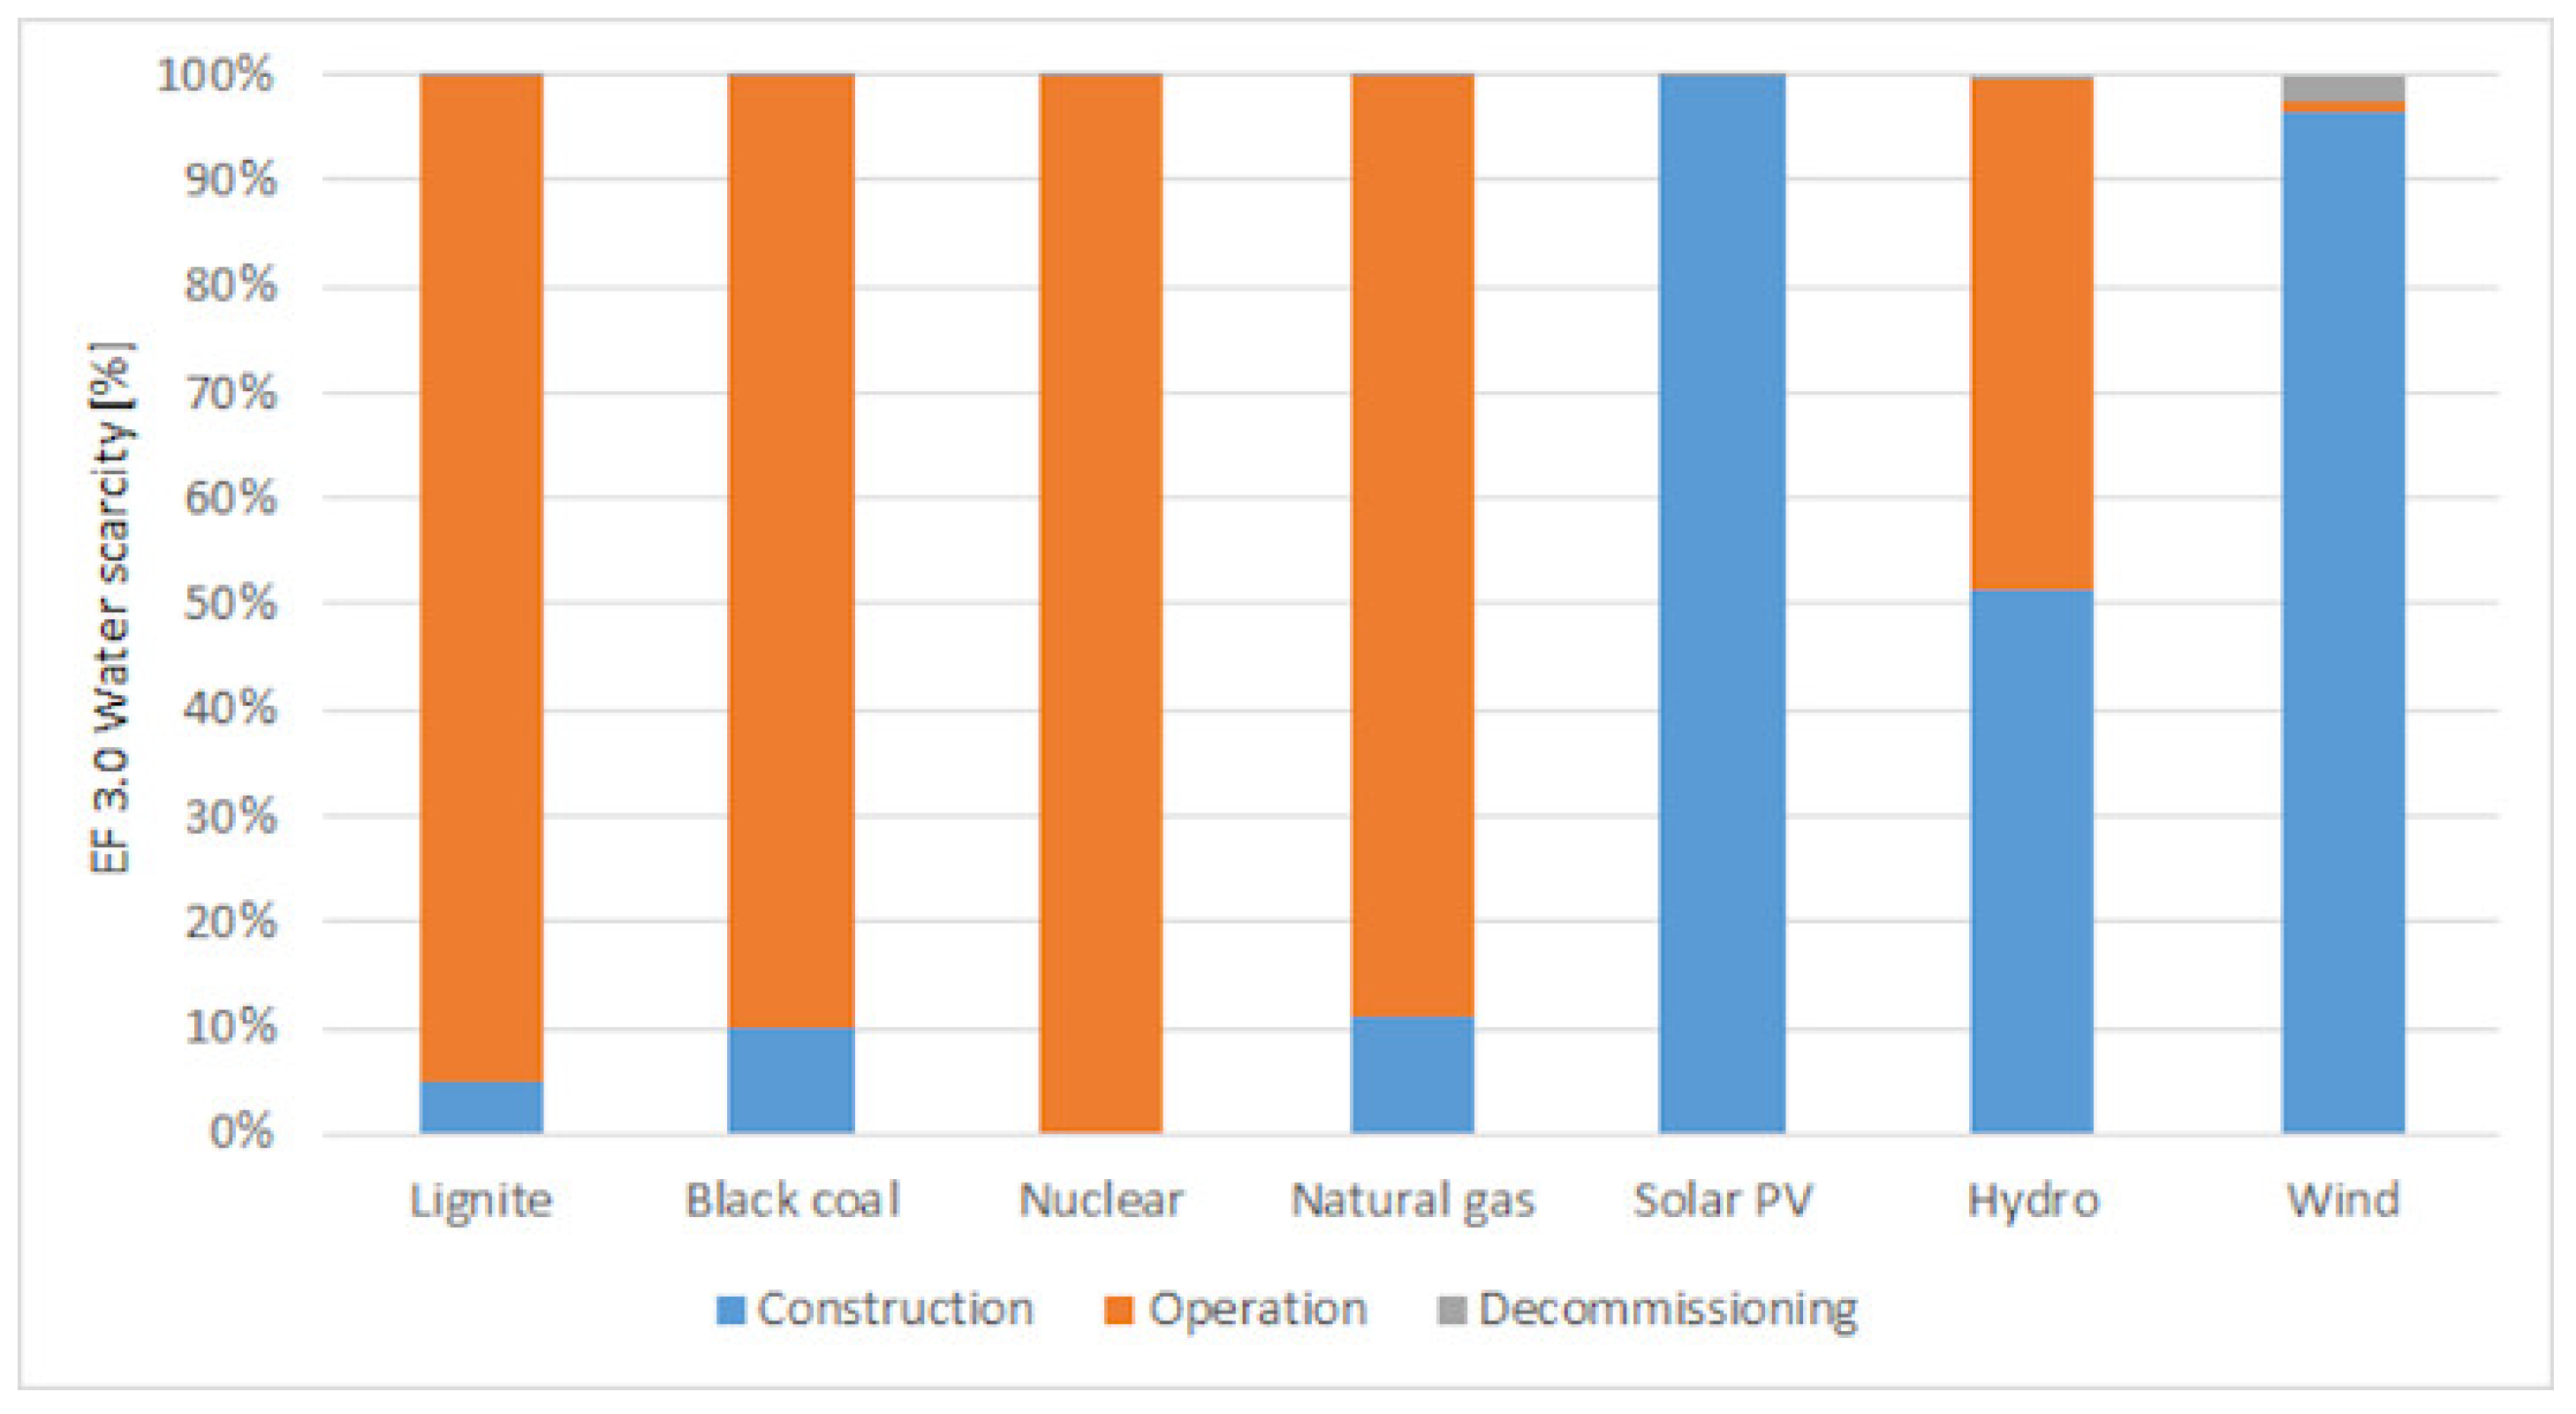
A comparison of energy sources and their impacts on the resource use, minerals and metals category, expressed in terms of kg Sb equivalent, is provided in Figure 6. The environmental footprint methodology employs the CML method to evaluate the consumption of mineral raw materials and metals [39]. Although no consensus has yet been reached in terms of the recommendation of the use of a specific methodology for the evaluation of this impact category, a study [9] that assesses the outputs of this category using different evaluation methods recommended the CML method. The results suggest that the most significant impact on this category relates to the life cycle of photovoltaic sources, i.e., 0.01 g Sb eq./kWh. The significant variance that is evident in the results concerning photovoltaic power plants is due to the consideration of different panel technologies (monocrystalline, polycrystalline silicon and Cd-Te), differences in the placement of the panels (on the roofs or walls of buildings, in fields) and differing inclination. According to this and other studies, the effectiveness of PV panels is influenced primarily by the technology used, the suitability of the site and the location of the panels [44,45]. The importance of the slope of the panel is also evidenced by the results of this study, from which it can be concluded that panels located on walls, i.e., in a vertical position, are significantly less effective than horizontally-positioned panels (on roofs or in fields). A further study [45] that addressed the environmental impacts of the life cycle of polycrystalline panels installed in the United Kingdom and Spain presented assessments for the abiotic depletion element impact category. The resulting values ranged between 0.0027 g and 0.0105 g Sb eq./kWh and thus corresponded to the results of this study. However, the above-mentioned study did not assess the end of the life cycle of photovoltaic panels. Approximately 15-times lower values are associated with wind sources, i.e., 0.0007 g Sb eq./kWh. All the other types of sources were found to have negligible impact values in terms of this category. The lowest impacts are related to the life cycle of the lignite power plant, i.e., 9.84 × 10⁻⁹ g Sb eq./kWh.
It is clear from Figure 7 that photovoltaic sources exert impacts on the resource use, mineral and metals category, especially with concern to the construction phase, i.e., the production of construction materials (specifically mining and the processing of various metals). With respect to the manufacture of monocrystalline and polycrystalline panels, the highest impact concerns the production of silver and, in the case of cadmium-tellurium panels, the production of cadmium. The influence of the composition of the PV panel is also relatively significant in terms of this category, i.e., panels based on Cd-Te exert a roughly five times lower impact on the resource use, mineral and metals category. The values for polycrystalline and monocrystalline panels are comparable. In the case of wind sources, impacts concerning the resource use, mineral and metals category relate mainly to the production of construction materials (construction phase), the main contributing factors being the mining and production of copper. To coal-fired power plants, the impact on this category relates to the operational phase, particularly the mining and preparation of the fuel.

3.4. Water Scarcity

A comparison of the various energy sources and their impacts on the water consumption impact category, expressed in m3, is provided in Figure 8. The results illustrate that the most significant impacts concern the life cycle of photovoltaic sources, i.e., 1.69 m3/kWh. The impacts on this category relate to the construction phase and the mining and production of their structural elements, especially metal components (silicon, Cd-Te and the metals for the production of electronic parts). The significant differences in terms of the use of the installed capacity and electricity produced and, thus, the results of the case studies are due to the same factors as mentioned in the previous chapter, i.e., the overall suitability of the location and the slope and positioning of the panel and the technology. According to the results of studies that assessed the water footprint of energy sources, average global values for water consumption per kWh produced by photovoltaic panels ranged from 0.00002 to 0.00109 m3/kWh [46]. One study presented water consumption values of as high as 0.0003 m3/kWh [47]. The results of previous studies differed mainly due to the use of different evaluation methodologies. The EF methodology evaluation approach employs the Water Scarcity Index of Available Water Remaining (AWARE) methodology with the user deprivation potential indicator (deprivation-weighted water consumption) [40], whereas these studies employed the Water Footprint methodology [48] to evaluate the amount of water consumed and polluted during electricity generation.
The life cycle of nuclear sources exerts an approximately five times lower impact, and the results of this study indicate that other types of energy sources exert lower impacts of up to several orders of magnitude.
Figure 9 shows the ratio of individual energy source life cycles in the water scarcity category. In the case of photovoltaic and wind sources, most of the impacts relate to the production of structural elements, especially the production and extraction of metals and electrical components. Both types of renewables also have significant potential in terms of environmental benefits at the end of the source life cycle. In the case of nuclear sources, most of the environmental impacts relate to the operation of power plants and, in particular, three specific processes, i.e., the extraction and preparation of nuclear fuel, the production of boric acid and the evaporation of water from cooling towers. With respect to nonrenewable sources, most of the impacts relate to the operation of power plants, especially the extraction and preparation of fuel.

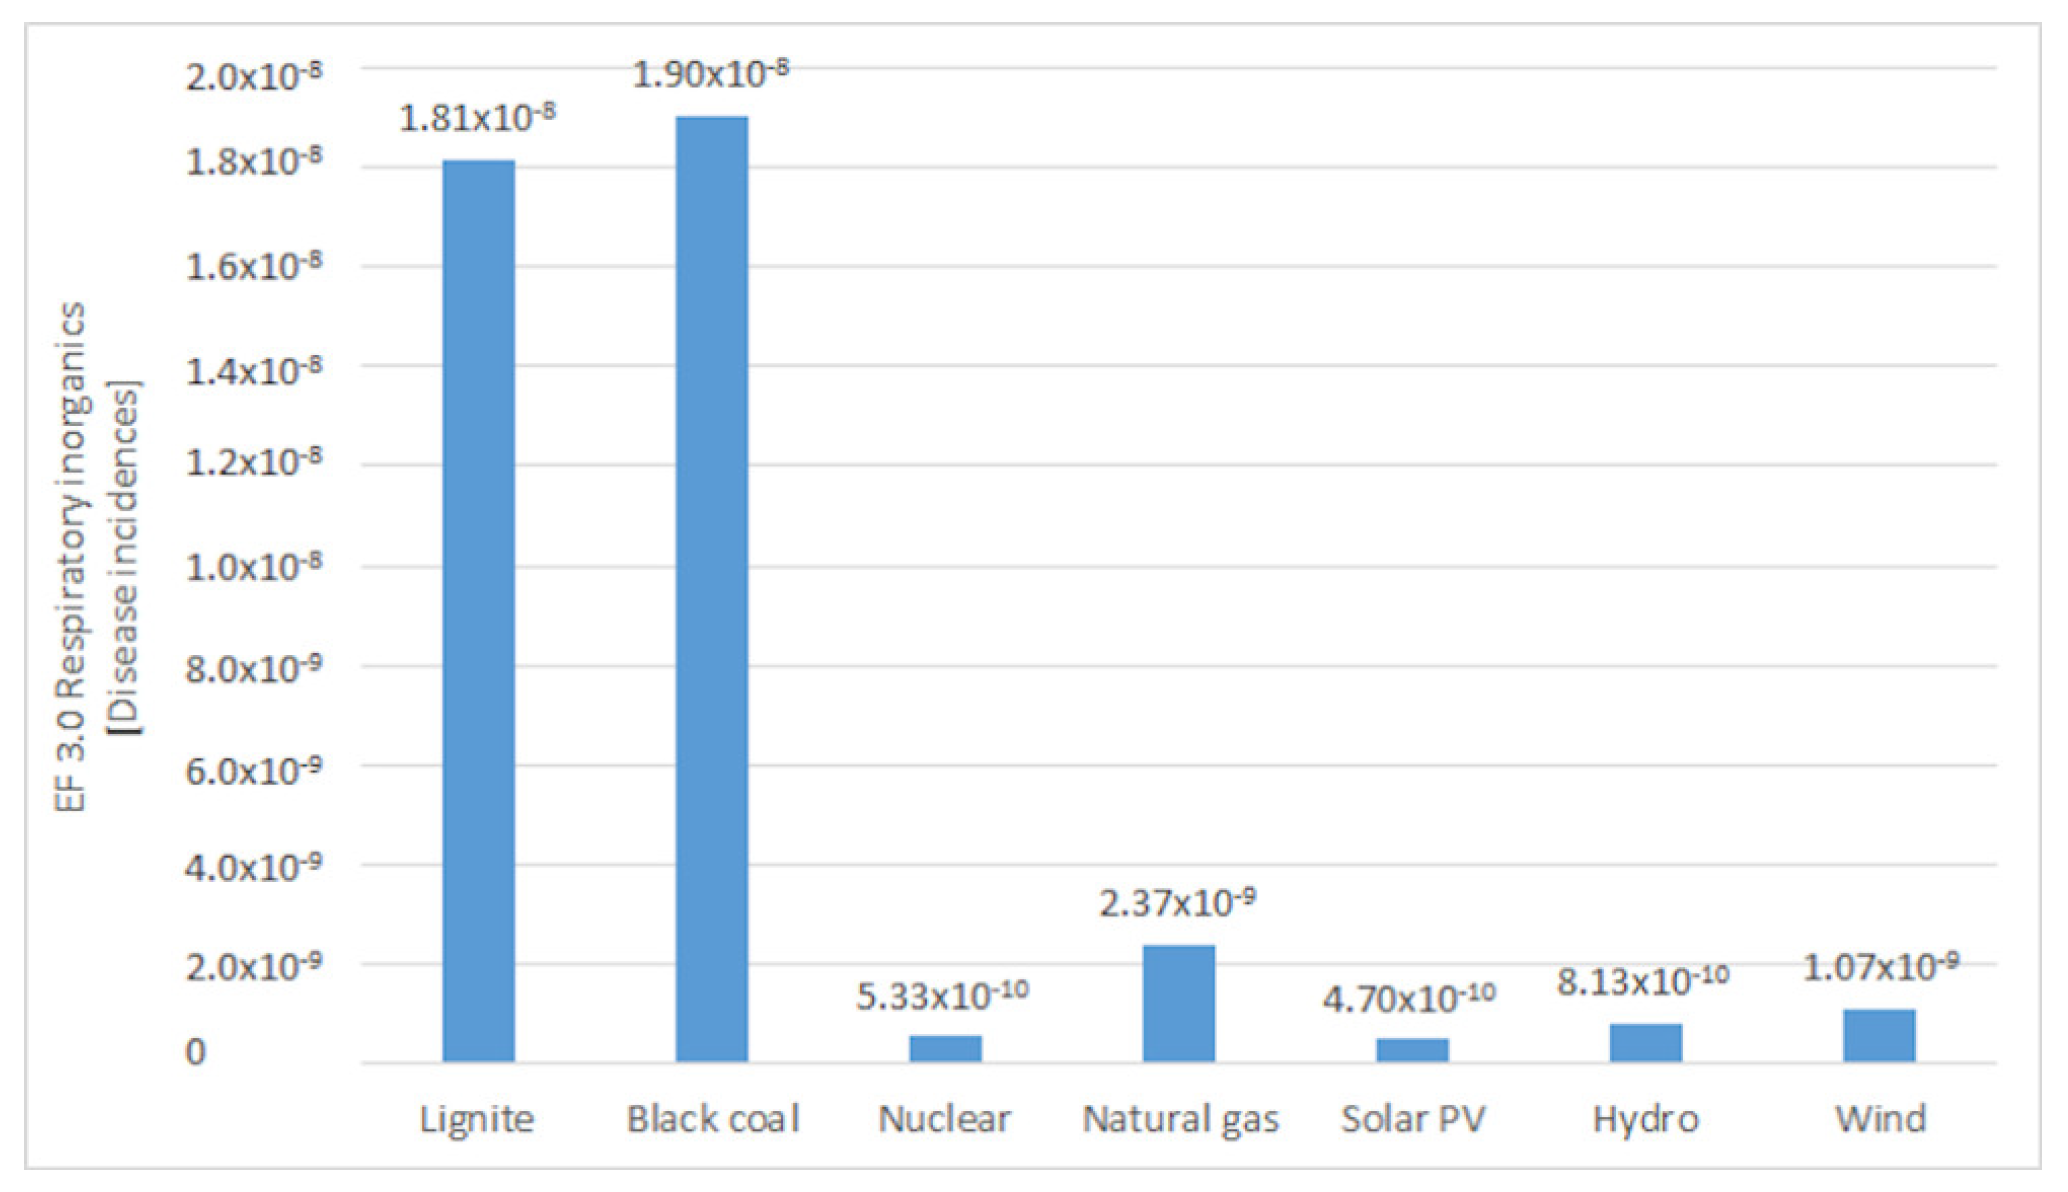
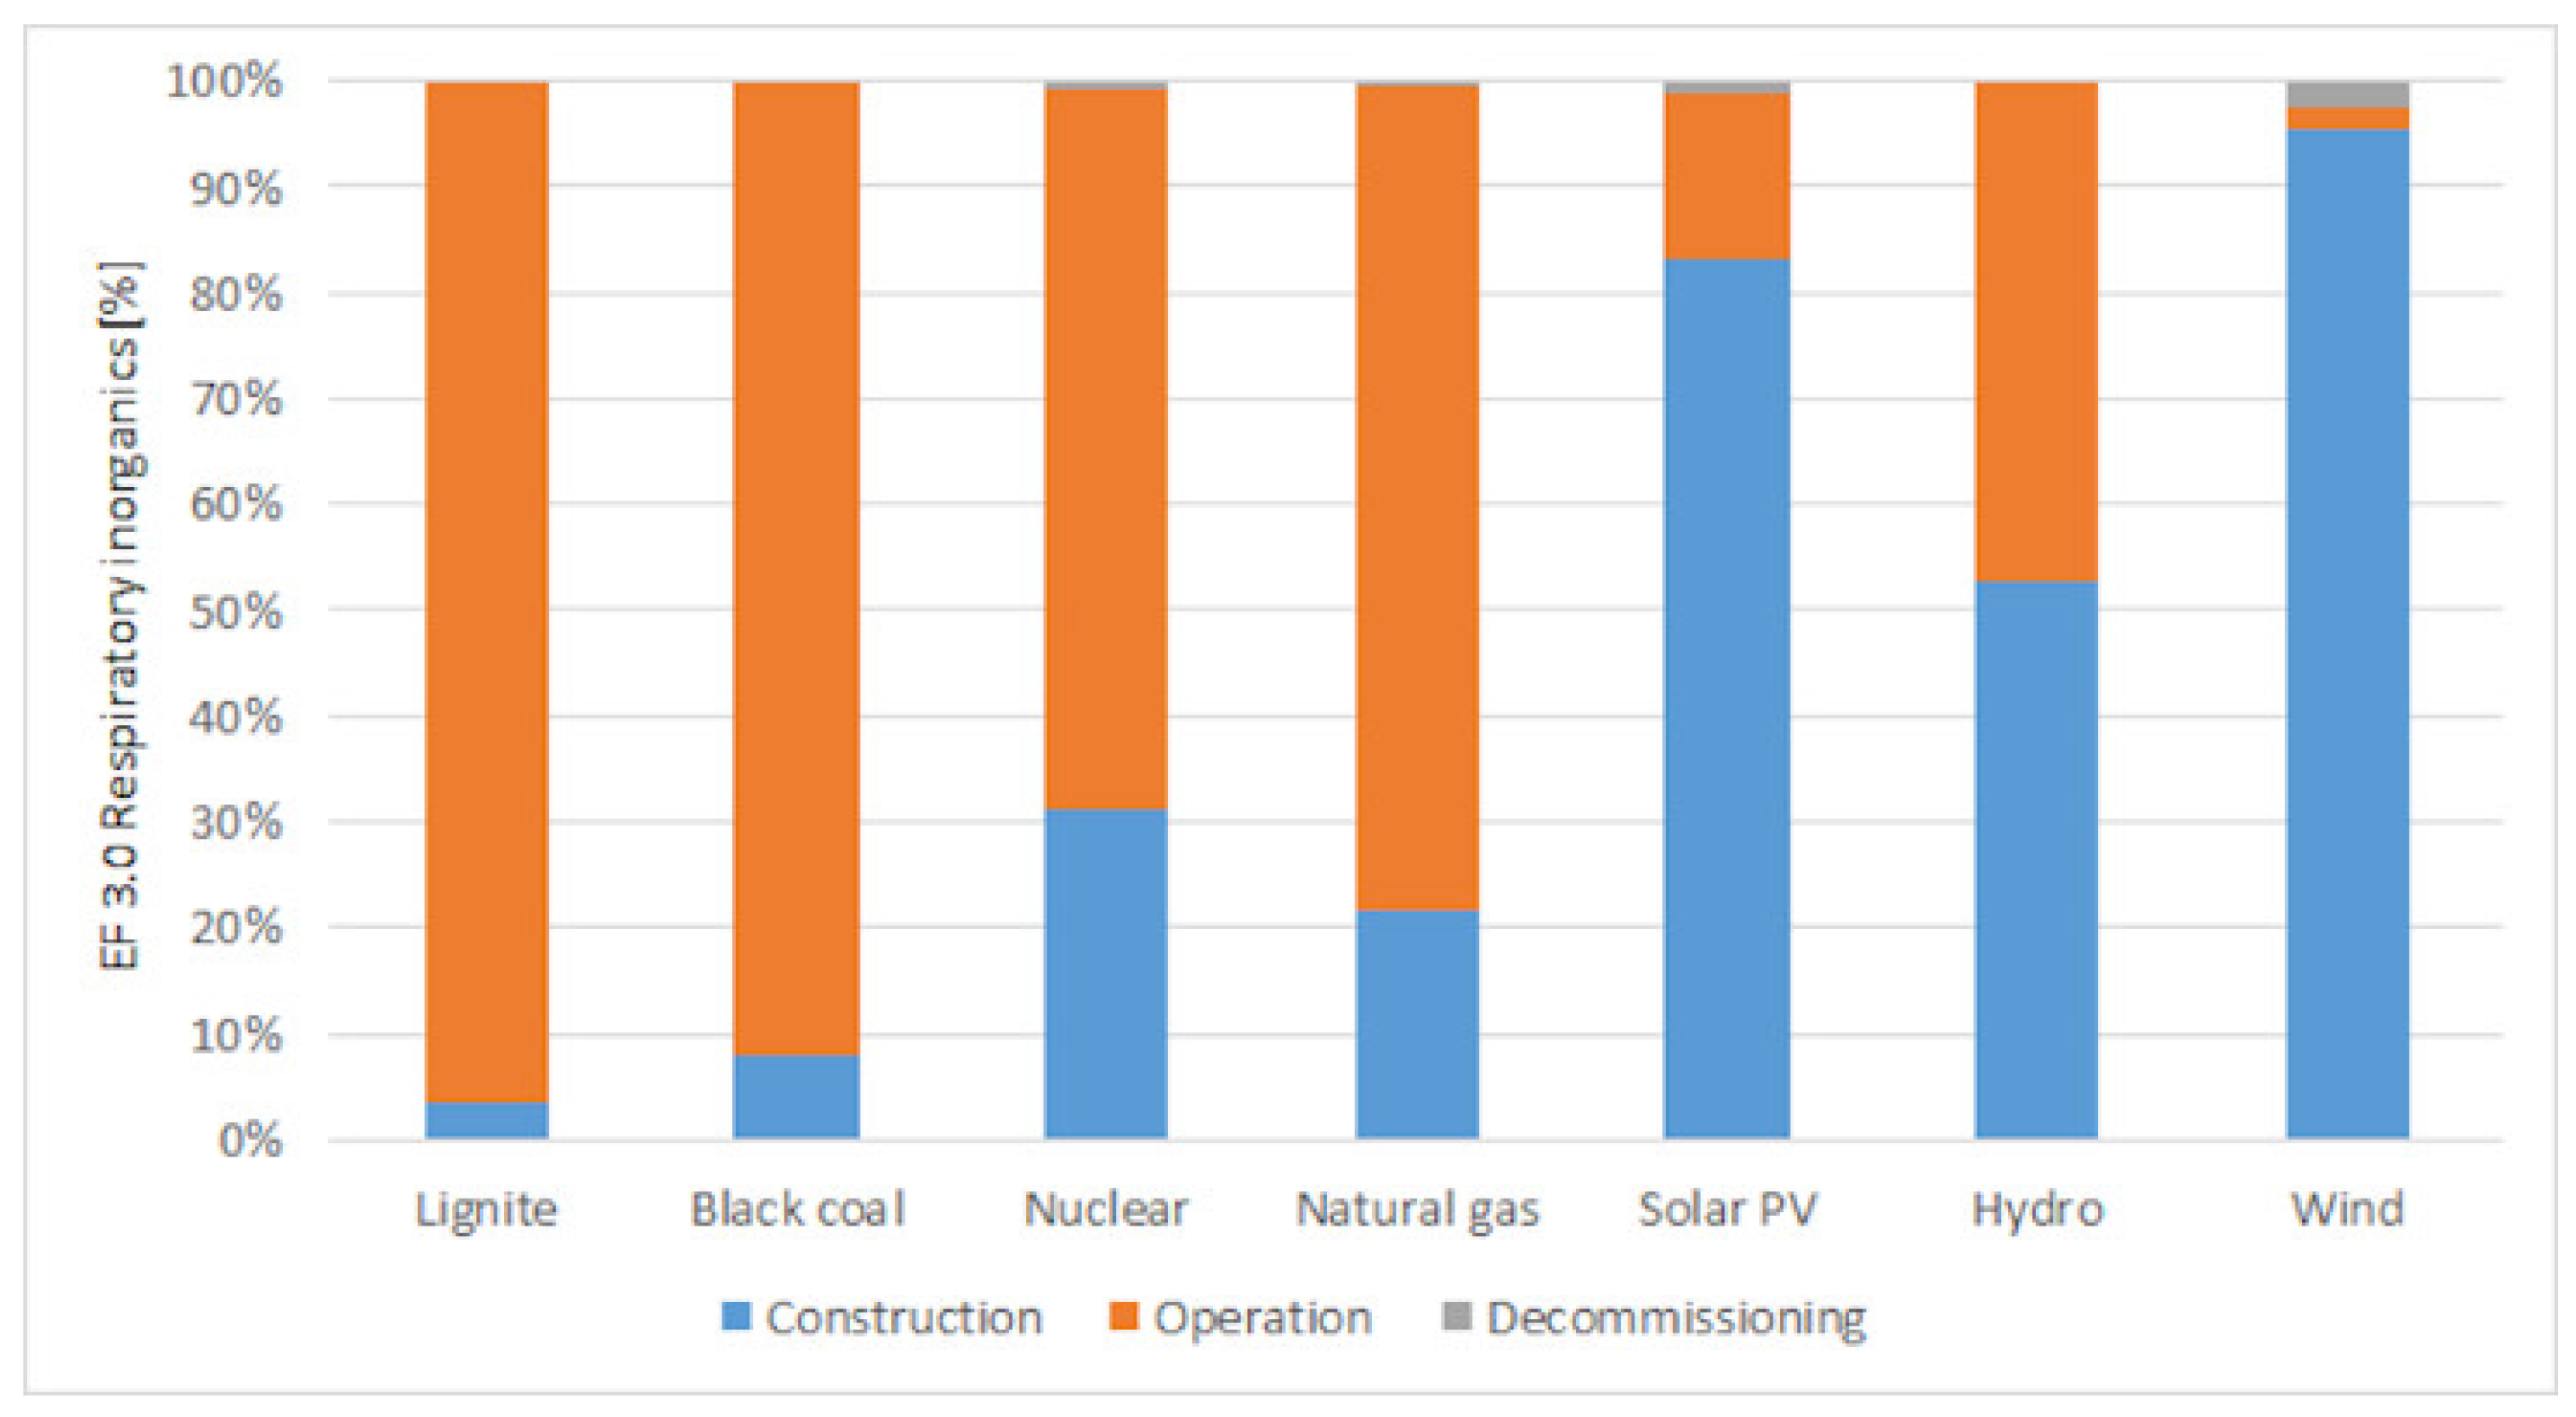
3.5. Particulate Matter

A comparison of the impacts of individual energy sources on the particular matter category expressed as the number of disease incidents is presented in Figure 10. The most significant impacts relate to the life cycle of coal-fired power plants, i.e., 1.9×10⁻⁸ for black coal-fired power plants and 1.8×10⁻⁸ for lignite-fired power plants. The production of electricity by natural gas power plants exerts an approximately eight times lower impact. The lowest impacts of all the assessed sources relate to the production of electricity from photovoltaic and nuclear power plants. With respect to hydro sources, again, it is possible to observe a significant variance in the values between the case studies depending on the properties of the site. A study [2] that addressed the impact of energy on the environment reported that the average global citizen produced 2.55 kg PM2.5 eq. in 2011 as a result of electricity consumption. According to the study, more than 94% of this impact related to the operation of coal-fired power plants, while other sources contributed only marginally to this impact category. A study that focused on the environmental impacts of the Greek energy mix reported the production of 1.484 kg PM10 per 1 MWh of electricity produced by coal-fired power plants; moreover, the combustion of coal sources exerted the most significant effect on this impact category [4]. While it is not possible to compare the results of these studies due to their employing different evaluation methodologies, the same trend was determined in the values of the assessed electricity sources in this study and the studies cited above.
As far as the life cycle of coal-fired power plants is concerned, impacts in this category relate mainly to the operational phase, i.e., the combustion of coal (Figure 11). The second most significant impact in this category refers to the operational phase of natural gas sources, particularly the extraction and processing of natural gas. With respect to RES, the impacts relate mainly to electricity consumption in the construction phase, particularly the production of structural elements. In the case of nuclear sources, the impacts in this category primarily concern the operation of the source, namely the production of boric acid and the extraction and processing of nuclear fuel.

4. Conclusions

This study assesses the impacts of the life cycles of various energy sources operated in the Czech Republic on selected impact categories. Based on the results of the extensive LCA study, it can be stated that while NRES exert environmental impacts, especially in the operational phase, the impacts of RES relate primarily to their construction. The decommissioning phase exerts marginal environmental impacts compared to the other phases.
The results of the study can be used at several levels. Since the functional unit and the system boundaries are maintained for all the sources considered, the results can be used for the comparison of two or more energy sources. The results also clearly identify the phase or individual processes where optimization or improvement is appropriate from the LCA point of view. NRES, namely black-coal and lignite power plants, comprise the most significant contributors to the global warming, resource use, energy carrier and particulate matter categories. Since these sources account for approximately 47% of the Czech energy mix, it can be stated that these four categories are most affected by electricity generation in the Czech Republic. The production of electricity from photovoltaic power plants contributes most to the water scarcity and resource use, minerals and metals categories. Nuclear, hydro and wind power plants contribute to the above-mentioned impact categories to a lesser extent. However, it is not possible to unambiguously recommend these three types of power units as most suitable for the future Czech energy mix from the point of view of environmental impacts and energy security since the study does not consider, for example, the future management of spent nuclear fuel and the construction and operation of a deep nuclear waste repository in the evaluation of nuclear power plants. The issue of the construction of a long-term nuclear waste repository in the Czech Republic is currently being subjected to intense discussion, and follow-up studies should address this aspect. Regarding the evaluation of renewable electricity sources, this study does not evaluate the degree of resource availability and the reliability of the supply of electricity to the national grid. This parameter should be included in LCA models in the form of an alternative evaluation scenario and will be included in future evaluation studies.
The results of the study can be used for the further development of, and proposals for, appropriate energy policies, as well as for the formulation of recommendations, strategies and scenarios concerning the ideal future energy mix of the Czech Republic aimed at reducing the environmental burdens related to electricity generation. It will serve to benefit the Czech Republic and the wider Central European region.

Author Contributions

Conceptualization, M.Š., V.K., J.Š., M.V. and K.Z.; methodology, V.K., J.Š., M.V., M.Š. and K.Z; software, M.Š. and V.K.; validation, M.Š., V.K., J.Š., M.V. and K.Z.; formal analysis, M.Š., J.Š., M.V., K.Z., P.W. and V.K.; investigation, M.Š., J.Š., M.V., K.Z. and V.K., resources, J.Š., M.V., K.Z. and P.W.; writing—original draft preparation, M.Š.; writing—review and editing, M.Š., M.V., J.Š., V.K. and P.W.; visualization, M.Š.; supervision, V.K; project administration, J.Š., V.K.; funding acquisition, J.Š., V.K. and M.V. All authors have read and agreed to the published version of the manuscript.

Funding

This research was funded by the Technology Agency of the Czech Republic (TH03020169) and specific university research (MSMT No. 21-SVV/2019); institutional support was provided by UCT Prague and by CTU UCEEB, project CZ.02.1.01/0.0/0.0/15_003/0000464 Centre for Advanced Photovoltaics. The paper was also supported with the project Innovative and additive manufacturing technology—New technological solutions for 3D printing of metals and composite materials, reg. no. CZ.02.1.01/0.0/0.0/17_049/0008407 financed by European Regional Development Fund.

Conflicts of Interest

The authors declare no conflict of interest. The funders had no role in the design of the study; in the collection, analyses, or interpretation of data; in the writing of the manuscript, or in the decision to publish the results.

References

  1. International Energy Agency Data & Statistics-IEA. Available online: https://www.iea.org/data-and-statistics?country=WORLD&fuel=Energy consumption&indicator=Carbon intensity of industry energy consumption (accessed on 25 March 2020).
  2. Laurent, A.; Espinosa, N. Environmental impacts of electricity generation at global, regional and national scales in 1980–2011: What can we learn for future energy planning? Energy Environ. Sci. 2015, 8, 689–701. [Google Scholar] [CrossRef] [Green Version]
  3. Scherer, L.; Pfister, S. Global water footprint assessment of hydropower. Renew. Energy 2016, 99, 711–720. [Google Scholar] [CrossRef]
  4. Kumar, A.; Melkote, S.N. Diamond Wire Sawing of Solar Silicon Wafers: A Sustainable Manufacturing Alternative to Loose Abrasive Slurry Sawing. Procedia Manuf. 2018, 21, 549–566. [Google Scholar] [CrossRef]
  5. Bhat, I.K.; Prakash, R. LCA of renewable energy for electricity generation systems—A review. Renew. Sustain. Energy Rev. 2009, 13, 1067–1073. [Google Scholar] [CrossRef]
  6. Sherwani, A.F.; Usmani, J.A. Life cycle assessment of solar PV based electricity generation systems: A review. Renew. Sustain. Energy Rev. 2010, 14, 540–544. [Google Scholar] [CrossRef]
  7. Theodosiou, G.; Koroneos, C.; Stylos, N. Environmental impacts of the greek electricity generation sector. Sustain. Energy Technol. Assess. 2014, 5, 19–27. [Google Scholar] [CrossRef]
  8. Mahmud, M.A.P.; Huda, N.; Farjana, S.H.; Lang, C. Life-cycle impact assessment of renewable electricity generation systems in the United States. Renew. Energy 2019, 151, 1028–1045. [Google Scholar] [CrossRef]
  9. Lieberei, J.; Gheewala, S.H. Resource depletion assessment of renewable electricity generation technologies—Comparison of life cycle impact assessment methods with focus on mineral resources. Int. J. Life Cycle Assess. 2017, 22, 185–198. [Google Scholar] [CrossRef]
  10. Turconi, R.; Boldrin, A.; Astrup, T. Life cycle assessment (LCA) of electricity generation technologies: Overview, comparability and limitations. Renew. Sustain. Energy Rev. 2013, 28, 555–565. [Google Scholar] [CrossRef] [Green Version]
  11. Curran, M.A. Life Cycle Assessment Handbook; John Wiley & Sons Inc.: Hoboken, NJ, USA, 2012; ISBN 978-1-118-09972-8. [Google Scholar]
  12. Garcia, R.; Marques, P.; Freire, F. Life-cycle assessment of electricity in Portugal. Appl. Energy 2014, 134, 563–572. [Google Scholar] [CrossRef]
  13. Orfanos, N.; Mitzelos, D.; Sagani, A.; Dedoussis, V. Life-cycle environmental performance assessment of electricity generation and transmission systems in Greece. Renew. Energy 2019, 139, 1447–1462. [Google Scholar] [CrossRef]
  14. Atilgan, B.; Azapagic, A. An integrated life cycle sustainability assessment of electricity generation in Turkey. Energy Policy 2016, 93, 168–186. [Google Scholar] [CrossRef]
  15. Santoyo-Castelazo, E.; Gujba, H.; Azapagic, A. Life cycle assessment of electricity generation in Mexico. Energy 2011, 36, 1488–1499. [Google Scholar] [CrossRef]
  16. Mallia, E.; Lewis, G. Life cycle greenhouse gas emissions of electricity generation in the province of Ontario, Canada. Int. J. Life Cycle Assess. 2013, 18, 377–391. [Google Scholar] [CrossRef]
  17. Barros, M.V.; Salvador, R.; Piekarski, C.M.; de Francisco, A.C.; Freire, F.M.C.S. Life cycle assessment of electricity generation: A review of the characteristics of existing literature. Int. J. Life Cycle Assess. 2020, 25, 36–54. [Google Scholar] [CrossRef]
  18. Lelek, L.; Kulczycka, J.; Lewandowska, A.; Zarebska, J. Life cycle assessment of energy generation in Poland. Int. J. Life Cycle Assess. 2016, 21, 1–14. [Google Scholar] [CrossRef] [Green Version]
  19. García-Gusano, D.; Garraín, D.; Dufour, J. Prospective life cycle assessment of the Spanish electricity production. Renew. Sustain. Energy Rev. 2017, 75, 21–34. [Google Scholar] [CrossRef]
  20. Turconi, R.; Simonsen, C.G.; Byriel, I.P.; Astrup, T. Life cycle assessment of the Danish electricity distribution network. Int. J. Life Cycle Assess. 2014, 19, 100–108. [Google Scholar] [CrossRef]
  21. Ou, X.; Xiaoyu, Y.; Zhang, X. Life-cycle energy consumption and greenhouse gas emissions for electricity generation and supply in China. Appl. Energy 2011, 88, 289–297. [Google Scholar] [CrossRef]
  22. Ministry of Industry and Trade. National Energy and Climate Plan of the Czech Republic; Ministry of Industry and Trade: Prague, Czech Republic, 2019.
  23. CENIA. Zpráva o Životním Prostředí České Republiky 2018; CENIA: Prague, Czech Republic, 2018. [Google Scholar]
  24. ERU. Roční Zpráva o Provozu ES ČR.; ERU: Prague, Czech, 2019. [Google Scholar]
  25. Ministerstvo Životního Prostředí Rámec v Oblasti Klimatu a Energetiky do Roku 2030. Available online: https://www.mzp.cz/cz/klimaticko_energeticky_ramec_2030 (accessed on 26 March 2020).
  26. Kočí, V. Na LCA Založené Srovnání Environmentálních Dopadů Obnovitelných Zdrojů Energie; ECO Trend Research Centre s.r.o.: Prague, Czech Republic, 2012. [Google Scholar]
  27. Sphera: Life Cycle Assessment LCA Software. Available online: https://sphera.com/insights/what-is-a-life-cycle-assessment-lca/ (accessed on 25 March 2020).
  28. Ecoinvent: The Ecoinvent Database. 2019. Available online: https://www.ecoinvent.org/ (accessed on 25 March 2020).
  29. Capello, C.; Homlquist, L.; Le-Boulch, D.; Frischknecht, R.; Raadal, H.; Setterwall, C.; Ekhagen, M. Product Group Classification: UN CPC 171 and 173 Electricity, Steam and Hot/Cold Water Generation and Distribution; EPD: Prague, Czech Republic, 2015; p. 50.
  30. Fthenakis, V.M.; Kim, H.C. Photovoltaics: Life-cycle analyses. Sol. Energy 2011, 85, 1609–1628. [Google Scholar] [CrossRef]
  31. Černá, L.; Kudláček, I.; Finsterle, T.; Hrzina, P.; Benda, V.; Šutka, J. Ekonomická Bilance Výroby a Likvidace Fotovoltaických Modulů Instalovaných v ČR.; Vypracováno pro REsolars.r.o.: Prague, Czech Republic, 2015. [Google Scholar]
  32. Vestas V52-850,00 kW-Wind Turbine. Available online: https://en.wind-turbine-models.com/turbines/71-vestas-v52 (accessed on 20 September 2020).
  33. Envis Veterný Park Vráble-Správa o Hodnotení; CE Energy, s.r.o.: Prague, Czech Republic, 2008.
  34. Fortum Demolition of Inkoo Coal-Fired Power Plant Turns Waste into Raw Materials|Fortum. Available online: https://www.fortum.com/demolition-inkoo-coal-fired-power-plant-turns-waste-raw-materials (accessed on 25 March 2020).
  35. Spath, P.L.; Mann, M.K.; Kerr, D.R. Life Cycle Assessment of Coal-Fired Power Production; National Renewable Energy Lab.: Golden, CO, USA, 1999.
  36. Wambach, K. Life Cycle Inventory of Current Photovoltaic Module Recycling Life Cycle Inventory of Current Photovoltaic Module Recycling Processes in Europe; The United States Department of Energy and Electric Power Research Institute: Washington, DC, USA, 2017; ISBN 978-3-906042-67-1. [Google Scholar]
  37. ČSÚ Produkce, Využití a Odstranění Odpadů-2017. Available online: https://www.czso.cz/csu/czso/produkce-vyuziti-a-odstraneni-odpadu-2017 (accessed on 3 February 2020).
  38. Huang, J.; Mendoza, B.; Daniel, J.S.; Nielsen, C.J.; Rotstayn, L.; Wild, O. Anthropogenic and Natural Radiative Forcing. In Climate Change 2013: The Physical Science Basis. Contribution of Working Group I to the Fifth Assessment Report of the Intergovernmental Panel on Climate Change; Cambridge University Press: Cambridge, UK, 2013; pp. 659–740. [Google Scholar] [CrossRef]
  39. Guinée, J. Handbook on Life Cycle Assessment Operational Guide to the ISO Standards; Springer: Dordrecht, The Netherlands, 2002; ISBN 978-1-4020-0228-1. [Google Scholar]
  40. UNEP. UNEP-Life Cycle Iniciative Global Guidance for Life Cycle Impact Assessment Indicators; UNEP: Nairobi, Kenya, 2016. [Google Scholar]
  41. World Nuclear Association. Comparison of Lifecycle Greenhouse Gas Emissions of Various Electricity Generation Sources. WNNA Rep. 2011, 1–10. [Google Scholar] [CrossRef]
  42. Dones, R.; Heck, T.; Emmenegger, M.F.; Jungbluth, N. Life cycle inventories for the nuclear and natural gas energy systems and examples of uncerteinzy analysis. Int. J. Life Cycle Assess. 2004, 10, 10–23. [Google Scholar] [CrossRef]
  43. Wang, L.; Wang, Y.; Du, H.; Zuo, J.; Yi Man Li, R.; Zhou, Z.; Bi, F.; Garvlehn, M.P. A comparative life-cycle assessment of hydro-, nuclear and wind power: A China study. Appl. Energy 2019, 249, 37–45. [Google Scholar] [CrossRef]
  44. Gerbinet, S.; Belboom, S.; Léonard, A. Life Cycle Analysis (LCA) of photovoltaic panels: A review. Renew. Sustain. Energy Rev. 2014, 38, 747–753. [Google Scholar] [CrossRef]
  45. Stamford, L.; Azapagic, A. Environmental Impacts of Photovoltaics: The Effects of Technological Improvements and Transfer of Manufacturing from Europe to China. Energy Technol. 2018, 6, 1148–1160. [Google Scholar] [CrossRef]
  46. Mekonnen, M.M.; Gerbens-Leenes, P.W.; Hoekstra, A.Y. The consumptive water footprint of electricity and heat: A global assessment. Environ. Sci. Water Res. Technol. 2015, 1, 285–297. [Google Scholar] [CrossRef]
  47. Jin, Y.; Behrens, P.; Tukker, A.; Scherer, L. Water use of electricity technologies: A global meta-analysis. Renew. Sustain. Energy Rev. 2019, 115, 109391. [Google Scholar] [CrossRef]
  48. Water Footprint. Available online: https://waterfootprint.org/en/water-footprint/ (accessed on 24 April 2020).
Figure 1. The system boundaries applied in the study.
Energies 13 05833 g001
Figure 2. Environmental impacts of selected types of energy sources on the climate change category. The results are related to 1 kWh of electricity supplied to the grid. The results are expressed in kg CO2 equivalent.
Energies 13 05833 g002
Figure 3. Contributions of the various life cycle phases (construction, operation and decommissioning) of energy sources to the climate change category. Environmental benefits excluded.
Energies 13 05833 g003
Figure 4. Environmental impacts of selected energy sources on the resource use, energy carriers category. The results related to 1 kWh of electricity supplied to the grid. The results are expressed in MJ of primary energy.
Energies 13 05833 g004
Figure 5. Contributions of the various life cycle phases (construction, operation and decommissioning) of electricity sources to the resource use, energy carriers category. Environmental benefits excluded.
Energies 13 05833 g005
Figure 6. Environmental impacts of selected energy sources on the resource use, mineral and metals category. The results relate to 1 kWh of electricity supplied to the grid. The results are expressed in kg of antimony equivalent.
Energies 13 05833 g006
Figure 7. Contributions of the various life cycle phases (construction, operation and decommissioning) of electricity sources to the resource use, minerals and metals category. Environmental benefits excluded.
Energies 13 05833 g007
Figure 8. Environmental impacts of selected energy sources on the water scarcity category. The results relate to 1 kWh of electricity supplied to the grid. The results are expressed in m3 world equivalent.
Energies 13 05833 g008
Figure 9. Contributions of the various life cycle phases (construction, operation and decommissioning) of electricity sources to the water scarcity category. Environmental benefits excluded.
Energies 13 05833 g009
Figure 10. Environmental impacts of selected energy sources on the particulate matter category. The results relate to 1 kWh of electricity supplied to the grid. The results are expressed in the number of disease incidents.
Energies 13 05833 g010
Figure 11. Contributions of the various life cycle phases (construction, operation and decommissioning) of electricity sources to respiratory inorganics. Environmental benefits excluded.
Energies 13 05833 g011
Table 1. Overview of electricity production in the Czech Republic in the period 2015–2018 based on the energy sources and technologies considered in the presented study [24].
Energy Source2015 (GWh)2016 (GWh)2017 (GWh)2018 (GWh)The Average Share of TotalNumber of Case Studies
Black coal51,6565720445334555%1
Lignite35,945322836,97837,73443%2
Natural gas19783422338834884%1
Nuclear power26,84124,10428,34029,92132%2
Hydropower30713202304026794%8
Solar energy22642132219323403%6
Wind energy5734975916091%2
Other80527997805477769%0
Total83,88883,30287,03888,002100%22
1–10 MWe1
Table 2. Evaluated energy sources and installed capacities.
Energy SourceInstalled CapacityNumber of Case StudiesComment
Lignite sub-critical steam power plantover 300 MWe2Lignite power plants are very similar (subcritical steam power plant) in the Czech Republic. Therefore, we chose one older and one newer power plant for the assessment.
Black coal-fired steam power plantover 300 MWe1Black coal-fired power plants are very similar in the Czech Republic. For this reason, only one energy source was evaluated.
Natural gas combined cycle plant (NGCC)over 300 MWe1We included all the energy sources that works in the Czech Republic.
Nuclear power plants with pressurized water reactor (PWR/VVER)over 300 MWe2We included all the energy sources that work in the Czech Republic.
Hydroelectric power plantsbelow 1 MWe2We assessed more case studies, because there are a large number of different types of hydropower plants differing in gradient, location, type of power plant in the Czech Republic. Therefore, we expected variability in results.
1–10 MWe2
10–100 MWe2
100–300 MWe1
over 300 MWe1
Wind turbines1–10 MWe2We chose one older and one newer power plant for the assessment.
Photovoltaic plantsbelow 1 MWe5We assessed several case studies in different locations (in a field, on the roof of a house, on the wall of a house) and with various types of photovoltaic (PV) panels (polycrystalline, monocrystalline, cadmium-tellurium). Therefore, we expected variability in the results.
Table 3. The considered life-times of electricity sources according to the Product Category Rules Methodology [29].
Energy SourcePower PlantLife-Time (Years)
Lignite/Black Coal/Natural gasSubcritical steam power plants, Natural gas combined cycle (NGCC)40
NuclearNuclear power plant with a pressurized water reactor (PWR)60
WaterHydroelectric power plants60
WindWind turbines20
SolarPV plants30
Publisher’s Note: MDPI stays neutral with regard to jurisdictional claims in published maps and institutional affiliations.

