Article

Mutual Interaction between Temperature and DO Set Point on AOB and NOB Activity during Shortcut Nitrification in a Sequencing Batch Reactor in Terms of Energy Consumption Optimization

by
Mehdi Sharif Shourjeh
1,
Przemysław Kowal
1,
Jakub Drewnowski
1,*,
Bartosz Szeląg
2,
Aleksandra Szaja
3 and
Grzegorz Łagód
3,*
1
Faculty of Civil and Environmental Engineering, Gdansk University of Technology, Narutowicza 11/12, 80-233 Gdansk, Poland
2
Faculty of Environmental, Geomatic and Energy Engineering, Kielce University of Technology, Tysiąclecia Państwa Polskiego 7, 25-314 Kielce, Poland
3
Faculty of Environmental Engineering, Lublin University of Technology, Nadbystrzycka 40B, 20-618 Lublin, Poland
*
Authors to whom correspondence should be addressed.
Energies 2020, 13(21), 5808; https://doi.org/10.3390/en13215808
Submission received: 24 September 2020 / Revised: 29 October 2020 / Accepted: 3 November 2020 / Published: 6 November 2020
(This article belongs to the Collection Feature Papers in Bio-Energy)

Abstract

:
Recently, many wastewater treatment plants (WWTPs) have had to deal with serious problems related to the restrictive requirements regarding the effluent quality, as well as significant energy consumption associated with it. In this situation, mainstream deammonification and/or shortened nitrification-denitrification via nitrite (so-called “nitrite shunt”) is a new promising strategy. This study shows the mechanisms and operating conditions (e.g., dissolved oxygen (DO) concentration, temp.), leading to the complete domination of ammonium oxidizing bacteria (AOB) over nitrite oxidizing bacteria (NOB) under aerobic conditions. Its successful application as shortcut nitrification in the sequencing batch reactor (SBR) technology will represent a paradigm shift for the wastewater industry, offering the opportunity for efficient wastewater treatment, energy-neutral or even energy-positive facilities, and substantial reductions in treatment costs. In this study, under low and moderate temperatures (10–16 °C), averaged DO concentrations (0.7 mg O2/L) were preferable to ensure beneficial AOB activity over NOB, by maintaining reasonable energy consumption. Elevated temperatures (~30 °C), as well as increased DO concentration, were recognized as beneficial for the NOB activity stimulation, thus under such conditions, the DO limitation seems to be a more prospective approach.

1. Introduction

Recently, many wastewater treatment plants have to deal with serious problems related to restrictive requirements regarding the effluent quality, as well as the associated significant energy consumption. Additionally, the global and progressive climate concerns connected with the depletion of fossil fuel resources and increasing energy demand resulted in a growing interest in the field of an energy optimization at many wastewater treatment plants (WWTPs). It is well known that WWTPs are one of the largest municipalities of energy consumption [1,2]. However, apart from the environmental issue, the financial aspect should also be considered [3]. The energy consumption for a conventional WWTP constitutes about 25–60% of the operating costs of treatment [4,5,6]. As compared to the EU countries, the electricity consumption at Polish WWTPs represents a significant value, which is estimated at 0.2–1.5 kWh for each 1 m3 of treated wastewater [7].
In this context, aeration is widely recognized as the most energy-consuming process at many WWTPs, corresponding to about 45–75% of total energy costs [8,9]. Especially, the biological nitrogen removal realized through a conventional nitrification-denitrification process is recognized as an unprofitable and ineffective solution [10,11]. Therefore, the innovative nitrogen removal technologies are gaining more attention. Most of them are based on the phenomenon of “competition ammonium oxidizing bacteria (AOB) and nitrite oxidizing bacteria (NOB)” [12]. This group includes, among others, the ANAMMOX process. Therein, the ammonium nitrogen and the NO2-N (in the ratio of 1:1.3) are transformed into molecular nitrogen (~90%) and nitrates (~10%) involving autotrophic microorganisms Planctomycetales (anammox bacteria) without external carbon source addition [12,13]. This autotrophic process has commonly been applied as an efficient tool for nitrogen removal from high strength ammonia wastewater [14]. Interestingly, the deammonification process has also been developed in recent years. This technology is a combination of two well-described processes: Partial nitrification and anammox. In the first step, ammonium is partially oxidized to nitrite under aerobic conditions by the AOB bacteria. Subsequently, in the second step, the Anammox bacteria (AMB) oxidized the remaining ammonium to nitrogen gas involving nitrite as electron acceptor [15,16]. The implementation of this strategy presents several advantages over the conventional nitrification-denitrification process. One of the most important features is a significant reduction of the energy demand for aeration (~60%) [12]. It is estimated that this strategy led to a major decrease in energy consumption, from 2.4 kWh/kg under conventional process to 1 kWh/kg within partial nitritation/anammox (deammonification) PN/A technology [17,18]. Importantly, the level of overall energy demand within the conventional method is estimated at around 30 kWh/PE·year, which is almost twice higher than that in the deammonification method by 17 kWh/PE∙year. Other benefits are low sludge production (reduced by 90%) and avoiding the contribution of organic carbon sources as compared to other biological processes [19,20].
In recent years, in order to optimize the WWTPs performance, various methods, such as technological study and/or statistical analysis, as well as advanced dynamic mathematical models (ASMs), have been evaluated [21,22,23]. In particular, the latter tool is considered as an inherent part of the design and operation of many WWTPs. It assesses and predicts the biological nutrient removal processes. Moreover, ASM models allow a better understanding of the transformations that occurred through the process and rapid response to these [24,25]. Therefore, this approach contributes to reducing the wastewater treatment costs, as well as improving the process efficiency [22,26]. It has been applied to improve the energetic balance at WWTPs [9,27]. Jenni et al. [28] also showed that sludge retention time (SRT) has a significant impact on the PN/A process. When the anammox activity decreased with increasing chemical oxygen demand (COD) concentration, it was enhanced by increasing the SRT with 160 mg NH4-N/L/d to 220 mg NH4-N/L/d. Another important aspect of the PN/A technology is the selection of the system configuration, i.e., single vs. two-stage reactors. Most of the available studies were performed in a single-stage, preferred because of relatively low operational and infrastructure costs [29]. However, single-stage reactors are highly susceptible to the COD available in the influent wastewater, the high load of which leads to decreases of the nitrifying as well as anammox bacteria activity [30]. Separation of the COD removal from the PN and anammox processes in the two-step systems seems to be a prospective solution to such issues. In terms of the successful two-stage systems maintenance, a critical point is the achievement of effective NOB suppression, due to the competition between NOB and AMB for nitrite, as well as the limitation of nitrate production, the removal of which increases the operational costs. In parallel, sustaining high AOB activity should be achieved. Recent studies revealed that high-rate PN could be stably achieved and maintained at low [31] and high temperatures [32] or different DO (dissolved oxygen) set points [33,34], as well as aeration strategies (continuous vs. intermittent) [35]. Nevertheless, most of the available references are the case studies focused on the overall system performance, or works showing the process advantages in the context of reducing the energy costs and the generation of greenhouse gases; however, complex investigations connected to the specific mutual effect of DO set point and temperature on AOB and NOB activity followed by sensitivity analysis are missing. Therefore, there is still a need to conduct research in this area, while the most favorable results are achieved by combining model, microbial and technological studies.
In this research, the evaluation of different aeration control strategies for cost-effective nitrogen removal was conducted involving a technological, as well as statistical analysis. The technological study was carried out using full-scale activated sludge from a sequencing batch reactor (SBR) located in Swarzewo WWTP and then tested in a laboratory special scientific unit equipped with double SBRs and online measurements. The obtained results from the technological study and statistical analysis show the mechanisms and operating conditions (dissolved oxygen (DO) concentration, temperature) which favor the AOB activity over NOB under aerobic conditions. The main objective of this study was to investigate the interaction between different operating factors that can successfully control the AOB-NOB competition for either nitrification or shortcut nitrification processes to significantly reduce the energy consumption and make the process more cost-effective, as compared to the conventional denitrification-nitrification (D/N) process.

2. Materials and Methods

2.1. Experimental Set-Up for Determination of the AOB and NOB Activity

In order to assess the AOB and NOB activity, a series of batch tests were carried out in a laboratory set-up consisting of two batch reactors with a working volume of 4 L each (Figure 1). The reactors were equipped with the systems for continuous monitoring of pH, temperature (sensor SenTix®, WTW, Germany) and automatic control of DO set point managed by CellOx® 325 sensors (WTW, Germany) cooperated with air pump and airflow valve by the management of the main controller.
The activated sludge used in the experiments originated from the local biological nutrient removal (BNR) Swarzewo WWTP, which involves mechanical, biological, and chemical treatments.
In the present study, two series of batch tests were conducted with different nitrogen sources. In the first one, ammonium nitrogen was applied to determine the activity of AOBs followed by NOBs (under limited substrate availability for NOBs, due to waiting for subsequent nitrification step). In turn, in the second one, nitrite nitrogen was directly supplied to the system to establish the NOB activity under high substrate availability. The concentration of the biomass during the experiments was maintained within the range from 2.1 to 2.5 gMLVSS/m3.
The batch tests within both series were conducted in parallel, in the experimental set-up described at the beginning of the M&M section. During particular experimental runs, one of the reactors was supplied with ammonium (Series 1), while the second with nitrite (Series 2), at the same combination of temperature and DO set point. Each batch test was performed as a single trial. Throughout the following experiments, combinations of three temperatures (30 °C, 16 °C, and 10 °C) and four dissolved oxygen (DO) set points (0.5; 0.7; 1.0 g and 1.5 mg O2/L), have been provided to assess the nitrifying bacteria activity under the specified conditions. Actual DO profiles and averaged DO concentrations during the following batch tests were summarized in the Supplementary Materials (Figures S3 and S4, and Tables S1 and S2, respectively).
The AOB and NOB activities were examined on the basis of ammonium utilization rate (AUR), nitrite utilization rate (NiUR), and nitrate production rate (NPR). Therein, a decrease in the concentration of ammonium and nitrite nitrogen, as well as an increase of nitrate nitrogen over time, were measured. In order to estimate the rates of nitrification processes, the following equations were used:
AUR = slope ( S NH 4 ,   t 1 S NH 4 ,   t 2 ) t · X ,   mg   N / g   vss · h
NiUR = slope ( S NO 2 ,   t 1 S NO 2 ,   t 2 ) t · X , mg N g vss · h
NPR = slope ( S NO 3 ,   t 1 S NO 3 ,   t 2 ) t · X , mg   N / g   vss · h
where SNH4-N—concentration of ammonium nitrogen after time t1 or t2 (mg N/L), SNO2-N—concentration of nitrite nitrogen after time t1 or t2 (mg N/L), SNO3-N—concentration of nitrate nitrogen after time t1 or t2 (mg N/L), △t—difference between the end time (t2) and the initial time (t1) of the measurement (h), X—concentration of organic fraction of activated sludge (g dried mass/L).
At the beginning of each test, the ammonium (Series 1) or nitrite (Series 2) nitrogen concentration was increased to approximately 20 mg N/L by the addition of 305 mg of NH4Cl or 394.29 mg of NaNO2 to the 4 L of the working volume of the reactor. Adequate alkalinity was ensured by the application of 3 moles NaHCO3 per each gram of the nitrogen added. The basic criterion to select the N concentration at 20 mg/L for batch tests, was the average ammonium nitrogen concentration specific for the initial stage of the SBR cycle in the full-scale WWTP, from which the experimental biomass originated.
In accordance with the DO profiles against time, the oxygen uptake rates (OUR) were estimated by the calculation of decreasing slopes of DO (△DO/△t), where the aeration pump was turned off. Afterward, by plotting the OUR values against time, the maximum value for OUR ( OUR max ) could be achieved. The energy demand per hour at the particular experimental conditions was estimated based on a simplified:
E = OURmax oxygen   supply   ·   air   pump   power ,   W / h
where E—energy consumption (W) per hour, OURmax—maximal oxygen utilization rate (mg O2/L h), oxygen supply—air pump efficiency recalculated in relation to a single liter of the reactor (547 mg O2/L h), air pump power—8 watts.
Total energy demand was estimated based on the time required for the complete substrate consumption at the particular process rate (under the defined experimental conditions) multiplied by unitary energy demand assessed from Equation (4), by using the following formula:
Total   E = C int AUR   or   NiUR   × E  
where Cint—initial substrate concentration, AUR-NiUR—process rate, E—energy demand per hour.

2.2. Analytical Methods

In order to control the process performance, mixed liquor samples were withdrawn from the batch reactor with a set frequency, and then filtered under vacuum pressure on Whatman GF/C. The concentrations of ammonia nitrogen (NH4-N), nitrate nitrogen (NO3-N), and nitrite nitrogen (NO2-N) were controlled with a Xion 500 spectrophotometer (Dr Lange GmbH, Germany) using the Hach analytical methods. In turn, the total nitrogen concentration was examined by means of a Total Nitrogen Measuring Unit TNM-1 (Shimadzu, Japan). Mixed liquor suspended solids (MLSS) and mixed liquor volatile suspended solids (MLVSS) in the reactor were determined according to the Polish Standard Methods for the Examination of the Water and Wastewater Standards (PN-72/C-04559).

2.3. Microbiological Analysis

Due to the fact that all batch tests were performed within two following weeks, a fresh delivery (60 L) of the activated sludge from the Swarzewo WTTP was carried out at the beginning of each week. For metagenomic analysis, the uniformed sample of biomass from the storage tank was taken, in order to establish the bacterial community composition for each fresh sludge delivery. Thus, two biomass samples were subjected for further analysis. After collection, the biomass samples were kept in a sterile 100 mL tube at −20 °C prior to further analysis. DNA extraction from 100 mg of the biomass samples was performed in duplicate by means of FastDNA™ Spin Kit for Soil (MP Biomedicals, Santa Ana, CA, USA), in accordance with the manufacturer’s protocol. Genomic DNA was initially subjected to quality control by spectrophotometry at a 260/280 ratio and standardized to the concentration of 100 ng/μL. Subsequently, a DNA matrix was applied for the library preparation of the 16S rRNA gene V3–V4 region with the primers set 341F and 785R proposed by Klindworth et al. [36]. The sequencing reactions were carried out with a MiSeq sequencer (Illumina, Inc., San Diego, CA, USA) by an external contractor. The obtained pair-end reads were initially joined with a FASTQ joiner [37] and subjected to quality control with the FASTQ/A (at quality cut-off value = 20 and length ≤ 100 bp) [38] via Useqalaxy server [39]. The reads were screened for the chimera presence with a USEARCH 6.0 online tool [40]. Classification of the reads on each taxonomical level was carried out with the Silva NGS server [41] by using database release version 132 at the species similarity level of 90% and OTUs (operational taxonomic units) clustering at 97%. The data output from the Usegalaxy server were saved into FASTA files and uploaded to the MetaGenome Rapid Annotation Subsystems Technology (MG-RAST) [42]. The rates of processes (AUR, NPR, and NiUR) were divided by percentages of AOB and NOB, established during the microbial analysis, in order to assess the normalized activity of each bacterial group under the particular experimental conditions.

2.4. Statistical Analysis

2.4.1. Empirical Models

On the basis of the results of analyses conducted by Drewnowski et al. [43], the description of NH4-N = f(t), NO2-N = f(t), NO3-N = f(t) variability was performed with a proposed linear model having the following general form:
y = μ · x + b
For instance, in relation to NH4-N, NO2-N, NO3-N, Equations (7)–(9) assume the following forms:
NH 4 N = μ 1 · t + ( NH 4 N ) 0
NO 2 N = μ 2 · t + ( NO 2 N ) 0
NO 3 N = μ 3 · t + ( NO 3 N ) 0
where (NH4-N, NO2-N, NO3-N)0 are the initial values of the selected wastewater quality indices, t—time measured from the beginning of the process, μ1,2,3—empirical coefficients estimated with the least squares method, based on the results of the analyses by Drewnowski et al. [43], which can be written in the following form:
μ i = f ( DO , T )
Due to the lack of literature premises connected to Relationship (5), it was assumed that the ai values will be expressed using the second-degree polynomial function having the following form:
μ i = β 0 + β 1 · T + β 2 · DO + β 3 · T 2 + β 4 · DO 2 + β 5 · DO · T
where DO—oxygen concentration in the bioreactor, T—temperature in the bioreactor, β0,1,2,3,4,5—empirical coefficients estimated with the least square’s method. The STATISTICA 12 program was used to determine the empirical models described by Equations (6)–(11).

2.4.2. Local Sensitivity Analysis of the Models

The local sensitivity analysis constitutes an essential element of the model analyses. It is aimed at identifying the independent variables having a significant influence on the modeled process [44]. Moreover, it enables us to analyze the variability of the selected independent variables on the simulation results, which can be significant while optimizing the technological processes in wastewater treatment systems. On the basis of the designated models, the sensitivity coefficients (Sij) were calculated using the following equation:
S ij = y x · x 0 y
where: y x —values of derivatives in point x0; x, y—numerical values of dependent variables and model output.
In the practical analyses, the sensitivity coefficients Sij are determined at the stage of local sensitivity analyses in a narrow variability range. Using the obtained Sij values, the Sij = f(DO,T) relationships were designated and used to determine the areas susceptible (or characterized by low susceptibility) to the changes in the DO and T values. If the Sij values are lower than 0.25, it can be assumed that the selected independent variable has a negligible influence on the simulation results. In turn, when Sij > 1 then, according to the literature data [44], it can be stated that these variables have a significant influence on the calculation results.

3. Results

3.1. Microbial Community Composition of The Applied Biomass

The analyzed activated sludge samples showed a typical microbial community composition-specified for the biomass from the wastewater treatment plants [45], with predominant abundances of Proteobacteria (49.25% ± 3.50%), Bacteroidetes (15.42% ± 91%), Actinobacteria (10.26% ± 3.33%) and Firmicutes (6.67% ± 1.05%) phyla (Figure 2). The representatives of Acidobacteria, Chlorobi, Chloroflexi, Nitrospirae, and Planctomycetes remain an important, but less abundant, component of the microbial community (in a range of 1 to 5%). Around 4.90% of the obtained readouts of DNA sequences were unclassified.
AOB were exclusively represented by Nitrosomonas, while NOB by the members of the Nitrospira genus, at average share in the total microbial community of 2.73% ± 0.45% and 1.08% ± 0.21%, respectively (Table 1). The AOB/NOB ratio was maintained at a level of 2.5. The heterotrophic bacteria (HET) responsible for organic matter decomposition constituted a predominant component of the activated biomass, with the highest share (9.63% ± 0.73%) of the Saprospira related organisms. An important component of the heterotrophic bacteria was attributed to denitrifiers, with a predominance of Acidovorax, Comamonas, and Thermomonas genera representatives, the share of which ranged from 2 to 4%. Other abundant heterotrophs belonged to the Rhodanobacteraceae family and Terrimonas genus. Total contribution of HET was estimated at 86.0% ± 5.0%.

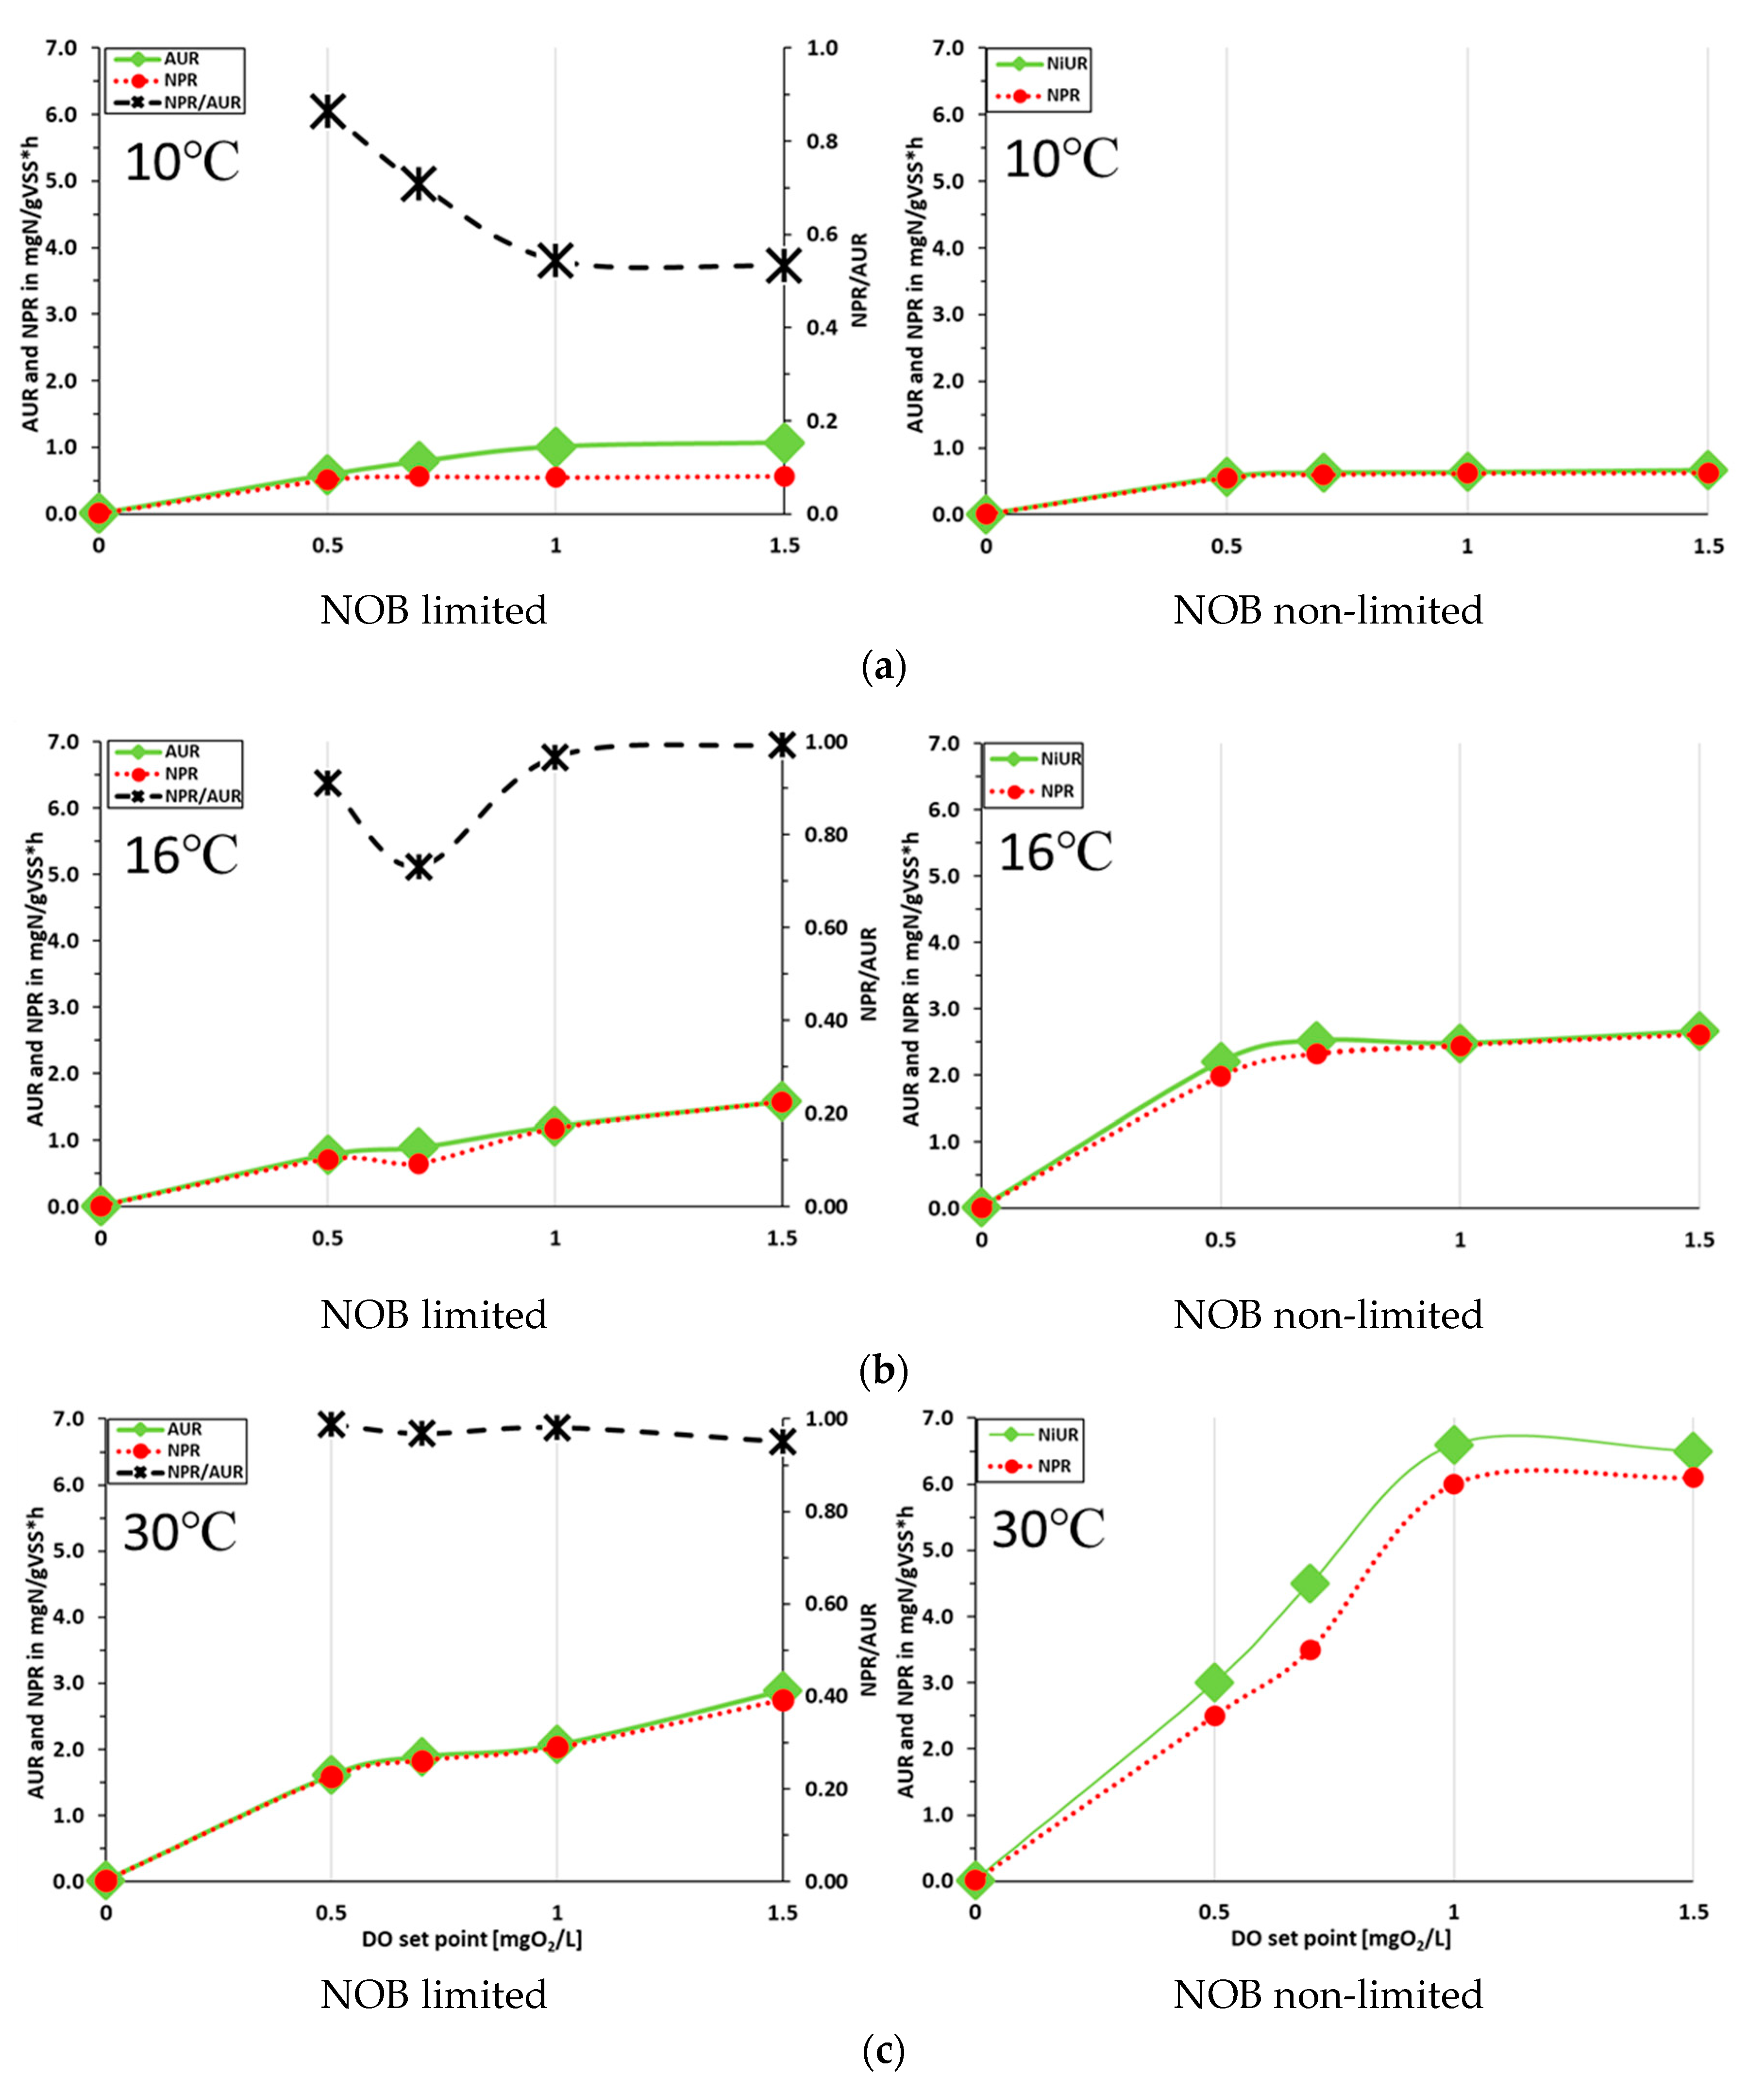
3.2. The Effect of DO and Temperature on the AOB and NOB Activity

The detailed results of the batch tests conducted with ammonium (Series 1) and nitrite (Series 2) as sole nitrogen sources were summarized in Table 2 and Table 3, respectively, while the raw data from each batch test were presented in the Supplementary Data (Figures S1 and S2). In addition, the AOB and NOB activity at a particular DO set point, as well as temperature, were visualized in Figure 3. At a temperature of 10 °C and DO = 0.5 mg O2/L, the AOB activity measured as the AUR value was 0.59 mg NH4-N/gVSS∙h and almost doubled (47% increase) up to 1.07 when the DO set point was elevated to 1.5 mg O2/L. The NOB activity, considered as a nitrate production rate with ammonium applied as a sole nitrogen source, under the same operational conditions increased slightly for around 10% from 0.51 to 0.57 mgNO3-N/gVSS∙h. The unbalance between both stages of nitrification was connected with the nitrite accumulation in the system, to the concentration of 0.5 mg NO2-N/L (Supplementary Data Figure S1).
An increase of the process temperature to 16 °C enhanced the ammonium utilization rate by around 21.1% (the AUR values ranged from 0.71 to 1.58 mgNH4-N/g∙VSS) in relation to the corresponding DO set points for batch tests at 10 °C. However, in opposition to the 10 °C, except the batch test at 0.7 mg O2/L, at least 91% of the ammonia was fully nitrified. Further temperature elevation to 30 °C improved the AUR rate by an additional 47.8%, on average, and promoted the completed nitrification irrespective of the applied DO set point. The observed AURs ranged from 1.61 to 2.59 NH4-N/g∙VSS. In terms of the Series 1 with ammonium as a sole nitrogen source, the applied DO concentration affected the AOB activity, which tended to double during the switch within the range from 0.5 to 1.5 mg O2/L. The highest accumulation of the nitrite in the system was observed for the batch tests under 1.0 mg O2/L, irrespective of the process temperature (Supplementary Data Figure S1).
During Series 2, where nitrite was added to assess the NOB activity under non-limited substrate availability, the process rates were induced to a greater extent, along with the temperature increase in comparison to the batch tests with ammonium (Figure 3). During the batch tests conducted at 10 °C, a similar pattern in terms of the NOB activity were obtained as in the case of Series 1 under limited substrate availability, by considering the NPR (Series 1) and NiUR values, which ranged from 0.51–0.57 mg NO3-N/gVSS∙h and 0.55–0.63 mg NO2-N/gVSS∙h, respectively. Along with the temperature rise from 10 °C to 16 °C, the NOB activity expressed as a NiUR enhanced by about four times to (2.21–2.61 mg NO2-N/gVSS∙h) and was twice higher in relation to the AOB activity under the same conditions (0.78–1.58 mg NH4-N/gVSS∙h). Temperature elevation to 30 °C caused a further doubling of the nitritation rates to the values of 3.01–6.62 mg NO2-N/gVSS∙h. Moreover, the NOB activity after the switch from 16 °C to 30 °C was strengthened in relation to AOB, by around three times.
The DO concentration increase during batch tests at the temperatures 10 °C and 16 °C was a less effective inducer of the NOB in comparison to the AOB activity measured under the same conditions within Series 1. By the modification of the DO set point from 0.5 to 1.5 mg O2/L, the nitritation process rate increased by approx. 12% and 17% at temperatures of 10 °C and 16 °C, respectively. However, at 30 °C after the transition from 0.7 to 1.0 mg O2/L NiUR almost doubled, as well. Further increase of the DO concentration did not promote the NOB activity.
For both lower temperatures (10 °C and 16 °C), nitrite was effectively converted to nitrate with the conversion efficiency, expressed as NPR/NiUR, at least 90%. The nitrate conversion efficiency was lower at DO set points 0.5 and 0.7 mg O2/L at 30 °C at around 80%; however, after an increase of DO to 1.0 mg O2/L, it returned back to the level above 90%.
Normalized AOB and NOB activity indicators (which considered contribution of the particular microbial group in the total bacterial community) under the defined temperature and DO set point, for both experimental series, were summarized in Table 4. The proposed calculations enabled to identify the operational conditions preferable for the NOB suppression, based on the selection of the lowest NOB/AOB activity ratios.

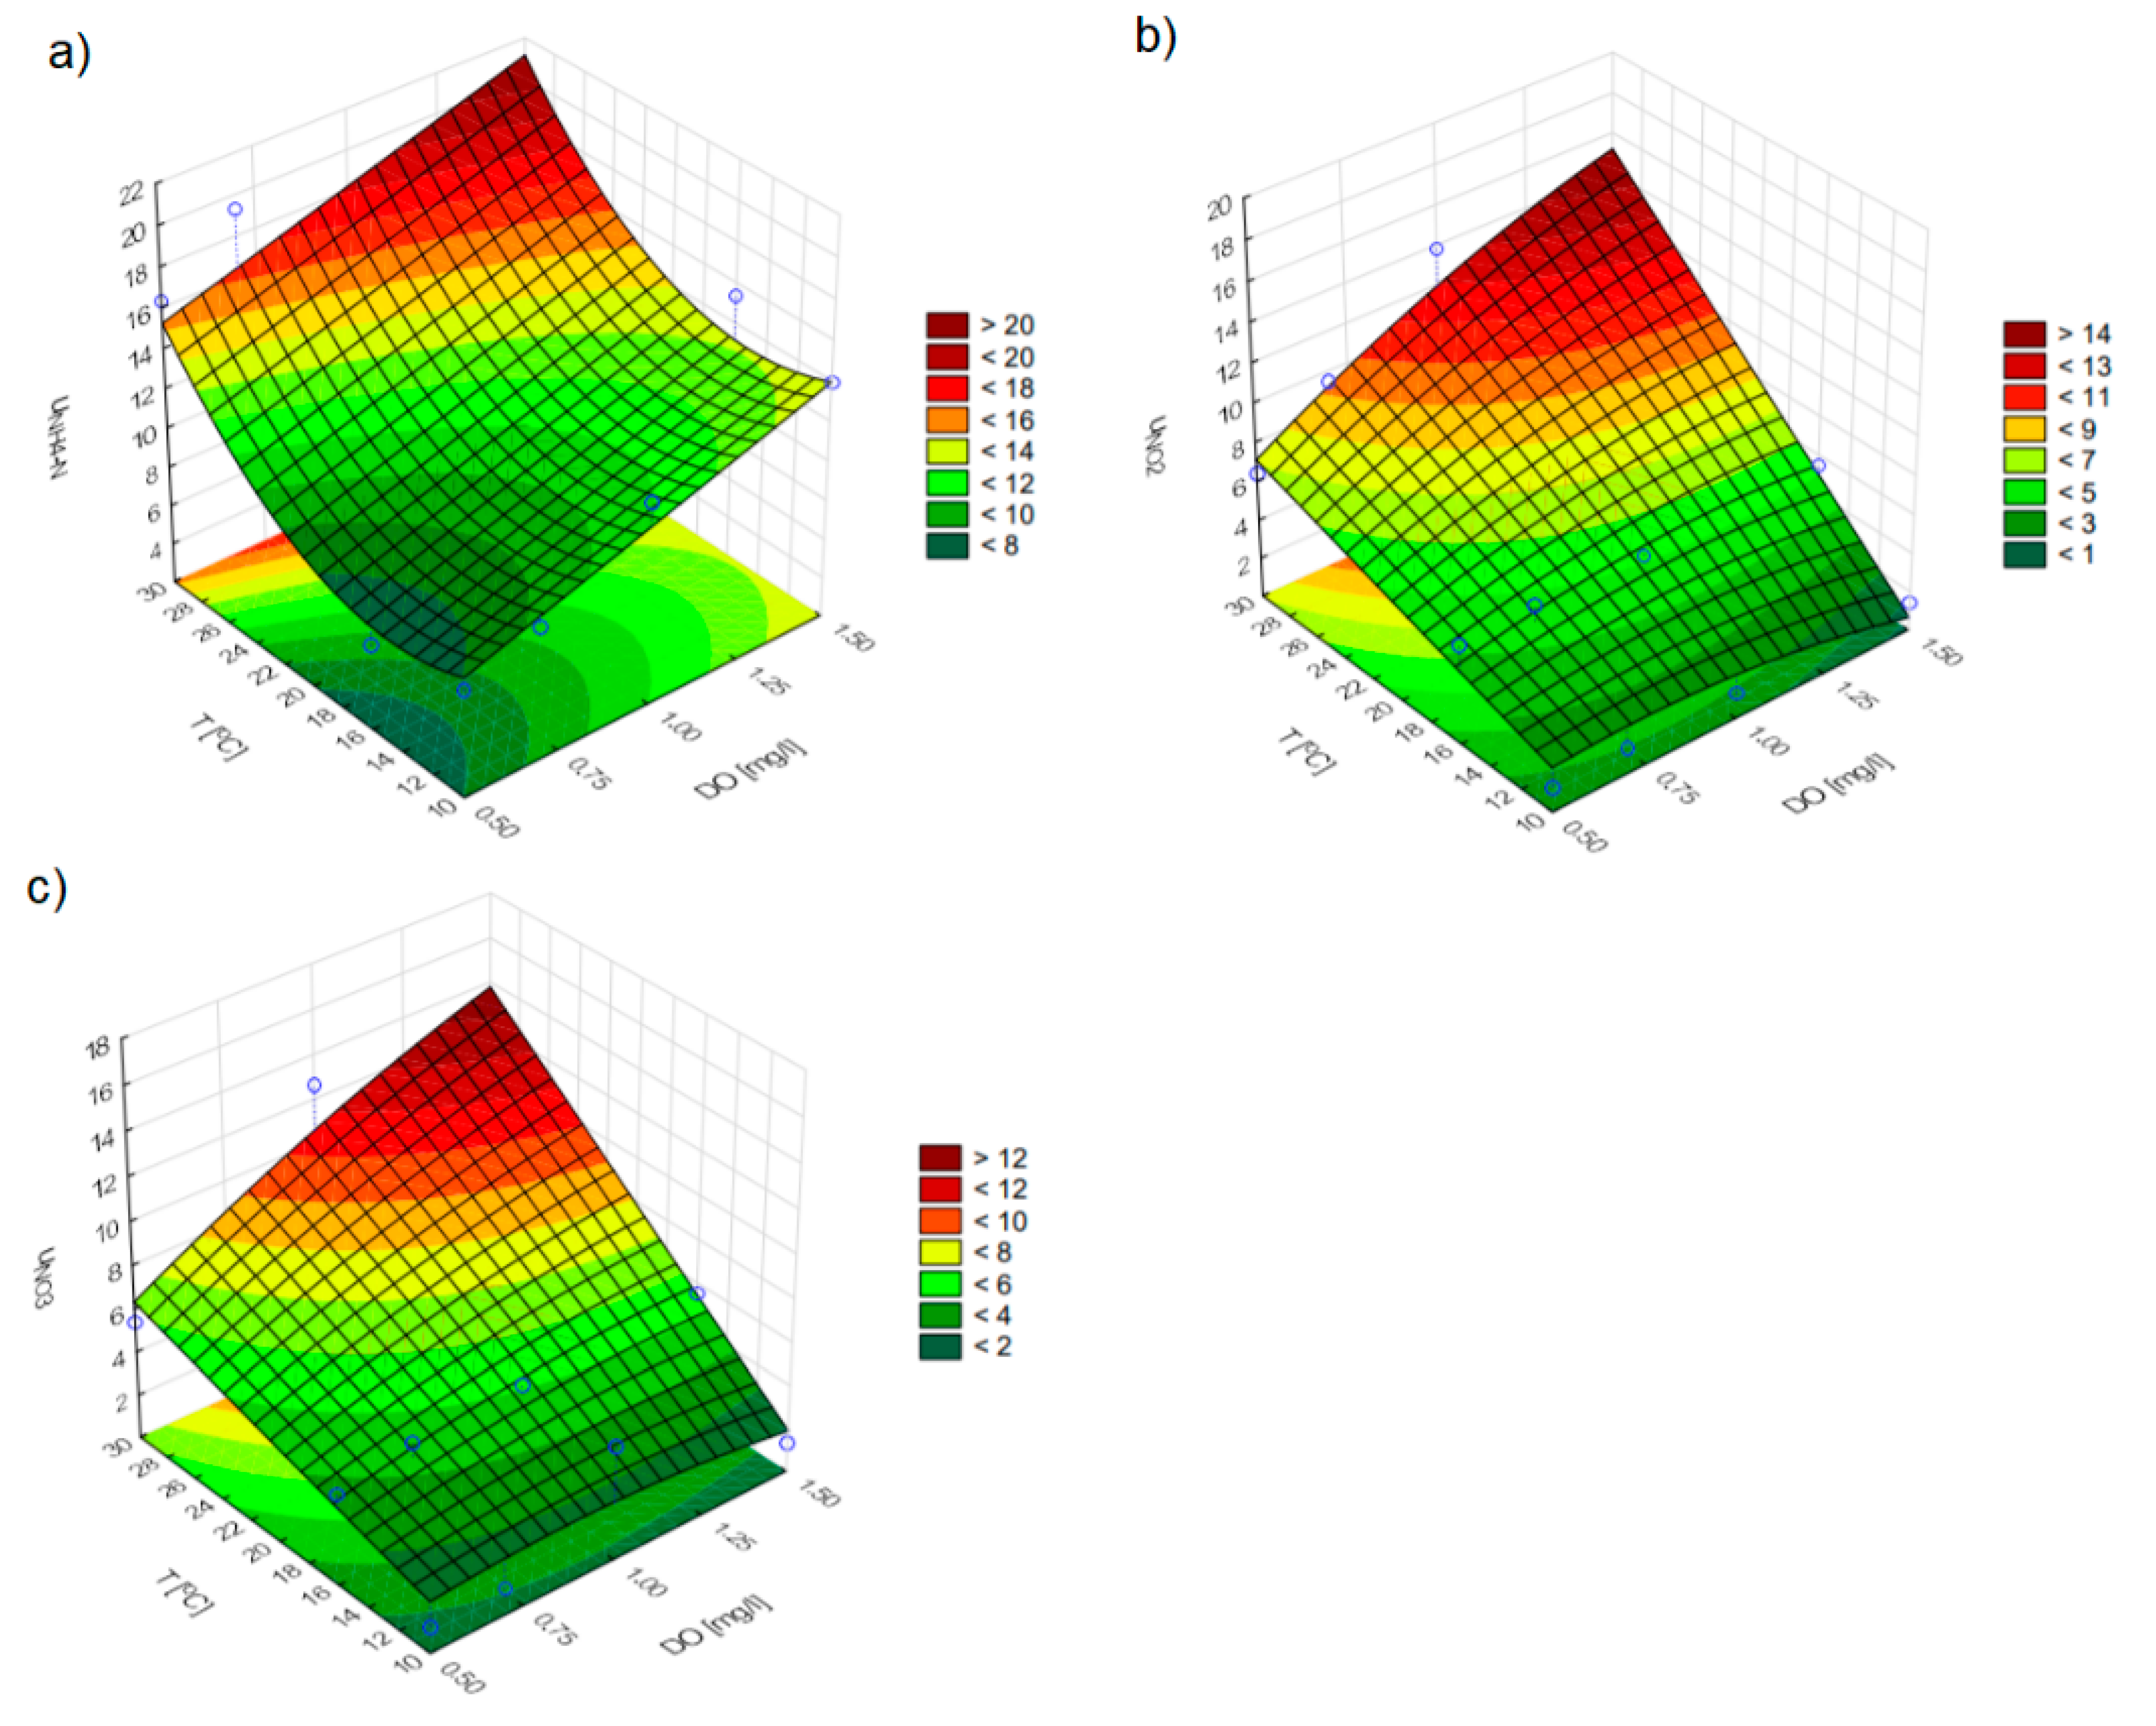
3.3. Analytical and Statistical Models of AOB/NOB Activity under Distinct Temperatures and DO

On the basis of the obtained results and the estimated curves, the models for NH4-N, NO2-N, and NO3-N predictions were calculated, described with Equations (13)–(15). Thus, the following relationships were designated for predicting μNH4-N, μNO2-N, and μNO3-N:
  • -AOB:
    μ NH 4 N = 5.909 · DO 1.049 · T + 0.035 · T 2 + 12.048   R 2 = 0.891
  • -NOB:
    μ NO 3 N = 14.116 · DO 8.934 · DO 2 + 0.386 · DO · T 5.246 R 2 = 0.932
    μ NO 2 N = 0.484 · DO · T 3.219 · DO 2 + 0.632   R 2 = 0.943
Involving Equations (13)–(15) in relation to (2), (3), and (4) further models for predicting the selected wastewater quality indices were designated:
  • -AOB:
    NH 4 N = ( 5.909 · DO 1.049 · T + 0.035 · T 2 + 12.048 ) · t + ( NH 4 N ) 0
  • -NOB:
    NO 2 N = ( 14.116 · DO 2 8.934 · DO 2 + 0.386 · DO · T 5.246 ) · t + ( NO 2 N ) 0
    NO 3 N = ( 0.396 · DO · T 2.205 · DO 2 + 0.925 ) · t + ( NO 3 N ) 0
In order to expand the obtained results, the curves illustrating Relations 11, 12, and 13 were drawn, which are shown in Figure 4a–c.
Since no regression relations were found for NO3-N (NOB) in connection with the investigated cases, the analyses were supplemented by studying the variability of μNO3-N (NOB) for different temperatures (T = 10 °C, T = 16 °C, T = 30 °C). The results of the analyses were presented in Figure 5.

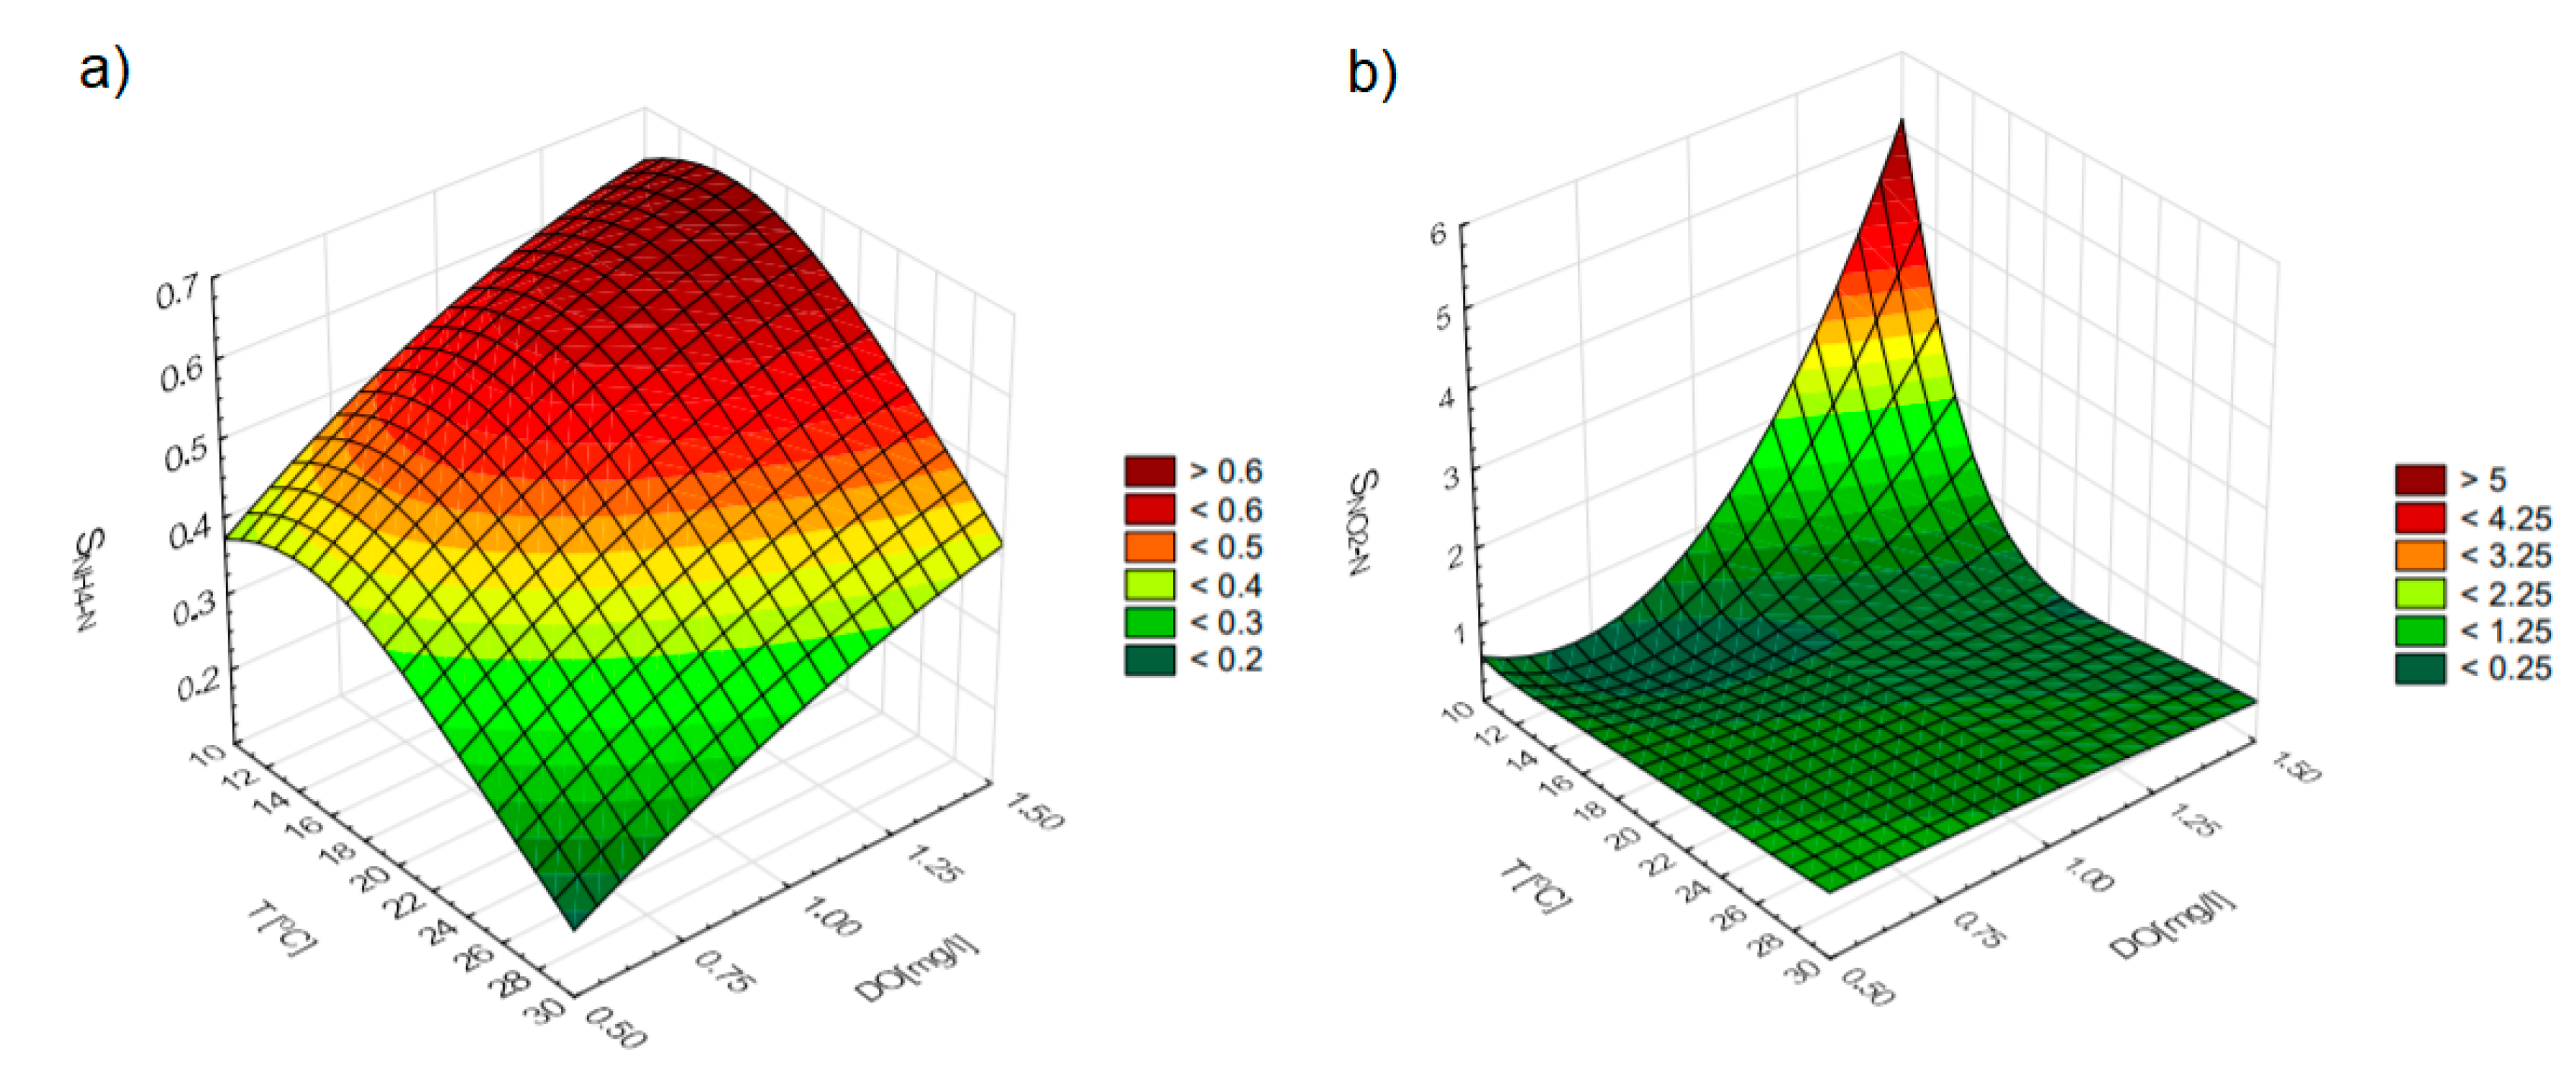
3.4. Sensitivity Analysis for the Designated Models for Forecasting NH4-N (AOB), NO2-N(NOB)

In order to expand the results of the conducted simulations and determine the conditions for which the change in the operational parameters (DO,T) has a significant influence on the process conditions, the values of sensitivity coefficients (Sij) were established. The results of calculations were illustrated with the SNH4-N = f(DO,T) and SNO2-N = f(DO,T) curves, presented in Figure 6a,b. This is essential from the point of view of the changes in the values of the selected operational parameters (DO) depending on temperature, which significantly affects the aeration of wastewater in a bioreactor.

4. Discussion

Nitrification is known as a two-stage process that takes place under aerobic conditions. In the first step, it is affected by the ammonium oxidizing organisms (bacteria (AOB) and/or archaea (AOA)), whereas the second one involves NOB. The whole process occurs according to the following reaction [46]:
NH4+ + 1.9 O2 + 0.069 CO2 + 0.017 HCO3 → 0.017 C5H7O2N + 0.98 NO2 + 0.97 H2O + 1.8 H+
On the basis of the presented equation, the theoretical oxygen required to oxidize ammonia is 4.57 g O2/gNH3-N, while 7.14 g alkalinity/gNH3-N is consumed. As compared to the conventional N/D process, the Partial Nitrification/Anammox (PN/A) process or another autotrophic process (involving the shortened AOB-NOB pathway) require up to 62.5% less oxygen and reduce the requirements for an external carbon source to 100%. Due to the fact that this process is classified as autotrophic, also biomass production can be significantly lower. The development of new technologies for removing nitrogen from the wastewater, based on the shortened nitrogen removal pathways, is considered as an energy-saving method, attractive for implementation by WWTPs operators. Compared with a conventional N/D method, the potential profits can be successfully achieved by inhibiting the NOB activity accompanied by enriching the AOB community during the nitrification process, which is followed by shortened denitrification or anammox processes. Thus, along with the elimination of strong competition between AOB and NOB for oxygen, lower costs for aeration system maintenance and carbon demand can be achieved. The NOB activity restriction is possible to obtain by the control of operational factors or the application of chemical mechanisms. However, a wide database about the specific activity of AOB and NOB under the defined conditions has to be provided in order to develop successful strategies for NOB suppression in the WWTPs systems.

4.1. AOB and NOB Activity in Terms of Different Do Set Points and Fixed Temperatures

The present study focused on the discrete and combined effects of DO and temperature changes on the activity of nitrifying bacteria under a lab-scale framework.
The activity measurements of AOB and NOB, expressed as AURs, NiURs, and NPRs, were expanded by the microbial community investigations and statistical modeling. An additional aspect considered in this study, was the identification of favorable conditions for the shortcut nitrification process in relation to the energy consumption demand. Statistical analysis and model predictions were applied for further process optimization.
During all experimental batch tests, an increase of the nitrification process rates—typical for biochemical processes—was obtained along with the temperature increase and enhanced DO availability [47]. Since the AOB-NOB metabolism is highly dependent on the available DO and temperature, the modification of each factor value is expected to be followed by the modulation in the activity rate of both nitrifying bacteria groups. However, the AOB and NOB responses to the modifications of the operational conditions reflected distinct patterns and sensitivities.
Along with a temperature increase from 10 °C to 16 °C (despite applied DO set point), averaged AOB activity raised by 21%. Under the same conditions, the NOB activity intensification amounted to 40% under limited substrate availability (tests with ammonia) and 75% when nitrite was available in non-limiting concentrations. Further temperature elevation stimulated the AOB activity by an additional 47%. In the case of the NOB activity, a similar modulation effect was observed despite the substrate availability, 48% for limited, and 50% for non-limited substrate conditions.
These findings suggest that NOB presented higher sensitivity to the lowered temperatures in relation to the AOB, and are in agreement with the previous studies, where the AOB activity was successfully retained even under the low temperature of 10 °C, while NOB was repressed under the DO concentrations higher than 3 mg/L [48].
Additionally, the greater contribution of the AOB over NOB in the total bacterial community, proven by 16S rRNA high-throughput sequencing, has to be considered. In the applied biomass reads, 2.73% of the total number of the DNA sequences was derived from the members of the Nitrosomonas genus, considered as the main group of AOB in natural and artificial ecosystems [49]. The number of the DNA sequences specified for NOB was slightly lower and accounted for 1.08% of the total bacterial community. The representatives of NOB were exclusively affiliated to the Nitrospira genus, well recognized predominant nitrite oxidizer in the WWTPs [50]. In accordance with the presented data, the NOB/AOB ratio in the analyzed system was 0.4, which is a commonly found value for activated sludge systems [51]. Thus, the AOB activity under low temperatures was possibly compensated, due to their higher abundance in relation to NOB.
The DO set point is considered as a key factor for controlling the NOB/AOB activity at the defined temperature [52]. In this study, the lowest disproportion between the NOB/AOB activity was observed at the lowest of the applied temperatures, i.e., 10 °C and tended to improve along with the increasing DO set point. The most beneficial NOB/AOB ratio at 10 °C was gained after the transition from the 0.7 to 1.0 mg O2/L, while further oxygen concentration increase did not ensure a proportional process improvement. Under these conditions, the DO concentration increment favored the AOB activity over NOB; moreover, NOB reflected rather stable activity, irrespective of the aeration system parameters. At temperatures of 16 °C and 30 °C and ammonium as a sole nitrogen source, the normalized process rate achieved by NOB reflected at least twice a greater rate in comparison to AOB irrespective of the applied DO concentration. In terms of the tests conducted at 30 °C, the NOB/AOB activity ratio was not affected by the DO set point adjustment, while at 16 °C the most beneficial conditions have been obtained for DO = 0.7 mg O2/L. Under non-limiting substrate availability for NOB, their nitrifying activity under 16 °C and 30 °C was further induced and exceeded AOB from four to eight times.
The obtained results revealed the requirement to adjust the DO concentration in relation to the process temperature for ensuring the shortened nitrogen removal pathway. It is particularly important, because the results of wide range of studies conducted at the moderate temperatures (15–25 °C), do not provide unambiguous conclusions. In the available data, the application of low [53], as well as high DO concentrations [54] have been proven as a valuable strategy for NOB suppression. For instance, in accordance with Laureni et al. [53], the application of the limited DO concentrations, as low as 0.17 mg O2/L, ensured effective NOB suppression at the T = 15.5 °C. Similar results were obtained by Blackburne et al. [33], for the higher temperature range (19–23 °C) and DO set point = 0.25 mg O2/L. Conversely, in the studies performed by Bellucci et al. [54], and no substantial differences between AUR at the low DO (0.5 mg/L) or high DO (3 mg/L) were found, while Zhu et al. [55] obtained only limited NOB suppression at DO concentration = 0.56 mg O2/L and under room temperature. In terms of the elevated DO concentrations, Bao et al. [56] observed partial NOB suppression after increasing the DO concentrations to 1.8 mg O2/L. On the other hand, Law et al. [57] achieved a complete NOB washout from the system by increasing the DO concentration up to 5.5 mg O2/L, which caused the completed washout of Nitrospira from the system.
There are few potential explanations of such inconsistency, as well as issues that have to be considered for the development of the successful NOB suppression strategies. For instance, the bacteria growth form affects the different response to the available DO concentration. In accordance with Blackburne et al. [33], oxygen availability and processes triggering between anaerobic/aerobic metabolism is affected by the type (granules vs. flocs) and morphological characteristics (flocs size and their distribution) of the applied biomass. An additional aspect that has to be considered, especially in the application of the actual wastewater, is the influence of the organic loading rate on the DO consumption and nitrifiers activity. Al-Hazmi et al. [30] revealed that the AUR value decreased along with the increase in the carbon to nitrogen (C/N) ratio. After an increase of the C/N ratio to 3, the nitrification process was inhibited. Moreover, a rearrangement of the bacterial community structure was observed, where the bacteria with dominant heterotrophic metabolism showed intensive growth, with a parallel decrease in the autotrophic bacteria ratio.
Another potential explanation of the discrepancies in the values of the AOB and NOB activity and the lack of specific relations in this study which should be taken into account is that, especially at low oxygen concentrations (0.5–0.7 mg O2/L), other metabolic pathways may be activated, mainly heterotrophic denitrification processes, or simply simultaneous N/D.
In addition, previous studies [29] showed that low DO set points favored NOB suppression, due to a higher oxygen affinity of AOB (Nitrosomonas related AOB are considered as an r-strategists), compared to NOB (Nitrospira-dominant NOB in this study is a K-strategist). However, recent studies suggested that the tight control of the oxygen supply, rather than the DO set point, may be critical for NOB suppression. This can be attributed, due to the lag phase of the NOB activity during the transition between the aerobic and anoxic conditions [35,58]. On the basis of this discovery, intermittent aeration seems to be the most attractive aeration strategy in order to suppress NOB in the novel nitrogen removal systems.
In order to overcome the potential ambiguity leading from the available data, further biochemical process optimization can be achieved by the implementation of the mathematical modeling and sensitivity analysis [59,60]. In this study, an empirical model was applied to examine the NH4-N, NO2-N, and NO3-N behavior at the expanded temperature range. The analysis revealed that at the temperature range of 10–18 °C, the NH4-N utilization rate was strongly correlated with the applied DO set point. Under the same conditions, the NOB activity was relatively lower in relation to the AOB (Figure 4a,b). In terms of the optimal DO concentration selection, the calculations of the empirical coefficients for the particular compound utilization (NH4-N, NO2-N)/production (NO3-N) rates have proven that under low and moderate temperatures, the highest potential for NOB suppression was obtained for DO = 0.7 mg O2/L (Figure 5). In terms of the elevated temperature (30 °C), the model proved a notable increase of the AOB and NOB activity; however, in contrast to the lowest range of the temperatures, an increase in the DO concentration promotes NOB over AOB.
The curves showing the changes in the values of the sensitivity coefficients (S) for the adopted temperatures (Figure 6a,b) were of great importance in the interpretation of the calculation results in terms of process control and its optimization. A sensitivity analysis in this study, revealed a mutual interaction between temperature and DO concentration on the AOB activity, at the wide range of the temperature. AOB reflected greater sensitivity to DO concentration under lower temperatures. Along with the temperature increase, the AOB sensitivity decreased; however, it still remained at a notable level. In contrast, NOB presented low sensitivity in relation to the available DO under elevated temperatures, while it was extremely susceptible when the temperature dropped below 14 °C.

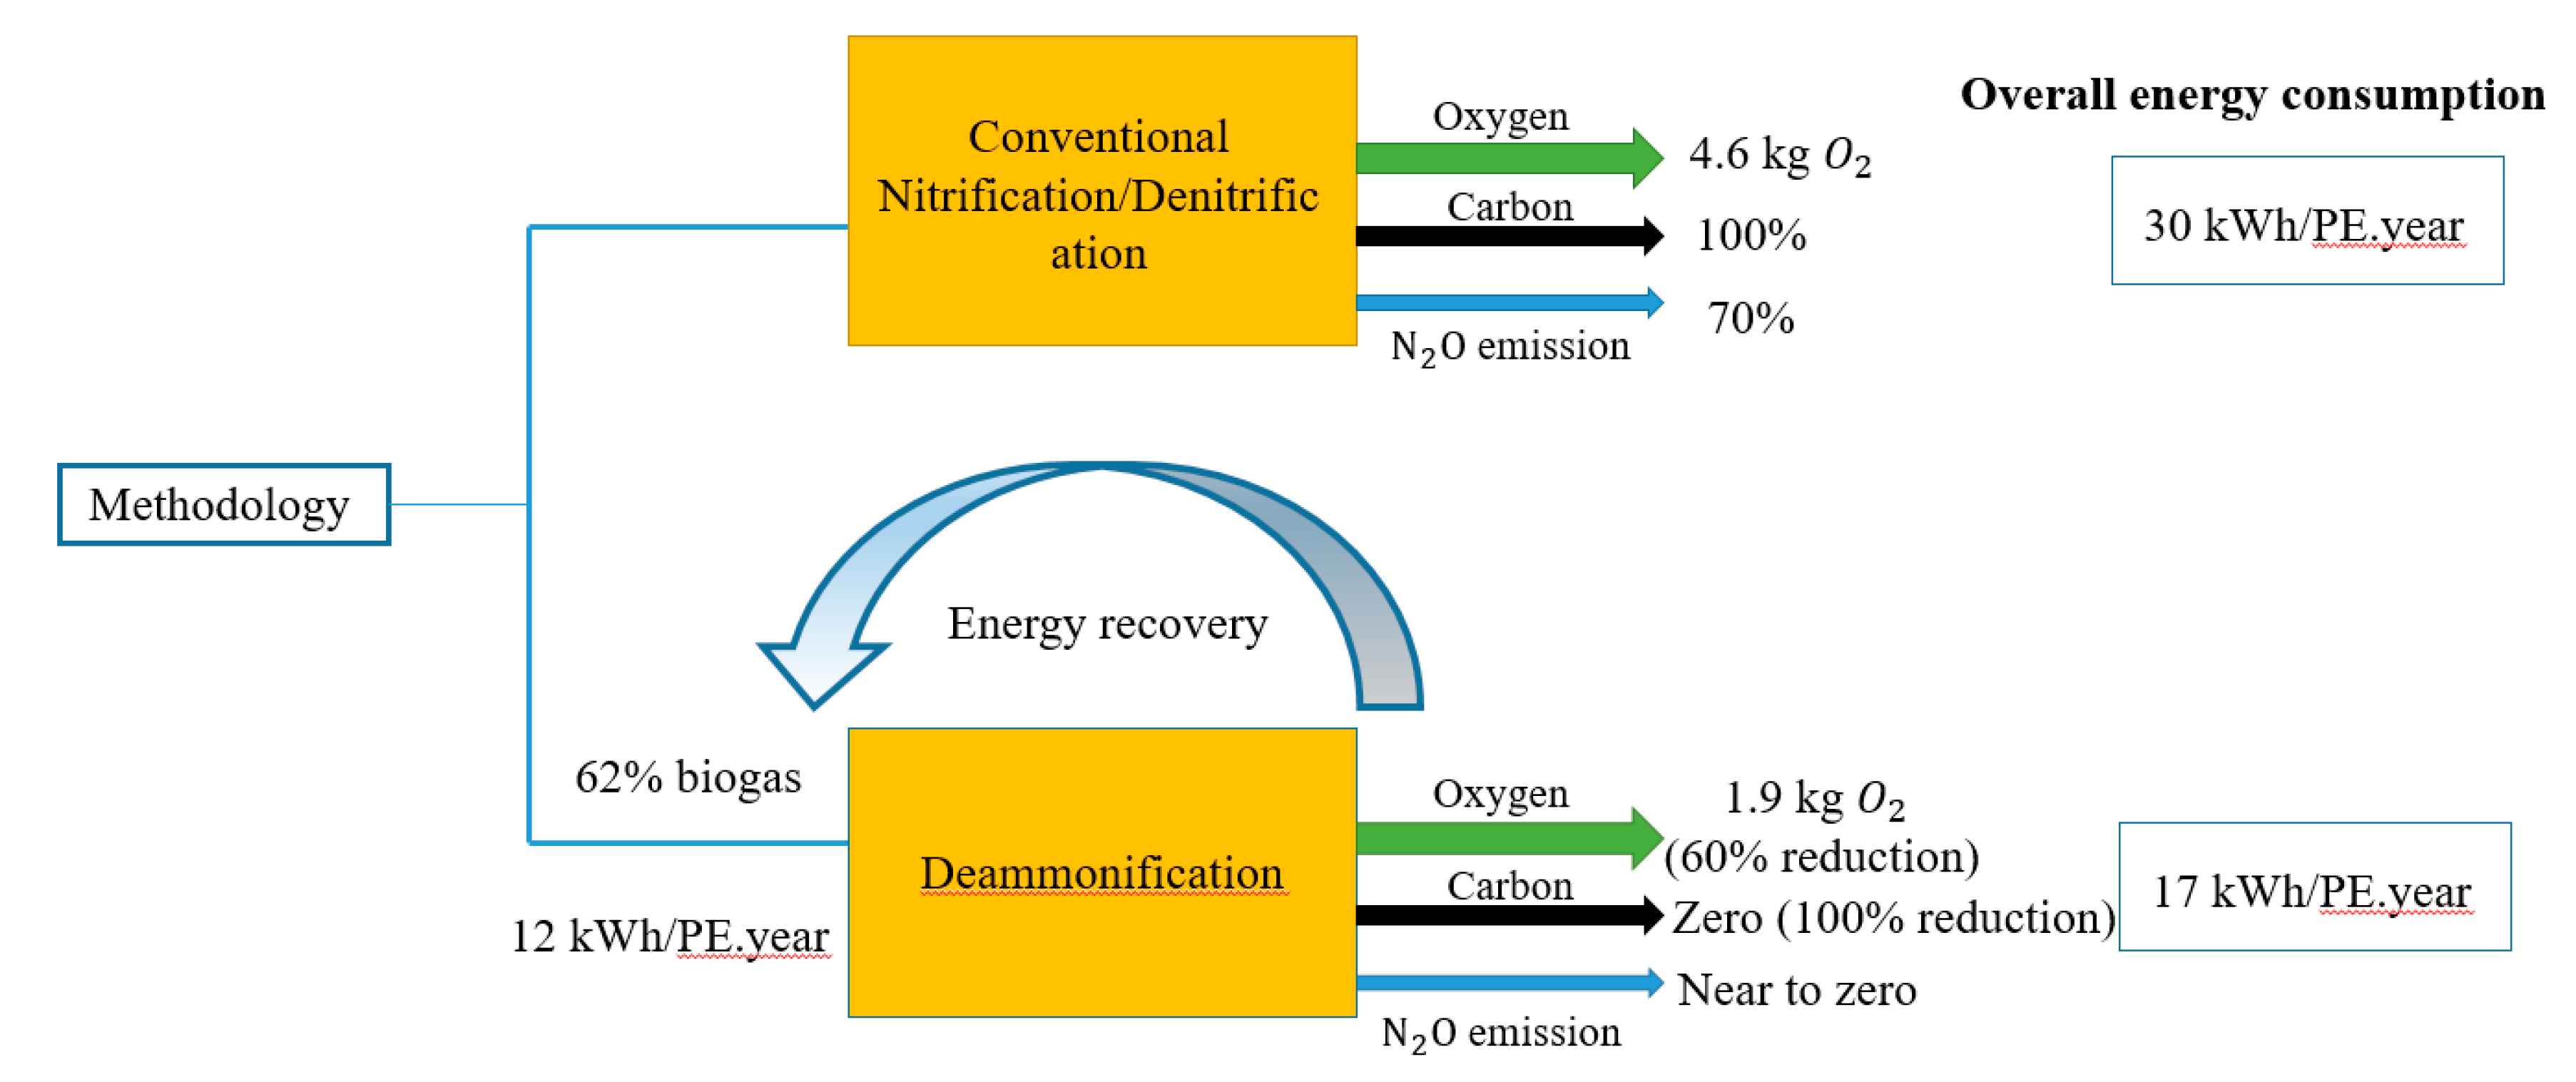
4.2. Energy Optimization by Aeration Strategy Control for Shortcut Nitrification Methods

The oxygen supply required for successful ammonium oxidation is considered as the main consumer of the energy at the WWTPs [61]. Implementation of the processes which rely on shortened nitrification, like partial nitrification combined with anammox (PN/A), seems to be promising a strategy in order to reduce the aeration demand. The popularity of PN/A, so-called “deammonification”, is highly developed for side-stream with high temperature and highly concentrated ammonium around 1 g N/L [15].
The OUR max factor in this study was employed to investigate the level of energy consumption by AOB and NOB within the nitrification and nitratation processes. On the basis of the OUR max values (Table 2 and Table 3), low and optimum quantities for operational factors are beneficial conditions for reducing the additional costs caused by oxygen utilization and energy consumption.
The highest total energy demand for system aeration in terms of series 1 was observed for the batch tests conducted at 16 °C (averaged E = 2.82 watt), which was around 2 to 3 times higher compared to the values specified for 10 °C (Eavg. = 1.15 watt) and 30 °C (averaged Eavg. = 1.49 watt). In turn, unitary energy demand, which was estimated based on the oxygen uptake rate, increased along with the DO concentration applied during the particular batch test. The total energy consumption connected to the nitrification process rate did not show unequivocal trends. In series 2, total energy demand constituted, on average, 23.8% ± 4.0% of the value estimated for series 1, independently of the temperature and applied DO set point. At temperatures of 10 °C and 16 °C, total energy demand has dropped slightly along with the elevation of DO set point, while at 30 °C, a sharp decrease was observed. Such a trend was connected to the relatively high nitritation process rates under those conditions.
While comparing the values of total energy demand between the series, the most energy efficient conditions in terms of AOB and NOB activity under various temperatures and DO set points have been identified. Despite the total energy demand itself, the crucial issue was to determine NOB contribution to the obtained values (Table S3). By comparing averaged values, the share of NOB activity in the total energy consumption was estimated in the range of 20.2 to 25.8%, and the most favorable outputs have been identified at 16 °C. However, by considering standard deviations from the averaged NOB contribution in energy consumption, there were not substantial differences between applied temperatures. Contrastingly, the applied DO set point seems to play a more important role in relation to the discussed issue. At the lowest from the analyzed temperatures (10 °C), NOB contribution in total energy demand decreased along with the increase of the available DO concertation, mainly due to the beneficial AOB activity. At the higher process temperatures, i.e., ≥16 °C the most preferable energy conditions have been identified for the DO set points in a range from 0.7 to 1.0 mg O2/L. By verification of the applied DO set points with the actual DO concentrations measured during batch tests (Tables S1 and S2), suggested DO set points for the PN process range from 0.65 to 1.12 mg O2/L.
The application of this strategy provides an opportunity to achieve efficient ammonium nitrogen conversion at lowered energy demand, and hence, a substantial reduction in the operating costs [17,18].
Several studies have also investigated the reducing effects of the nitrogen removal costs through the nitrite pathway, leading to a great reduction in the oxygen demand, of more than 50% on average. Moreover, surprisingly, the overall energy consumption exhibited a dramatic reduction from 2.4 kWh/kg under the conventional process to 1 kWh/kg within the PN/A technology [29,62]. As an example, Figure 7 compares the energy consumptions by the conventional and deammonification methods, including oxygen, carbon, and N 2 O emission. The level of overall energy consumption within the conventional method, estimated around 30 kWh/PE.year, is almost twice higher than that in deammonification method at 17 kWh/PE.year [63].
Other investigations indicated that the WWTPs involving anammox into the main stream would yield 24–30 Wh/PE.d (watt hours per person per day), as compared to 44 Wh/PE.d consumption in the conventional treatment [64]. The survey data form a full-scale SBRs using the PN/A technology indicated that the energy demand was varied between 0.8–1.92 kWh/kgN. Higher energy demand was found in the biofilm-based and 2-stage systems, therein the average values were from 1.05 to 1.86 kWh/kgN. In contrast, the conventional process required around 4.0 kWh/kgN [65].

5. Conclusions

The energetic aspect is a great concern for many WWTPs. In this context, innovative nitrogen removal technologies, such as PN/A process, could be a solution. The obtained results indicated that the adopted aeration control strategy contributed to achieving efficient wastewater treatment, ensuring substantial reductions in the operational costs. Providing in this way, energy savings, that would constitute a paradigm shift for the wastewater industry.
In this research, the mutual interaction between temperature and DO concentration was investigated in order to define the optimal conditions for the energy efficient aeration control during the nitrification process. It seems that the effect of operational factors alone cannot be an effective way to simultaneously inhibit the NOB activity and promote AOB activity. Hence, the importance of optimum range for operational factors, proper DO concentration at low levels based on the AOB-NOB activity, and energy-consumption approaches, can be crucial for making the process more cost-effective. The microbial community examination, along with the mathematical modeling and sensitivity analysis was applied to better understand the interactions between AOB and NOB. On the basis of the obtained data, it was proven that in order to implement a shortened nitrogen removal pathway, the DO set point adjustment has to be related to the process temperature. Despite the lower abundance of NOB in the total bacterial community, in relation to AOB, revealed by the microbial analysis, their activity may predominate at increased temperatures. Further model implementation, as well as a sensitivity analysis of models, enabled to recognize of the beneficial aeration strategy at a particular temperature, based on the AOB and NOB activity predictions. NOB reflected low sensitivity in relation to the available DO under elevated temperatures, while it was extremely susceptible when the temperature dropped below 14 °C. Conversely, the AOB activity was stimulated by the DO concentration increases at the wider range of the temperatures; however, this effect was reduced along with the temperature increase. To conclude, the combined effect of optimum DO, and the low temperature has to be considered to inhibit the NOB activity and make the process more energy efficient. In this study, under low and moderate temperatures (10–18 °C), averaged DO concentrations (0.7 mg O2/L) were preferable to ensure beneficial AOB activity over NOB, while simultaneously maintaining reasonable energy consumption. Elevated temperatures (~30 °C), as well as increased DO concentration, were recognized as beneficial for the NOB activity stimulation; thus, under such conditions, the DO limitation seems to be a more prospective approach.

Supplementary Materials

The following are available online at https://www.mdpi.com/1996-1073/13/21/5808/s1, Figure S1: AUR and NPR under various combination of the temperature and dissolved DO set point, during batch tests with ammonium as a nitrogen source., Figure S2: NiUR and NPR under various combination of the temperature and dissolved DO set point, during batch tests with nitrite as a nitrogen source. Figure S3. DO profiles in the reactors during batch tests with ammonium as a nitrogen source under various temperatures and DO set points. Figure S4. DO profiles in the reactors during batch tests with nitrite as a nitrogen source under various temperatures and DO set points. Table S1. Averaged DO concentrations during batch tests with ammonium as a nitrogen source under various temperatures and DO set points. Table S2. Averaged DO concentrations during batch tests with nitrite as a nitrogen source under various temperatures and DO set points. Table S3. Identification of the most energy efficient conditions in terms of AOB and NOB activity under various temperatures and DO set points.

Author Contributions

Conceptualization, P.K. and J.D.; methodology, P.K. and J.D.; data curation, software and visualization, B.S. and P.K.; formal analysis, G.Ł.; investigation, M.S.S., P.K.; writing—original draft preparation, M.S.S., P.K., J.D., B.S., A.S.; writing—review and editing, G.Ł.; project administration and funding acquisition, J.D. All authors have read and agreed to the published version of the manuscript.

Funding

This work was financially supported by National Science Centre as a result of the research project no.2017/26/D/ST8/00967.

Acknowledgments

The participation of the Swarzewo WWTP staffs gratefully acknowledged. The authors would like to thank the reviewers for their valuable comments and remarks that allowed to improve the quality of the manuscript.

Conflicts of Interest

The authors declare no conflict of interest.

Abbreviations

AMBanammox bacteria
AOBammonium oxidizing bacteria
ASMadvanced dynamic mathematical model
AURammonium utilization rate
BNRbiological nutrient removal
C/Ncarbon to nitrogen ratio
CODchemical oxygen demand
D/Nconventional denitrification-nitrification process
DOdissolved oxygen
HETheterotrophic bacteria
MLSSmixed liquor suspended solids
MLVSSmixed liquor volatile suspended solids
NH4-N ammonia nitrogen
NiUR nitrite utilization rate
NO2-N nitrite nitrogen
NO3-Nnitrate nitrogen
NOBnitrite oxidizing bacteria
NPRnitrate production rate
OTU operational taxonomic unit
OURoxygen uptake rates
P.E. population equivalent
PN/A nitritation/anammox (deammonification) technology
PN/A partial nitrification/anammox
S sensitivity coefficient
SBRsequencing batch reactor
SRTsludge retention time
T temperature
WWTPwastewater treatment plant

References

  1. Wett, B.; Buchauer, K.; Fimml, C. Energy self-sufficiency as a feasible concept for wastewater treatment systems. In Proceedings of the IWA Leading Edge Technology Conference, Singapore, 21–24 September 2007; pp. 21–24. [Google Scholar]
  2. Gu, Y.; Li, Y.; Li, X.; Luo, P.; Wang, H.; Wang, X.; Wu, J.; Li, F. Energy Self-sufficient Wastewater Treatment Plants: Feasibilities and Challenges. Energy Procedia 2017, 105, 3741–3751. [Google Scholar] [CrossRef]
  3. Longo, S.; d’Antoni, B.M.; Bongards, M.; Chaparro, A.; Cronrath, A.; Fatone, F.; Lema, J.; Mauricio-Iglesias, M.; Soares, A.; Hospido, A. Monitoring and diagnosis of energy consumption in wastewater treatment plants. A state of the art and proposals for improvement. Appl. Energy 2016, 179, 1251–1268. [Google Scholar] [CrossRef]
  4. Venkatesh, G.; Brattebø, H. Energy consumption, costs and environmental impacts for urban watercycle services: Case study of Oslo (Norway). Energy 2011, 36, 792–800. [Google Scholar] [CrossRef]
  5. Panepinto, D.; Fiore, S.; Zappone, M.; Genon, G.; Meucci, L. Evaluation of the energy efficiency of a large wastewater treatment plant in Italy. Appl. Energy 2016, 161, 404–411. [Google Scholar] [CrossRef]
  6. Luo, L.; Dzakpasu, M.; Yang, B.; Zhang, W.; Yang, Y.; Wang, X. A novel index of total oxygen demand for the comprehensive evaluation of energy consumption for urban wastewater treatment. Appl. Energy 2019, 236, 253–261. [Google Scholar] [CrossRef]
  7. Wójtowicz, A.; Jędrzejewski, C.; Bieniowski, M.; Darul, H. Modelowe Rozwiązania w Gospodarce Osadowej; Izba Gospodarcza Wodociągi Polskie: Bydgoszcz, Poland, 2013. [Google Scholar]
  8. Rosso, D.; Larson, E.L.; Stenstrom, M.K. Aeration of large-scale municipal wastewater treatment plants: State of the art. Water Sci. Technol. 2008, 57, 973–978. [Google Scholar] [CrossRef] [PubMed]
  9. Drewnowski, J.; Remiszewska-Skwarek, A.; Duda, S.; Łagód, G. Aeration Process in Bioreactors as the Main Energy Consumer in a Wastewater Treatment Plant. Review of Solutions and Methods of Process Optimization. Processes 2019, 7, 311. [Google Scholar] [CrossRef] [Green Version]
  10. Sheik, A.; Muller, E.; Wilmes, P. A hundred years of activated sludge: Time for are think. Front. Microbiol. 2014, 5, 47. [Google Scholar] [CrossRef] [PubMed]
  11. Zhang, Z.; Zhang, Y.; Chen, Y. Recent advances in partial denitrification in biological nitrogen removal: From enrichment to application. Bioresour. Technol. 2020, 298, 122444. [Google Scholar] [CrossRef]
  12. Zaborowska, E.; Majtacz, J.; Drewnowski, J.; Sobotka, D.; Al-Hazmi, H.; Kowal, P.; Mąkinia, J. Improving the energy balance in wastewater treatment plants by optimization of aeration control and application of new technologies. In Water Supply and Wastewater Disposal; Politechnika Lubelska: Lublin, Poland, 2018; pp. 317–328. [Google Scholar]
  13. Vandegraaf, A.A.; Mulder, A.; Debruijn, P.; Jetten, M.S.M.; Robertson, L.A.; Kuenen, J.G. Anaerobic oxidation of ammonium is a biologically mediated process. Appl. Environ. Microbiol. 1995, 61, 1246–1251. [Google Scholar] [CrossRef] [Green Version]
  14. Sobotka, D.; Tuszyńska, A.; Kowal, P.; Ciesielski, S.; Czerwionka, K.; Mąkinia, J. Long-term performance and microbial characteristics of the anammox-enriched granular sludge cultivated in a bench-scale sequencing batch reactor. Biochem. Eng. J. 2017, 120, 125–135. [Google Scholar] [CrossRef]
  15. Xu, G.; Zhou, Y.; Yang, Q.; Lee, Z.; Gu, J.; Lay, W.; Cao, Y.; Liu, Y. The challenges of mainstream deammonification process for municipal used water treatment. Appl. Microbiol. Biot. 2015, 99, 2485–2490. [Google Scholar] [CrossRef] [PubMed]
  16. Jo, Y.; Cho, K.; Choi, H.; Lee, C. Treatment of low-strength ammonia wastewater by single-stage partial nitritation and anammox using upflow dual-bed gel-carrier reactor (UDGR). Bioresour. Technol. 2020, 304, 123023. [Google Scholar] [CrossRef]
  17. Figueroa, M.; Vazquez-Padin, J.R.; Mosquera-Corral, A.; Campos, J.L.; Mendez, R. Is the CANON reactor an alternative for nitrogen removal from pre-treated swine slurry? Biochem. Eng. J. 2012, 65, 23–29. [Google Scholar] [CrossRef]
  18. Liang, Y.C.; Daverey, A.; Huang, Y.T.; Sung, S.; Lin, J. Treatment of semiconductor wastewater using single-stage partial nitrification and anammox in a pilot-scale reactor. J. Taiwan Inst. Chem. Eng. 2016, 63, 236–242. [Google Scholar] [CrossRef]
  19. Morales, N.; Val Del Río, Á.; Vázquez-Padín, J.R.; Méndez, R.; Mosquera-Corral, A.; Campos, J.L. Integration of the Anammox process to the rejection water and main stream lines of WWTPs. Chemosphere 2015, 140, 99–105. [Google Scholar] [CrossRef]
  20. Chini, A.; Bolsan, A.C.; Hollas, C.E.; Antes, F.G.; Fongaro, G.; Treichel, H.; Kunz, A. Evaluation of deammonification reactor performance and microrganisms community during treatment of digestate from swine sludge CSTR biodigester. J. Environ. Manag. 2019, 246, 19–26. [Google Scholar] [CrossRef]
  21. Henze, M.; Gujer, W.; Mino, T.; van Loosdrecht, M.C.M. Activated Sludge Models ASM1, ASM2, ASM2d and ASM3; IWA Publishing: London, UK, 2000; p. 121. [Google Scholar]
  22. Drewnowski, J. Advanced Supervisory Control System Implemented at Full-Scale WWTP—A Case Study of Optimization and Energy Balance Improvement. Water 2019, 11, 1218. [Google Scholar] [CrossRef] [Green Version]
  23. Szeląg, B.; Drewnowski, J.; Łagód, G.; Majerek, D.; Dacewicz, E.; Fatone, F. Soft Sensor Application in Identification of the Activated Sludge Bulking Considering the Technological and Economical Aspects of Smart Systems Functioning. Sensors 2020, 20, 1941. [Google Scholar] [CrossRef] [Green Version]
  24. Jaromin-Gleń, K.; Piotrowicz, A.; Drewnowski, J.; Łagód, G. Modelling of different aeration modes influencing processes in SBR bioreactor. In Proceedings of the 7th Eastern European Young Water Professionals Conference, Belgrade, Serbia, 17–19 September 2015; pp. 496–504. [Google Scholar]
  25. Wu, X.; Yang, Y.; Wu, G.; Mao, J.; Zhou, T. Simulation and optimization of a coking wastewater biological treatment process by activated sludge models (ASM). J. Environ. Manag. 2016, 165, 235–242. [Google Scholar] [CrossRef]
  26. Martin, C.; Vanrolleghem, P.A. Analysing, completing, and generating influent data for WWTP modelling: A critical review. Environ. Modell. Softw. 2014, 60, 188–201. [Google Scholar] [CrossRef] [Green Version]
  27. De Gussem, K.; Fenu, A.; Wambecq, T.; Weemaes, M. Energy saving on wastewater treatment plants through improved online control: Case study wastewater treatment plant Antwerp-South. Water Sci. Technol. 2014, 69, 1074–1079. [Google Scholar] [CrossRef]
  28. Jenni, S.; Vlaeminck, S.E.; Morgenroth, E.; Udert, K.M. Successful application of nitritation/anammox to wastewater with elevated organic carbon to ammonium ratios. Water Res. 2014, 49, 316–326. [Google Scholar] [CrossRef] [Green Version]
  29. Cao, Y.; van Loosdrecht, M.C.M.; Daigger, G.T. Mainstream partial nitritation–anammox in municipal wastewater treatment: Status, bottlenecks, and further studies. Appl. Microbiol. Biotechnol. 2017, 101, 1365–1383. [Google Scholar] [CrossRef]
  30. Al-Hazmi, H.; Grubba, D.; Majtacz, J.; Kowal, P.; Makinia, J. Evaluation of Partial Nitritation/Anammox (PN/A) Process Performance and Microorganisms Community Composition under Different C/N Ratio. Water 2019, 11, 2270. [Google Scholar] [CrossRef] [Green Version]
  31. Kouba, V.; Vejmelkova, D.; Proksova, E.; Wiesinger, H.; Concha, M.; Dolejs, P.; Hejnic, J.; Jenicek, P.; Bartacek, J. High-rate partial Nitritation of municipal wastewater after psychrophilic anaerobic pretreatment. Environ. Sci. Technol. 2017, 51, 11029–11038. [Google Scholar] [CrossRef]
  32. Gu, J.; Yang, Q.; Liu, Y. Mainstream anammox in a novel A-2B process for energy-efficient municipal wastewater treatment with minimized sludge production. Water Res. 2018, 138, 1–6. [Google Scholar] [CrossRef]
  33. Blackburne, R.; Yuan, Z.; Keller, J. Partial nitrification to nitrite using low dissolved oxygen concentration as the main selection factor. Biodegradation 2008, 19, 303–312. [Google Scholar] [CrossRef]
  34. Arora, A.S.; Nawaz, A.; Qyyum, M.A.; Ismail, S.; Aslam, M.; Tawfik, A.; Yune, C.M.; Lee, M. Energy saving anammox technology-based nitrogen removal and bioenergy recovery from wastewater: Inhibition mechanisms, state-of-the-art control strategies, and prospects. Renew. Sustain. Energy Rev. 2021, 135, 110126. [Google Scholar] [CrossRef]
  35. Ma, B.; Bao, P.; Wei, Y.; Zhu, G.; Yuan, Z.; Peng, Y. Suppressing Nitrite-oxidizing Bacteria Growth to Achieve Nitrogen Removal from Domestic Wastewater via Anammox Using Intermittent Aeration with Low Dissolved Oxygen. Sci. Rep. 2015, 5, 13048. [Google Scholar] [CrossRef] [PubMed]
  36. Klindworth, A.; Pruesse, E.; Schweer, T.; Peplies, J.; Quast, C.; Horn, M.; Glöckner, F.O. Evaluation of general 16S ribosomal RNA gene PCR primers for classical and next-generation sequencing-based diversity studies. Nucleic Acids Res. 2013, 41, 1–11. [Google Scholar] [CrossRef]
  37. Blankenberg, D.; Gordon, A.; Von Kuster, G.; Coraor, N.; Taylor, J.; Nekrutenko, A. The Galaxy Team, Manipulation of FASTQ data with Galaxy. Bioinformatics 2010, 26, 1783–1785. [Google Scholar] [CrossRef] [PubMed]
  38. Gordon, A. FASTQ/A Short-Reads Pre-Processing Tools. Available online: http://hannonlab.cshl.edu/fastx_toolkit/ (accessed on 20 September 2020).
  39. Useqalaxy Server. Available online: https://usegalaxy.org (accessed on 20 September 2020).
  40. USEARCH 6.0 On-Line Tool. Available online: http//fungene.cme (accessed on 20 September 2020).
  41. Silva NGS Server. Available online: http://www.arb-silva.de (accessed on 20 September 2020).
  42. Meyer, F.; Paarmann, D.; D’Souza, M.; Olson, R.; Glass, E.M.; Kubal, M.; Paczian, T.; Rodriguez, A.; Stevens, R.; Wilke, A.; et al. The metagenomics RAST server—A public resource for the automatic phylogenetic and functional analysis of metagenomes. BMC Bioinform. 2008, 9, 386. [Google Scholar] [CrossRef] [Green Version]
  43. Drewnowski, J.; Szeląg, B.; Xie, L.; Lu, X.; Ganesapillai, M.; Deb, C.K.; Szulżyk-Cieplak, J.; Łagód, G. The Influence of COD Fraction Forms and Molecules Size on Hydrolysis Process Developed by Comparative OUR Studies in Activated Sludge Modelling. Molecules 2020, 25, 929. [Google Scholar] [CrossRef] [Green Version]
  44. Petersen, B.; Gernaey, K.; Henze, M.; Vanrolleghem, P.A. Evaluation of an ASM1 Calibration Procedure on a Municipal-Industrial Wastewater Treatment Plant. J. Hydroinform. 2002, 4, 15–38. [Google Scholar] [CrossRef] [Green Version]
  45. Yang, Y.; Wang, L.; Xiang, F.; Zhao, L.; Qiao, Z. Activated Sludge Microbial Community and Treatment Performance of Wastewater Treatment Plants in Industrial and Municipal Zones. Int. J. Environ. Res. Public Health 2020, 17, 436. [Google Scholar] [CrossRef] [PubMed] [Green Version]
  46. Caranto, J.D.; Lancaster, K.M. Nitric oxide is an obligate bacterial nitrification intermediate produced by hydroxylamine oxidoreductase. Proc. Natl. Acad. Sci. USA 2017, 114, 8217–8222. [Google Scholar] [CrossRef] [Green Version]
  47. Soliman, M.; Eldyasti, A. Ammonia-Oxidizing Bacteria (AOB): Opportunities and applications—A review. Rev. Environ. Sci. Biotechnol. 2018, 17, 285–321. [Google Scholar] [CrossRef]
  48. Lotti, T.; Kleerebezem, R.; Hu, Z.; Kartal, B.; Jetten, M.S.M.; van Loosdrecht, M.C.M. Simultaneous partial nitritation and anammox at low temperature with granular sludge. Water Res. 2014, 66, 111–121. [Google Scholar] [CrossRef]
  49. Ge, S.; Wang, S.; Yang, G.; Qiu, S.; Li, B.; Baikun, Z.; Peng, Y. Detection of nitrifiers and evaluation of partial nitrification for wastewater treatment: A review. Chemosphere 2015, 140, 85–98. [Google Scholar] [CrossRef]
  50. Mehrani, M.J.; Sobotka, D.; Kowal, P.; Ciesielski, S.; Makinia, J. The occurrence and role of Nitrospira in nitrogen removal systems. Bioresour. Technol. 2020, 303, 122936. [Google Scholar] [CrossRef]
  51. You, S.J.; Hsu, C.L.; Chuang, S.H.; Ouyang, C.F. Nitrification efficiency and nitrifying bacteria abundance in combined AS-RBC and A2O systems. Water Res. 2003, 37, 2281–2290. [Google Scholar] [CrossRef]
  52. Feng, Y.; Lu, X.; Al-Hazmi, H.; Mąkinia, J. An overview of the strategies for the deammonification process start-up and recovery after accidental operational failures. Rev. Environ. Sci. Biotechnol. 2017, 16, 541–568. [Google Scholar] [CrossRef]
  53. Laureni, M.; Weissbrodt, D.G.; Villez, K.; Robin, O.; de Jonge, N.; Rosenthal, A.; Wells, G.; Lund , J. Biomass segregation between biofilm and flocs improves the control of nitrite-oxidizing bacteria in mainstream partial nitritation and anammox processes. Water Res. 2019, 154, 104–116. [Google Scholar] [CrossRef]
  54. Bellucci, M.; Ofiţeru, I.D.; Graham, D.W.; Head, I.M.; Curtis, T.P. Low-dissolved-oxygen nitrifying systems exploit ammonia-oxidizing bacteria with unusually high yields. Appl. Environ. Microbiol. 2011, 77, 7787–7796. [Google Scholar] [CrossRef] [Green Version]
  55. Zhu, T.; Xu, B.; Wu, J. Experimental and mathematical simulation study on the effect of granule particle size distribution on partial nitrification in aerobic granular reactor. Biochem. Eng. J. 2018, 134, 22–29. [Google Scholar] [CrossRef]
  56. Bao, P.; Wang, S.; Ma, B.; Zhang, Q.; Peng, Y. Achieving partial nitrification by inhibiting the activity of Nitrospira-like bacteria under high-DO conditions in an intermittent aeration reactor. J. Environ. Sci. 2017, 56, 71–78. [Google Scholar] [CrossRef]
  57. Law, Y.; Matysik, A.; Chen, X.; Swa Thi, S.; Ngoc Nguyen, T.Q.; Qiu, G.; Natarajan, G.; Williams, R.B.H.; Ni, B.J.; Seviour, T.W.; et al. High Dissolved Oxygen Selection against Nitrospira Sublineage I in Full-Scale Activated Sludge. Environ. Sci. Technol. 2019, 53, 8157–8166. [Google Scholar] [CrossRef]
  58. Gao, H.; Scherson, Y.D.; Wells, G.F. Towards energy neutral wastewater treatment: Methodology and state of the art. Environ. Sci. Process Impacts 2014, 16, 1223–1246. [Google Scholar] [CrossRef]
  59. Prosser, J.I. Mathematical Modeling of Nitrification Processes. In Advances in Microbial Ecology. Advances in Microbial Ecology; Marshall, K.C., Ed.; Springer: Boston, MA, USA, 1990; Volume 11, pp. 263–304. [Google Scholar]
  60. Chen, Z.; Shi, L.; Ye, M.; Zhu, Y.; Yang, J. Global Sensitivity Analysis for Identifying Important Parameters of Nitrogen Nitrification and Denitrification under Model Uncertainty and Scenario Uncertainty. J. Hydrol. 2018, 561, 884–895. [Google Scholar] [CrossRef]
  61. How, S.W.; Lim, S.Y.; Lim, P.B.; Aris, A.M.; Ngoh, G.C.; Curtis, T.P.; Chua, A.S.M. Low-dissolved-oxygen nitrification in tropical sewage: An investigation on potential, performance and functional microbial community. Water Sci. Technol. 2018, 77, 2274–2283. [Google Scholar] [CrossRef] [Green Version]
  62. Cho, S.; Kambey, C.; Nguyen, V.K. Performance of Anammox Processes for Wastewater Treatment: A Critical Review on Effects of Operational Conditions and Environmental Stresses. Water 2020, 12, 20. [Google Scholar] [CrossRef] [Green Version]
  63. Bott, C.B.; Parker, D.S. WEF/WERF Study Quantifying Nutrient Removal Technology Performance; Water Environment Research Foundation: Alexandria, VA, USA, 2011; ISBN 978-1-78-040332-8. [Google Scholar]
  64. Siegrist, H.; Salzgeber, D.; Eugster, J.; Joss, A. Anammox brings WWTP closer to energy autarky due to increased biogas production and reduced aeration energy for N-removal. Water Sci. Technol. 2011, 57, 383–388. [Google Scholar] [CrossRef]
  65. Lackner, S.; Gilbert, E.M.; Vlaeminck, S.E.; Joss, A.; Horn, H.; van Loosdrecht, M.C. Full-scale partial nitritation/anammox experiences—An application survey. Water Res. 2014, 15, 292–303. [Google Scholar] [CrossRef]
Figure 1. Scheme of the laboratory installation used in the experiment.
Energies 13 05808 g001
Figure 2. Averaged microbial community composition at a phylum level. Only the phyla showing abundance higher than 1% in at least one sample are presented, the remaining microbial phyla were grouped as others.
Energies 13 05808 g002
Figure 3. Comparison of the AOB and NOB activity in terms of different dissolved oxygen (DO) set points and fixed temperatures under limited (Series 1) and non-limited (Series 2) substrate availability for NOB. On the following sub-figures, measured AUR, NPR and NiUR values at the defined DO set points have been presented, under different process temperature: (a) 10 °C; (b) 16 °C; (c) 30 °C.
Energies 13 05808 g003
Figure 4. Influence of T and DO on the values: (a) μNH4-N, (b) μNO2-N, (c) μNO3-N.
Energies 13 05808 g004
Figure 5. Influence of DO on the μNO3-N (NOB) value for: (a) T = 10 °C, (b) T = 16 °C, (c) T = 30 °C.
Energies 13 05808 g005
Figure 6. Of the DO set point at the defined temperature on the sensitivity coefficients (Sij) for (a) NH4-N, (b) NO2-N.
Energies 13 05808 g006
Figure 7. Energy consumption in wastewater treatment plants (WWTPs) under conventional and novel nitrogen removal methods, based on [63].
Energies 13 05808 g007
Table 1. Percentage of the microbial community representatives and their physiological function at a specified taxonomical level. AOB, ammonium oxidizing bacteria; NOB, nitrite oxidizing bacteria.
Physiological Function in BiomassAffiliation at Specified Taxonomic LevelPercentage in Total Bacterial Community [%]
AOBProteobacteria > Betaproteobacteria > Nitrosomonadales > Nitrosomonas2.73 ± 0.45%
NOBNitrospirae > Nitrospira > Nitrospirales > Nitrospiraceae > Nitrospira1.08 ± 0.21%
Dominant *
HET
Bacteroidetes > Sphingobacteria > Sphingobacteriales > Saprospiraceae > Saprospira9.63 ± 0.73%
Proteobacteria > Gammaproteobacteria > Xanthomonadales > Rhodanobacteraceae4.61 ± 0.11%
Proteobacteria > Betaproteobacteria > Burkholderiale s> Comamonadaceae > Comamonas3.88 ± 0.82%
Proteobacteria > Betaproteobacteria > Burkholderiales > Comamonadaceae > Acidovorax3.25 ± 0.35%
Bacteroidetes > Sphingobacteriia> Sphingobacteriales > Chitinophagaceae > Terrimonas2.13 ± 0.10%
Proteobacteria > Gammaproteobacteria > Xanthomonadales > Xanthomonadaceae > Thermomonas2.06 ± 0.09 *%
* Bacterial groups recognized as heterotrophic, which accounted for >2% in the total bacterial community.
Table 2. Summary of the main criteria for the evaluation of the nitrification process based on the AOB-NOB activity at different temperatures and DO concentrations with ammonium as a sole nitrogen source (substrate limiting conditions for NOB).
Process Temp.DO
(mg O2/L)
AUR
(mgNH4-N/
(g∙VSS∙h))
NPR
(mgNO3
-N/
(g∙VSS∙h))
NPR/AUROURmax
mg O2
L·h)
Energy Demand
(watt/h)
Total Energy Demand (watt)
10 °C0.50.590.510.862.430.0351.19
0.70.790.560.712.760.0401.01
11.010.550.543.760.0551.09
1.51.070.570.534.820.0701.31
16 °C0.50.780.710.916.420.0942.41
0.70.890.650.7310.120.1483.33
11.211.190.9812.150.1772.93
1.51.581.570.9914.290.2092.65
30 °C0.51.611.590.999.520.1391.73
0.71.891.830.9710.480.1531.62
11.971.930.9810.190.1491.44
1.52.892.750.9511.670.1701.18
Table 3. Summary of the main criteria for the evaluation of the nitrification process based on the AOB-NOB activity at different temperatures and DO concentrations with nitrite as a sole nitrogen source (substrate limiting conditions for NOB).
Process Temp.DO
(mg O2/L)
NiUR
(mg NO2-N
/(g∙VSS∙h))
NPR
(mg NO3-N
/(g∙VSS∙h))
NPR/NiUROURmax
mg O2
(L·h)
Energy Consumption
(watt/h)
Total Energy Demand
(watt)
10 °C0.50.570.550.960.560.0080.29
0.70.630.610.950.620.0090.29
10.640.620.970.640.0090.29
1.50.670.630.940.640.0090.28
16 °C0.52.211.980.904.280.0620.57
0.72.522.320.924.900.0720.57
12.482.450.994.700.0690.55
1.52.662.610.985.140.0750.56
30 °C0.53.012.560.856.150.0900.60
0.74.543.540.786.400.0930.41
16.586.010.916.400.0930.28
1.56.626.130.936.420.0940.28
Table 4. The normalized activity of the AOB and NOB after relation to actual abundance in the applied biomass samples under the defined temperature and DO set point.
Process Temp.DOAOB ActivityNOB Activity LimitedNOB Activity UnlimitedNOB/AOB Activity LimitedNOB/AOB
Activity Unlimited
°C(mg O2/L)(mgNH4-N/(g∙VSSAOB∙h)(mgNO3-N/
(g∙VSSNOB∙h)
(mgNO3-N/
(g∙VSSNOB∙h)
Series 1Series 1Series 2Series 1Series 2
10 °C0.521.5347.2252.782.192.45
0.728.8351.8558.331.802.02
1.036.8650.9359.261.381.61
1.539.0552.7862.041.351.59
16 °C0.528.4765.74204.632.317.19
0.732.4866.19233.332.037.18
144.16110.19229.632.505.20
1.557.66145.37246.302.524.27
30 °C0.558.76147.22278.702.514.74
0.768.98169.44420.372.466.09
1.071.90178.70609.262.498.47
1.5105.47254.63612.962.415.81
Publisher’s Note: MDPI stays neutral with regard to jurisdictional claims in published maps and institutional affiliations.

