Article

Influence of FACTS Device Implementation on Performance of Distribution Network with Integrated Renewable Energy Sources

1
HEP Distribution System Operator Ltd., Elektra Sisak, 44000 Sisak, Croatia
2
Faculty of Electrical Engineering, Computer Science and Information Technology Osijek, University of Osijek, 31000 Osijek, Croatia
3
Croatian Transmission System Operator Ltd., PrP Osijek, 31000 Osijek, Croatia
*
Author to whom correspondence should be addressed.
Energies 2020, 13(20), 5516; https://doi.org/10.3390/en13205516
Submission received: 22 August 2020 / Revised: 15 October 2020 / Accepted: 19 October 2020 / Published: 21 October 2020
(This article belongs to the Special Issue Energy Management in Prosumer-Rich Distribution Networks)

Abstract

:
In the modern power system, Flexible Alternating Current Transmission System (FACTS) devices are widely used. An increased share of the distributed generation (DG) and the development of microgrids change the power flows in the existing distribution networks as well as a conventional power flow direction from the transmission to the distribution network level which may affect the overall stability aspects. The paper shows the FACTS devices’ implementation influence on the performance of the distribution network with integrated renewable energy sources (RES) observing the aspects of the oscillatory stability and the low-voltage motor starting. The FACTS devices, in particular the static var compensators (SVC), have been allocated according to a novel algorithm proposed in the paper. The algorithm uses an iterative process to determine an optimal location for implementation and rating power of SVC considering active power losses minimization, improvement of the voltage profile and maximizing return of investment (ROI) of FACTS devices. Novel constraints—transformer station construction constraint, SVC industrial nominal power value constraint and the constraint of distribution system operator (DSO) economic willingness to investment in the distribution network development are considered in the proposed algorithm. The analysis has been performed on 20 kV rural distribution network model in DIgSILENT PowerFactory software.

Graphical Abstract

1. Introduction

The aim of the paper is to provide an approach that can be applied to any practical example of a power distribution system that shares similarities with Croatian distribution system operator (DSO). The proposed approach is characteristic for the Croatian DSO—one of the oldest in the world characterized by great stagnation in the development. Distribution network with integrated renewable energy sources (RES) and controllable loads can be classified as grid-connected microgrid [1]. Unlike the conventional stability classification, the microgrid stability is mainly defined as control system stability and power supply and balance stability [1]. Oscillatory stability deals with power system’s ability to maintain synchronism if small disturbances occur [2]. If the critical eigen values of the system are poorly damped, small disturbance can trigger oscillations in a conventional power system as well as in a microgrid [1]. Small disturbances in microgrids are likely to appear more frequent than in a conventional power system due to the smaller system inertia and variable RES generation [1]. Low frequency electromechanical oscillation shave the frequency range from approximately 0.1 to 3.0 Hz [3,4]. This is more prominent in modern conventional power systems with large power transfers over long distances with far displacement of generators and loads. Small disturbances can trigger system faults and trip the faulty power lines which may cause undelivered energy losses [5] and overload other power lines which can further propagate sequence trip back to the generator. Power system oscillations are composed of modes (multiple frequency components) which are determined by the power system components [6].
RES generators connected indirectly through power electronic inverters—doubly-fed induction generators (DFIG) and direct-drive synchronous generators (DDSG) inherently decrease system stability [7]. In Reference [1], the authors point to studies revealing that tuning of inverters outer power sharing control loops significantly influence the critical low frequency modes in microgrids. While inertia emulation of RES is needed, their effect on small-signal stability is negligible [8,9]. DG might cause local or inter-area instabilities depending on the point of connection, their operating point and chosen control parameters [10]. Rapidly growing undamped power oscillations in the short term can arise from an inadequate power sharing coordination between several RES units in a microgrid [1]. Furthermore, small load changes can trigger undamped power oscillations in excessively loaded microgrids in the long-term period [1]. The benefits of having Flexible Alternating Current Transmission System (FACTS) devices in a system with high penetration of DG as well as the influence of static var compensators (SVC) and static synchronous compensators (STATCOM) on voltage stability is presented in Reference [11]. Furthermore, the research in Reference [12] showed the financial benefits of optimal FACTS device placement.
In today’s power systems, low frequency oscillations are damped by FACTS and/or power system stabilizers [13]. In the literature [14], a FACTS device is installed in a single machine infinite bus system and it was shown that power system stabilizer (PSS) parameters can be optimized using a support vector regression-controlled FACTS device in real time. FACTS devices are classified into series controllers, shunt controllers and combination of series-series and series-shunt controllers [15].
In this paper, the influence of SVC implementation on the dominant oscillatory modes of the rural distribution network with integrated RES is presented. Since the observed distribution network is characterized with a significant motor load increase, the influence of SVC implementation analysis has been extended on a low voltage asynchronous motor starting. After the literature overview in the Introduction, Section 2 gives a short summary on FACTS devices. Section 3 begins with the description of the distribution network model selection criteria and purposes of SVC implementation. Moreover, considering the topological and manufacturing constraints, an algorithm for FACTS devices allocation has been proposed. The model of 20 kV rural distribution network is described in Section 4. SVC influence on the oscillatory stability is analyzed through two system operation points depending on the total system load, while the influence of SVC on the low voltage asynchronous motor starting is examined independently on the system loading. The comments and views on the performed analysis can be found in the Conclusion.

2. Short Summary on FACTS Devices

From a small-signal consideration, SVCs can be modelled as a controllable susceptance B [16]. The current equation is
I = j B · V .
The SVC consists of a thyristor-controlled reactor (TCR), thyristor-switched capacitors (TSC), harmonic filters and a step-down transformer, which is a primary point of losses in this FACTS device. The harmonic filters are used because of TCR-produced harmonics. Using fewer large SVCs instead of multiple smaller ones has the benefits of using less area; it requires less maintenance and can sometimes be connected without the need for step-down transformers, which significantly decreases losses [17]. When comparing SVC with STATCOMs, STATCOM provides improved performance at a higher cost [18]. Improved performance includes supplying rated current at a different range of voltage, improved dynamic response and the use of a smaller capacitor on the DC bus compared to capacitors used for SVC [19]. Distribution STATCOM (D-STATCOM) is proven a comparable solution for voltage sag mitigation, voltage stabilization, flicker suppression and power factor correction [20]. The optimal location of installed devices must also be considered. Multiple algorithms for determining the point of connection are used [21,22,23,24]. A modern FACTS device, like the voltage source converter (VSC)-based STATCOM, acts as an AC voltage source with a controllable source magnitude and phase angle. As shown in Figure 1, VSC has two terminals that allow series and shunt connection [25]. STATCOM devices can use multi-pulse converters with multiple voltage source converters or multilevel converter technology. Multilevel converter technology was shown to be an efficient alternative for medium voltage systems [26]. A STATCOM voltage control system can incorporate current drop to mitigate voltage deviations at the point of connection proportional to current injected by STATCOM. The STATCOM control system changes capacitor voltage so that output voltage provides required reactive power and uses a phase-locked loop to synchronize gate-turn off transistor pulses to grid voltage [27]. Reactive power flow control of STATCOM depends on the bus voltage. If the bus voltage is lower than the output voltage, STATCOM operates in a capacitive mode and supplies reactive power into the system, while if the bus voltage is higher than the output voltage, STATCOM operates in an inductive mode and consumes reactive power from the system [28].
An ideal FACTS device is a PV bus in which the current is in quadrature with voltage at the terminal, meaning there is no active power exchange. Through bus voltage modulation, phase shifting and line reactance change, STATCOM substantially increases power transfer limits during the steady state operation [29,30].
Thyristor switched capacitor (TSC) is a FACTS device that consists of a series connected capacitors and bidirectional thyristor valves, Figure 2. Commonly, TSC is used for voltage regulation and compensation as is done in this paper.
The basic principle behind TSC is to divide capacitor banks into smaller capacitors to emulate a controllable susceptance [31]. Three-phase TSC can be connected either in a delta or star arrangement. It generates no harmonics, so it does not require filtering. A series inductance is usually used in a TSC to provide resistance, that is, to limit the inrush current [32]. TSC can only be switched on and off and it lacks precise control. The capacitor is previously charged to peak source voltage to lower transient overvoltage [33].

3. Methodology

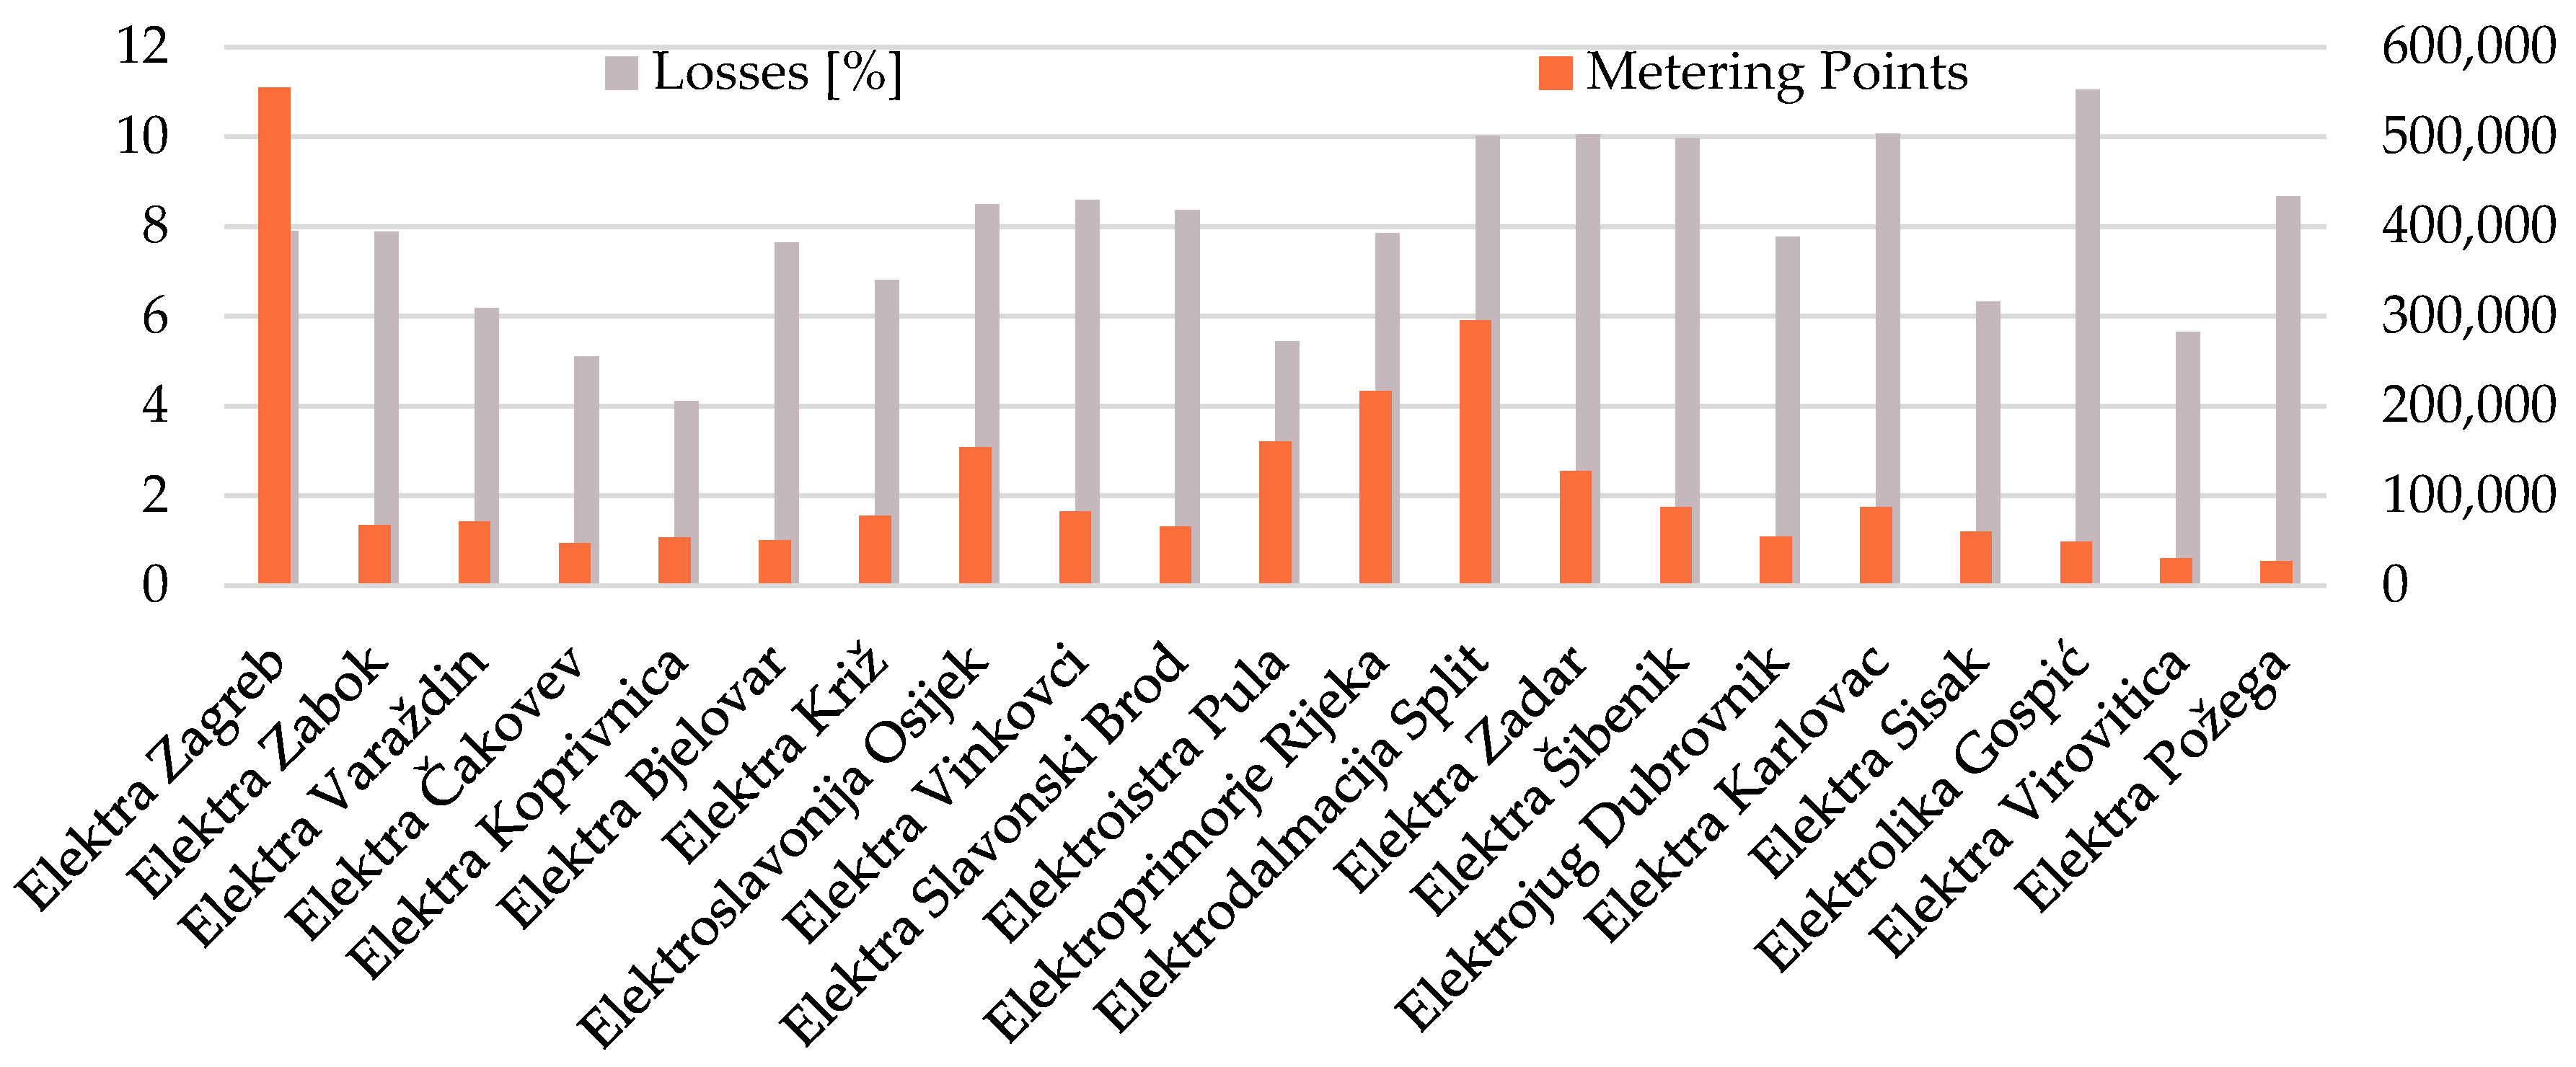
In Croatia there is only one distribution system operator divided into 21 distribution areas, which differ in size, number of metering points, network length and configuration. The data on neighboring countries distribution networks that share a similar configuration and history of occurrence can be seen in Table 1 [34]. The difference compared to neighboring countries DSOs is most evident in the grid losses that are significantly lower in Croatian DSO. Since all the classic ways of improving grid properties of Croatian DSO have been exhausted, FACTS devices represent the next step in distribution network development and improvement.
Metering points and grid losses for the 21 distribution areas of the Croatian DSO can be seen in Figure 3.
Due to the relatively small number of metering points and tendency of the load increase, especially the motor load, the distribution area “Elektra Sisak” was selected for the analysis and implementation of FACTS devices. The part of this distribution area has been analyzed before and after the implementation of FACTS device—SVC proposed by algorithm on Figure 4.
The purpose of the proposed algorithm is to determine the ideal busbar for FACTS implementation and the rated power of FACTS device(s). The proposed algorithm arises from the local industry growth and represents a unique example that can be applied to neighboring countries with similar power systems and similar operational challenges. The mathematical background of the proposed approach is well known [36,37,38] and it has been used as a tool in the optimization process of the FACTS allocation in this paper. The Newton-Raphson method is the most widely used method for solving non-linear equations. The method is an approximation algorithm based on an initial estimate and the use of Taylor’s series expansion and can be applied on the power flow problem. The iterative method can be expressed with (2),
[ δ | V | ] n + 1 = [ δ | V | ] n + [ δ | V | ] n + 1 ,
where δ is system node phase angle, V is voltage magnitude and n is the iteration step [37]. Further comparisons of conventional algorithms are made in References [39,40]. Optimization techniques mentioned in References [41,42] consider fewer constraints than the proposed approach. A similar optimization framework is used in Reference [43] for battery storage systems allocation in a microgrid with significant photovoltaic generation. Algorithms in References [21,22,23,
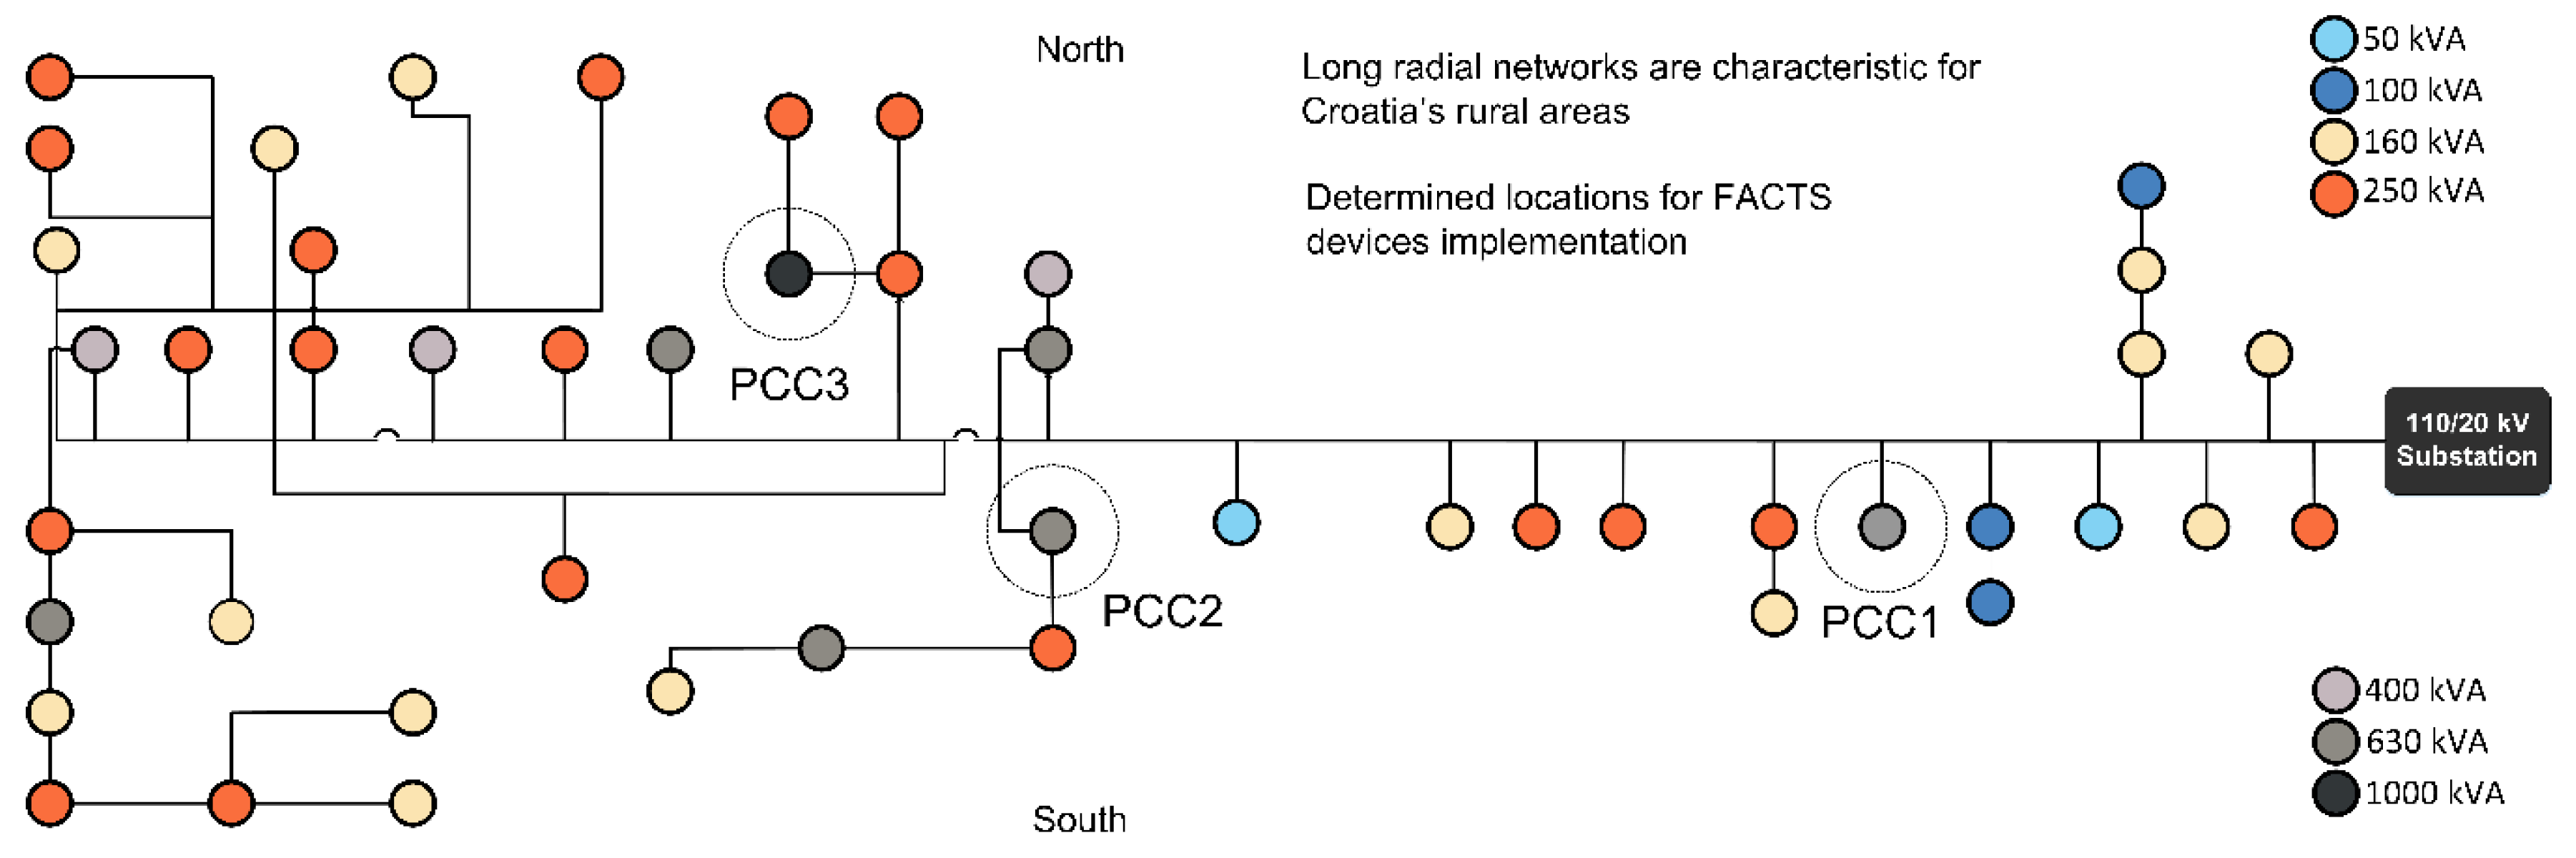
24], if applied to the network simulated in Figure 5, would show better results in terms of reducing total network losses but an attempt to implement SVC on network buses selected by conventional algorithms would lead to legal, political and strategical challenges. The main advantage of the proposed algorithm is minimizing investment by avoiding the need to expand existing transformer station equipment or increasing transformer rated power on a selected busbar. Furthermore, avoiding physical expansion of transformer stations is crucial because building permits reduce ROI and increase total investment timeframe significantly. Due to FACTS devices high costs, all the state of the art techniques used for the FACTS allocation based on the analytical, soft-computing, hybrid approaches have the common objective function, to achieve the maximum benefit of FACTS devices implementation by determining the ideal location and the rating of the FACTS devices. Most of the state of the art techniques for FACTS allocation solve the objective function comprising the FACTS devices costs to maximal benefits of their implementation for the distribution network management resulting in voltage profile improvement as well as active power losses decrease and line loadings decrease. Beside the FACTS manufacturer power rating constraint (which includes standardized FACTS power rating values), proposed approach in this paper comprising the costs of FACTS implementation and the benefits of their implementation allocating the FACTS devices considering the constraints that cannot be found in other state of the art techniques. As mentioned before, those constraints are the transformer station construction constraint and the DSO economic willingness to investment in distribution network development constraint. Minimization of the objective function can be expressed as (3), with constraints Ω,
min i k f ( i k ) ,   = { R O I k < E L k ,   S T k t o w e r , S m   m o d   S S V C = 0   } ,
where f(ik) is the objective function, ik is total investment for installation on node k, ROIk is return of investment for node k, ELk is equipment lifecycle, STk is substation type for node k, Sm is manufacturer power rating of SVC and SSVC is installed rated power of SVC. The starting point of the optimization is node k0, as defined in (4), the node with highest voltage deviation.
k 0 = m i n { Δ | V | k } .
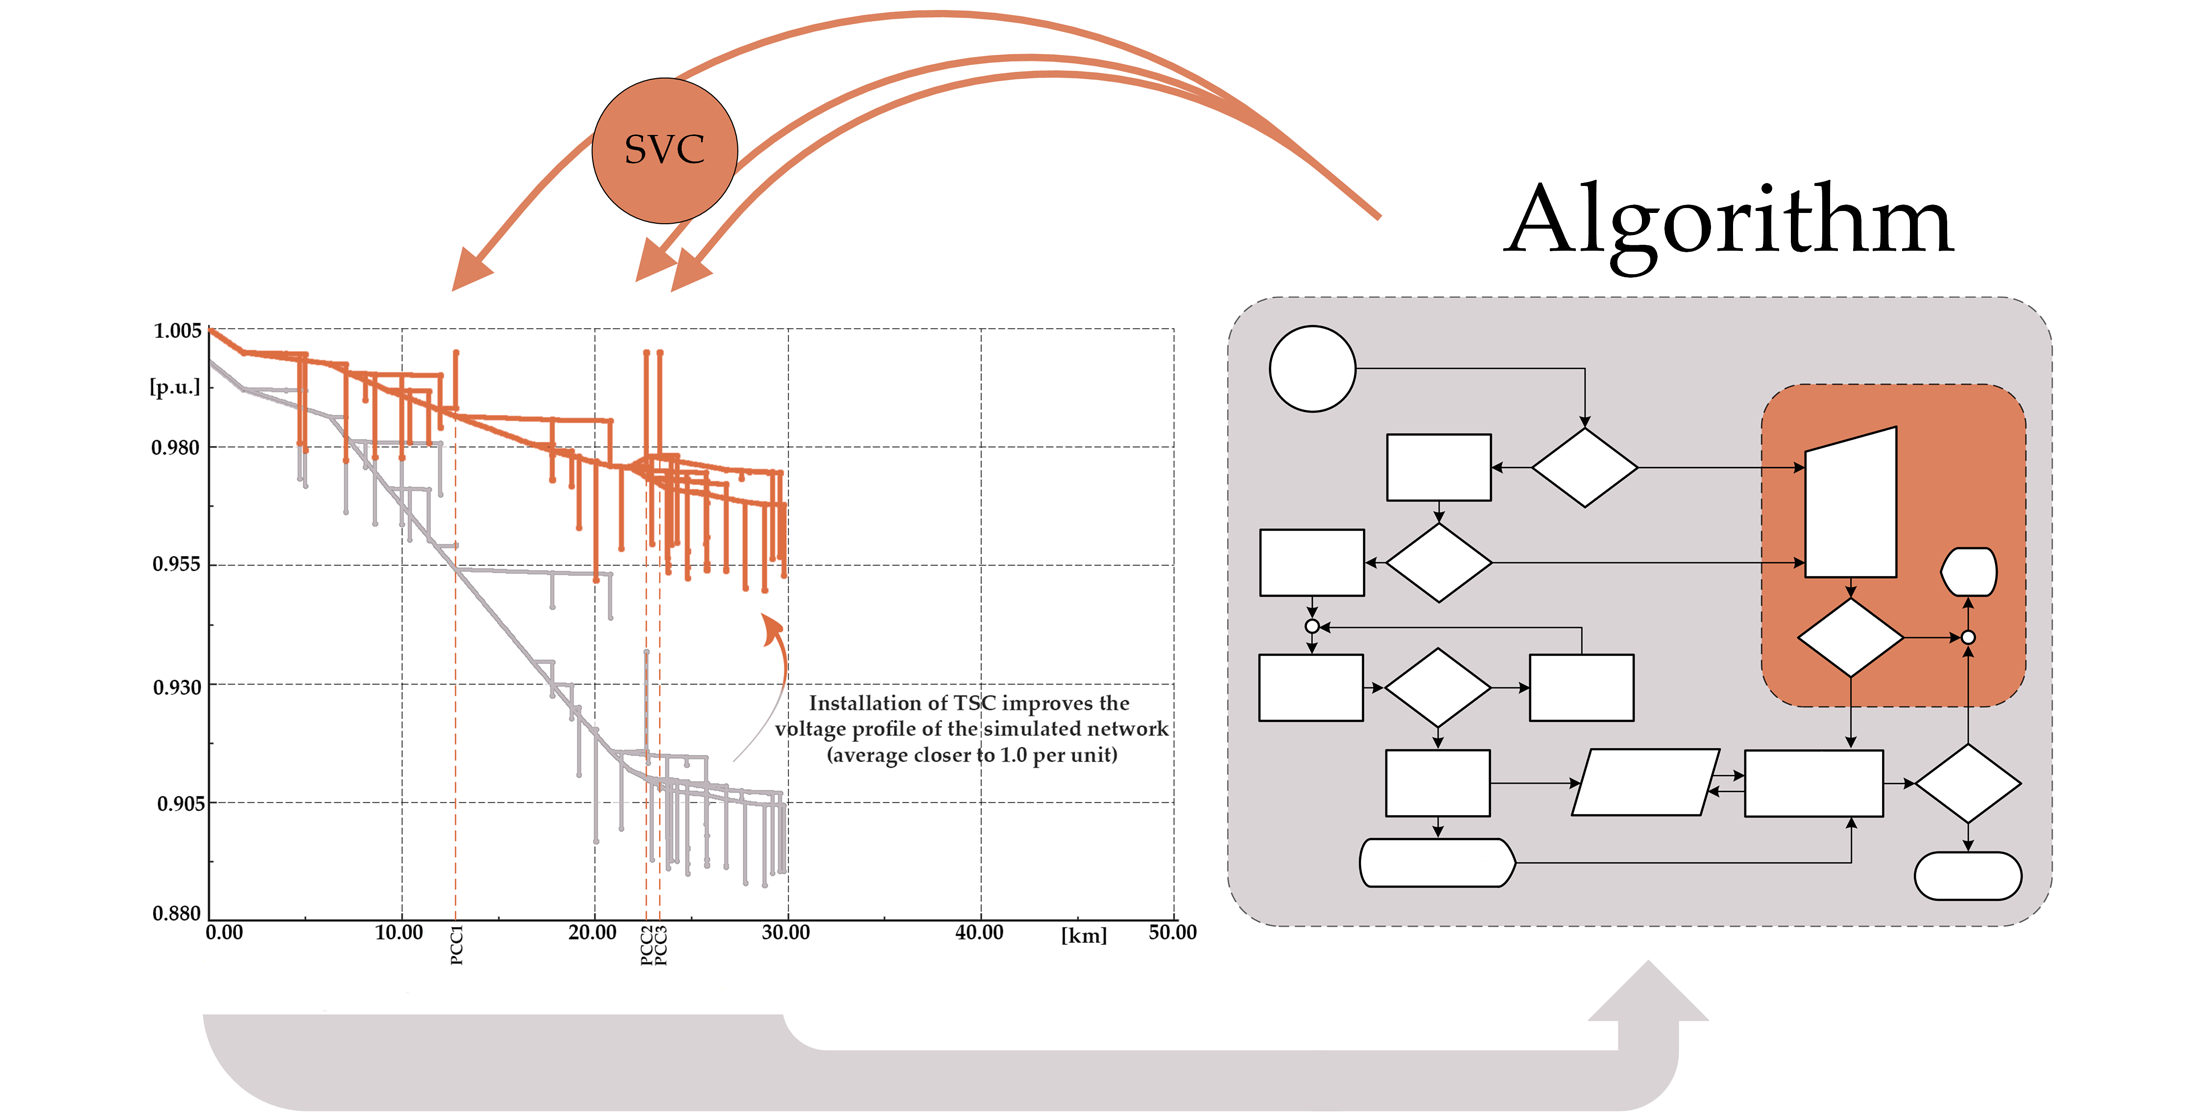
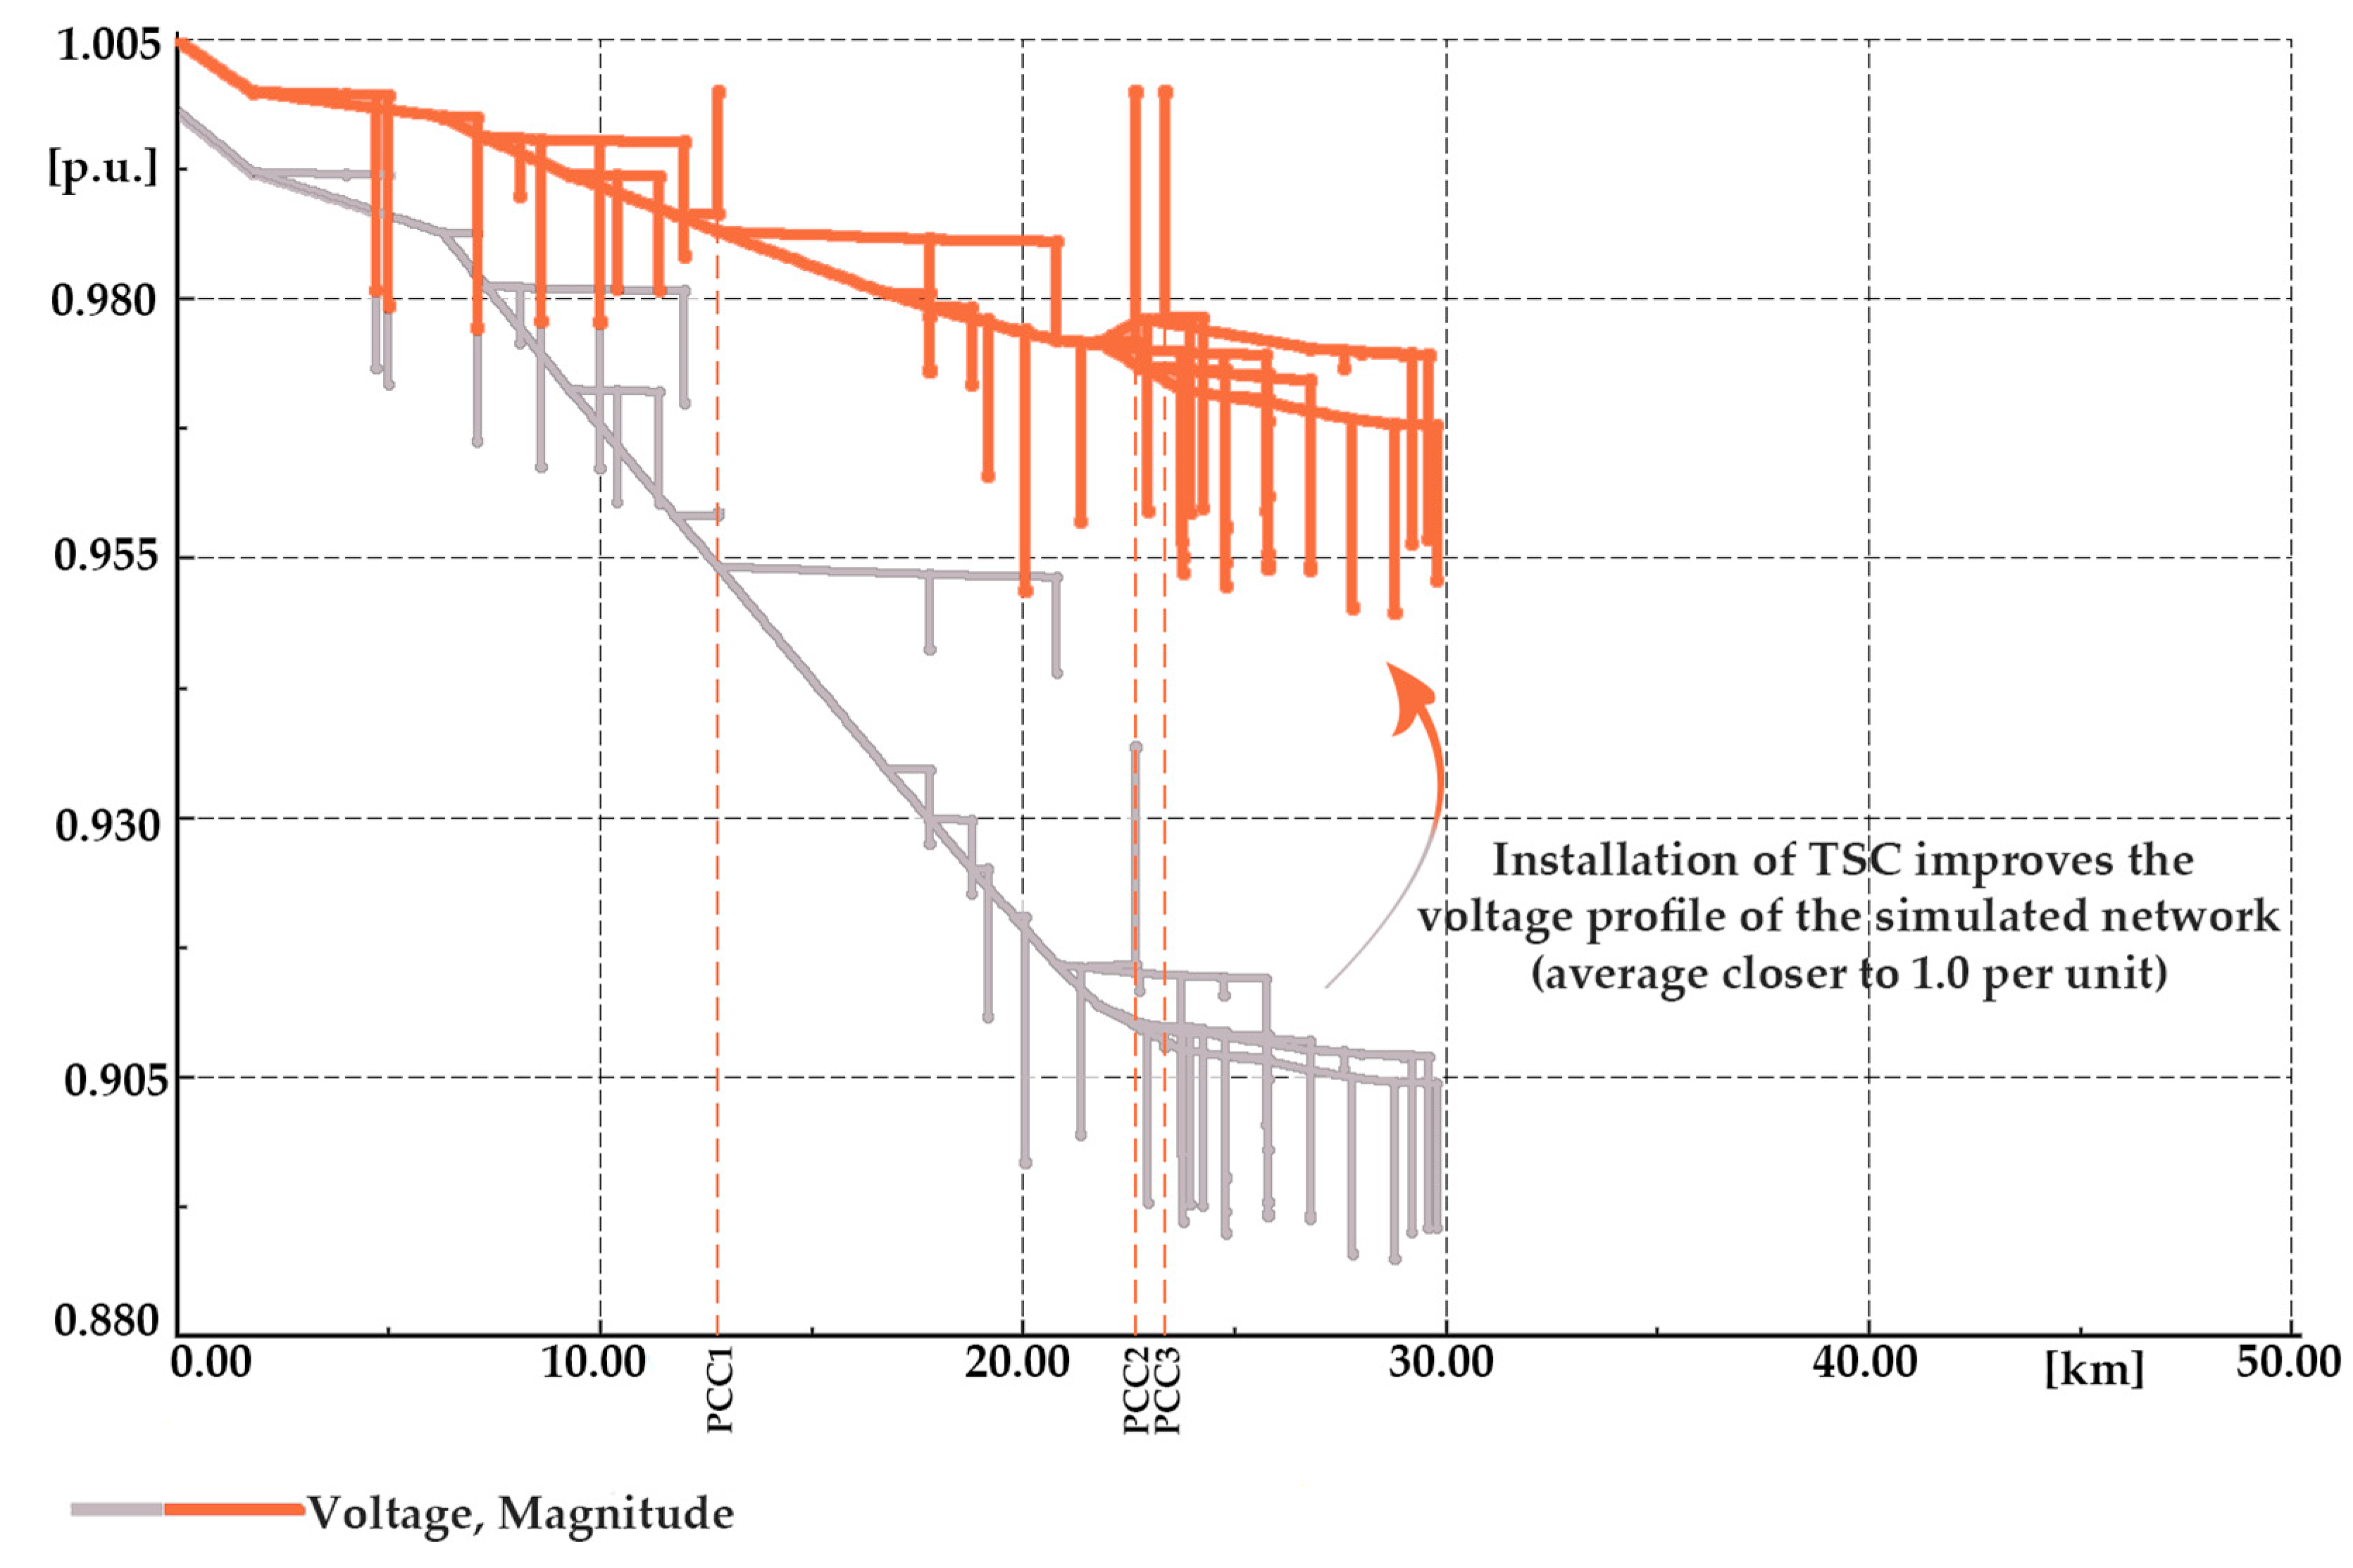
The voltage profile of the feeder is observed and the busbars with voltage lower than threshold voltage value (determined by DSO or watchdog agency rules) are taken into consideration. SVC would be installed on the busbars with the lowest voltage values if those busbars are suitable for the implementation (tower substations are not suitable). Otherwise, SVC would be installed on the next suitable busbar. SVC rated power is determined by an iterative process where rated reactive power is incrementally increased according to standardized values until acceptable voltage levels are found. SVC implementation feasibility is calculated by finding the return of investment (ROI) for the project and comparing it to the equipment lifecycle and decreased losses through optimized load flows and improved stability of supply. Initial cost depends on the type of substation and installed transformer. In Croatia’s distribution grid, installed transformers usually have power rating of 50, 100, 160, 250, 400, 630 or 1000 kVA. Transformers with power rating of 250 kVA and lower are typically installed in tower-type substations, which are not suitable for FACTS implementation. Moreover, transformers with rated power of 400 kVA face overloading for most commercially available FACTS devices. Further challenges lie in coordination with national DSO strategy, local subnet development strategy and the local government spatial plans. The objective function of the proposed algorithm is to find the optimal location for the implementation and the rating of the FACTS devices. Candidate locations for FACTS devices implementation are determined solving nonlinear system nodal equation using an iterative Newton-Raphson method comprising the mentioned constraints. FACTS devices ratings are determined iteratively too; the first FACTS device(s) rating value is the smallest standardized value; in each subsequent iteration this value increases until the predefined voltage conditions are reached. The idea of the proposed algorithm is to incorporate additional constraints to allocation techniques to improve the possibility of their practical implementation.
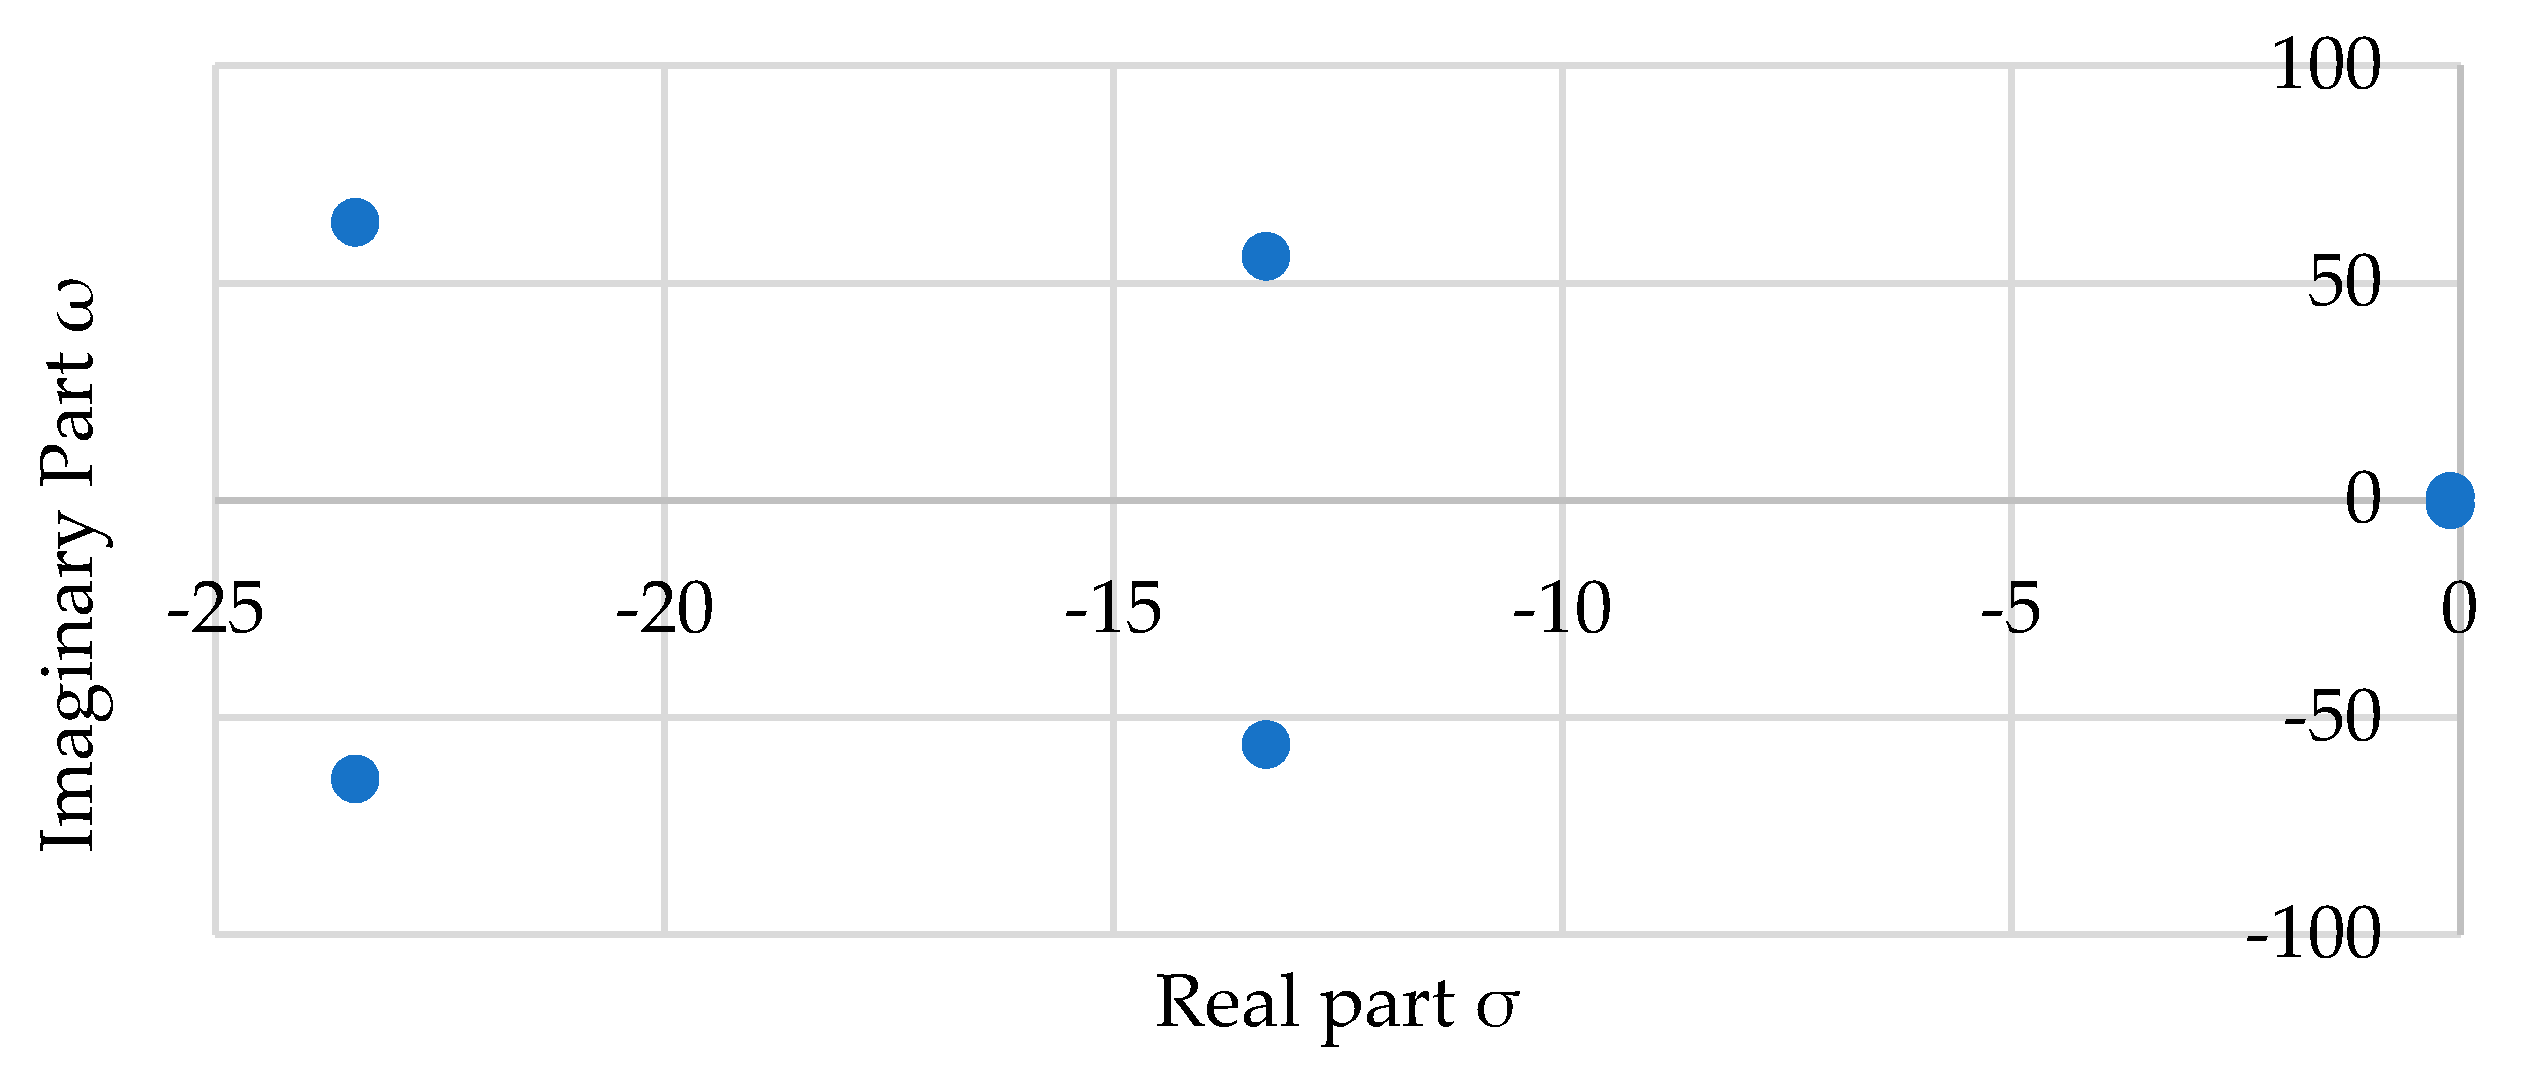
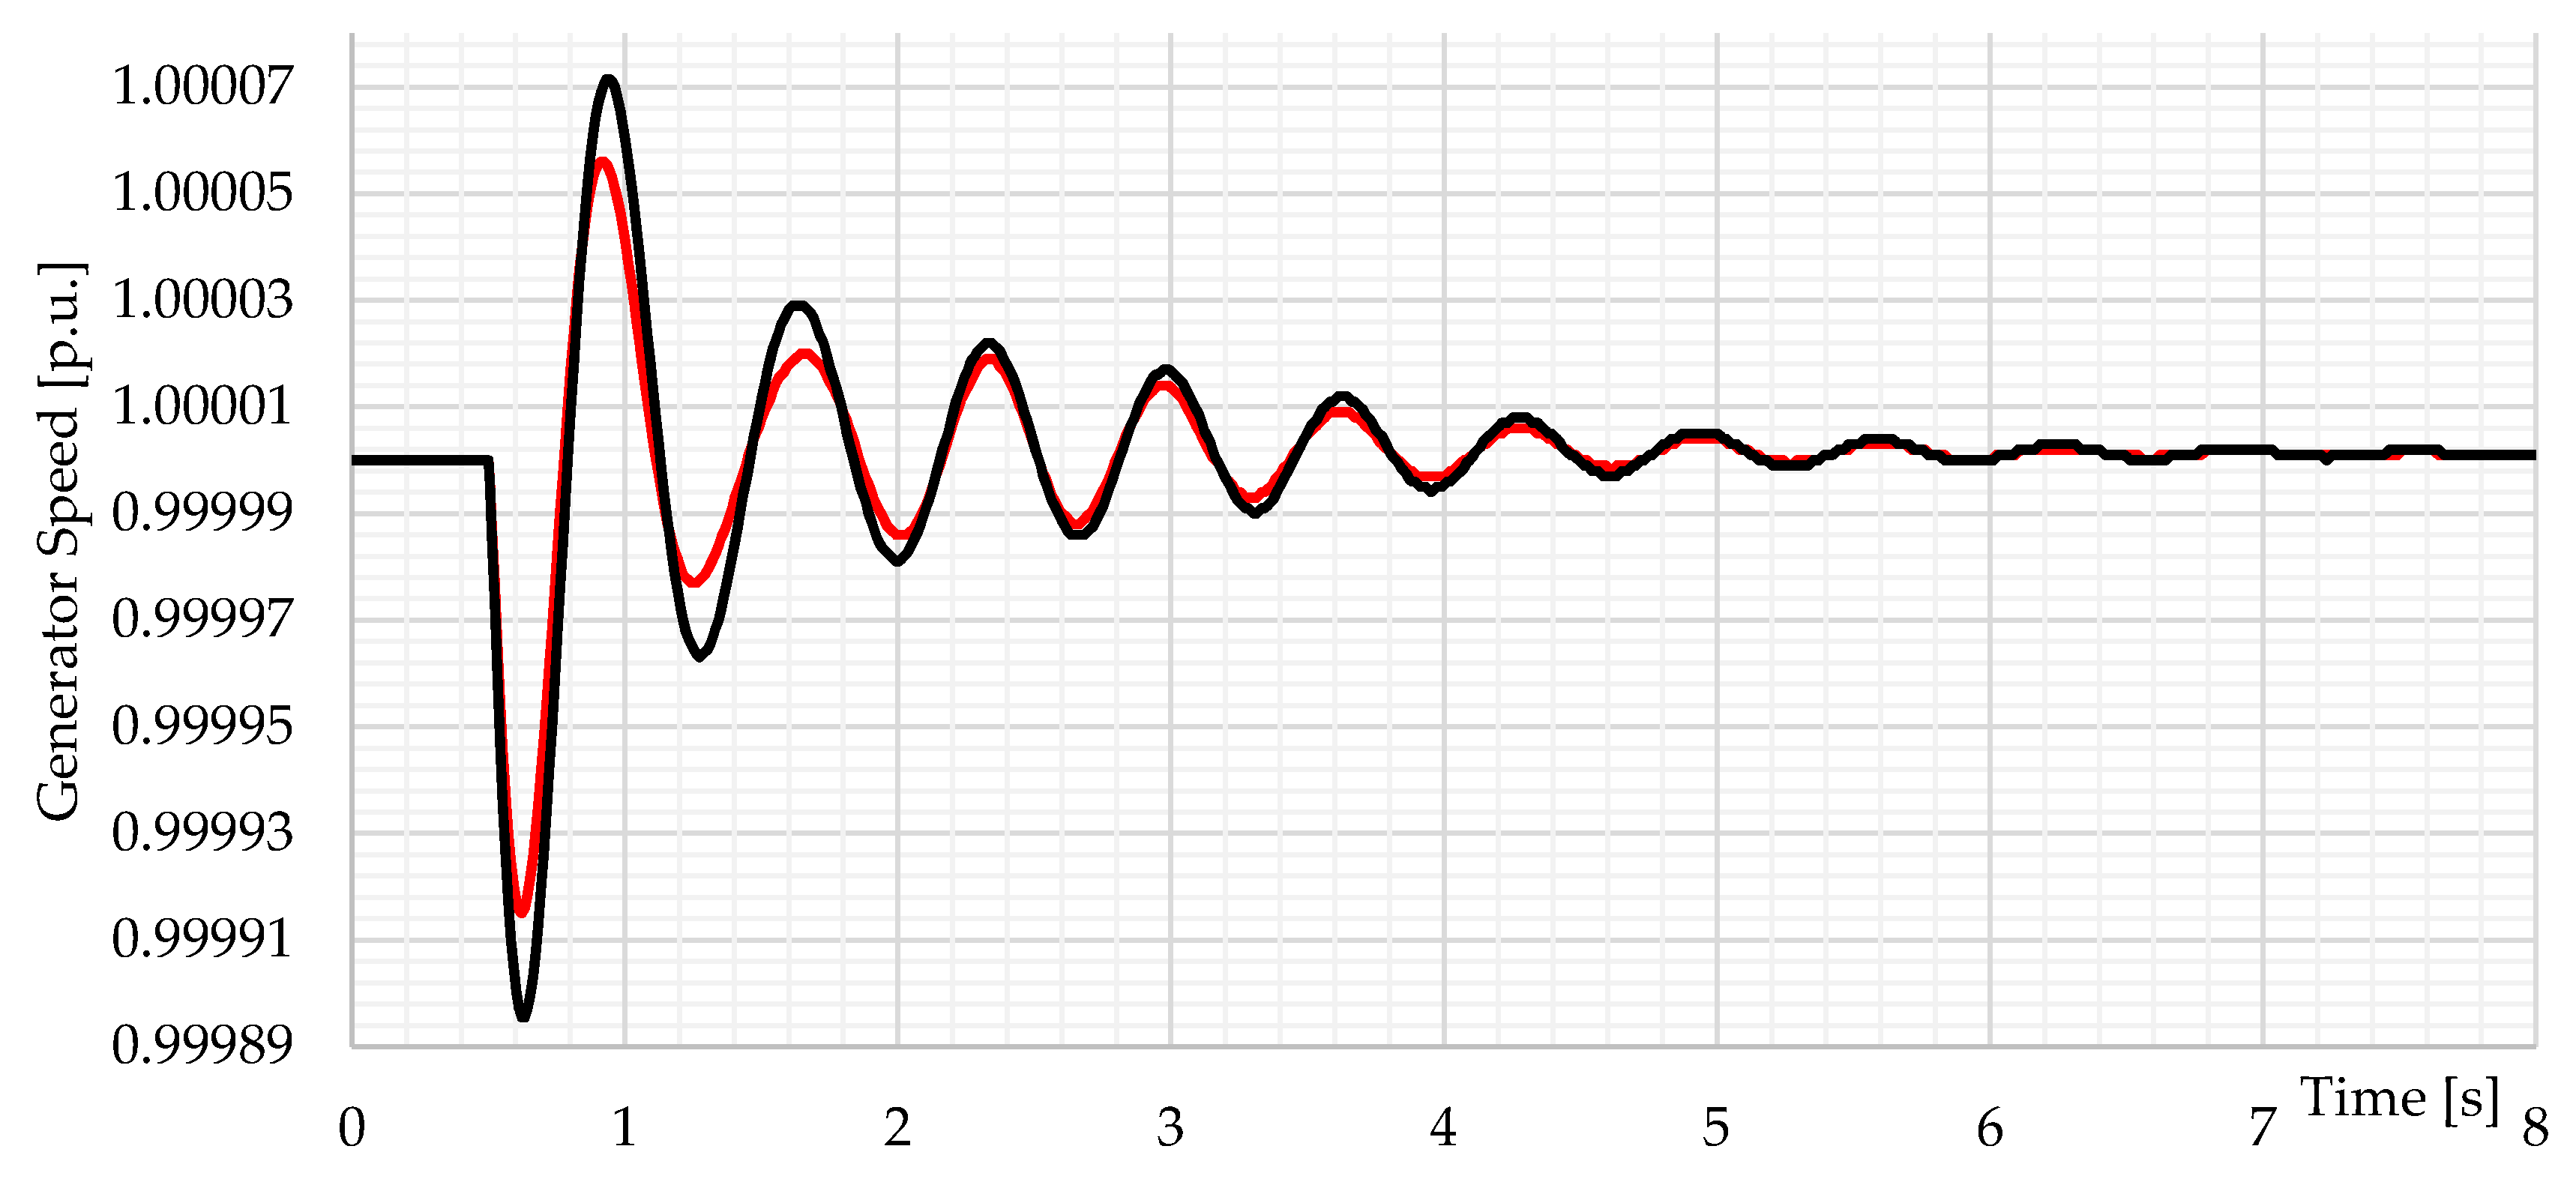
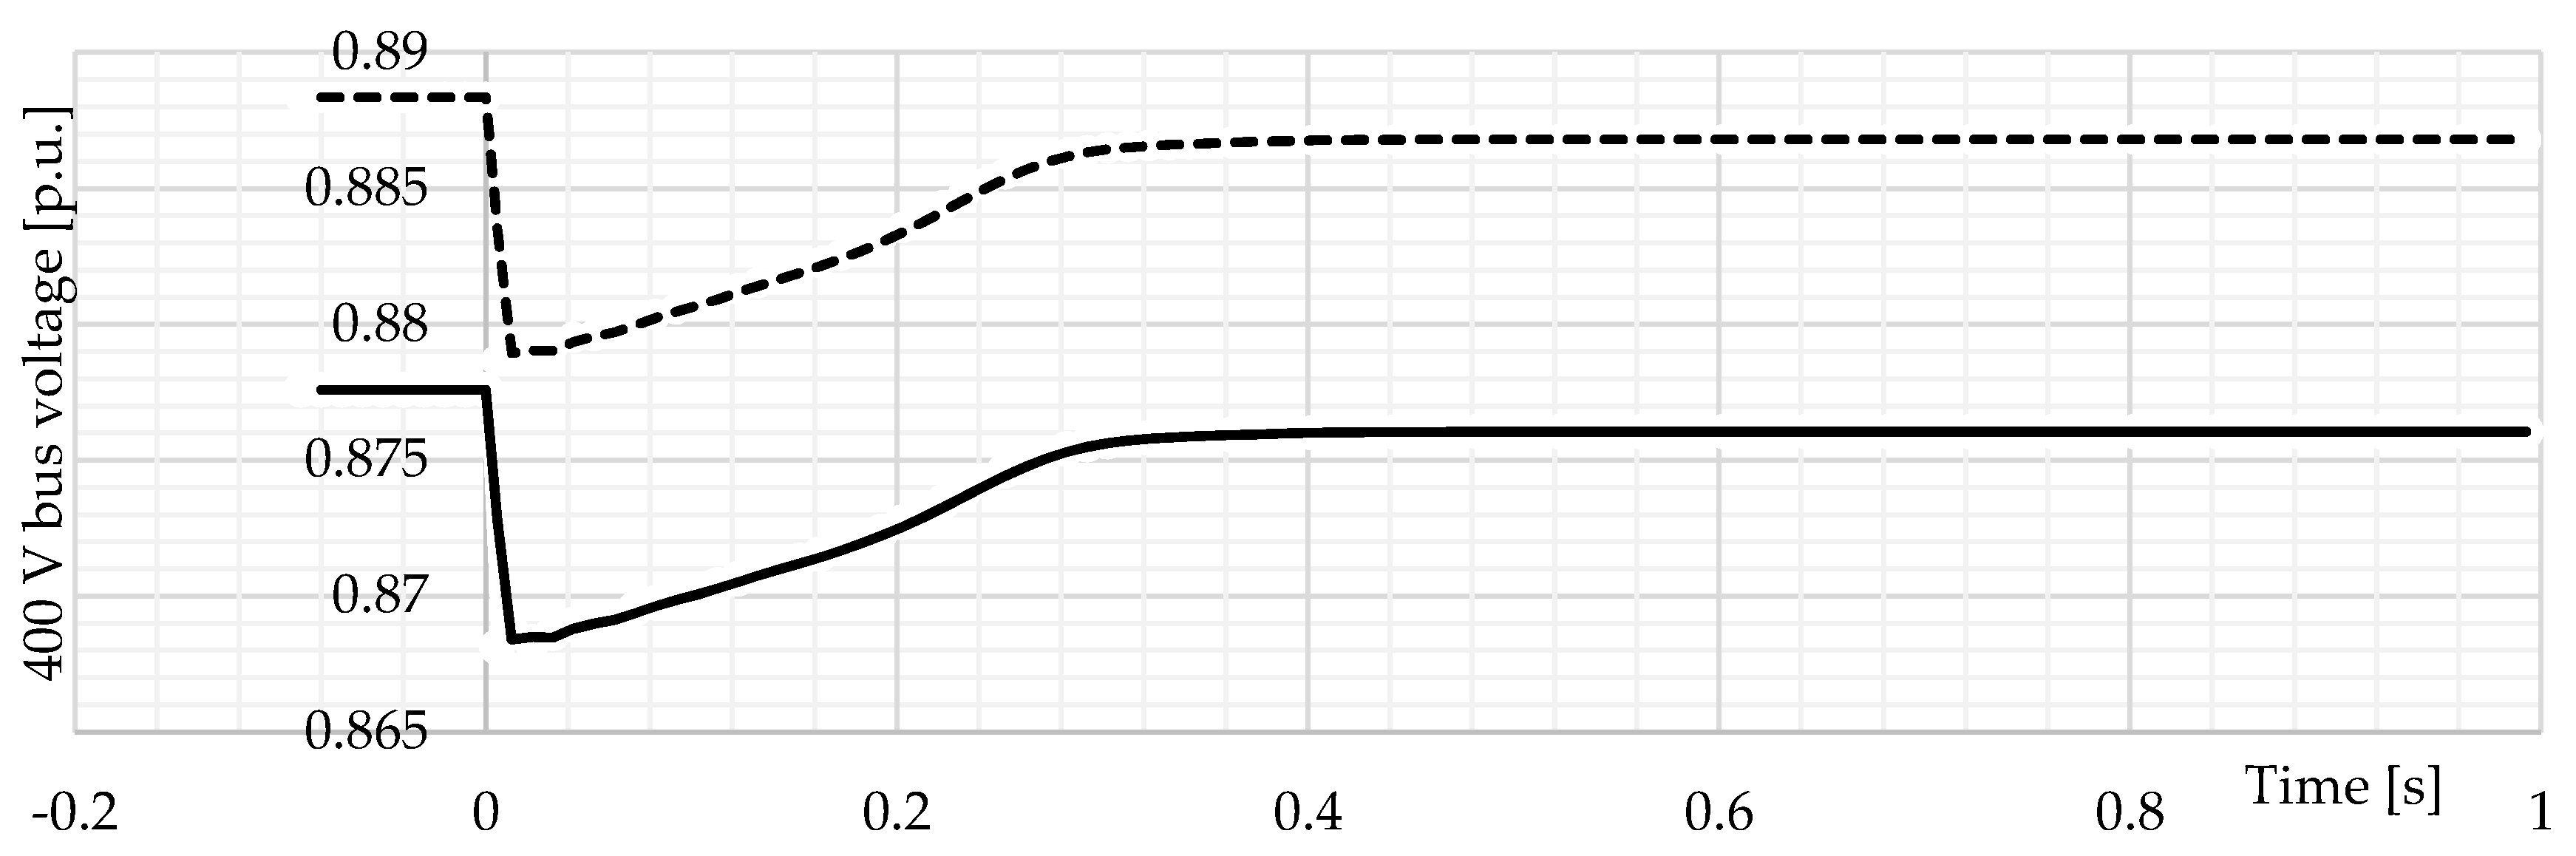
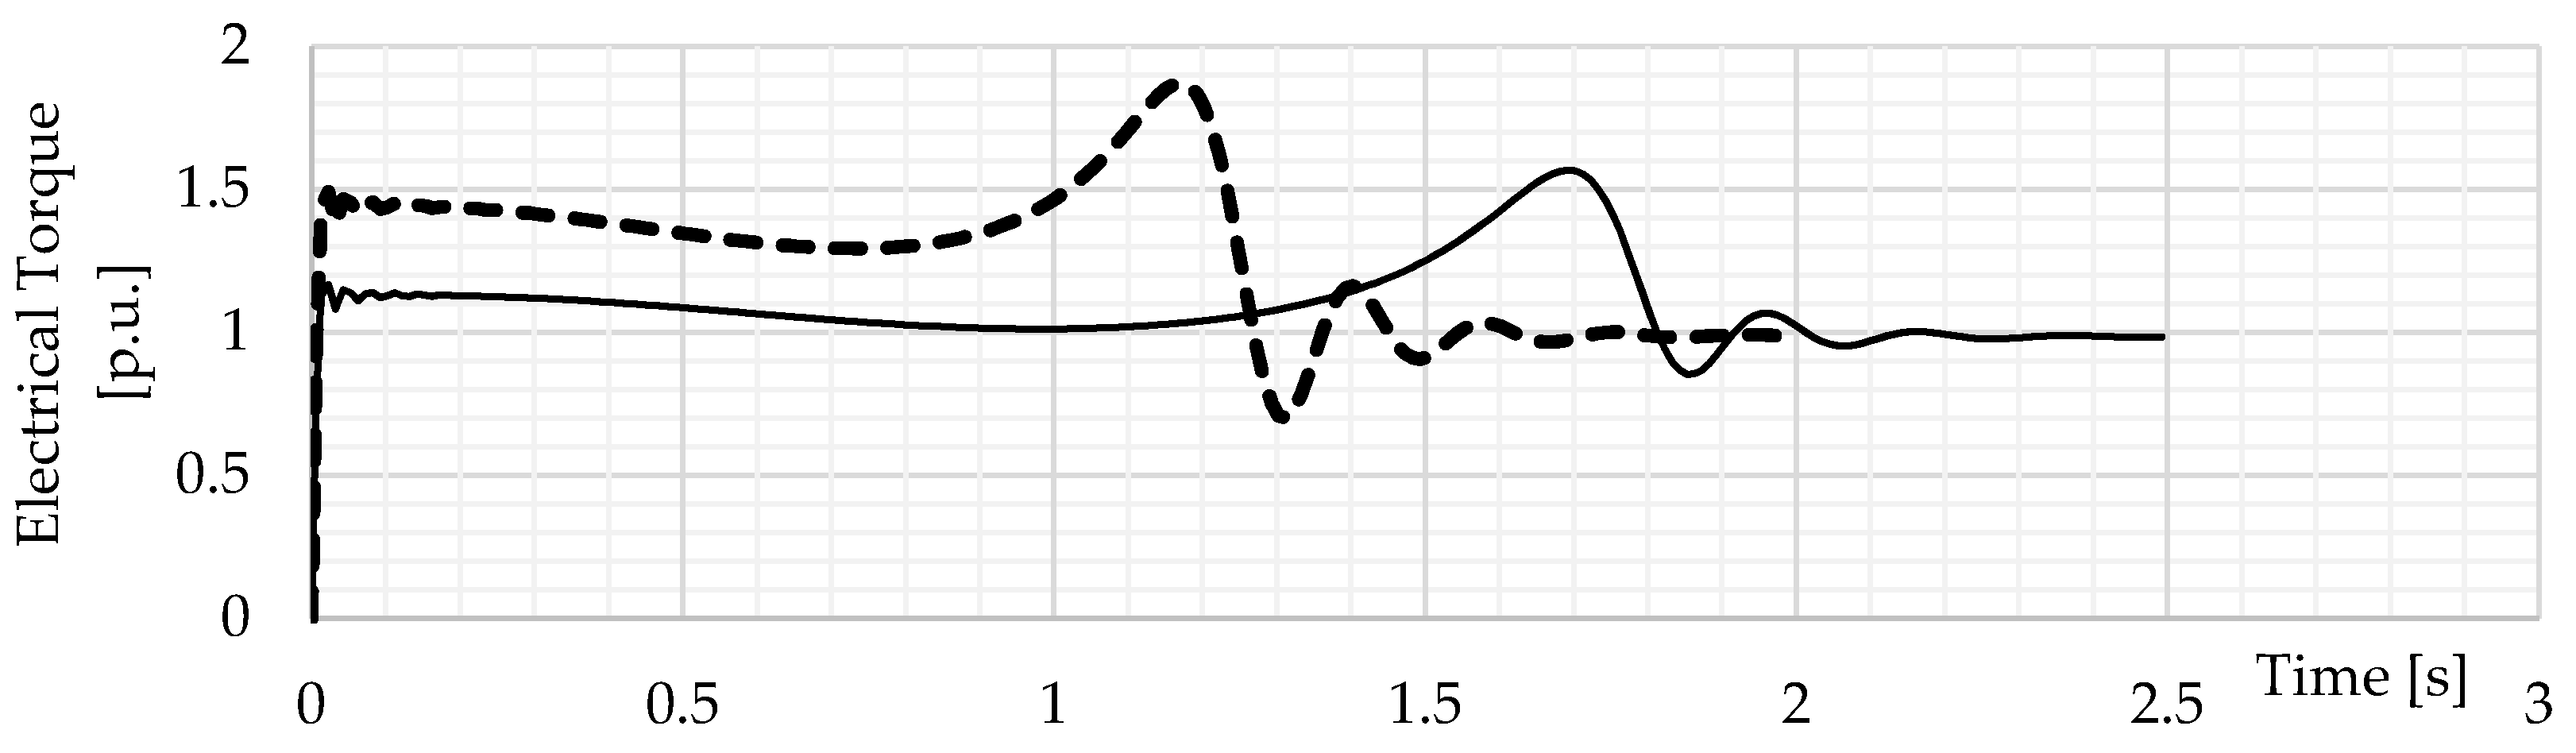
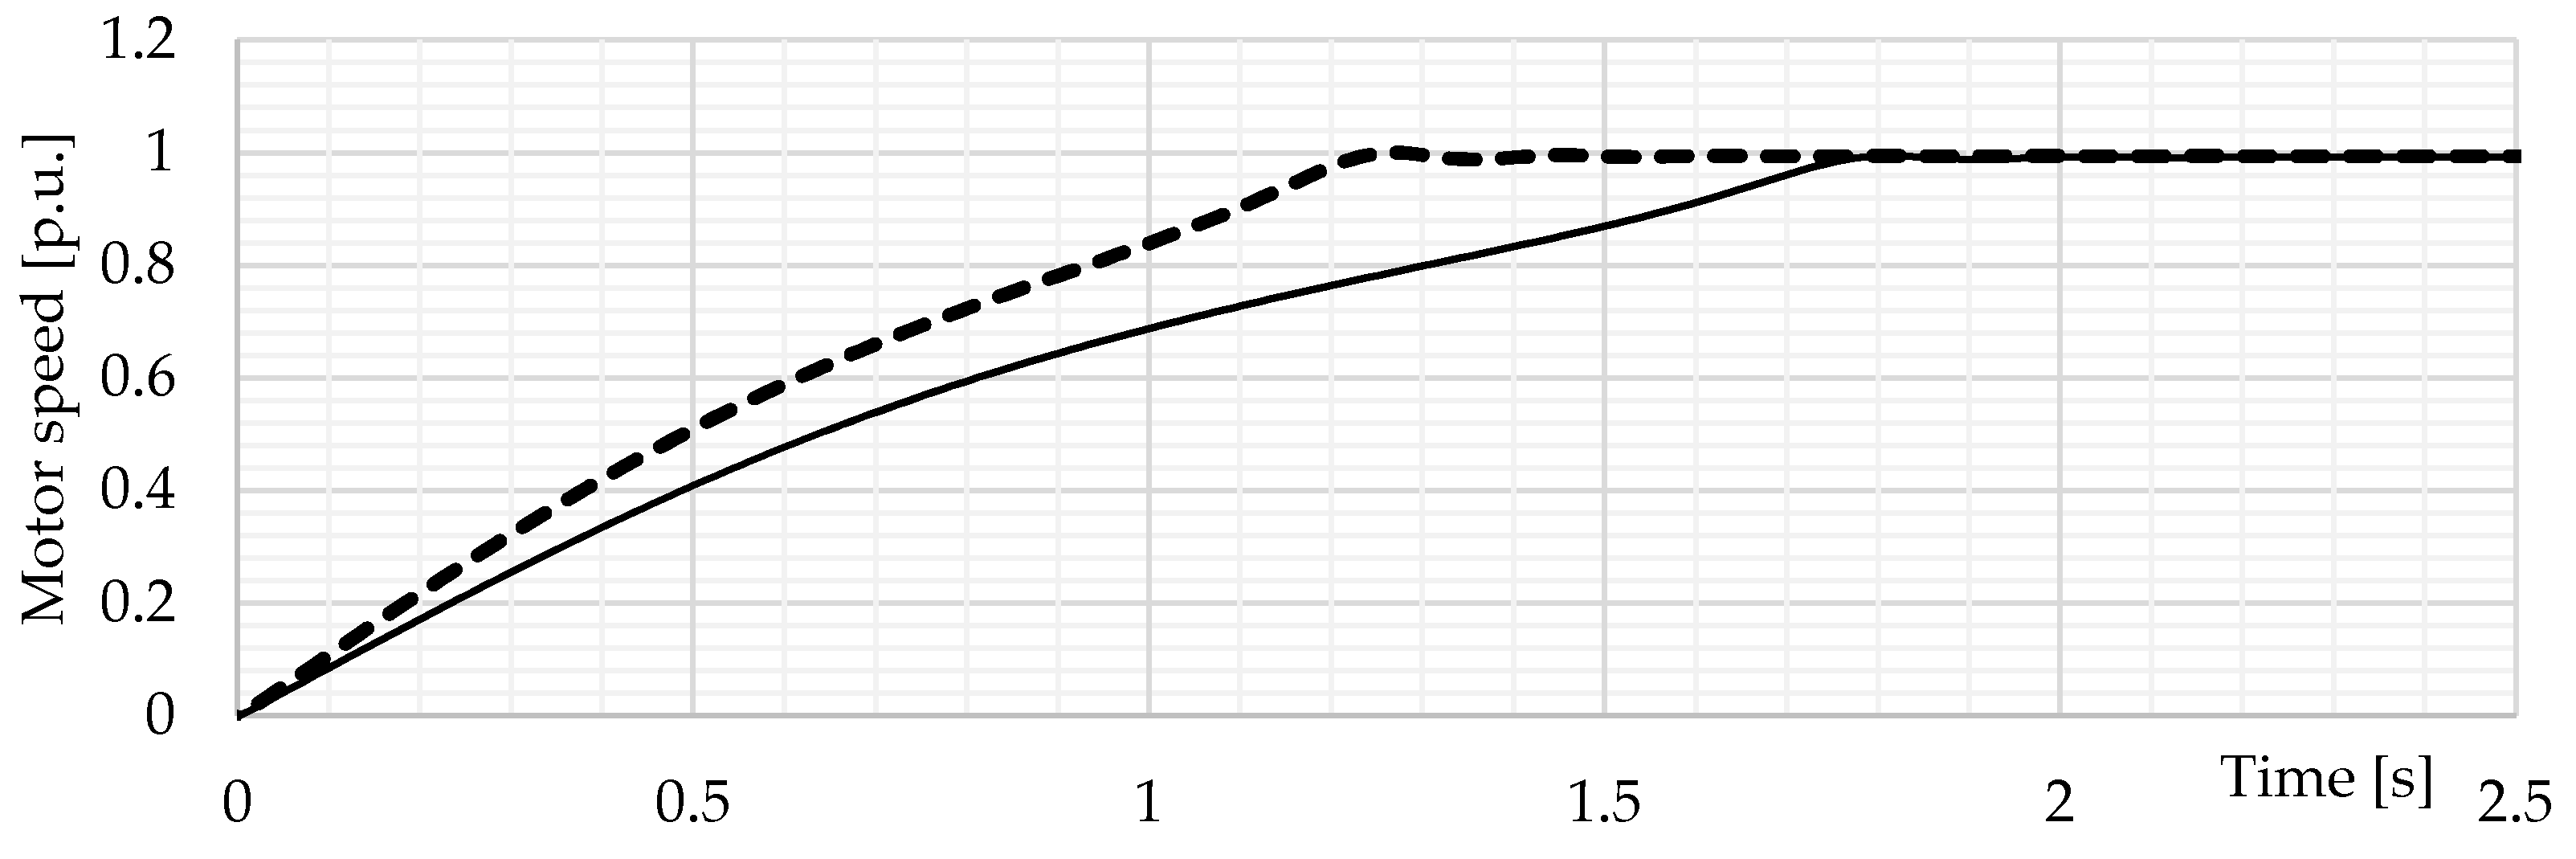
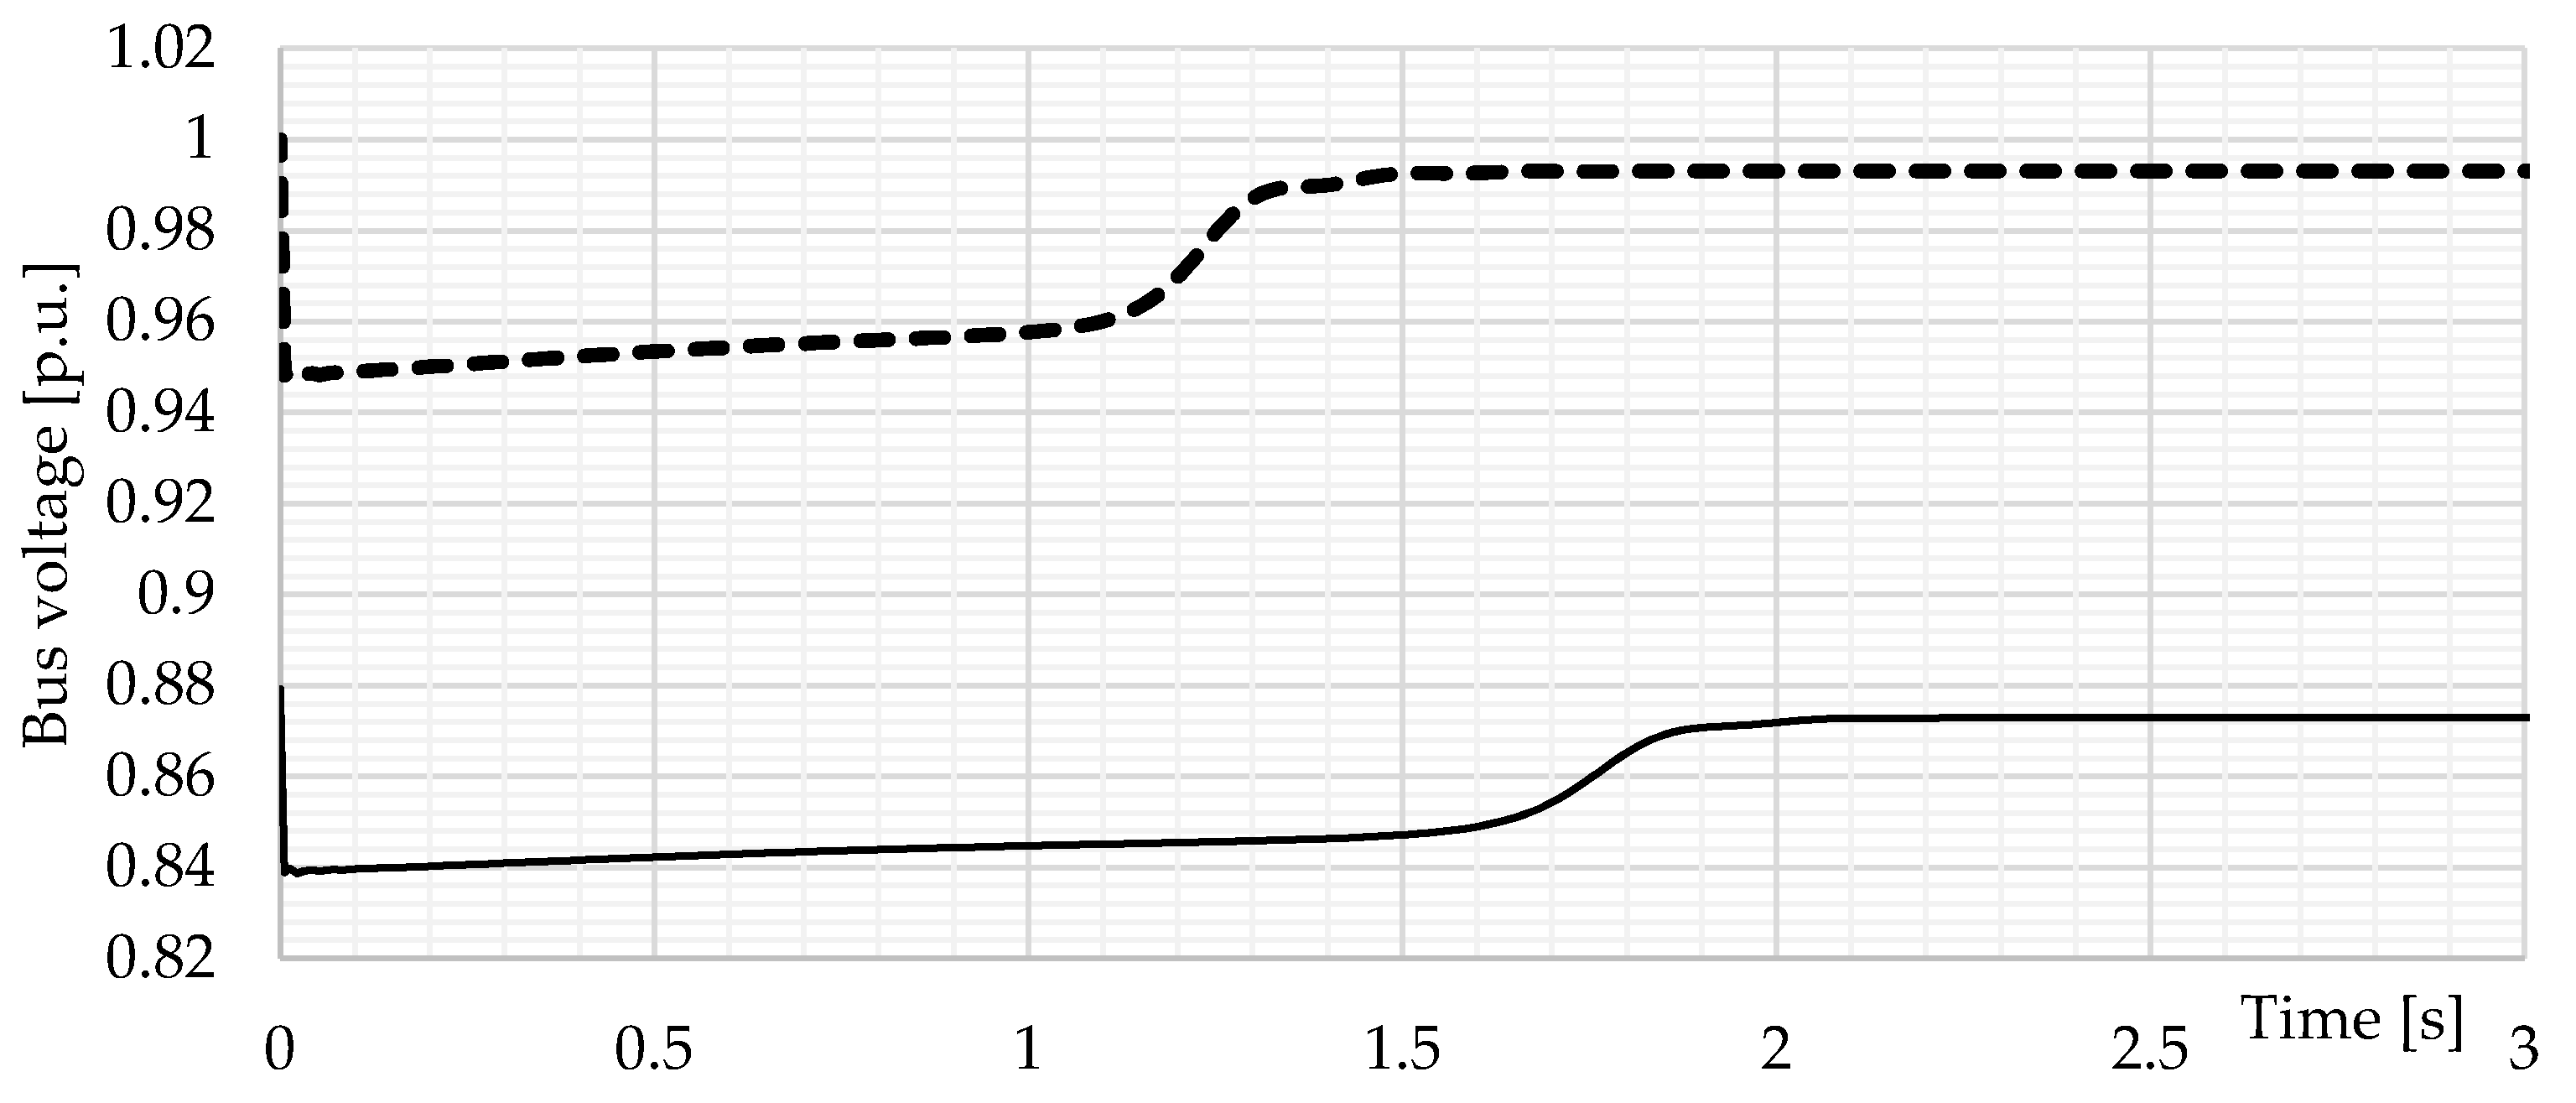
Beside the aspects of SVC implementation proposed with the algorithm in Figure 4, the influence of SVC on the oscillatory stability and low voltage motor starting will be discussed. Due to distribution network specific configuration and topology without long tie lines and connected synchronous generators, the oscillatory stability analysis of distribution network is not a common research area. The modern rural distribution network could be classified as a microgrid since it has been characterized by significant integration of different RES including synchronous and asynchronous generators coupled directly or through the power inverter interface as well as controllable asynchronous motors loads in animal farm facilities. Considering these facts, the analysis of possible influence of SVC implementation on the modern rural distribution network oscillatory stability and the low-voltage motor starting seems to be reasonable.

4. Study Case

The observed network in Figure 3, simulated in DIgSILENT Power Factory software, has been characterized by tendency of the total load increase. High-voltage and the medium-voltage consumers mostly consist of asynchronous motor loads and make a significant share of total energy consumption. Low-voltage enterprise consumers also have a higher chance of using some types of motor drives—Table 2. With data obtained from suppliers of different types of FACTS devices, calculation is done with 100 €/kVAr for SVC devices. Using the simulation data from Table 3, a grid loss reduction of 80 kVAr can be observed. Calculating with a market price of 0.05 €/kWh, a Return of Investment (ROI) is obtained in (5).
ROI = (Pavg*Si)/(λ*ΔS*Pe*24*365) ≅ 3.2 years,
where Pavg—average price of reactive power of SVC per kVAr, Si—installed reactive power in the simulated case study (900 kVAr), ΔS is average total grid loss reduction, λ—inefficiency factor caused by TSC losses (in this example 80%) and Pe—average market price of delivered kWh to a consumer. It can be seen from (2) that ROI is far shorter than expected standard electrical equipment lifecycle of 20–40 years when following the algorithm in Section 2.

4.1. SVC Influence on the Distribution Network Oscillatory Stability

Modeled network (Figure 5) consists of 98 busbars and 49 medium/low voltage 20/0.4 kV substations rated power from 50 kVA to 1 MVA. An asynchronous motor with rated power of 110 kW is connected on the bus marked PCC3, a micro hydroelectric power plant with rated power of 100 kVA is connected on the bus marked PCC1, a wind generator (DDSG) of 550 kVA is connected on the bus marked PCC2.
Busbars voltages are presented for the maximum system load of 6.12+j2.01 MVA—Figure 6. Following the proposed algorithm in Figure 4, all the busbars with voltage value lower than threshold of 0.95 p.u. (determined by local DSO) are taken into consideration. According to the proposed algorithm and network voltage profile in Figure 6, the ideal busbar(s) for SVC implementation are nearby the location that is 30 km away from the feeder beginning. However, those busbars are tower substations unsuitable for SVC implementation, hence determined busbars for SVC implementation are PCC1, PCC2 and PCC3 busbars. SVC rated power is determined from the proposed algorithm according to the industry-available modules whose implementation is feasible in distribution systems and in order to improve voltage profile achieving the minimum busbar voltage of 0.95 p.u., determined rated power of SVC is 3 × 100 kvar (SVC). The busbars voltage values after SVC implementation can also be seen in Figure 6.
The modal analysis is performed for two system operation points, namely Operating point 1, with the minimum system load and Operating point 2, with the maximum system load with or without SVC connected on marked buses. Table 3 shows the load flow results for Operating point 1 and Operating point 2 with connected TSC (OP1_tsc; OP2_tsc) and without connected TSC (OP1; OP2).
Using the QR-method in DIgSILENT Power Factory, 43 system modes are observed. All modes have real parts −σ below zero, meaning they are all stable. After implementing SVC, the modal analysis is performed again. The results of the modal analysis are given in the following tables and eigenvalue plot (Figure 7). Table 4 presents system oscillatory modes without implemented SVC for the Operating point 1. Table 5 points to SVC having a small positive influence on damping of the dominant system modes—mode 27 and mode 28 and their shift on the left side on the s-plane. Table 6 presents the difference for SVC disconnected and connected. Table 7, Table 8 and Table 9 present the oscillatory modes for Operating point 2. SVC implementation influenced the system oscillatory modes similar to operating point 1.
Table 4 presents oscillatory modes for operating point 1—system with the minimum load. The values of mode 27 and 28 are most dominant with a damping ratio ξ of 10.52%. The effect of SVC will therefore be most important on those modes.
A slight shift on the left side of the s-plane can be seen for all system oscillatory modes when SVC are implemented as presented in Table 5.
Implementation of SVC results in a damping ratio increase of 2.28% for dominant system oscillatory modes as presented in Table 6. The influence of implementation for Operating point 1 is presented as oscillatory modes differences in Table 6. It can be observed from the data in Table 6 that the greatest damping ratio difference is achieved on dominant modes.
Maximum loading must also be considered when simulating the systems. Operating point 2 takes the maximum system load into consideration and initial oscillatory modes for that system loading are presented in Table 7.
Similar to the results for Operating point 1, the influence of SVC implementation can be seen as a slight shift on the left side of the s-plane for all system modes as in Table 8.
The damping ratio increase of the dominant system modes is more significant for Operating point 2 when SVC are in operation as presented in Table 9.
The influence of implemented SVC on oscillatory stability is performed in the time domain too observing 100 kVA synchronous generator (micro hydro-power plant) speed oscillation. A small system disturbance—the sudden disconnection of the wind generator connected to PCC2 is initiated for the Operating point 2 (approx. 9% of change of the total system generation). The change in generator speed can be seen in Figure 8. When set for voltage control, SVC operation shows a slight decrease in the magnitude of the generator speed oscillation.
The obtained modal analysis and time-domain analysis results point to a slightly positive effect of distribution-level SVC devices on the oscillatory stability of the rural distribution network.

4.2. SVC Influence Onasynchronous Motor Start

The observation of SVC influence on the distribution network performance is extended on 110kW asynchronous motor start. The simulations are done for the minimum system load—operating point 1 and with SVC’s control mode set to voltage control, positive sequence with a local setpoint. The chosen control mode has a significant effect on observed bus parameters. As the overall voltage profile of the simulated network showed values below allowed limits and voltage sags are observed during motor start, voltage control was selected instead of reactive power control. Figure 9 illustrates the voltage profile improvement when SVC are implemented.
A further analysis shows the influence of SVC on asynchronous motor starting torque, speed ramp up and voltage sag duration. Although the peak value of the electrical torque is higher, the duration of the start-up transition process is 20% shorter when SVC are implemented—Figure 10.
Higher electrical torque causes faster ramp-up of the simulated motor—Figure 11.
Implemented SVC devices beneficially influenced the initial voltage value and the voltage sag duration during the motor start on the busbar where motor is connected—Figure 12.

5. Conclusions

According to the algorithm proposed in this paper, static var compensators have been implemented in the real rural distribution network with integrated micro hydroelectric synchronous generator, DDSG wind generator and low-voltage asynchronous motor loads. Beside the network voltage profile improvement, the implementation resulted in a slight shift on the left side of the s-plane for all system oscillatory modes and slight damping ratio increase for the dominant system oscillatory modes and minor damping ratio decrease for non-dominant system oscillatory modes. The damping ratio of the dominant system oscillatory modes have been increased with maximal system loading while non-dominant system modes experienced slight damping decrease. After initiating a small disturbance in the system, SVC implementation resulted in a slight magnitude decrease of speed oscillations of micro hydroelectric synchronous generator. A decrease of the motor ramp up time as well as the decrease of the voltage sag duration during the asynchronous motor start was shown with SVC implementation. The overall analysis in this paper indicates that the distribution-level static var compensators have a small positive effect on the oscillatory stability of the modern rural distribution network and beneficial influence on the asynchronous motor starting. Due to multiple constraints when using conventional allocation techniques, a novel algorithm that incorporates the mentioned constraints to determine a suboptimal solution with acceptable return of investment and improved investment timeframe is proposed. Authors of this paper believe that an expanded set of the constraints will be helpful in further research on the FACTS allocation problem while the modal (oscillatory) analysis will be useful in understanding the network dynamic properties which will lead to an increase of FACTS implementation in future networks. Future research should consider other variables in the multi-disciplinary challenge of FACTS allocation with a focus on finding an optimal economic solution for a given system.

Author Contributions

Conceptualization, F.R.; methodology, F.R. and H.G.; validation, P.M. and H.G.; formal analysis, F.R.; investigation, F.R.; resources, P.M.; data curation, I.P.; writing—original draft preparation, F.R.; writing—review and editing, H.G.; visualization, F.R.; supervision, P.M. and I.P.; project administration, P.M. All authors have read and agreed to the published version of the manuscript.

Funding

This research received no external funding.

Acknowledgments

We would like to thank the Faculty of Electrical Engineering, Computer Science and Information Technology Osijek for the support during the preparation of this paper. This paper is part of a project called “Review of methodology for positioning and sizing of FACTS devices in transmission networks.”

Conflicts of Interest

The authors declare no conflict of interest.

References

  1. IEEE PES Task Force on Microgrid Stability Analysis and Modeling. Microgrid Stability Definitions, Analysis, and Modeling; Technical Report (PES-TR66); IEEE Power & Energy Society: Piscataway, NJ, USA, 2018; p. 120. [Google Scholar]
  2. Kundur, P.; Balu, N.J.; Lauby, M.G. Power System Stability and Control; McGraw-hill: New York, NY, USA, 1994; Volume 7. [Google Scholar]
  3. Hsu, Y.Y.; Shyue, S.W.; Su, C.C. Low Frequency Oscillations in Longitudinal Power Systems: Experience With Dynamic Stability of Taiwan Power System. IEEE Trans. Power Syst. 1987, 2, 92–100. [Google Scholar] [CrossRef]
  4. Huang, Y.; Dong, C.; Liu, D.; Liao, Q.; Chen, E.; Zeng, Z. Research on indicators of early warning in low frequency oscillation based on energy function theory. In Proceedings of the 2011 Asia-Pacific Power and Energy Engineering Conference, Wuhan, China, 25–28 March 2011; pp. 8–12. [Google Scholar]
  5. Goswami, A.K.; Gupta, C.P.; Singh, G.K. Minimization of voltage sag induced financial losses in distribution systems using FACTS devices. Electr. Power Syst. Res. 2011, 81, 767–774. [Google Scholar] [CrossRef]
  6. Padiyar, K.R. FACTS Controllers in Power Transmission and Distribution; New Age International: Delhi, India, 2007. [Google Scholar]
  7. Morren, J.; Pierik, J.; de Haan, S.W.H. Inertial response of variable speed wind turbines. Electr. Power Syst. Res. 2006, 76, 980–987. [Google Scholar] [CrossRef]
  8. Nanou, S.I.; Papakonstantinou, A.G.; Papathanassiou, S.A. A generic model of two-stage grid-connected PV systems with primary frequency response and inertia emulation. Electr. Power Syst. Res. 2015, 127, 186–196. [Google Scholar] [CrossRef]
  9. Tamimi, B.; Canizares, C.; Bhattacharya, K. System stability impact of large-scale and distributed solar photovoltaic generation: The case of Ontario, Canada. IEEE Trans. Sustain. Energy 2013, 4, 680–688. [Google Scholar] [CrossRef]
  10. Srivastava, A.K.; Kumar, A.A.; Schulz, N.N. Impact of distributed generations with energy storage devices on the electric grid. IEEE Syst. J. 2012, 6, 110–117. [Google Scholar] [CrossRef]
  11. Salehi, V.; Afsharnia, S.; Kahrobaee, S. Improvement of voltage stability in wind farm connection to distribution network using FACTS devices. In Proceedings of the IECON 2006—32nd Annual Conference on IEEE Industrial Electronics, Paris, France, 6–10 November 2006; pp. 4242–4247. [Google Scholar]
  12. Ghaemi, S.; Hamzeh Aghdam, F.; Safari, A.; Farrokhifar, M. Stochastic economic analysis of FACTS devices on contingent transmission networks using hybrid biogeography-based optimization. Electr. Eng. 2019, 101, 829–843. [Google Scholar] [CrossRef]
  13. Maity, S.; Ramya, R. A Comprehensive Review of Damping of Low Frequency Oscillations in Power Systems. Int. J. Innov. Technol. Explor. Eng. 2019, 8, 133–138. [Google Scholar]
  14. Shahriar, M.S.; Shafiullah, M.; Rana, M.J. Stability enhancement of PSS-UPFC installed power system by support vector regression. Electr. Eng. 2018, 100, 1601–1612. [Google Scholar] [CrossRef]
  15. Narain, A.; Srivastava, S.K. An Overview of Facts Devices used for Reactive Power Compensation Techniques. Int. J. Eng. Res. 2015, V4, 81–85. [Google Scholar] [CrossRef]
  16. Pali, B.S.; Bhowmick, S.; Kumar, N. Newton-Raphson power flow models of static VAR compensator. In Proceedings of the 2012 IEEE 5th India International Conference on Power Electronics (IICPE), Delhi, India, 6–8 December 2012; pp. 9–13. [Google Scholar]
  17. Grunbaum, R. Facts for voltage control and power quality improvement in distribution grids. IET Semin. Dig. 2008, 2008, 23–24. [Google Scholar] [CrossRef] [Green Version]
  18. Noorozian, M.; Taylor, C.W. SVC and STATCOM for Electric Utility Application. In Proceedings of the IEEE PES Transmission and Distribution Conference and Exposition, Dallas, TX, USA, 7–12 September 2003; Volume 3, pp. 1192–1199. [Google Scholar]
  19. Badavath, D.; SASTRY, S. Design and Analysis of Multi Level D-STATCOM to Improve the Power Quality. IEEE Xplore 2014, 4, 392–396. [Google Scholar]
  20. Yusuf, S. Design of a Prototype D-Statcom for Voltage Sag. In Proceedings of the PECon National Power and Energy Conference, Kuala Lumpur, Malaysia, 29–30 November 2004; pp. 61–66. [Google Scholar]
  21. Gerbex, S.; Cherkaoui, R.; Germond, A.J. Optimal Location of FACTS Devices to Enhance Power System Security. In Proceedings of the 2003 IEEE Bologna Power Tech Conference Proceedings, Bologna, Italy, 23–26 June 2003. [Google Scholar]
  22. Chintam, J.R.; Geetha, V.; Mary, D. Optimal relocating of compensators for real-reactive power management in distributed systems. J. Electr. Eng. Technol. 2018, 13, 2145–2157. [Google Scholar]
  23. Mori, H. Optimal allocation of FACTS devices in distribution systems. In Proceedings of the 2001 IEEE Power Engineering Society Winter Meeting, Columbus, OH, USA, 28 January–1 February 2001; pp. 936–937. [Google Scholar] [CrossRef]
  24. Najafi, S.R.; Abedi, M.; Hosseinian, S.H. A novel approach to optimal allocation of SVC using genetic algorithms and continuation power flow. In Proceedings of the 2006 IEEE International Power and Energy Conference, Putra Jaya, Malaysia, 28–29 November 2006; pp. 202–206. [Google Scholar]
  25. Gibbard, M.J.; Pourbeik, P.; Vowles, D.J. Small-Signal Stability, Control and Dynamic Performance of Power Systems; The University of Adelaide Press: Adelaide, Australia, 2016; Volume 14, ISBN 9780980723038. [Google Scholar]
  26. Ramesh, G.; Kaladhar, G.; Anil Kumar, S.V.D. A Novel Design of DC Voltage Controller and Asymmetric Twin Converter Topology based D-STATCOM used for Induction Drive Application. Int. J. Eng. Res. Manag. 2015, 2, 41–46. [Google Scholar]
  27. Bandopadhyay, S.; Roy, A. Digital Simulation of 48 Pulse GTO Based Statcom and Reactive Power Compensation. Int. J. Recent Innov. Trends Comput. Commun. 2014, 2, 824–827. [Google Scholar]
  28. Abhilasha, G.D.Y.; Sharma, N. Modeling and Analysis of 24-pulse GTO-Based STATCOM for Voltage Regulation. Int. Res. J. Eng. Technol. 2016, 3, 2401–2404. [Google Scholar]
  29. Eltamaly, A.M.; Elghaffar, A.N.A.; Sayed, Y.; El-Sayed, A.-H.M. Enhancement of Power System Quality Using Static Synchronous Compensation (STATCOM). Int. J. Mechatron. Electr. Comput. Technol. 2018, 9, 3966–3974. [Google Scholar]
  30. El-Moursi, M.S.; Sharaf, A.M. Novel controllers for the 48-pulse VSC STATCOM and SSSC for voltage regulation and reactive power compensation. IEEE Trans. Power Syst. 2005, 20, 1985–1997. [Google Scholar] [CrossRef]
  31. Maity, S.; Ramya, R.; Pudic, D.; Banovac, E.; Badavath, D.; SASTRY, S.; Chavan, G.; Acharya, S.; Bhattacharya, S. Implementation of Shunt and Series FACTS Devices for Overhead Transmission Lines. Int. J. Recent Innov. Trends Comput. Commun. 2018, 4, 2009–2017. [Google Scholar]
  32. Khan, S.; Meena, R.; Bhowmick, S. Small signal stability improvement of a single machine infinite bus system using SVC. In Proceedings of the 2015 Annual IEEE India Conference (INDICON), New Delhi, India, 17–20 December 2015; pp. 1–5. [Google Scholar]
  33. Gelen, A.; Yalcinoz, T. The behavior of thyristor switched capacitor (TSC) installed in an infinite bus system. In Proceedings of the IEEE EUROCON 2009, Saint Petersburg, Russia, 18–23 May 2009; pp. 614–617. [Google Scholar] [CrossRef]
  34. Pudic, D.; Banovac, E. Analysis of Some Important Indicators of the Croatian Electric Power Distribution System. Econ. East. Croat. Yesterday Today Tommorow 2015, 4, 454–463. [Google Scholar]
  35. HEP DSO Annual Report; HEP ODS d.o.o.: Zagreb, Croatia, 2019; pp. 16–17.
  36. Ambriz-Pérez, H.; Acha, E.; Fuerte-Esquivel, C.R. Advanced SVC models for Newton-Raphson load flow and Newton optimal power flow studies. IEEE Trans. Power Syst. 2000, 15, 129–136. [Google Scholar] [CrossRef]
  37. Kulworawanichpong, T. Simplified Newton-Raphson power-flow solution method. Int. J. Electr. Power Energy Syst. 2010, 32, 551–558. [Google Scholar] [CrossRef]
  38. Wasley, R.G.; Shlash, M.A. Newton-Raphson Algorithm for 3-Phase Load Flow. Proc. Inst. Electr. Eng. 1974, 121, 630–638. [Google Scholar] [CrossRef]
  39. Sailaja Kumari, M.; Priyanka, G.; Sydulu, M. Comparison of genetic algorithms and particle swarm optimization for optimal power flow including FACTS devices. In Proceedings of the 2007 IEEE Lausanne Power Tech, Lausanne, Switzerland, 1–5 July 2007; pp. 1105–1110. [Google Scholar]
  40. Lee, K.Y.; Farsangi, M.M.; Nezamabadi-pour, H. Hybrid of analytical and heuristic techniques for FACTS devices in transmission systems. In Proceedings of the 2007 IEEE Power Engineering Society General Meeting, Tampa, FL, USA, 24–28 June 2007; pp. 1–8. [Google Scholar]
  41. Bansal, R.C. Optimization methods for electric power systems: An overview. Int. J. Emerg. Electr. Power Syst. 2005, 2. [Google Scholar] [CrossRef]
  42. Panciatici, P.; Campi, M.C.; Garatti, S.; Low, S.H.; Molzahn, D.K.; Sun, A.X.; Wehenkel, L. Advanced optimization methods for power systems. In Proceedings of the 2014 Power Systems Computation Conference, Wroclaw, Poland, 18–22 August 2014; pp. 1–18. [Google Scholar]
  43. Žnidarec, M.; Šljivac, D.; Došen, D.; Nakomčić Smaragdakis, B. Performance evaluation of simple PV microgrid energy management system. In Proceedings of the International Conference on Smart Systems and Technologies 2020, Osijek, Croatia, 14–16 October 2020. [Google Scholar]
Figure 1. Generic voltage source converter (VSC) model, source [25].
Energies 13 05516 g001
Figure 2. Generic thyristor switched capacitor (TSC) model [18].
Energies 13 05516 g002
Figure 3. Number of metering points and grid losses for the 21 distribution areas of Croatian DSO [35].
Energies 13 05516 g003
Figure 4. Algorithm for determining Flexible Alternating Current Transmission System (FACTS) implementation feasibility.
Energies 13 05516 g004
Figure 5. Network model, PCC1 with connected SVC and micro hydroelectric power plant; PCC2 with connected SVC and wind generator; PCC3 with connected SVC and asynchronous motor.
Energies 13 05516 g005
Figure 6. DIgSILENT Power Factory simulation results—network voltage profile without SVC (gray) and with implemented SVC (orange) on PCC1, PCC2 and PCC3 busbar.
Energies 13 05516 g006
Figure 7. Eigenvalue plot, operating point 1, SVC disconnected.
Energies 13 05516 g007
Figure 8. Micro hydro-power plant generator speed in p.u. after initiating a small system disturbance—Operating point 2 (red—with SVC implemented, black—without SVC implemented).
Energies 13 05516 g008
Figure 9. Voltage values during the 110 kW asynchronous motor start (without SVC implemented—solid line, with SVC implemented—dashed line).
Energies 13 05516 g009
Figure 10. Electrical torque during the 110 kW asynchronous motor start with SVC implemented (dashed line) and without SVC implemented (solid line).
Energies 13 05516 g010
Figure 11. 110 kW asynchronous motor starting speed with SVC implemented (dashed line) and without SVC implemented (solid line).
Energies 13 05516 g011
Figure 12. Voltage sag on 400 V bus during the 110 kW asynchronous motor start with SVC implemented (dashed line) and without SVC implemented (solid line).
Energies 13 05516 g012
Table 1. Neighboring Grid Characteristics [34].
CountryBosnia and HerzegovinaCroatiaKosovoMacedoniaSerbia
Basic Data
Metering Points1,480,9142,350,885483,251827,3663,554,417
Electrical Energy Consumption [TWh/year]8.46214.7533.4685.25227.839
Supply Area Size [km2]53,21756,59410,90725,71377,696
Total Length of Distribution Network [km]94,955105,09419,45319,462153,963
Losses [%]13.118.6833.5217.4114.14
Table 2. Elektra Sisak area Characteristics [35].
Metering PointsElectrical Energy Consumption [kWh]
High Voltage179,719,480
Medium Voltage6060,249,284
Low Voltage (Enterprise)453368,679,239
Low Voltage (Household)55,622141,525,113
Table 3. Results of load flow calculation.
ModeReal Power [MW]Reactive Power [MVAr]
OP1OP1_tscOP2OP2_tscOP1OP1_tscOP2OP2_tsc
Generation0.550.550.550.550.270.270.270.27
External Infeed2.562.506.106−0.50.421.142.08
Load P(U)2.822.776.125.980.930.912.011.97
Load P(Un)2.932.937.037.030.960.962.312.31
Load P(Un-U)0.110.160.911.040.040.050.300.34
Motor Load0.110.110.110.1100.0100.01
Grid Losses0.180.180.420.45−1.2−1.13−0.61−0.52
Table 4. Oscillatory modes, operating point 1, SVC disconnected.
ModeReal Part σImaginary Part ωDamping Ratio ξ
Mode 12−23.3763.7534.42%
Mode 13−23.37−63.7534.42%
Mode 14−13.2455.4423.23%
Mode 15−13.24−55.4423.23%
Mode 27−0.100.9810.52%
Mode 28−0.10−0.9810.52%
Table 5. Oscillatory modes, operating point 1, SVC connected.
ModeReal Part σImaginary Part ωDamping Ratio ξ
Mode 12−23.4464.0734.36%
Mode 13−23.44−64.0734.36%
Mode 14−13.3056.1523.04%
Mode 15−13.30−56.1523.04%
Mode 27−0.110.9810.76%
Mode 28−0.11−0.9810.76%
Table 6. Oscillatory modes, operating point 1, difference SVC connected/disconnected.
ModeReal Part Difference ΔσImaginary Part Difference ΔωDamping Ratio Difference Δξ
Mode 120.30%0.50%-0.17%
Mode 130.30%0.50%-0.17%
Mode 140.45%1.28%-0.82%
Mode 150.45%1.28%-0.82%
Mode 2710.00%0%2.28%
Mode 2810.00%0%2.28%
Table 7. Oscillatory modes, operating point 2, SVC disconnected.
ModeReal Part σImaginary Part ωDamping Ratio ξ
Mode 12−22.5958.7635.89%
Mode 13−22.59−58.7635.89%
Mode 14−12.9650.8024.73%
Mode 15−12.96−50.8024.73%
Mode 27−0.090.8610.32%
Mode 28−0.09−0.8610.32%
Table 8. Oscillatory modes, operating point 2, SVC connected.
ModeReal Part σImaginary Part ωDamping Ratio ξ
Mode 12−22.7259.6035.62%
Mode 13−22.72−59.6035.62%
Mode 14−13.0852.8124.05%
Mode 15−13.08−52.8124.05%
Mode 27−0.100.8511.82%
Mode 28−0.10−0.8511.82%
Table 9. Oscillatory modes, operating point 2, difference SVC connected/disconnected.
ModeReal Part Difference ΔσImaginary Part Difference ΔωDamping Ratio Difference Δξ
Mode 120.58%1.43%−0.75%
Mode 130.58%1.43%−0.75%
Mode 140.93%3.96%−2.75%
Mode 150.93%3.96%−2.75%
Mode 2711.11%−1.16%14.53%
Mode 2811.11%−1.16%14.53%
Publisher’s Note: MDPI stays neutral with regard to jurisdictional claims in published maps and institutional affiliations.

