1. Introduction
Research and innovation (R&I) forms a key component of the EU’s strategy calling for the delivery of stronger, lasting economic growth and the creation of more and higher quality jobs while respecting and promoting social and environmental objectives. The constant creation of new ideas and their transformation into technologies and products forms a powerful cornerstone for the 21st century society, with universities, research institutes and innovative companies cultivating this process. The EU R&I strategy ensures that innovative ideas are turned into new products and services in an effort to create growth, quality jobs and address societal challenges. R&I investment directed to research organisations, universities and innovative technology companies are key component of the EU’s strategy, complemented with appropriate framework conditions, market regulation and the supply of the required skills and low-cost capital. Guided by the goals of the Innovation Union flagship initiative, the EU aims to radically change the way public and private R&I sectors cooperate, remove bottlenecks (like expensive patenting, market fragmentation, limited access to capital and skill shortages) that prevent the market development of innovative ideas and increase R&I investments to 3% of EU GDP. The central role of R&I in EU policy is demonstrated by the increased budget allocations to Horizon Europe program, the InvestEU fund (to mobilise private R&I) and the recent EU Green deal.
The “Clean Planet for all” long-term strategy (
https://ec.europa.eu/clima/policies/strategies/2050_en) of the European Commission (EC) suggests that the acceleration of research, innovation, entrepreneurship and human capital investment are key for the achievement of a climate neutral Europe by mid-century while boosting the EU’s industrial competitiveness. In this context, it is crucial to improve the understanding of how increased R&I spending in low-carbon technologies can induce innovation and affect firms’ productivity, economic growth and societal transitions in order to better inform policy makers on the role of low-carbon R&D towards decarbonization. In turn, policymakers can deploy a series of policy instruments to promote low-carbon innovation directly and indirectly, including investment and subsidies in R&D and knowledge diffusion (e.g., open access to science results), investment in human capital upgrade (through education and training), developing a regulatory and policy environment that stimulates the entry and exit of new businesses, promoting venture capital and access to low-cost finance for businesses.
There is very little quantitative macro and socio-economic assessment of the impacts, costs and benefits associated to low-carbon R&D investment and how these are financed. Existing literature has analysed the R&D contribution to improve the costs and performance of low-carbon technologies [
1,
2], but not accounting for the R&D impacts at the macro-economy level. Energy system models are commonly used to explore low-emission transition pathways but do not capture the macro and socio-economic impacts of climate and innovation policies; conventional Computable General Equilibrium (CGE) models do not explicitly represent technological learning, innovation and diffusion. In order to bridge this research, the GEM-E3-FIT CGE model is further developed to consistently assess the interactions between energy system decarbonisation, low-carbon technology development and investment in public and private low-carbon R&D [
3]. Due to its detailed treatment of energy technologies and sectors, technical progress, innovation and climate issues, GEM-E3-FIT model appears to be the most suitable modelling framework for exploring the socio-economic impacts of low-carbon innovation [
4].
The improved macroeconomic modelling framework with enhanced representation of low-carbon R&I is used to analyse the synergies between climate and innovation policies, in particular how investment in low-carbon R&I and human capital upgrade would affect the European economy and industries within a decarbonisation context. The model-based assessment of the economic, trade and employment impacts of low-carbon R&I can be used to provide practical recommendations to EU policy makers on the potential allocation of ETS revenues towards R&D in low-carbon technologies to fully exploit the clean energy innovation benefits (i.e., enhanced competitiveness and productivity growth).
The main methodological novelty of the paper is the detailed modelling of technological change in a multi-sectoral CGE model combined with the representation of sectors manufacturing low-carbon technologies. In this way, the analysis provides novel insights on the activity growth and competitiveness impacts of innovation policies, capturing in detail the inter-industrial relations and the potential industry effects that being a global technology leader might bring about [
5]. In addition, the distinction between public and private R&D in applied modelling sheds light on their differential socio-economic impacts, while the detailed representation of knowledge spillovers provides an enhanced framework to study the complex linkages between low-carbon innovation, human capital upgrade and decarbonisation.
This paper is organised as follows: In
Section 2, we conduct a literature review on the role of low-carbon innovation and we provide an overview of how the modelling tools incorporate technical change. In
Section 3, we provide a detailed description of the modelling approach and scenarios examined, focusing on the representation of low-carbon technology innovation and clean energy manufacturing markets.
Section 4 includes the analysis of model-based results focusing on the macro-economic, employment and competitiveness impacts of low-carbon innovation.
Section 5 includes a discussion and conclusions.
3. Methodology
In order to consistently assess the macro-economic impacts of low-carbon R&I, we further improve the GEM-E3-FIT model to represent low-carbon R&D expenditure—differentiated into public and private R&D—and its relation with productivity improvements, innovation spillovers, the workers’ skill levels and the households’ decision for schooling and education linked with human capital development and firms’ absorptive capacity [
30]. In addition to model extensions, key model parameters are updated with empirically validated evidence including the link between R&I expenditure and human capital with productivity growth [
42].
3.1. Brief Description of GEM-E3-FIT
GEM-E3-FIT is a multi-sectoral, CGE model which analyses the complex interactions between the economy, the energy system and the environment. GEM-E3-FIT represents 46 regions (EU Member States are represented separately) and 51 production sectors linked through endogenous bilateral trade flows. It covers the interlinkages between productive sectors, consumption, labour and capital, bilateral trade, innovation and investment dynamics (
Figure 1). GEM-E3-FIT is dynamic driven by accumulation of knowledge, capital and equipment until 2050. The model ensures that the economic system remains in general equilibrium in alternative scenario simulations.
Each national economy is formed by a set of representative firms and a representative household whose interactions are governed by endogenously-derived prices. Firms maximize profits, considering the possibilities of substitution between capital, labour, materials and energy. Households maximize their intertemporal welfare under a budget constraint choosing the optimal level for current and future consumption levels. Households receive income from labour supply and from holding shares in companies. Firms’ decision on investments is driven by the rate of return on capital and its replacement cost. Trade modelling is based on the Armington hypothesis that domestic and imported goods are imperfect substitutes. In GEM-E3-FIT, the supply mix of each good is represented as a multi-level nested constant elasticity of substitution (CES) function: at the upper level, firms decide on the optimal mix between domestically produced and imported goods; at the next level, the demand for imports is split by country of origin.
Technology constrains the set of paths upon which agents can make their investment and consumption choices. The standard technology representation in CGEs uses nested CES production functions that differentiate capital, labour, energy and material inputs, while the amount of economy-wide physical capital is considered fixed within a period. GEM-E3-FIT includes a detailed representation of energy system technologies as distinct sectors calibrated to recent EUROSTAT, GTAP and IEA datasets and covers fiscal elements, including taxes, subsidies and social security contributions.
GEM-E3-FIT includes several features that go beyond a conventional CGE approach, enabling an enhanced representation of socio-economic implications of climate and innovation policies. Its advanced features include: a detailed coverage of the financial sector [
38], innovation-induced productivity growth through R&D, detailed modelling of the energy system [
43], and disaggregated representation of employment by skill [
42].
3.2. Endogenous Representation of Clean Energy Markets
Most global energy-economy models fail to represent the domestic industry effects that being a global technology leader might bring about and thus their results may be misleading [
5]. To address this caveat, GEM-E3-FIT includes the manufacturing of low-carbon products and equipment as separate production sectors. The model consistently derives the future development of low-carbon manufacturing and trade patterns under alternative assumptions. GEM-E3-FIT database is extended to allow for a distinct representation of low-carbon technology producers in economic terms, namely for solar PV, wind, electric vehicles, batteries and biofuels. Data about the size, market shares, cost structure and trade flows of the above sectors are not included in GTAP and are derived from supplementary data sources, including Fraunhofer [
44], Navigant [
45], CEMAC [
46] and IEA [
47]. For example, IEA data [
47] is used for the demand (sales) and manufacturing volumes of EVs and batteries which are combined with base year technology prices from [
3] to estimate production and trade (in economic terms) of EVs in each country. The cost structure of low-carbon equipment is derived from [
48,
49] in terms of inputs required by other sectors (i.e., metals, electric equipment, machinery etc.) to produce clean energy products, which are different from the cost structure of fossil-fuel technologies. GEM-E3-FIT integrates differences in low-carbon technology production costs across countries as derived from [
46]. Detailed data handling processes (i.e., RAS routines) are developed to ensure full consistency of GEM-E3-FIT Input-Output tables including low-carbon manufacturing with GTAP data, e.g., the production of conventional ICE and EVs sums up to GTAP sector 43 “Manufacture of motor vehicles, trailers and semi-trailers’ [
40]. This allows capturing consistently the potential growth effects driven by the uptake of low-carbon industries and innovation, as well as the changes in competitiveness and trade flows induced by ambitious decarbonisation and low-carbon innovation.
3.3. Modelling of Technological Change and R&D
GEM-E3-FIT represents public and private low-carbon R&I, knowledge spillovers and absorption linked to human capital and their impacts on technology costs. Modelling of technological change in GEM-E3-FIT draws on the endogenous growth theory [
11,
50]. In GEM-E3-FIT, technology progress is endogenous deriving from spending in R&I while productivity improvements are based on two-factor learning curves depending on learning-by-doing and R&D expenditure from the private and public sector. The learning-by-doing component represents the productivity gained through cumulative production (i.e., experience and economies of scale), while R&D learning describes the cost improvement for each doubling of cumulative R&D expenditure.
In conventional CGE modelling, total factor productivity (TFP) is determined exogenously in the baseline scenario. In GEM-E3-FIT, TFP development is endogenised as it includes an exogenous and an endogenous part, which represents innovation-induced growth and is composed of: (i) the learning by doing effect, (ii) the learning by research effect, (iii) the impact of knowledge spillovers, and (iv) the human capital stock measure. More precisely, TFP is decomposed into a part related to learning by doing, a part related to R&D expenditure and a part related to spillovers, i.e.,:
where
denote the productivity growth due to learning by doing, learning by R&D and innovation spillovers, respectively.
Learning by doing is assumed to increase with cumulative production (“Wrights law”), so that
where
represents cumulative production up to period t and the parameter lbd denotes the percentage cost reduction induced by an increase in cumulative production given by learning rate LR. Namely:
Learning rates for low-carbon technologies are based on a comprehensive literature review in [
3] and are presented in
Table 1.
GEM-E3-FIT separates public from private R&D expenditures. Public R&D is set exogenously, while private firms decide upon the optimal R&D spending so as to increase productivity and maximize their profits. Each sector optimizes allocation of resources in R&D simultaneously with decisions about acquiring capital, labour, materials and energy. R&D expenditures create demand for R&D services addressed to the R&D supply sector, which is represented as a separate sector in GEM-E3-FIT. Private R&D expenditure are undertaken by firms to develop product, process or other types of innovations, enhance firm productivity, reduce their production costs and improve their competitive position relative to other firms. R&D expenditures generate a stock of knowledge that in turn is linked to productivity increase, which is provided in the following Equations (4) and (5), where
is the optimal demand of firms for R&D,
is the value share of R&D expenditures in production costs,
represents the total sales of the firm,
is selling price and
is the unit cost of R&D:
Public and private R&D expenditures accumulate over time increasing the stock of knowledge that leads to TFP growth:
where
represents the cumulative investment in R&D and
denotes the percentage cost reduction associated with a doubling in cumulative R&D, which is derived from [
3]. TFP growth may also be induced by spillovers from R&D performed in other regions and sectors which may be driven by foreign direct investment, trade and transfers of intellectual property [
51]. Kirchherr and Urban focus on international technology transfer schemes [
52]. The impact of spillovers on TFP growth follows:
where
absorptioni,r represents the absorption capacity of sector i in region r and
spilloveri,j,r,s, denotes the rate of spillover from sector j in region s to sector i in region r. These spillover rates are estimated in [
30] by using the patent citation methodology of Verspagen [
53].
The availability of human capital is essential to enable productivity growth induced by R&D and knowledge spillovers. The index of human capital stock is constructed based on the shares of each skill type to the total labour force; these indicate that the respective skills embodied at high skill type are more productive relative to those in lower skill types [
9]. The capacity of firms to absorb knowledge spillovers is linked to human capital availability, especially related to skilled labour. The accumulation of public R&D knowledge stock is global assuming perfect spillovers to other regions, while private R&D can be diffused through bilateral trade of goods and services and through knowledge spillovers based on a patent citations approach for low-carbon technologies. R&D expenditure has been widely used as an indicator of innovation, while patents are also widely used as output-based indicators. Generation of patents does not only have a direct positive effect on the industry that produces them, but also impacts positively other industries through knowledge spillovers. These spillovers benefit the country and industry that receives them, increase the income of innovator through royalties and reduce the monopoly rents of the innovator.
Productivity generated through R&D is diffused into other sectors and countries according to:
3.4. Scenario Design
R&D investment is a key driver for cost reduction for low-carbon technologies, with clean energy R&D increasing in recent years and in 2017 amounted to
$9.9 bn [
54]; however, government R&D spending stayed flat at
$5.1 billion despite the creation of Mission Innovation at the Paris conference in 2015. Europe maintained its lead in low-carbon R&D rising to
$2.7 billion, with the US and China following closely; China leads the R&D in solar technologies. Among the leading economies, Japan registers the largest energy R&D expenditure as a share in GDP, ahead of China and Europe [
55].
The EU strategy calls for increased R&D expenditure to stimulate growth and create quality jobs, with an increasing part of them directed to low-carbon technologies. To assess the socio-economic impacts of low-carbon R&D, a series of policy scenarios are modelled with GEM-E3-FIT (
Table 2). These aim to explore the complex interactions between decarbonisation and low-carbon innovation, with EU carbon revenues used to finance R&D in low-carbon technologies. In all scenarios, public budget neutrality is ensured with the general equilibrium modelling framework. In the policy scenarios, the exogenous part of TFP does not change from Baseline levels, while changes in the endogenous part are driven by increased R&D expenditure and human capital upgrade in alternative scenarios. All other exogenous parameters (i.e., trade or substitution elasticities, value shares, price elasticities etc.) do not change from baseline levels.
To analyse the macro-economic and competitiveness effects of climate and innovation policies, we consider eight scenarios:
A “baseline scenario” (BASE), where all regions implement their current energy, climate and innovation policies by 2030 and do not intensify their efforts beyond 2030. Low-carbon R&D remains constant as a percentage of GDP to 2015 levels. In this scenario, limited climate policies are adopted worldwide in line with the current fragmentation and lack of ambition in the international climate policy landscape.
A “global well-below 2 °C scenario” (2DEG) assuming cost-efficient implementation of the 1000 Gt carbon budget over 2010–2050 (considered equivalent to “well-below 2 °C”) based on the imposition of a global carbon price across all countries. In this scenario the EU achieves a GHG emission reduction of at least 80% over 1990–2050. Low-carbon R&D does not increase from Baseline levels.
We further consider six low-carbon innovation policy scenarios building on 2DEG specifications but assuming that EU countries implement additional investment in low-carbon R&I, either public or private, or/and increase expenditure to human capital development. The split of increased R&D spending in specific low-carbon technologies (PV, wind, biofuels, EVs, batteries and CCS) is determined by their base-year share in global clean energy market. Budget neutrality is ensured in all scenarios; increased low-carbon R&D is financed using a certain share of carbon revenues, while remaining carbon revenues are used to reduce the global interest rate, thus promoting investment required in the decarbonisation context. Innovation and human capital policy interventions can be simulated through various channels in GEM-E3-FIT, including direct government subsidisation to R&D and wages (i.e., for highly-skilled labour), tax credits, reduced barriers to buy patents, facilitation of spillovers and reduced risk premiums through provision of low-cost finance directed to R&D. In the current set-up, we use direct subsidisation of low-carbon R&D and high-skilled workforce as a policy driver, directly influencing productivity improvement and enhanced adoption of low-carbon technologies:
In the “2DEG_GRD” scenario, EU countries use 10% of ETS carbon revenues to finance public low-carbon R&D, which leads to TFP growth in clean energy manufacturing and hence reduced low-carbon technology costs.
In the “2DEG_GRDW” scenario, all countries use 10% of carbon revenues to finance public R&D in clean energy, which leads to an improved TFP and cost reduction globally, which is reinforced by spillovers across regions.
These scenarios reflect the major role of governments in energy innovation, often funding basic and higher-risk research as well as novel low-carbon technologies, which are costly and have uncertain market value.
In the “2DEG_PRD” scenario, EU countries use 10% of carbon revenues for private low-carbon R&D, resulting in improved productivity in the country and industry performing the R&D. Non-EU countries benefit indirectly from EU low-carbon R&D spending through partial diffusion of knowledge spillovers and trade. This reflects intellectual property protection, obstacles for knowledge diffusion and patent spillovers, lack of human capital and costly replication of patents. Each country benefits from increased R&D spending only when its cumulative R&D stock increases beyond a certain threshold (set at 10% of the current global R&D stock). Countries with very limited knowledge stock cannot fully exploit innovation-induced productivity gains due to limitations in human capital, infrastructure, institutions, industrial and innovation base etc.
Public and private R&D can have different effects on the cost and/or performance of clean energy technologies [
56,
57]. Shinnosuke et al. developed a three-factor learning curve for PV costs as a function of cumulative capacity and the knowledge stock accumulated by public and private R&D spending [
58]. They found that public R&D has a lower impact on PV cost reduction in Japan, implying a lower learning rate than private R&D (of about 30%). In addition, various empirical studies point to the different nature and impacts of public and private R&D [
15,
24,
27]. Based on these empirical data, GEM-E3-FIT uses lower learning rates for public R&D relative to their default levels (
Table 1). The 2DEG_GRDH variant is designed to explore this uncertainty and it is assumed that the values of learning rates for public and private R&D are set to be the same.
In the “2DEG_SK” scenario, EU countries use 10% of ETS revenues to subsidise high-skilled jobs required for the clean energy transition in the form of direct wage subsidisation and a reduction of social security contributions for highly-skilled jobs. The subsidisation incentivises households to educate more in order to acquire additional skills needed for the low-carbon transition.
The “2DEG_COMB” scenario combines all policy measures assessed in previous scenarios to quantify the socio-economic impacts of a variety of innovation and education policies. In particular, EU countries use 30% of carbon revenues for financing R&D in low-carbon technologies and for subsidising highly-skilled labour. In this scenario, the policy measures are simultaneously implemented in the model, thus simulating the adoption of a policy portfolio (based on low-carbon innovation and human capital upgrade) in order to boost EU’s economic growth and employment in the decarbonisation context.
4. Results
Public budget neutrality is ensured in the general equilibrium framework and scenario results show the impact of resources shift within the economy (i.e., towards R&D and education), rather than just the impact of additional government spending on specific sectors.
4.1. Energy System Restructuring
The decarbonisation scenarios simulate a future consistent with the Paris Agreement goal to limit global warming to well-below 2 °C relative to pre-industrial levels, with a global CO
2 budget of 1000 Gt over 2010–2050; the EU meets its target to reduce domestic GHG emissions by at least 80% in the period 1990–2050. This is achieved through the imposition of universal carbon price reflecting the cost-optimal mitigation pathway equalizing marginal abatement costs across countries and sectors. To reflect increasing climate policy stringency, the global carbon price increases over time to about 80€/tn CO
2 in 2030 and 290€/tn in 2050, which is consistent with the results of multi-model comparison exercises on mitigation pathways [
59].
Ambitious climate policies lead to structural transformation of global and EU energy systems with increased expansion of renewable energy, accelerated energy efficiency in end-uses and electrification of energy, mobility and heating services. Low-carbon technologies are massively deployed to substitute fossil fuel use, while their costs improve as a result of accelerated learning-by-doing induced by their increased deployment. GEM-E3-FIT incorporates several emission abatement technological options, including RES power generation technologies (wind onshore and offshore, PV, hydro, biomass), EVs, batteries, advanced biofuels, energy efficiency and electrification in end-uses, fuel substitution, and technologies to capture and store carbon dioxide (CCUS) emitted from power plants. Through its wide coverage, GEM-E3-FIT can provide a rigorous assessment of interlinkages between the various mitigation options, i.e., interplay between RES expansion and electrification, competition between advanced biofuels and EVs etc., and can assess the complex dynamics related to energy demand and supply, technology innovation and uptake of low-carbon technologies.
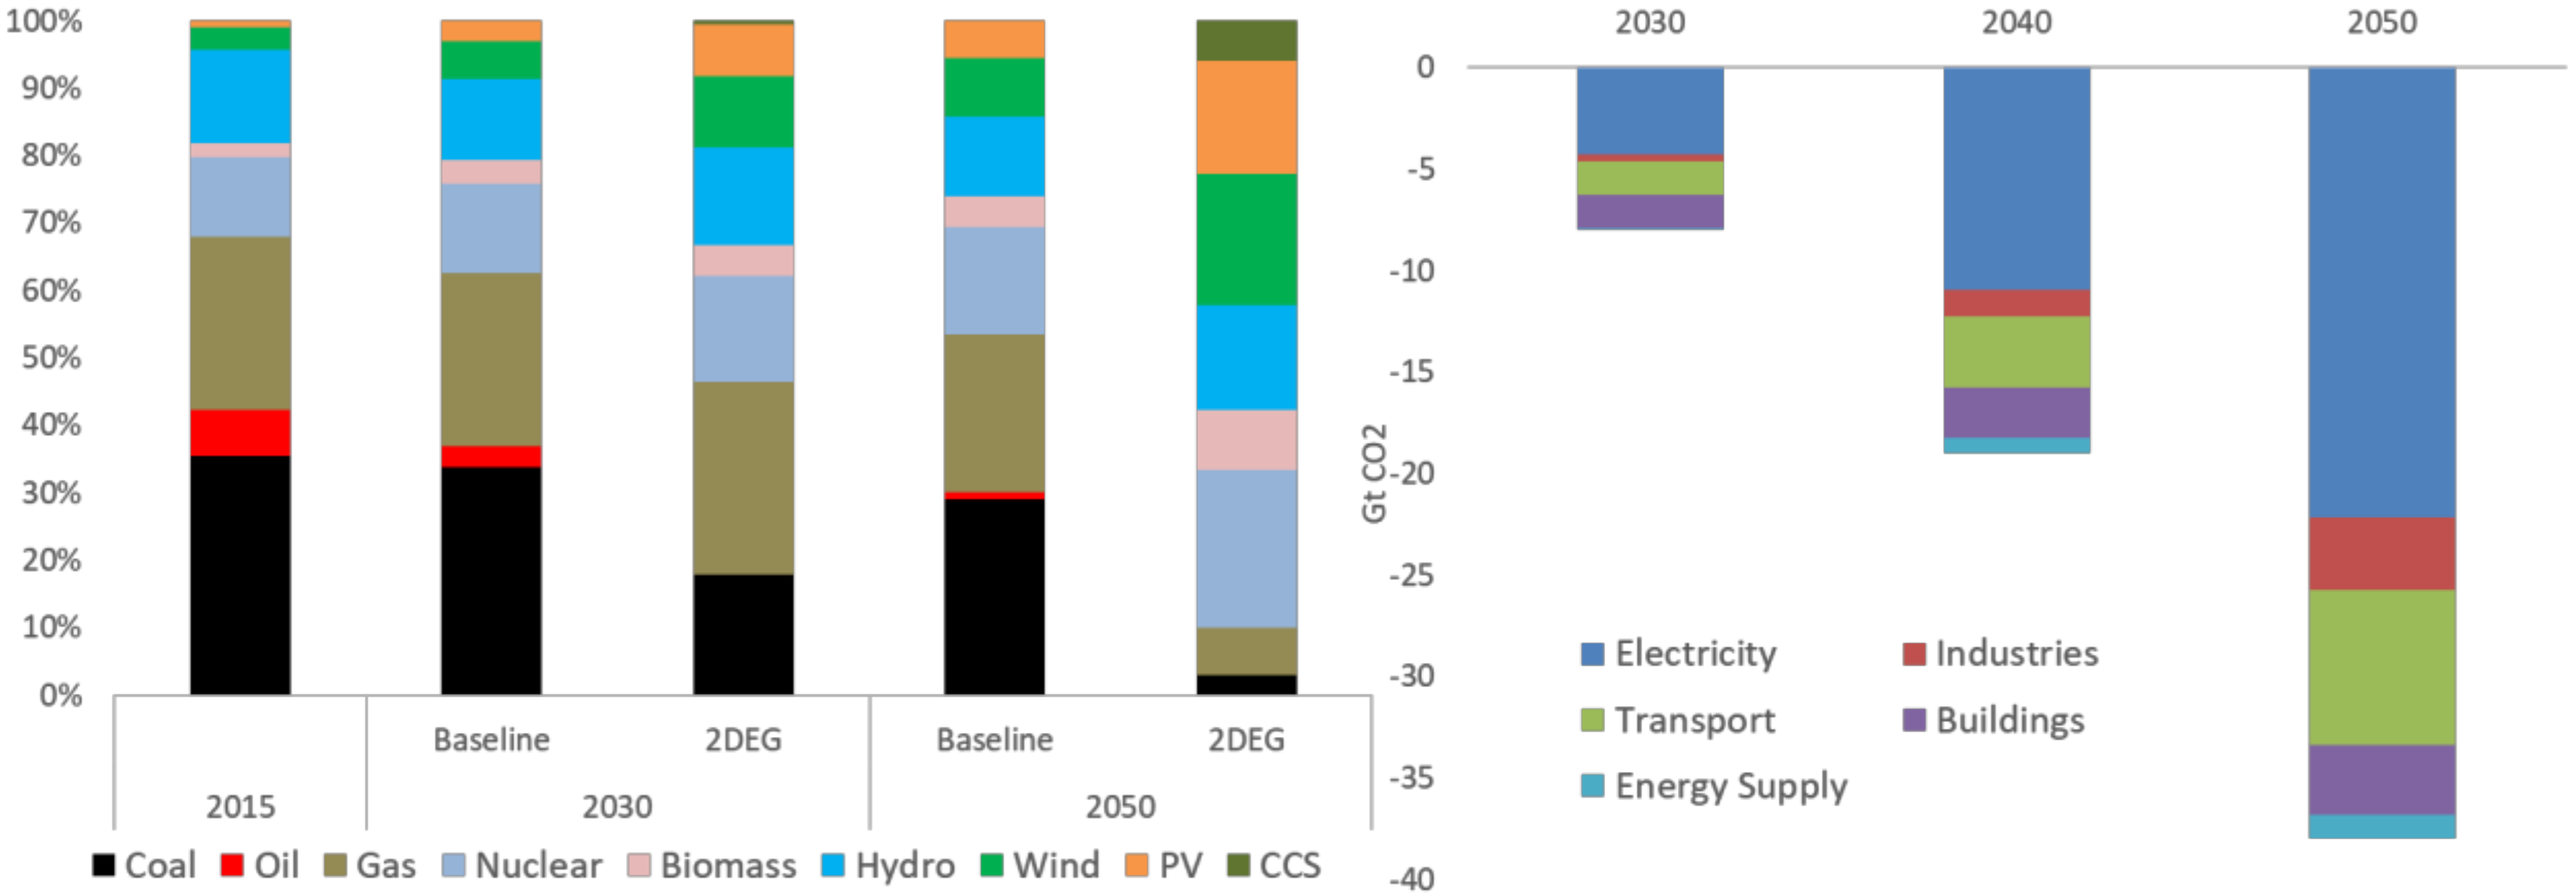
Global CO
2 emissions from fossil fuel combustion are projected to decline from 52 Gt CO
2 in Baseline to about 14 Gt CO
2 in 2DEG scenario in 2050 induced by increased carbon pricing (
Figure 2). The power generation sector is the first to decarbonize and contributes to about 55% of emission reduction effort by 2050 through large-scale expansion of several low-carbon technologies, with are already cost-competitive with fossil-fired power plants in many countries. The electricity sector is rapidly transformed towards a low-emission paradigm with the share of fossil fuels declining from 68% in 2015 to only 8% in 2050 (
Figure 2) accompanied by a rapid expansion of renewable energy and CCS (in specific countries) which is consistent with the projections of prior research using as suite of national energy-economy models [
60]. The electrification of energy services combined with decarbonized power supply is a key mitigation option in hard-to-abate sectors (i.e., industries, heating, transport). Energy efficiency improves considerably relative to Baseline, while low-carbon and efficient energy forms (RES-based electricity, advanced biofuels) substitute fossil fuels in end-uses. The system transformation is even more pronounced in the EU, with a rapid coal phase-out by 2040, massive deployment of PV and wind (onshore and offshore) and a nearly emission-free electricity production by mid-century.
The global market for low-carbon technologies is growing fast driven by technology uptake, innovation dynamics, technological improvements and climate policies and regulations. In 2015 the size of the global low-carbon technology market is estimated at about €250bn and is dominated by PV panels, biofuels and wind turbines. The global low-carbon market increases constantly in the baseline scenario and amounts to 18.7 trillion EUR over 2020–2050. In the 2DEG scenario, the high carbon pricing and accelerated uptake of low-carbon technologies induce an increase in the global low-carbon market, which amounts to €39 trillion cumulatively by 2050. EV and battery manufacturing are the largest sectors, accounting for 42% of the global market, with PV and wind representing about 35%. The EU accounts for 15% of the global low-carbon market, but has very small shares in the production of PV and batteries (
Figure 3).
The size of the low-carbon market is driven by the number of equipment units sold and technology costs that tend to decline as a result of learning by doing. Thus, the low-carbon market does not increase proportionally with technology uptake, as this is moderated by lower technology costs. In the baseline scenario, the deployment of PV and wind drives down their costs significantly, and hence their additional deployment in 2DEG leads to a relatively limited cost reduction from baseline. On the other hand, EVs and batteries will not reach maturity in terms of cost reductions in baseline scenario; thus they have high potential for cost improvements in the decarbonisation context.
Climate policies (and the imposition of carbon pricing) drive energy system restructuring towards a more capital-intensive structure, with increased investment to renewable energy, EVs and energy efficiency projects. High carbon prices increase the cost of energy services and hence production costs throughout the economy and have a depressing effect on private consumption and GDP, which is partly alleviated by increased investment in low-carbon and energy-efficient technologies. Ambitious climate policies in 2DEG lead to a 1.5% decline in cumulative global GDP over 2020–2050 (
Figure 4) and 3.2% reduction in 2050.
Many macroeconomic models that have computed the costs of decarbonisation provide evidence of net mitigation costs; for example the modelling results reported in the IPCC WG3 AR5 estimated global consumption losses of 2–6% in 2050 associated with an emissions trajectory that limit global warming to less than 2 °C by 2100. Our model-based projection lies in the middle of these estimates and shows differential macro-economic impacts across countries:
Major fossil fuel exporters, like Saudi Arabia and Russia, would face large negative economic impacts due to their high carbon intensity (per unit of GDP) and the reduced revenues from fossil fuel exports
Mitigation costs in large developing countries (China and India) are generally higher than developed economies, as the former have higher carbon intensities and the imposition of universal carbon price results in higher relative mitigation effort for developing countries.
The macro-economic impacts across developed economies are limited, on average less than 1% of their cumulative GDP. Mitigation costs are higher in economies with relatively high carbon intensities (i.e., Bulgaria, Poland), while costs are very limited in countries with low carbon intensities (Japan, France, UK) that already implement climate policies and in countries that can benefit from increased low-carbon technology exports (e.g., Germany).
4.2. Impacts of Public Low-Carbon R&D
Energy innovation depends on public sector contribution, with governments funding basic research and novel low-carbon technologies, which are costly and have uncertain market value. This is reflected in the allocation of energy R&D [
55], where public R&D represents more than 50% of R&D directed to renewable technologies, while its share in conventional energy is about 20%. In the last decade, energy-related R&D expenditure accounted for about 1–2% of total R&D expenditure in the EU-28 and US, with fossil fuels and nuclear having the biggest share till the early ‘80s, but innovation in renewables and energy efficiency is steadily gaining ground, enabling a more diverse and balanced energy R&D portfolio.
To construct base-year R&D stocks (to be used in GEM-E3-FIT modelling), R&D data from the IEA R&D database were used for low-carbon technologies, including PV, wind, batteries, biofuels and electric cars. In 2014, R&D on biofuels accounted for more than 50% of total low-carbon R&D in OECD economies, followed by PV and wind. This R&D structure changes considerably when China is added, as the Frankfurt School finds that solar technologies constitute 50% of global renewable energy R&D, followed by wind (20%) and biofuels (18%) [
61]. Building on data from IEA R&D database, the R&D stock for low-carbon technologies in OECD countries is constructed following the methodology of [
62] that consider R&D depreciation to develop consistent estimates for low-carbon R&D stock. For China, we have used estimates for public R&D in PV, wind and batteries from World Bank [
63]. GEM-E3-FIT estimates for public R&D spending for PV, wind, biofuels and batteries are consistent with [
54].
In Baseline and 2DEG scenarios, it is assumed that the R&D intensity of clean energy sectors (i.e., R&D expenditures as a percentage of value added) remains constant at 2015 levels in all countries implying that low-carbon R&D increases in line with the size of the clean market. Public R&D spending in low-carbon technologies increases significantly in “2DEG_GRD” scenario as 10% of EU carbon revenues are directed to public low-carbon R&D, triggering increased innovation and learning in PV, wind and EVs. As EU carbon revenues increase to about 3% of GDP by 2050, the low-carbon R&D stock accumulates rapidly triggering cost reductions of 27% for wind, 18% for PV and 37% for batteries in 2050 relative to 2DEG. TFP growth induced by public low-carbon R&D is diffused across EU countries, with high amounts of R&D directed to wind, as the R&D split is determined by technological shares in global low-carbon market in 2015.
Increased public R&D expenditure would lead to improved productivity and cost reductions for low-carbon technologies resulting in positive macro-economic effects, with EU GDP increasing by 0.01% in 2030 and 0.05% in 2050 relative to 2DEG. The scenario impacts increase over time as low-carbon R&D stock accumulates and productivity improvements become more visible. Differential impacts are projected across EU countries depending (among others) on the country position in low-carbon manufacturing and trade and the amount of carbon revenues directed to public R&D. Energy system decarbonisation would create market opportunities for countries and industries that manufacture clean energy products, as already manifested by large export surpluses in China and the EU (major PV and wind manufacturers respectively). The explicit modelling of low-carbon products and equipment in GEM-E3-FIT allows to consistently capture the trade, competitiveness and inter-industrial production effects of decarbonisation. The largest GDP increase is projected for Denmark (0.11% in 2050), which is the leading wind turbine producer and highly benefits from productivity improvements and increased turbine exports. Leading producers of PV (China), wind turbines (Germany, Denmark), batteries (Japan, Korea) and biofuels (Brazil) register larger GDP impacts than the global average. As public R&D diffuses globally, all countries benefit and register positive GDP growth relative to 2DEG (global average of 0.05%), while leading EU low-carbon technology producers benefit the most from increased public R&D in terms of exports, production and employment. For example the implicit multiplier of low-carbon R&D (ratio of GDP gains to public R&D spending) is particularly high in key wind manufacturers (Denmark, Germany); note that most of low-carbon R&D is directed to wind turbine manufacturing as technology shares in R&D investment are determined by their shares in 2015 global low-carbon market. Technology importers register lower economic benefits, as financial resources are limited in the general equilibrium framework and R&D expenditures can exert a crowding out effect in investment in other sectors at least temporarily (
Figure 5). However, productivity gains induced by R&D enlarge the market prospects and can induce higher investment and activity in the long term. Our findings reinforce prior research on the topic, as Edenhofer et al. illustrated positive GDP impacts from low-carbon R&D spending [
34], while Dechezleprêtre et al. argue that increased public low-carbon R&D is required for the transition to a low-emission economy while providing socio-economic benefits [
64].
In case that all countries use 10% of their carbon revenues to finance low-carbon public R&D (2DEG_GRDW), the accumulation of knowledge and innovation accelerates leading to increased productivity growth via leaning by research. Productivity improvements are diffused to other countries and industries based on knowledge spillovers of public R&D. As global carbon revenues amount to about 7 trillion EUR in 2050 (i.e., about 3.5% of global GDP), the public low-carbon R&D stock increases significantly leading to cost reductions of 52% for wind, 43% for PV and 60% for batteries in 2050 relative to 2DEG. As productivity improvements induced by public low-carbon R&D diffuse globally, higher public R&D expenditures have positive economic and employment impacts for EU and non-EU countries. Global GDP increase is significantly higher than 2DEG_GRD (
Figure 6), as the additional low-carbon R&D spending is 10 times higher than 2DEG_GRD. The economic impacts differ across countries depending on their low-carbon technology innovation potential. Leading producers and exporters of PV (China), wind (Denmark, Germany), biofuels (Brazil, USA) and batteries (Japan, Korea) register the largest GDP gains. On the other hand, GDP gains are low in countries with limited innovation dynamics and low clean energy manufacturing base (as observed in [
39]).
To explore the uncertainty surrounding R&D learning rates, the variant 2DEG_GRDH is developed where the learning rates of public low-carbon R&D are assumed to be the same as private R&D (
Table 2). This variant shows larger macro-economic benefits, with global GDP increasing by 0.3% relative to 2DEG, with even higher growth in large low-carbon technology manufacturers (Denmark, China, Germany, Brazil, Japan etc.). The uncertainty regarding the link between R&D expenditures and cost reduction is more relevant to new, currently immature technologies like batteries. Paroussos et al. implemented a full-scale sensitivity analysis to quantify the macro-economic impacts of uncertain low-carbon R&D learning rates [
30].
4.3. Impacts of Private Low-Carbon R&D
Several low-carbon technologies do not have global system boundaries, as e.g., the learning system of photovoltaics is national or regional with spillovers across regions [
65], while wind turbines were analysed both at the national and global basis [
66]. Clas-Otto argues that public and private R&D have different objectives, as the former focuses on basic higher-risk research and novel low-carbon technologies with uncertain market value [
56]. Private R&D focuses is commonly directed to mature technologies with limited risk and high market value. As government and private R&D have different nature and impacts on technology costs and performance [
56], our analysis differentiates between public and private low-carbon R&D.
Private R&D expenditure can increase knowledge stocks and is linked with positive externalities of technological progress. To construct the private R&D stock for low-carbon technologies, we combine R&D data from [
54] with estimates on the share of corporate to government R&D by technology for major economies. For China, estimates on private low-carbon R&D are used [
63], which match well with [
54] estimates. Based on these sources, the private R&D stock for low-carbon technologies is constructed following [
62] considering R&D depreciation over time. In China low-carbon R&D is largely based on government spending, while Japan and Korean R&D efforts are driven by the private sector; in the EU and USA, private and public low-carbon R&D expenditures are comparable.
In the 2DEG_PRD scenario, 10% of EU carbon revenues are assumed to be directed to private low-carbon R&D (in the form of subsidies), triggering increased innovation and learning in low-carbon technologies. The R&D split across technologies is determined by their shares in global clean energy market in 2015. The private EU low-carbon R&D stock increases significantly, triggering significant cost reductions of 26% for wind, 20% for PV and 43% for batteries in 2050 (average of EU countries) relative to 2DEG scenario. The private low-carbon R&D expenditures lead to TFP growth in the country and industry performing the R&D, while non-EU countries benefit indirectly through bilateral trade and spillovers with partial knowledge diffusion to other countries, reflecting Intellectual Property Protection, obstacles for knowledge diffusion and costly replication of patents. In GEM-E3-FIT, countries with low knowledge stock cannot fully exploit innovation-induced productivity gains due to limitations in human capital, infrastructure, institutions, regulation, industrial and innovation base [
3]; countries benefit from increased R&D spending only when their R&D stock increases beyond a certain threshold (set at 10% of the 2015 global low-carbon R&D stock).
R&D expenditures reduce the costs of low-carbon technologies. As resources are limited in the general equilibrium framework, additional R&D can exert a crowding out effect on investment in other sectors, but temporarily, because productivity gains induced by R&D enlarge the market prospects inducing higher growth and investment in medium-term. Thus, private R&D expenditures may induce positive economic growth with EU GDP increasing by 0.9% in 2050 compared to 2DEG scenario (
Figure 7). The positive impact is higher relative to public R&D scenario (2DEG_GRD) indicating the higher efficiency of corporate R&D, which is closer to industrial activities that can benefit directly from innovation activities in contrast to public R&D activities that commonly focus on basic research and immature, highly uncertain technologies, as argued in [
67]. Major EU manufacturers of low-carbon technologies (Germany, Spain, Denmark) register higher GDP gains relative to EU average, as they benefit from their competitive advantage and increase their production and exports. High GDP gains are also projected in countries with large amounts of carbon revenues as a percentage of GDP, i.e., Poland, Hungary, Spain, as they benefit from higher investment in private low-carbon R&D and overtake the “efficiency” threshold of private R&D. In contrast, impacts are smaller in countries where increased low-carbon R&D does not suffice to reach the “efficiency threshold” and thus they fail to benefit massively from low-carbon innovation.
Higher private low-carbon R&D expenditures improve the competitiveness of EU manufacturers in global markets, reflecting that “
To become competitive, consolidated R&I action at a European level is required in the short term to secure Europe’s strong industrial position in clean energy manufacturing in the future” [
68]. Based on technology assessments [
46], the EU produces PV and batteries at a cost 30% higher relative to the main supplier (China). Increased private R&D can eliminate the price gap, as EU technology production costs decline induced by R&D expenditure, and leading EU manufacturers achieve price-parity with global main suppliers by 2040 (
Figure 8).
Increased low-carbon R&D reduces costs for EU manufacturers, leading to an increase in EU share in global low-carbon production from 15% in 2DEG to 25% 2DEG_PRD (
Figure 9), provided that knowledge advantage gained from low-carbon R&D is not quickly diffused to foreign competitors. Leading European manufacturers would enhance their competitive advantage in wind turbine and EV manufacturing, while R&D expenditure directed to batteries and PV would significantly reduce EU production costs allowing EU producers become competitive in global markets and achieve price-parity with their main competitors (China, Japan, Korea) by 2050. The development of a competitive battery and PV manufacturing capacity boosts domestic activity through growth of industrial activities, increased employment and positive impacts on household income.
4.4. Upgrade of Human Capital
Energy system decarbonisation leads to structural changes in the economy and labour market, requiring a different set of skills relative to conventional technologies [
36]. The enhanced labour skills can be provided either by higher attainment in tertiary education (e.g., advanced skills for high-tech manufacturing activities), public training programmes (aiming to develop new skills required by the market) and private on-job training inducing higher labour productivity [
69]. The 2DEG_SK scenario assumes that 10% of ETS revenues are used to subsidise high-skilled jobs required for the low-carbon economy, with half of them directed to firms to reduce social security contributions for highly-skilled jobs, and the other half subsidising the wage of highly-skilled labour, i.e., those completed tertiary education. This makes it attractive for young age cohorts to attain tertiary education and develop skills required for the transition, i.e., engineers, IT, technicians, STEM skills, managers [
9]; thus inducing an upgrade in human capital and increased productivity of workforce entering the labour market.
In GEM-E3-FIT modelling, the wage rate is higher for high-skilled relative to low-skilled labour reflecting their higher labour productivity. The subsidisation of high-skilled workers incentivises firms to employ high-skilled workforce through the reduction of social security contributions. Households are incentivised to attain tertiary education with the prospect of increased wage in the future (i.e., for engineering or IT jobs) due to the subsidisation of wages of high-skilled labour.
In the short-term, as younger cohorts increasingly decide to attain tertiary education and delay entering the labour market, labour supply declines inducing small negative impacts on EU GDP. However, in the longer-term, EU GDP would increase by 0.1% relative to 2DEG induced by higher employment (+0.16% in 2050), increased labour productivity and higher wage rate (+0.15% in 2050), which result in increased private consumption of households (+0.22% in 2050). The improved matching of labour demand and supply leads to reduced EU unemployment rate from 7.4% in 2DEG to 7.2% in 2DEG_SK in 2050. The differentiation of impacts across countries largely reflects the amount of carbon revenues as share of GDP used to subsidise highly-skilled labour.
The 2DEG_SK scenario leads to a 0.5% increase in highly-skilled jobs relative to 2DEG in 2050 (
Figure 10). Impacts on other labour skills are relatively limited, driven by indirect mechanisms: increased GDP –through higher labour productivity- would positively impact labour demand for all skills (as positive effects cascade in all productive sectors); however, firms have incentives to choose high-skilled employees that offer higher productivity and can take advantage of the subsidisation. As an increasing number of young cohorts chooses to attain tertiary education, the supply of low-skilled labour declines exerting a limited downward pressure on their employment.
4.5. Combined Policy Scenario
The “2DEG_COMB” scenario simulates the impacts of a policy package to facilitate clean energy transition, combining low-carbon innovation and development of the required skills. It aims to boost low-carbon R&I with an ambitious allocation of resources, as 20% of ETS carbon revenues are used to finance public and private low-carbon R&D, while an additional 10% is used to subsidise the wages and social security contributions of highly-skilled labour required for the transition. The interactions and synergies between policies promoting public and private low-carbon R&D and labour skills are explored through a combination of increased expenditure for low-carbon R&D and human capital upgrade.
The “2DEG_COMB” scenario has positive macro-economic impacts driven by: (1) high productivity improvements and cost reductions in low-carbon technologies and (2) higher labour productivity, as a higher percentage of the workforce would attain tertiary education and develop advanced skills. The European GDP would increase by 1.1% relative to 2DEG in 2050, triggered by impacts from increased public (0.08%) and private low-carbon R&D (0.9%) and human capital upgrade (0.11%). The positive socio-economic impacts of “2DEG_COMB” are higher in the longer term with EU GDP gains increasing from 24 bn EUR in 2030 to 311 bn EUR in 2050 (
Figure 11). This is driven by the increasing amounts of ETS revenues directed to low-carbon R&D combined with the accumulated effect of innovation and human capital policies on productivity growth. The major driver of GDP growth is the increase of low-carbon technology exports triggered by improved EU competitiveness in international markets, while investment and consumption also contribute to EU GDP increase. The results of our analysis confirm prior research on the benefits of endogenous technical change, as Edenhofer et al used 10 energy-economy models and showed that low-carbon technology improvements result in a significant reduction of mitigation costs [
34].
The macro-economic impacts of the combined policy scenario are significant in countries with:
Large low-carbon manufacturing base (Germany, Denmark, Spain) as they benefit from higher low-carbon R&D to enhance their competitive advantage and technology exports.
High amounts of carbon revenues as a percentage of GDP, i.e., Poland, Hungary, Spain, that benefit through higher low-carbon R&D leading to higher gains in innovation-induced productivity growth.
The impacts are smaller in magnitude in EU countries with limited low-carbon innovation base, as they do not massively benefit from low-carbon innovation, as they do not reach the “efficiency threshold” imposed for low-carbon innovation, and receive limited knowledge spillovers. Using ETS revenues to finance low-carbon R&D has positive impacts for EU GDP growth as R&D expenditure induces productivity improvements through innovation, with positive modest impacts on employment triggered by improved industrial competitiveness (
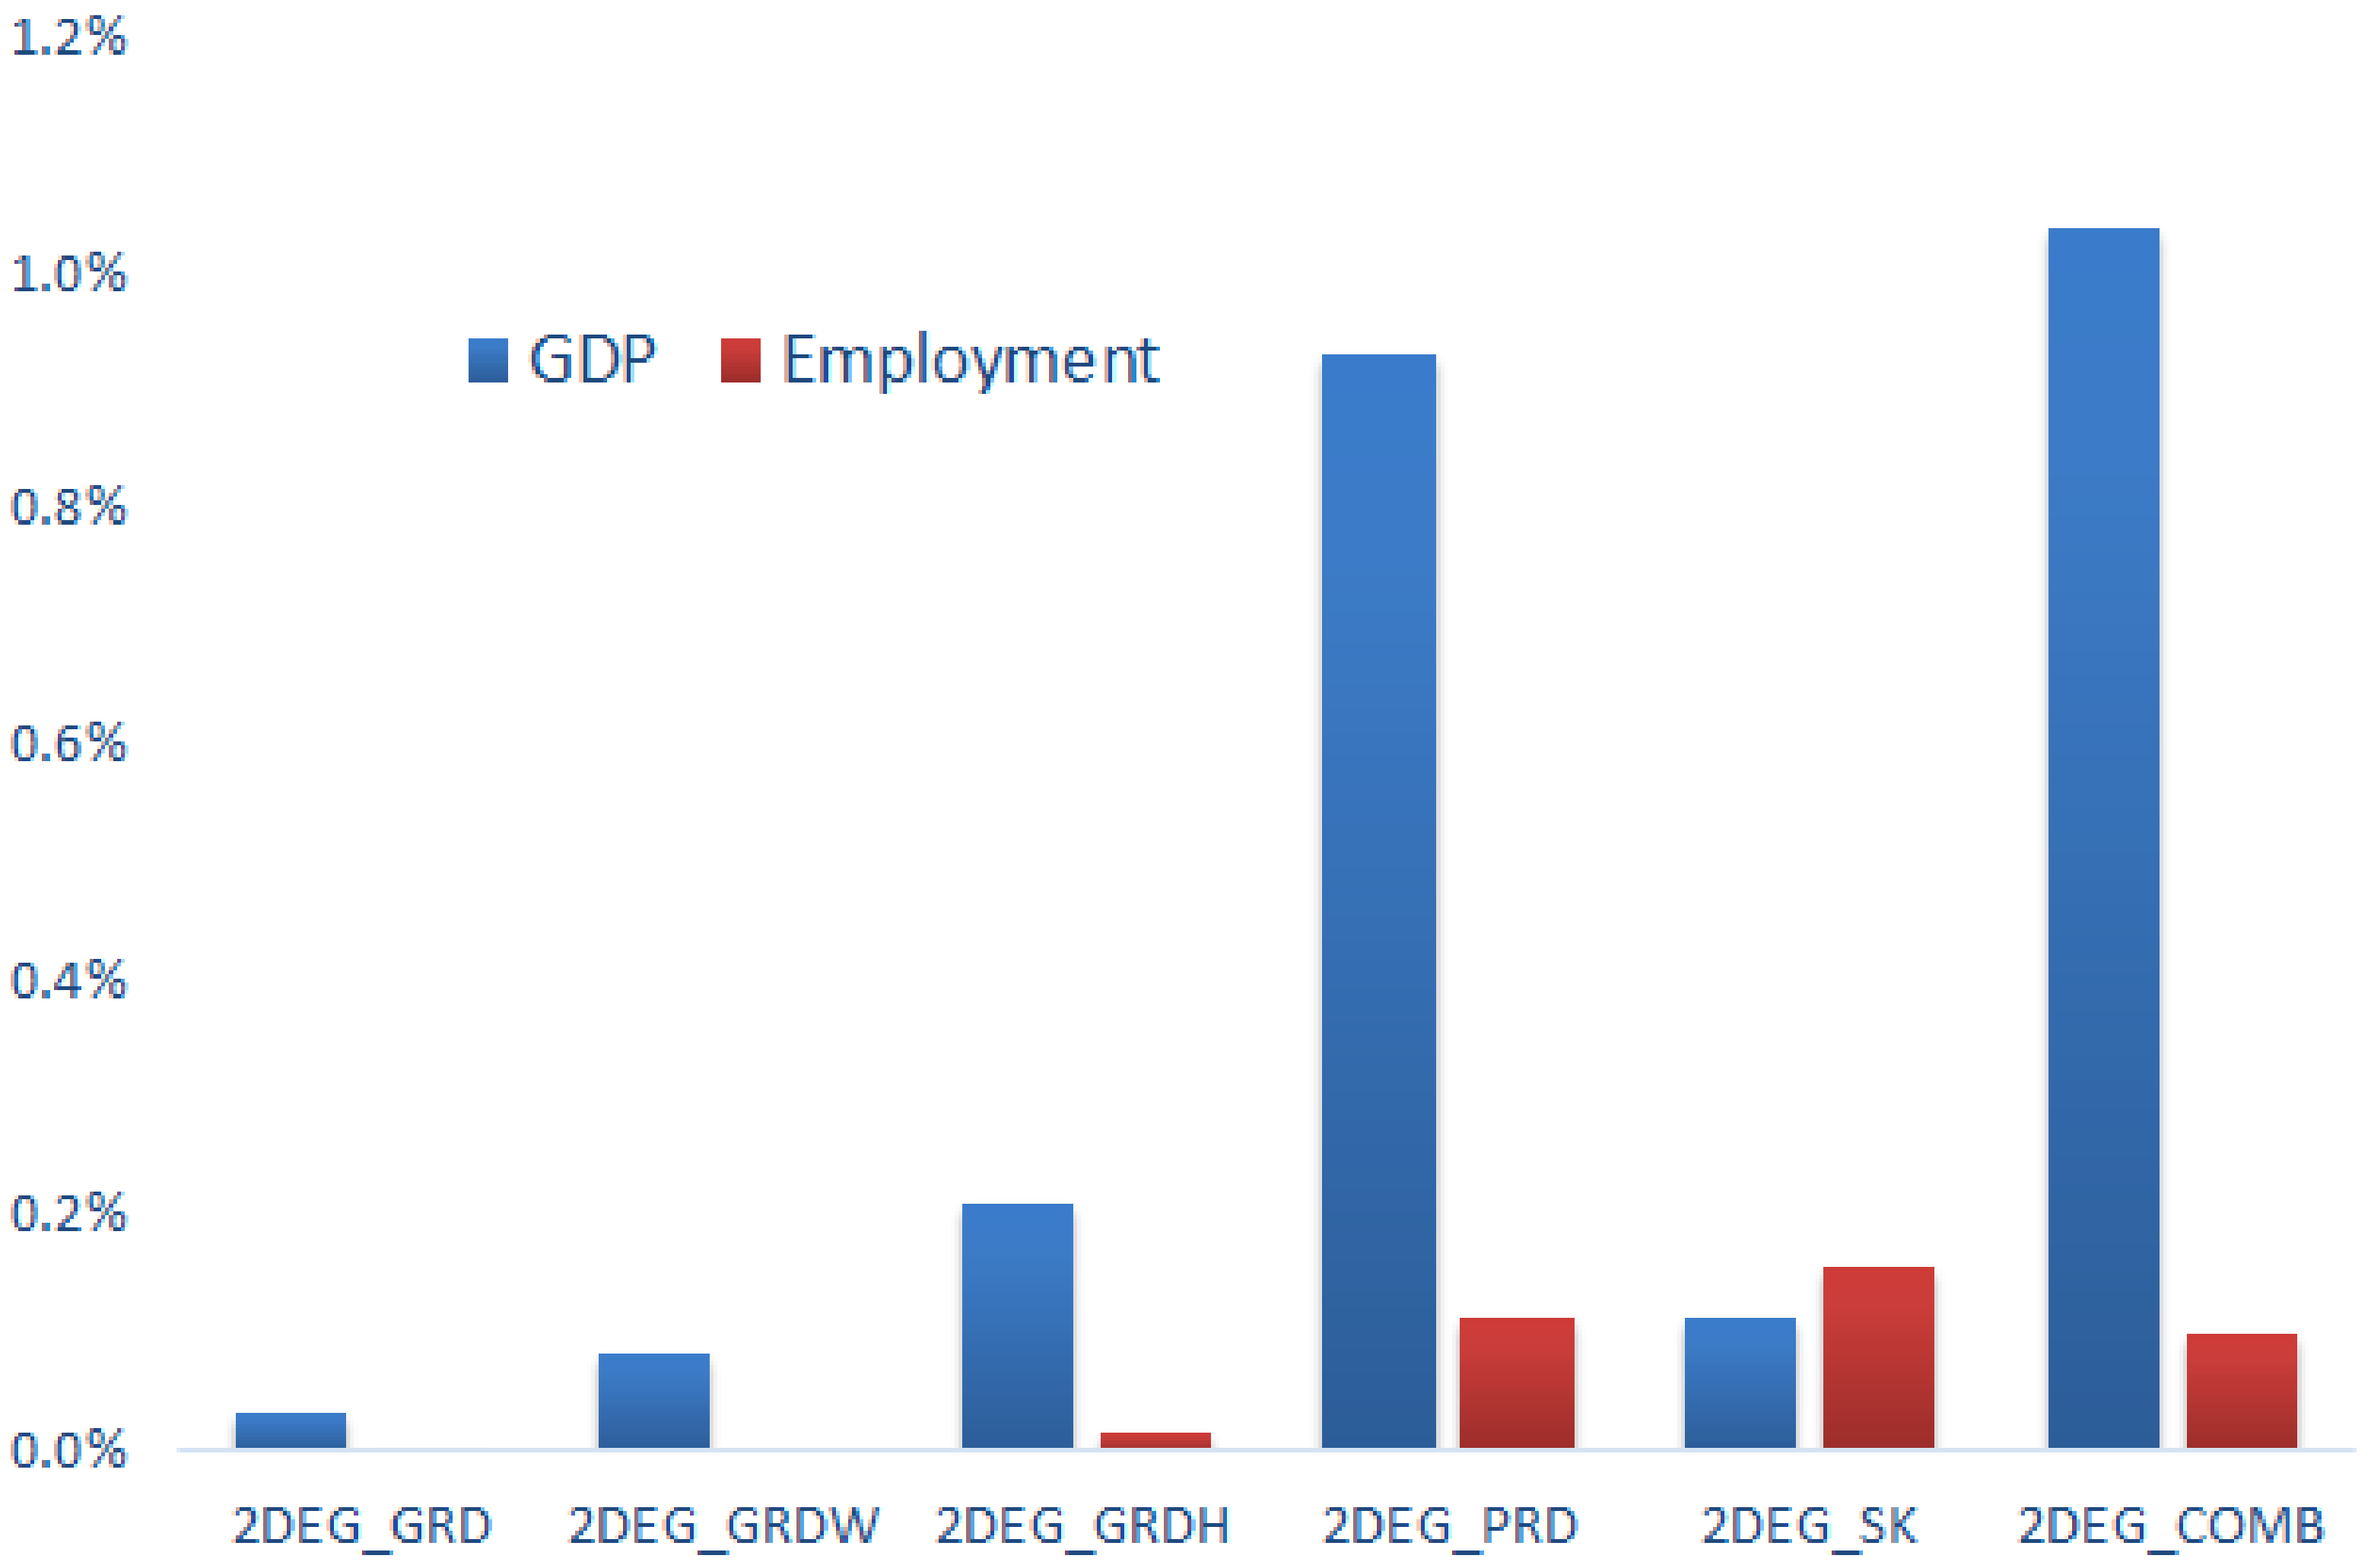
Figure 12). In case that the policy focus lies on job creation, carbon revenues should be directed towards subsidization of skills required for the transition (engineers, IT, technicians, managers). Private low-carbon R&D induces higher productivity and economic growth than public R&D (as industrial activities directly benefit from corporate innovation) with EU-based companies improving their competitiveness and increasing low-carbon technology exports. The Combined Policy scenario leads to an even higher GDP growth as a larger part of ETS carbon revenues are directed towards low-carbon R&D and human capital upgrade. GDP growth is mostly driven by increased low-carbon technology exports triggered by improved EU competitiveness in international markets.
5. Discussion and Conclusions
The EU strategy calls for increased R&I investment in an effort to deliver stronger and inclusive growth, create more and better jobs and promote social and environmental objectives. The ambitious EU emission reduction targets included in the EU Green Deal would drive a massive deployment of renewable and energy efficient technologies. In this context, the EU can exploit its large R&I and manufacturing base to further innovate and develop these technologies domestically creating new jobs and growth. The study investigates the socio-economic impacts of increased public and private R&D in low-carbon technologies and assesses its contribution towards a cost efficient low-emission transition while enhancing the EU competitiveness in global markets.
Using the state-of-the-art multi-sectoral CGE model GEM-E3-FIT enhanced with a novel representation of learning and innovation dynamics, we find that extensive R&I is required to support private businesses in low-carbon technology innovation and manufacturing and the development of domestic value chains, if the EU wants to be a competitive technology supplier. The policy scenarios examine different ways to support EU low-carbon innovation using a part of ETS carbon revenues, e.g., increased public R&D, subsidies to support private R&D or subsidisation to develop labour skills required for the transition. The complex interactions between energy system decarbonisation, technology development and low-carbon R&D are analysed, in the ambitious climate policy context consistent with Paris Agreement goals. Based on the general equilibrium framework, all scenarios ensure public budget neutrality where government expenditures need always to be backed up by the generation of respective revenues. Model results thus show the impact of specific policies leading to a reallocation of resources and innovation-induced productivity growth, rather than just the impact of additional spending on R&D or on education.
The decarbonisation of the energy system is based on large-scale uptake of renewable energy, improved energy efficiency and accelerated electrification of energy services. Ambitious climate policies induce a transition towards a more capital-intensive structure of the economy, while carbon prices increase the cost of energy services throughout the economy with negative impacts on GDP and consumption. The low-emission transition results in increased development of low-carbon technologies that substitute for fossil fuel use in energy demand and supply, leading to a large-scale growth of the global low-carbon market amounting to €39 trillion cumulatively by 2050, dominated by EVs, solar PV, wind and batteries. Empirical scientific findings show that R&D expenditure can reduce the costs of low-carbon technologies, a mechanism that is incorporated in GEM-E3-FIT. So, what is the impact of policies using carbon revenues to enhance low-carbon R&D and develop the required labour skills?
The analysis shows that increased public and private EU investment in low-carbon R&D (funded by carbon revenues) leads to lower technology costs, improved productivity and GDP growth fuelled by innovation and increased EU competitiveness and exports in the international market. The public R&D scenario shows macro-economic benefits for all countries as productivity improvements are diffused worldwide but the highest GDP gains are registered in large low-carbon manufacturers, as they exploit their competitive advantage in a large-growing market; these include Denmark and Germany (wind turbines), China (PV), Japan (batteries) and Brazil (biofuels). In case all countries use 10% of their carbon revenues to finance low-carbon R&D, the technology cost reductions will be significant resulting in large GDP gains (0.2% at the global level in 2050). As resources are limited in the general equilibrium framework, additional low-carbon R&D can crowd-out investment in other sectors, but only temporarily, because innovation-induced productivity gains enlarge market prospects, leading to more efficient use of economic resources triggering accelerated activity growth in the medium and longer term.
The different nature of private R&D is reflected in the policy scenarios. Private R&D investment leads to improved productivity in the country and industry performing R&D, while other countries benefit indirectly through bilateral trade and knowledge spillovers but with limitations in knowledge diffusion. At the EU level, GDP gains are higher relative to public R&D, indicating the higher efficiency of corporate R&D that is closer to industrial activities, while public R&D commonly focuses on basic research and immature highly uncertain technologies. Major EU low-carbon manufacturers (Germany, Spain, Denmark) register even higher GDP gains, as they benefit from their competitive advantage and increase technology exports. In addition, countries with large amounts of carbon revenues as a percentage of GDP benefit from higher private R&D investment and overtake the innovation efficiency threshold. In contrast, impacts are smaller in countries with limited innovation and low-carbon manufacturing base that fail to massively benefit from low-carbon R&D and their competitiveness vis-à-vis other EU countries worsens. The model-based results show that the EU should increase expenditure for private low-carbon R&D relative to its major competitors, in order to boost activity growth, create more and high-quality jobs and expand its first mover advantage in low-carbon manufacturing exploiting new market opportunities with high export potential.
The low-carbon transition leads to structural economic and labour market changes and requires different labour skills relative to conventional technologies. In case that carbon revenues are used to subsidise high-skilled jobs required for the transition (e.g., engineers, IT, STEM skills, managers, technicians), the mismatch between labour demand and supply is reduced leading to human capital upgrade and increased productivity of the workforce. The subsidisation of high-skilled jobs leads to increased attainment in tertiary education, so that younger cohorts delay entering the labour market with slightly negative short-term GDP impacts. However, increased labour productivity and household income boost long-term GDP and employment.
These findings can provide robust evidence to policy makers, especially related to potential allocation of carbon revenues in the decarbonisation context. Using ETS revenues to subsidise public or private low-carbon R&D will reduce technology costs and improve productivity leading to increased EU competitiveness and GDP. If the policy focus lies on the creation of jobs, carbon revenues can be directed towards subsidisation of high-skilled labour required for the low-carbon transition. A holistic strategy aiming to boost low-carbon R&D and develop the required skills can fully alleviate the cost burden of decarbonisation for the European economy and create more and better jobs, especially in transition-related sectors. Investment and consumption contribute to GDP growth, but the major driver is the increase in low-carbon technology exports triggered by the improved EU competitiveness in international markets. Therefore, innovation-related policies –including deployment– should be integrated in climate policy impact assessments, as they can provide socio-economic co-benefits, while ensuring the cost-efficient transition to a climate neutral and resource efficient economy.
The analysis estimates the potential socio-economic and trade impacts of supporting low-carbon R&I to facilitate EU decarbonisation. The EU currently has a small share in PV and battery value chain and thus large support to low-carbon R&D is required to assure the competitiveness of EU-produced low-carbon products. The relocation of low-carbon manufacturing to the EU brings benefits in terms of reduced imports of PV and batteries and lower dependence on non-EU manufacturers. The design of well-planned climate, innovation and education policies would lead to enhanced development of cost-efficient clean energy manufacturing capability in the EU boosting domestic activity and employment through increased production of low-carbon technologies. The study informs policy makers on the need for a technology-smart policy strategy, integrating a portfolio of measures facilitating private low-carbon R&D (to boost domestic activity), public R&D (to enhance research for currently immature clean technologies) and labour market policies (to ensure increased employment, labour productivity and development of the required skills). The incentivization of private R&D along the supply chain of low-carbon technologies can enhance the international competitiveness of EU-based manufacturing. A clear, well-predictable and ambitious strategy for the development of low-carbon technologies is needed to create an attractive European market and provide well-anticipated price signals and planning security to European investors, industries and innovators [
40]. This strategy should integrate demand (i.e., though ambitious climate policies, carbon pricing, emission standards, subsidies or mandates) and manufacturing aspects—largely focused on innovation and skills development—related to clean energy transition.
There is no doubt that despite the significant methodological improvements presented above, this kind of modelling has limitations and requires additional research. The modelling results greatly depend on the trade and price elasticities and learning rates used in the model. The study has benefited from the most recent estimates on elasticities and technology learning rates available in the literature but future research can develop a sensitivity analysis around the core model parameters specified by country and sector. Further research is also required on the distinction between public and private R&D, as empirical literature provides evidence on their different nature, but stronger empirical foundation is needed.


