Article

Influence of Active Power Output and Control Parameters of Full-Converter Wind Farms on Sub-Synchronous Oscillation Characteristics in Weak Grids

1
School of Electrical Engineering, Zhengzhou University, Zhengzhou 450001, China
2
School of Engineering, Cardiff University, Cardiff CF24 3AA, UK
3
State Key Laboratory of Power Grid Safety and Energy Conservation (China Electric Power Research Institute), Beijing 100192, China
*
Author to whom correspondence should be addressed.
Energies 2020, 13(19), 5225; https://doi.org/10.3390/en13195225
Submission received: 22 August 2020 / Revised: 30 September 2020 / Accepted: 1 October 2020 / Published: 7 October 2020

Abstract

:
Active power outputs of a wind farm connected to a weak power grid greatly affect the stability of grid-connected voltage source converter (VSC) systems. This paper studies the impact of active power outputs and control parameters on the subsynchronous oscillation characteristics of full-converter wind farms connected weak power grids. Eigenvalue and participation factor analysis was performed to identify the dominant oscillation modes of the system under consideration. The impact of active power output and control parameters on the damping characteristics of subsynchronous oscillation is analysed with the eigenvalue method. The analysis shows that when the phase-locked loop (PLL) proportional gain is high, the subsynchronous oscillation damping characteristics are worsened as the active power output increases. On the contrary, when the PLL proportional gain is small, the subsynchronous oscillation damping characteristics are improved as the active power output increases. By adjusting the control parameters in the PLL and DC link voltage controllers, system stability can be improved. Time-domain results verify the analysis and the findings.

1. Introduction

In recent years, as a clean, renewable and relatively proven technology, wind power generation has grown significantly in order to tackle the climate change and replace fossil fuels generators. By the end of 2019, the cumulative installed capacity of wind power worldwide reached 650 GW, of which 60.4 GW was newly added [1]. With the development of wind power and high voltage direct current transmission system (HVDC), subsynchronous interaction (SSI) has attracted the attention of academia and industry. The SSI is generally classified into the following three types: subsynchronous resonance (SSR), subsynchronous control interaction (SSCI) and subsynchronous torsional interaction (SSTI) [2]. In 2009, an SSI incident occurred in southern Texas, USA. A doubly fed induction generator (DFIG)-based wind farm was integrated into the grids via a high-series compensation transmission line. This caused a subsynchronous control interaction, resulting in a large number of wind turbine trips [3,4]. In 2012, the Guyuan wind farm in China also experienced the interaction between the control of DFIG and series compensation devices, causing the SSI event.
With the increase of grid-connected wind power capacity and the use of long-distance transmission lines, the support from the grids for wind farm connection is weakened [5]. There is a different type of interaction observed recently between full-converter wind farms and weak AC networks. In 2015, the permanent magnet synchronous generators based wind farm in Xinjiang, China, suffered from a severe oscillation event without series compensation. The oscillation frequency coincided with the torsional vibration frequency of the nearby thermal power unit, which led to the torsional vibration protection action of the thermal power unit resulting in generator shut down [6]. This type of interaction between full-converter wind farms and weak AC networks is also called subsynchronous oscillation (SSO), which is the topic investigated in this paper.
The dominant elements that affect the subsynchronous interaction characteristics in different scenarios of wind farms connected to the grids [6,7,8,9,10,11,12,13,14,15,16,17,18,19,20,21,22,23,24,25]. References [7,8,9] established DFIG-based wind farms interconnected with the grids and analysed the influence of the number of wind turbine generators (WTGs), wind speed, series compensation, line resistance, and outer and inner loop control parameters on subsynchronous interaction. For instance, reference [8] points out that when the DFIG-based wind farm is connected to series capacitive compensated transmission systems, the system damping decreases with the rise of series compensation or the decrease of total line resistance. Meanwhile, the variations of series compensation also affect the oscillation frequency of subsynchronous interaction. As for SSO in the full-converter wind farm or the VSC connected to AC grid system, the eigenvalue analysis, impedance-based analysis and the complex torque coefficient approach are conducted in [6,10,11,12,13,14,15,16,17,18,19,20] to research the dominant elements that affect the SSO characteristics. AC system strengths, WTGs number, wind speed, converter control parameters, PLL parameters and aggregation characteristics of wind farms are considered in these works. The work in [6] indicates the SSO will occur with the decrease of the AC system strengths. And control parameters also have great impacts on the SSO characteristics. In addition, SSO caused by the interconnection of direct-drive wind farms via voltage source converter based high voltage direct current (VSC-HVDC) transmission system has been studied in the references [21,22,23,24,25,26,27,28]. These elements, including wind farm control parameters, HVDC control parameters, PLL parameters and filter parameters are analysed and the coordinated controller is designed.
Until recently, there were very few papers specifically analysing the impact of the active power output of wind farms on the SSO characteristics. However, the change of active power output during the operation of wind farms will have a more significant impact on system stability. References [17,18,19,20] established the model of full-converter wind farm integrated into the grids or the VSC connected to AC grid. The SSO characteristics of the system are studied, and the impact of active output is analysed. The works in [17,18,19] pointed out that as the active power output of wind farms increases, the damping of the SSO mode decreases. However, it is revealed in [20] that increasing the active power output of wind farms will increase the damping of the SSO mode and increase system stability. When the active power output is too small, the system will result in diverging oscillation and loss of system stability.
In the view of the impact of active power output on SSO characteristics, some studies identified that the greater the active power output, the worse the SSO damping characteristics will be [17,18,19]. However, some studies that found that the higher the active output, the better the SSO damping characteristics will be [20]. Meanwhile, the existing researches are based on a certain set of control parameter without considering the influence of different control parameters. Therefore, it is necessary to study further the relationship between active power output and damping characteristics of SSO mode.
This paper investigates the impact of active power output on SSO characteristics by a small-signal analysis based on analytical models. The correlation between the active power output and the damping of the SSO mode with different control parameters is analysed through dynamic modelling and linear system analysis. First, the critical factor that determines the correlation is identified. Then, based on the eigenvalue analysis results, the strategy to increase the damping of SSO mode and improve system stability is proposed. Case studies and time-domain simulation verify the analysis result.
The rest of the paper is organized as follows: Section 2 builds the dynamic model of the system with full converter wind farm connected to the AC grids. In Section 3, both eigenvalue analysis and calculation of participation factors are carried to study the impact of active power output on SSO characteristics. The correlation between the active power output and the damping of the SSO mode is analysed with different control parameters and the critical factors that affect the SSO characteristics are presented. Meanwhile, the strategy to improve the stability of the system is proposed. Section 4 presents case studies and time-simulation results. Finally, the brief conclusions are given in Section 5.

2. System Modeling

A full-converter wind model including wind turbine, synchronous generator (SG), machine-side converter (MSC), DC link, grid-side converter (GSC), phase-locked loop (PLL), and converter control system is considered. It is assumed that wind farms usually consist of the same type of wind turbines with similar control parameters and operating conditions. Therefore, a wind farm is represented by an equivalent wind turbine. The schematic diagram of grid-connected wind power system structure is shown in Figure 1. Lf1 and Rf1 represent the filter inductance and filter resistance, respectively. C1 represents the reactive power compensation parallel capacitor. R2+jX2 represents the equivalent impedance of both 25 kV line and 220 kV line. R3+jX3 represents the equivalent impedance of the transmission line near the grids. vpcc denotes the voltage of point of common coupling (PCC). vgrid denotes the infinite grid voltage. i1 and i2 are the grid-side output current and transmission line current, respectively. Since the grid-connected dynamics of full-converter mainly depends on the control features of GSC, this paper ignores the machine-side dynamics. The wind turbine, SG and MSC are simplified as constant power sources [6].
The following section will establish a dynamic mathematical model of the grid-connected system. There are two dq reference frames in the dynamic mathematical model, namely the PLL-based dq frame and the grid-based dq frame. The PLL-based reference frame aligns its d-axis with the PCC voltage space vector vpcc through the PLL output phase. Meanwhile, the grid-based reference frame has its d-axis aligned with the grid voltage space vector vgrid [10,17]. Superscripts ‘c’ and ‘g’ represent variables in the PLL-based reference frame and the grid-based reference frame, respectively. Phasor diagram of the component in different reference frames is shown in Figure 2.

2.1. Modeling of DC-Link

Since the machine-side dynamics are ignored, it is assumed that the active power output of the generator remains constant and is represented by Pwind. The dynamic mathematical model can be obtained from the DC link active power balance equation as Equation (1).
C dc V dc d V dc d t = P wind P g
C dc V dc , base 2 2 P base 2 d ( V dc pu ) 2 d t = P wind pu P g pu
P g = v pcc , d c i 1 d c + v pcc , q c i 1 q c
Pg and Pbase are the GSC power delivered to the grids and base power, respectively. Vdc and Vdc,base are expresses as DC voltage and rated DC voltage, respectively. Superscript ‘pu’ represents per unit variables. Subscripts ‘d’ and ‘q’ respectively notate the d-axis and q-axis components of variables. Hereafter the dc-link dynamic mathematical model is expressed by Equation (2). For convenience, the superscript ‘pu’ is omitted.

2.2. Outer and Inner Control Loop of GSC

The GSC control block diagram is shown in Figure 3. DC-link voltage control (DVC) and reactive power control are adopted for GSC, which contributes to balancing the power flow through DC link, maintaining DC-link voltage and operating at unit power factor for wind farm. The dynamic mathematical model of the outer and inner loop can be expressed as
{ d x 1 d t = K idc ( V dc 2 V dc , ref 2 ) d x 2 d t = K ii ( i 1 d , ref c i 1 d c ) d x 3 d t = K ii ( i 1 q , ref c i 1 q c )
{ v d c = K pdc K pi ( V dc 2 V dc , ref 2 ) + K pi x 1 K pi i 1 d c + x 2 ω L f 1 i 1 q c + v pcc , d c v q c = K pi ( i 1 q , ref c i 1 q c ) + x 3 + ω L f 1 i 1 d c
where x1, x2 and x3 represent intermediate state variables. Kpdc and Kidc notate DVC proportional gain and integral gain, respectively. Kpi and Kii are the proportional gain and integral gain of the inner current control loop, respectively. Subscript ‘ref’ denotes the system reference value.

2.3. Phase-Locked Loop Model

PLL uses the three-phase voltage at PCC bus as inputs to obtain the phase of the PCC voltage to achieve synchronization between the wind farm and the grids. The control block diagram of the PLL is illustrated in Figure 4. The PLL principle has been well documented [26] and will not be discussed here. ω0 represents the rated angular frequency of the grids. Δω notates the frequency deviation. θpll is the voltage phase of the PLL output. Kppll and Kipll denote the PLL proportional gain and integral gain, respectively. PLL dynamic mathematical model can be expressed as
{ d x pll d t = K iPLL v pcc , q c d Δ θ pll d t = ω 0 + Δ ω

2.4. Grid Dynamics

The grid dynamics mainly include shunt capacitor dynamics, filter inductance dynamics, and transmission line equivalent inductance dynamics. The dynamic mathematical model of the grid is established in the grid-based reference frame. The grid dynamic mathematical model can be written as Equation group (7):
{ d i 1 d g d t = 1 L f 1 ( v d g v pcc , d g R f 1 i 1 d g + ω 0 L f 1 i 1 q g ) d i 1 q g d t = 1 L f 1 ( v q g v pcc , q g R f 1 i 1 q g ω 0 L f 1 i 1 d g ) d i 2 d g d t = 1 L g ( v pcc , d g v grid , d g R g i 2 d g + ω 0 L g i 2 q g ) d i 2 q g d t = 1 L g ( v pcc , q g v grid , q g R g i 2 q g ω 0 L g i 2 d g ) d v pcc , d g d t = 1 C 1 ( i 1 d g i 2 d g + ω 0 C 1 v pcc , q g ) d v pcc , q g d t = 1 C 1 ( i 1 q g i 2 q g ω 0 C 1 v pcc , d g )
Rg and Lg denote the total equivalent resistance and inductance of the grid, including the transformers and the transmission lines. The impedance from the PCC to the grid can be represented as a single impedance Rg + jω0Lg, Rg = RT1 + RT2 + R2 + R3, Lg = LT1 + LT2 + L2 + L3.

3. Eigenvalue Analysis

3.1. Analysis of the Dominant Oscillation Mode

In this paper, a wind farm consisting of fifty 2 MW wind turbines connected to the AC grid through long-distance transmission lines is used as the target test system. The parameters of the system are listed in Table 1. The short circuit ratio (SCR) of this system is 1.53, which indicates that the wind farm is connected to a very weak AC grid [27]. The parameters of the wind generator are shown in Table 2.
In the system dynamic mathematical model established in this paper, the state variables are x = [ ig1d, ig1q, ig2d, ig2q, vgpcc,d, vgpcc,q, xpll, Δθpll, Vdc, x1, x2, x3]. By linearizing the dynamic mathematical model at an operating condition x0, the small signal model of the system can be established as Equation (8) shows.
d Δ x d t = A Δ x
In Equation (8), A represents the eigenmatrix of the small signal model as shown in Appendix A and Δx denotes incremental state vector.
When the active power output of the wind farm is maintained at 0.8 pu, the eigenmatrix is used to calculate the eigenvalues of the system as shown in Table 3. It can be observed that there are four oscillation modes in the target system, of which λ6,7 and λ9,10 belong to the SSO mode. However, the real parts of the eigenvalues λ6,7 are positive, which indicates that the mode exhibits negative damping and the system is unstable. For this mode, the participation factors of state variables are shown in Figure 5. In Figure 5, the first six state variables represent the dynamics of the grids and the last six state variables represent the dynamics of the wind farm. Therefore, this mode is related to both the grid dynamics and the wind farm dynamics and reflects the subsynchronous interaction between the AC grids and the wind farm. As far as the control loops are concerned, the participation factors of these state variables (Δθpll, xpll, V2dc, x1) are higher. That is, PLL and DVC have a greater impact on this mode.

3.2. Impacts of the Active Power Outputs of the Wind Farm on Subsynchronous Oscillation Characteristics with Different Control Parameters

There are two main factors that affect the eigenvalues in the weak grids: one is active power output (operating condition), and the other is the control structure and control parameters. By calculating the participation factors, it can be seen that the PLL and the DVC loop have a greater impact on the dominant oscillation mode. In this section, the eigenvalue method will be used to analyse the impact of active power output on SSO characteristics with different control parameters. For convenience of expression, the following sections will use comparative gain to express the control parameters. The comparative gain represents a multiple of the pre-set value of the parameters given in Table 2.

3.2.1. Impacts of Active Power Outputs with Different PLL Proportional Gains

To evaluate this case, Kppll is selected between 0.1 and 1.2 times of its pre-set value. When the active power output increases from 0.6 pu to 1.0 pu, the variations of the dominant eigenvalues with different Kppll are shown in Figure 6 (only those parts are shown where the imaginary part is positive). When the value of Kppll is large (e.g., when the factors are larger than 0.3 times), the eigenvalues move toward the right half plane (RHP) with the increase of the active power output, the mode damping decreases, and the system stability decreases. The active power output is negatively related to the mode damping. When the value of Kppll is small (e.g., when the factors are smaller than 0.3 times), the eigenvalues move towards the left half plane (LHP) as the active power output increases. The active power output is positively correlated with the mode damping. There are only slight changes of the frequency of the SSO modes with different active power outputs.
When Kppll takes these intermediate values, the correlation between the active power output and the mode damping will change from negative correlation to positive correlation with the decrease of Kppll. When Kppll takes the critical value, the real part of the dominant eigenvalues changes with the active power output as shown in Figure 7. Moreover, as depicted in Figure 7, the real part of the dominant eigenvalues gradually increases when the active power output increases from 0.6 pu to 0.75 pu, while the real part of the dominant eigenvalues decreases when the active power output increases from 0.75 pu to 1.0 pu. It can be found that when Kppll takes the critical value, the mode damping decreases first and then increases as the active power output increases.
In addition, it can also be seen from Figure 6 that when the active power output is negatively correlated with the mode damping, the larger the value of Kppll, the greater the variation of the mode damping with the active power output will be. That is, the stability of the system is more affected by the active power output. Conversely, when the active power output is positively correlated with the mode damping, the smaller the value of Kppll, the stability of the system is more affected by the active power output.
From the results above, a conclusion can be drawn that when selecting a larger Kppll, the active power output is negatively correlated with the damping of this SSO mode, while when selecting a smaller Kppll, the active power output is positively correlated with the damping of this SSO mode. Moreover, there is a critical value Kppll for correlation. Meanwhile, the closer Kppll is to the critical value, the less the system stability is affected by the active power output.

3.2.2. Impacts of Active Power Outputs with Different PLL Integral Gain

In the two cases where Kppll is selected to be larger (negative correlation) and smaller (positive correlation), the impact of the active power outputs on the mode damping with different Kipll is observed. When the active power output increases from 0.6 pu to 1.0 pu, the dominant eigenvalue is plotted as shown in Figure 8. As shown in Figure 8a, with different Kipll, the dominant eigenvalues move towards the RHP as the active power output increases and in effect decreasing the mode damping. At the same time, Figure 8b shows response with smaller Kppll value. With different Kipll, the dominant eigenvalues move towards the LHP as the active power output increases and the mode damping increases. It can be observed that adjusting Kipll does not affect the correlation between the active power output and the damping of this SSO mode. However, under the same active power output condition, the damping of the SSO mode increases when Kipll decreases. This is because the typical control parameters of a PLL are designed to ensure good phase tracking responses. However, in a weak grid, a fast PLL response will enlarge the interaction between the weak grid and the wind turbine converter, which will reduce the system stability. Therefore, a smaller integral gain is selected to improve the stability by compromising the PLL response characteristics.

3.2.3. Impacts of the Active Power Outputs with Different DVC Proportional Gain.

According to the above analysis on PLL parameters, four representative PLL parameters are selected as shown in Table 4. The impact of Kpdc on the correlation between the active power output and the damping of the dominant SSO mode is analysed with the four different PLL parameters. When the active power output increases from 0.6 pu to 1.0 pu, the variations of the dominant eigenvalues with different Kpdc are presented in Figure 9.
The Kppll of PLL is selected to be larger in Figure 9a,b. Figure 9a,b show that with different Kpdc, the dominant eigenvalues move towards the RHP as the active power output increases, and the mode damping decreases. The Kppll of PLL is selected to be smaller in Figure 9c,d and shows that with different Kpdc, the dominant eigenvalues move towards the LHP as the active power output increases, and the mode damping increases. Therefore, adjusting Kpdc does not change the correlation between the active power output and the mode damping. However, when the active power output is negatively correlated with the mode damping, the smaller the value of Kpdc, the greater the variation of the mode damping with the active power output. That is, system stability is more affected by the active power output (as shown in Figure 9a,b). Conversely, when the active power output is positively correlated with the mode damping, the greater the value of Kpdc, the greater the system stability affected by the active power output (as shown in Figure 9c,d).
Meanwhile, it can be found that the increase in Kpdc leads to increase the mode damping under the same active power output condition. When the damping of the SSO mode is small, the stability can be improved by increasing Kpdc. Comparing Figure 9a,c with Figure 9b,d, it can be seen that better and improved system stability can be achieved by simultaneously decreasing Kipll and increasing Kpdc.
A conclusion can be drawn from the analysis that the correlation between the active power output and the damping of the dominant SSO mode mainly depends on Kppll. When Kppll is large, the active power output is negatively correlated with the damping of this SSO mode. When Kppll is small, the active power output is positively correlated with the damping of the dominant SSO mode. Moreover, there is a critical range for Kppll, in which SSO damping is near consistent irrespective to the change of active power variation. Meanwhile, the system stability can be improved by appropriately decreasing Kipll or increasing Kpdc.

4. Case Study and Simulation Verifications

To validate the effectiveness of the conclusions in Section 3, the impact of the active power output on the eigenvalues of the system is analysed with different control parameters shown in Figure 1. At the same time, the detailed simulation model of the studied system is developed in Matlab/Simulink (2018a, MathWorks, Natick, MA, USA) for validation.

4.1. Verification of the Negative Correlation when the PLL Proportional Gain is Large

When the active power output is 0.6pu, the system has good stability through trial-and-error and adjustment of control parameters. The control parameters in this case are called the based-case as shown in Table 5. When the control parameters of the based-case in Table 5 are used (with the larger Kppll selected), the eigenvalue locus of the two SSO modes with the increase in active power output are plotted in Figure 10a. It is found that under the control parameters of the based-case, the eigenvalues λ6,7 move to the RHP with the increase of active power output. The mode damping decreases continuously, and the system stability is weakened. When the active power output reaches 0.75 pu, λ6,7 first crosses the imaginary axis and enters the RHP. The system becomes unstable. That is, there is a negative correlation between the active power output and the damping of the λ6,7 mode. The results proved that when Kppll is large, the active power output is negatively correlated with the damping of this SSO mode.
When the control parameters of group 1 in Table 5 are used, the impact of the active power output on the eigenvalues of the SSO modes is shown in Figure 10b. Clearly, the eigenvalues are always in the LHP during the variations of active power output. The damping of the λ6,7 mode is always positive, and the system remains stable. Therefore, it is proved that the system stability can be improved by decreasing Kipll and increasing Kpdc.
In order to verify the above analysis, an electromagnetic transient simulation model of the grid-connected wind farm system in Figure 1 is built in MATLAB/Simulink. The studied system adopts the control parameters of the based-case and the group 1 control parameters, respectively. At t = 3 s, the active power output of the wind farm increases from 0.7 pu to 0.75 pu. Responses of active power output, DC voltage and phase-a voltage of the PCC are observed and analysed. The corresponding time-domain simulation results are presented in Figure 11. It can be seen that when the active power output increases from 0.7 pu to 0.75 pu, the system with the control parameters of the based-case oscillates and becomes unstable. As shown in Figure 11a, the wind power has 31Hz oscillation. This further confirms the conclusion in Section 3 that the active power output is negatively correlated to the damping of this λ6,7 mode with a lager Kppll. Furthermore, the system with the group 1 control parameters is able to keep stable after disturbance, indicating that the damping of the SSO mode increased after adjusting Kipll and Kpdc. The simulation results are consistent with the analysis results above.

4.2. Verification of the Positive Correlation when the PLL Proportional Gain Is Small

When the control parameters of group 2 in Table 5 are used (the smaller Kppll is selected), the eigenvalue locus with varied active power output is depicted in Figure 12a. It can be seen that the eigenvalues λ6,7 move to the LHP as the active power output increases. The damping of this SSO mode increases and the system stability is enhanced. Moreover, when the active power output of the wind farm is too small (less than 0.75 pu), the eigenvalue λ6,7 will be in the RHP. The system will result in diverging oscillation and become unstable. That is, the active power output is positively correlated to the damping of the λ6,7 mode. It is proved that when Kppll is small, the active power output is positively correlated with the damping of this SSO mode.
Similarly, when the control parameters of group 3 in Table 5 are adopted, the impact of active power output on the eigenvalues of the SSO modes is shown in Figure 12b. In the process of active power output change, the eigenvalues are always in the LHP. The damping of the λ6,7 mode is always positive, and the system remains stable. This analysis indicates again that the stability of the system can be enhanced by decreasing Kipll and increasing Kpdc.
To validate the above analysis, group 2 and group 3 were selected as the control parameters of the system respectively. At t = 3 s, the active power output of the wind farm decreases from 0.8 pu to 0.7 pu. Figure 13 presents the corresponding time-domain simulation results. It can be observed that when the active power output decreases from 0.8 pu to 0.7 pu, the system using group 2 of control parameters is unstable and the oscillation frequency of the wind power is 21 Hz. This result matches the conclusion in Section 3 well, which demonstrates that there is a positive correlation between the active power output and the damping of this λ6,7 mode with a smaller Kppll. Meanwhile, the system using the control parameters of group 3 can remain stable after disturbance. This indicates that the damping of the SSO mode increases after adjusting the parameters. The simulation results are in accordance with the analysis results above.

4.3. Simulation Verification for a Complex System

To verify the analyses, simulation has been carried out for a complex system with different wind farm ratings, grid configurations and grid voltage levels, as shown in Figure 14. The system parameters are given in Figure 14. The control parameters are given in Table 6. The simulation results are given in Figure 15 and Figure 16.
In Figure 15, a large Kppll is used. Figure 15a gives the simulation results when the Group 4 control parameters are used. When the wind power increases, system tends to be unstable. If the control parameters are adjusted properly, by reducing Kipll and increasing Kpdc, as in Group 5, the system can be maintained stable, as shown in Figure 15b.
In Figure 16, a small Kppll is used. Figure 16a gives the simulation results when the Group 6 control parameters are used. When the wind power decreases, system tends to be unstable. If the control parameters are adjusted properly, by reducing Kipll and increasing Kpdc, as in Group 7, the system can be maintained as stable, as shown in Figure 16b.
The simulation of the complex system further verifies the proposed theoretical analysis.

5. Conclusions

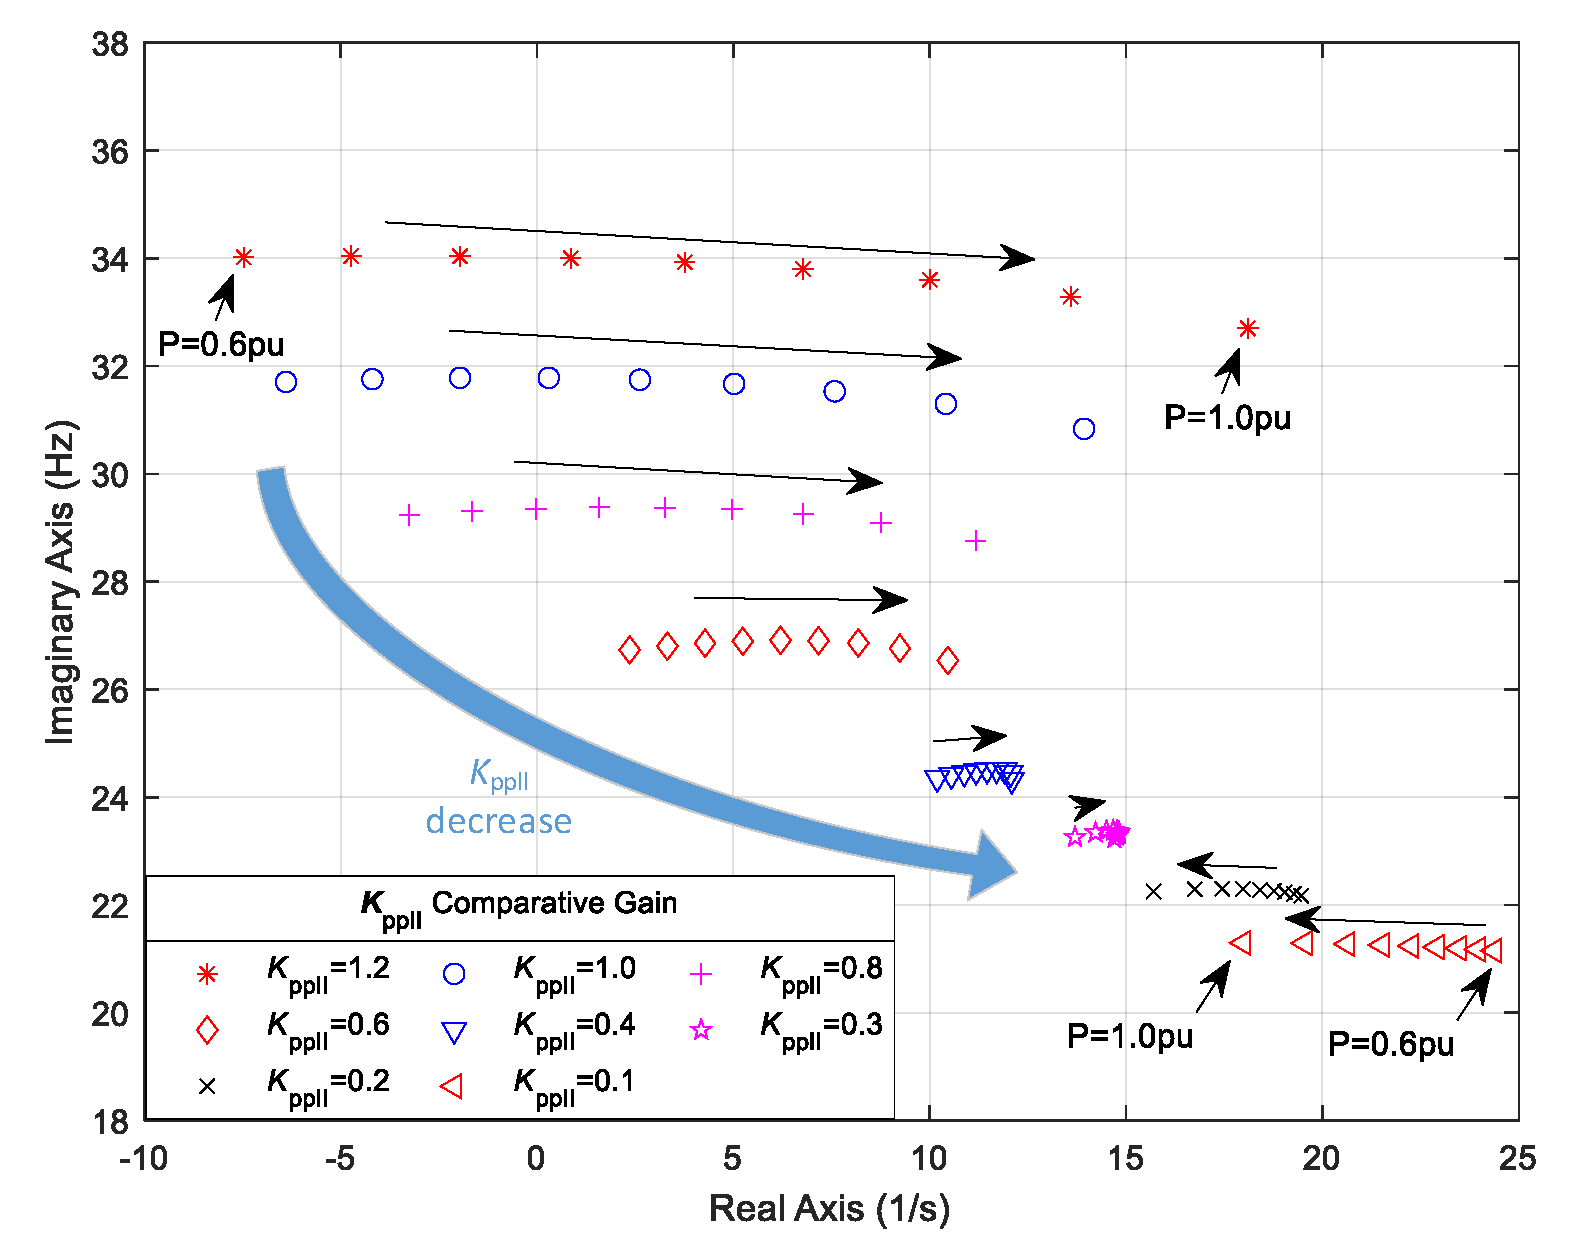
This paper investigates the influence of active power output on subsynchronous oscillation characteristics in weak grids. Compared to the research in the literature, this is the first of its kind to investigate the distinctive correlations between active power output and the damping of the SSO mode. The reasons for the different correlation between active power output and SSO mode damping have been explained. The findings and contributions of the study include:
The change of active power output in one direction can either improve or reduce SSO mode damping. This work identifies that the correlation between active power variation and damping mainly depends on the proportional gain of the phase-locked loop (PLL).
  • When the PLL proportional gain is large, the active power output is negatively correlated with the damping of the SSO mode. When the PLL proportional gain is small, the active power output is positively correlated with the damping of the SSO mode. This clarifies the confusions in the understanding of the correlation between active power output and SSO damping.
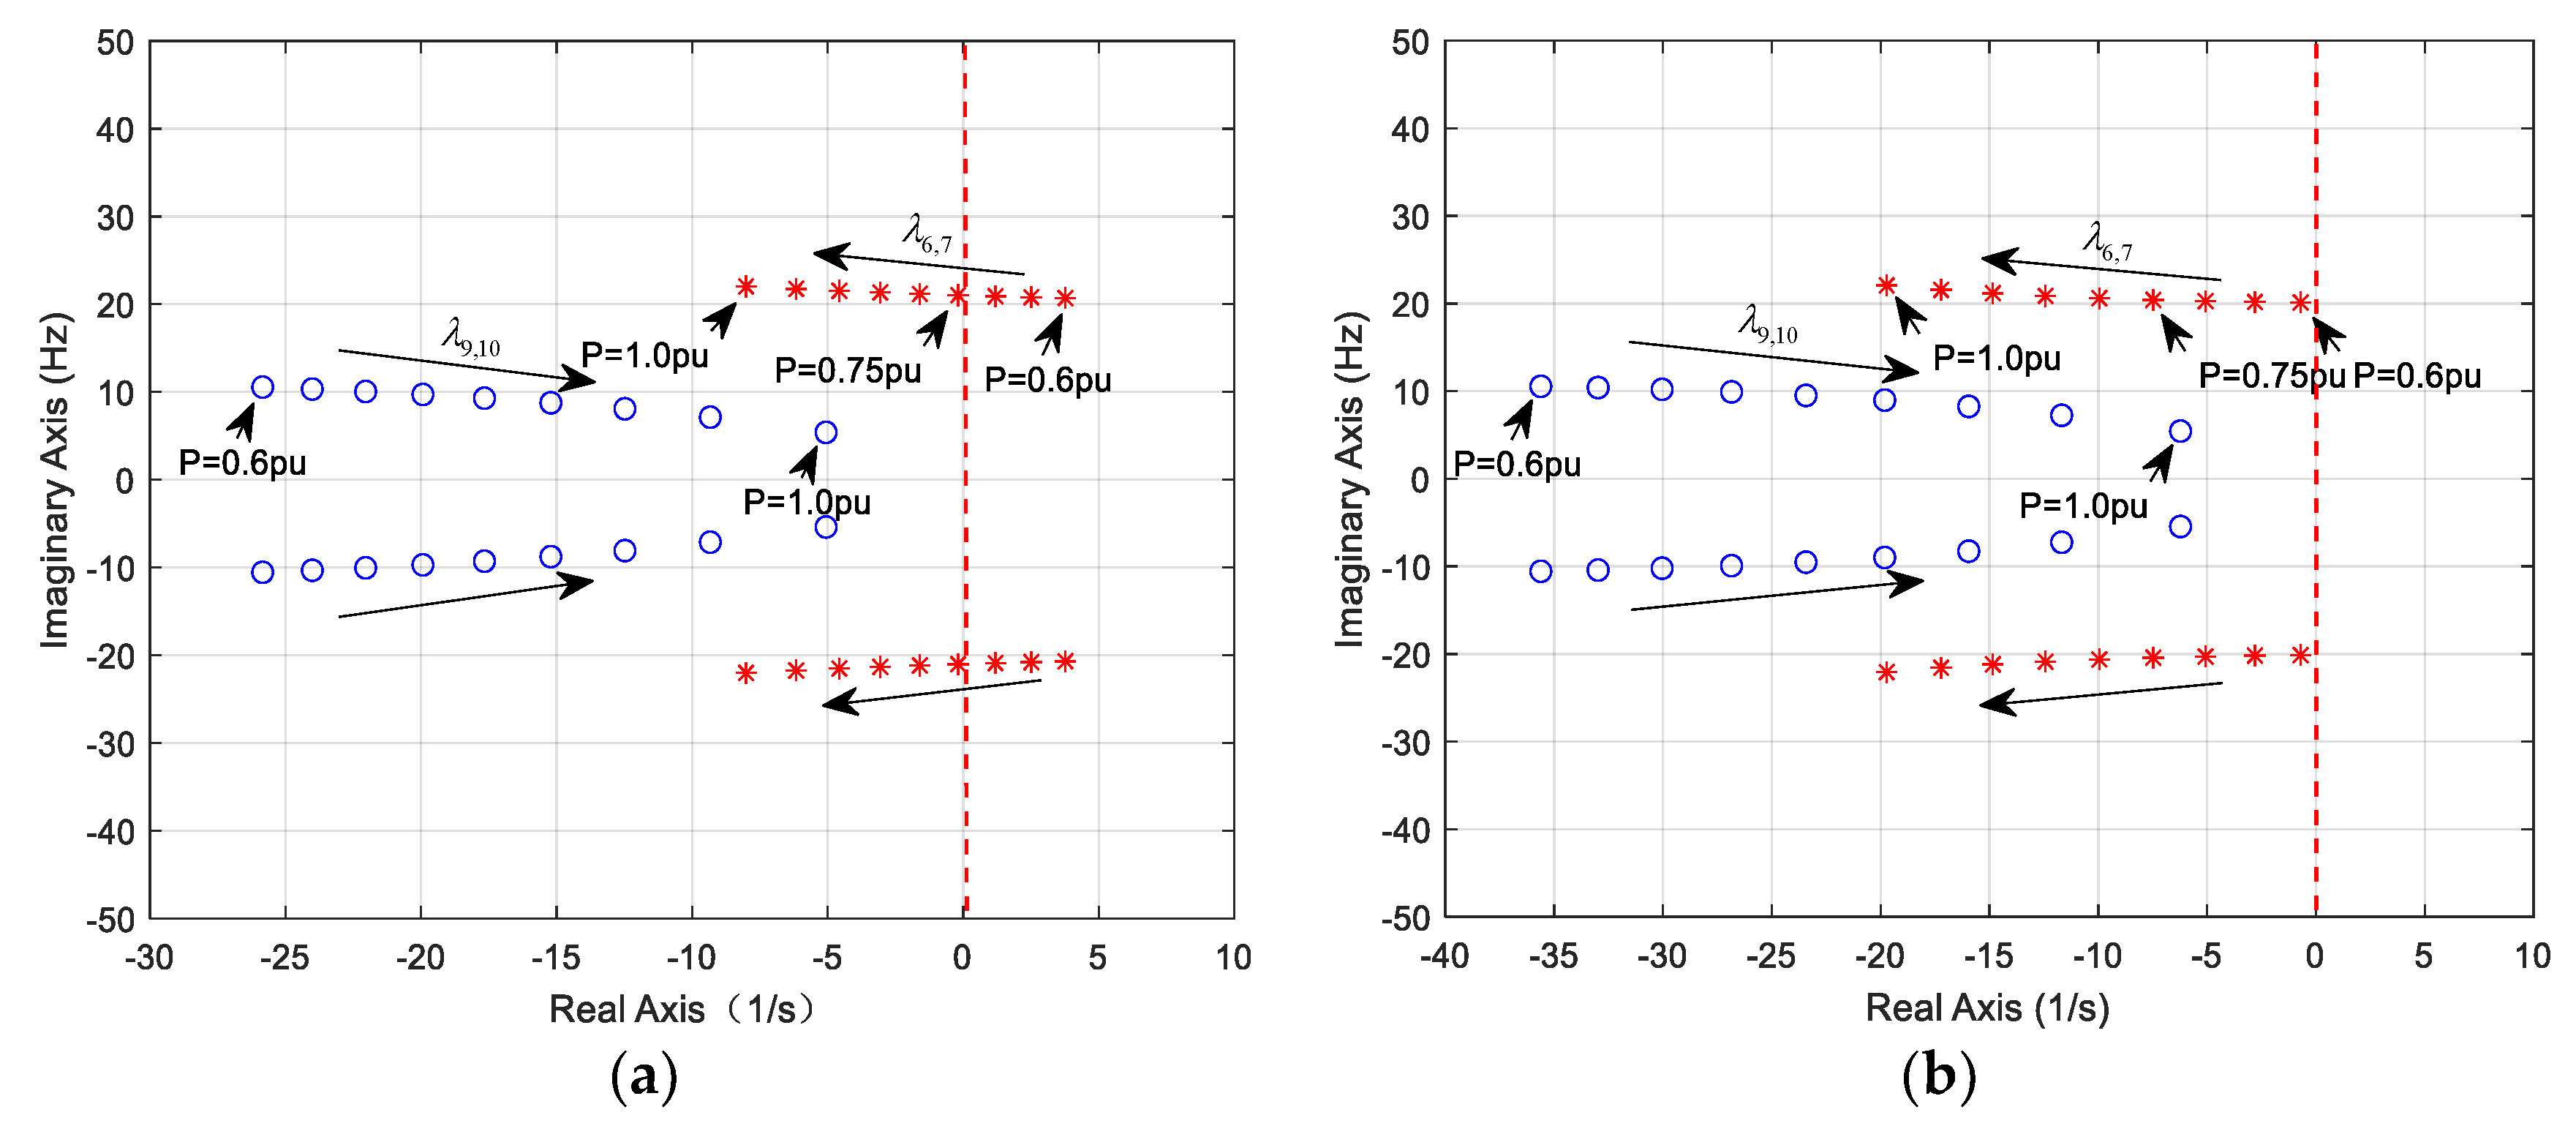
  • The PLL integral gain and the DC voltage control proportional gain have little influence on the correlation between the active power output and SSO damping. However, the system stability can be improved by appropriately retuning the PLL integral gain and the DC voltage control proportional gain.
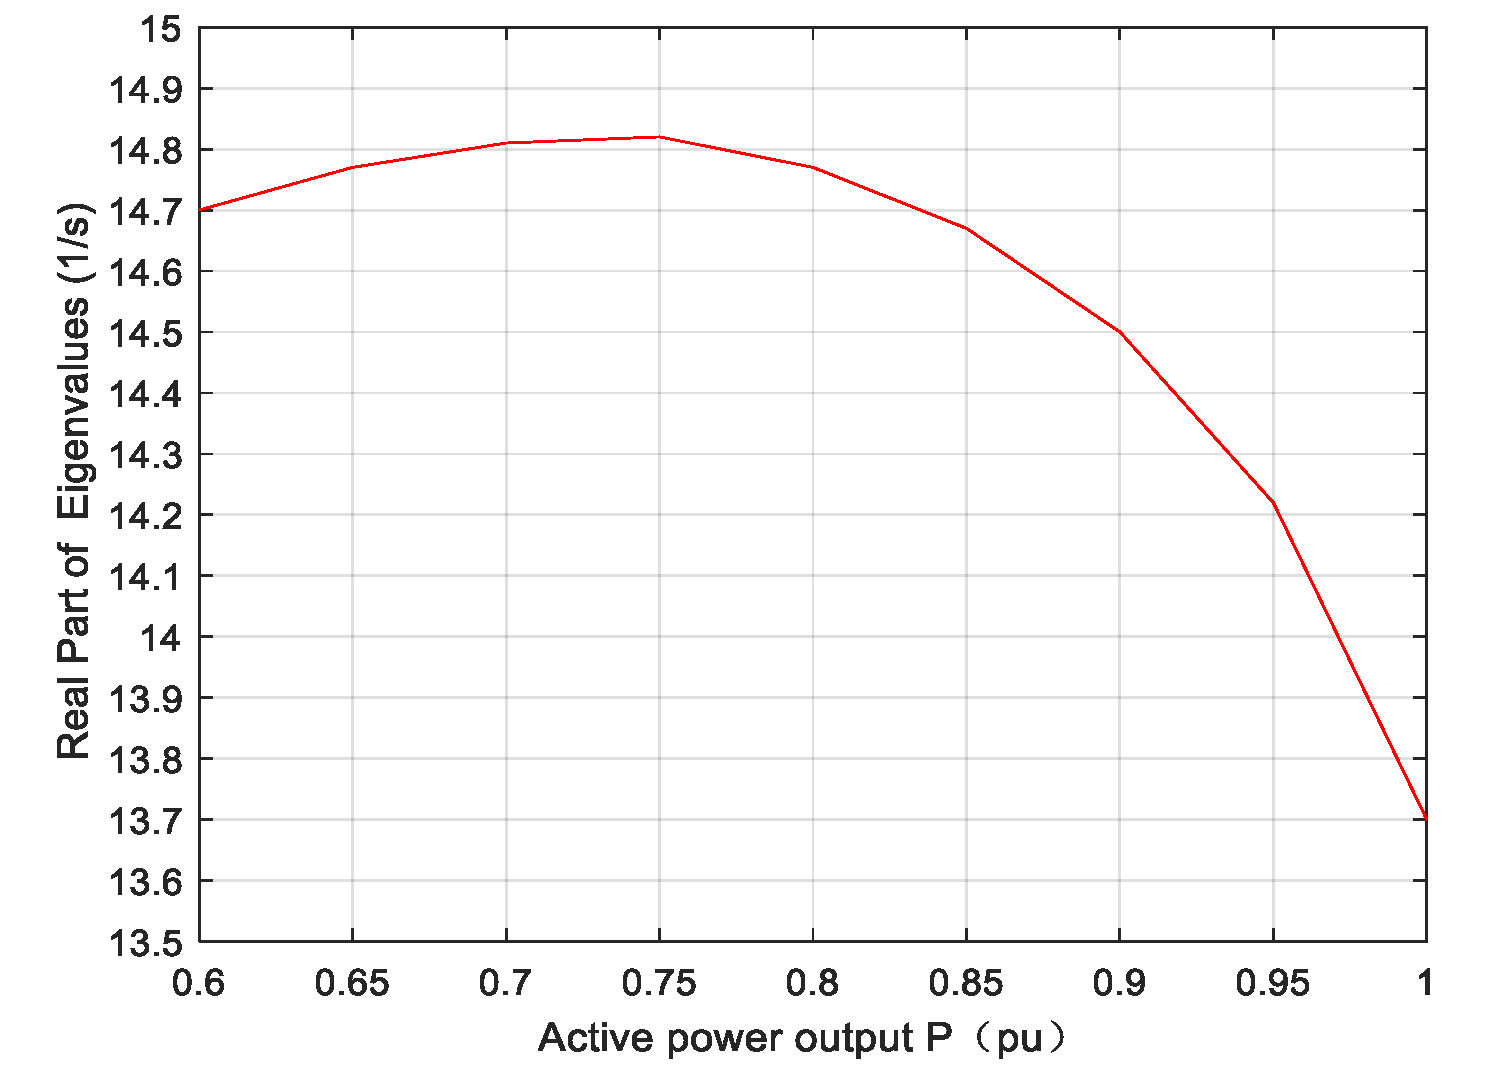
  • There is a critical range for the PLL proportional gain, in which SSO damping is near consistent irrespective to the change of active power variation. The influence of active power output on the stability can be minimized by selecting proper the PLL proportional gain first when the damping variation is at the critical range. Then adjustment of other parameters will improve the stability. This is valuable for engineering applications in designing PLL parameters.
For full-converter wind power systems, the grid-connected dynamics mainly depend on the control of GSC and are not affected by the wind turbine types. The conclusions of this paper are applicable to full-converter wind farms with induction generators or permanent magnet synchronous generators. DFIG is not covered in the study, and the analysis of the DFIG-based wind farms and the auxiliary control design will be undertaken in future research.

Author Contributions

Conceptualization, Y.H., J.L. and G.W.; methodology, Y.H., J.L., K.W. and G.W.; validation, Y.H., J.L. and G.W.; formal analysis, Y.H. and J.L.; investigation, Y.H. and J.L.; writing—original draft preparation, Y.H., J.L., G.W. and R.S.; writing—review and editing, Y.H., J.L., T.J. and R.S.; supervision, J.L. and K.W.; funding acquisition, J.L. All authors have read and agreed to the published version of the manuscript.

Funding

This work is supported by National Natural Science Foundation of China under Grant 51507155 and State Key Laboratory Open Fund Project under Grant FXB51201901458.

Conflicts of Interest

The authors declare no conflict of interest.

Appendix A

The A matrix expression in Equation (8):
[ K 1 K 9 + K 2 K 10 R f 1 L f 1 K 1 K 10 K 2 K 9 L f 1 ω 0 0 0 K 1 2 1 L f 1 K 1 K 2 L f 1 0 K 1 K 11 K 2 K 12 + K 7 L f 1 2 K 1 K pdc K pi L f 1 K 1 K pi L f 1 K 1 L f 1 K 2 L f 1 K 2 K 9 K 1 K 10 L f 1 ω 0 K 1 K 9 + K 2 K 10 R f 1 L f 1 0 0 K 1 K 2 L f 1 K 2 2 1 L f 1 0 K 2 K 11 + K 1 K 12 + K 8 L f 1 2 K 2 K pdc K pi L f 1 K 2 K pi L f 1 K 2 L f 1 K 1 L f 1 0 0 R g L g ω 0 1 L g 0 0 0 0 0 0 0 0 0 ω 0 R g L g 0 1 L g 0 0 0 0 0 0 1 C 1 0 1 C 1 0 0 ω 0 0 0 0 0 0 0 0 1 C 1 0 1 C 1 ω 0 0 0 0 0 0 0 0 0 0 0 0 K 2 K ipll K 1 K ipll 0 K 6 K ipll 0 0 0 0 0 0 0 0 K 2 K ppll K 1 K ppll 1 K 6 K ppll 0 0 0 0 v pcc , d 0 g 2 τ v pcc , q 0 g 2 τ 0 0 i 1 d 0 g 2 τ i 1 q 0 g 2 τ 0 0 0 0 0 0 0 0 0 0 0 0 0 0 2 K idc 0 0 0 K 1 K ii K 2 K ii 0 0 0 0 0 K 3 K ii 2 K ii K pdc K ii 0 0 K 2 K ii K 1 K ii 0 0 0 0 0 K 4 K ii 0 0 0 0 ]
State variables:
x = [ i g 1 d , i g 1 q , i g 2 d , i g 2 q , v g pcc , d , v g pcc , q , x pll , Δ θ pll , V d c , x 1 , x 2 , x 3 ]
K 1 = cos θ pll 0 ,   K 2 = sin θ pll 0
K 3 = sin θ pll 0 i 1 d 0 g + cos θ pll 0 i 1 q 0 g ,   K 4 = cos θ pll 0 i 1 d 0 g sin θ pll 0 i 1 q 0 g
K 5 = sin θ pll 0 v pcc , d 0 g + cos θ pll 0 v pcc , q 0 g ,   K 6 = cos θ pll 0 v pcc , d 0 g sin θ pll 0 v pcc , q 0 g
K 7 = sin θ pll 0 v d 0 c cos θ pll 0 v q 0 c ,   K 8 = cos θ pll 0 v d 0 c sin θ pll 0 v q 0 c
K 9 = K 2 ω 0 L f 1 K 1 K pi ,   K 10 = K 1 ω 0 L f 1 K 2 K pi
K 11 = K 5 K 4 ω 0 L f 1 K 3 K pi ,   K 12 = K 3 ω 0 L f 1 K 4 K pi
τ = C dc V dc 2 2 P base

References

  1. Global Wind Energy Council. Global Wind Report 2019; Global Wind Energy Council: Brussels, Belgium, 2019. [Google Scholar]
  2. Leon, A.E.; Solsona, J.A. Sub-synchronous interaction damping control for DFIG wind turbines. IEEE Trans. Power Syst. 2015, 30, 419–428. [Google Scholar] [CrossRef]
  3. Ren, W.; Larsen, E. A refined frequency scan approach to subsynchronous control interaction (SSCI) study of wind farms. IEEE Trans. Power Syst. 2016, 31, 3904–3912. [Google Scholar] [CrossRef]
  4. Adams, J.; Pappu, V.A.; Dixit, A. ERCOT experience screening for sub-synchronous control interaction in the vicinity of series capacitor banks. In Proceedings of the 2012 IEEE Power and Energy Society General Meeting, San Diego, CA, USA, 22–26 July 2012; pp. 1–5. [Google Scholar]
  5. Strachan, N.P.; Jovcic, D. Stability of a variable-speed permanent magnet wind generator with weak ac grids. IEEE Trans. Power Del. 2010, 25, 2779–2788. [Google Scholar] [CrossRef]
  6. Liu, H.; Xie, X.; He, J.; Xu, T.; Yu, Z.; Wang, C.; Zhang, C. Subsynchronous interaction between direct-drive PMSG based wind farms and weak AC networks. IEEE Trans. Power Syst. 2017, 32, 4708–4720. [Google Scholar] [CrossRef]
  7. Liu, H.; Xie, X.; Zhang, C.; Li, Y.; Liu, H.; Hu, Y. Quantitative SSR analysis of series-compensated DFIG-based wind farms using aggregated RLC circuit model. IEEE Trans. Power Syst. 2017, 32, 474–483. [Google Scholar] [CrossRef]
  8. Wang, L.; Xie, X.; Jiang, Q.; Liu, H.; Li, Y.; Liu, H. Investigation of SSR in practical DFIG-based wind farms connected to a series compensated power system. IEEE Trans. Power Syst. 2015, 30, 2772–2779. [Google Scholar] [CrossRef]
  9. Hu, J.; Yuan, H.; Yuan, X. Modeling of DFIG-based WTs for small signal stability analysis in DVC timescale in power electronized power systems. IEEE Trans. Energy Convers. 2017, 32, 1151–1165. [Google Scholar] [CrossRef]
  10. Li, Y.; Fan, L.; Miao, Z. Wind in weak grids: Low-frequency oscillations, subsynchronous oscillations, and torsional interactions. IEEE Trans. Power Syst. 2020, 35, 109–118. [Google Scholar] [CrossRef]
  11. Wang, D.; Liang, L.; Shi, L.; Hu, J.; Hou, Y. Analysis of modal resonance between PLL and DC-Link voltage control in weak-grid tied VSCs. IEEE Trans. Power Syst. 2019, 34, 1127–1138. [Google Scholar] [CrossRef]
  12. Huang, Y.; Wang, D. Effect of control-loops interactions on power stability limits of VSC integrated to AC system. IEEE Trans. Power Del. 2018, 33, 301–310. [Google Scholar] [CrossRef]
  13. Li, X.; Liang, J.; Li, G.; Joseph, T. Modeling and stability analysis of the sub-synchronous interactions in weak AC grids with wind power integration. In Proceedings of the 2018 International Universities Power Engineering Conference (UPEC), Glassgow, UK, 4–7 September 2018; pp. 1–6. [Google Scholar]
  14. TAO, G.; Wang, Y.; WU, Y.; CHEN, Y. Subsynchronous interaction analysis of PMSG based wind farm with AC networks. In Proceedings of the 2019 International Conference on Electrical Machines and Systems (ICEMS), Harbin, China, 11–14 August 2019; pp. 1–5. [Google Scholar]
  15. Alawasa, K.M.; Mohamed, Y.A.-R.I.; Xu, W. Modeling, analysis, and suppression of the impact of full-scale wind-power converters on subsynchronous damping. IEEE Syst. J. 2013, 7, 700–712. [Google Scholar] [CrossRef]
  16. Cespedes, M.; Sun, J. Impedance Modeling and Analysis of Grid-Connected Voltage-Source Converters. IEEE Trans. Power Electron. 2014, 29, 1254–1261. [Google Scholar] [CrossRef]
  17. Fan, L. Modeling type-4 wind in weak grids. IEEE Trans. Sustain. Energy 2019, 10, 853–864. [Google Scholar] [CrossRef]
  18. Huang, Y.; Yuan, X.; Hu, J.; Zhou, P. Modeling of VSC connected to weak grid for stability analysis of DC-Link voltage control. IEEE J. Emerg. Sel. Topics Power Electron. 2015, 3, 1193–1204. [Google Scholar] [CrossRef]
  19. Papangelis, L.; Debry, M.-S.; Prevost, T.; Panciatici, P.; Van Cutsem, T. Stability of a voltage source converter subject to decrease of short-circuit capacity: A case study. In Proceedings of the 2018 Power Systems Computation Conference (PSCC), Dublin, Ireland, 11–15 June 2018; pp. 1–7. [Google Scholar]
  20. Huang, B.; Sun, H.; Liu, Y.; Wang, L.; Chen, Y. Study on subsynchronous oscillation in D-PMSGs-based wind farm integrated to power system. IET Renew. Power Gener. 2019, 13, 16–26. [Google Scholar] [CrossRef]
  21. Lyu, J.; Cai, X.; Molinas, M. Optimal design of controller parameters for improving the stability of MMC-HVDC for wind farm integration. IEEE J. Emerg. Sel. Topics Power Electron. 2018, 6, 40–53. [Google Scholar] [CrossRef] [Green Version]
  22. Jing, L.; Xu, C. Impact of controller parameters on stability of MMC-based HVDC systems for offshore wind farms. In Proceedings of the International Conference on Renewable Power Generation (RPG 2015), Beijing, China, 17–18 October 2015; pp. 1–6. [Google Scholar]
  23. Pipelzadeh, Y.; Chaudhuri, N.R.; Chaudhuri, B.; Green, T.C. Coordinated Control of Offshore Wind Farm and Onshore HVDC Converter for Effective Power Oscillation Damping. IEEE Trans. Power Syst. 2017, 32, 1860–1872. [Google Scholar] [CrossRef]
  24. Amin, M.; Molinas, M. Understanding the Origin of Oscillatory Phenomena Observed Between Wind Farms and HVdc Systems. IEEE J. Emerg. Sel. Topics Power Electron. 2017, 5, 378–392. [Google Scholar] [CrossRef] [Green Version]
  25. Amin, M.; Rygg, A.; Molinas, M. Self-Synchronization of Wind Farm in an MMC-Based HVDC System: A Stability Investigation. IEEE Trans. Energy Convers. 2017, 32, 458–470. [Google Scholar] [CrossRef]
  26. Fan, L. Control and Dynamics in Power Systems and Microgrids; CRC Press: Boca Raton, FL, USA, 2017. [Google Scholar]
  27. Institute of Electrical and Electronics Engineers. IEEE Guide for Planning DC Links Terminating at AC Locations Having Low Short-Circuit Capacities; IEEE Standard 1204-1997; Institute of Electrical and Electronics Engineers: New York, NY, USA, 1997. [Google Scholar]
  28. Joseph, T.; Ugalde-Loo, C.E.; Balasubramaniam, S.; Liang, J. Real-Time Estimation and Damping of SSR in a VSC-HVDC Connected Series-Compensated System. IEEE Trans. Power Syst. 2018, 33, 7052–7063. [Google Scholar] [CrossRef]
Figure 1. The diagram of the grid-connected wind farm.
Energies 13 05225 g001
Figure 2. Phasor diagram of component in different reference frame.
Energies 13 05225 g002
Figure 3. The control block diagram of GSC
Energies 13 05225 g003
Figure 4. The control block diagram of the PLL.
Energies 13 05225 g004
Figure 5. Participation factors of the state variables in the dominant oscillation mode
Energies 13 05225 g005
Figure 6. The impact of the active power output on the dominant SSO modes with different Kppll.
Energies 13 05225 g006
Figure 7. The impact of the active power output on the dominant SSO modes with the critical value of Kppll.
Energies 13 05225 g007
Figure 8. The impact of the active power output on the dominant SSO modes with different Kipll. (a) At large Kppll. (b) At small Kppll.
Energies 13 05225 g008
Figure 9. The impact of the active power output on the dominant SSO modes with different Kpdc. (a) Case 1. (b) Case 2. (c) Case 3. (d) Case 4.
Energies 13 05225 g009
Figure 10. The impacts of the active power output on the SSO modes with the different control parameters. (a) Pre-set values. (b) Group 1.
Energies 13 05225 g010
Figure 11. Simulation results of wind power increase with a large Kppll. (a) Based-case. (b) Group 1.
Energies 13 05225 g011
Figure 12. The impacts of the active power output on the SSO modes with the different control parameters. (a) Group 2. (b) Group 3.
Energies 13 05225 g012
Figure 13. Simulation results of wind power decrease with a small Kppll. (a) Group 2. (b) Group 3.
Energies 13 05225 g013
Figure 14. The diagram of a complex system.
Energies 13 05225 g014
Figure 15. Simulation results of wind power increase with a large Kppll. (a) Using the Group 1 parameter (b) Using the Group 2 parameter after adjustment.
Energies 13 05225 g015
Figure 16. Simulation results of wind power decrease with a small Kppll. (a) Using Group 3’s parameters (b) Using Group 4’s parameters after adjustment
Energies 13 05225 g016
Table 1. Parameters of the grid-connected system.
ParameterValue (pu, SB = 100 MVA)
Transformer T1(575 V/25 kV)XT1 = 0.06, RT1 = 0.006
Transformer T2(25 kV/220 kV)XT2 = 0.065, RT2 = 0.0065
Long-distance transmission lineX2 = 0.525, R2 = 0.0525
Short-distance transmission lineX3 = 0.01, R3 = 0.001
Table 2. The parameters of a single wind generator.
ParameterValue (pu, SB = 2 MVA)
Rated power2 MW
Rated frequency50 Hz
GSC filterXf1 = 0.15, Rf1 = 0.003, yc1 = 0.25
DC capacitor0.09 F
Rated DC voltage1100 V
DVCKpdc = 1.1, Kidc = 137.5
Current controlKpi = 0.4758, Kii = 3.28
PLLKppll = 314, Kipll = 24,700
Table 3. Eigenvalues of the weak grids-connected wind power system.
ModeEigenvalue
λ1,2−569.33 ± j1764.69
λ3,4−87.53 ± j836.15
λ5−976.21
λ6,72.62 ± j199.47
λ8−91.51
λ9,10−15.89 ± j55.99
λ11−6.90
λ12−6.89
Table 4. Four different PLL parameters.
KppllKipll
Case 1314 (the pre-set value)24,700 (the pre-set value)
Case 231424,700 × 0.8
Case 3314 × 0.224,700
Case 4314 × 0.224,700 × 0.8
Table 5. Four different control parameters
ParametersBased-CaseGroup 1Group 2Group 3
PLLKppll314314314 × 0.2314 × 0.2
Kipll24,70024,700 × 0.824,700 × 0.824,700 × 0.7
DVCKpdc1.11.1 × 1.61.1 × 1.61.1 × 2
Kidc137.5137.5137.5137.5
Inner current control loopKpi = 0.4758Kii = 3.28
Table 6. Four different control parameters.
ParametersGroup 4Group 5Group 6Group 7
PLLKppll314314314 × 0.2314 × 0.2
Kipll24,70024,700 × 0.824,700 × 0.824,700 × 0.7
DVCKpdc1.1 × 1.21.1 × 1.81.1×1.81.1 × 2.0
Kidc137.5137.5137.5137.5
Inner current control loopKpi = 0.4758Kii = 3.28

