Article

Restoring Pre-Industrial CO2 Levels While Achieving Sustainable Development Goals

1
Ocean Foresters, Oxnard, CA 93003, USA
2
Pacific Centre for Environment and Sustainable Development, The University of the South Pacific, Suva, Fiji
3
Department of Food and Agriculture, University of New Hampshire, Durham, NH 03824, USA
4
Department of Marine Science, Incheon National University, Incheon 22012, Korea
5
Department of Ecology and Evolutionary Biology, University of Connecticut, Stamford, CT 06901, USA
6
Intake Works, Sacramento, CA 95820, USA
7
Thad Cochran Marine Aquaculture Center, University of Southern Mississippi, Ocean Springs, MS 39564, USA
8
Department of Geology, Baylor University, Waco, TX 76798, USA
9
Stingray Sensing, Goleta, CA 93117, USA
*
Author to whom correspondence should be addressed.
Part of a MARINER (U.S. Department of Energy ARPA-E) Team.
Energies 2020, 13(18), 4972; https://doi.org/10.3390/en13184972
Submission received: 20 July 2020 / Revised: 7 September 2020 / Accepted: 9 September 2020 / Published: 22 September 2020
(This article belongs to the Section A: Sustainable Energy)

Abstract

:
Unless humanity achieves United Nations Sustainable Development Goals (SDGs) by 2030 and restores the relatively stable climate of pre-industrial CO2 levels (as early as 2140), species extinctions, starvation, drought/floods, and violence will exacerbate mass migrations. This paper presents conceptual designs and techno-economic analyses to calculate sustainable limits for growing high-protein seafood and macroalgae-for-biofuel. We review the availability of wet solid waste and outline the mass balance of carbon and plant nutrients passing through a hydrothermal liquefaction process. The paper reviews the availability of dry solid waste and dry biomass for bioenergy with CO2 capture and storage (BECCS) while generating Allam Cycle electricity. Sufficient wet-waste biomass supports quickly building hydrothermal liquefaction facilities. Macroalgae-for-biofuel technology can be developed and straightforwardly implemented on SDG-achieving high protein seafood infrastructure. The analyses indicate a potential for (1) 0.5 billion tonnes/yr of seafood; (2) 20 million barrels/day of biofuel from solid waste; (3) more biocrude oil from macroalgae than current fossil oil; and (4) sequestration of 28 to 38 billion tonnes/yr of bio-CO2. Carbon dioxide removal (CDR) costs are between 25–33% of those for BECCS with pre-2019 technology or the projected cost of air-capture CDR.

Graphical Abstract

1. Introduction

People face interrelated crises affecting basic human needs for food, shelter, and health, while at the same time maintaining aspirations for education and meaningful work. Crises involving food and shelter (e.g., droughts, floods, sea-level rise, groundwater depletion, and diminished glaciers/snowpack, which store fresh water for use during dry periods) are exacerbated by increasing greenhouse gas concentrations. Crises involving health (e.g., pandemics and the increasing range of disease-transmitting organisms) also are intensified by climate change.
The need to find interconnected opportunities within the interrelated challenges is critical. Indeed, Pope Francis [1] and others (see Sorondo and Ramanathan [2]) wish to “...bring the whole human family together to seek a sustainable and integral development…” The 2015 Paris Agreement [3] recommends that “rapid reductions” of greenhouse gases be achieved “on the basis of equity, and in the context of sustainable development and efforts to eradicate poverty” [4].
Planning horizons account for much of the differences in integrated approaches to sustainability. Perhaps as much as 70 percent of humanity urgently need improved food, shelter, health, education, and opportunity. Many of these people see accomplishing United Nations Sustainable Development Goals (SDGs) [5] by 2030 as more urgent than zeroing greenhouse gas emissions by 2050. Some of the others agree, seeing the SDGs as the best way to mitigate violence, migrations, and unsustainable population growth.
However, the world is not on track to achieve the climate goals, as outlined in the Emissions Gap Report [6]. Previous IPCC reports called for substantial carbon dioxide removal (CDR) [7], updated in the 1.5 °C report [4], which stated, “All pathways that limit global warming to 1.5 °C with limited or no overshoot project the use of carbon dioxide removal on the order of 100–1000 GtCO2 over the 21st century.” Simply eliminating fossil fuels is insufficient to ensure warming of <1.5 °C (on timelines acceptable to everyone). Thus, zero-carbon electricity sources such as wind, hydro, solar, geothermal, and nuclear are necessary, but not sufficient.
There are a variety of CDR methods (also called negative emissions technologies or NETs). Some explicitly consider societal challenges: the U.S. National Academies of Sciences, Engineering, and Medicine [8] plus the comprehensive literature reviews by Minx et al. [9]), Fuss et al. [10] and Nemet et al. [11], as well as Tim Flannery’s books [12,13] and the recent Project Drawdown Review [14]. Three emerging technologies, considered insufficiently proven in these reviews, are now viable and warrant analyses of their potential impacts:
(1)
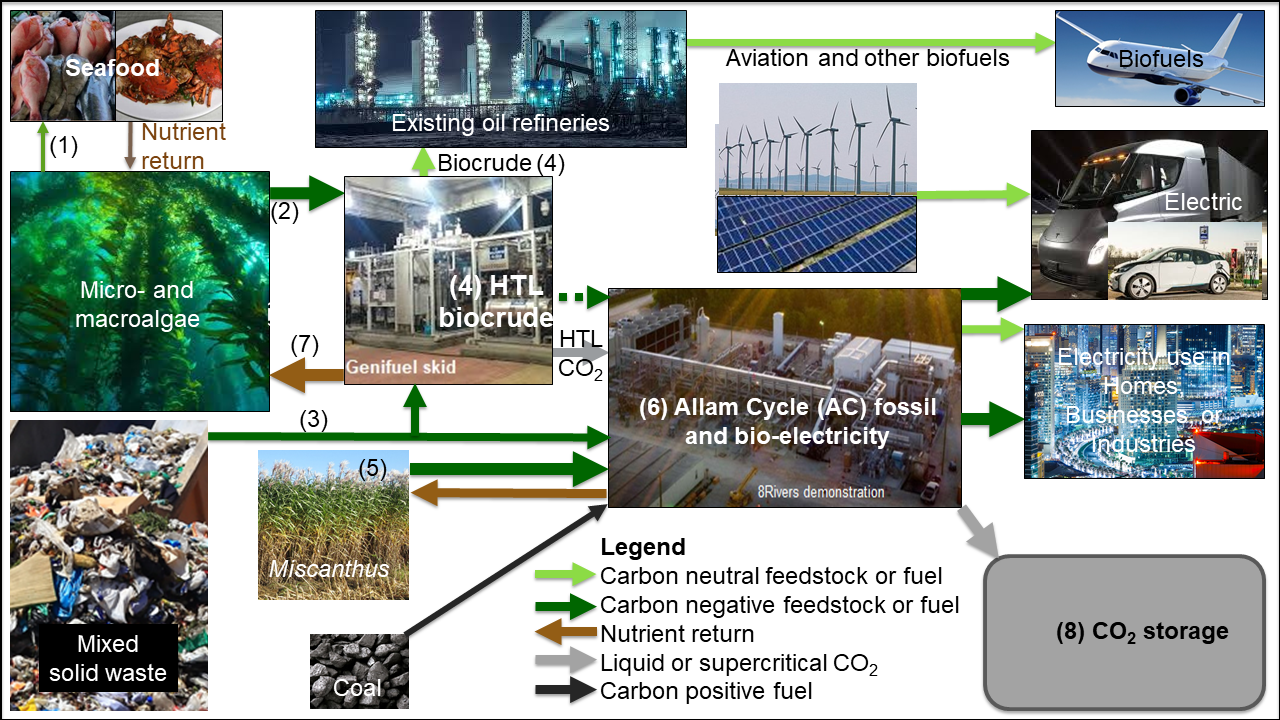
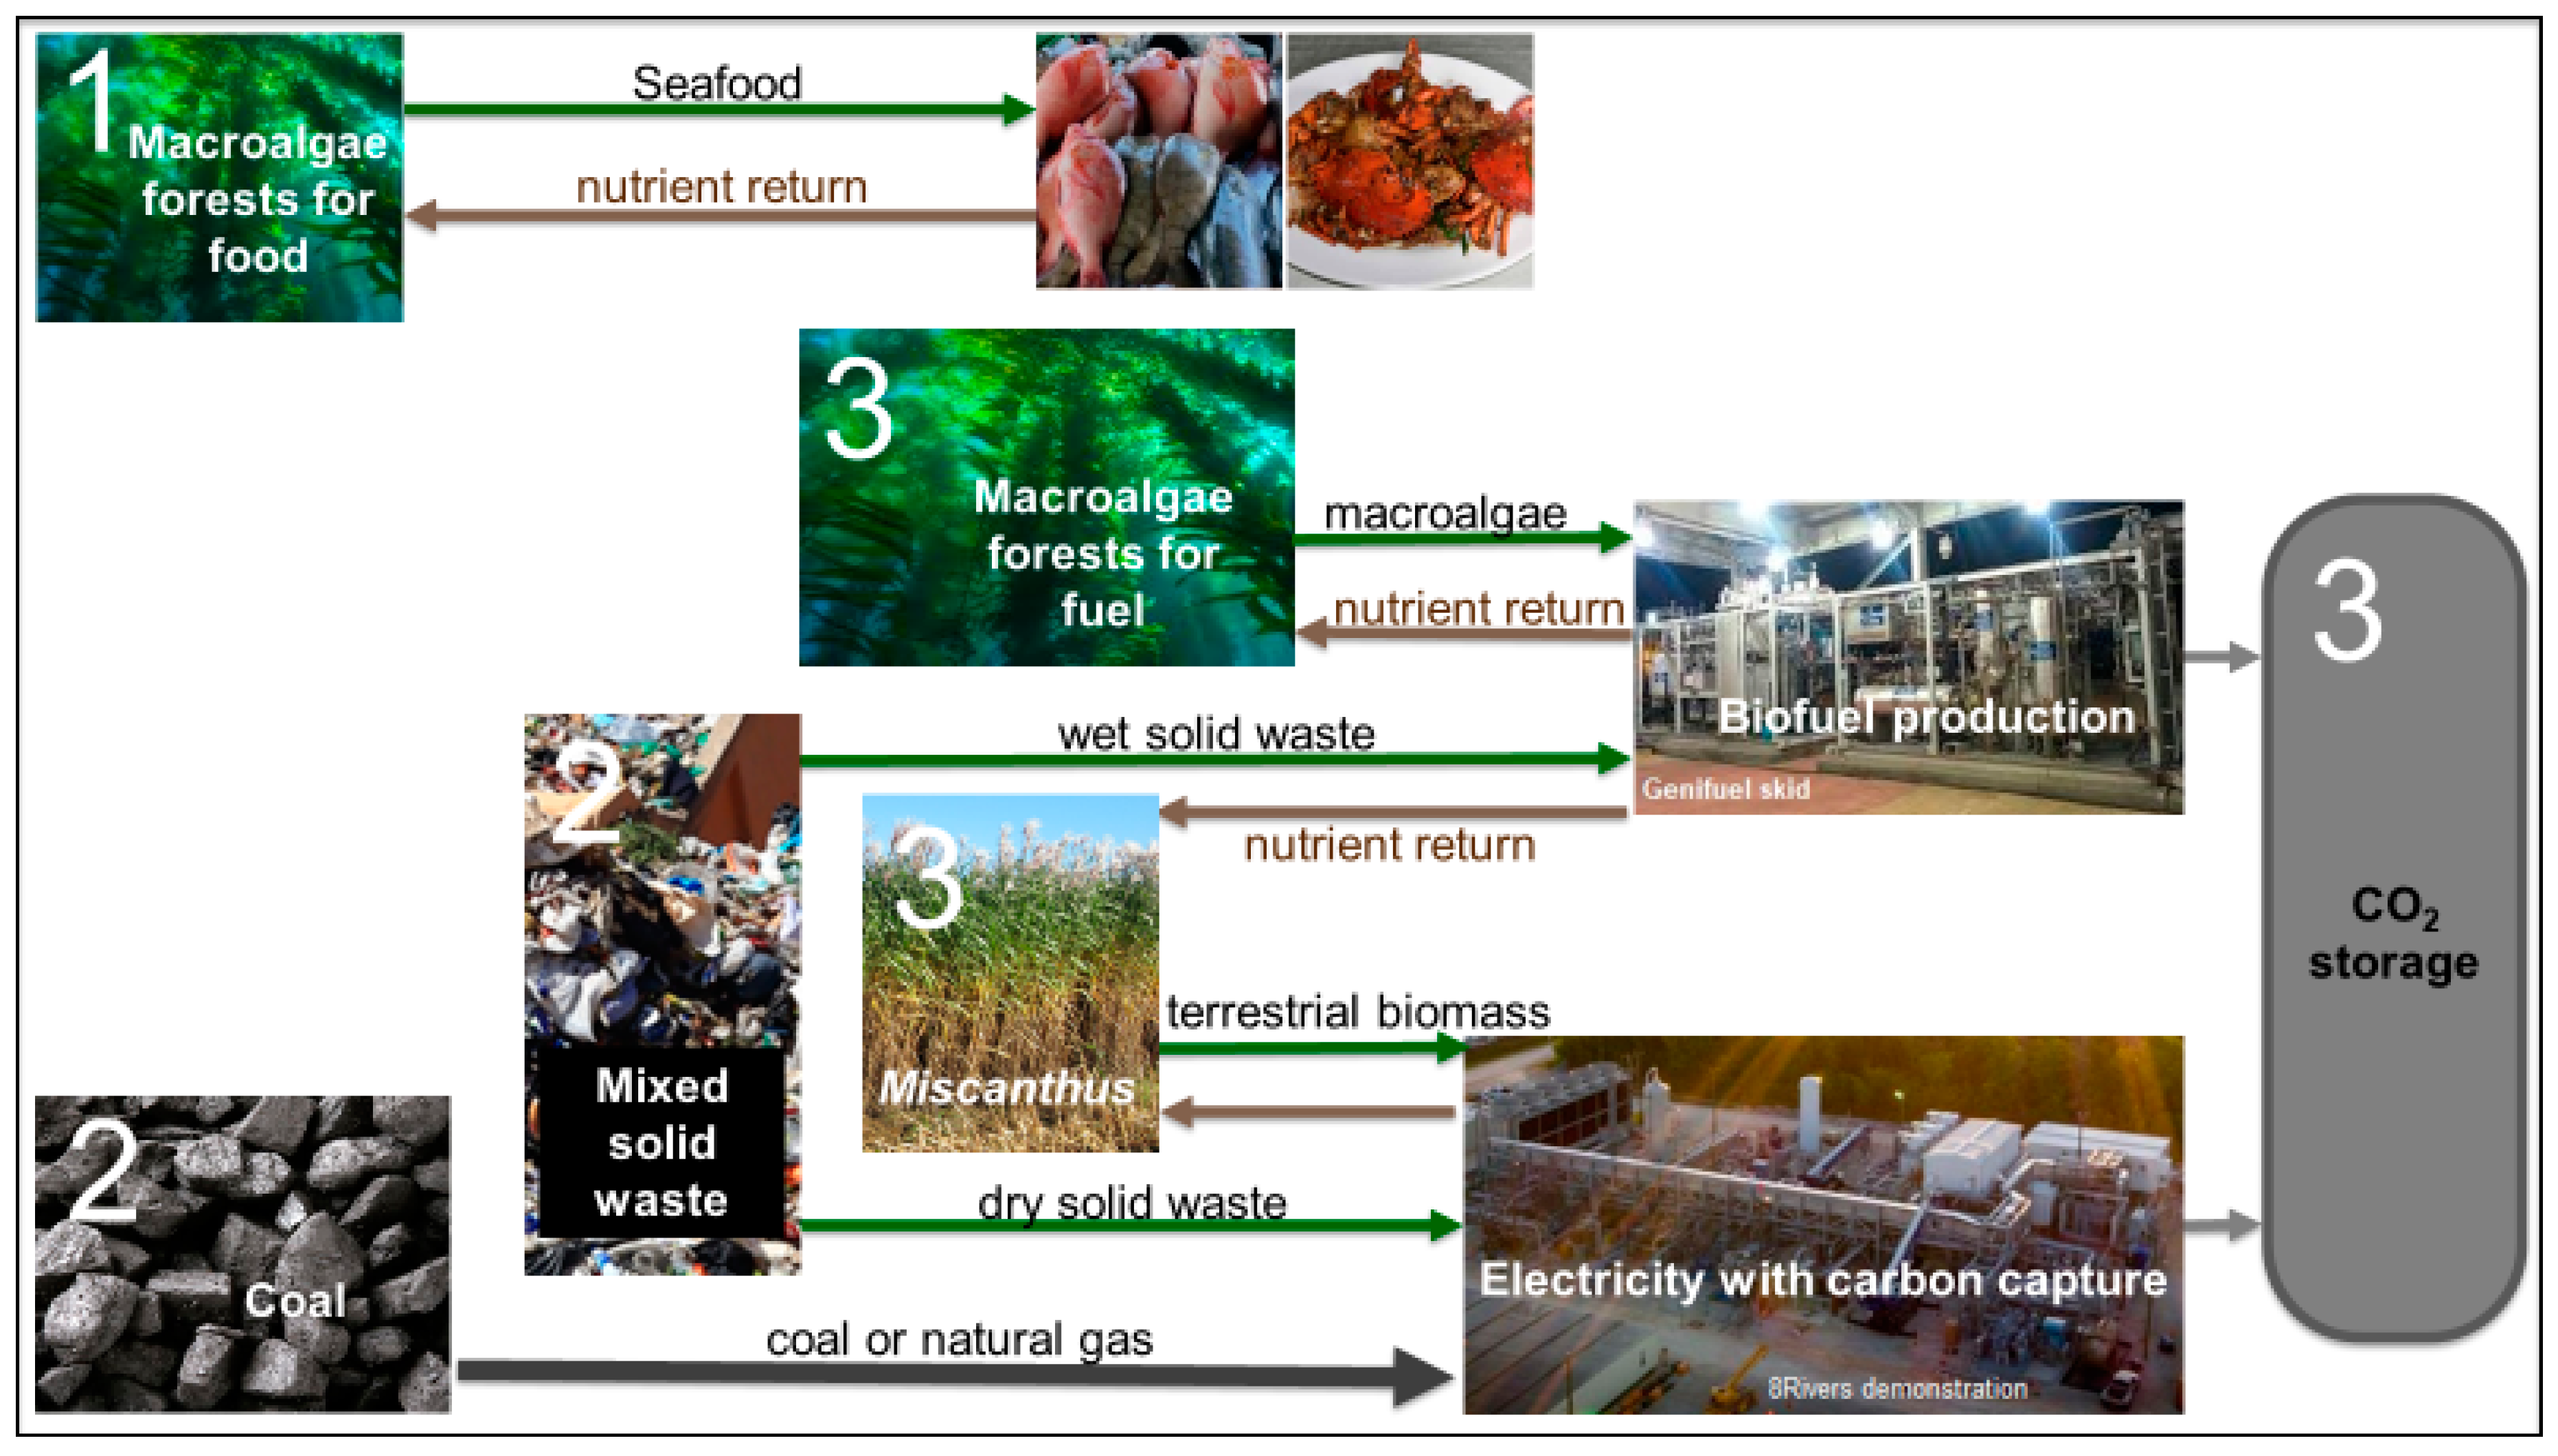
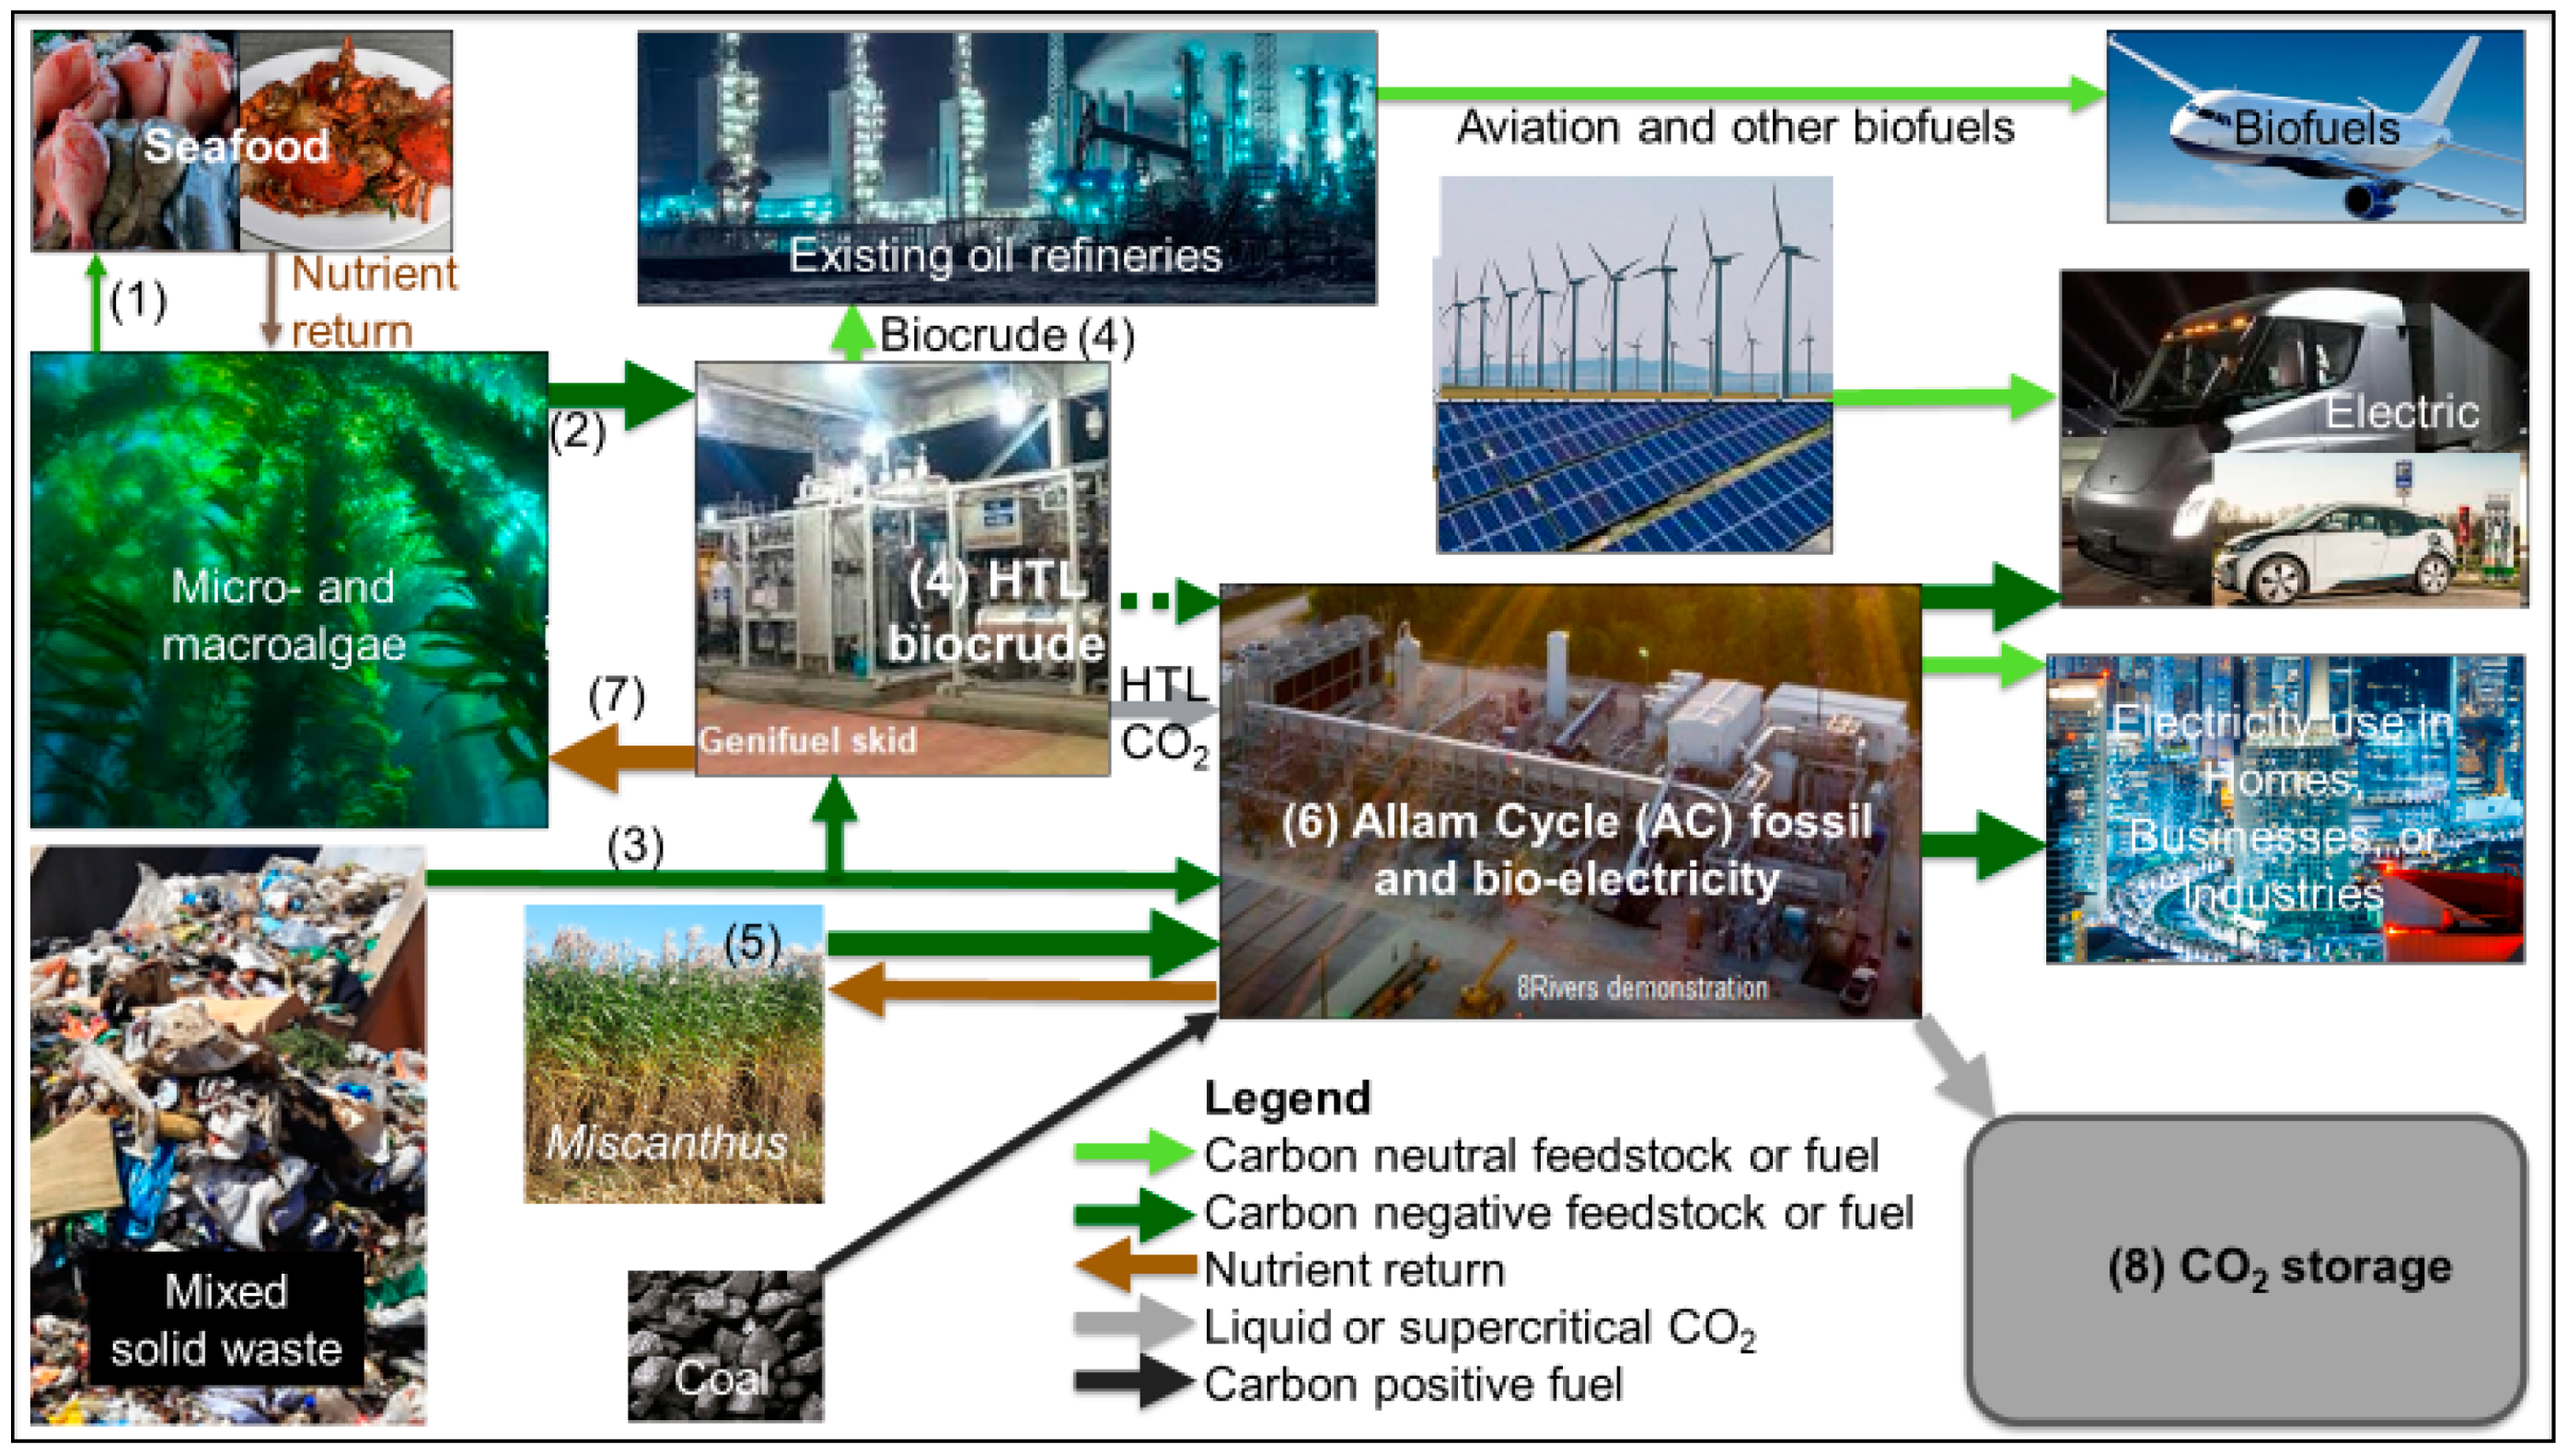
Total ecosystem aquaculture (TEA) was developed by Capron and his colleagues [15,16,17,18,19,20,21,22,23], based on decades of work on integrated multi-trophic aquaculture (IMTA) (see Chambers [24] and Knowler [25] and references therein) during a techno-economic analysis funded by the U.S. Department of Energy (DOE) Advanced Research Projects Agency—Energy (ARPA-E) MacroAlgae Research Inspiring Novel Energy Resources (MARINER) program [26]. TEA systems consist of permanent, flexible reefs floating at ocean depths for optimal growth of cultured macroalgae species. Primary productivity is optimized by returning just as much nutrients as extracted, unless the reef is extracting excessive anthropogenic nutrients. That is, primary productivity is not nutrient limited. Initially TEA produces finfish, shellfish, crustaceans, and other high-protein seafood with some boutique harvesting of macroalgae. Seafood-producing reefs directly address SDGs 1–3, 8, 10, and 14 and indirectly address most of the others. Some seafood reefs can expand tropical fisheries in the face of climate change, substitute for natural reefs so that natural marine areas can be protected and facilitate research and development on growing macroalgae-for-biofuel. Macroalgae-for-biofuel requires an energy conversion process that recycles nutrients to support complete ecosystems similar to seafood-production reefs. Although full TEA is not yet demonstrated, most components and technologies are proven in other forms of aquaculture, including integrated multi-trophic aquaculture (IMTA). In addition, Laurens et al. [27] make the case for greatly expanded biofuels production from macroalgae.
(2)
Hydrothermal liquefaction (HTL) [28,29,30] uses a combination of high temperature (350 °C, 660 °F) and pressure (2 MPa, 3,000 psi) to convert wet biomass and some plastics to a biocrude oil in about 30 min. Because the reaction temperature is <400 °C, all nutrients can be recovered and used to grow more plants. Several companies [31,32,33] have systems operating at 1–10 wet tonnes of biomass/day. Using wet organic wastes mixed with select plastics to make biofuels addresses SDGs 7, 12, 13, and 14. Like many biofuel technologies, HTL deployment has been interrupted by several global oil price drops including the 2008 recession, the 2014 oil glut, and the 2020 SARS-COV-2 pandemic.
(3)
Allam Cycle electricity production [34,35,36,37] combines pure O2, gaseous fuel, and recirculating CO2. The combustion product is a supercritical fluid (viscosity like a gas, density like a liquid) that exits the turbine at 3 MPa (as a gas). The CO2 is compressed to become a sequestration-ready gas or supercritical fluid at 10 MPa with no efficiency penalty. Economic costs or benefits depend primarily on fuel price. The fuel can be natural gas, gasified coal, or gasified dry biomass (including crop residues and other dry wastes). With fossil fuel, electricity production can be carbon-neutral, addressing SDGs 7, 12, and 13. With gasified dry biomass, the electricity produced can be carbon-neutral or carbon-negative. 8 Rivers Capital has operated a 50-MW natural gas Allam Cycle plant for over two years [38]. They plan to be mass-producing 300-MW natural gas units by 2022 [37], and gasified coal units after demonstration of a 300-MW unit expected by 2026 [35].
These three technologies can be sequentially deployed as shown in Figure 1 (see Section 3 for details). Infrastructure built to produce food prior to 2030 is expanded for biomass feedstocks and carbon capture after 2030:
(1)
Install TEA on floating, flexible, fishing reefs with macroalgae forests to produce seafood while returning nutrients for sustainability.
(2)
Install solid-waste collection systems that produce bioenergy (as opposed to deposition in landfills). Simultaneously install electrical power plants that can be upgraded easily to capture and compress CO2 emissions. As soon as possible, switch to capture-and-compression of CO2 from biomass combustion.
(3)
Sequester the captured fossil- and bio-CO2. Increase the amount of biomass (such as macroalgae, Miscanthus, and other sustainable biomass crops) to make carbon-negative liquid fossil fuels (using the HTL process, which in itself captures some CO2). Gradually increase the ratio of biomass-fueled to fossil-fueled electricity.

2. Methods

This project began as an update of N’Yeurt, et al.’s “Negative carbon via ocean afforestation” [39]. N’Yeurt et al., used a mass balance of carbon and nutrient flows combined with a life cycle analysis of concept-level process designs to estimate the amount of energy and CDR that can be produced using macroalgae. The update was based on Lucas, et al.’s initial results [16] from the U.S. DOE’s Advanced Research Projects Agency-Energy (ARPA-E) MARINER program [26]. MARINER funded nine teams [40] to address the economics of growing and harvesting macroalgae for energy conversion, most of which are represented either as co-authors of this paper or providers of summary data. The MARINER teams each generated techno-economic analyses for potential grow-harvest systems across a wide range of tropical and temperate macroalgae species in a variety of fixed and free-floating systems using novel substrates, paths to market, and autonomous operations. The ARPA-E guidelines for the techno-economic analyses included:
(a)
An integrated system design that includes seeding, growing, and harvesting.
(b)
Use of any reasonably foreseeable technology such as autonomous operation.
(c)
A minimum, but not necessarily continuous, 100,000 hectare (ha) seaweed farm.
(d)
A location that will support the concept, including nutrients.
(e)
A reasonable expected economic life of the capital investment.
Early in the MARINER project, the plan was to improve the accuracy of the estimated carbon and nutrient demands and combine these with data on financing and energy costs to forecast the cost per dry tonne. The goal was to determine how much of global oil demand could be replaced with macroalgal biomass.
Gasified, coal-fired, Allam Cycle electricity generation data were made public as part of the U.S. DOE’s coal FIRST (Flexible, Innovative, Resilient, Small, Transformative) program [41]. Details of HTL carbon and nutrient flows combined with details of Allam Cycle processes revealed an opportunity for HTL to produce carbon-negative biofuel. This facilitated creation of a low-bioelectricity, high-biofuel path to global carbon neutrality with substantial sequestration (labeled Pfuel path).
Combining information on available wet (for HTL) and dry (for Allam Cycle gasification) waste and purpose-grown biomass and plastic with data on Allam Cycle power generation allowed a different path of high-bioelectricity, low-biofuel (Pelectric). The estimates calculated over these two paths are presented in Section 3.1, Table 1 and Table 2, and discussed throughout this paper.
In summary, the method combined theoretical studies from the MARINER program with other theoretical and experimental results including those for HTL and gasified, coal-fired, Allam Cycle power generation. The authors reviewed available research and calculations for waste and purpose-grown biomass. The method highlights first-order approximations, based on simplifications including:
(a)
Costs are estimated for production from the nth macroalgae grow-harvest unit (after the learning curve to install automated harvesting and economies of scale).
(b)
Nutrient recycling calculations focus on nitrogen (N) (in protein, ammonium, nitrates, etc.). Phosphorus (P) and other nutrients are assumed to be roughly proportional when recycling waste (such as sewage or crop residues). However, if relying on excess nutrients (mainly N), as from a dead zone, the P may become a limiting factor)
(c)
Macroalgae productivity per area is not nutrient-limited (due to nutrient recycling). Of course, nutrient recycling per area is limited to less than that which would adversely affect local biodiversity and ecosystem balance.
(d)
High-protein seafood (shellfish, finfish, crustaceans, etc.) production per area is estimated from a mass balance of N and information on the insolation-limited primary productivity.
(e)
The technology issues and life-cycle cost for gasified dry biomass-fired Allam Cycle electricity will be like those for gasified coal-fired Allam Cycle electricity.
(f)
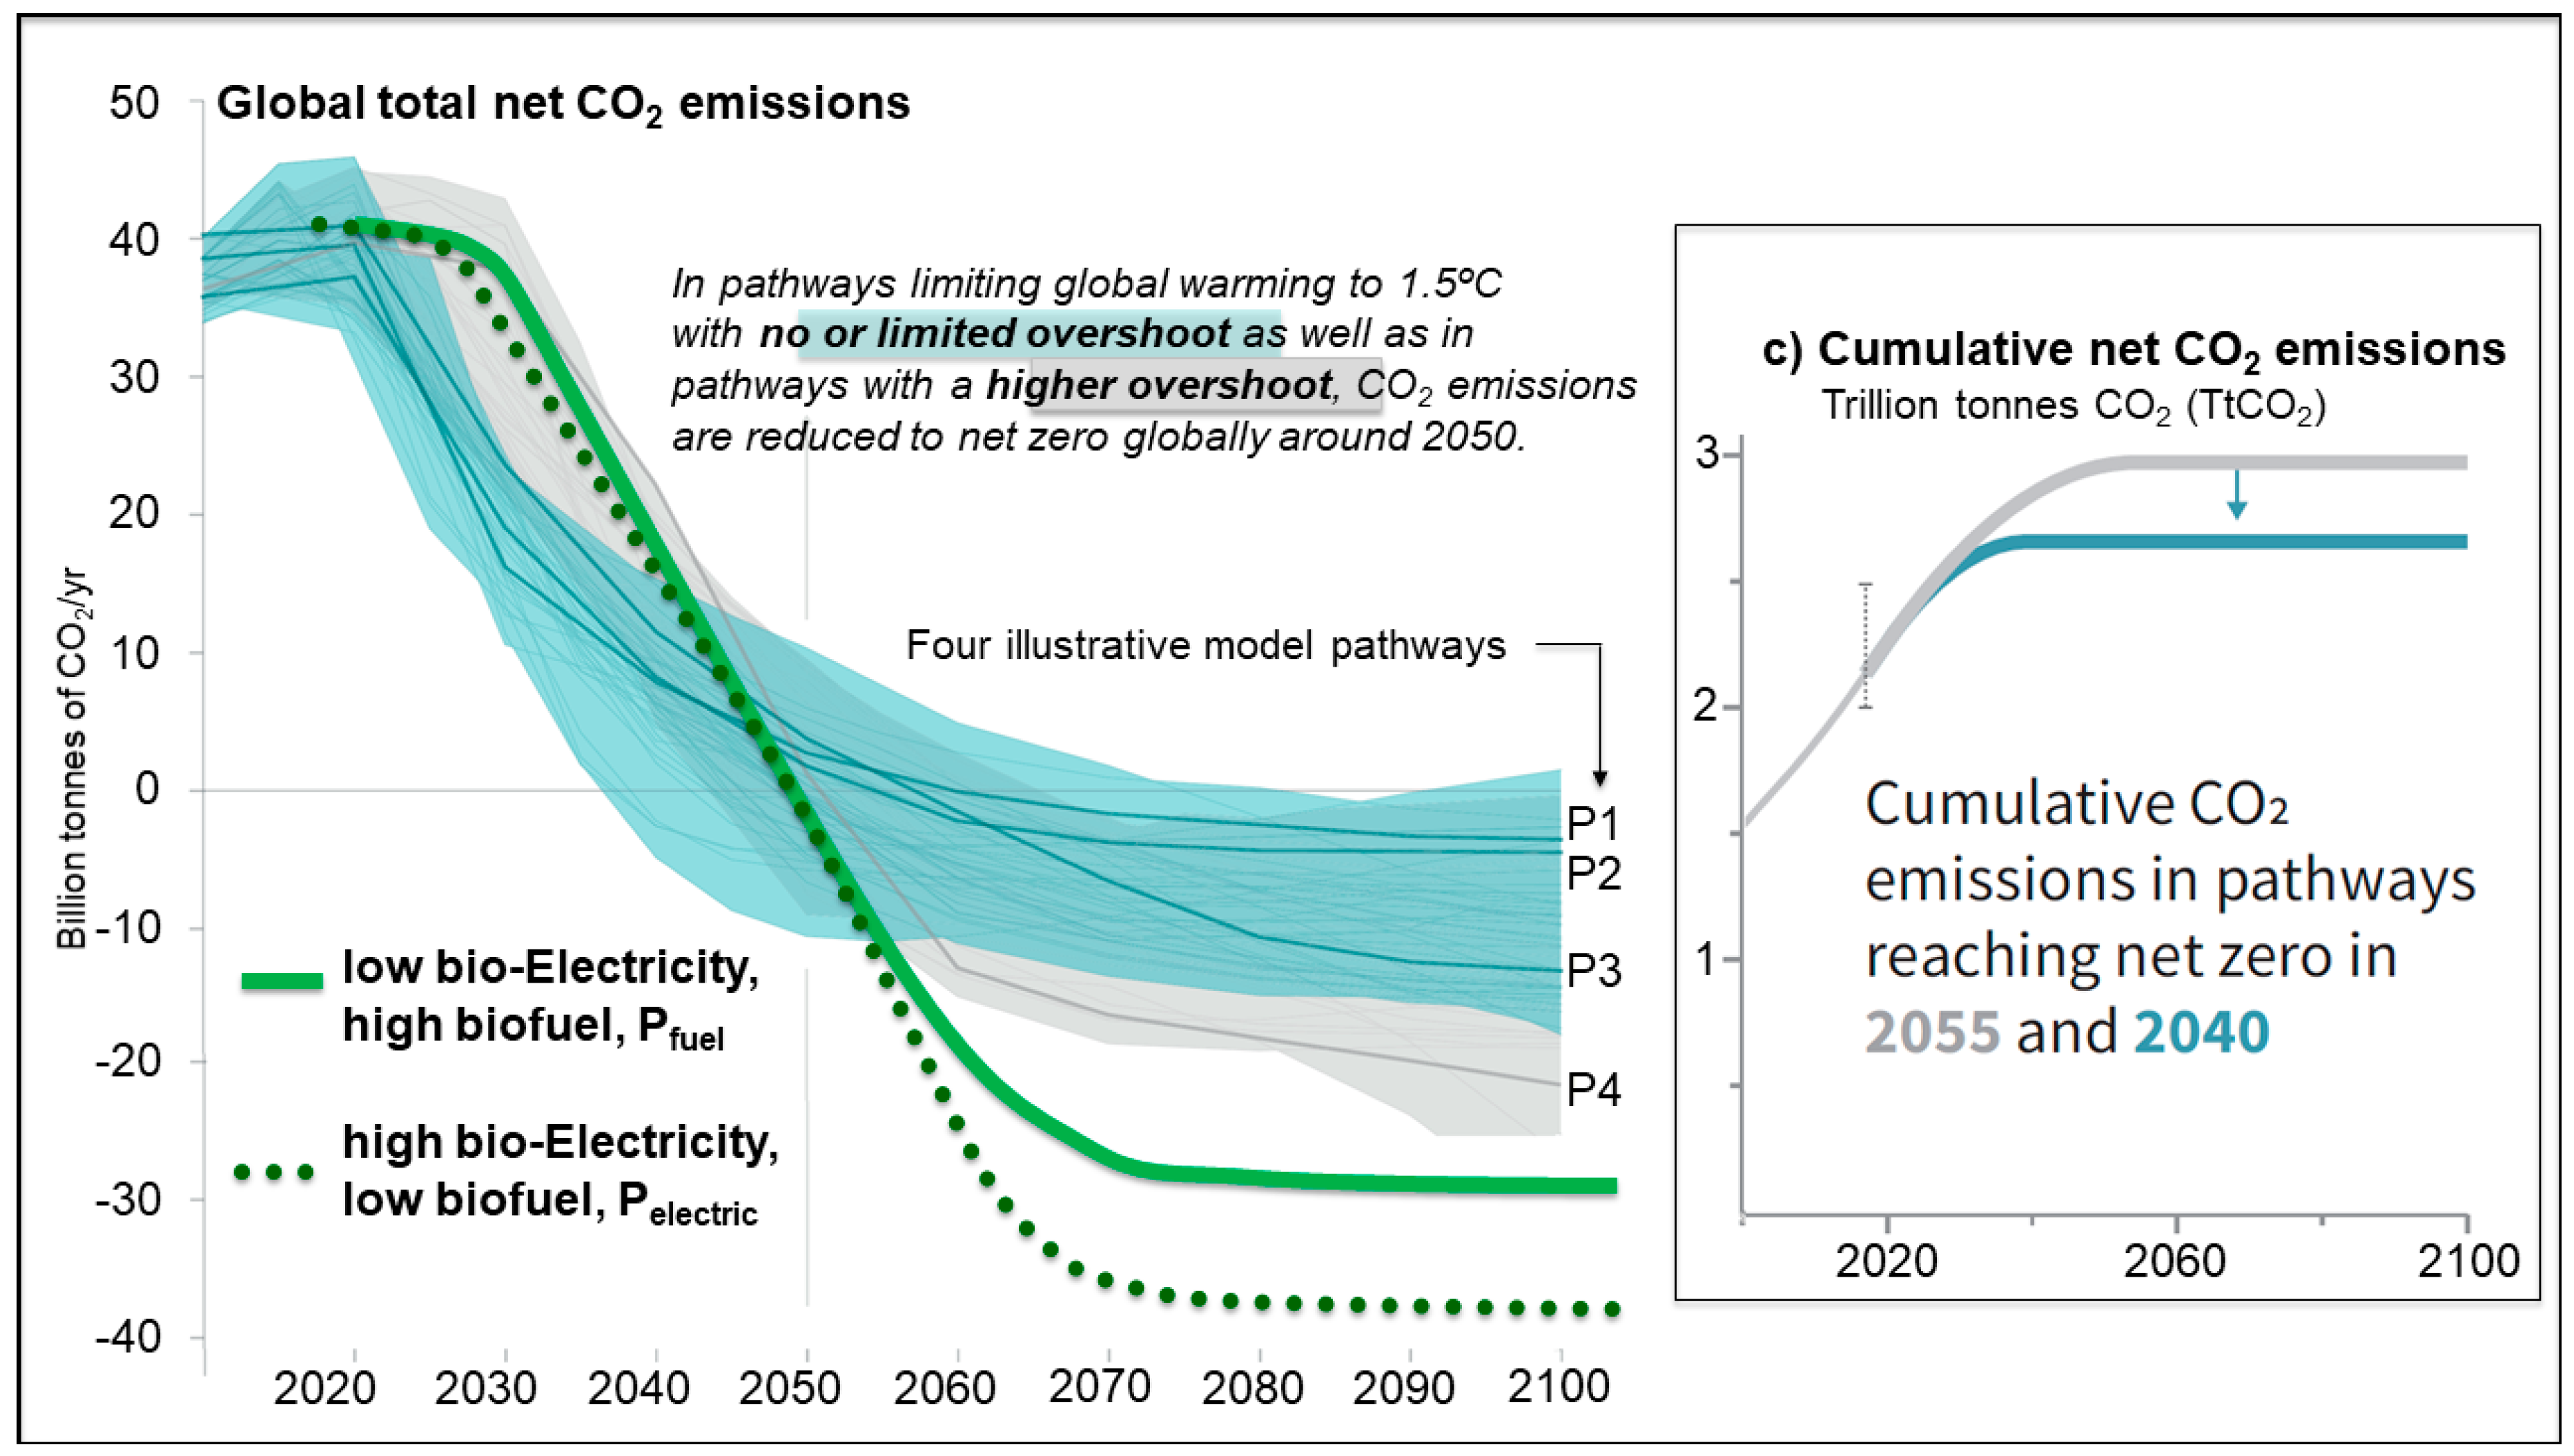
The paths shown in Figure 2 are based on values at three points: (1) 2018 emissions, (2) net zero CO2 emissions (assigned to 2050), and (3) calculated maximum CDR (assigned to 2070).
(g)
Only CO2 emissions and CDR from energy production and use are calculated. Other CO2eq causes of climate change such as methane will need to be addressed separately from energy production (although the elimination of fossil fuel production will considerably reduce methane emissions).
(h)
The amount of CDR is dependent on the energy demand from sequestering sources burning biofuels, such as HTL and Allam Cycle. If these are replaced by wind, solar, etc. CDR will cease.
(i)
The calculations do not include CDR from other sources, such as trees, soils, etc. If these remove significant carbon, that could speed up the timetable in this paper and spreadsheet.
All the above information was collated into the Supplemental Materials Spreadsheet (SMS), an Excel workbook with multiple worksheets (tabs), which show the relevant data produced and collected as well as the calculations that produce the summary numbers in the tables. Instructions in the SMS guide “what-if” calculations. Most of the data used in the spreadsheet come from published sources, which are referenced in the spreadsheet (workbook) and displayed on SMS#25 (which refers to worksheet tab 25). If there was a wide range of published data, that is reported with an indication why a particular average value was chosen. Since percentages of available biomass (such as municipal waste or crop residues) that can be collected at reasonable prices for bioenergy use vary widely by location and other variables, SMS#4 (Rows 12–16 and 75, 78, 105) collection percentages can be varied to account for local situations (red text indicates a number that can be varied).
However, the data for the MARINER macroalgae calculations have not been published. Only the AdjustaDepth techno-economic analysis spreadsheet [42] and report [16] are publicly available. SMS#6 (Rows 6–13) summarizes the calculations from several MARINER projects. One key number is available area for which Gentry et al. [43] report 11 million sq km as appropriate for macroalgae and bivalve aquaculture with seafloor depth less than 200 m). Another is productivity (our supplemental materials spreadsheet uses 50 dry tonnes/ha/yr, based on Lapointe and his colleagues who found values up to 125 dry tonnes/ha/yr for Gracilaria tikvahiae [44,45,46]). Cost per dry tonne harvested is calculated in the Capron et al. [42] spreadsheet based on the materials, energy, and labor needed to construct, deploy, plant, harvest, and maintain a structure modeled to survive a direct hit by a category 5 hurricane.
These three cost and yield numbers were also provided by three other MARINER teams and shown on SMS#6. The four sets of numbers were totaled to a potential of 60 billion dry tonnes/yr (SMS#6, cell D44) at a projected biomass-weighted average cost of $110/dry tonne (cell D45).
The other important unpublished data are HTL cost projections shown in SMS#8, based on private communications from Craig Pichach, CleanCarbon Energy, including a site visit and calculations by Professional Engineer Mark E. Capron [30]. Note these costs are based on an engineering design, not a physical demonstration. However, the fact of commercial HTL plants being built in 2019 by Licella for a plastic feedstock demonstration in the United Kingdom [33] and by Steeper Energy [32] in Denmark and Canada indicate HTL prices are commercially viable and thus potentially in the ranges projected in this paper for CleanCarbon Energy.

3. Results

3.1. Overview of Two Bracketing Paths

Calculating for both a primarily wet biomass-to-biofuel process versus a dry biomass-to-electricity process, allows showing CDR results on two contrasting paths. The two paths, shown in Figure 2 as Pfuel and Pelectric, represent extremes of either mostly biofuel or mostly electricity. Presenting two paths provides options for communities and nations to consider as they develop their individual blend of technology and infrastructure to best fit their unique culture, people, natural resources, and needs. In terms of global impact, one path and/or technology is no better than any other; however, at the community level, some paths and technologies are better than others. At both global and community levels, all paths address global food demand before significant production of biomass for energy.
The Pfuel and Pelectric lines in Figure 2 are hand drawn using values calculated in SMS#1, 2, 10. They present smoothed paths between 2018 emissions, net zero emissions in 2050 (calculated in Table 1), and maximum net CDR starting about 2070 (calculated in Table 2).

3.2. Overview Calculation Results for Net Zero Emissions and Maximum Net CDR

Table 1 and Table 2 show the global energy, biomass, and CDR values calculated in this paper. Table 1 (from SMS#2) outlines possible approaches to achieve net-zero emissions while using some fossil fuel by: (1) capturing and storing all CO2 emitted by fossil-fuel electricity generation to make such electricity production carbon neutral, (2) capturing and storing some CO2 from biofueled electricity production to offset some non-captured fossil fuel use, (3) capturing and storing most of the byproduct CO2 produced when biomass is converted to biofuel to offset other fossil fuel emissions, and (4) carbon-negative biofuels and electricity replacing fossil-fueled transportation. Negative emissions from the captured and stored bio-CO2 offset the use of fossil fuels (mainly natural gas) for heating and industry. After net zero CO2 emissions, increasing biomass-fueled energy production with carbon capture removes CO2 from the atmosphere at the rates indicated in Table 2.
Table 2 (from SMS#2) summarizes calculations for the two alternative global energy demands used to calculate required bio-CO2 sequestration by 2070 and beyond. The Pfuel path proposes a little more liquid biofuel than the 2018 demand for oil with relatively little bioelectricity. The Pelectric path assumes that the demand for bioelectricity is over twice the 2018 demand for electricity with one quarter of the 2018 demand for liquid fuel. Specifically, Pelectric involves mostly electric transportation, commercial, and residential energy use (little natural gas or biofuels).
Table 2 shows estimated plug-in values (in red) and computed numbers (in black). The variable plug-in numbers are illustrative of possibilities interpolated from 2018 global statistics. SMS#1 and 2 include more plug-in numbers, show the formulae, provide references, and offer opportunities for various “what if” calculations. The two paths in Table 1 and Table 2 are designed to contrast: (1) Pfuel, the “low bioelectricity” path where most electricity is produced by conventional renewables and nearly all biofuel production is consumed by transportation; and (2) Pelectric, the high bioelectricity path that maximizes Allam Cycle bioenergy with carbon capture and storage (BECCS) with most transportation electrified. Pfuel requires somewhat more biomass production than Pelectric with a slightly slower return to pre-industrial CO2 levels.
Table 1 and Table 2 quantify the steps illustrated in Figure 3 to demonstrate how net-zero emissions are technically feasible by 2050. Every component of Figure 3 can scale quickly using existing demand and supply chains.
Economics are explained in more detail in the supplementary materials document (SMD) and spreadsheet (SMS). The costs, values, and relative local scale for each process and arrow in Figure 3 can be modified in the SMS for any given time and location. Potential variations and uncertainties include how fast oil prices recover after the COVID-19 pandemic and the effects of millions of barrels per day of inexpensive HTL biocrude made from solid waste. Price unknowns arise in the early learning curve for employing new technologies. Some carbon neutral fossil-fueled electricity with >97% CO2 sequestration could continue. Numbered economic and sustainability considerations labeled in Figure 3 include:
(1)
Increasing seafood production can start now with excess and artificial nutrients (Section 3.3; SMS#18).
(2)
Ocean (aquatic) plants produce wet biomass feedstock for food and energy (Section 3.3; SMS# 4, 6).
(3)
Wet solid waste is the initial feedstock for HTL biofuel. Dry solid waste can be the initial biomass feedstock for Allam Cycle electricity (Section 3.3, Section 3.5 and Section 3.6; SMS#4).
(4)
About 60% of the carbon in biomass or most plastics becomes biocrude oil during HTL. Biocrude can be refined at existing refineries. About 40% of the carbon can be recovered as a mixture of fuel gas and CO2 for Allam Cycle (or other) electricity and heat co-generation or the CO2 can be separated and sequestered (see Section 3.5 and Section 3.6; SMS#11, 12; SMD Section 3.5 and Section 3.6).
(5)
Dry terrestrial biomass can be gasified for Allam Cycle electricity production with carbon capture and sequestration (Section 3.6; SMD Section 3.6).
(6)
The Allam Cycle produces electricity from gasified coal, gasified biomass, or natural gas at 40–60% efficiency while also producing pure CO2 compressed to 100-bar ready for sequestration (Section 3.6; SMD Section 3.6).
(7)
Nutrient recycling is essential for sustained production of seafood and energy (Section 3.4, SMS#18, 19; SMD Section 3.4).
(8)
There are many ways to permanently sequester CO2 (Section 3.7; SMS# 13, 17; SMD Section 3.7).

3.3. Biomass Production Details

Table 1 and Table 2 indicate the necessary scale of total biomass production. A higher proportion of the biomass for the “low bioelectricity, high biofuel” path will be “wet” such as macroalgae, food and green waste. A higher proportion of the biomass for the “high bioelectricity, low biofuel” path will be “dry” such as Miscanthus, paper and plastic.
The first type of biomass that should be considered is waste (also called trash) that is not currently recycled onsite. The main categories of waste are (details in SMS#4):
  • Municipal solid waste (MSW) (which also includes household and business trash in rural areas) [49] (dry weights are calculated using the percentages of water from [50])
  • Industrial wastes [49,51,52]
  • Construction and demolition debris [49,53]
  • Hazardous and medical wastes [49,53]
  • Agricultural and forestry residues [49,54,55,56,57,58].
SMS#4 estimates the above sources total about 1 billion dry tonnes of food and green wet wastes plus 11.5 billion dry tonnes of dry organic wastes for a global total of 12 (±4) billion dry tonnes per year. These global numbers provide hope for large quantities of inexpensive carbon neutral fuels that do not impact land use. When these fuels supply carbon capturing facilities, such as HTL and Allam Cycle plants, the processes could accomplish large amounts of CDR.
The second source is sustainable purpose-grown biomass, which has a wide range from 0.5 billion dry tonnes/yr [59] to 20 billion [50,60,61] or even 75 billion dry tonnes/yr [62]. SMS#4 shows the calculations (using yields per acre from [50,63]) based on 6 billion dry tonnes/yr. Note these calculations do not include purpose-grown wood, which could add another billion tonnes (using [50] extrapolated to the globe).
A third major source is ocean wet biomass that starts with seafood grown in total ecosystem aquaculture (TEA) or other systems [25,64,65,66,67,68,69], which provide food and oxygen for traditional seafoods (i.e., finfish, crabs, oysters, and the like). Gentry et al. [43], Froehlich et al. [70], and Theuerkauf et al. [71] provide global overviews of potential locations. The SMD explains that TEA adaptation research is needed to ensure seafood and biomass productivity with biodiversity in warming tropical waters. For example, some species have reproductive issues [72], others are migrating toward Earth’s poles to escape marine heat waves [73].
While harvesting seafood, macroalgal biomass-for-energy production would be demonstrated and improved. Fish and shellfish production should cost less than $2/kg on average. Domestic sales might be $1–2/kg while exports earn $4/kg or more at the dock. When demand for biomass-for-biofuel rises, aquaculture ecosystems can be managed to simultaneously produce both a 0.5 billion wet tonnes of seafood (worth about $1 trillion/yr) and 3 billion wet tonnes (0.3 billion dry tonnes) of macroalgae for energy. At $100/dry tonne [16], this start-up macroalgae-for-energy would be worth $30 billion/yr.
The Pfuel path presumes increasing ocean net primary productivity by 40% or about 40 billion dry tonnes/yr. The Pelectric path projects increasing terrestrial net primary productivity by 15% or about 17 billion dry tonnes/yr. Currently, the world’s net primary productivity is near 210 billion tonnes/yr of biomass [74]. Total land productivity is about 110 billion tonnes on an area of 150 million km2. Ocean productivity is about 96 billion tonnes on 360 million km2. This suggests that oceans are under-producing relative to land, which could be remedied by ensuring nutrient recycling and building structures supporting macroalgae or seagrass production in the photic zone. See SMD Section 3.3 F for a discussion of how macroalgae-for-fuel expansion into “nutrient deserts” can increase ocean biodiversity more than traditional marine protected areas.
Primary conclusions from Table 3 include:
  • Globally, there is excess potential additional biomass, 60–100 billion dry tonnes/yr, much more than the 30–40 billion dry tonnes/yr needed in these projections. Thus, there is no need to use wood from forests, which is often regarded as unsustainable [75]. More discussion in SMD.
  • There is more than enough organic solid waste (including mixed biosolids, paper, plastic, food waste, etc.) [49] for 20 million barrels/day (by 2050) of sweet biocrude oil (see SMS#4, 7, 11, 12).
  • Every kind of biomass or waste (wet or dry) can contribute, which means most countries can participate in some form of biomass production.
  • While there are obvious differences in maximum scale and cost, most biomass sources can be turned into a viable industry.
  • These numbers are speculative in that macroalgae projections are based on theoretical studies, not physical demonstration projects.
The bottom line is that there is potentially more sustainable biomass, at acceptable costs, than is needed for either path. The Pelectric path uses 17 billion dry tonnes of dry biomass for Allam Cycle and 13 billion dry tonnes of wet biomass (food/green waste + macroalgae) for HTL. The Pfuel path uses 4 billion dry tonnes of dry biomass and 39 billion dry tonnes of wet biomass (see SMS#2, 3, 4).
The availability of large quantities of ocean biomass relieves pressure on terrestrial sources of biomass, which are increasingly limited by demands for food as well as climate impacts. TEA could grow 1 billion tonnes/yr of seafood on less than 10% of the suitable continental shelf less than 200 m seafloor depth (identified by Gentry et al. [43]). That would be about 0.3% of the world’s oceans (see SMS#6, 18). TEA could grow 39 billion dry tonnes of oceanic biomass-for-energy on 7% of the world’s oceans, including some deep ocean areas (SMD 3.3 and SMS#6). The remaining 93% of ocean area would not be needed for food or bioenergy production.

3.4. Nutrient Recycling Details

The 17 billion dry tonnes/yr of terrestrial biomass for the Pelectric path (Table 1) requires about 50 million tonnes/yr of nitrogen (see SMS#12) and proportional amounts of phosphorus, potassium, iron, boron, copper, manganese, molybdenum, zinc, nickel, and other micronutrients. Gasification (start of the Allam Cycle process for coal and dry biomass) followed by combustion might or might not recover the nitrogen in both fuels for use as fertilizer. If nitrogen is not recovered, lost nitrogen might be made up with advances in nitrogen-fixing crops or increased artificial nitrogen production. Other nutrients can be recovered from the solid residues of both HTL and Allam Cycle.
The 39 billion dry tonnes/yr of oceanic biomass for the Pfuel path, requires cycling 1.2 billion tonnes/yr of nitrogen (SMS#12, 18) from the ecosystem-to-energy process and back. Proportional amounts of phosphorus, potassium, iron, boron, copper, manganese, molybdenum, zinc, nickel, and other micronutrients cycle along with the nitrogen. HTL recovers virtually all N as ammonia in the “leftover” water. Other nutrients are recovered in the solid residues. Because recycled nutrients (such as sewage biosolids) contain a complete array of micronutrients, they are also more beneficial to biomass growth than commercial fertilizer [105,106].
Other reasons for recycling nutrients (see discussion in SMD3.4 plus computations and references in SMS#18) include:
  • Terrestrial and oceanic biomass increase food and reduce waste by moving to a circular economy, as explained in “The End of Trash” [107].
  • Buying ammonia would add $24/tonne to the cost of oceanic biomass, (i.e., add US$22/barrel to the cost of biocrude oil produced by HTL) based on values used by Jiang et al. [28]. There are additional costs for other nutrients, such as phosphates.
  • If nutrients after energy production were not recycled, waste-treatment costs using conventional “wastewater” biologic nutrient removal processes would increase the cost of bio-oil by $60/barrel.
  • Reduce emissions from global artificial nitrogen production, which was 176 million tonnes of N, which emitted 505 million tonnes of CO2, ~1% of global CO2 emissions [108]. Between 75% and 90% of manufactured ammonia is used for agriculture [109].
  • Removing 1.2 billion tonnes of inorganic nitrogen (and other nutrients) from a few million km3 of deep ocean water each year [110] is not sustainable (see SMS#19). Temporarily upwelling a smaller amount of deep ocean water to start and expand primary production until recycled nutrients are available may be acceptable.
  • Upwelling deep ocean water for nutrient supply brings up CO2, drops surface water pH (ocean acidification), and might increase the amount of CO2 in the air [111,112,113,114].
  • Several processes (in addition to HTL, such as anaerobic digestion [27,115]) convert macroalgae to energy with good efficiency while separating most of the carbon from the nutrients. These separated nutrients can be returned to the macroalgae ecosystem during harvesting without significant cost [16,42].

3.5. HTL Details

Recent innovations and cost reductions with HTL ([28,29,30,31,32,33,116,117]) make it practical to scale up as a solid waste-collection system that pays for itself. HTL converts to bio-oil any blend of wet plants, paper, wax, and most plastics (except thermosets, about 14% of total plastics [118]). This could include expired juice in plastic bottles, newspaper, expired packages of meat, seaweed, microalgae, switch grass, feces, biohazard wastes in plastic—all chopped and blended together. The process is analogous to the way algae became oil when buried deep in the Earth. By using a combination of high temperature (350 °C, 660 °F) and pressure (200 atmospheres, 3000 psi) the conversion to oil is complete in about 30 min. Because the reaction temperature is less than 400 °C, all plant nutrients can be recovered and used to grow more plants (see SMD 3.5).
There are many processes that convert wet biomass or wet organic waste to energy. There are many processes that convert most plastics (a dry material) to the raw material for new plastics or energy. HTL is the only process that converts both as a blended feedstock into energy. Eventually, all the plastic will be made from plants or biocrude and become biocrude or new plastics in a circular economy.
Because it produces biocrude, oil companies view an HTL facility as if it were a large oil well. All the existing oil handling and consumption infrastructure mean the transition from fossil fuel to biofuel is as fast as the waste collection, macroalgae production, and HTL facilities can scale. Even so, many factors, which vary with location, will determine which of the variety of processes is best for that location.
In the CleanCarbon Energy (CCE) HTL process about 60% of the carbon in the biomass becomes biocrude. The other 40% becomes byproduct carbon in the forms of biochar, CH4, and CO, all of which can be converted to energy, plus CO2, which can be captured for sequestration. SMS#11 quantifies the amounts of sweet biocrude and the byproduct carbon. More details in SMD 3.5.
HTL technology is nearly commercial now based on substantial research and development in many countries. Recent examples include work at the U.S. Pacific Northwest National Laboratories with U.S. DOE funding [28]. Aarhus University (Denmark) has investigated using HTL to recover phosphorus and carbon from manure and sewage sludge with Horizon 2020 funding [119]. Several companies are preparing ever larger demonstrations of HTL devices including Genifuel in the USA [31], Licella (based in Australia) with a plastic feedstock demonstration in the United Kingdom [33], Steeper Energy in Denmark and Canada [32] and CleanCarbon Energy in Canada [30].
Developed countries could accelerate deploying commercial HTL with commercial scale demonstrations (100 to 4000 wet tonnes/day). Demonstrations are needed because HTL processes have been developed so far for less-than-commercial scale with single consistent feedstocks. Solid waste will be a mixed and inconsistent feedstock requiring more sensors to predict its properties and controls to produce a consistent refinery-ready biocrude product. Communities in developed countries could pay for demonstrations using the disposal fees they collect to safely recycle and dispose of solid waste. After demonstrations clarify costs, HTL could be deployed in both developed and developing countries to replace landfills. Each community would determine their optimum balance between the amount of collected (and uncollected) waste, their disposal fees, and their resulting income from the sale of biocrude oil, electricity, and other products. See discussion in Table 3, Note 3, with details and graph in SMD 3.5.

3.6. Allam Cycle Details

The Allam Cycle process (aka Allam-Fetvedt Cycle) [34,35,36,37] first makes pure oxygen separated from air. The left-over nitrogen and argon from air separation can be sold. Inside the Allam Cycle combustion chamber, pure O2, the fuel (gasified coal, gasified biomass, gasified plastic, or natural gas), and CO2 (for cooling the combustion chamber) mix. After spinning the turbine, all the CO2 is compressed and cooled. Most is recirculated. A little, 3 to 5%, depending on the type of fuel, is available as liquid or supercritical sequestration-ready CO2. Its pressure, 100 to 150-bar (10 to 15 MPa, 1450 to 2175 psi), will push it through a pipeline for direct injection into underground or underwater sequestration.
Allam Cycle power plants can produce electricity and byproduct liquid CO2 using any biofuel or fossil fuel. Initially, we propose they run on fossil fuels (natural gas or gasified coal) but be converted to biofuels as rapidly as biofuels become available. Because the fossil-fuel supply chain and much of the electrical distribution system is already in place, fossil-fueled Allam Cycle carbon-neutral power plants can replace all expansions and replacements for fossil-fuel electricity production in less than two decades.
There are more designs for electricity with carbon capture and storage than just Allam Cycle. Several, including Allam Cycle, have detailed technical and cost analyses presented at the website for the U.S. DOE’s Coal FIRST (Flexible, Innovative, Resilient, Small, Transformative) program [120,121]. Allam Cycle is used throughout this paper because its projected cost of electricity from gasified coal, with sequestration-ready CO2 at 100-bar pressure is only $74/MWh, using typical US coal costs. The other six Coal FIRST program projects captured a lower fraction of produced CO2 at close to one atmospheric pressure. Adding $12/MWh for compression of CO2 from 1 to 100 bar (SMS#14), their projected costs ranged from $118 to $243/MWh. (Fuel costs and byproduct sales differ, which complicates this comparison.)
James et al. [122] prepared a standard baseline report for several power plant processes with CCS. The process with the least avoided cost, supercritical pulverized coal (SC-PC), showed a levelized cost of electricity is $64/MWh without CCS or $109/MWh with 90% carbon capture (these are James’ figures without transport and sequestration costs with an added $3/MWh to compress from James’ 15 bar to Allam Cycles’ 100 bar). Irlam [123] reports values similar to those of James. See Section 3.6 for a discussion of costs in terms of $/tonne of CO2 sequestered.
8 Rivers Capital [35] explains that early adopters can sell gas products argon (Ar), nitrogen (N2), and CO2 and use the income to decrease the price of electricity to $55/MWh ($54 less than SC-PC coal with CCS).
Using the existing global coal supply chain combined with a design that facilitates mass production may mean that Allam Cycle electricity with CO2 sequestration is the fastest way to net zero emissions. In addition to lower costs from mass production, this action will increase budget certainty for developing countries as they switch to Allam Cycle power. Fast start-up is encouraged while the oil industry is still buying CO2 for enhanced oil recovery (EOR). Income from selling CO2 for enhanced oil recovery (EOR) will decrease the cost of electricity. 8 Rivers Capital estimated in early 2020 that the global demand for CO2 used for EOR is equivalent to nearly 6000 of the 300 MW Allam Cycle power plants or 1800 GW [124]. Note that Melzer found that over 90% of EOR CO2 stays in the ground [125].
NET Power (a subsidiary of 8 Rivers) targets commercial deployment of 300-MW natural gas Allam Cycle power plants in 2022 [37]. 8 Rivers has proposed a demonstration of a 300-MW Allam cycle with coal gasification at a Wyoming coal mine including selling all the argon and CO2. The commercial operation date would be 2026 [124]. Allam Cycle power plants are almost zero emissions and have operating flexibility that reduces the need for battery backup of solar and wind energy [124]. They also provide “firm” 24/7 power which has been calculated by Sepulveda et al. [126] to reduce overall electricity costs in decarbonized scenarios. See discussion in SMD 3.6.

3.7. CO2 Sequestration Details

There are many options for liquid CO2 sequestration start-up using the current 13 billion tonnes/yr of fossil-fueled CO2 emissions from electricity generation. There are many more carbon and CO2 storage techniques appropriate for situations other than low-cost liquid CO2 not discussed in this paper. The options shown in Table 4 can retain acceptable costs while scaling for the safe sequestration of trillions of tonnes of liquid CO2 produced by the HTL and Allam Cycle power plants. They include geologic CO2 sequestration in depleted oil and gas wells and brine aquifers [59,127,128] and mineralization in olivine, basalt, and other rocks on land [8,129,130,131,132,133] and in the sub-seafloor [134]. Other authors have analyzed secure contained seafloor storage either as liquid [135] or as CO2-hydrate [136,137,138].
SMD 3.7 includes more discussion of the concepts and results in Table 4, including how the different approaches to CO2 storage complement each other.

3.8. Costs of CDR

Legacy CO2 is commonly thought of as CO2 from emissions already in the atmosphere and ocean [141,142]. This paper’s calculation includes future fossil-fuel CO2 uncaptured emissions in the total legacy CO2 to be removed from the air and oceans. The total cost is a cost to society in the form of higher energy costs. The cost calculation below is an apples-to-apples comparison with:
  • $150/tonne for direct air capture (in 2019 USD) [143];
  • $74/tonne ($52/MWh) [122] breakeven emissions penalty (aka “avoided”) cost when adding CCS to a SC-PC coal power plant, the lowest cost option in James’ Exhibit ES-4 [122]. Costs may be slightly higher when biomass replaces coal (BECCS).

3.8.1. Capture

The first added cost and energy component of removing and storing legacy CO2 is for capture. That is concentrating the CO2 about 2500 times from a little over 0.04% in air to >95%. Allam Cycle power plants always capture the combustion CO2 when they produce electricity, so their added cost for capture is zero. HTL plants concentrate CO2 but the separation is costly, unless they feed their output gas as fuel into an Allam Cycle as discussed in Section 3.8.2.

3.8.2. Compression

The second added cost and energy component is for compressing the pure CO2 to a liquid or supercritical state for permanent sequestration, which varies for the following different situations:
  • CO2 capture from Allam cycle—Each 300 MW coal- or biomass-fired power plant compresses 4600 tonnes/h of CO2 from 30 to 150 bar. Most of the CO2 is recirculated working fluid. About 230 tonnes/h is produced from coal for sale or sequestration. The energy required to compress CO2 from a gas at 30 bar to a supercritical fluid at 100 to 150 bar is small, about 9 kWh/tonne [124]. The combined compression energy plus other operating and capital costs are near $1/tonne of CO2 for coal or $2/tonne for natural gas. This is based on data from Fernandes et al. [36], Atlas Copco CO2 compressors [144], Allam et al. [34], and 8 Rivers Capital [124] presented in SMS#14.
  • CO2 capture from HTL—HTL produces bio-crude plus fuel gas that could be combusted with air such that it produces gas with a high fraction of CO2 (10 to 20%) at 1 bar. Capturing >95% of the CO2 costs about $40/tonne of CO2. Compressing CO2 from 1 to 100 bar requires about 130 kWh/tonne of CO2. The combined capture, energy plus other operating, and capital costs are near $65/tonne of CO2. Most of the cost is for capture and compressing energy, which varies significantly by location, by technology, and over time, as indicated in Table 5.
  • Hybrid of HTL co-located with Allam Cycle—HTL’s byproduct fuel gas and CO2 at 1 bar could be blended and provided as fuel (low-grade fuel gas) to the Allam Cycle. Its value as fuel should cover the cost of compressing it to the required fuel pressure. This situation’s capture and compression cost should be similar to the $1 or $2/tonne of CO2 for the Allam Cycle situation (SMS#14).

3.8.3. Transportation

The third added cost component (relatively little energy needed because the CO2 is a supercritical fluid with very little friction) is the capital cost for transportation, which has been projected by National Academies of Sciences, Engineering, Medicine [8] as $2/tonne for a 100 km pipeline.

3.8.4. Storage

The fourth added cost is sequestration of the pure, compressed CO2. Table 5 values (from SMS#13, 14) are based on transportation and storage costs of $10/tonne of CO2 (we note that James et al. [122] and Rubin [145] used $9/MWh in SC-PC avoided cost calculations ($12 per tonne of CO2) for transportation and storage). This paper uses $8/tonne of CO2 as an average cost of sequestering liquid or supercritical CO2 because Turner et al. [59], Deng et al. [127], and others project costs for many saline aquifers as $1–$8/tonne. In addition, Table 5 shows negative costs (a credit) for those able to sell CO2 for EOR (see more discussion in SMD 3.6, 3.8C).

3.8.5. Input Fuel Cost

A fifth cost component is the varying cost of fuels plus economics of the new and old technologies for converting fuel into liquid fuel and/or electricity and process heat. For example, if the new fuel source is less expensive (such as solid waste) than the old fuel (such as liquified natural gas), capturing and sequestering CO2 might have negative additional cost (Table 5, first two rows). Similarly, if the new fuel source costs $11/GJ (such as HTL biocrude from macroalgae) instead of $2.5/GJ (U.S. coal), the total additional cost might be $180/tonne of CO2 (Table 5, bottom row).

3.8.6. Process Cost

A sixth cost component is because different processes result in different levelized electricity cost ($/MWh) even with the same fuel cost ($/MMBTU). The process cost also may be expressed in $/tonne of CO2 captured and compressed. The mainstream processes competing with Allam Cycle for fossil fuel or biomass electricity are supercritical pulverized coal (SC-PC) and combined cycle gas turbine (CCGT using natural gas). The Allam Cycle process cost with CCS appears to be $15/tonne of CO2 higher than for SC-PC without CCS [124], explained in SMD3.6, used in Table 5.

3.8.7. Total Cost

Each row in Table 5 presents the sum for various situation of the six cost components to society of producing electricity, capturing CO2, compressing it to liquid, transporting it, and permanently sequestering it, while showing the outcomes using the Allam Cycle process and varying fuel cost.
The transportation and sequestration cost of $10/tonne of CO2 is included in all rows. Rows 1 and 2 are negative because the cost is offset by income from waste disposal fees and sales of gases. A local analysis is required to show the local cost differences for each technology with the local cost of fuel. The assumptions and variables in Table 5 include (see calculations and explanations in SMS#14):
  • Waste can be converted to inexpensive energy with CO2 capture and sequestration because disposal fees decrease the cost of fuel.
  • Terrestrial (dry) biomass (agricultural residues and purpose-grown biomass) costs roughly the same as coal, which might be $1.9/GJ in some countries (such as US) and $4.7/GJ in other countries (such as Japan which is dependent on imported coal at about $100/tonne).
  • The hybrid of HTL co-located with Allam Cycle has about the same added cost for sequestering CO2 as does Allam Cycle alone, which greatly reduces the sequestration cost for the byproduct fuel gas and CO2 generated during HTL.
  • HTL biocrude and biogas made from purpose-grown biomass are likely to cost much more than coal or natural gas as shown in the bottom two rows of Table 5. Therefore, we assume essentially no HTL biocrude-from-macroalgae will be fed into Allam Cycle plants for electricity production; it will be used for transportation fuels.
SMS#16 includes a traditional calculation of “avoided” or “breakeven emissions penalty” costs. With SC-PCref and Allam CycleCCS the avoided cost is $22/tonne of CO2. This compares well with the slightly more conservative $26/tonne of CO2 shown in Table 5.
Table 2 shows globally about 28 billion tonnes/yr of fossil- and bio-CO2 being sequestered globally on either path at net zero emissions. With mostly co-located HTL and Allam Cycle facilities, the global cost is 28 billion tonnes/yr times $26/tonne, which rounds to $730 billion/yr.
A range of 28 to 38 billion tonnes/yr of bio-CO2 is being sequestered in Table 2 on either path for reducing atmospheric CO2 concentrations (carbon dioxide removal (CDR)). Suppose an additional 20 billion tonnes/yr of fossil-CO2 is generated and sequestered. The average net mass sequestered between the two paths is 53 billion tonnes times $26/tonne (from Table 5), which rounds to $1400 billion/yr with mostly co-located HTL and Allam Cycle facilities.
If HTL is not co-located with Allam Cycle facilities, both paths would use $75/tonne for HTL byproduct CO2 capture, compression, and sequestration. The HTL-focused Pfuel path would cost about $2300 billion/yr. The Allam Cycle-focused Pelectric path would total about $1900 billion/yr (SMS#14).
US$1400 billion/yr ($26/t) is $175/person/year for 8 billion people, $700/yr for a family of four (much better than CDR at $150/tonne, which would cost a family of four nearly $4000/yr). On the other hand, $1400 billion is only 1.6% of the total global 2019 gross domestic product of $87 trillion (StatisticsTimes, 2019). It is also a third the current cost of production of fossil fuels [146,147] and only 3% of the projected global cost of inaction on the climate crisis [148]. SMD3.8 provides more discussion about the following:
  • Process cost explained
  • Putting the cost of sequestering CO2 in perspective
  • Lower costs for early adopters
  • Allocating costs for removing legacy CO2
  • Examples of fossil-CO2 fees and sequestration payments
  • Comparison of carbon fee and regulation options.

3.9. SDGs Details

The needed multiple interrelated systems can start by achieving UN SDGs and expand in scale to reduce CO2 levels. These systems are interrelated in that the most circular economy (cradle-to-cradle manufacturing) and the best economics occur when the systems are co-located. Systems can include the following nine items.

3.9.1. Food Systems with Lower CO2eq Emissions (SDGs 1, 2, 3, 13, 14, and 15)

Total ecosystem aquaculture systems are built-reef ecosystems with nutrient recycling that can provide abundant, inexpensive multi-species seafood. Distributed globally, seafood reefs based on total ecosystem agriculture (described in the Introduction) can sustainably and economically produce a billion tonnes/yr of seafood by 2050. That is, the necessary ocean surface area and amount of recycled nutrients are available to produce an additional billion tonnes of seafood per year. Combined meat and seafood production in 2019 was about 500 million tonnes per year. The FAO [149] expects demand for meat and seafood may double by 2050. That implies that a half billion tonnes of seafood could fill the gap. Average meat GHG impact is about 17 tonnes of CO2eq per tonne of meat [150,151] (see SMS#24). Seafood GHG impact is about three tonnes of CO2eq per tonne of seafood (including both wild-caught and aquaculture) [152,153]. A business-as-usual increase in both meat and seafood production could produce 13 billion tonnes of CO2eq. Continuing 2018 meat and seafood production levels and adding a half billion tonnes of TEA seafood would total eight billion tonnes of CO2eq, a savings of five billion tonnes of CO2eq (see SMS#24).
Land-locked countries would not have direct access to seafood production, other than inland aquaculture. Land-locked countries could follow the high-bioelectricity path, which transitions to dry biomass-electricity-with-sequestration. The market for agriculture residue-to-electricity (corn cobs, corn stalks, chaff, bagasse) may benefit land agriculture (better paying jobs, more robust food production, etc.). An additional half-billion tonnes of seafood per year should mean that inland people can still have high protein seafood to augment local agriculture. It also may reduce pressures to deforest land areas for more crops and livestock.
As temperatures rise in the tropics, more crops are failing [154,155] and, especially important for developing countries, food micronutrient levels are dropping [156,157,158]. Thus, health can be improved with seafood, which has high micronutrient levels [159,160,161]. While ocean temperatures are rising slowly on average, marine heat waves are already forcing fish to migrate hundreds of kilometers within a few months and harming less mobile species. On a built-reef, water temperature can be adjusted (submerging each night or pumping deep water) to sustain the ecosystem. In addition, air temperatures along coasts are rising more slowly than inland, so refugees from inland droughts and floods can find work without leaving their home country. The hope is that this could lead to less migration and less violence. Aquatic-based organic fertilizers can replace chemical fertilizers. Scaling built-reef total ecosystem aquaculture provides more seafood, which makes it easier to reserve marine protected areas.

3.9.2. Human Waste Resource Recovery Systems (SDGs 3, 6, 12, and 14)

Improved human and livestock waste collection and recycling systems can maintain public health while recovering freshwater, energy, and nutrients to produce more food and improving ocean health. When nutrients are recycled effectively, the food-waste-food circular economy should cost less than current systems for treating human and livestock waste that destroy nutrients, thus necessitating use of artificial and mined nutrients.

3.9.3. Solid Waste Resource Recovery Systems (SDGs 3, 6, 12, and 14)

Municipal and industrial solid waste collection systems can recover resources safely and effectively while producing energy that more than covers the cost of collection. Paying people for their solid waste could reduce future marine plastic pollution.

3.9.4. Sustainable Energy Systems (SDGs 7 and 13)

The multi-fuel energy systems outlined above can support universal access to affordable, reliable and modern energy services while also recycling nutrients and producing sequestration-ready CO2. Co-locating the human and solid waste resource recovery plants with the energy systems reduces costs.

3.9.5. Sustainable Ocean Biomass-For-Energy (SDGs 7 and 13)

The seafood reefs can be expanded beyond the global seafood demand to also produce sufficient macroalgae to fulfill the global demand for carbon neutral liquid biofuels while supporting some carbon capture during the HTL process (making the biofuel carbon negative).

3.9.6. CO2 Sequestration Systems (SDG 13)

Many countries have locations appropriate for the CO2 sequestration systems listed above. Developing countries might earn income from developed countries by exporting negative carbon credits.

3.9.7. Floating Land Systems (SDG 11)

As sea levels rise, some people in developing countries can opt to stay at the shore to operate the reef systems by utilizing floating land [162].

3.9.8. Other Public Health Systems (SDG 3)

Both proposed paths help replace inefficient open-flame home cooking with clean-burning fuel or electric stoves. They also eliminate air pollutants from electricity generation, yielding large co-benefits for air quality and human health. West et al. [163] calculated local average marginal co-benefits of avoided mortality from air pollution ranging from $50–380/tonne of CO2.

3.9.9. All Human Systems Be Sustainable (All SDGs)

Since N’Yeurt et al. [39] discussed, in 2012, sustainability criteria for growing macroalgae forests to reverse climate change, the technologies have evolved and the economics improved, facilitating sustainability across environmental, climate, political, social, energy, and economic pathways. (See SMD3.9.9 for more discussion on how ocean forest reefs directly support twelve of the SDGs.)

4. Conclusions and Recommendations

4.1. Summary

This paper identified sustainable paths to realizing large negative carbon emissions (CDR) while achieving food, employment, healthy oceans, and other SDGs. This CDR is a relatively inexpensive by-product of energy production. The paths are integrated and can contribute to global human and environmental justice, while adhering to principles presented by Morrow et al. [164] for evaluating CDR. Introducing the concept of continued fossil fuel use paying for legacy CDR might help nations increase their national declared contributions to achieve the IPCC 1.5 °C goal of net zero by 2050 and then continue BECCS beyond 2100 to return the planet to preindustrial levels of CO2 if desired.
An additional 0.5 billion tonnes/yr of seafood (three times present seafood production and equal to the current total meat and seafood production) [149] could be produced by recycling nutrients from humans back to the land and ocean. In the ocean, recycled nutrients are distributed to macroalgae or seagrass grown on floating, flexible fishing reefs positioned in the photic zone independent of seafloor depth. These fishing reefs form highly productive ecosystems supported by nutrients optimized for seasonal productivity and natural variations in endogenous nutrients and dissolved oxygen supply. Calculations suggested that a billion tonnes of seafood can be grown on less than 10% of the suitable continental shelf with water depths <200 m [43] equating to about 0.3% of the world’s oceans (see SMS#6, 18). By growing more food in less ocean, marine protected areas could be increased. Production of high-protein food in the ocean could facilitate transition of grain-for-meat production to grain-for-people production as well as increased energy crops, forests, and wildlife habitat with lower GHG emissions. Structures supporting seafood-production reefs are similar to those used for macroalgae-for-biofuel production. Seafood production and macroalgae-for-biofuel equipment could be co-developed on a single structure.
All countries can benefit from safe handling of biohazard wastes and mixed-solid wastes in general with low, even negative, disposal fees using HTL to produce as much as 20 million barrels/day (3 million tonnes/day) of biocrude oil from wastes by 2050. Additional benefits include less plastic trash reaching the ocean, less methane emissions from landfills, and clearing beached Sargassum.
Allam Cycle power plants reduce the avoided cost (i.e., the economic penalty as defined by Rubin et al. [145]) to capture, compress, transport, and sequester one tonne of CO2 from the >$60/tonne (in 2020) for other power plant CCS technologies to less than $0/tonne for early adopters (see Table 5 and SMS#14, 16). As “waste” sources become valuable and gases produced during Allam Cycle electricity production exceed commercial demand, the avoided cost could rise to $26/tonne. This significant cost decrease for CCS, combined with developing-country needs for renewable, sustainable electricity, provides an opportunity for these countries to lead in mitigating climate change. Utilizing the existing global coal supply chain combined with significant construction of Allam Cycle power plants decreases the time to net-zero emissions. Fast start-up can be supported by the oil industry buying CO2 for enhanced oil recovery.
When co-located, the HTL and Allam Cycle facilities synergistically produce carbon-negative biofuel. Both technologies can be co-located with other businesses and waste-handling facilities to maximize this closed-loop economy that demonstrates improved energy efficiencies (e.g., pasteurizing human and medical wastes with “waste” heat and manufacturing high-performance plastics from biocrude oil that, when recycled, more easily convert to biocrude or electricity).
We realize that proposing that all new electricity power plants be Allam Cycle (or similar sequestering technologies), perhaps initially burning fossil fuels (coal and natural gas) may seem counter-intuitive. However, Quirion et al. [165] found that using CCS with fossil fuels produced faster reduction in emissions with a lower carbon price.
Each country or community can consider which sustainable-development components and associated technologies best fit their resources and goals. Every sustainable development listed in Section 3.9 can start now and grow while achieving SDGs with high economic efficiency. These technologies can deploy to global scales while producing seafood in addition to energy and nutrient production from mixed-plastics and organic solid waste. This is consistent with Otto et al. [166] in that major climate efforts must be “explicitly compatible with the Sustainable Development Goals, in the sense of positive social tipping dynamics.” The health co-benefits of net-zero-emissions energy and waste recovery engender local support, especially because these benefits are primarily local and near-term [163].

4.2. Needed Research

The process of building, operating, and maintaining the needed commercial-scale infrastructure will involve needed technology refinements. Potential research topics include the following (see SMD for additional examples):
  • Life-cycle costs, planetary boundaries [167], energy, and emissions analyses for all the mechanisms and technologies included, such as emissions during soil preparation, cultivation, collection and processing of dry biomass and the equivalent for oceanic biomass. Macroalgae-for-biofuel scale production requires a planetary boundary check on ozone layer depletion from gases emitted by micro- and macroalgae ([168,169] and references therein).
  • Total-ecosystem aquaculture must be designed for continued biodiversity and seafood production even with some fish species moving toward the poles as the tropical oceans become too warm [170].
  • Economists and political leaders need to devise equitable ways to pay [164,171] for accomplishing net-zero CO2 emissions and removing legacy CO2 emissions from the atmosphere for a century or so after achieving net-zero CO2 emissions.
  • The United Nations Decade of Ocean Science for Sustainable Development [172] could use the above framework to focus on supporting sustainable management of the oceans to achieve the UN SDGs.

Supplementary Materials

The following are available online at: https://www.mdpi.com/1996-1073/13/18/4972/s1, Supplemental Materials Spreadsheet (SMS) (Excel) containing the tables from the manuscript with formulas linked to calculations across 24 numbered tabs (aka worksheets). The left-most tab is a table of contents. The appropriate tab is referenced in the manuscript as SMS#X. The SMS allows “what if” calculations. Supplemental Materials Document (SMD) (PDF) contains Figures S1–S24 and Table S1. The SMD provides a more detailed explanation of how input quantities were selected for the spreadsheet calculations.

Author Contributions

Conceptualization, M.E.C.; methodology, M.E.C.; writing—original draft preparation, M.E.C. and J.R.S.; source data, All; writing—review and editing, All; visuals, M.E.C. All authors have read and agreed to the published version of the manuscript.

Funding

This research was not directly funded by agencies in the public, commercial, or not-for-profit sectors. However, the authors appreciate funding by the U.S. DOE’s Advanced Research Projects Agency—Energy (ARPA-E) MacroAlgae Research Inspiring Novel Energy Resources (MARINER) Program, which helped assemble teams and facilitated work on ocean macroalgae-for-energy cultivation under the following Department of Energy contracts: DE-AR0000911, DE-AR0000912, DE-AR0000915, DE-AR0000916, DE-AR0000919, DE-AR0000923, DE-AR0000925.

Acknowledgments

Marc von Keitz for establishing and leading the U.S. Department of Energy Advanced Research Projects Agency-Energy’s MARINER Program. Michael Huesemann and his team for providing cost and global-scale information from the Pacific Northwest National Laboratory’s MARINER team—Nautical Offshore Macroalgal Autonomous Device (NOMAD). Michael Stekoll and his team for providing cost and global-scale information from the University of Alaska, Fairbanks’ MARINER team—Scalable Coastal and Offshore Macroalgal Farming. Kelly Lucas, University of Southern Mississippi, for leading the Thad Cochran Marine Aquaculture Center to propose and execute two MARINER projects: AdjustaDepth and SeaweedPaddock. Michael Rust of the U.S. National Oceanic and Atmospheric Administration for suggesting teaming with the Thad Cochran Marine Aquaculture Center and insights concerning total ecosystem aquaculture. Ricardo Radulovich of University of Costa Rica for insights on Sea Farms and the feeding habits of green sea turtles. Gabrielle Maassen and Larry Unser of Samson Rope and Paul Badeau of Applied Fiber for contributing design, construction, and cost insights of the permanent built-reef structure. Matthew Wennerholm of AquaDam for contributing construction insights and cost data informing the design, performance, and cost of containers for CO2-hydrate storage. James R. Oyler of Genifuel, Matt Atwood of Algae Systems, Craig Pichach of CleanCarbon Energy, Jeffrey Moeller and Aaron Fisher of the Water Research Foundation’s Leaders Innovation Forum for Technology, and Greg Yamamoto of FreshMining for insights into hydrothermal liquefaction, biocrude upgrading, and potential nutrient-recycling processes. Rodney J. Allam, Jeremy Fetvedt, 8 Rivers, Toshiba, the U.S Department of Energy, and others associated with inventing and developing Allam Cycle electrical power plants. Jade Chongsathapornpong for his pro-bono illustrations of an AdjustaDepth floating flexible reef structure with total ecosystem aquaculture while a student at Oxnard High School and edits/comments as a freshman at the Massachusetts Institute of Technology. The four reviewers for their careful reading and good comments that helped us to clarify the paper and add some important references. The anonymous MDPI editor for catching typos and improving readability.

Conflicts of Interest

The authors declare no competing interests. Authors Capron and Hasan acquired knowledge of HTL processes while considering HTL manufacturers Genifuel, Algae Systems, and CleanCarbon Energy for municipal biosolids and solid waste. Capron and Hasan provided pro-bono advice to all three companies on topics related to recycling nutrients and handling byproduct carbon (can be either fuel or food).

References

  1. Pope Francis. Encyclical Letter Laudato Si’ of the Holy Father Francis on Care for Our Common Home. 2015. Available online: http://www.vatican.va/content/francesco/en/encyclicals/documents/papa-francesco_20150524_enciclica-laudato-si.html (accessed on 10 April 2020).
  2. Sorondo, M.S.; Ramanathan, V. Pursuit of integral ecology. Science 2016, 352, 747. [Google Scholar] [CrossRef] [PubMed] [Green Version]
  3. UNFCCC. What is the Paris Agreement? 2015. Available online: https://unfccc.int/process-and-meetings/the-paris-agreement/what-is-the-paris-agreement (accessed on 14 April 2020).
  4. IPCC. Global Warming of 1.5 °C. An IPCC Special Report on the Impacts of Global Warming of 1.5 °C above pre-Industrial Levels and Related Global Greenhouse Gas Emission Pathways, in the Context of Strengthening the Global Response to the Threat of Climate Change; IPCC: Geneva, Switzerland, 2018. [Google Scholar]
  5. United Nations. Sustainable Development Goals. 2016. Available online: https://sustainabledevelopment.un.org (accessed on 10 April 2020).
  6. UNEP. Emissions Gap Report 2019. Available online: https://www.unenvironment.org/resources/emissions-gap-report-2019 (accessed on 9 September 2020).
  7. IPCC. Climate Change 2014: Synthesis Report. Contribution of Working Groups I, II and III to the Fifth Assessment Report of the Intergovernmental Panel on Climate Change; Pachauri, R.K., Meyer, L.A., Eds.; IPCC: Geneva, Switzerland, 2014. [Google Scholar]
  8. National Academies of Sciences, Engineering, and Medicine. Negative Emissions Technologies and Reliable Sequestration: A Research Agenda.; The National Academies Press: Washington, DC, USA, 2019; ISBN 978-0-309-48452-7. [Google Scholar]
  9. Minx, J.C.; Lamb, W.F.; Callaghan, M.W.; Bornmann, L.; Fuss, S. Fast growing research on negative emissions. Environ. Res. Lett. 2017, 12. [Google Scholar] [CrossRef]
  10. Fuss, S.; Lamb, W.F.; Callaghan, M.W.; Hilaire, J.; Creutzig, F.; Amann, T.; Beringer, T.; De Oliveira Garcia, W.; Hartmann, J.; Khanna, T.; et al. Negative emissions-Part 2: Costs, potentials and side effects. Environ. Res. Lett. 2018, 13. [Google Scholar] [CrossRef] [Green Version]
  11. Nemet, G.F.; Callaghan, M.W.; Creutzig, F.; Fuss, S.; Hartmann, J.; Hilaire, J.; Lamb, W.F.; Minx, J.C.; Rogers, S.; Smith, P. Negative emissions—Part 3: Innovation and upscaling. Environ. Res. Lett. 2018, 13, 63003. [Google Scholar] [CrossRef] [Green Version]
  12. Flannery, T. Atmosphere of Hope: Searching for Solutions to the Climate Crisis.; Atlantic Monthly Press: Boston, MA, USA, 2015. [Google Scholar]
  13. Flannery, T. Sunlight and Seaweed, an Argument for How to Feed, Power and Clean Up the World.; The Text Publishing Company: Melbourne, Australia, 2017. [Google Scholar]
  14. Wilkinson, K. The Drawdown Review 2020: Climate Solutions for a New Decade. Available online: https://drawdown.org/drawdown-framework/drawdown-review-2020 (accessed on 10 April 2020).
  15. Capron, M.E.; Blaylock, R.; Lucas, K.; Chambers, M.D.; Stewart, J.R.; DiMarco, S.F.; Whilden, K.; Wang, B.; Kim, M.H.; Moscicki, Z.; et al. Ocean Forests: Breakthrough Yields for Macroalgae. In Proceedings of the OCEANS 2018 MTS/IEEE Charleston, Charleston, SC, USA, 22–25 October 2018; pp. 1–6. [Google Scholar] [CrossRef]
  16. Lucas, K.; Capron, M.E.; Blaylock, R.; Chambers, M.D.; Stewart, J.R.; DiMarco, S.F.; Whilden, K.; Kim, M.H.; Moscicki, Z.; Sullivan, C.; et al. AdjustaDepth Phase 1 Final Report to ARPA-E, DE-AR0000916. 2019. Available online: https://www.researchgate.net/publication/341997484_AdjustaDepth_Phase_1_Final_Report_DE-AR0000916_Feed_the_world_on_the_way_to_abundant_biofuels (accessed on 9 September 2020).
  17. Lucas, K.; Capron, M.E.; Blaylock, R.; Chambers, M.D.; Stewart, J.R.; DiMarco, S.F.; Whilden, K.; Wang, B.; Kim, M.H.; Moscicki, Z.; et al. Ocean Forests: Feeding the World with Floating Artificial Reefs. In Proceedings of the World Aquaculture Society, #666, New Orleans, LA, USA; 2019. Available online: https://wasblobstorage.blob.core.windows.net/meeting-abstracts/AQ2019AbstractBook.pdf (accessed on 9 September 2020).
  18. Capron, M.E. Centuries of Food and Job Security for Coastal Peoples. 2019. Available online: https://challenges.openideo.com/challenge/2019-bridgebuilder-challenge/ideas/centuries-of-food-and-job-security-for-coastal-peoples (accessed on 4 April 2020).
  19. Capron, M.E.; Piper, D. Abundant Food and Export Income with Total ecosystem Aquaculture. 2019. Available online: https://www.climatecolab.org/contests/2019/reshapingdevelopmentpathwaysinLDCs/c/proposal/1334620 (accessed on 9 September 2020).
  20. Capron, M.E.; Lucas, K.; Chambers, M.D.; Lapointe, B.; N’Yeurt, A.d.R.; Krueger-Hadfield, S.A.; James, S.C.; Blaylock, R.; Stewart, J.R.; Piper, D.; et al. Building New Fishery Ecosystems: The Science of Flexible Floating Fishing Reefs. In Proceedings of the International Symposium on Stock Enhancement & Sea Ranching; 2019. Available online: https://mote.org/media/uploads/contact/ISSESR-Wednesday-1150-Piper.pdf (accessed on 9 September 2020).
  21. Capron, M.E.; N’Yeurt, A.d.R.; Kim, J.K.; Pichach, C.; Chambers, M.D.; Fuhrman, R.; Jones, A.T.; Stewart, J.R.; Blaylock, R.; Hasan, M.A.; et al. Reversing Climate Change within 100 Years: The Scale to Restore Natural CO2 Levels. In Proceedings of the Ocean Sciences Meeting Presentation SI41A-02; 2020. Available online: https://agu.confex.com/agu/osm20/meetingapp.cgi/Paper/648119 (accessed on 9 September 2020).
  22. Capron, M.E.; Prasad, R.; N’Yeurt, A.d.R.; Hopkins, K.; Stewart, J.R.; Harris, G.; Hasan, M.A.; Piper, D. Increasing South Pacific aquaculture with complete ecosystems. Ocean Sciences Meeting Presentation SI12A-05. 2020. Available online: https://agu.confex.com/agu/osm20/meetingapp.cgi/Paper/649244 (accessed on 9 September 2020).
  23. Capron, M.E.; Prasad, R.; N’Yeurt, A.d.R.; Hewavitharane, C.; Stewart, J.R. Total Ecosystem Aquaculture—Sustainable Seafood Production for Fiji, the Pacific, and then the World. 2020. Available online: https://challenges.openideo.com/challenge/food-system-vision-prize/open-submission/restorative-aquaculture-sustainable-seafood-production-for-the-world (accessed on 9 March 2020).
  24. Chambers, M.D. Integrated Multi-Trophic Aquaculture of Steelhead, Blue Mussels and Sugar Kelp. Ph.D. Dissertation, University of New Hampshire, Durham, NH, USA, 2013. [Google Scholar]
  25. Knowler, D.; Chopin, T.; Martínez-Espiñeira, R.; Neori, A.; Nobre, A.; Noce, A.; Reid, G. The economics of Integrated Multi-Trophic Aquaculture: Where are we now and where do we need to go? Rev. Aquac. 2020. [Google Scholar] [CrossRef]
  26. Advanced Research Projects Agency—Energy (ARPA-E)—U.S. Department of Energy. MacroAlgae Research Inspiring Novel Energy Resources (MARINER) Program Overview. Available online: https://arpa-e.energy.gov/sites/default/files/documents/files/MARINER_ProgramOverview_FINAL.pdf (accessed on 10 April 2020).
  27. Laurens, L.M.L.; Nelson, R.S. Chapter 21—Sustainable technologies for seaweed conversion to biofuels and bioproducts. In Advances in Green Chemistry; Torres, M.D., Kraan, S., Dominguez, H.B.T.-S.S.T., Eds.; Elsevier: Amsterdam, The Netherlands, 2020; pp. 643–661. ISBN 978-0-12-817943-7. [Google Scholar]
  28. Jiang, Y.; Jones, S.B.; Zhu, Y.; Snowden-Swan, L.; Schmidt, A.J.; Billing, J.M.; Anderson, D. Techno-economic uncertainty quantification of algal-derived biocrude via hydrothermal liquefaction. Algal Res. 2019, 39, 101450. [Google Scholar] [CrossRef]
  29. Jiao, J.-L.; Wang, F.; Duan, P.-G.; Xu, Y.-P.; Yan, W.-H. Catalytic hydrothermal gasification of microalgae for producing hydrogen and methane-rich gas. Energy Sources Part Recovery Util. Environ. Eff. 2017, 39, 851–860. [Google Scholar] [CrossRef]
  30. Pichach, C. CleanCarbon Energy: Carbon Balanced Renewable Energy, Plus Private Communication. Available online: https://www.f6s.com/cleancarbonenergy (accessed on 10 April 2020).
  31. Genifuel. Clean Conversion of Wet Waste to Fuel. Available online: https://www.genifuel.com/ (accessed on 4 April 2020).
  32. Steeper Energy. Hydrofaction Technology. Available online: https://steeperenergy.com/ (accessed on 4 April 2020).
  33. ReNew ELP. Unlocking the Value in Plastic Waste. Available online: https://renewelp.co.uk/ (accessed on 4 April 2020).
  34. Allam, R.; Martin, S.; Forrest, B.; Fetvedt, J.; Lu, X.; Freed, D.; Brown, G.W.; Sasaki, T.; Itoh, M.; Manning, J. Demonstration of the Allam Cycle: An Update on the Development Status of a High Efficiency Supercritical Carbon Dioxide Power Process Employing Full Carbon Capture. Energy Procedia 2017, 114, 5948–5966. [Google Scholar] [CrossRef]
  35. 8 Rivers Capital. Allam Cycle Zero Emission Coal Power Plant DOE Grant Proposal 89243319CFE000015. 2020. Available online: https://www.netl.doe.gov/coal/tpg/coalfirst/concept-reports (accessed on 10 April 2020).
  36. Fernandes, D.; Wang, S.; Xu, Q.; Buss, R.; Chen, D. Process and Carbon Footprint Analyses of the Allam Cycle Power Plant Integrated with an Air Separation Unit. Clean Technol. 2019, 1, 325–340. [Google Scholar] [CrossRef] [Green Version]
  37. McMahon, J. Multiple Zero-Carbon Natural-Gas Plants Planned at Lower Cost Than Conventional Plants. Forbes Mag. 2019, 15, 3074–3098. [Google Scholar]
  38. Flin, D. First Fire for La Porte Carbon Capture demo. Gas Turbine World. Available online: https://gasturbineworld.com/first-fire-for-la-porte-carbon-capture-demo/ (accessed on 10 April 2020).
  39. N‘Yeurt, A.R.; Chynoweth, D.P.; Capron, M.E.; Stewart, J.R.; Hasan, M.A. Negative carbon via Ocean Afforestation. Process Saf. Environ. Prot. 2012, 90, 467–474. [Google Scholar] [CrossRef]
  40. U.S. Department of Energy Advanced Research Projects Agency-Energy. MacroAlgae Research Inspiring Novel Energy Resources (MARINER) Project Listing. 2017. Available online: https://arpa-e.energy.gov/?q=arpa-e-programs/mariner (accessed on 4 April 2020).
  41. U.S. Department of Energy. Department of Energy Announces $100M in Investments in Coal FIRST; U.S. Department of Energy: Washington, DC, USA, 2019.
  42. Capron, M.E.; Lucas, K.; Stewart, J.R.; Blaylock, R.; Howden, S.; Chambers, M.D.; James, S.C.; Brooks, M.T.; Lapointe, B.; N’Yeurt, A.d.R.; et al. AdjustaDepth TechnoEconomic Analysis for ARPA-E Phase 1 Contract DE-AR0000916. Available online: https://www.researchgate.net/publication/343697255_AdjustaDepth_TechnoEconomic_Analysis_for_ARPA-E_Phase_1_Contract_DE-AR0000916 (accessed on 9 September 2020).
  43. Gentry, R.R.; Froehlich, H.E.; Grimm, D.; Kareiva, P.; Parke, M.; Rust, M.; Gaines, S.D.; Halpern, B.S. Mapping the global potential for marine aquaculture. Nat. Ecol. Evol. 2017, 1, 1317–1324. [Google Scholar] [CrossRef]
  44. Lapointe, B.E.; Ryther, J.H. Some aspects of the growth and yield of Gracilaria tikvahiae in culture. Aquaculture 1978, 15, 185–193. [Google Scholar] [CrossRef]
  45. Lapointe, B.E. Strategies for pulsed nutrient supply to Gracilaria cultures in the Florida Keys: Interactions between concentration and frequency of nutrient pulses. J. Exp. Mar. Biol. Ecol. 1985, 93, 211–222. [Google Scholar] [CrossRef]
  46. Capo, T.R.; Jaramillo, J.C.; Boyd, A.E.; Lapointe, B.E.; Serafy, J.E. Sustained high yields of Gracilaria (Rhodophyta) grown in intensive large-scale culture. J. Appl. Phycol. 1999, 11, 143. [Google Scholar] [CrossRef]
  47. BP. BP Statistical Review of World Energy. 2019. Available online: https://www.bp.com/en/global/corporate/energy-economics/statistical-review-of-world-energy.html (accessed on 8 August 2020).
  48. U.S. Energy Information Administration. Petroleum and other liquids. 2020. Available online: https://www.eia.gov/international/data/world/petroleum-and-other-liquids/annual-petroleum-and-other-liquids-production (accessed on 4 April 2020).
  49. Kaza, S.; Yao, L.; Bhada-Tata, P.; Van Woerden, F. What a Waste 2.0: A Global Snapshot of Solid Waste Management to 2050; The World Bank: Washington, DC, USA, 2018; ISBN 978-1-4648-1329-0. [Google Scholar]
  50. U.S. Department of Energy. 2016 Billion-Ton Report: Advancing Domestic Resources for a Thriving Bioeconomy; U.S. Department of Energy: Washington, DC, USA, 2018. [CrossRef] [Green Version]
  51. Jolly, R. Dutch Industrial Waste Continues to Decrease. 2004. Available online: https://www.cbs.nl/en-gb/news/2004/42/industrial-waste-continues-to-decrease (accessed on 9 September 2020).
  52. CalRecycle. Disposal-Facility-Based Characterization of Solid Waste in California. 2015. Available online: https://www2.calrecycle.ca.gov/Publications/Details/1546 (accessed on 4 April 2020).
  53. U.S. Energy Information Administration (EIA). Average Heat Content of Selected Biomass Fuels. Renewable Energy Annual 2004. Available online: https://www.eia.gov/renewable/annual/ (accessed on 3 March 2020).
  54. Smil, V. Crop Residues: Agriculture’s Largest Harvest: Crop residues incorporate more than half of the world’s agricultural phytomass. BioScience 1999, 49, 299–308. [Google Scholar] [CrossRef] [Green Version]
  55. Daioglou, V.; Stehfest, E.; Wicke, B.; Faaij, A. Projections of the availability and cost of residues from agriculture and forestry. Bioenergy 2016, 8, 456–470. [Google Scholar] [CrossRef]
  56. Ravindra, K.; Singh, T.; Mor, S. Emissions of air pollutants from primary crop residue burning in India and their mitigation strategies for cleaner emissions. J. Clean. Prod. 2019, 208, 261–273. [Google Scholar] [CrossRef]
  57. Deng, Y.Y.; Koper, M.; Haigh, M.; Dornburg, V. Country-level assessment of long-term global bioenergy potential. Biomass Bioenergy 2015, 74, 253–267. [Google Scholar] [CrossRef] [Green Version]
  58. Devi, S.; Gupta, C.; Jat, S.L.; Parmar, M.S. Crop residue recycling for economic and environmental sustainability: The case of India. Open Agric. 2017, 2, 486–494. [Google Scholar] [CrossRef]
  59. Turner, P.A.; Mach, K.J.; Lobell, D.B.; Benson, S.M.; Baik, E.; Sanchez, D.L.; Field, C.B. The global overlap of bioenergy and carbon sequestration potential. Clim. Chang. 2018, 148, 1–10. [Google Scholar] [CrossRef] [Green Version]
  60. Das, P.K.; Das, B.P.; Dash, P. Role of Energy Crops to Meet the Rural Energy Needs: An Overview. Biomass Valorization Bioenergy 2019. [Google Scholar] [CrossRef]
  61. Eisentraut, A. Sustainable Production of Second-Generation Biofuels: Potential and Perspectives in Major Economies and Developing Countries; IEA Energy Pap. No 201001; OECD Publ.: Paris, France, 2010. [Google Scholar] [CrossRef]
  62. Smeets, E.M.W.; Faaij, A.P.C.; Lewandowski, I.M.; Turkenburg, W.C. A bottom-up assessment and review of global bio-energy potentials to 2050. Prog. Energy Combust. Sci. 2007, 33, 56–106. [Google Scholar] [CrossRef] [Green Version]
  63. Daly, C.; Halbleib, M. Potential Yield Mapping of Dedicated Energy Crops. Available online: http://energy.gov/sites/prod/files/2014/11/f19/daly_biomass_2014.pdf (accessed on 4 April 2020).
  64. Buschmann, A.H.; Camus, C.; Infante, J.; Neori, A.; Israel, Á.; Hernández-González, M.C.; Pereda, S.V.; Gomez-Pinchetti, J.L.; Golberg, A.; Tadmor-Shalev, N.; et al. Seaweed production: Overview of the global state of exploitation, farming and emerging research activity. Eur. J. Phycol. 2017, 52, 391–406. [Google Scholar] [CrossRef]
  65. Kim, J.K.; Wu, H.; Shin, S.K.; Park, M.S.; Kim, Y.D.; Do, Y.H.; Kim, N.G.; Han, T. An effective integrated multi-trophic aquaculture system for Korean waters. In The 2nd International Integrated Multi-Trophic Aquaculture Symposium Book of Abstracts; Springer: New York, NY, USA, 2017; pp. 17–32. [Google Scholar]
  66. Kim, J.K.; Yarish, C.; Hwang, E.K.; Park, M.; Kim, Y. Seaweed aquaculture: Cultivation technologies, challenges and its ecosystem services. ALGAE 2017, 32, 1–13. [Google Scholar] [CrossRef] [Green Version]
  67. Park, M.; Shin, S.K.; Do, Y.H.; Yarish, C.; Kim, J.K. Application of open water integrated multi-trophic aquaculture to intensive monoculture: A review of the current status and challenges in Korea. Aquaculture 2018, 497, 174–183. [Google Scholar] [CrossRef]
  68. Radulovich, R.; Umanzor, S.; Cabrera, R.; Mata, R. Tropical seaweeds for human food, their cultivation and its effect on biodiversity enrichment. Aquaculture 2015, 436, 40–46. [Google Scholar] [CrossRef] [Green Version]
  69. Shi, H.; Zheng, W.; Zhang, X.; Zhu, M.; Ding, D. Ecological–economic assessment of monoculture and integrated multi-trophic aquaculture in Sanggou Bay of China. Aquaculture 2013, 410–411, 172–178. [Google Scholar] [CrossRef]
  70. Froehlich, H.E.; Afflerbach, J.C.; Frazier, M.; Halpern, B.S. Blue Growth Potential to Mitigate Climate Change through Seaweed Offsetting. Curr. Biol. 2019, 29, 3087–3093. [Google Scholar] [CrossRef]
  71. Theuerkauf, S.J.; Morris, J.A., Jr.; Waters, T.J.; Wickliffe, L.C.; Alleway, H.K.; Jones, R.C. A global spatial analysis reveals where marine aquaculture can benefit nature and people. PLoS ONE 2019, 14, e0222282. [Google Scholar] [CrossRef] [PubMed]
  72. Dahlke, F.T.; Wohlrab, S.; Butzin, M.; Pörtner, H.O. Thermal bottlenecks in the life cycle define climate vulnerability of fish. Science 2020, 369, 65–70. [Google Scholar] [CrossRef] [PubMed]
  73. Hastings, R.A.; Rutterford, L.A.; Freer, J.J.; Collins, R.A.; Simpson, S.D.; Genner, M.J. Climate Change Drives Poleward Increases and Equatorward Declines in Marine Species. Curr. Biol. 2020, 30, 1572–1577. [Google Scholar] [CrossRef] [PubMed] [Green Version]
  74. Field, C.B.; Behrenfeld, M.J.; Randerson, J.T.; Falkowski, P. Primary Production of the Biosphere: Integrating Terrestrial and Oceanic Components. Science 1998, 281. [Google Scholar] [CrossRef] [Green Version]
  75. Hudiburg, T.W.; Luyssaert, S.; Thornton, P.E.; Law, B.E. Interactive Effects of Environmental Change and Management Strategies on Regional Forest Carbon Emissions. Environ. Sci. Technol. 2013, 47, 13132–13140. [Google Scholar] [CrossRef]
  76. Korai, M.S.; Mahar, R.B.; Uqaili, M.A. Assessment of Power Generation Potential from Municipal Solid Wastes: A Case Study of Hyderabad City, Sindh, Pakistan. Pak. J. Anal. Environ. Chem. 2014, 15, 18–27. [Google Scholar]
  77. Clarke, S.; Preto, F. Biomass Burn Characteristics. Available online: http://www.omafra.gov.on.ca/english/engineer/facts/11-033.pdf (accessed on 9 September 2020).
  78. Kumar, P.; Kumar, S.; Joshi, L. Socioeconomic and Environmental Implications of Stubble Burning in Punjab SpringerBriefs in Environmental Science. 2015, 156. [CrossRef]
  79. Faaij, A. Contribution of Bioenergy to the World’s Future Energy. 2007. Available online: https://www.ieabioenergy.com/publications/potential-contribution-of-bioenergy-to-the-worlds-future-energy-demand (accessed on 9 September 2020).
  80. Fischer, G.; Schrattenholzer, L. Global bioenergy potentials through 2050. Biomass Bioenergy 2001, 20, 151–159. [Google Scholar] [CrossRef] [Green Version]
  81. Frank, A.B.; Berdahl, J.D.; Hanson, J.D.; Liebig, M.A.; Johnson, H.A. Biomass and Carbon Partitioning in Switchgrass. Crop Sci. 2004, 44, 1391–1396. [Google Scholar] [CrossRef] [Green Version]
  82. Hall, C.A.S.; Dale, B.E.; Pimentel, D. Seeking to understand the reasons for different energy return on investment (EROI) estimates for biofuels. Sustainability 2011, 3, 2413–2432. [Google Scholar] [CrossRef] [Green Version]
  83. Macreadie, P.I.; Anton, A.; Raven, J.A.; Beaumont, N.; Connolly, R.M.; Friess, D.A.; Kelleway, J.J.; Kennedy, H.; Kuwae, T.; Lavery, P.S.; et al. The future of Blue Carbon science. Nat. Commun. 2019, 10. [Google Scholar] [CrossRef] [Green Version]
  84. Hoogwijk, M.; Faaij, A.; de Vries, B.; Turkenburg, W. Exploration of regional and global cost–supply curves of biomass energy from short-rotation crops at abandoned cropland and rest land under four IPCC SRES land-use scenarios. Biomass Bioenergy 2009, 33, 26–43. [Google Scholar] [CrossRef] [Green Version]
  85. Eriksson, O.; Finnveden, G. Plastic waste as a fuel—CO2-neutral or not? Energy Environ. Sci. 2009, 2, 907–914. [Google Scholar] [CrossRef]
  86. Ioelovich, M. Recent Findings and the Energetic Potential of Plant Biomass as a Renewable Source of Biofuels—A Review. Bioresources 2015, 10, 1879–1914. [Google Scholar]
  87. Kostecki, J.; Greinert, A.; Drab, M.; Wasylewicz, R.; Szafraniec, M.; Stodulski, G.; Wypych, M. The total content of nitrogen in leaves and wood of trees growing in the area affected by the Głogów Copper Smelter. J. Elem. 2015, 20, 137–148. [Google Scholar] [CrossRef]
  88. Reinhart, D. Estimation of Energy Content of Municipal Solid Waste. 2004. Available online: http://msw.cecs.ucf.edu/wastecharacterization.html (accessed on 2 February 2020).
  89. Milledge, J.J.; Harvey, P.J. Potential process ‘hurdles’ in the use of macroalgae as feedstock for biofuel production in the British Isles. J. Chem. Technol. Biotechnol. 2016, 91, 2221–2234. [Google Scholar] [CrossRef] [PubMed]
  90. Penniman, C.A.; Mathieson, A.C. Variation in Chemical Composition of Gracilaria tikvahiae McLachlan (Gigartinales, Rhodophyta) in the Great Bay Estuary, New Hampshire. Bot. Mar. 1987, 30, 525–534. [Google Scholar] [CrossRef]
  91. Lee, M.-S.; Wycislo, A.; Guo, J.; Lee, D.K.; Voigt, T. Nitrogen Fertilization Effects on Biomass Production and Yield Components of Miscanthus ×giganteus. Front. Plant Sci. 2017, 8, 544. [Google Scholar] [CrossRef] [Green Version]
  92. Tanger, P.; Field, J.; Jahn, C.; DeFoort, M.; Leach, J. Biomass for thermochemical conversion: Targets and challenges. Front. Plant Sci. 2013, 4, 218. [Google Scholar] [CrossRef] [Green Version]
  93. UNEP. Waste-to-Energy: Considerations for Informed Decision-Making. 2019. Available online: http://wedocs.unep.org/bitstream/handle/20.500.11822/28413/WTEfull.pdf (accessed on 9 September 2020).
  94. Sherman, M.T.; Blaylock, R.; Lucas, K.; Capron, M.E.; Stewart, J.R.; DiMarco, S.F.; Thyng, K.; Hetland, R.; Kim, M.H.; Sullivan, C.; et al. SeaweedPaddock: Initial Modeling and Design for a Sargassum Ranch. In Proceedings of the OCEANS 2018 MTS/IEEE Charleston, Charleston, SC, USA, 22–25 October 2018; pp. 1–6. [Google Scholar] [CrossRef]
  95. Wilcox, B. Biofuel Production from Kelp. 2017. Available online: https://arpa-e.energy.gov/?q=slick-sheet-project/biofuel-production-kelp (accessed on 9 September 2020).
  96. Huesemann, M.; Mumford, T.; Wood, G.; Quinn, J.; Wang, T.; Yang, Z. Nautical Offshore Macroalgal Autonomous Device (NOMAD). Available online: https://arpa-e.energy.gov/?q=slick-sheet-project/nautical-offshore-macroalgal-autonomous-device (accessed on 4 April 2020).
  97. Stekoll, M. Scalable Coastal and Offshore Macroalgal Farming (SCOMF). 2017. Available online: https://arpa-e.energy.gov/?q=slick-sheet-project/scalable-coastal-and-offshore-macroalgal-farming (accessed on 9 September 2020).
  98. Lombardelli, G.; Pirone, R.; Ruggeri, B. LCA Analysis of Different MSW Treatment Approaches in the Light of Energy and Sustainability Perspectives. Chem. Eng. Trans. 2017, 57, 469–474. [Google Scholar] [CrossRef]
  99. Zaimes, G.G.; Khanna, V. Microalgal biomass production pathways: Evaluation of life cycle environmental impacts. Biotechnol. Biofuels 2013, 6, 88. [Google Scholar] [CrossRef] [Green Version]
  100. Pandur, Z.; Šušnjar, M.; Zorić, M.; Nevečerel, H.; Horvat, D. Energy Return on Investment (EROI) of Different Wood Products. In Precious Forests—Precious Earth; Zlatic, M., Ed.; IntertechOpen: London, UK, 2015. [Google Scholar]
  101. Environmental Research & Education Foundation. Analysis of MSW Tipping Fees. 2019. Available online: http://www.erefdn.org (accessed on 4 April 2020).
  102. REN21. Renewables 2019 Global Status Report. Available online: https://www.ren21.net/gsr-2019/ (accessed on 11 April 2020).
  103. Schiener, P.; Black, K.D.; Stanley, M.S.; Green, D.H. The seasonal variation in the chemical composition of the kelp species Laminaria digitata, Laminaria hyperborea, Saccharina latissima and Alaria esculenta. J. Appl. Phycol. 2015, 27, 363–373. [Google Scholar] [CrossRef]
  104. Sims, N.A.; Vollbrecht, L.; Bullock, M.; Martin, K. Ocean Era Blue Fields Offshore Macroalgae Demonstration Project. 2019. Available online: http://ocean-era.com/projects (accessed on 4 April 2020).
  105. Wesseler, S. In King County, Washington, Human Waste Is a Climate Solution. Available online: https://www.yaleclimateconnections.org/2019/11/in-king-county-washington-human-waste-is-a-climate-solution/ (accessed on 4 April 2020).
  106. Pan, W.L.; Port, L.E.; Xiao, Y.; Bary, A.I.; Cogger, C.G. Soil Carbon and Nitrogen Fraction Accumulation with Long-Term Biosolids Applications. Soil Sci. Soc. Am. J. 2017, 81, 1381–1388. [Google Scholar] [CrossRef] [Green Version]
  107. Kunzig, R. Is a World without Trash Possible? Natl. Geogr. March 2020. Available online: https://www.nationalgeographic.com/magazine/2020/03/ (accessed on 9 September 2020).
  108. Brown, T. Ammonia Production Causes 1% of Total Global GHG Emissions. 2016. Available online: https://ammoniaindustry.com/ammonia-production-causes-1-percent-of-total-global-ghg-emissions/ (accessed on 4 April 2020).
  109. FAO. World fertilizer Trends and Outlook to 2018; FAO: Roma, Italy, 2015; ISBN 9789251086926. [Google Scholar]
  110. Monterey Bay Aquarium Research Institute (MBARI) Ocean Data FloatViz 6.0. Available online: https://www.mbari.org/science/upper-ocean-systems/chemical-sensor-group/floatviz (accessed on 11 November 2019).
  111. Chan, F.; Barth, J.A.; Blanchette, C.A.; Byrne, R.H.; Chavez, F.; Cheriton, O.; Feely, R.A.; Friederich, G.; Gaylord, B.; Gouhier, T.; et al. Persistent spatial structuring of coastal ocean acidification in the California Current System. Sci. Rep. 2017, 7, 2526. [Google Scholar] [CrossRef]
  112. Feely, R.A.; Sabine, C.L.; Hernandez-Ayon, J.M.; Ianson, D.; Hales, B. Evidence for Upwelling of Corrosive “Acidified” Water onto the Continental Shelf. Science 2008, 320, 1490–1492. [Google Scholar] [CrossRef] [Green Version]
  113. Köhn, E.E.; Thomsen, S.; Arévalo-Martinez, D.L.; Kanzow, T. Submesoscale CO2 variability across an upwelling front off Peru. Ocean Sci. 2017, 13, 1017–1033. [Google Scholar] [CrossRef] [Green Version]
  114. Ries, J.B. Review: Geological and experimental evidence for secular variation in seawater Mg/Ca (calcite-aragonite seas) and its effects on marine biological calcification. Biogeosciences 2010, 7, 2795–2849. [Google Scholar] [CrossRef] [Green Version]
  115. Melara, A.J.; Singh, U.; Colosi, L.M. Is aquatic bioenergy with carbon capture and storage a sustainable negative emission technology? Insights from a spatially explicit environmental life-cycle assessment. Energy Convers. Manag. 2020, 224, 113300. [Google Scholar] [CrossRef]
  116. Watson, J.; Wang, T.; Si, B.; Chen, W.T.; Aierzhati, A.; Zhang, Y. Valorization of hydrothermal liquefaction aqueous phase: Pathways towards commercial viability. Prog. Energy Combust. Sci. 2020, 77. [Google Scholar] [CrossRef]
  117. Cheng, F.; Porter, M.D.; Colosi, L.M. Is hydrothermal treatment coupled with carbon capture and storage an energy-producing negative emissions technology? Energy Convers. Manag. 2020, 203, 112252. [Google Scholar] [CrossRef]
  118. American Chemistry Council. U.S. Resin Production & Sales 2018 vs. 2017; American Chemistry Council: Washington, DC, USA, 2017. [Google Scholar]
  119. Bruun, J. Revolutionizing the Way We Manage Waste. 2019. Available online: https://eng.au.dk/en/news-and-events/news/show/artikel/revolutionising-the-way-we-manage-waste-a-danish-researcher-is-developing-a-pioneering-new-technolo-1/ (accessed on 4 April 2020).
  120. U.S. Department of Energy. U.S. Department of Energy Invests $7 Million for Projects to Advance Coal Power Generation under Coal FIRST Initiative. 2019. Available online: https://www.energy.gov/fe/articles/us-department-energy-invests-7-million-projects-advance-coal-power-generation-under-coal (accessed on 4 April 2020).
  121. U.S. Department of Energy. Reports for the Coal FIRST concepts of interest; 2020. Available online: https://netl.doe.gov/coal/tpg/coalfirst/concept-reports (accessed on 4 January 2020).
  122. James, R.E.; Kearins, D.; Turner, M.; Woods, M.; Kuehn, N.; Zoelle, A. Cost and Performance Baseline for Fossil Energy Plants Volume 1: Bituminous Coal and Natural Gas to Electricity; NETL: Washington, DC, USA, 2019. [CrossRef]
  123. Irlam, L. Global Costs of Carbon Capture and Storage. 2017. Available online: https://www.globalccsinstitute.com/archive/hub/publications/201688/global-ccs-cost-updatev4.pdf (accessed on 4 April 2020).
  124. 8 Rivers Capital. Direct Supercritical Carbon Dioxide Power Plant System. 2020. Available online: https://www.netl.doe.gov/coal/tpg/coalfirst/DirectSupercriticalCo2 (accessed on 9 September 2020).
  125. Melzer, L.S. Carbon Dioxide Enhanced Oil Recovery (CO2 EOR): Factors Involved in Adding Carbon Capture, Utilization and Storage (CCUS) to Enhanced Oil Recovery. 2012. Available online: https://carboncapturecoalition.org/wp-content/uploads/2018/01/Melzer_CO2EOR_CCUS_Feb2012.pdf (accessed on 4 April 2020).
  126. Sepulveda, N.A.; Jenkins, J.D.; de Sisternes, F.J.; Lester, R.K. The Role of Firm Low-Carbon Electricity Resources in Deep Decarbonization of Power Generation. Joule 2018, 2, 2403–2420. [Google Scholar] [CrossRef] [Green Version]
  127. Deng, H.; Bielicki, J.M.; Oppenheimer, M.; Fitts, J.P.; Peters, C.A. Leakage risks of geologic CO2 storage and the impacts on the global energy system and climate change mitigation. Clim. Chang. 2017, 144, 151–163. [Google Scholar] [CrossRef] [Green Version]
  128. Alcalde, J.; Flude, S.; Wilkinson, M.; Johnson, G.; Edlmann, K.; Bond, C.E.; Scott, V.; Gilfillan, S.M.V.; Ogaya, X.; Haszeldine, R.S. Estimating geological CO2 storage security to deliver on climate mitigation. Nat. Commun. 2018, 9, 2201. [Google Scholar] [CrossRef]
  129. Montserrat, F.; Renforth, P.; Hartmann, J.; Leermakers, M.; Knops, P.; Meysman, F.J.R. Olivine Dissolution in Seawater: Implications for CO2 Sequestration through Enhanced Weathering in Coastal Environments. Environ. Sci. Technol. 2017, 51, 3960–3972. [Google Scholar] [CrossRef] [PubMed] [Green Version]
  130. Strefler, J.; Amann, T.; Bauer, N.; Kriegler, E.; Hartmann, J. Potential and costs of carbon dioxide removal by enhanced weathering of rocks. Environ. Res. Lett. 2018, 13. [Google Scholar] [CrossRef]
  131. Project Vesta. Available online: https://projectvesta.org/ (accessed on 9 September 2020).
  132. Kelemen, P.; Benson, S.M.; Pilorgé, H.; Psarras, P.; Wilcox, J. An Overview of the Status and Challenges of CO2 Storage in Minerals and Geological Formations. Front. Clim. 2019, 1, 9. [Google Scholar] [CrossRef]
  133. Snæbjörnsdóttir, S.Ó.; Sigfússon, B.; Marieni, C.; Goldberg, D.; Gislason, S.R.; Oelkers, E.H. Carbon dioxide storage through mineral carbonation. Nat. Rev. Earth Environ. 2020, 1, 90–102. [Google Scholar] [CrossRef] [Green Version]
  134. Moran, K.; Crawford, C.; Webb, R.; Holmes, G.; Paulson, M.; Rankin, M. Solid Carbon: A Climate Mitigation Partnership Advancing Stable Negative Emissions. Available online: https://www.solidcarbon.ca/ (accessed on 12 April 2020).
  135. Caserini, S.; Dolci, G.; Azzellino, A.; Lanfredi, C.; Rigamonti, L.; Barreto, B.; Grosso, M. Evaluation of a new technology for carbon dioxide submarine storage in glass capsules. Int. J. Greenh. Gas Control 2017, 60, 140–155. [Google Scholar] [CrossRef]
  136. Brewer, P.G.; Orr Franklin, M.; Friederich, G.; Kvenvolden, K.A.; Orange, D.L. Gas Hydrate Formation in the Deep Sea: In Situ Experiments with Controlled Release of Methane, Natural Gas, and Carbon Dioxide. Energy Fuels 1998, 12, 183–188. [Google Scholar] [CrossRef]
  137. Brewer, P.G. Roger Revelle commemorative lecture contemplating action: Storing carbon dioxide in the ocean. Oceanography 2000, 13, 84–92. [Google Scholar] [CrossRef] [Green Version]
  138. Capron, M.E.; Stewart, J.R.; Rowe, R. Secure Seafloor Container CO2 Storage. In Proceedings of the OCEANS’13 MTS/IEEE San Diego Technical Program #130503-115, San Diego, CA, USA, 23–27 September 2013. [Google Scholar]
  139. McGrail, B.P.; Schaef, H.T.; Spane, F.A.; Horner, J.A.; Owen, A.T.; Cliff, J.B.; Qafoku, O.; Thompson, C.J.; Sullivan, E.C. Wallula Basalt Pilot Demonstration Project: Post-injection Results and Conclusions. Energy Procedia 2017, 114, 5783–5790. [Google Scholar] [CrossRef]
  140. Gunnarsson, I.; Aradóttir, E.S.; Oelkers, E.H.; Clark, D.E.; Arnarson, M.Þ.; Sigfússon, B.; Snæbjörnsdóttir, S.Ó.; Matter, J.M.; Stute, M.; Júlíusson, B.M.; et al. The rapid and cost-effective capture and subsurface mineral storage of carbon and sulfur at the CarbFix2 site. Int. J. Greenh. Gas Control 2018, 79, 117–126. [Google Scholar] [CrossRef] [Green Version]
  141. Friedlingstein, P.; Jones, M.W.; O’Sullivan, M.; Andrew, R.M.; Hauck, J.; Peters, G.P.; Peters, W.; Pongratz, J.; Sitch, S.; Le Quéré, C.; et al. Global Carbon Budget 2019. Earth Syst. Sci. Data 2019, 11, 1783–1838. [Google Scholar] [CrossRef] [Green Version]
  142. Knutti, R.; Rogelj, J. The legacy of our CO2 emissions: A clash of scientific facts, politics and ethics. Clim. Chang. 2015, 133, 361–373. [Google Scholar] [CrossRef]
  143. Baker, S.E.; Stolaroff, J.K.; Peridas, G.; Pang, S.H.; Goldstein, H.M.; Lucci, F.R.; Li, W.; Slesarev, E.W.; Pett-Ridge, P.; Ryerson, F.J.; et al. Getting to Neutral: Options for Negative Carbon Emissions in California; Lawrence Livermore National Laboratory: Livermore, CA, USA, 2020.
  144. Atlas-Copco CO2 Compressors. Available online: https://www.atlascopco.com/en-us/compressors/products/gas-compressors/co2-compressor (accessed on 1 April 2020).
  145. Rubin, E.S.; Davison, J.E.; Herzog, H.J. The cost of CO2 capture and storage. Int. J. Greenh. Gas Control 2015, 40, 378–400. [Google Scholar] [CrossRef]
  146. Investopedia. What Percentage of the Global Economy Consists of the Oil and Gas Drilling Sector? Available online: https://www.investopedia.com/ask/answers/030915/what-percentage-global-economy-comprised-oil-gas-drilling-sector.asp (accessed on 11 April 2020).
  147. Ibisworld. Global Coal Mining Industry—Market Research Report. 2019. Available online: https://www.ibisworld.com/global/market-research-reports/global-coal-mining-industry (accessed on 12 April 2020).
  148. USGCRP. Impacts, Risks, and Adaptation in the United States: Fourth National Climate Assessment, Volume II. Available online: https://nca2018.globalchange.gov/ (accessed on 10 April 2020).
  149. FAO. The State of World Fisheries and Aquaculture 2018—Meeting the Sustainable Development Goals; FAO: Roma, Italy, 2018. [Google Scholar]
  150. Poore, J.; Nemecek, T. Reducing food’s environmental impacts through producers and consumers. Science 2018, 360, 987–992. [Google Scholar] [CrossRef] [Green Version]
  151. Ritchie, H.; Roser, M. Global “Meat and Dairy Production” for 2018. Available online: https://ourworldindata.org/meat-production (accessed on 8 September 2020).
  152. MacLeod, M.J.; Hasan, M.R.; Robb, D.H.F.; Mamun-Ur-Rashid, M. Quantifying greenhouse gas emissions from global aquaculture. Sci. Rep. 2020, 10, 11679. [Google Scholar] [CrossRef]
  153. Parker, R.W.R.; Blanchard, J.L.; Gardner, C.; Green, B.S.; Hartmann, K.; Tyedmers, P.H.; Watson, R.A. Fuel use and greenhouse gas emissions of world fisheries. Nat. Clim. Chang. 2018, 8, 333–337. [Google Scholar] [CrossRef]
  154. Porter, J.R.; Xie, L.; Challinor, A.J.; Cochrane, K.; Howden, S.M.; Iqbal, M.M.; Lobell, D.B.; Travasso, M.I.; Aggarwal, P.; Hakala, K.; et al. Food security and food production systems. In Climate Change 2014: Impacts, Adaptation, and Vulnerability. Part A: Global and Sectoral Aspects; Cambridge University Press: Cambridge, UK, 2015; pp. 485–534. [Google Scholar] [CrossRef] [Green Version]
  155. Tigchelaar, M.; Battisti, D.S.; Naylor, R.L.; Ray, D.K. Future warming increases probability of globally synchronized maize production shocks. Proc. Natl. Acad. Sci. USA 2018, 115, 6644–6649. [Google Scholar] [CrossRef] [Green Version]
  156. Tirado-von der Pahlen, C. Sustainable Diets for Healthy People and a Healthy Planet. 2017. Available online: https://www.unscn.org/uploads/web/news/document/Climate-Nutrition-Paper-EN-.pd (accessed on 3 August 2020).
  157. Zhu, C.; Kobayashi, K.; Loladze, I.; Zhu, J.; Jiang, Q.; Xu, X.; Liu, G.; Seneweera, S.; Ebi, K.L.; Drewnowski, A.; et al. Carbon dioxide levels this century will alter the protein, micronutrients, and vitamin content of rice grains with potential health consequences for the poorest rice-dependent countries. Sci. Adv. 2018, 4, eaaq1012. [Google Scholar] [CrossRef] [PubMed] [Green Version]
  158. Chumley, H.; Hewlings, S. The effects of elevated atmospheric carbon dioxide [CO2] on micronutrient concentration, specifically iron (Fe) and zinc (Zn) in rice; a systematic review. J. Plant Nutr. 2020, 43, 1571–1578. [Google Scholar] [CrossRef]
  159. FAO. World Aquaculture 2015: A Brief Overview; FAO: Roma, Italy, 2017; Volume 1140. [Google Scholar]
  160. Mohanty, B.P.; Sankar, T.V.; Ganguly, S.; Mahanty, A.; Anandan, R.; Chakraborty, K.; Paul, B.N.; Sarma, D.; Dayal, J.S.; Mathew, S.; et al. Micronutrient Composition of 35 Food Fishes from India and Their Significance in Human Nutrition. Biol. Trace Elem. Res. 2016, 174, 448–458. [Google Scholar] [CrossRef]
  161. Hicks, C.C.; Cohen, P.J.; Graham, N.A.J.; Nash, K.L.; Allison, E.H.; D’Lima, C.; Mills, D.J.; Roscher, M.; Thilsted, S.H.; Thorne-Lyman, A.L.; et al. Harnessing global fisheries to tackle micronutrient deficiencies. Nature 2019, 574, 95–98. [Google Scholar] [CrossRef] [PubMed] [Green Version]
  162. Guarino, B. As Seas Rise, the U.N. Explores a Bold Plan: Floating Cities. Available online: https://www.washingtonpost.com/science/2019/04/05/seas-rise-un-explores-bold-plan-floating-cities/ (accessed on 4 April 2020).
  163. West, J.J.; Smith, S.J.; Silva, R.A.; Naik, V.; Zhang, Y.; Adelman, Z.; Fry, M.M.; Anenberg, S.; Horowitz, L.W.; Lamarque, J.-F. Co-benefits of mitigating global greenhouse gas emissions for future air quality and human health. Nat. Clim. Chang. 2013, 3, 885–889. [Google Scholar] [CrossRef] [PubMed] [Green Version]
  164. Morrow, D.R.; Thompson, M.S.; Anderson, A.; Batres, M.; Buck, H.J.; Dooley, K.; Geden, O.; Ghosh, A.; Low, S.; Njamnshi, A.; et al. Principles for Thinking about Carbon Dioxide Removal in Just Climate Policy. One Earth 2020, 3, 150–153. [Google Scholar] [CrossRef]
  165. Quirion, P.; Rozenberg, J.; Sassi, O.; Vogt-Schilb, A. How CO2 Capture and Storage Can Mitigate Carbon Leakage. SSRN Electron. J. 2012. [Google Scholar] [CrossRef] [Green Version]
  166. Otto, I.M.; Donges, J.F.; Cremades, R.; Bhowmik, A.; Hewitt, R.J.; Lucht, W.; Rockström, J.; Allerberger, F.; McCaffrey, M.; Doe, S.S.P.; et al. Social tipping dynamics for stabilizing Earth’s climate by 2050. Proc. Natl. Acad. Sci. USA 2020, 117, 2354–2365. [Google Scholar] [CrossRef] [Green Version]
  167. Algunaibet, I.M.; Pozo, C.; Galán-Martín, Á.; Huijbregts, M.A.J.; Mac Dowell, N.; Guillén-Gosálbez, G. Powering sustainable development within planetary boundaries. Energy Environ. Sci. 2019, 12, 1890–1900. [Google Scholar] [CrossRef] [Green Version]
  168. Stemmler, I.; Hense, I.; Quack, B. Marine sources of bromoform in the global open ocean—Global patterns and emissions. Biogeosciences 2015, 12, 1967–1981. [Google Scholar] [CrossRef] [Green Version]
  169. Mehlmann, M.; Quack, B.; Atlas, E.; Hepach, H.; Tegtmeier, S. Natural and anthropogenic sources of bromoform and dibromomethane in the oceanographic and biogeochemical regime of the subtropical North East Atlantic. Environ. Sci. Process. Impacts 2020, 22, 679–707. [Google Scholar] [CrossRef] [PubMed]
  170. Morley, J.W.; Selden, R.L.; Latour, R.J.; Frölicher, T.L.; Seagraves, R.J.; Pinsky, M.L. Projecting shifts in thermal habitat for 686 species on the North American continental shelf. PLoS ONE 2018, 13, e0196127. [Google Scholar] [CrossRef] [PubMed] [Green Version]
  171. Buck, H.J. How to Decolonize the Atmosphere. 2020. Available online: https://progressive.international/blueprint/46253391-5b3d-4e68-bd3f-d53dc54180fd-holly-jean-buck-how-to-decolonize-the-atmosphere/en (accessed on 8 September 2020).
  172. Intergovernmental Oceanographic Commission. United Nations Decade of Ocean Science for Sustainable Development. 2020. Available online: https://oceandecade.org (accessed on 9 September 2020).
Figure 1. Initial technologies to achieve SDGs while restoring 300 ppm CO2. Gray arrows represent liquid CO2.
Energies 13 04972 g001
Figure 2. The two paths, Pfuel and Pelectric, superimposed on the four pathways of the IPCC 1.5 °C target [4] reflect annual emissions projections from IPCC Figure SPM.3a (left) plus IPCC cumulative projections from SPM.1c on the right. (Note: The Pfuel and Pelectric paths are smoothed lines between three calculated points. The IPCC Figure SPM.3a pathways are smoothed lines with many calculated points.).
Energies 13 04972 g002
Figure 3. Process overview for mature (2070 and beyond) production of food, energy, and CO2 sequestration. It is a simplified representation of the future global energy system with future oceanic integrated food and energy systems. It does not show terrestrial food systems. Each country and community will determine how much of each component is appropriate depending on local economics. (Note: Miscanthus represents all terrestrial biomass including wood waste, agricultural residues, etc. that might be gasified directly at the Allam Cycle electricity facility or fed to HTL. Solid waste represents organic sludges, food waste, paper, and plastics that are not recycled some other way. Micro- and macroalgae represent all watery biomass including seagrass and freshwater plants. The darker green and thicker arrows are paths to more bio-CO2 storage (CO2 removed from the environment, i.e., negative emissions). The lighter green and thinner arrows lead to carbon-neutral emissions, including bio-CO2 emissions from combustion by airplanes, or wind and solar power.
Energies 13 04972 g003
Table 1. Balancing fossil fuel use, biomass-for-energy production, and bio-CO2 sequestration for net zero emissions about 2050 (from SMS#1).
MetricUnitsPfuel: Low Bio-Electricity, High BiofuelPelectric: High Bio-Electricity, Low Biofuel
Global fossil oil and natural gas use without sequestering the CO2.Billion barrels/yr (energy equiv.)33 110
Global negative emissions biofuel production for non-electric use (transportation, industry, heating)70
Global carbon neutral electricity (solar, wind, nuclear, fossil fuel with emissions capture, etc.)Billion MWh/yr1556
Global carbon negative electricity (biomass with carbon capture and sequestration)3514
Biomass production at net zero (mix of waste, Miscanthus and similar, and macroalgae)billion dry tonnes/yr133
Resulting approximation of fossil- and bio-CO2 sequestration (at net zero)billion tonnes/yr2628
Computed net CO2 emissionsbillion tonnes/yr00
1 The red numbers are variable input values that can be changed by the reader in the SMS spreadsheet to produce varying outcomes.
Table 2. Two paths of energy demand and supply a few years (~2070) after net CO2 emissions drop to zero around 2050 (SMS#2).
MetricUnitsPfuelPelectric
Global populationBillion1010
Projected global average electricity generation in 2070 * (2018 world average: 3.5 MWh/capita, China: 5.0, US: 13.6, Japan: 8.3 [47])MWh/yr/person57
Projected global electricity generation in 2070 (2018 global electricity generation was 27 billion MWh per year [47]) Billion MWh/yr5070
Fraction of global electricity production projected to be BECCS with the remainder nuclear or renewable: solar PV, solar thermal, wind, hydro, wave, geothermal, etc.%22%67%
Global non-electric HTL-produced biofuel use (transportation, industry, heating) (global oil demand of 100 million barrels/day (14 million tonnes/day) or 37 billion barrels/yr in 2018 [48]Billion barrels/yr4010
Global biomass production for Allam Cycle electricity BECCSBillion dry tonnes/yr417
Global biomass production for non-electric biofuel359
Global biomass production for HTL bio-construction materials (asphalt, plastic, carbon fiber, textiles, etc.)44
Total global biomass production (well past net zero, perhaps 2070)4330
Mass of bio-CO2 captured and stored (well past net zero, perhaps 2070)Billion tonnes of CO2/yr2838
Year when 3 trillion tonnes of CO2 are removed from atmosphere and ocean and permanently sequesteredYear21702140
* Although the Pfuel path shows only a small increase in per-capita electricity from present levels, it assumes that the UN SDG goal of doubling the global rate of improvement in energy efficiency by 2030 continues so that universal access is achieved, but little additional energy is needed. The Pfuel path is an extreme case in that it assumes little increase in electric vehicles with most powered by carbon negative biofuels.
Table 3. Estimated global biomass production possibilities for some biomass sources (from SMS#3).
MetricEstimated Global Scale at Indicated Cost 1Estimated Cost Delivered to Energy Process 1Estimated Energy-Return Ratio 2
Billions of Dry Tonnes/yr$/dry TonneEout/Ein
Organic waste including mixed biosolids, paper, plastic, food waste, etc. 35 to 7$(200) to $204 to 20
Terrestrial agriculture residues and purpose-grown biomass-for-energy (Miscanthus, etc.) 46 to 20$0 to $4001 to 50
Macroalgae with total ecosystem aquaculture 5 paying for the structure0.1 to 0.3$40 to $7020 to 50
Microalgae, mixed species, microbes, and plants 6Small, due to high cost$400 to $20000.4 to 1.1
Macroalgae, anchored systems 710 to 15$125 to $1458 to 20
Macroalgae, free-floating systems 840 to 60$75 to $1804 to 12
1 Terrestrial material scale and costs (including moisture content and heating values) are from references in SMS#4, 22, 23 [55,57,58,76,77,78,79,80,81,82,83,84,85,86,87,88,89,90,91,92,93]. Macroalgae scale and cost are interpolated from MARINER projected technologies and systems in SMS#6 [94,95,96,97]. The techno-economic analyses were funded by the U.S. DOE’s ARPA-E MARINER Program [40]. 2 Terrestrial material energy-return ratios are from references in SMS#4 [82,98,99,100]. Macroalgae energy-return ratios were defined as the lower heating value of macroalgae for the energy out (Eout) and the energy required for planting, growing, harvesting, and transporting to the energy processor for energy in (Ein). The embedded energy in the structure, ships, etc. is approximated by the capital cost of those items converted to $/dry tonne. The operating energy in is approximated as the cost of biofuel or the capital cost of ambient energy (solar, wave, wind) converted to $/dry tonne [42]. 3 Solid waste pays a disposal fee as if the HTL unit was a landfill. Landfill fees in the U.S. range from $30 to $100/wet ton ($120 to $400/dry tonne) [101]. $(200) indicates a negative value because that disposal fee could go to the HTL facility, which means it could produce oil for $0/barrel. Ein includes the difference between the energy expended now to collect and transport solid waste to landfills compared to the energy expended to collect, transport, and process it at HTL facilities. Quantity from Kaza et al. [49]. 4 Biomass quantities based on data in SMS#4 from Kaza et al. [49]; Turner et al. [59]; REN21 [102]; U.S. Department of Energy [50]; Eisentraut [61]; Daly & Halbleib [63]; Das et al. [60]; Pandur et al. [100]. Some possibly significant quantities of dry biomass could be delivered to the electricity process (Allam Cycle) for $50/tonne [50], about the same price as US coal at $2.5/GJ ($2.6/MMBTU). 5 The scale of high-protein food products paying for the reef structure (so that the cost of biomass-for-energy can be as low as $40/dry metric tonne) is limited by the demand for high-protein seafood, as identified by Lucas, Capron, et al. [17,20,42]. Macroalgae calculations use data from [44,46,90,103] 6 U.S. Department of Energy [50] and Jiang et al. [28] projected a range of $400–2000 per dry ash-free tonne of microalgae in their techno-economic uncertainty analysis. Energy return on investment (EROI) from Zaimes & Khanna [99]. 7 The area available for most anchored macroalgae systems assumes seafloor depths from 0–200 m, generally on relatively flat continental shelves [16,20]. But there are moored systems appropriate for deeper seafloors and steep slopes [104]. Figure S8 in SMD (based on Pichach [30])suggests that wet biomass delivered to the biofuel process (HTL) for less than about $120/dry tonne could produce biocrude oil for less than about $70/barrel. 8 Free-floating deep-ocean macroalgae systems access large open-ocean areas by floating in currents, eddies, and gyres with minor steering inputs. Individually free-floating plants include Sargassum (S. fluitans and S. natans) (Sherman et al. [94]). Attached growth plants on free-floating structures (Huesemann et al. [96]) include Saccharina japonica, Saccharina latissima, Undaria pinnatifida, Nereocystis luetkeana, Gracilaria tikvahiae, Gracilaria edulis, Gracilariopsis lemaneiformis and Sargassum polycystum (details in SMS#4, 6).
Table 4. Liquid or supercritical CO2 sequestration scale and cost (from SMS#13).
MetricGlobal Scale of Potential Storage 1Global Scale of Injection RateCost for Injecting into Sequestration Process with Permanent Monitoring and Occasional Repairs 2Leakage Rate 3
Billions of Tonnes of CO2Billions of Tonnes of CO2/yrUS$/Tonne 4 of CO2US$/MWh 5 with CO2 from Allam Cycle%
Geologic sequestration 6 in emptied oil wells, gas wells, and brine aquifers (negative costs are for enhanced oil recovery (EOR)2000 to 5800large uncertainty$40 to $56 most w/o EOR below $8$27 to $40 most below $5<0.9% of total per 1000 years
Mineralization sequestration in on land basalt and peridotite rocks 7more than 1000more than 10$10 to $30 $7 to $20Negligible
Mineralization sequestration in subsea basalt rocks 7more than 20,000much more than 20$200 to $400 $140 to $300Negligible
Contained CO2-hydrate storage on the seafloor or liquid CO2 in glass containers 8more than 20,000much more than 20$5 to $17$3 to $12<0.06% per 1000 years
1 Many countries have geologic resources for only one of the four options. Not every option guarantees the necessary scale. 2 The cost range for geologic storage represents variations in geology, meaning some countries will have inexpensive storage sites and some will have expensive geologic storage. Mineralization costs depend on the characteristics of the local rocks and the depth of drilling required. The range for hydrate storage costs reflects the current situation of relatively little research and development. 3 Leakage of 0.9% over 1000 years [128] applied to 2 trillion tonnes of CO2 would be 18 million tonnes of CO2/yr. Or 0.06% over 1000 years [138] applied to 2 trillion tonnes is only 1 million tonnes of CO2/yr. Kelemen et al. reports potential for only up to 2% leakage over 10,000 years [132] (see SMS#13). 4 Costs do not include capturing, compressing, and transporting pure CO2 (compression from 30 to 100 bar is projected at $1/t, from 1 to 100 bar at $18/t in SMS#14). Transportation costs are highly dependent on distance to suitable storage location estimated at $2 to $3/t for 100 km [8]. 5 Different fuels have different $/MWh (with the same $/tonne of CO2) due to differences in their electrical efficiency and their carbon:hydrogen ratio. This column shows the $/MWh using gasified coal into an Allam Cycle plant. SMS#14 shows it for other fuels. Note that US$10/MWh corresponds to 1 cent/kWh. 6 With geologic or mineralization storage, the injection rate of CO2 should not exceed that which causes earthquakes or leaks due to high pressure in the ground near the injection point [127]. 7 The actual mineralization rate depends on the characteristics of the local rocks [133,139]. See SMD for maps and discussion of different types of rocks with more references [132,134,140]. 8 Contained seabed storage scale and injection rate is essentially unlimited. It may be the least expensive option for coastal communities with short distances to >500 m depths. Costs based on Capron et al. [138] but updated in SMS#17. Note that Caserini et al. [135] project ~$17/t storing liquid CO2 at depths between 1000 and 3000 m (more discussion in SMD).
Table 5. Added cost to society for capturing, compressing, and sequestering CO2, changing from various fossil fuels to biomass fuels, and changing to Allam Cycle. Each row reflects a different local situation. Negative numbers mean reduced costs but are limited to early adopters using dry waste for fuel and able to sell gases. “No gas sales” means demand for more CO2, argon, or nitrogen has dropped to zero. Results are calculated in SMS#14, 16.
MetricAdditional $/Tonne of CO2Comment
Allam Cycle power plant gasifying $0/GJ ($0/MMBTU) dry waste in place of $7.6/GJ ($8/MMBTU) LNG, including income from sales of argon and nitrogen plus CO2 for EOR $260Lower electricity fuel cost possible when retaining solid waste disposal fees to offset Allam capital and operating costs.
Allam Cycle power plant gasifying $0/GJ ($0/MMBTU) dry waste in place of $2.5/GJ Illinois coal delivered in US, including income from gas sales $45
Allam Cycle power plant burning terrestrial biomass delivered for the same $2.5/GJ as for US coal, no gas sales$26When fuel costs the same, all the additional cost is process change ($15/tonne), compressing ($1/tonne), transporting, and sequestering liquid CO2 ($10/tonne).
Allam Cycle power plant burning $11/GJ HTL biocrude instead of fossil oil for the same $11/GJ, no gas sales$26
Hybrid co-located HTL and fossil-fired (some HTL biogas) Allam Cycle capturing and compressing CO2 from both processes. Same $/GJ for biomass or fossil fuel, no gas sales$26
Standalone HTL facility using by-product biogas internally with internal capture and compression of by-product CO2, no gas sales$75Using historic capture and compression average cost of $65/tonne plus the same $10/tonne for sequestration.
Allam Cycle power plant burning $11/GJ HTL biocrude in place of $7.6/GJ LNG (approximate), no gas sales$90Higher fuel cost increasing electricity price is most of the added expense.
Allam Cycle power plant burning $11/GJ HTL biocrude in place of $2.5/GJ coal (approximate), no gas sales$180

